evaluation of the wraparound zones initiative - doe. web viewhuman and social developmentoctober...
TRANSCRIPT

Evaluation of the Wraparound Zones InitiativeReport Two: Analysis of Conditions During Year 1Submitted toMassachusetts Department of Elementary and Secondary Education Kendra Winner, Research and Evaluation CoordinatorRebecca Shor, Wraparound Zone Coordinator
October 2013
Human and Social Development

Evaluation of the Wraparound Zones InitiativeReport Two: Analysis of Conditions During Year 1
October 2013
Allison Gandhi, Ed.D., Project Manager, Principal Researcher Wehmah Jones, Ph.D., Senior ResearcherJeffrey Poirier, M.A., PMP, Senior ResearcherEmily Rosenthal, M.A., ResearcherRobin Bzura, Research AssistantSandy Williamson, M.Ed., Principal Investigator, Managing Researcher
201 Jones RoadSuite 1Waltham, MA 02451-1600781.373.7005 | Fax: 781.899.3287www.air.org
Copyright © 2013 American Institutes for Research. All rights reserved.


ContentsPage
Executive Summary.........................................................................................................................1
Data Sources..............................................................................................................................1
Findings......................................................................................................................................2
I. Introduction..................................................................................................................................4
II. Methods.......................................................................................................................................6
Data Sources..............................................................................................................................6
Data Analysis...........................................................................................................................10
III. Findings....................................................................................................................................11
Cross-District Findings............................................................................................................11
Profile A: Fall River.................................................................................................................17
Profile B: Holyoke...................................................................................................................36
Profile C: Lawrence.................................................................................................................55
Profile D: Lynn........................................................................................................................67
Profile E: Springfield...............................................................................................................83
Profile F: Worcester.................................................................................................................96
IV. Conclusion.............................................................................................................................118
Appendix A: Research Questions, by Data Source.....................................................................120
Appendix B: 2011–12 Wraparound Zones Initiative Districts and Schools................................126
Appendix C: Sample Interview Protocol.....................................................................................127
Appendix D: 2012 Massachusetts Conditions for Learning Surveys..........................................131
Appendix E: Wraparound Zones Initiative Evaluation, School Staff Survey.............................144
Appendix F: Massachusetts Wraparound Zones Initiative 2011–12 Implementation Strategies, by Initiative Priority Improvement Area and School District..................................158

List of TablesTable 1. Districts and Schools by WAZ Implementation and Planning Status...............................6Table 2. CFL Survey School Response Rates.................................................................................8Table 3. Staff Survey School Response Rates.................................................................................9Table 4. Fall River WAZ School and District Demographics, 2011–12.......................................18Table 5. Students’ and Staff Members’ Perceptions of School Climate.......................................23Table 6. Staff Members’ Perceptions of Schoolwide Procedures for Behavior
Management....................................................................................................................25Table 7. Staff Members’ Perceptions of Procedures for Identifying and Addressing
Student Needs.................................................................................................................29Table 8. Staff Members’ Perceptions of Timeliness and Follow-Up Related to Identifying
and Addressing Student Needs.......................................................................................30Table 9. Staff Perceptions of the Adequacy of Supports Provided by External Partners..............34Table 10. Holyoke WAZ School and District Demographics, 2011–12.......................................37Table 11. Students’ and Staff Members’ Perceptions of School Climate.....................................43Table 12. Staff Members’ Perceptions of Schoolwide Procedures for Behavior
Management....................................................................................................................44Table 13. Staff Members’ Perceptions of Family Involvement in Decisions About
Nonacademic Supports...................................................................................................45Table 14. Staff Members’ Perceptions of Procedures for Identifying and Addressing
Student Needs.................................................................................................................48Table 15. Lawrence WAZ School and District Demographics, 2011–12.....................................55Table 16. Students’ and Staff Members’ Perceptions of School Climate.....................................59Table 17. Staff Members’ Perceptions of Schoolwide Procedures for Behavior
Management....................................................................................................................61Table 18. Lynn WAZ School and District Demographics, 2011–12............................................68Table 19. Staff Members’ Perceptions of School Climate............................................................75Table 20. Students’ Perceptions of School Climate......................................................................75Table 21. Staff Members’ Perceptions of Procedures for Schoolwide Behavior
Management....................................................................................................................76Table 22. Staff Members’ Perceptions of Adequacy of Supports Provided by Community
Partners............................................................................................................................81Table 23. Springfield WAZ School and District Demographics, 2011–12...................................84Table 24. Worcester WAZ School and District Demographics, 2011–12....................................98Table 25. Staff Members’ Perceptions of School Climate..........................................................105Table 26. Staff Members’ Perceptions of Schoolwide Procedures for Behavior
Management..................................................................................................................107Table 27. Staff Members’ Perceptions of Procedures for Identifying and Addressing
Student Needs...............................................................................................................112

Executive SummaryThe Massachusetts Department of Elementary and Secondary Education (ESE) Wraparound Zones (WAZ) Initiative is designed to create coordinated district systems that allow schools to proactively and systematically address students’ nonacademic needs. The four WAZ Priority Improvement Areas include
Climate and Culture. Each participating school creates a climate and culture that promotes mental health and positive social, emotional, and intellectual growth for students, resulting in a new standard of practice understood and practiced by every member of the school community.
Identification of Student Needs and Efforts to Address Them. Each participating school implements a proactive system of identifying student needs in key academic and nonacademic areas, leading to both universal supports and targeted interventions.
Community Coalitions. Each participating school integrates a range of resources to tailor student services from both within the school and the larger community. The range of services includes prevention, enrichment, early intervention, and intensive crisis response services.
District Systems of Support. Each participating district develops district-level systems to support the communication, collaboration, evaluation, and continuous improvement of the WAZ initiative.
The American Institutes for Research (AIR)1 is evaluating how well the WAZ initiative achieves these goals. AIR’s research is assessing progress on planning, implementation, outcomes, sustainability, and replication related to the initiative’s four Priority Improvement Areas. This evaluation report provides a comprehensive analysis of data collected during the first year of WAZ implementation, with a focus on answering the following research question:
What are the district, school, and other conditions (e.g., school climate and culture) and supports that are in place at the beginning of the WAZ grants, and how are they facilitating or impeding planning and implementation?
Data Sources
The findings in this report are based on analysis of data collected from six WAZ school districts during the 2011–12 school year: five school districts that received a WAZ implementation grant (Fall River Public Schools, Holyoke Public Schools, Lawrence Public Schools, Springfield Public Schools, and Worcester Public Schools); and Lynn Public Schools, which received a 2011–12 planning grant to prepare for WAZ implementation in the 2012–13 school year. Data sources included (a) interviews with WAZ district coordinators and other district leaders, WAZ school coordinators and school principals, and a sample of external partners in each of the WAZ districts; (b) a survey of students in 13 of the 26 WAZ schools;2 (c) a survey of staff in 20 of the
1 AIR (www.air.org) is a behavioral and social science research organization founded in 1946. AIR carries out its work with strict independence, objectivity, and nonpartisanship. AIR’s mission is to conduct and apply the best behavioral and social science research and evaluation to improve peoples’ lives, with a special emphasis on the disadvantaged.2 Springfield and Worcester did not participate in the student survey component of the evaluation.
American Institutes for Research Evaluation of the Wraparound Zones Initiative: Report Two—1

26 WAZ schools;3 and (d) district- and school-level documents related to WAZ planning and implementation. All data collection occurred from January to May 2012, which represented the second half of the first year of WAZ implementation or planning.
Findings
Each district entered the first year of WAZ with a unique set of conditions and supports in place that influenced implementation of the initiative. Among these conditions, five common themes emerged from the data across all districts that highlight the ways in which existing conditions and supports facilitated or impeded planning and implementation for WAZ overall. These were
1. Most districts and schools were able to align WAZ strategies with other, related initiatives, but some encountered challenges in making these connections clear and relevant for staff.
2. WAZ-funded staff positions varied by district, but all played important roles in facilitating implementation and planning during the first year.
3. Although staff buy-in to the goals of WAZ was strong at all levels, knowledge among school staff about how to implement many of the WAZ strategies was limited.
4. In all WAZ districts, schools were developing strong partnerships with community agencies; however, a district-level infrastructure for supporting and formalizing these partnerships was yet to develop.
5. Engaging families in the WAZ work was an ongoing struggle that was one of the top challenges reported by all interviewees.
In general, these findings suggest several strengths that districts and schools could build upon as they progress through their WAZ grant, but also several challenges. For example, data revealed overwhelmingly strong buy-in across all stakeholders for the purpose and goals of WAZ, much of which could be attributed to the fact that the WAZ districts were all finding ways to connect WAZ to other, related initiatives. The connections that district and school leaders made between social–emotional support and academic success were instrumental for communicating and gaining widespread support for the importance of WAZ. However, data also revealed challenges related to family engagement, access to services, and school climate. These challenges were all compounded by the fact that many staff members in the WAZ schools lacked sufficient experience, knowledge, and training on how to address the very intensive needs of the students and families in their communities.
Finally, although data generally indicated that WAZ districts and schools were moving forward with the implementation of strategies in their WAZ plans, these data also foreshadowed potential future challenges with respect to the sustainability of these strategies. For example, although all of the WAZ schools were building and enhancing partnerships with community agencies, district progress in establishing an infrastructure to coordinate the development and maintenance of these relationships was much slower to develop. Although this did not seem to impede progress in the development of school–community partnerships in Year 1, a continued lack of a district infrastructure in Years 2 and 3 could potentially compromise the sustainability of these
3 Springfield did not participate in the staff survey component of the evaluation.
American Institutes for Research Evaluation of the Wraparound Zones Initiative: Report Two—2

partnerships. Similarly, during Year 1, staff relied very heavily on district- and school-level WAZ staff positions to move the work forward. Evidence from Year 1 suggested that these WAZ-funded positions were critical for the planning and start-up phases of WAZ, but a gradual shift toward integrating these roles and responsibilities into the broader district and school staff will be important for sustainability in Years 2 and 3.
AIR’s evaluation efforts are ongoing. Future reports will provide additional analyses of the interview, survey, and document data for each of the WAZ districts. Special emphasis will be placed on an analysis of how districts and schools progress and experience success with their WAZ grants in Year 2 and how they plan for sustainability in Year 3. AIR looks forward to producing meaningful results and recommendations that can effectively support district and school WAZ-related planning, implementation, sustainability, and replication.
American Institutes for Research Evaluation of the Wraparound Zones Initiative: Report Two—3

I. IntroductionThe Massachusetts Department of Elementary and Secondary Education (ESE) Wraparound Zones (WAZ) Initiative is designed to create coordinated district systems that allow schools to proactively and systematically address students’ nonacademic needs. The four WAZ Priority Improvement Areas include
Climate and Culture. Each participating school creates a climate and culture that promotes mental health and positive social, emotional, and intellectual growth for students, resulting in a new standard of practice understood and practiced by every member of the school community.
Identification of Student Needs and Efforts to Address Them. Each participating school implements a proactive system of identifying student needs in key academic and nonacademic areas, leading to both universal supports and targeted interventions.
Community Coalitions. Each participating school integrates a range of resources to tailor student services from both within the school and the larger community. The range of services includes prevention, enrichment, early intervention, and intensive crisis response services.
District Systems of Support. Each participating district develops district-level systems to support the communication, collaboration, evaluation, and continuous improvement of the WAZ initiative.
The American Institutes for Research (AIR)4 is evaluating how well the WAZ initiative achieves these goals. AIR’s research will assess progress on planning, implementation, outcomes, sustainability, and replication related to the initiative’s four Priority Improvement Areas. AIR completed a first evaluation report in Fall 2012 that described the 2011–12 WAZ plans, summarized student school climate survey results, and reported school and district coordinator perspectives on strengths and challenges experienced during Year 1. This second evaluation report provides a more comprehensive analysis of data collected during the first year of WAZ implementation, with a focus on answering the first overarching research question that informs its evaluation design:
What are the district, school, and other conditions (e.g., school climate and culture) and supports that are in place at the beginning of the WAZ grants, and how are they facilitating or impeding planning and implementation?
Over AIR’s three-year evaluation, periodic reports will assess different aspects of WAZ planning, implementation, outcomes, sustainability, and replication. The reports will build on each other, using previously reported findings to contextualize and support future findings and recommendations. Specifically, Report 3 will focus on answering the second and third overarching research questions that focus on implementation progress and evidence of impact on outcomes:
4 AIR (www.air.org) is a behavioral and social science research organization founded in 1946. AIR carries out its work with strict independence, objectivity, and nonpartisanship. AIR’s mission is to conduct and apply the best behavioral and social science research and evaluation to improve peoples’ lives, with a special emphasis on the disadvantaged.
American Institutes for Research Evaluation of the Wraparound Zones Initiative: Report Two—4

How are districts and schools progressing on early indicators of WAZ planning and implementation?
What are the outcomes associated with WAZ implementation?
Report 4 will focus on the last research question about sustainability:
Is WAZ sustainable at the district and school levels, and what supports or hinders (or will support or hinder) sustainability and replication in other districts and schools?
Appendix A shows the full list of research questions and sub-questions that are guiding the three-year evaluation, and the data sources that are being used to inform answers to those questions.
In the remainder of this report, we first present the methods and data used to develop findings. Next, we present the findings, organized in two sections: (a) cross-district findings and (b) district profiles. In the cross-district findings section, we identify common and recurring themes across multiple districts as well as strategies that may warrant further study and attention as potential models for other WAZ schools and districts to replicate. In the district profiles section we describe, for each of the six districts, findings related to the unique conditions and supports that existed at the start of the WAZ grant and that influenced the degree to which the grant was implemented as intended. We conclude with a discussion section focused on the implications of these findings.
American Institutes for Research Evaluation of the Wraparound Zones Initiative: Report Two—5

II. MethodsThe findings in this report are based on analysis of data collected from six WAZ school districts during the 2011–12 school year: five school districts that received a WAZ implementation grant (Fall River Public Schools, Holyoke Public Schools, Lawrence Public Schools, Springfield Public Schools, and Worcester Public Schools); and Lynn Public Schools, which received a 2011–12 planning grant to prepare for WAZ implementation in the 2012–13 school year. Appendix B lists the 21 implementation and 5 planning schools across these districts from which AIR gathered data. Table 1 shows the number of schools in each of these districts by implementation and planning status.
Table 1. Districts and Schools by WAZ Implementation and Planning Status
School District Number of Schools Implementing WAZ in 2011–12
Number of Schools Planning for WAZ Implementation in 2012–13
Fall River 3 -Holyoke 2 1Lawrence 3 -Lynn - 4Springfield 6 -Worcester 7 -Total 21 5
Note: The number of schools planning for WAZ implementation includes only those that received ESE funding to carry out WAZ planning during the 2011–12 school year.
Data Sources
The data sources used in this report include the following:
1. Interviews with WAZ district coordinators and other district leaders, WAZ school coordinators and school principals, and a sample of external partners in each of the WAZ districts
2. A survey of students in 13 of the 26 WAZ schools5
3. A survey of staff in 20 of the 26 WAZ schools6
4. District- and school-level documents related to WAZ planning and implementation
All data collection occurred from January to May 2012, which represented the second half of the first year of WAZ implementation or planning.
5 Springfield and Worcester did not participate in the student survey component of the evaluation.6 Springfield did not participate in the staff survey component of the evaluation.
American Institutes for Research Evaluation of the Wraparound Zones Initiative: Report Two—6

Interviews
AIR conducted interviews with WAZ district and school coordinators, district administrators, school principals, and key community partners. For Year 1, AIR interviewed 6 district coordinators or their proxies (all districts), 20 school wraparound coordinators (Fall River, Holyoke, Lawrence, Springfield, and Worcester)7, and 4 school social workers (Lynn) who were the most similar to coordinators as respondents. We also interviewed 23 principals8 and 17 community partners.
The majority of interviews were conducted on-site by a team of two researchers. One researcher served as the lead and the other as note-taker. In addition to on-site note-taking, researchers recorded the audio from the interviews. All site visits were conducted from February to March 2012. To minimize the burden on principals in Level 4 schools who were undergoing SchoolWorks monitoring visits, AIR carried out phone interviews in late April and May 2012. Community partner interviews were also conducted by telephone. For the on-site interviews, the note-taker took detailed notes and then used the audio recording to create a nearly verbatim transcript. The telephone interviews were recorded and transcribed.
AIR used semistructured interview protocols, guided by the research questions and designed to last approximately 45 minutes. Appendix C shows a sample protocol used for the school coordinator interviews. The protocols included questions asked of all participants so as to facilitate a systematic analysis of the data as well as questions specific to each respondent’s role with respect to WAZ.
Student Survey Data
AIR administered and analyzed data from its Conditions for Learning (CFL) student survey. The CFL survey was administered in February 2012 to students in Grades 2–8 in Fall River, Holyoke, and Lynn, and to students in Grades 2–12 in Lawrence. The CFL survey is designed to help districts and schools monitor students’ opinions about their schools, including their schools’ climate, perceived levels of student support, levels of challenge, and perceptions about students’ social and emotional learning skills. Appendix D shows the CFL survey forms. Data were reported and analyzed as the percentage of students whose responses fell into the “excellent,” “adequate,” and “needs improvement” categories on the following four scales:
The Challenge Scale. This scale measures how much students report that teachers and other adults in their school encourage them to think, work hard, do their best, and connect what they are learning in school to life outside of it. A challenging curriculum, presented in a way that is relevant to students, will promote student achievement.
The Peer Social–Emotional Climate Scale. This scale measures students’ perception of their peers’ social and problem-solving skills. Developing students’ social and emotional skills improves their grades, attendance, behavior, and attitudes toward school. Students with good social and emotional skills are less likely to drop out of school.
7 Of the 20 school coordinators, two were from one school in Springfield. The Viveiros school coordinator in Fall River was not interviewed and Homer School in Springfield did not have a coordinator at the time of our interviews. 8 Three of the 26 WAZ school principals were unavailable for an interview, even after multiple scheduling attempts.
American Institutes for Research Evaluation of the Wraparound Zones Initiative: Report Two—7
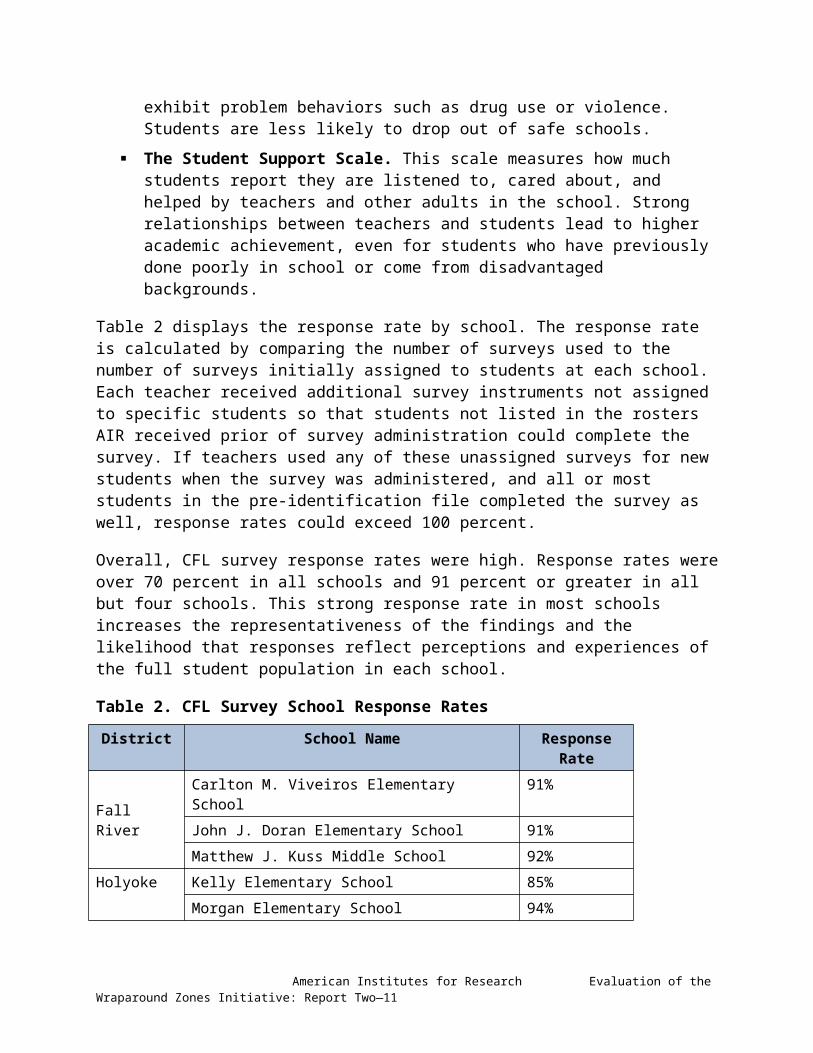
The Safe and Respectful Climate Scale. This scale measures how students assess the physical and emotional safety of their schools. Students who attend safe schools are more likely to be academically engaged and are less likely to exhibit problem behaviors such as drug use or violence. Students are less likely to drop out of safe schools.
The Student Support Scale. This scale measures how much students report they are listened to, cared about, and helped by teachers and other adults in the school. Strong relationships between teachers and students lead to higher academic achievement, even for students who have previously done poorly in school or come from disadvantaged backgrounds.
Table 2 displays the response rate by school. The response rate is calculated by comparing the number of surveys used to the number of surveys initially assigned to students at each school. Each teacher received additional survey instruments not assigned to specific students so that students not listed in the rosters AIR received prior of survey administration could complete the survey. If teachers used any of these unassigned surveys for new students when the survey was administered, and all or most students in the pre-identification file completed the survey as well, response rates could exceed 100 percent.
Overall, CFL survey response rates were high. Response rates were over 70 percent in all schools and 91 percent or greater in all but four schools. This strong response rate in most schools increases the representativeness of the findings and the likelihood that responses reflect perceptions and experiences of the full student population in each school.
Table 2. CFL Survey School Response Rates
District School Name Response Rate
Fall RiverCarlton M. Viveiros Elementary School 91%John J. Doran Elementary School 91%Matthew J. Kuss Middle School 92%
HolyokeKelly Elementary School 85%Morgan Elementary School 94%William R. Peck Full Service Community School 84%
LawrenceArlington Elementary School 94%Arlington Middle School 92%Humanities & Leadership Development High School 71%
Lynn
Cobbet Elementary School 102%Connery Elementary School 95%E. J. Harrington School 101%Thurgood Marshall Middle School 74%
Staff Survey Data
AIR administered a survey to all staff members in participating WAZ schools for the Fall River; Holyoke; Lawrence; Lynn; and Worcester districts. The survey’s purpose was to understand staff
American Institutes for Research Evaluation of the Wraparound Zones Initiative: Report Two—8

members’ perceptions of school conditions during the first year of WAZ implementation. The survey included questions related to seven topic areas: (a) staff attitudes and knowledge about the theory of action behind WAZ, (b) school climate, (c) staff use of data, (d) school-wide behavior management, (e) student support, (f) family involvement, and (g) community and external provider supports.
The survey was developed in collaboration with ESE, and it included items that were adapted from existing staff surveys of school climate. Items were also included that aligned with items in the CFL survey to facilitate comparison of staff and student perceptions of school climate. A draft version of the survey was pilot-tested with a sample of 10 non-WAZ district school staff members in a wide range of roles to obtain feedback on readability and clarity of purpose and content. The final survey instrument, shown in Appendix E, reflects feedback from this pilot.
AIR administered the survey electronically and worked collaboratively with district and school staff to monitor response rates and follow-up as appropriate with non-respondents. Table 3 displays the response rate by school. School response rates varied from a low of 42 percent to a high of 80 percent.
Table 3. Staff Survey School Response Rates
District School Name Response Rate
Fall RiverCarlton M. Viveiros Elementary School 80%John J. Doran Elementary School 73%Matthew J. Kuss Middle School 75%
HolyokeKelly Elementary School 42%Morgan Elementary School 80%William R. Peck Full Service Community School 53%
LawrenceArlington Elementary School 73%Arlington Middle School 76%Humanities & Leadership Development High School 75%
Lynn
Cobbet Elementary School 70%Connery Elementary School 74%E.J. Harrington School 75%Thurgood Marshall Middle School 73%
Worcester
Chandler Elementary School 72%Chandler Magnet School 50%Goddard Elementary School 56%Goddard Scholars Academy 71%Union Hill Elementary School 42%University Park Campus School 56%Woodland Academy 63%
American Institutes for Research Evaluation of the Wraparound Zones Initiative: Report Two—9

Review of WAZ-Related Documents
AIR gathered and reviewed several extant school and district documents related to WAZ. These included: grant applications, school and district implementation plans, notes from interagency coalition and school meetings, school and district policy manuals or guidance documents related to key wraparound functions (e.g., positive school climate and tiered student support delivery system), and district and school monitoring reviews (conducted by ESE).
The WAZ plans included descriptions of strategies for each of the aforementioned Priority Improvement Areas (see Appendix F for a summary). The plans provide important baseline information on WAZ initiatives, but not all wraparound-related activities were listed in the WAZ plans. Some wraparound activities were already underway in districts and schools at the start of the WAZ initiative and districts and schools did not use WAZ resources to fund these activities. The information contained in this report draws on WAZ plans and other contextual documents to inform the analysis of interview and survey data. For example, if interview data were unclear or offered incomplete information about the background or context of a particular WAZ strategy, researchers often referred to documents as a way to get a better and more thorough understanding of the issue. Documents also served as an important resource for obtaining facts that interviewees sometimes did not know (e.g., the timing of a particular initiative).
Data Analysis
The data analysis for this report focused on identifying a set of findings within each district that best summarized the conditions and supports that existed in the district during the first year of WAZ. First, researchers reviewed the Year 1 WAZ plans to gain an understanding of the planned activities in each district. Next, researchers coded interview data using a set of codes that aligned topically with the WAZ priorities. A copy of the code guidebook that was used for Year 1 data analysis is shown in Appendix F. Finally, researchers reviewed student and staff survey results, which had been previously tabulated and reported in the fall 2012 report as well as in a set of staff survey data tables and accompanying memos that were disseminated to districts in winter 2012.
During the analysis phase, researchers sought to triangulate data sources as a way of identifying findings with the strongest weight of evidence supporting them. In other words, themes that emerged from multiple interviewees and through survey data were considered to have the strongest weight of evidence and were prioritized as a compelling finding to include in the report. A lead researcher for each district conducted the initial review of data and identification of findings. The full research team then discussed these findings and their supporting evidence during weekly team meetings. These discussions often led to refinement in how findings were worded or to a more detailed exploration of the data to help clarify or contextualize data that were not clearly connected to the larger finding. The findings contained in this report reflect this collaborative, comprehensive, and iterative approach to analyzing all data sources.
American Institutes for Research Evaluation of the Wraparound Zones Initiative: Report Two—10

III. FindingsCross-District Findings
The focus of this evaluation report is on answering the first overarching research question:
What are the district, school, and other conditions (e.g., school climate and culture) and supports that are in place at the beginning of the WAZ grants, and how are they facilitating or impeding planning and implementation?
Each district entered the first year of WAZ with a unique set of conditions and supports in place that influenced their implementation of the initiative. However, a number of common themes emerged from the data across all districts that highlight the ways in which existing conditions and supports facilitated or impeded planning and implementation for WAZ overall. These were:
1. Most districts and schools were able to align WAZ strategies with other, related initiatives, but some encountered challenges in making these connections clear and relevant for staff.
2. WAZ-funded staff positions varied by district, but all played important roles in facilitating implementation and planning during the first year.
3. Although staff buy-in to the goals of WAZ was strong at all levels, knowledge among school staff about how to implement many of the WAZ strategies was limited.
4. In all WAZ districts, schools were developing strong partnerships with community agencies; however, a district-level infrastructure for supporting and formalizing these partnerships was yet to develop.
5. Engaging families in the WAZ work was an ongoing struggle that was one of the top challenges reported by all interviewees.
In this section, we summarize the evidence supporting these cross-district findings. The subsequent district profiles describe the district-specific findings.
Cross-District Finding 1: Most districts and schools were able to align WAZ strategies with other, related initiatives.
For each district, the WAZ initiative represented an opportunity to secure additional state resources to support other, ongoing school reform initiatives that aligned with WAZ goals. For example, all six of the WAZ districts were designated as either Level 4 or 5 by the state,9 and they were engaged in intensive district improvement planning and monitoring to accelerate growth in student achievement and other outcomes. Each district improvement plan included components focused on social–emotional learning, and several district leaders were very explicit during interviews about the ways in which WAZ supported their efforts in achieving broader reform goals. One district leader stated, “We now know that [social–emotional needs] has to be a
9 ESE ranks all districts and schools on a five-level scale, with 1 indicating the highest- and 5 indicating the lowest-performing districts or schools. Schools and districts are subject to increasing levels of accountability and receive increasing levels of state assistance, according to their rank. More information about ESE’s framework for accountability and assistance can be found at: http://www.doe.mass.edu/apa/general/.
American Institutes for Research Evaluation of the Wraparound Zones Initiative: Report Two—11

huge piece of what we address. If we don’t address that, it doesn’t matter how good our curriculum is going to be because kids aren’t going to be able to access the curriculum.” Another explained that WAZ was “providing the resources to ‘move to vision’ to motivate kids academically, socially and emotionally for college.... This WAZ grant is helping to fund that vision to fruition.”
Many of the schools in these districts (including some of the WAZ schools) had been designated as Level 4 schools and were thus afforded certain flexibilities and resources designed to support them in implementing changes and new initiatives targeting improved student outcomes. The Level 4 status of WAZ schools was not an accident. When asked to explain how schools were selected for WAZ, many district leaders reported that they intentionally chose Level 4 schools or schools that were otherwise struggling to be WAZ schools. On the one hand, these schools demonstrated the most need for WAZ supports, and on the other hand, many also demonstrated a strong readiness to implement WAZ strategies because of their engagement in turnaround efforts and the priority they were placing on social–emotional learning. As one interviewee shared, “the Level 4 schools have an advantage in a way because they’ve been required to do some of this work and systematically they have some systems in place.”
For these schools, changes implemented as a result of their Level 4 status often facilitated implementation of WAZ strategies. For example, as part of its Level 4 redesign efforts, Kuss Middle School in Fall River implemented an extended day. This longer schedule allowed them more time to conduct remedial work and provide enrichment opportunities that aligned with WAZ’s goals for student support. The principal of Harrington Elementary School in Lynn was granted more autonomy and control over her staff because of the school’s Level 4 status, and she therefore was able to hire and retain staff with a strong commitment to the WAZ strategies being implemented. All of the Level 4 schools had already included and begun implementing school climate strategies as part of their turnaround plans, and therefore had greater buy-in and momentum upon entering the WAZ grant.
Some evidence from Year 1 suggests that the Level 4 schools were more ready for and progressed more smoothly with WAZ strategies than non-Level 4 schools. For example, in Fall River and Lynn, survey data showed that students and staff in the Level 4 WAZ elementary schools had more positive perceptions of school climate than those in the non-Level 4 WAZ elementary schools. However, other data pointed to resistance among Level 4 school staff to buy in to what may have seemed like yet another initiative: “There’s a lot that we are responsible for, a lot that we have to do and to add the wraparound zone to it, although it fits very nicely with what we’re already doing. You only have so much time and can only do so many initiatives.” This was the especially the case in Springfield, which chose to contract with City Connects to implement WAZ strategies and encountered more resistance among principals and staff than was reported by interviewees in other districts. One interviewee in Springfield hypothesized, “All the change in Level 4 schools might be impeding wraparound.”
In addition to implementing initiatives associated with state-designated accountability status, the WAZ districts found ways to build on other, related district initiatives that existed prior to WAZ. Lawrence, for example, had an existing community coalition in place, the Agency Partnership Advisory Network (APAN), that facilitated access to community partners and served as the community coalition under WAZ. Worcester had already begun to conceptualize a plan for
American Institutes for Research Evaluation of the Wraparound Zones Initiative: Report Two—12
delivering student supports and partnering with the community through a proposal for a United Way Promise Neighborhood grant. They were able to build on that work when developing their WAZ implementation plan, by gathering support from partners who were already working with them for the United Way grant. Fall River, which had existing “wellness teams” in place at each school to manage systems for identifying and addressing student non-academic needs, worked to enhance these teams through the WAZ grant. Holyoke was using WAZ to expand its Full Service Community Schools model. Overall, the theory of action for WAZ was closely aligned with each district’s overall goals and strategies for district improvement, and most district and school leaders took advantage of WAZ to move those strategies forward.
Cross-District Finding 2: WAZ-funded staff positions varied by district, but all played important roles in facilitating implementation and planning during the first year.
Districts varied in the ways in which they used the WAZ grant to support staff positions, and they also varied in the speed with which WAZ-funded positions were filled during the first year. Interviews with stakeholders revealed strong feelings about the critical role that dedicated WAZ staff positions played in facilitating the launch of WAZ-related strategies during the first year of the grant. In districts and schools where positions were filled quickly and where roles were clear, stakeholders expressed gratitude and positive perceptions about the instrumental role that these staff members played in moving the grant forward. In contrast, in districts where positions were slow to fill or where roles were unclear, stakeholders expressed confusion, uncertainty and frustration about the extent to which the grant was progressing.
In all five of the implementation districts, WAZ was used to designate and fully or partially fund a school-based position with responsibility for coordinating and implementing WAZ strategies at that school. Names for this position varied by district: “Student Support Coordinator (SSC)” in Fall River, “Full Service Community (FSC) School Manager” in Holyoke, “Intensive Case Manager (ICM)” in Lawrence, “School Site Coordinator” in Springfield, and “Wraparound Outreach Coordinator (WAC)” in Worcester. In every district, interviewees universally acknowledged the importance of this role in terms of moving the WAZ work forward, and they referred to these staff as “crucial,” “the link,” and “a huge resource and support.” One interviewee noted, “Every school needs dedicated staff for this [work].” Another said, “We wanted to address the social, emotional, and behavioral needs of students in a cohesive way. And there was never really anyone who could document that until [the coordinator] position was created.”
In two districts (Worcester and Lynn), a lack of clarity around the role of the school coordinator and how it potentially overlapped with existing staff positions contributed to some anxiety and confusion among staff. In Worcester, for example, several interviewees reported being confused about the distinction between the role of the WAC and the school adjustment counselor, with some stating that the department overseeing the school adjustment counselors felt “very threatened by wraparound.” District leaders in Worcester spent considerable time in Year 1 clarifying the role of the WAC and communicating to school- and district-based staff about this role.
In Lynn, which received a planning grant during Year 1, there was uncertainty and confusion around how the WAZ grant would impact school-based staff roles and responsibilities when
American Institutes for Research Evaluation of the Wraparound Zones Initiative: Report Two—13

implementation began. Each of the WAZ schools in Lynn had a social worker who was taking responsibility for such things as providing direct service to students, engaging and communicating with families, facilitating partnerships with community agencies, and consulting with teachers on how to address nonacademic needs in the classroom. Some staff expressed anxiety over potential changes in the social workers’ role with the onset of WAZ: “How many hours a week would she [social worker] be dedicating to wraparound and therefore, who would be able to pick up her duties that she already does for the school?” At the time of AIR data collection during Year 1, Lynn had not yet decided if and how it would use WAZ to support school-based staff positions.
District-level staff positions dedicated to WAZ also varied by district. With the exception of Holyoke, all districts used WAZ to support a district-level staff person (the district coordinator) to oversee and coordinate implementation of the district’s WAZ plan. Interviewees all commented positively on the importance of the district coordinator role, referring to the coordinators as a “conduit” or “advocate,” for example. District coordinators provided support and resources to school-based WAZ staff and also facilitated much of the communication and relationship building at the district and community levels. One community partner reported, “That the district is committed to having a wraparound coordinator is huge. With him in particular it’s huge because there’s a lot of trust in the agencies with him.”
Holyoke intentionally did not hire a full-time coordinator, reflecting what interviewees described as a “bottom-up” culture in which “the driving force won’t come from district, it will come from schools.” Instead, Holyoke identified a district-level staff person to serve as a WAZ liaison who would act as a bridge between the school-based WAZ staff and district staff. Although Holyoke interviewees generally found the WAZ liaison helpful and supportive, some expressed a desire for more dedicated district support in the form of a full-time staff person whose responsibilities would solely focus on WAZ implementation.
Some districts experienced delays in the hiring of WAZ staff, which interviewees felt impeded their progress with WAZ implementation. In Lynn, the district coordinator was not hired until April, four months after the originally planned January hire date. District and school-level staff members in Lynn expressed frustration over this delay and felt like they could not move forward with their plan until this person was in place: “Everyone’s busy so I think unfortunately we’ve been waiting for this new person to be hired to really get things going.... We want someone whose only thing is working on wraparound. We need someone to dedicate their day.” Similar frustration was noted in Springfield, where the district coordinator was on maternity leave for part of the year, and in Fall River, where one of the schools experienced turnover in the SSC position during the year. Overall, interview data pointed to a strong need for dedicated WAZ staff in the district and in the schools to ensure that action was taken to move WAZ plans forward during the first year.
Cross-District Finding 3: Although staff buy-in to the goals of WAZ was strong at all levels, knowledge among school staff about how to implement many of the WAZ strategies was limited.
On the staff survey administered in spring of 2012, nearly all respondents across all WAZ schools and districts reported that the key components of the WAZ Initiative were important for
American Institutes for Research Evaluation of the Wraparound Zones Initiative: Report Two—14

student success. Additionally, buy-in was an important theme that emerged in many of the interviews, with a large majority of respondents noting that staff at all levels in their district had bought into and were supportive of WAZ. In many cases, this strong buy-in was directly related to the fact that WAZ aligned with similar initiatives, such as the FSC work in Holyoke, wellness teams in Fall River, City Connects partnership in Springfield, and the district-wide priority placed on social-emotional well-being in Lawrence, Lynn and Worcester. The strong buy-in to the WAZ initiative is an important strength that the districts can build upon as they move forward. Many interviewees described the importance of buy-in for facilitating smooth implementation of new initiatives such as WAZ: “If the principal shows they are not supportive, then it’s like, ‘What’s the point?’”
A smaller percentage of respondents, however, described themselves as knowledgeable in many of these same areas. For example, fewer than three-quarters (and in some districts only half) of respondents reported that they were “knowledgeable” or “very knowledgeable” about using data to screen and monitor progress for students with nonacademic needs, or about customizing the types and intensity of supports for students with nonacademic needs. This compared with more than 90 percent of respondents in all districts reporting that these same topics were “important” or “very important” for student success.
IInterviewees noted that a lack of knowledge or training in key areas could hinder implementation progress and reduce the strong buy-in and enthusiasm that already existed. Knowledge was particularly lacking in the area of behavior management. Interviewees in all six districts described challenges in making sure that staff had sufficient training and tools to implement effective behavior management procedures in their classrooms. All districts were using the WAZ grant to provide professional development to school staff, but as one interviewee noted, they were “struggling with systematically getting that knowledge to the classroom level in a way that’s sustainable, that’s strategic, with urgency.”
Cross-District Finding 4: In all WAZ districts, schools were developing strong partnerships with community agencies; however, a district-level infrastructure for supporting and formalizing these partnerships was yet to develop.
A strength that was evident across all six WAZ districts was the wealth of community resources available to support student and family needs, and the strong willingness of community and school representatives to partner with one another to address these needs. In all districts, the WAZ schools began the first year of the initiative with existing partnerships in place and new ones being developed. Interviewees described community partners as “very highly committed” and “very willing to give time and energy.” Partners also praised school and district leaders for being very willing to open their doors and collaborate with them.
However, very few interviewees reported that their districts had a district-level infrastructure in place to facilitate and provide district-level support for formalizing school–community partnerships. This is notable given that the establishment of a community coalition is a Priority Improvement Area for the WAZ initiative. As one interviewee aptly summarized, “We have a lot of partners but not partnerships.”
American Institutes for Research Evaluation of the Wraparound Zones Initiative: Report Two—15

Every district (except for Lynn, which was in a planning year) made some mention in its 2011–12 WAZ plan of a role for district leadership in overseeing community partnerships, but none of the districts made progress in establishing these coalitions during the first year. In Fall River, plans to establish their planned “Community Wellness Team” were pushed into Year 2. In Holyoke, the three WAZ schools were collaborating around community partnerships, but this work remained informal. In Springfield, the district was planning to host an event to bring community partners together to learn about City Connects, but had no reported plans in place to develop a “Community Advisory Board” as described in its plan. In Worcester, the district coordinator supported schools in identifying partnerships but not in any formal, structured way. Although Lynn was in the planning stage, interviewees expressed a desire to formalize existing relationships with partners. Lawrence was the one exception because its APAN already existed; as one interviewee noted, “It was easy to get community agencies on board with wraparound because we were already working with these agencies through the APAN. APAN has been a huge resource because we had it established already.”
Cross-District Finding 5: Engaging families in the WAZ work was an ongoing struggle that was one of the top challenges reported by all interviewees.
Interviewees in all six districts reported that engaging families in decisions about and delivery of nonacademic supports was a major challenge, and one that they were hoping to address through WAZ. All districts, and in particular the WAZ schools, were serving a needy population of students and families who were experiencing high poverty, transience, homelessness, hunger, language barriers, lack of access to transportation, and neighborhood crime among other challenges. Staff in the WAZ schools reported long-standing difficulties establishing relationships with families, and in particular with families of students with the greatest needs. Several staff described instances of not being able to reach families simply due to change in address or phone number, or of repeated attempts to communicate with families and receiving no response. Staff also described how a lack of transportation and language barriers were preventing families from being able to access needed services. In addition, some staff cited a family culture that they perceived as “not necessarily one where education matters.” Staff survey data echoed interview data, with only fewer than 10 percent of staff members characterizing family involvement in decisions about nonacademic supports as “high.” About half of staff characterized family involvement as “slight.”
All districts were focusing on family engagement as part of their WAZ plans. However, Holyoke stood out as placing a particularly high priority on family engagement and building relationships with families during the first year. Interviewees emphasized that their “priority is family engagement, above and beyond” and that “family engagement is critical, and how schools engage families is essential” to WAZ. Holyoke used its WAZ funds to hire and place Family Access and Engagement Coordinators in each of its WAZ schools, who were solely responsible for reaching out to families and facilitating their school involvement. This position allowed the WAZ coordinators in Holyoke to focus more on issues related to addressing student needs and partnerships. Interviewees in Holyoke referred to the importance of “professionalizing” family engagement work, as opposed to delegating it to part-time, nonprofessional staff in the school. In other districts, similar strategies were being planned or had begun but were somewhat slower to develop than in Holyoke. For example, in Fall River, plans were underway to develop family resource centers in each WAZ school, and in Worcester, schools had existing family support
American Institutes for Research Evaluation of the Wraparound Zones Initiative: Report Two—16

teams that were integrated into the WAZ work. Many schools had begun or were planning to collect data from parents about their needs. Overall, stakeholders in all WAZ schools and districts recognized the need to address family engagement and were in varying stages of implementing strategies focused on this issue.
Summary
In general, these findings suggest that there were several strengths that districts and schools could build upon as they progress through their WAZ grant, but also that there were several challenges. For example, data revealed overwhelmingly strong buy-in across all stakeholders for the purpose and goals of WAZ, much of which could be attributed to the fact that the WAZ districts were all finding ways to connect WAZ to other, related initiatives. The connections that district and school leaders made between social–emotional support and academic success were instrumental for communicating and gaining widespread support for the importance of WAZ. However, data also revealed challenges related to family engagement, student and family access to services, and school climate. These challenges were all compounded by the fact that many staff members in the WAZ schools lacked sufficient experience, knowledge, and training on how to address the very intensive needs of the students and families in their communities.
Finally, although data generally indicated that WAZ districts and schools were moving forward with the implementation of strategies in their WAZ plans, these data also foreshadowed potential challenges to come with respect to the sustainability of these strategies. For example, although all of the WAZ schools were building and enhancing partnerships with community agencies to some degree, district progress in establishing an infrastructure to coordinate the development and maintenance of these relationships was yet to develop. Although this did not seem to impede progress in the development of school–community partnerships in Year 1, a continued lack of a district infrastructure in Years 2 and 3 could potentially compromise the sustainability of these partnerships. Similarly, during Year 1, staff relied very heavily on district- and school-level WAZ staff positions to move the work forward. Evidence from Year 1 suggested that these WAZ-funded positions were critical for the planning and start-up phases of WAZ, but a gradual shift toward integrating these roles and responsibilities into the broader district and school staff will be important for sustainability in Years 2 and 3.
In the following sections, we present profiles for each district, which include detail on the findings that were unique to each district.
Profile A: Fall River
Introduction
The purpose of this profile is to provide a description of the conditions and supports that existed in Fall River during Year 1 of the Wraparound Zones (WAZ) initiative and to present key findings related to the district’s initial efforts for WAZ implementation. The data sources used to inform this profile are (a) stakeholder interviews conducted during the spring of 2012,10
10 These included interviews with district leaders, including the district wraparound coordinator, WAZ school principals, student support coordinators (SSC) at Doran and Kuss, a school wellness coordinator at Doran, and four community partners. The SSC at Viveiros was newly hired at the time of AIR’s interviews, and so was not included.
American Institutes for Research Evaluation of the Wraparound Zones Initiative: Report Two—17

(b) WAZ-related documents provided by the district and schools, (c) data from a staff survey administered by AIR, 11 and (d) data from AIR’s Conditions for Learning (CFL) survey of students in Grades 2–8.12 Together, analysis of these data provides a comprehensive picture of the conditions in Fall River during the first year of WAZ implementation.
Fall River selected three schools to participate in the initiative in Year 1 (Doran and Viveiros Elementary Schools and Kuss Middle School). These schools were selected because they were either Level 4 schools (Doran and Kuss) or a feeder school (Viveiros) to the Level 4 middle school (Kuss) with “tremendous need.” When WAZ implementation began, the two Level 4 schools were entering their second year of the redesign process. Table 4 presents demographic data for the three participating schools, as well as averages across the three schools and for Fall River overall.
Table 4. Fall River WAZ School and District Demographics, 2011–12
Doran Elementary
PK-6
Viveiros Elementary
K-5
Kuss Middle
6-8
Cross-WAZ School
AverageFall River
DistrictAccountability status Level 4 Level 3 Level 4 N/A Level 4Enrollment 459 729 626 N/A 9,834Percentage low-income 90.2% 90.3% 79.4% 86.5% 78.3%Percentage English language learners 22.2% 5.5% 0.3% 7.9% 6.1%Percentage with disabilities 18.3% 16.6% 18.1% 17.5% 21.1%Percentage scoring proficient or higher on the English language arts section of the Massachusetts Comprehensive Assessment System (MCAS) 28.1% 38.8% 63.0% 49.8% 48.0%Percentage scoring proficient or higher on mathematics section of MCAS 26.6% 35.9% 53.7% 43.7% 36.7%Percentage African American/black 5.4% 7.0% 7.3% 6.7% 6.8%Percentage Asian 2.6% 2.3% 1.8% 2.2% 4.5%Percentage Hispanic 30.9% 24.6% 16.9% 23.5% 19.0%Percentage white 55.6% 57.8% 70.3% 61.5% 65.3%
11 The staff survey was administered to all teaching and nonteaching staff members in the school building except for the principal and staff person serving in the WAZ coordinator role. 12 The student survey was administered in February 2012, and the staff survey was administered in May 2012.
American Institutes for Research Evaluation of the Wraparound Zones Initiative: Report Two—18

Doran Elementary
PK-6
Viveiros Elementary
K-5
Kuss Middle
6-8
Cross-WAZ School
AverageFall River
DistrictPercentage other 0.2% 0.4% 1.0% 0.6% 4.4%
Source: Massachusetts Department of Elementary and Secondary Education.
In the remainder of this profile, we describe findings related to the conditions that existed in Fall River during Year 1 of WAZ implementation. We first present overall findings that cut across WAZ Priority Improvement Areas or that reflect particularly strong themes that emerged in the Fall River data. We then present findings within each of the four WAZ Priority Improvement Areas.
Overview and Summary of Key Findings
Overall, data from the evaluation revealed the following four key findings for Fall River, which describe the conditions and supports that existed in the district upon beginning implementation of its WAZ grant:
1. Upon launching the WAZ grant, there was evidence of strong buy-in for the initiative at both the district and school levels, due in large part to recent district efforts that aligned with WAZ priorities.
2. During Year 1, schools varied across in terms of the foundational work related to “wellness” that they were able to build off when implementing WAZ.
3. Fall River entered into its WAZ grant with a strong infrastructure of community–district relationships and community services in place in many schools. However, systematizing procedures to enhance and maintain these relationships was an ongoing challenge.
4. Facilitating better home–school connections had been a longstanding challenge.
Two sections follow that further elaboration on these findings. In the first section, we present a brief summary of the evidence supporting each of the four findings listed above. In the second section, further analysis and data for each of the WAZ Priority Improvement Areas are presented.
Overall Finding 1. Upon launching the WAZ grant, there was evidence of strong buy-in for the initiative at both the district and school levels, due in large part to recent district efforts that aligned with WAZ priorities.
During the years just prior to beginning its WAZ grant, Fall River began including social–emotional supports as part of what the district calls its “wellness plan.” The Fall River wellness plan emphasizes the importance of student’s physical and emotional health as a contributor to learning, and promotes policies and programs designed to support all aspects of student health and well-being. This district-level focus on wellness initially centered on physical activity and nutrition, but began to include social-emotional health with the school redesign work at Doran Elementary, which included an emphasis on building community partnerships to carry out strategies in the areas of positive youth development, positive climate and culture, and home–school connections. As one interviewee noted, Doran “started the whole wraparound pieces a
American Institutes for Research Evaluation of the Wraparound Zones Initiative: Report Two—19

little bit earlier than the formal wraparound” grant. At the same time, Fall River had recently (in 2009) undergone a comprehensive district review by the Massachusetts Department of Elementary and Secondary Education and was implementing a recovery plan designed to address areas the Commissioner had found to be deficient. Because of this confluence of factors—including the district’s recovery plan and its wellness-related efforts—stakeholders at a variety of levels of the district and school system that we interviewed were optimistic about WAZ’s potential success and expected there to be many positive changes underway in the district. Interviewees noted strong buy-in for the WAZ work at the senior district level, and among principals and staff in all three WAZ schools. One school leader shared that “I am certain that it’s [WAZ] going to yield results, if not this year then next year, in terms of MCAS [Massachusetts Comprehensive Assessment System] scores and other qualitative data ways.” Several others noted that the WAZ grant enhanced and helped to move their already existing wellness priorities forward.
Overall Finding 2. During Year 1, schools varied in terms of the foundational work related to wellness that they were able to build off when implementing WAZ.
All three WAZ schools—Doran Elementary, Viveiros Elementary, and Kuss Middle School—demonstrated strong buy-in and readiness to implement WAZ upon receiving the grant. One interviewee commented that “each school has a dynamic leader...[and that] all of these principals were involved in writing the initial grant,” so they had “a good vision for where the work needs to go.” However, some evidence suggested that WAZ implementation moved forward more quickly at Doran and Kuss than it did at Viveiros. At both Doran and Kuss, their Level 4 status and identification as struggling schools allowed them the flexibility to make certain changes that also facilitated implementation of WAZ strategies. For example, Doran’s Level 4 status led to changing half of the school’s staff and was “an opportunity to really restructure” the school. As one interviewee commented, “the turnaround funds also went into [the school’s]...plan because we wanted it to help influence community and culture...[and] a big part of the [school’s] turnaround plan was wellness. A lot of strategies in the wraparound plan are very similar to those in the turnaround plan.” Kuss, as part of its Level 4 redesign efforts, implemented an extended day, which afforded more time to conduct remedial work and provide enrichment opportunities that aligned with WAZ’s goals for student support. Kuss had also established a wellness team as a subcommittee of its redesign team.
Viveiros was not a Level 4 school, but several interviewees commented that the district considered it a school in crisis. Unlike Doran and Kuss, Viveiros did not have the benefit of having initiatives or leadership in place that were already focused on wellness-related work. At the start of the WAZ grant, Viveiros had a new principal, and one interviewee shared that Viveiros was not focused on wellness prior to WAZ. In addition, the school experienced a change in its student support coordinator (SSC) in the middle of the year, which may have slowed its WAZ-related progress. Many interviewees in Fall River noted that the SSC role in supporting WAZ strategies was critical; one school leader shared that the school’s SSC “is really the link between our school, our families and the community.... [The SSC] does a lot of work with our families and...also brought a lot of partnerships into the school.”
American Institutes for Research Evaluation of the Wraparound Zones Initiative: Report Two—20

Overall Finding 3. Fall River entered into its WAZ grant with a strong infrastructure of community–district relationships and community services in place in many schools. However, systematizing procedures to enhance and maintain these relationships was an ongoing challenge.
The Fall River community had many agency resources and funding sources available to support families and children, and the school district had long-standing partnerships with a range of community organizations at the district and school levels. Several stakeholders commented on the passion and commitment of outside agency and district/school staff to the community, students, and families. In recent years, community partners have been more welcomed into schools to provide services. As one interviewee explained, “Everyone has that feeling that it used to be closed-door policy [for community agencies] and now it’s open.” Another shared that WAZ aligns directly with the community organization mission of facilitating involvement in delivering services to Fall River students. Nonetheless, challenges still existed with respect to ensuring that appropriate and effective partnerships were systematically established and maintained to support school and student needs. Staff survey data showed that sizable percentages of staff members weren’t aware of the services provided by external partners (or thought they were not adequate or only slightly adequate), and interview data noted challengesrelated to district leader time and commitment as well as navigating changing services and funding. One interviewee noted, “A strength is that we have lots of resources in our community, lots of funding comes into this community.... However, on the flipside, navigating these resources for communities is sometimes impossible.” Another interviewee shared that “we also need to educate ourselves about what these partners can bring into our school and really how these partnerships are going to be mutually successful.”
Overall Finding 4. Facilitating better home–school connections had been a longstanding challenge.
According to interview data, parent and family school engagement was widely considered a major challenge. As one community partner shared, “If 10 is the highest we can achieve of family involvement, I’d say it’s 3 or 4.” A school interviewee commented that “our biggest struggle is getting parents to be part of the school.” Issues such as poverty, family transience, limited educational attainment, inadequate college access, and neighborhood crime were noted by interviewees as factors which could be contributing to this challenge: “If you listen to the baggage that some of these children have, I mean broken homes, and parents who are ill or have lost their job. There is high unemployment here.” In addition, stigma associated with, and social attitudes toward, mental health and counseling were a challenge: “We have some youngsters who are not on Mass Health or whose parents don’t believe in counseling, so that’s an ongoing issue that has been there since the beginning of time.”
The Coordinated Family and Community Engagement (CFCE) Program, funded by the Massachusetts Department of Early Education and Care and in its second year of implementation in Fall River in 2011–12, was available to provide information to families about early education opportunities and facilitate their connection with community partners. Examples of available supports from the CFCE included literacy programs, such as a weekly Play and Learn program to build literacy skills of caregivers and children, written resources on child development, and facilitating family access to the statewide wait-list for child-care vouchers. Although the CFCE
American Institutes for Research Evaluation of the Wraparound Zones Initiative: Report Two—21

has been a resource, one interviewee noted that it was challenging to build awareness about this support.
Other staff member reported a need for more translation resources to address language barriers, training for new teachers on home issues, and better access to transportation so that families can easily access the schools. WAZ was seen as a potential catalyst to shift family perceptions and attitudes toward their schools from negative to positive. One interviewee explained, “90 percent of the parents are afraid to walk into a school building. It could be based on a past experience or the way school staff looked down on them. I see it changing...but I’m hoping that that is the norm in the end of three years—that parents feel welcome, they feel safe, kids feel welcome...and our staff is equipped to meet all of their needs, not just their academic needs.”
WAZ Priority Improvement Area 1—Climate and Culture
The WAZ Climate and Culture Priority Improvement Area includes school-level practices intended to ensure safety, effectively manage student behavior, teach and model strong social–emotional skills, establish positive relationships with families and the community, and cultivate a climate of high expectations and positive regard between leadership, staff, and students—all supported by district-level systems. To address this improvement area, Fall River’s 2011–12 WAZ plan laid out the following four strategies:
1. Implement social–emotional learning (SEL)/healthy behavior curricula: Responsive Classroom and Playworks (elementary schools) and Guided Discipline (middle school).
2. Conduct a school climate and culture survey (students, staff, and parents) to establish a baseline and determine areas of need.
3. Continue implementing the middle school advisory program designed to develop positive and collaborative relationships between students and promote student connection to school.
4. Identify activities and other programmatic strategies that contribute to student/family engagement and positive school climate.
During Year 1, Fall River made progress in all four of the strategies laid out in its WAZ plan. The district implemented SEL curricula in all three WAZ schools (Strategy 1); assessed climate using various surveys, although some of this occurred prior to the WAZ grant (Strategy 2); continued and enhanced the advisory program at Kuss (Strategy 3); and worked to move family engagement strategies forward (Strategy 4). This section describes three findings related to Priority Improvement Area 1: Climate and Culture, and the evidence that supports these findings.
Climate and Culture Finding 1. Teaching and modeling social–emotional learning and respectful behavior was both a need and an area of focus in the Fall River WAZ schools.
Both student and staff survey data revealed concerns about school climate, specifically as it related to relationships among students in the schools. For example, according to the CFL survey, 31 percent of students reported that their school “needs improvement” on the “Safe and Respectful Climate” scale, which measures how physically safe (e.g., whether there are fights, thefts, and vandalism) and emotionally safe (e.g., whether students treat each other with respect or tease/bully each other) students feel. In addition, 25 percent of students reported that their
American Institutes for Research Evaluation of the Wraparound Zones Initiative: Report Two—22

school “needs improvement” on the “Peer Social–Emotional Climate” scale, which measures students’ perceptions of their peers’ social and problem-solving skills. Social–emotional learning was of particular concern at Kuss, where 38 percent of students saw this as an area needing improvement. Staff survey data further supported this finding, with 43 percent of respondents disagreeing that students in their school respected and supported one another (see Table 5).
Table 5. Students’ and Staff Members’ Perceptions of School Climate
Reported Perceptions
Doran Elementary
(n = 290, 40)13
Viveiros Elementary (n = 424, 65)
Kuss Middle (n = 584, 57)
Fall River WAZ
Overall (N = 1298,
163)Conditions for Learning SurveyStudents reporting that their school “needs improvement” on the “Safe and Respectful Climate” scale 24% 32% 33% 31%Students reporting that their school “needs improvement” on the “Peer Social–Emotional Climate” scale 12% 15% 38% 25%Staff SurveyStaff members disagreeing or strongly disagreeing that students are respectful toward and support one another 27.5% 50.8% 43.9% 42.9%
To address these needs, Fall River implemented SEL curricula in all three WAZ schools during the first year of WAZ implementation. At the two elementary schools, these included Responsive Classroom and Playworks, programs intended to address problem behavior and improve students’ social skills. Responsive Classroom is a schoolwide SEL curricula focused on effective classroom management strategies. Components of Responsive Classroom include a student–teacher greeting, sharing opportunity, group activity, and morning message. Playworks is a curriculum that teaches students how to interact with each other appropriately during recess. Both of these programs were initiated in Doran and Viveiros in June 2011, prior to the launch of the WAZ grant. Interviewees noted these curricula were much-needed supports, in particular because many students lacked social skills and could not effectively interact with peers during playtime. One interviewee shared that “I think the initiative of Responsive Classroom, which we implemented in Fall 2011, has helped with community and culture.... Teachers have used the language, which has helped...[and] we have morning meeting. It starts the day off positively, the kids say it’s the best part of their day.” Another raved about Playworks and its benefit for climate and culture: “The culture shift in recess carries over to the building. The kids do rock paper scissors outside and in the classroom instead of beating each other up. What’s happened in Playworks is structured, collaborative play. The principal at a school was telling me that the biggest, toughest kid in fourth grade was playing a game with a kid with a disability. That would have never happened before. This idea of inclusiveness, [being] collaborative rather than 13 The first number in the parentheses represents the number of respondents for the CFL and the second represents the number of respondents for the staff survey.
American Institutes for Research Evaluation of the Wraparound Zones Initiative: Report Two—23

competitive. We’ve seen immediate results from that. In many ways that has been easy to implement.”
At the middle school, Guided Discipline entered its second year of implementation during Year 1 of WAZ. This program is intended to support students’ self-management, responsible decision making, and disciplined work habits. Teachers received “a lot” of professional development to implement this behavioral approach, which the school used “to empower kids to be responsible for themselves” and to build the capacity of teachers “to deal with kids who can be destructive, in a positive way.” In addition, using data it collected from the Tripod survey in spring 2010 and 2011, Kuss decided to put in place an advisory program because students reported concerns with teachers caring about them. This program provided opportunities for students to meet with adult advisors, creating a more personalized learning environment for students and increased connections to caring adults.
Also, school-specific efforts were underway to address this Priority Improvement Area. For example, at Doran and Kuss, Leadership and Educational Attainment Developed Through Service (LEADS) was providing students with leadership opportunities to enhance peer-to-peer interactions and school culture. Doran was in the process of transitioning from a K–5 to a PreK–8 school, adding prekindergarten and Grade 6 in 2011–12. This was intended to build stronger connections with students and their families and address instability in their lives: “We wanted to...really try to keep our students and give them more stability, because we noticed they lack a lot of that.” Viveiros restructured into a house system, with students assigned and separated into red, orange, yellow, green, and blue houses as part of its larger efforts to promote positive SEL and youth development. This structure was intended to create smaller communities, each of which was staffed with a school adjustment counselor and therefore better able to sustain connections between students, families, and staff. In addition to having monthly house meetings, the school was providing “an incentive at lunch and recess so the houses...[could] earn points based on their work ethic out on the playground.” The school also put in place a student center with three components: a peace room, an in-school suspension room, and a student resource room.
Overall, several interviewees described positive impacts that these strategies were having on their school climate. One interviewee talked about how the school’s social–emotional efforts were supporting a shift in school climate: “We really wanted to change this culture and really create this positive atmosphere where our kids could believe that they could be anybody they wanted to be, do anything they wanted to do, so we felt that responsive classrooms, morning meetings, that was really going to kind of set the tone for us and really get us to a culture shift. It has done some of that, but we need to bring that to the next level.” Another shared that the school’s openness to supporting students’ SEL was a key strength: “You can tell when you walk in, [the school] is open to the issue of servicing kids socially and emotionally.”
Climate and Culture Finding 2. Schools had some strengths and several challenges related to their behavior management systems.
Staff survey data revealed both strengths and challenges related to behavior management systems (see Table 6). For example, almost all elementary school staff members (93 percent or more) reported that their schools had clearly stated expectations for student behavior. The percentages
American Institutes for Research Evaluation of the Wraparound Zones Initiative: Report Two—24

of elementary school staff members who reported teaching and positively reinforcing expected student behaviors were also relatively high (75 percent or higher). Viveiros developed a schoolwide behavior plan in summer 2011 because, as one interviewee noted, the school “didn’t have any expectations” for student behavior prior to then. The plan included “clear expectations and...a clear outline for what teachers could do in response to any sort of student behavior that children were exhibiting, whether or not it was social–emotional or behavioral.” School staff received professional development to implement the new plan. The school also created a one-page description of positively written expectations for students so as to be “clear about everything” because “children like structure.”
However, at the time of AIR’s survey, fewer staff at both elementary schools agreed that behavior management procedures were adequate for their classrooms, that behavior was effectively managed in nonclassroom settings, or that schools had clearly defined consequences for not meeting expected student behaviors. At Viveiros in particular, only 54 percent of staff members agreed that schoolwide procedures for behavior management were adequate for their classroom, raising questions about the adequacy of their redesigned behavior management system, or the extent to which staff members were fully knowledgeable of it at the time of the staff survey.
Perceptions of behavior management at Kuss were less positive than at the elementary schools, with less than 70 percent of staff members agreeing that their school had clearly defined expectations for student behavior, or that all staff members teach and positively reinforce expected student behaviors. Furthermore, less than half of the staff members at Kuss agreed that behavior management procedures were adequate for their classrooms, that behavior was effectively managed in nonclassroom settings, or that the school had clearly defined consequences for not meeting expected student behaviors.
Table 6. Staff Members’ Perceptions of Schoolwide Procedures for Behavior Management
Staff Members Who Agree or Strongly Agree
Doran Elementary (n = 33–34)
Viveiros Elementary (n = 63–64)
KussMiddle (n = 55)
Fall River WAZ Overall (N = 153–
155)Their school has clearly defined behavior expectations. 97.1% 93.7% 69.1% 85.7%All staff members in their school teach expected student behaviors. 90.9% 82.8% 69.1% 79.7%All staff members in their school positively reinforce expected student behaviors. 88.2% 76.6% 69.1% 76.6%Schoolwide procedures for behavior management are adequate for their classroom. 81.9% 54.7% 45.5% 57.5%Behavior is effectively managed in nonclassroom settings. 61.8% 65.1% 38.2% 54.9%
American Institutes for Research Evaluation of the Wraparound Zones Initiative: Report Two—25

Staff Members Who Agree or Strongly Agree
Doran Elementary (n = 33–34)
Viveiros Elementary (n = 63–64)
KussMiddle (n = 55)
Fall River WAZ Overall (N = 153–
155)Their school has clearly defined consequences for not meeting expected student behaviors. 66.6% 54.7% 36.3% 50.9%
Climate and Culture Finding 3. Parent/family school engagement was widely considered a major challenge and efforts to improve family engagement were underway in all three WAZ schools.
According to the staff survey, slightly more than half (57 percent) of staff members characterized the level of involvement that families had in decisions about students’ nonacademic services as “slight” or “not involved”. Only 8 percent described family involvement in these decisions as “high.” Reported barriers to family engagement included communication with parents (due to language differences), parents not accessing services because they “don’t believe in counseling,” transportation (which one interviewee describes as a “huge” factor), and parent follow-through (e.g., parent workshops on topics such as good nutrition at one school were not well attended). Doran had multilingual staff speaking Portuguese and Spanish, which were the most common languages spoken by parents whose primary language was not English. Nonetheless, language differences were a challenge. One interviewee noted that Doran had “kids from all over the city...who speak many languages other than English.” Another shared that “for the individual teachers, it might be challenging. Even for some of the ancillary staff, it might be a barrier for those staff that don’t speak Portuguese or Spanish. They do a great job. They translate everything. But still, if you don’t speak a parent’s language, it can be very challenging. That’s the only challenge that I can see that they have there—it’s the language barrier.”
Furthermore, one interviewee noted that “the culture of Fall River is not necessarily one where education matters, and many of the parents of our youngsters are not well educated.” As an example of concerns about parent follow-through, one interviewee shared that an external provider came into the school to deliver presentations to parents on various topics, and the school “sent out all sorts of literature and sign ups and...had 40 people sign up and on the day of [the presentation] one person came. That was sad.” Another interview pointed to “the disconnect between the diversity of our student population and the lack of diversity in our adult population” as a challenge that could be related to family engagement and the ability of school staff to effectively connect with families. One interviewee noted that newer teachers may be less adept at understanding and supporting the particular home issues of students with high needs and that as senior teachers leave, new teachers needed training on how to connect with students and families more effectively.
Several efforts to enhance family engagement were underway in Fall River during Year 1 of WAZ implementation. The district WAZ coordinator, in collaboration with the Coordinated Family and Community Engagement Program, was working with schools to develop family resource centers. Also, all three WAZ schools were focusing on parent/family school engagement. For example, one school leader noted that “the parent component is the biggest piece that we’re working on.” Another shared that “we have worked really hard to involve all
American Institutes for Research Evaluation of the Wraparound Zones Initiative: Report Two—26
parents...[but the] challenge is getting them to come in.” One interviewee noted that Doran and Kuss were making great efforts to get families involved. For example, Doran was recruiting neighborhood partners to provide services to families at night. Viveiros brought in a retired school psychologist to give presentations to parents on various topics. Although these presentations were not well attended, the school had “met with more parents” during Year 1, including to give parents “direction to where they can go to get services...[a] proactive piece with the adjustment counselors.” Several interviewees noted that the SSCs at the schools were also helping to reach out to and engage families. One school leader noted that “my SSC is really the link between our school, our families, and the community.... [The SSC] does a lot of work with our families.”
WAZ Priority Improvement Area 2—Identifying and Addressing Student Needs
The WAZ Identifying and Addressing Student Needs Priority Improvement Area includes school-level practices intended to assess the well-being of all students; effectively implement policies or programs to address the universal needs of students; establish structures and systems to create, monitor and adapt success plans for students requiring targeted assistance; and provide the necessary training and support to ensure that staff members can effectively identify and address student needs—all supported by district-level systems. To address this improvement area, Fall River’s 2011–12 WAZ plan laid out the following five strategies:
1. Use existing curriculum accommodation teams (CATs) as the main referral, intervention, and case management teams that field teacher referrals, develop individualized student academic and social–emotional support plans, and track support.
2. Develop/recast school-based wellness teams and use as main teams responsible for WAZ implementation in the building and development of strategies that support overall needs of the student body.
3. Conduct resource mapping and a needs assessment to identify existing resources (partners, program capacity, and so on) and parent interests (what they would like more of); use findings to identify resource gaps and WAZ development priorities.
4. Expand or develop activities, programs, or services designed to meet priority student and climate and culture needs, e.g., family activities (literacy night and game night), expanded extended learning time/afterschool or mentoring opportunities, and increased access to in-school counseling.
5. Review referral protocols, practices, tools, and data collection across schools; identify consistent methods.
Data collected during Year 1 revealed that Fall River WAZ schools were using their CATs and wellness teams to facilitate the implementation of consistent processes around identifying and addressing student needs (Strategies 1 and 2). At Doran and Kuss, school-level resource mapping occurred prior to the WAZ grant, and all three schools collected data from teachers, students, and parents to identify needs (Strategy 3). Efforts were underway at all three schools to address priority student and climate and culture needs (Strategy 4). There was no evidence that the district had reviewed referral protocols and identified consistent methods across schools (Strategy 5). This section describes two findings related to Priority Improvement Area 2: Identifying and Addressing Student Needs, and the evidence that supports these findings.
American Institutes for Research Evaluation of the Wraparound Zones Initiative: Report Two—27

Identifying and Addressing Student Needs Finding 1. All three WAZ schools had well-functioning CATs and wellness teams in place, with clear referral processes for identifying and addressing student needs.
The first two strategies in Fall River’s plan related to identifying and addressing student needs involved using existing CATs and developing or enhancing existing wellness teams as the main resources for managing referrals and intervention plans for students in need of support. Interview data suggested that these two teams were in place in all three schools and were a major strength with respect to identifying and addressing student needs.
The CATs were already in place for students struggling academically. As one interviewee shared, “If a student is struggling, the teacher will make the referral to the CAT team. They’ll meet three to four times, put in different interventions, see if there is growth. If not, it results in a special education referral after the team meets three times. Those go to the counselors.” Although Fall River’s plan described the CATs as a vehicle to support students’ social–emotional needs as well as academic needs, there was no evidence that schools were using the CATs in this way in Year 1.
Interviewees were especially positive when describing the ways in which the wellness teams supported their schools’ efforts related to addressing students’ nonacademic needs. The wellness teams included multiple school stakeholders (e.g., school adjustment counselors and school nurses) and focused on coordinating care, whether individual or group supports, for students who were identified as needing additional nonacademic supports. One interviewee shared that the school’s wellness team “is very organized. They will bring in outside people to talk about what kind of services they’ll be able to provide. Their goal is to be very proactive.” Similarly, at another school, the wellness team was seen as the “biggest strength.” Another interviewee shared, “The wellness team meeting once a week is helpful.... It’s the coordination of kids who are struggling, identifying a plan for those kids, seeing what the needs are with the key players in the building. Having the wellness team is a key strength. Having a fully staffed team makes a big difference, the roles are really clear.... The turnaround now is so much quicker than last year because we have so many more people.”
With the support of these teams, the WAZ schools were putting processes in place to refer students with identified needs. At Viveiros, teachers were using referral forms which members of the wellness team would use to identify students who could benefit from the different resources offered by the school’s student center (e.g., peace room, in-school suspension room, on-site behavioral supports). The school was “looking at children who...[were] coming in over and over again, and what their needs are and what’s in place for those children, and also monitoring whether or not there needs to be more in place.” Kuss put in place additional processes to create a pathway for referring and coordinating services for students. These emerged around the school’s cluster structure (i.e., four cohorts of teachers with members representing key content areas—English, mathematics, science, and social studies—and serving the same students). Each cluster of teachers began meeting weekly, and the school put in place protocols for these clusters to identify and refer students in need. The school saw those “cluster meetings as a conduit for information sharing. They were already existing. The clear protocols for information sharing
American Institutes for Research Evaluation of the Wraparound Zones Initiative: Report Two—28

were not there,” though. So the school added a standing item related to student referrals as part of the cluster meeting agendas.
Staff survey findings supported interviewee perspectives on the CATs and wellness teams; more than 80 percent of staff members at each school said that they would follow a formal, systematic process for sharing their concerns with other staff members if they identified a student needing additional academic or nonacademic support (see Table 7). A large majority of staff members at all three schools indicated that they used data to identify students’ academic needs and followed a systematic process for referring students to both academic and nonacademic services. Moreover, over 80 percent of staff at the two elementary schools, and a sizable proportion at Kuss, also noted that they used data to identify students’ nonacademic needs and that academic and nonacademic services students received effectively addressed their needs. Some concerns were evident at Kuss, though, where fewer respondents (59 percent) indicated it was “likely” or “very likely” that nonacademic supports would address students’ needs.
Table 7. Staff Members’ Perceptions of Procedures for Identifying and Addressing Student Needs
Staff Members’ Reports
Doran Elementary
(n = 30)
Viveiros Elementary
(n = 55)
Kuss Middle
(n = 49–51)
Fall River WAZ Overall
(N = 135–137)Reports of “Likely” or “Very Likely” Actions Upon Identifying a Student With Academic Needs The staff member would follow a systematic process for referral. 90.7% 96.4% 88.5% 92.2%The staff member would use data to confirm the need for support. 87.1% 91.1% 82.7% 87.1%The services that the student receives would effectively address his or her needs. 81.2% 82.1% 67.3% 76.6%Reports of “Likely” or “Very Likely” Actions Upon Identifying a Student With Nonacademic Needs The staff member would follow a systematic process for referral. 93.3% 100.0% 83.7% 92.6%The staff member would use data to confirm the need for support. 83.3% 92.7% 68.6% 81.7%The services that the student receives would effectively address his or her needs. 86.7% 85.5% 58.8% 75.9%
American Institutes for Research Evaluation of the Wraparound Zones Initiative: Report Two—29

Identifying and Addressing Student Needs Finding 2. Despite well-functioning teams and systems in place for identifying student needs, data revealed some challenges related to follow-up steps and addressing student needs in a timely manner.
According to the staff survey, large majorities of staff at all three WAZ schools indicated that they would be “likely” or “very likely” to follow a systematic process for referral (see Identifying and Addressing Student Needs Finding 2). However, smaller majorities of staff at all three schools reported that it would be “likely” or “very likely” for students to receive services in a timely manner or for them to receive follow-up communication about the steps that were being taken to meet the students’ needs (see Table 8). These concerns were especially pronounced at Kuss.
Table 8. Staff Members’ Perceptions of Timeliness and Follow-Up Related to Identifying and Addressing Student Needs
Staff Members’ Reports
Doran Elementary
(n = 30)
Viveiros Elementary
(n = 55)
Kuss Middle
(n = 49–51)
Fall River WAZ Overall
(N = 135–137)Reports of “Likely” or “Very Likely” Actions Upon Identifying a Student With Academic Needs The student would receive services in a timely manner. 75.0% 66.1% 55.8% 64.6%They would receive follow-up about the steps that are being taken to address the student’s needs. 67.8% 74.5% 50.0% 64.0%Reports of “Likely” or “Very Likely” Actions Upon Identifying a Student With Nonacademic Needs The student would receive services in a timely manner. 80.0% 69.1% 51.0% 65.0%They would receive follow-up about the steps that are being taken to address the student’s needs. 60.0% 69.1% 43.2% 57.7%
In addition to the data in the staff survey, several general concerns related to timeliness and capacity to address student needs emerged during interviews. When asked about WAZ-related challenges, one interviewee noted that sometimes school staff were pulled in other directions and could not focus on wellness as much as they needed to: “If there is turnover or a priority, the wellness team isn’t as active as at other times.”
Transportation was also a major concern related to ensuring timeliness and follow-through on services. Three interviewees noted that the lack of district bussing was a significant challenge to
American Institutes for Research Evaluation of the Wraparound Zones Initiative: Report Two—30
connecting families and students with services in schools or the community. Another shared that public transportation was costly and that some families could not afford it. At one school, a concern was raised about the students “in the middle”—those who were not receiving attention because they weren’t students with challenges or high-performing students. One school also raised concerns about the capacity of support for students experiencing traumatic stress. Finally, the lack of a statewide criminal offense record information (CORI) check for individuals volunteering in schools was mentioned as a barrier to timely and efficient school access to services from external partners. One interviewee shared that “a major challenge above transportation is the CORI check issue. It’s important and valid. Because there is no statewide CORI check...[providers or volunteers] need to be checked at each different location. It’s a state problem, not Fall River, that we can’t make this more efficient.”
WAZ Priority Improvement Area 3—Community Coalitions
The WAZ Community Coalition Priority Improvement Area includes school-level practices intended to utilize a system to take stock of and access internal and external resources and supports, establish and coordinate partnerships to address student needs that cannot be met with internal resources, monitor the effectiveness of those partnerships and make changes where necessary, and convene internal and external partners and stakeholders to share information, collectively problem-solve, and collaborate on improvement efforts—all supported by district-level systems. To address this Improvement Area, Fall River’s 2011–12 WAZ plan laid out the following three strategies:
1. Identify valuable community WAZ partners and appropriate level and types of engagement. Establish more routine methods for reviewing and coordinating resources.
2. Leverage existing community coalitions; mobilize support for wraparound strategies.
3. Develop a community wellness team or coalition to advise the district on school–community collaboration and develop strong student/wraparound strategies.
Data collected from stakeholders during Year 1 revealed that Fall River began efforts to identify partners and leverage existing community coalitions (Strategies 1 and 2), but that more work was needed to improve monitoring and coordination of services. Furthermore, a community wellness team or coalition to advise the district, as laid out in Strategy 3, was not launched during Year 1. The district was instead looking into pushing the launch into Year 2, and holding partnership meetings and increasing awareness of available resources during Year 1. As one school interviewee commented, it “hasn’t started, but it would be helpful.” This section describes three findings related to Priority Improvement Area 3: Community Coalitions, and the evidence that supports these findings.
Community Coalitions Finding 1. Community partners as well as district and school staff all demonstrated a strong passion for and willingness to collaborate with one another around meeting student needs.
Analysis of interview data revealed a strong, genuine interest among community partners to support the district and its schools in meaningful ways. As one partner shared, “The city has a lot of long-standing agencies like ours that are willing to roll their sleeves up and work with the school system.” Community partners also spoke favorably about the ways in which district and
American Institutes for Research Evaluation of the Wraparound Zones Initiative: Report Two—31

school leaders were facilitating agency involvement and delivery of services. One noted in particular their willingness to partner with community organizations, embrace change, and increasingly meet the needs of students through targeted supports. Another noted the superintendent’s efforts: “Before we’ve been working with schools on a fragmented basis; she is trying to tear down those walls now for community partners to work jointly and on behalf of the children. Her leadership is a strength.” Another interviewee shared that Fall River is not just “trying to revitalize the schools, but also the larger community...[by] having our schools open, having activities for the parents.” Community partners also seemed to buy in to the district’s focus on wellness: “What practice tells me is that this model works. If you can stay with it...the outcomes will be good.”
School staff also had a strong openness and desire to collaborate with outside agencies. According to a partner, “I think the dedication of the teachers, from my exposure to them, they’re very committed to the purpose of the school and very accepting of the help to help deal with behaviors in the classroom and those sorts of things.” Several school staff members also commented on their commitment to fostering meaningful collaboration with outside agencies and spoke enthusiastically about their school–community efforts. For example, one shared that “I think knowing the community [agencies] has been really helpful, knowing who to reach out to. There were a lot of partnerships, people in the community, when I asked them to meet with me they said it had been tough to get into the schools in a while. They weren’t quite sure how or why that happened. We created a buzz, now I’ve had people call me. I think the community has been really open to helping, it’s been great.... I think the community has been really helpful and open to coming in and doing what they can.”
Two interviewees spoke about being from the Fall River community, and how that has influenced their commitment to the district and schools. For example, one explained: “If you ask someone who was born and raised here, there is a connection and a dedication, a commitment to the city. There is a sense of pride one feels whether you still live in the city or not. I would say the community partners and staff have that, it’s a passion, not a profession. The Boys and Girls Club is an example, they’re a partner. I went there the other day.... The kids feel comfortable there, they’re doing positive youth development activities, they’re doing great. The thing that impressed me the most is that they had many college kids working there, kids who grew up in the city. Three or four of them said ‘I grew up here,’ they mean they grew up in Boys and Girls Club, there’s a sense of connection, of giving back, a sense of community, a sense of being in the community.”
Community Coalitions Finding 2. During Year 1, Fall River began the process of identifying existing community partners and coalitions, and leveraging those relationships to support implementation of WAZ strategies.
Upon launching the WAZ initiative in Year 1, the Fall River WAZ schools had a range of community partners that were already providing services to students and families, including the Boys and Girls Club, Child & Family Services, People Inc., Re-Creation (CD Rec), United Partnerships, and the University of Massachusetts Dartmouth. Key informants described a number of school partners, some long-standing and some new collaborative efforts, to address priority student needs. For example, Music and Mind was providing music therapy to a small number of students at Doran and Kuss. Also, two mentoring programs provided related supports
American Institutes for Research Evaluation of the Wraparound Zones Initiative: Report Two—32

to students at all three schools. South Coast Mentoring Initiative for Learning, Education and Service (SMILES) was linking caring adults from the community with students (approximately 12 students at Doran and 30 students at Kuss), and United Partnerships, a peer mentoring program, was connecting approximately 10 seventh-grade mentors from Kuss with fifth-grade mentees at Viveiros. This effort emerged from the efforts of Kuss’s wellness subcommittee (which was part of its redesign committee), which wanted to start such a support for students. Furthermore, Child and Family Services had a “solid partnership” with Viveiros, with therapists coming into the school during the day to meet with students and collaborate with school adjustment counselors around strategies for meeting student goals. The three WAZ schools were working to expand existing partnerships. One school leader noted that the SSC “brought a lot of partnerships into the school.” Another commented that the district’s WAZ efforts led to improved coordination of services that each student receives and that new partnerships were “a direct outgrowth of the wellness initiative.” This interviewee also noted that the SSC was “working on other partnerships to provide more counseling and leadership” opportunities for students.
Although the district did not establish a coalition or district-level wellness team in Year 1 as planned, there were several existing community coalitions that the district was leveraging as part of WAZ. For example, the district coordinator and other district representatives were participating in South Coast Services, created by the Center for Civic Engagement at the University of Massachusetts Dartmouth; this group brings together 40 community-based organizations on a monthly basis to expand the breadth and depth of community service in the region, including its schools. Fall River was also participating in the Community Service Agency, a continuum-of-care group bringing together community partners to discuss expansion of services (both within and outside of schools). Although one partner described a “historically weak” grassroots movement to address community needs and the community–school connection in Fall River, efforts to improve these connections were underway. For example, a grassroots coalition focusing on homeless families recently began in the larger community, and for the first time, Fall River now had neighborhood associations and a neighborhood outreach coordinator position through the mayor’s office.
Community Coalitions Finding 3. The development and leveraging of community partnerships was fragmented in Year 1, and lacked sufficient district oversight and monitoring.
Despite strong efforts to identify and leverage partners, district and school collaborations with outside organizations remained somewhat fragmented in Year 1. This caused progress to be limited in establishing routine methods for reviewing and coordinating services and mobilizing support, as laid out as a strategy in Fall River’s WAZ plan. As noted in Community Finding 2, the WAZ schools in Fall River were leveraging multiple partnerships in myriad ways to try and meet student needs. However, relationships with community partners were not formalized at the district level with clear communication mechanisms. For example, some partners were learning of district and school needs through various communication channels, such as the district’s oversight committee. External organizations were also engaging in relationship building and communicating primarily with principals rather than through a district coalition (or wellness team). One partner knew about WAZ goals through informal conversations with the central office but had not received formal information about WAZ; other interviewed partners were
American Institutes for Research Evaluation of the Wraparound Zones Initiative: Report Two—33

knowledgeable of WAZ’s general purpose. Furthermore, one interviewee commented that it was challenging to free up central office staff time to attend meetings in the community and develop needed partnerships. Another noted that the large number of community meetings were not systematically organized and “doesn’t mean anything gets done.”
The lack of a formal coalition and inadequate communication about partnerships may have contributed to lack of staff knowledge or access to available supports. Staff survey data showed that a sizable proportion (approximately 60 percent) of WAZ school staff members reported that they were not knowledgeable about available supports or considered them not adequate or only slightly adequate (see Table 9).
Table 9. Staff Perceptions of the Adequacy of Supports Provided by External Partners
Staff Members’ Characterization of Nonacademic Supports Provided by External Partners in Their School
Doran Elementary (n = 25–26)
Viveiros Elementary (n = 46–48)
Kuss Middle
(n = 46–50)
Fall River WAZ Overall
(N = 120–125)Very adequate 11.3% 4.5% 6.6% 6.7%Adequate 48.2% 26.5% 30.6% 33.0%Slightly adequate 13.9% 19.8% 26.4% 21.2%Not adequate 4.6% 8.3% 10.8% 8.7%Don’t know 22.0% 40.9% 25.6% 30.5%
WAZ Priority Improvement Area 4—District Systems of Support
An important goal of the WAZ initiative is to expand and enhance districtwide systems to support practices related to improving climate and culture, identifying and addressing student needs, and sustaining a community coalition. To address this, Fall River included the following four strategies in its 2011–12 WAZ plan:
1. Provide professional development and coordination support for school-based WAZ implementation.
2. Establish consistent systems, practices, and protocols across schools for core WAZ activities, (e.g., climate and culture data collection, student and family needs assessment, referral protocols, and a base of wraparound supports that all Fall River schools should have in place, such as in-school counseling, afterschool programming, and mentoring).
3. Establish a strong collaboration with the Fall River Public Schools parent engagement office and develop core WAZ activities for parents (e.g., activities such as parent cafes and institutes to learn parent needs and share resource information).
4. Develop a community wellness team.
Data collected from stakeholders during Year 1 revealed that Fall River made significant progress in providing professional development and coordination to support WAZ implementation (Strategy 1). The district also made progress establishing consistent WAZ-related systems and practices, such as collecting climate and culture data and implementing
American Institutes for Research Evaluation of the Wraparound Zones Initiative: Report Two—34

school-based teams for identifying and referring students for services, but it had not yet established consistent referral protocols (Strategy 2). Furthermore, with involvement from the district’s parent engagement office, schools expanded supports for parents and families and the district began discussing development of a rubric to measure schools’ parent engagement efforts (Strategy 3). As noted in the previous section, rather than developing a community wellness team (Strategy 4), the district was instead considering holding partnership meetings and increasing awareness of available resources. This section describes two key findings related to Priority Improvement Area 4: District Systems of Support, and the evidence that supports these findings.
District Systems of Support Finding 1. The district used the WAZ grant to establish staff positions dedicated to overseeing and coordinating implementation of its WAZ strategies.
Fall River used its WAZ grant to invest in personnel, including a district WAZ coordinator and SSCs who functioned as school WAZ coordinators. The WAZ district coordinator, a new position funded through Race to the Top to support WAZ implementation beginning in October 2012, was housed within the Office of Instruction. The district coordinator was responsible for facilitating the SSCs as a group to both implement their school wellness plans and foster district cohesiveness around this initiative. The district coordinator position facilitated communication between the central office and the SSCs. Several school staff commented on the usefulness of the district coordinator position; one partner expressed gladness that the district coordinator position was created because it would be easier to collaborate with schools through that person because that person would understand districtwide activities and needs. Another shared that the district coordinator was a valuable position because it served as a “conduit between the schools and senior staff and central office,” which was important for keeping “communication going.” The district coordinator was working to support WAZ-related priorities, including “increasing efforts to engage parents, not just in school but also in ways...[to] help parents to meet their own goals and needs, such as résumé training and job interview techniques.” However, one interviewee noted that the district WAZ coordinator was both a new support and a challenge because schools were already doing this work, and the coordinator had to get “caught up.”
Each of the three Year 1 WAZ schools also received a full-time SSC, although there was turnover in this position at Viveiros during Year 1. School adjustment counselors filled these positions at Doran and Kuss, where wellness efforts were already underway. Comments related to the SSCs were quite positive. As one leader noted, the SSCs were helping to enhance service coordination through standard meeting agendas and that the SSC “follows through on whatever activities or plans” are discussed at the wellness team meetings. Another interviewee commented that the school’s SSC was “very strong in this position.”
District Systems of Support Finding 2. Professional development on WAZ-related strategies for school staff was a major district focus.
Fall River used the WAZ grant to support programs including Responsive Classroom and Playworks, which were considered significant and important WAZ efforts. The Fall River central office also used WAZ funds to provide additional professional development to build teacher capacity to improve student behavior and classroom climate. These supports were considered assets to implementing school improvement efforts: “We did it through the data and lots of professional development.” Another interviewee noted that to address climate and culture, the
American Institutes for Research Evaluation of the Wraparound Zones Initiative: Report Two—35

district was “providing increased professional development, giving teachers tools to improve management or classroom climate and culture,” building on the “great research” on “how to improve teacher language, how to increase motivation, how to get kids to self-regulate.”
Although the district progressed in this area, one interviewee acknowledged that the district was “struggling with systematically getting that knowledge to the classroom level in a way that’s sustainable, that’s strategic, with urgency.” Furthermore, the district WAZ coordinator was working with the district’s Directors of Instruction and Professional Development to discuss priority areas and collaborate on planning professional development that aligned with the WAZ goals. Part of this included professional development on parent engagement and the types of activities that “will be important for families.”
Conclusion
During the 2011–12 school year, Fall River progressed in implementing many strategies identified in its Year 1 WAZ plan. The district made substantial progress in efforts to improve school climate and culture (Priority Improvement Area 1) including implementing SEL curricula in all three WAZ schools, enhancing the advisory program at one school, and moving family engagement strategies forward. All three schools were also using their CATs and wellness teams to implement consistent processes and other strategies (e.g., collecting data from teachers and students) to identify and address student needs (Priority Improvement Area 2). Fall River made some progress in addressing community coalitions (Priority Improvement Area 3) by expanding current partnerships and leveraging existing community coalitions, but more work was needed to improve service monitoring and coordination, and the district did not establish a community wellness team or coalition to advise it as was originally proposed. Finally, although it did not establish consistent WAZ referral protocols to expand district systems of support for WAZ (Priority Improvement Area 4), Fall River made significant progress in providing professional development and coordination (e.g., school and district staff members dedicated to WAZ) to support WAZ implementation.
Profile B: Holyoke
Introduction
The purpose of this profile is to provide a description of the conditions and supports that existed in Holyoke during Year 1 of the Wraparound Zones (WAZ) initiative and to present key findings related to the district’s initial efforts for WAZ implementation. The data sources used to inform this profile are (a) stakeholder interviews conducted during the spring of 2012,14 (b) WAZ-related documents provided by the district and schools, (c) data from a staff survey administered by AIR,15 and (d) data from AIR’s Conditions for Learning (CFL) survey of students in Grades
14 These included interviews with district leaders, including the district WAZ liaison, WAZ school principals, full service community school managers at Morgan and Peck, four community partners, and a consultant that had worked with all three schools in various capacities and had supported the full service community planning at Morgan and Peck. 15 The staff survey was administered to all teaching and nonteaching staff members in the school building, except for the principal and staff person serving in the WAZ coordinator role.
American Institutes for Research Evaluation of the Wraparound Zones Initiative: Report Two—36
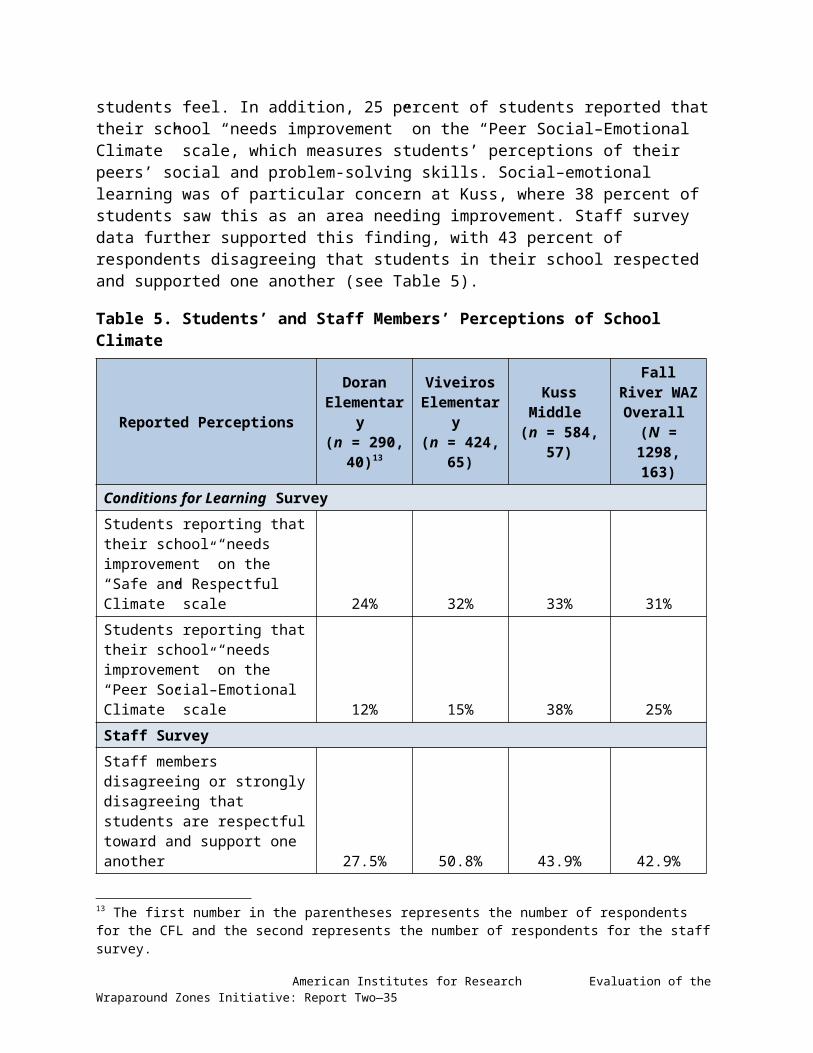
2–8.16 Together, analysis of these data provides a comprehensive picture of the conditions in Holyoke during the first year of WAZ implementation.
In Year 1, Holyoke’s WAZ initiative was supporting implementation of its full service community (FSC) school model in three schools: Kelly Elementary School, Morgan Elementary School, and Peck Elementary School. The FSC school model reflects a national movement to better coordinate and align school, home, and community resources, all in pursuit of a common goal to improve student achievement. Peck was entering its third year of implementation of the FSC model, Morgan was beginning its first year of the FSC model, and Kelly received a WAZ planning grant to prepare for its transition to a FSC school during the 2012–13 school year. All three schools served Grades K–8.
These three schools had “the neediest children in the district...with high poverty and homelessness.” They were selected because of this need and because they had the lowest academic scores in the district. Table 10 presents demographic data for the three participating schools, as well as averages across the three schools and for Holyoke overall.
Table 10. Holyoke WAZ School and District Demographics, 2011–12
Kelly Elementar
y K-8
Morgan Full Service
Community School
K-8
Peck Full Service
Community School
K-8
Cross-WAZ School
Average
Holyoke
District
Accountability status Level 3 Level 4 Level 3 N/A Level 4Enrollment 560 389 693 N/A 5,877Percentage low-income 98.6% 96.1% 95.4% 96.7% 82.4%Percentage English language learners 50.0% 42.7% 36.5% 42.6% 19.6%
Percentage with disabilities 18.8% 24.4% 23.8% 22.2% 16.7%Percentage scoring proficient or higher on the English language arts section of the Massachusetts Comprehensive Assessment System (MCAS)
17.9% 22.3% 22.7% 21.0% 50.1%
Percentage scoring proficient or higher on mathematics section of MCAS
13.0% 13.7% 24.1% 17.8% 39.4%
Percentage African American/black 0.7% 5.9% 4.3% 3.5% 3.3%
Percentage Asian 0.4% 0.5% 0.7% 0.5% 0.8%Percentage Hispanic 96.6% 88.9% 89.2% 91.7% 78.2%Percentage white 2.3% 4.6% 5.6% 4.3% 17.5%
16 The student survey was administered in February 2012 and the staff survey was administered May 2012.
American Institutes for Research Evaluation of the Wraparound Zones Initiative: Report Two—37

Percentage other — — — 0.0% 0.2%
Source: Massachusetts Department of Elementary and Secondary Education.
In the remainder of this profile, we describe findings related to the conditions that existed in Holyoke during Year 1 of WAZ implementation and, in the case of Kelly, WAZ planning. We first present overall findings that cut across WAZ Priority Improvement Areas or that reflect particularly strong themes that emerged in the Holyoke data. We then present findings within each of the four WAZ Priority Improvement Areas.
Overview and Summary of Key Findings
Overall, data from the evaluation revealed the following four key findings for Holyoke, which describe the conditions and supports that existed in the district upon beginning implementation of its WAZ grant:
1. WAZ funding in Holyoke built on and broadened the existing FSC school work at one school, and expanded the FSC school model to two additional schools.
2. Holyoke engaged in a purposeful, intensive, and data-informed planning process at Kelly, similar to its approach that supported FSC school implementation at Morgan and Peck.
3. WAZ planning and implementation were supported by strong buy-in for the FSC school model among staff at the WAZ schools, especially among principals.
4. Holyoke used WAZ to support a part-time district liaison rather than a full-time district coordinator, and established a Community of Practice among the WAZ schools as a vehicle for providing district support. In the absence of a formal system of district support, WAZ schools were relying heavily on one another for support.
Two sections follow that further elaboration on these findings. In the first section, we present a brief summary of the evidence supporting each of the four findings listed above. In the second section, further analysis and data for each of the WAZ Priority Improvement Areas are presented.
Overall Finding 1: WAZ funding in Holyoke built on and broadened the existing FSC school work at one school, and expanded the FSC school model to two additional schools.
The WAZ grant provided valuable resources for Holyoke to continue broaden the FSC school model at one school (Peck) and expand it to two more (Kelly and Morgan). In Holyoke, the FSC school initiative began under the leadership of the current principal at Peck. In fall 2008, Peck was a chronically underperforming middle school, which the district closed and then replaced by consolidating two schools—an elementary and a middle school—into a new K–8 school. According to one interviewee, this was an opportunity to “make a new school with a new identity.” The school’s principal wanted to prioritize family engagement and realized “it was a good time to think about Peck as a FSC school, look[ing] at existing partners, and align[ing] them where needed,” with focus areas such as “early college education, tutoring/mentoring, college awareness.... Partners came on board very quickly.” Fortunately, the two schools that were consolidating into one, as well as the old Peck school, had existing partnerships with community agencies that the new principal was able to leverage: “Lots of partnerships were
American Institutes for Research Evaluation of the Wraparound Zones Initiative: Report Two—38

available.” Peck began a FSC school planning process with an external consultant in fall 2009, began implementing components of the model during the 2009–10 school year, and fully implemented it in fall 2010. At around this time, the principal at Morgan was interested in the FSC school model and decided to participate in a planning process. During Year 1 of WAZ, a new principal at Morgan then continued this commitment and moved forward with implementing the FSC school model.
Through WAZ funding, Holyoke has supported continued implementation of the FSC school model at Peck, first year implementation of the model at Morgan, and a needs and assets assessment process at Kelly. Holyoke’s approach to the WAZ grant “was very much about the full service community agenda; what are the areas that wraparound would support that would add and grow the full service model.” For example, the district used the grant to fund the FSC school manager and family access and engagement coordinator positions at Morgan, and to support an external consultant who assisted with planning efforts at Kelly. Several interviewees noted how the FSC school and WAZ efforts were complementary: “Wraparound and full-service work together cohesively.” Others noted how WAZ was “building on existing efforts” and providing “the resources to ‘move to vision’ to motivate kids academically, socially, and emotionally for college. We’re working on all the pieces. This WAZ grant is helping to fund that vision to fruition.” Another interviewee also shared that WAZ “is a chapter in the [district’s] very long history” to bring together partners and improve services and outcomes for students.
Overall Finding 2: Holyoke engaged in a purposeful, intensive, and data-informed planning process at Kelly, similar to its approach that supported FSC school implementation at Morgan and Peck.
Holyoke hired an external consultant to facilitate the FSC school planning process at Morgan and Peck (prior to WAZ funding) and at Kelly with the WAZ planning grant. The district-funded planning at Morgan in spring and summer 2011 provided information that was the basis for the school’s WAZ-related efforts and FSC school implementation during the 2011–12 school year. The planning process produced an “extensive” amount of qualitative data as well as quantitative data, with a focus on “what could be better here?” An external consultant met with school staff, from teachers to custodians, in small groups that focused on discussing two guiding questions: (1) What were the barriers keeping students from reaching their highest academic potential? (2) What were resources/programs/ supports for them or their families to reach that potential? The consultant also met with and conducted short surveys of parents.
At Kelly, the consultant met and worked with teachers and conducted student surveys. She met with small groups of faculty and staff during grade-level team meetings to introduce FSC school concepts. She also “introduced the planning and wraparound concepts...[and] said what the vision is for school.” These discussions tended to focus on two questions: “What are the barriers that keep students from reaching their highest academic potential? What are resources/programs/supports for them or their families to reach their potential?”
The consultant also met with parents and developed a short parent survey, a half sheet with one question and related bullet points to engage parents with low literacy skills. The survey asked questions such as whether they would sign up for particular services. She also held a focus group with parents, which addressed a guiding question: “We think we know what your students need,
American Institutes for Research Evaluation of the Wraparound Zones Initiative: Report Two—39

but what do you think your students need?” Parent perspectives were key to this planning process, and relationships with them were important to the WAZ efforts. One interviewee shared that they “don’t use the message ‘If you build it they will come.’ In full-service learning, you can build it, but they might not come.... Once their relationship is established with school...then they can be involved at another level.” In other words, providing services for families was not enough to cultivate parent involvement; it was important to establish meaningful, trusting relationships with them first.
One interviewee noted when asked about the most helpful resource to support WAZ efforts: “The planner, being able to hire that person to do that has been the best resource. She is holding up the full-service WAZ ball. Couldn’t have done it without her.” Another noted a potential for enhancing the planning process at future schools; specifically, that “coordinators should be [involved] in the planning process” because of the “huge learning curve” that goes along with this position. Interviewees viewed the planning efforts in Holyoke—including at Peck and Morgan, which preceded WAZ—as integral to their progress: “A school needs to go through planning process.... The school needs some planning, inventorying, and setting a clear direction.”
Overall Finding 3: WAZ planning and implementation were supported by strong school principal and staff buy-in for the FSC school model among staff at the WAZ schools.
Interviewees consistently spoke of their strong commitment to and support of WAZ and the larger FSC school model. Several interviewees commented that although there was some variability, teachers at Morgan and Peck generally bought into WAZ thinking that “it’s a good thing,” and that teachers at Kelly were “committed to the planning process.” One interviewee noted that “75 percent of the teachers know and understand what it means that we’re a full service community school now and there are probably 25 percent who are still kind of like ‘well, how does that affect me?’ We have great buy-in. The teachers have overwhelmingly volunteered to be on working groups.”
Teacher buy-in took some time, however. One interviewee noted that building teacher buy-in can be “difficult” because “teachers have to decide what is critical to retain and what isn’t, [so] one needs to be intentional with faculty engagement.” As another interviewee noted, “some teachers prefer students to stay in classrooms, have never made referral, never stepped forward and actively been involved. Some teachers are involved with more than one workgroup, and host parents in class projects.” Barriers to teacher buy-in included the high level of pressure and expectations placed on them due to the district’s Level 4 accountability status—and “some teacher apathy.” This was a particular concern relative to family engagement: “Some teachers who have sets of beliefs about families that don’t align with [our school vision], ‘my job to teach.’ Not all believe it’s their job to engage families.” Another interviewee shared that the schools “have experienced every intervention there is.... However, if you can show results like improved test scores...you start to create the support and the buy-in.”
Principal buy-in for WAZ and the FSC school model was especially strong, though, and multiple interviewees commented about how principals at the three WAZ schools were significant assets generally and in particular relative to supporting WAZ- and FSC-related efforts. For example, interviewees noted the principals “are super involved,” “are bought in, committed, understand
American Institutes for Research Evaluation of the Wraparound Zones Initiative: Report Two—40

the value, and recognize it’s hard work.” One shared that the principal “wants the school to be better and is inviting to people coming in saying they can help,...is willing to look at anything in regards to full-service partners in WAZ or full-service model,...and engages with data to see what it shows.” A community partner described one school’s leadership as “outstanding.” When asked about a school’s strengths, another commented that “our tremendous strength is the principal, [who]...has a vision for the school that puts families and students at the center.” Another shared that the principal is attuned to the school’s climate and culture and focused on students’ needs and “not just the classroom.”
All three WAZ school principals had deep histories with their schools and the community. For example, the principal at Kelly attended the school as a child and had been working at the school since 2005 (except for one year when she was transferred to another school). The principal at Morgan had been an administrator at the school (formerly vice principal) since 2005. Principal support for the FSC school model and related WAZ efforts were considered key to moving the work forward: “One has to make sure school administrators believe in the philosophy. If there is a school that would benefit from the model, then the principal and assistant principal need to be in alignment.”
Overall Finding 4: Holyoke used WAZ to support a part-time district liaison rather than a full-time district coordinator, and established a Community of Practice among the WAZ schools as a vehicle for providing district support. In the absence of a formal system of district support, WAZ schools were relying heavily on one another for support.
Instead of hiring a full-time WAZ district coordinator, Holyoke identified a district-level staff person to serve as a WAZ liaison who would act as a bridge between the school-based WAZ staff and district staff. This decision was intentional, and reflected what interviewees described as a “bottom-up” culture in Holyoke in which “the driving force won’t come from district, it will come from schools.” Although Holyoke interviewees generally found the WAZ liaison helpful and supportive, some expressed a desire for more dedicated district support in the form of a full-time staff person whose responsibilities would solely focus on WAZ implementation. One interviewee noted that it “would take our work so much further” if they had a full-time district coordinator. Additionally, Holyoke put in place an FSC Community of Practice (COP), which involved monthly meetings among the three WAZ schools and an FSC consultant. WAZ school principals, FSC case managers, and the WAZ district liaison attended these meetings, and used them to share strategies and lessons learned with one another. Participants in these meetings found them extremely useful as a way to share information.
In the absence of dedicated district support for WAZ, the principal and FSC case manager at Peck took on an informal leadership role among the three WAZ schools. Leaders at Morgan and Kelly looked to Peck as a model for their work, and consulted closely with Peck’s leadership regarding how to replicate that model in their own buildings. The COP meetings were often used as a way for Peck to share lessons learned from its own experience and for Peck to act as a “mentor” to the other schools. Peck’s work in building community partnerships was especially held in high regard by the other WAZ schools. Peck had established a Central Coordinating Committee that coordinated the work of 40 partners within its school, and other schools were hoping to create similar entities in their own school. However, several interviewees also
American Institutes for Research Evaluation of the Wraparound Zones Initiative: Report Two—41

recognized and noted that this type of coordinating committee would be more useful at the district level than at each of the individual schools.
Despite the efforts of individual schools to fill in the gaps that would have been provided by a district WAZ coordinator and the success they experiences with these efforts, school staff still expressed the desire for more formal and additional support at the district level. For example, staff expressed the desire for the district to take a strong role in “setting a vision, goals, objectives” for the FSC model. Staff also described challenges in communicating to stakeholders about their success through data, and that more formal district support would give them better access to more data, as well as a vehicle for communicating these data more broadly.
WAZ Priority Improvement Area 1—Climate and Culture
The WAZ Climate and Culture Priority Improvement Area includes school-level practices intended to ensure safety, effectively manage student behavior, teach and model strong social–emotional skills, establish positive relationships with families and the community, and cultivate a climate of high expectations and positive regard between leadership, staff, and students—all supported by district-level systems. To address this improvement area, Holyoke’s 2011–12 WAZ plan laid out the following three strategies:
1. Provide school-wide teacher training and ongoing consultation.
2. Establish a middle school Caring Adult Team (CAT).
3. Establish a school-wide intensive behavioral support program for targeted students.
During Year 1, Holyoke made progress in all three of these strategies. Schools provided or were planning to deliver teacher trainings related to climate and culture (Strategy 1); established the CAT at Peck (Strategy 2); and put in place a schoolwide intensive behavioral support program for high-needs students (Strategy 3). This section describes two findings related to Priority Improvement Area 1: Climate and Culture, and the evidence that supports these findings.
Climate and Culture Finding 1: Student behavior, including its management, was a significant challenge in all three WAZ schools.
There were strong concerns related to student behavior and school behavior management systems at all three WAZ schools. For example, on the CFL survey, more than one third of students reported that their school “needs improvement” on the “Safe and Respectful Climate” scale, which measures student experiences of physical safety (e.g., whether there were fights, thefts, or vandalism) and emotional safety (e.g., whether students treated each other with respect or teased or bullied each other). In addition, on the staff survey, 66 percent of staff members disagreed or strongly disagreed that students in their school were respectful toward one another, and 51 percent disagreed or strongly disagreed that their schools were safe (see Table 11).
American Institutes for Research Evaluation of the Wraparound Zones Initiative: Report Two—42

Table 11. Students’ and Staff Members’ Perceptions of School Climate
Kelly Elementary
(n=334, 35)17
Morgan Full Service Community School (n=284, 51)
Peck Full Service Community School
(n=60, 430)
Holyoke WAZ overall (n=146, 1048)
Conditions for Learning SurveyStudents reporting their school “needs improvement” on the “Safe and Respectful Climate” scale 31% 31% 42% 35%Staff SurveyStaff members disagreeing or strongly disagreeing that students are respectful toward and support one another 54% 60% 77% 66%Staff members disagreeing or strongly disagreeing that their school is safe 31% 53% 62% 51%
Staff survey data also revealed challenges related to the behavior management systems at the three WAZ schools, in particular at Peck (see Table 12). For example, only a slight majority of respondents (56 percent) agreed that their school had defined a small number of clearly stated expectations for student behavior, and less than half reported that their schools had clearly defined consequences for not meeting expected student behaviors (37 percent). Less than half the respondents (45 percent) agreed or strongly agreed that the school-wide procedures for behavior management were adequate for their classrooms. About half the respondents agreed that all staff members in their school “teach expected student behaviors” (50 percent), “model expected student behaviors” (57 percent), or “positively reinforce expected student behaviors” (57 percent). For all of these indicators, the percentages were lower at Peck than at the other two schools.
Although the survey data suggest particularly strong behavior management challenges at Peck, interview data suggested that both Morgan and Peck were struggling with challenging student behaviors (concerns about student behavior at Kelly did not come up in interviews). For example, one interviewee commented that at both schools, “5 percent of the kids are creating 90 percent of the...serious problems that really there are no answers for. I mean these are kids with multiple challenges.” This interviewee also suggested that school staff members did not have the tools to support these high-need behaviors: “Their teachers are being asked to work with them without the resources and the supports to do it.” Peck was “having a very difficult time with 17 The first number in the parentheses represents the number of respondents for the CFL and the second represents the number of respondents for the staff survey.
American Institutes for Research Evaluation of the Wraparound Zones Initiative: Report Two—43

student behaviors.” The school had 100 more students than in the prior year, which in combination with the high needs of students, including poverty and “tremendous trauma,” was considered a contributing factor to these challenges. Furthermore, the building’s layout, including its size and students having to travel long distances in the school, was considered another challenge to managing student behavior.
Several interviewees reported that behavior management was a challenge at Morgan, and that behavior-related efforts at the school were receiving increased attention and were “at a delicate stage of emergence.” As one interviewee noted, “Before the initiative, no one was looking at the behavior.” Another commented that “classroom management is a challenge, and there isn’t consistency with what teachers know and what the behavior management staff is doing.” The school’s Level 4 status provided it with resources to fund school-based behavior interventionists to work with students with problematic behaviors. However, there was an unintended consequence of this additional support: “Teachers have become reliant [on the interventionists] to send kids out of classrooms” rather than addressing problem behaviors in their classrooms. An interviewee commented that more supports were needed to “make sure teachers have those resources and tools and skills to keep kids in class.”
Table 12. Staff Members’ Perceptions of School-wide Procedures for Behavior Management
Staff Members Who Agree or Strongly Agree
Kelly Elementary (n = 33–34)
Morgan Full Service
Community School (n = 48–49)
Peck Full Service Community School
(n = 53–54)
Holyoke WAZ overall
(N = 135–137)Their school has clearly defined behavior expectations. 67.6% 67.3% 38.9% 56.2%Their school has clearly defined consequences for not meeting expected student behaviors. 55.8% 34.7% 27.8% 37.2%Schoolwide procedures for behavior management are adequate for their classroom. 50.0% 52.1% 35.9% 45.2%All staff in their school teach expected student behaviors
67.6% 53.2% 37.1% 50.4%
American Institutes for Research Evaluation of the Wraparound Zones Initiative: Report Two—44

Staff Members Who Agree or Strongly Agree
Kelly Elementary (n = 33–34)
Morgan Full Service
Community School (n = 48–49)
Peck Full Service Community School
(n = 53–54)
Holyoke WAZ overall
(N = 135–137)All staff in their school model expected student behaviors
60.7% 62.5% 50.0% 57.0%
All staff members in their school positively reinforce expected student behaviors. 58.9% 58.3% 53.7% 56.6%
Morgan and Peck were carrying out various strategies to improve behavior management and reduce problematic student behaviors. For example, the schools had put in place intensive behavior support coordinators as part of a multiple-tier strategy to address needs of students with the most difficult behaviors. Peck had in place graduate social work interns to help provide these behavioral supports. Both schools also had behavior working groups in place to focus on these issues and use data to inform improved practice in supporting students: The “behavior management group has been meeting regularly, and they are looking at behavioral intervention data that we have at the school level on how many times students are sent out, which students are sent out the most. What are the responses that we’re giving with the students? Why do teachers send students out of class? And really kind of like get right down to the nuts and bolts of what can we do differently? What can our responses be that are different?”
Climate and Culture Finding 2: Efforts to enhance family engagement were a high priority, and related successes were evident in all three WAZ schools.
According to the staff survey, almost two thirds of staff members characterized the level of involvement that families had in decisions about students’ nonacademic services as “slight” or “not involved” (see Table 13). On average only 7 percent described family involvement in these decisions as “high” across the three schools, although this percentage was higher at Peck (15 percent), where FSC had been underway for several years.
Table 13. Staff Members’ Perceptions of Family Involvement in Decisions About Nonacademic Supports
Staff Members’ Characterization
of Family Involvement
Kelly Elementary
(n = 30)
Morgan Full Service Community School
(n = 43)
Peck Full Service Community School
(n = 48)
Holyoke WAZ overall
(N = 121)High 3.3% 2.3% 14.6% 7.4%Moderate 23.3% 30.2% 25.0% 26.4%Slight 46.7% 48.8% 41.7% 45.5%Not involved 26.7% 18.6% 18.8% 20.7%
American Institutes for Research Evaluation of the Wraparound Zones Initiative: Report Two—45

Reported barriers to family engagement included the “distressed neighborhood[s]” of students and their families, which required schools to engage in efforts to “build bridges with families.” One interviewee shared that “family engagement is a critical need.” Two of the WAZ schools—Kelly and Morgan—were neighborhood schools, which facilitated parent engagement. One interviewee pointed to this as a school strength: “Parents walk to school, it’s not hard to get parents into school. We try to be out there and connect with parents during drop off times to engage” with them. Peck, however, had been created after two schools closed and included students from across the district, which was a challenge to not only family engagement but also climate and culture more broadly. Part of its catchment area included the highest-need wards in the district.
Although Holyoke was a Level 4 district that was “focused, in large part with ESE [Department of Elementary and Secondary Education], on moving out of Level 4 status and increasing academic outcomes,” one interviewee noted that WAZ was an opportunity to invest resources in family engagement strategies and make this opportunity a more central focus of district improvement efforts. All three schools were prioritizing and undertaking efforts to support and expand family engagement in the schools more broadly and saw this as core to their WAZ efforts: “Family engagement is critical, and how schools engage families is essential.” Another interviewee noted that the school’s “priority is family engagement, above and beyond.” When asked about the most important goals of Holyoke’s WAZ efforts, a community partner responded, “Get parents involved.... Parents are value added, would like to see schools providing skills for the parents. Parents have expressed they don’t know how to help the children.”
As part of the FSC school model, family access and engagement coordinators were hired and charged with reaching out to families and facilitating their school involvement. These positions were considered instrumental to a school’s capacity to move family engagement strategies forward: “Professionalizing that work is critical. Prior, family engagement was supposed to be handled by teachers after school...or the work was done by part-time nonprofessional staff.” The family access and engagement coordinator position at Morgan, for example, was supporting the needs of families because the school staff recognized, “We can’t engage families if they have pressing needs.” The coordinator was making referrals and linking families to services and supports such as guidance and mental health services.
All three WAZ schools were making progress toward engaging families in other ways as well. For example, at one school some teachers volunteered at its “Friday night family fun night functions.” One interviewee pointed to Peck’s “good success at getting parents involved.” Another pointed to Morgan’s counseling initiative that brought families of third-grade students in to meetings with counselors and teachers to discuss how to improve student literacy. Kelly was also planning to train front-office staff around family engagement during summer 2012 because “if the second that the parent walks into the main office gets turned off by the people that work in the office, it just shoots down everything that you built up.... The first people that parents see and community partners see” when they come into schools are the office staff members.
As part of the FSC school workgroup structure, Morgan and Peck also had family assistance teams (called “Hub” at Morgan). Morgan’s was described as a “high-functioning team to talk about family–student needs. How to approach that, then make the referrals to intensive care
American Institutes for Research Evaluation of the Wraparound Zones Initiative: Report Two—46

coordinator, mental health services, after-school,” and so on. The team was in place at Morgan prior to WAZ, but it “wasn’t functioning well...[because] it wasn’t targeted, [was] more just venting” and lacked a team approach. The school was working to align the team with WAZ and to “make sure we have student plans that align with WAZ goals.” Parents were also represented on most of Peck’s FSC workgroups.
WAZ Priority Improvement Area 2—Identifying and Addressing Student Needs
The WAZ Identifying and Addressing Student Needs Priority Improvement Area includes school-level practices intended to assess the well-being of all students; effectively implement policies or programs to address the universal needs of students; establish structures and systems to create, monitor and adapt success plans for students requiring targeted assistance; and provide the necessary training and support to ensure that staff members can effectively identify and address student needs—all supported by district-level systems. To address this improvement area, Holyoke had two separate plans for the 2011–12 school year, one focused on Peck and the other on Morgan. Because Kelly was in a planning year, there was no plan specific to Kelly. Peck’s plan included the following four strategies:
1. Identify target families in the Peck attendance zone.
2. Arrange ongoing home visits to target families.
3. Establish relationships with local formal and informal early education and care providers.
4. Design, recruit for, and facilitate six-part series of monthly readiness workshops (trainings for families) during March to August 2012.
Morgan’s plan included the following five strategies:
1. Identify and address student needs.
2. Identify community partners to provide programs and services that aligned with identified student needs.
3. Establishing the FSC school manager position to facilitate responsive programming.
4. Create the family engagement and access coordinator position.
5. Create a FSC school governance system during Year 1 of WAZ.
Data collected during Year 1 revealed that Peck was working on each of its four strategies. This included identifying priority families within its attendance zone for school outreach and support (Peck Strategy 1), home visits to families in need (Peck Strategy 2), developing relationships with early education and care providers (Peck Strategy 3), and planning for a Peck readiness workshop series for families as part of its “Ready for Peck” efforts (Peck Strategy 4).
Morgan was also progressing on each of its five strategies. This included a needs and assets assessment, which was completed during summer 2011 prior to the beginning of WAZ funding (Morgan Strategy 1), communicating and coordinating with community partners (Morgan Strategy 2), hiring the FSC school manager to support an ongoing cycle of needs and assets identification and responsive programming (Morgan Strategy 3), hiring the family engagement and access coordinator to ensure family perspectives were part of school efforts to address
American Institutes for Research Evaluation of the Wraparound Zones Initiative: Report Two—47

student and family needs (Morgan 4), and putting in place a governance system with workgroups related to priority areas based on the assessment results (Morgan Strategy 5). This section describes one finding related to Priority Improvement Area 2: Identifying and Addressing Student Needs, and the evidence that supports this finding.
Identifying and Addressing Student Needs Finding 1: Although all three WAZ schools had processes in place to identify students in need of additional support, data suggested that there were challenges with respect to the timeliness, effectiveness, and adequacy of services students received.
Staff survey found that all three schools had very high percentages of staff members (80 percent or higher) reporting that they would follow a systematic process to refer students for nonacademic services. However, at all three schools, there were concerns about the timeliness of these services and communication about follow-up steps. Less than half of staff members reported that, if they identified a student with nonacademic needs, it would be “likely” or “very likely” that the students would receive services in a timely manner (44 percent) or that they would receive follow-up steps being taken to address the students’ needs (41 percent). Only slightly more than half (54 percent) reported that it would be likely or very likely that the services the student received would be effective (see Table 14).
Table 14. Staff Members’ Perceptions of Procedures for Identifying and Addressing Student Needs
Staff Members’ Reports
Kelly Elementary (n = 30–31)
Morgan Full Service
Community School (n = 42–44)
Peck Full Service Community
School (n = 47–49)
Holyoke WAZ overall (N = 120–124)
Reports of’ “Likely” or “Very Likely” Actions Upon Identifying a Student With Nonacademic NeedsThe staff member would follow a systematic process for referral. 90.4% 84.0% 81.6% 84.7%The student would receive services in a timely manner.
45.2% 34.1% 51.0% 43.6%
The staff member would receive follow-up about the steps being taken to address the student’s needs. 46.6% 40.9% 37.5% 41.0%The services that the student receives would effectively address his or her needs. 51.6%
51.2% 57.2% 53.7%
American Institutes for Research Evaluation of the Wraparound Zones Initiative: Report Two—48

Interview data further supported this finding. Each of the WAZ schools was following a systematic process for referring students for additional support. Peck used its Referral and Results Review Team as its centralized referral process, with referral forms that teachers completed and weekly meetings with school administrators, the FSC school manager, and graduate social work interns who were supporting this process. These team meetings led to a written plan for addressing the student’s need(s). One interviewee from another school described Peck’s approach as “a really great referral process.” However, the school wanted “to tighten this process” further by developing “a clear template for what a plan is and how to implement and look at outcomes.” One challenge was that “some people are great at responding; others are not.”
Morgan had a working group, called Hub, “like the hub of a wheel,” in place prior to WAZ. This team included the nurse, outreach worker, vice principal, special education team leader, and school counselors. Each participant at a meeting could bring a maximum of two student names to this working group to “figure out how to support child for whatever the needs are.” But the school still needed “a very streamlined referral process for students who need help; either basic needs or mental health or help with behavior,” and was planning to focus on this during Year 2 of WAZ. The school was planning to add community members to Hub and add representatives from the school’s mental health working group. It also wanted to “have better communication back to the teachers about who the students are that we have discussed and how we’re helping them or their families.”
WAZ Priority Improvement Area 3—Community Coalitions
The WAZ Community Coalition Priority Improvement Area includes school-level practices intended to utilize a system to take stock of and access internal and external resources and supports, establish and coordinate partnerships to address student needs that cannot be met with internal resources, monitor the effectiveness of those partnerships and make changes where necessary, and convene internal and external partners and stakeholders to share information, collectively problem-solve, and collaborate on improvement efforts—all supported by district-level systems. To address this improvement area, Holyoke’s 2011–12 WAZ plan laid out the following two strategies:
1. Expand Peck FSC School Full Partnership to become a district-level FSC School Full Partnership.
2. Prepare for a district-wide FSC school feasibility study/planning process.
According to Holyoke’s Year 1 WAZ plan, efforts related to expanding the Peck FSC School Partnership (Strategy 1) were scheduled to begin in May 2012 and the feasibility study (Strategy 2) was scheduled to begin in March 2012. Some evidence suggested that preliminary discussions about these activities were beginning or planned. However, in all three WAZ schools, school-level efforts were underway to expand or utilize existing partnerships with external partners. This section describes two findings related to Priority Improvement Area 3: Community Coalitions and the evidence supporting these findings.
American Institutes for Research Evaluation of the Wraparound Zones Initiative: Report Two—49

Community Coalitions Finding 1: Prior to Year 1 of WAZ, Peck had established a comprehensive model for community involvement and partnership to support its FSC school efforts and expand services for students and families.
Prior to FSC and WAZ, Holyoke had a reputation that “district personnel and teachers were not all that accommodating or constructive in supporting partnership work.” Several interviewees noted that this reputation changed with the school–community efforts that began at Peck. Through the school leadership’s efforts, Peck fostered a greater openness to district collaboration with outside agencies, which has helped to address prior perceptions that the district and its schools were not open to collaborating with community organizations.
To support its priorities, the principal, along with Peck’s FSC school manager, put in place a strong infrastructure to coordinate FSC school implementation. This included a Central Coordinating Committee (CCC) that the principal and the FSC school manager put in place and participated on, along with the family access and engagement coordinator who facilitated it. The CCC membership included representatives of school faculty, parents, and the FSC School Partnership workgroups focused on addressing particular school priority areas of need identified in the planning year (e.g., basic needs and Peck parents in action). The CCC was meeting monthly, monitoring FSC school implementation; making programming and operational recommendations. Community partners were participating actively on a number of the working groups that were connected with and coordinating through the CCC. This work was continuing during Year 1 of WAZ, at which point Peck had “40 community partner organizations involved in providing supports and services to kids through a comprehensive health clinic, 2.5 FTE therapists, family case managers, range of family engagement enrollments, and 7 working groups with a combination of faculty and staff working on critical development areas. There is lots of work happening and the infrastructure is there.” One interviewee noted that “the most impressive thing is the rich working groups in Peck school.” Another shared that “word is out in Holyoke that Peck is a full service community school, and there are increased services and supports.” A community partner shared that “a major reason why resources have been attracted to Peck, is that [the principal]...has created an atmosphere and a process, and put staff on the job of supporting the relationships with our institutions in ways that have not existed with the other schools or at a district-wide level prior to his arrival.”
Community Coalitions Finding 2: Stakeholders expressed a need to build from Peck’s success and create a district-level coalition to facilitate stronger partnerships with all schools.
At the time of the WAZ grant, Holyoke did not have a district-level community coalition in place to bring partners together. All three WAZ schools were at varying stages of leveraging and expanding partnerships with community organizations. As one interviewee noted, “They have a thriving coalition at Peck, emergent coalition in early phase at Morgan, and just partners at Kelly who aren’t a coalition yet.” Peck had an extensive array of partners and “good working groups as part of [its] coalition” that “produce outcomes” and were described as “intense.” Furthermore, one community partner described Peck as “serving as a de facto social service” because of the extensiveness of its supports to students and families.
American Institutes for Research Evaluation of the Wraparound Zones Initiative: Report Two—50
Several interviewees noted that a district-level coalition would be valuable. For example: “Various State agencies...are very involved with the schools and families; that discussion would be better to have at the district level.” Another noted that it would be valuable to move Peck’s quarterly partnership meetings to a city level to facilitate implementation of the FSC school model. The FSC school community of practice that Holyoke put in place in Year 1 for the three WAZ schools was helping to share information about the “long history of relationships” Peck had in place with community partners and its approach to structuring these supports (the community of practice is discussed further under Priority Improvement Area 4: District Systems of Support). However, there was interest in having a more formal coalition established.
Interest in a more formal coalition to support school-community partnerships was bolstered by the strong willingness of community organizations to support and partner with the WAZ schools. One interviewee noted that the school had “very highly committed community partners.” One community partner emphasized that community organizations were “very willing to give time and energy” and, when asked about local strengths, pointed to the “number of community agencies who are concerned and beginning to collaborate.” Another community partner shared that “the community is involved and wants to be in the work. I am privileged to be a part of this.” Another described the district’s proximity to multiple higher education institutions as an asset to efforts to address family and student: “Holyoke has long been a destination of community service for the institutions in the region.”
WAZ Priority Improvement Area 4—District Systems of Support
An important goal of the WAZ initiative is to expand and enhance district-wide systems to support practices related to improving climate and culture, identifying and addressing student needs, and sustaining a community coalition. To address this, Holyoke included the following three strategies in its 2011–12 WAZ plan:
1. Implement a district-level community of practice (COP) as a learning community for the three FSC schools.
2. Identify issues benefiting from district action or with district-level policy implications and bring these to the attention of district leaders and the district FSC School Full Partnership.
3. Align with other district initiatives such as Race to the Top (RTTT) and literacy.
Data collected from stakeholders during Year 1 revealed that Holyoke made progress in creating a COP for the three WAZ schools that met regularly during the year (Strategy 1). The district WAZ liaison participated in the COP meetings and served as a conduit for sharing WAZ-related issues with and building awareness about WAZ among district leaders (Strategy 2). The district was also making efforts to align the WAZ work with other district initiatives (Strategy 3). For example, the aforementioned counseling initiative at Morgan was an RTTT literacy initiative. The remainder of this section describes two key findings related to Priority Improvement Area 4: District Systems of Support, and the evidence that supports these findings.
District Systems of Support Finding 1: Holyoke established a FSC School COP that was providing valuable support in expanding the FSC school model from Peck to Morgan and Kelly.
American Institutes for Research Evaluation of the Wraparound Zones Initiative: Report Two—51
Holyoke established an FSC School COP as its primary mechanism for providing district-level support related to WAZ. The role of the COP was to facilitate sharing of FSC progress, lessons learned, and FSC-related information. Participants primarily included the WAZ school principals, FSC school managers, other staff members from Kelly (which had not yet hired a school manager), and district leaders, including the WAZ district liaison. Although one interviewee noted the group was a “work in progress” because its outcomes weren’t yet clear, interviewees largely considered this a highly valuable opportunity that emerged because “the schools wanted it.” The district’s FSC school consultant, who had been involved in FSC planning efforts at all three WAZ schools, facilitated the monthly one-hour meetings. These meetings were “a formal vehicle for sharing information,” including progress on school-related FSC efforts, information about the wraparound plan, and lessons learned. Participants discussed “the practical application for how to do things at each school and thinking about next steps at the district level.”
The COP was focusing on themes when it met, including pre-reading in preparation for the meetings. The group “develop[ed] an array of desired objectives for the school and district level” and used the objectives to select topics, identify relevant readings based on the experience of the three schools, and “come up with best practices for full-service learning practices in Holyoke.” One interviewee described it as “a very practical and useful opportunity to learn from each other.” Several interviewees commented about how the group has enabled sharing lessons learned, in particular from Peck given its multiple-year FSC effort. “The community of practice has done exactly what it’s supposed to do—support each school and to look at issues more deeply.” One interviewee noted that “principals at the three schools are learning from each other with a district representative.” When asked about resources that have been most helpful to supporting WAZ implementation, another pointed to the “community of practice meeting...that has been most helpful to me.”
When asked about district strengths, one interviewee noted its “structures for and support for communication and sharing across schools.” Another noted that relative to district support for WAZ, “most support is from community of practice, doing work together.” The WAZ grant was considered instrumental to moving this forward: “One of the greatest benefits of the grant has been to expand the conversation about full-service community school work. The grant and the benchmarks and the meetings have kept us on a path, especially to moving to the district level.” Through the COP and WAZ funding, the district was “looking at expansion. The most important goals are to get a citywide vision and expand knowledge of what a full-service community school is and some standard structures. Then, figuring out a way to prioritize the vision and create sustainability for the model.... We need managers funded by a [sustainable] plan. We need a unified definition and vision for full-service community and a rationale for why.”
Schools were also in regular contact with each other outside of these meetings, with the Peck principal being a “mentor” to the principals at the other two schools. Because Peck was entering its third year of FSC school implementation during Year 1 of WAZ, this provided an important history and foundation for WAZ-related efforts at the two other WAZ schools, including Kelly’s planning year. “The support that the project manager from Peck has given to my project manager...has been huge too. She’s been a great resource.” Another noted that “there is good information to be pulled from Peck.” One interviewee described the Peck principal as “highly involved in setting the direction of the community of practice” that, importantly, was a structure
American Institutes for Research Evaluation of the Wraparound Zones Initiative: Report Two—52
facilitating this collaboration and leveraging of Peck’s experience so that the new FSC schools could be “learning from two people that have been through and have pioneered a process already” and leading to, as another interviewee noted, “a shared commitment now.”
District Systems of Support Finding 2: The district did not use WAZ funds to hire a full-time district-level WAZ coordinator but instead used the grant to fund school-level staff positions dedicated to overseeing and coordinating implementation of its WAZ strategies.
Holyoke did not hire a full-time district coordinator as in other WAZ districts. One interviewee noted that “instead of hiring at the district and building bridges with multiple schools,” the district opted to fund school-level positions because “there was such a need in the schools” and the district “needed people there.” This school-based approach reflected the district’s culture: “Holyoke is bottom up—it happens at schools and then goes to district.” One interviewee noted the importance of this bottom-up approach to the success of the FSC school model: “The district needs to make it easy [for schools] to embrace this work and move this work forward. The driving force won’t come from district, it will come from schools.” Another echoed this perspective: The “shift in culture has to occur school by school.”
Morgan and Peck both had full-time FSC school managers funded by WAZ. Since it was in a planning year, Kelly did not have this funded position. However, Kelly was planning to begin recruiting for its school manager position in May 2012 and was aiming to have the position filled by July 2012 to “facilitate creating partnerships with community agencies.” WAZ funding was also used to create a family access and engagement coordinator position at Morgan and an intensive behavior support coordinator position. These positions were considered critical to moving the WAZ work forward, especially since schools have experienced “huge budget cuts.” Peck’s FSC school manager position, which was in place when the school began implementing the FSC school model, was kept in place of a teacher, given the school’s commitment to this work and “because it’s important to the instruction later on.”
Furthermore, the lack of formal district support for the WAZ work made the FSC school manager position especially important. The school manager role involved multiple responsibilities. As one interviewee noted, the FSC school manager’s role was “to continue the vision that we have for our full service community school...and coordinate or facilitate the working groups that we have.” Another noted that the school manager is “constantly in communication” with the principal and was helping to forge partnerships and monitor the school’s progress toward its FSC school benchmarks and outcomes, so that “they are either being met or we are on our way to meeting those goals.” As part of its FSC school plan to identify and address student needs, Morgan’s school manager was tasked with facilitating “structures and systems to support an ongoing cycle of needs and assets identification and responsive programming.” The FSC school managers were responsible for communicating with community partners as well as school staff around the FSC school vision and coordination of supports for students. Another interviewee described the school manager as being responsible for carrying out multiple FSC school projects and having “a big supervisory role” with
American Institutes for Research Evaluation of the Wraparound Zones Initiative: Report Two—53

responsibility for overseeing social work interns, CAT members, and the family access and community engagement coordinator.
These positions were considered instrumental to WAZ efforts during Year 1 in various ways. One interviewee commented that “every school needs dedicated staff for this [work]. Even if every principal said they want to be a FSC school, staff are critical to sustainability.” This may have been especially important in Holyoke, where there was a “small number of people working in the district” central office who were preoccupied “with Level 4 and all this other work.” Instead of a full-time coordinator position fully dedicated to WAZ, Holyoke identified a district-level staff person with other significant district management responsibilities to serve as a WAZ liaison. The district’s WAZ liaison was a resource to the schools, “always ready to help if necessary,” who participated in the FSC School COP meetings. As one school interviewee noted, the district liaison helped to share “information about full service community schools in other places and how they work” and has helped to provide “the whole picture perspective.” Peck staff members were also collaborating with the district liaison to facilitate her communication about WAZ and FSC, given their experience in implementing the FSC school model.
However, one interviewee noted that support from the district often felt lacking, and that although the liaison was “supporting the work,...resources to get a full-time person...would take our work further” because the liaison has “so much work.” Another noted that the “district hasn’t been asked to do a lot” and that the district needed to be the “central part” of WAZ. One also suggested it would be helpful for the district to provide data-related support to inform the WAZ efforts: “There is a potential for the school to be better about reporting to parents, district, teachers. To inform what we’re doing. I see a lot of barriers because data are confidential, aggregated. Would like to unpackage it. Support from district would be good. Data should be super transparent. Don’t know how to get it and be more demanding to getting it.” Another noted that it would be good to see the district show more “leadership—setting a vision, goals, objectives.”
Conclusion
During the 2011–12 school year, Holyoke and its three WAZ schools progressed in implementing strategies identified in its WAZ plan and expanding the FSC school model to a second school as well as beginning the planning process for a third. The district made progress in all four Priority Improvement Areas. This included efforts to improve school climate and culture (Priority Improvement Area 1), including a high priority on family engagement and putting in place intervention behavior specialists. Morgan and Peck had also put in place school-wide intensive behavioral supports for high-need students (Priority Improvement Area 2). Furthermore, the WAZ schools were building on Peck’s example by expanding partnerships with community agencies (Priority Improvement Area 3). Finally, as part of a district system of support for WAZ (Priority Improvement Area 4), Holyoke put in place a community of practice that was bringing together school leadership and district representatives to share lessons learned and move the FSC school efforts forward. Instead of hiring a district coordinator to oversee WAZ implementation, the district facilitated collaborations among the WAZ schools and designated a WAZ liaison at the district level to serve as a bridge between the schools and district leaders. School principals and FSC managers bore the brunt of the responsibility in ensuring that WAZ strategies were being implemented.
American Institutes for Research Evaluation of the Wraparound Zones Initiative: Report Two—54

Profile C: Lawrence
Introduction
The purpose of this profile is to provide a description of the conditions and supports that existed in Lawrence during Year 1 of the Wraparound Zones (WAZ) Initiative and to present key findings related to the district’s efforts for WAZ implementation. The data sources used to inform this profile are (a) stakeholder interviews conducted during the spring of 2012,18 (b) WAZ-related documents provided by the district and schools, (c) data from a staff survey administered by AIR,19 and (d) data from AIR’s Conditions for Learning (CFL) survey of students in Grades 2–12.20 Together, analysis of these data provides a comprehensive picture of the conditions in Lawrence during the first year of WAZ implementation.
Lawrence selected three schools to participate in the initiative (Arlington Elementary, Arlington Middle, and Humanities & Leadership Development High School). Arlington Elementary and Arlington Middle were selected to participate because they had already started to build the foundation for the wraparound work through a Promise Neighborhoods Planning Grant, and the schools were located in a “needy section of town,” according to district administrators and WAZ application documents. Humanities & Leadership Development High School (HLD) was selected because, as one district administrator put it, “Our superintendent truly believed that that was truly the best one [of the high schools] to place it in and have it flourish and then we can move it to the others.” In addition, according to WAZ application documents, staff members at HLD High School have seen an increase in the number of students with mental health needs that affected their ability to consistently be successful in the academic setting, and the staff members therefore believed a need existed for the school to support more of these needs. Table 15 presents demographic data for the three participating schools, as well as averages across the three schools, and Lawrence overall.
Table 15. Lawrence WAZ School and District Demographics, 2011–12
Arlington Elementar
y K-4
Arlington Middle
5-8
HLD High
School9-12
Cross-WAZ District School
AverageLawrence District
Accountability status Level 4 Level 3 Level 3 N/A Level 5Enrollment 516 457 506 N/A 12,900Percentage low-income 94.0% 93.7% 80.6% 89.3% 86.9%Percentage English language learners 48.8% 25.2% 9.9% 28.2% 24.2%
18 These included interviews with district leaders, including the district coordinator, WAZ school principals, intensive case managers at the WAZ schools, and community partners or representatives of community organizations.19 The staff survey was administered to all teaching and nonteaching staff in the school building except for the principal and staff person serving in the WAZ coordinator role. 20 The student survey was administered in February 2012, and the staff survey was administered in May 2012.
American Institutes for Research Evaluation of the Wraparound Zones Initiative: Report Two—55

Arlington Elementar
y K-4
Arlington Middle
5-8
HLD High
School9-12
Cross-WAZ District School
AverageLawrence District
Percentage with disabilities 14.1% 17.3% 20.6% 17.3% 20.6%Percentage scoring proficient or higher on the English language arts section of the Massachusetts Comprehensive Assessment System (MCAS) 22.5% 38.6% 68.6% 39.3% 41.1%Percentage scoring proficient or higher on mathematics section of MCAS 18.6% 14.7% 43.2% 20.4% 28.1%Percentage African American/black 1.2% 0.9% 1.8% 1.3% 1.7%Percentage Asian 0.0% 0.0% 2.4% 0.8% 2.0%Percentage Hispanic 96.1% 96.9% 92.5% 95.1% 90.2%Percentage white 2.5% 2.2% 3.4% 2.7% 5.9%Percentage other 0.0% 0.0% 0.0% 0.0% 0.2%
Source: Massachusetts Department of Elementary and Secondary Education.
In the remainder of this profile, we describe findings related to the conditions that existed in Lawrence during Year 1 of WAZ implementation. We first present overall findings that cut across WAZ Priority Improvement Areas or that reflect particularly strong themes that emerged in the Lawrence data. We then present findings within each of the four WAZ Priority Improvement Areas.
Overview and Summary of Key Findings
Overall, data from the evaluation revealed the following four key findings for Lawrence, which describe the conditions and supports that existed in the district upon beginning implementation of its WAZ grant:
1. The role of the intensive case manager (ICM) was critical to the implementation of the Lawrence Wraparound Zone strategies.
2. Lawrence entered into its WAZ grant with a strong infrastructure of community–district relationships (e.g., Agency Partnership Advisory Network (APAN)).
3. Stakeholders in Lawrence had concerns about school climate and culture.
4. Anxiety among staff relating to the level 5 designation interfered with staff willingness to support or implement the WAZ Initiative.
Two sections follow that further elaboration on these findings. In the first section, we present a brief summary of the evidence supporting each of the four findings listed above. In the second
American Institutes for Research Evaluation of the Wraparound Zones Initiative: Report Two—56

section, further analysis and data for each of the WAZ Priority Improvement Areas are presented.
Overall Finding 1. The role of the ICM was critical to the implementation of the Lawrence Wraparound Zone strategies.
Lawrence used its WAZ grant to fund ICMs at each WAZ school. During the first year of WAZ, the ICMs were working to connect students with services, particularly counseling services. In addition, two of the ICMs noted that they were trying to start “groups” so that they could counsel groups of students with similar needs or have a community partner lead these groups. One of the ICMs noted that this first year was really about building rapport with the students and having them feel comfortable. One principal noted that having the ICM has been “really helpful.” When discussing WAZ, almost all stakeholders interviewed talked about the ICM as integral to helping families and students. In fact, two of the principals, when asked about WAZ implementation, started by discussing the ICM and all the ICM had done for their schools. One principal also noted that the ICM played a key role in implementing Positive Behavioral Interventions and Supports (PBIS) and was a part of the PBIS team. A district administrator said, “I think the ICMs are crucial. Nonwraparound schools are jealous that they don’t really have that extra person to participate with families.”
Many respondents in Lawrence noted the importance of the ICM for the WAZ Initiative, and several noted that schools in Lawrence had had similar positions several years ago but that those positions had been cut or ended with the Safe Schools Grant that had funded it previously. Interviewees worried about this happening again. Furthermore, one district administrator noted, “We can’t have the ICM be the be all and end all of wraparound, there’s too many different parts to it.” This district administrator was hopeful that, as implementation progressed, schools would be able to get other staff members at the schools involved in leading some WAZ efforts.
Overall Finding 2. Lawrence entered into its WAZ grant with strong infrastructure of community-district relationships (e.g., APAN).
According to all district level respondents and several school level respondents, the APAN was a group that had been convened by the district for quite some time. Though there was not consensus among respondents as to how long the APAN had been in existence, all respondents indicated that it had existed at least since the 1990s, and one asserted that the APAN began meeting in 1985. The purpose of the APAN is to convene district personnel and community organizations and agencies to support students and families in the district. Having this group already established in the district that met regularly meant that ICMs had easy access to information about community organizations and that the organizations could easily learn about the work the district was doing as a part of the wraparound initiative. One interviewee described the APAN as a “huge resource.”
Overall Finding 3. Stakeholders in Lawrence had concerns about school climate and culture.
Overall, respondents expressed concerns about school safety, student behavior, and the general climate of the schools. For example, on both student and staff surveys, respondents in Lawrence
American Institutes for Research Evaluation of the Wraparound Zones Initiative: Report Two—57

generally reported concerns about school safety (for more detail, see Finding 1 under Climate and Culture). In addition, in interviews and on surveys, school staff reported concerns about student behavior and behavior management (for more detail, see all findings under Climate and Culture). However, district administrators were hopeful that with further implementation of PBIS, the schools would be able to address concerns about student behavior.
Overall Finding 4. Anxiety among staff relating to the level 5 designation interfered with staff willingness to support or implement the WAZ Initiative.
In November 2011, Lawrence was the first district in the state to be designated as Level 5, and a receiver was to be appointed to take over the leadership of the district for the state. The designation of the district as level 5 and the impending state takeover caused staff members at the schools and district to be concerned about the future of their jobs and the stability of the schools.
One district administrator noted that these concerns affected the climate at the school and worried that it could have an impact on implementation of the WAZ strategies. For example, two district administrators noted the critical role that the principal and stability of the staff played in the implementation of PBIS. One district administrator noted that having a stable staff was key to PBIS implementation and expressed concern that staff members would not have much motivation to learn new strategies if they were fearful for the future of their jobs. One district administrator said about the impact of accountability status, “It does impact culture, because there is an element of ‘are we going to be here next year?’ You compound that with the typical fears of a brand new feature, I wouldn’t say it’s at the level of toxic, but there’s uncertainty.” Another district administrator said, “Our key initiatives are changing because of our current status. But one of our big priorities is looking at our students’ needs as a whole child and not just in terms of the test scores and MCAS [Massachusetts Comprehensive Assessment System].” Overall, respondents reported concerns about uncertainty in the direction of the district and because of this were worried about the success of the WAZ.
WAZ Priority Improvement Area 1—Climate and Culture
The WAZ Climate and Culture Priority Improvement Area includes school-level practices intended to ensure safety, effectively manage student behavior, teach and model strong social–emotional skills, establish positive relationships with families and the community, and cultivate a climate of high expectations and positive regard between leadership, staff, and students—all supported by district-level systems. To address this improvement area, Lawrence’s 2011–12 WAZ plan laid out the following four strategies:
1. Survey staff, students, and parents around climate and culture of the school and analyze data to identify overall needs.
2. Introduce or re-introduce PBIS to each school staff and develop representative teams in each school to work with May Institute consultants to develop and implement school-based plans.
3. Establish a system to support all school-based teams through regular district-level and consultant support during the initial stages of implementation.
American Institutes for Research Evaluation of the Wraparound Zones Initiative: Report Two—58

4. Provide professional development to staff and parents on the behavioral issues that are affecting the school’s culture and climate.
Data collected from stakeholders during Year 1 revealed that, of the four strategies identified in the WAZ plan, Lawrence was focusing on introducing or reintroducing PBIS in each of its WAZ schools (Strategy 2). During interviews with key stakeholders, no one mentioned Strategy 1, survey staff, students, and parents about school climate, so there was not enough evidence to conclude whether this strategy was being implemented during the first year. District administrators noted plans to provide professional development on PBIS through the May Institute over the summer (2012) to the WAZ schools; however, no other respondents mentioned anything else related to progress on Strategies 3 and 4. This section describes three findings related to Priority Improvement Area 1: Climate and Culture, and the evidence that supports these findings.
Climate and Culture Finding 1. School safety and climate were a concern for many in the district.
Analysis of survey and interview data revealed that school safety and climate were areas of concern for the three WAZ schools in Lawrence. For example, 28 percent of students reported that their school “needs improvement” on the “Safe and Respectful Climate” scale, which measures how physically safe (e.g., whether there are fights, thefts, and vandalism) and emotionally safe (e.g., whether students treat each other with respect or tease-bully each other) students feel. These percentages were especially high at Arlington Elementary (46%) and Arlington Middle (33%). Staff survey data revealed similar perceptions, with only 54 percent reporting that their “school is safe,” and only 64 percent reporting that “students are respectful and supportive of one another” (see Table 16 for more detail).
Analysis of interview data also supported this finding, with interview respondents generally noting that the climate of the school was an area of concern. For example, one community partner noted that the neighborhood surrounding one of the schools was not safe and that many children had witnessed traumatic events. Another community partner noted that the school building was often chaotic. One of the ICMs noted that discipline was a major issue at the school and that students often roamed the hallways when they should be in class. Another ICM noted that there was still work to be done to improve overall student behavior.
Table 16. Students’ and Staff Members’ Perceptions of School Climate
Reported PerceptionsArlington
Elementary (n = 314, 44)21
Arlington Middle
(n = 423, 37)
HLD High School
(n = 355, 33)
Lawrence WAZ Overall
(N = 1092, 115)
Conditions for Learning SurveyStudents reporting that their school “needs improvement” on the “Safe
46% 33% 5% 28%
21 The first number in the parentheses represents the number of respondents for the CFL and the second represents the number of respondents for the staff survey.
American Institutes for Research Evaluation of the Wraparound Zones Initiative: Report Two—59
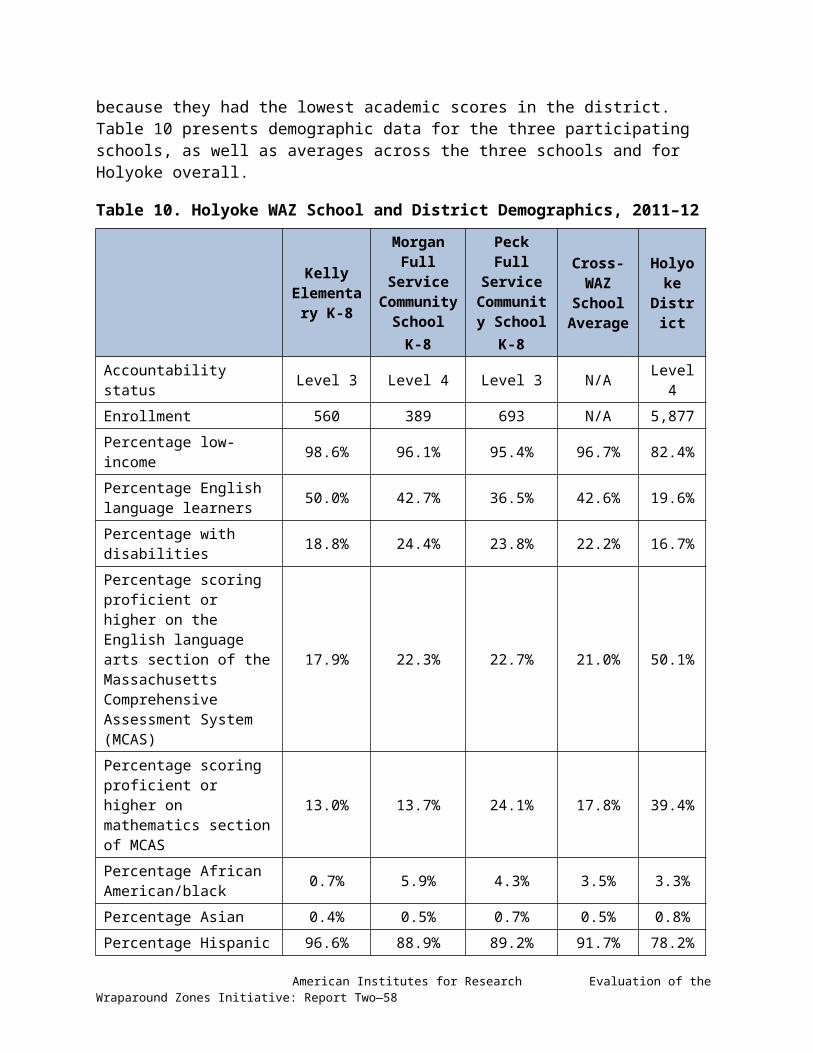
Reported PerceptionsArlington
Elementary (n = 314, 44)
Arlington Middle
(n = 423, 37)
HLD High School
(n = 355, 33)
Lawrence WAZ Overall
(N = 1092, 115)
and Respectful Climate” scaleStaff SurveyStaff members agreeing or strongly agreeing that their school is safe. 61.4% 27.8% 72.7% 53.9%Staff members agreeing or strongly agreeing that their students are respectful and supportive of one another. 74.4% 43.2% 72.7% 64.3%
Climate and Culture Finding 2. Two of the three WAZ schools in Lawrence were implementing PBIS, yet concerns remained in all three schools about the effective management of student behavior in these schools.
During Year 1, Arlington Elementary and Arlington Middle Schools were implementing PBIS, but Humanities & Leadership Development High School was not. Lawrence had had PBIS in the district for a number of years. Originally (prior to WAZ), principals were asked if they wanted their staff to be trained on PBIS, and then the school staff members had to vote on whether they wanted it. According to one district administrator, about 7 out of 20 schools chose to implement PBIS. Additional schools were added over the years. Arlington Middle School was one of the original PBIS schools in Lawrence. However, according to a district administrator, Arlington Middle tended to have problems with buy-in to the details of PBIS, and the implementation never got off the ground. Arlington Elementary School had not had PBIS previously because not enough of the staff voted to bring it to the school. However, due its Level 4 status, half of the staff members at the school were new, and they were willing to try anything to turn the school around, according to a district administrator. Although the high school did not have PBIS previously and was not implementing PBIS during Year 1 of WAZ, two district administrators noted that the school was one of those that was most open to programs such as PBIS.
Analysis of staff survey data revealed that, in the schools implementing PBIS, a majority of staff members (90 percent to 97 percent) reported that their school had clearly defined behavior expectations. However, at these same two schools (Arlington Elementary and Arlington Middle) only 61 percent and 58 percent of staff members, respectively, reported that their school had clearly defined consequences for not meeting expected student behaviors. In addition, at Arlington Middle, only 47 percent of staff members reported that all staff in their school taught expected behaviors, and only 64 percent reported that all staff in their school positively reinforced expected student behaviors, which is significant, considering that both of these practices are key aspects of PBIS. In addition, analysis of interview data supported this finding, with some respondents indicating that the schools still had work to do to effectively manage student behavior. For example, one interview respondent noted that while the school was trying to implement PBIS, not every teacher had bought in to it. This led to inconsistency in the
American Institutes for Research Evaluation of the Wraparound Zones Initiative: Report Two—60

communication of expectations to the students, and the school continued to have issues addressing student behavior. One district administrator noted that at the beginning of the school year, Arlington Middle had started implementing PBIS but that the school had “not really fleshed out a good plan, so we went back and started from square one.” This administrator was hopeful that additional training and the organization of a PBIS team would assist with stronger implementation in the future. Overall, however, interview respondents generally reported that in these two schools, PBIS implementation was “coming along.”
With respect to HLD, one district administrator reported that the school was “still struggling” or “a little bit behind” in terms of its implementation of all of the Wraparound Zones strategies (including PBIS implementation). Another district administrator noted that the staff at the high school was “open to suggestions” and that HLD was one of the schools that would be “most amenable to programs like this.” These district administrators reported that they were hopeful that the high school would be further along in terms of PBIS implementation the following year. Staff survey results for the high school suggested that staff members were concerned about the management of student behavior (see Table 17). For example, only 50 percent of staff members surveyed reported that their school had clearly defined behavior expectations, and 45 percent indicated that their school had clearly defined consequences for not meeting expected student behaviors. Interview respondents also expressed concerns about student behavior; for example, one interview respondent reported that “the school was working towards being more proactive and less reactive” by rewarding positive behavior and identifying students’ needs before these needs caused problems in the classroom, but that the school was not “there” yet.
Table 17. Staff Members’ Perceptions of School-wide Procedures for Behavior Management
Staff Members Who Agree or Strongly Agree
Arlington Elementary(n = 40–41)
Arlington Middle
(n = 35–36)
HLD High School
(n = 29–31)
Lawrence WAZ Overall(N = 107–110)
Their school has clearly defined behavior expectations. 90.3% 97.3% 50.0% 80.7%Their school has clearly defined consequences for not meeting expected student behaviors. 61.0% 58.4% 45.1% 56.4%All staff members in their school teach expected student behaviors. 77.5% 47.3% 63.4% 63.9%All staff members in their school positively reinforce expected student behaviors. 78.1% 63.9% 70.0% 71.6%
Climate and Culture Finding 3. Principal and staff buy-in were critical in supporting implementation of PBIS at the two WAZ schools where PBIS was implemented during the first year.
Analysis of interview data revealed that the principals and staff at Arlington Elementary School and Arlington Middle School generally saw the value of implementing PBIS and that this was critical in supporting implementation. For example, one interviewee noted that the PBIS team at
American Institutes for Research Evaluation of the Wraparound Zones Initiative: Report Two—61

Arlington Middle had surveyed staff members and asked what they liked about PBIS and why they thought it did not work when the school had tried using it previously. As mentioned previously, Arlington Middle School had been one of the original implementers of PBIS in the district but had struggled with teacher buy-in for implementation. This interviewee acknowledged that PBIS was “going fantastic,” and that discipline numbers were down, probably because the teachers were involved in making decisions about the implementation through the PBIS team at the school. In addition, one of the ICMs noted that having PBIS as a discussion point during staff meetings at the school had helped with the implementation of PBIS and in getting buy-in from more staff. However, another ICM noted that not every teacher had bought into PBIS and that sometimes led to challenges in communicating consistent messages about behavior expectations to students. This issue was something that the school was trying to work on by including the ICM more regularly in grade-level meetings with staff. The hope was that, by attending the grade-level meetings more regularly, the ICM would be able to provide suggestions and support PBIS implementation because the ICM had been trained on PBIS.
Overall, there was consensus among interview respondents that if the principal or staff did not see the value of implementing PBIS, then implementation would be ineffective. For example, one district administrator said, “If the principal shows they are not supportive, then it’s like ‘what’s the point.’” Another administrator shared a similar position with regard to staffing and PBIS, when he said, “Staffing really has an impact on PBIS. If you lose staff, you might have to start over with PBIS because of training and buy-in.” Another also acknowledged that if “they [teachers] are not willing to implement it [PBIS], it does not work.” In addition to this consensus, respondents generally indicated that the principals at these two schools were supportive of PBIS implementation and were hopeful that implementation would progress.
WAZ Priority Improvement Area 2—Identifying and Addressing Student Needs
The WAZ Identifying and Addressing Student Needs Priority Improvement Area includes school-level practices intended to assess the well-being of all students, effectively implement policies or programs to address the universal needs of students, establish structures and systems to create, monitor, and adapt success plans for students requiring targeted assistance, and provide the necessary training and support to ensure that staff members can effectively identify and address student needs—all supported by district-level systems. To address this improvement area, Lawrence’s 2011–12 WAZ plan laid out the following four strategies:
1. Establish school-based support teams led by the ICM to meet two to four times per month to address overall wellness issues of students at the school.
2. Conduct annual social–emotional or behavioral and health screenings for all students to identify students who may need additional supports.
3. Assess the interventions available at each school for addressing social–emotional or behavioral issues through the student support team process to bolster options as needed.
4. Implement a school-based case management system that is monitored and supported at the district level.
Data collected from stakeholders during Year 1 revealed that Lawrence conducted a needs assessment screening, using the Strengths and Difficulties Questionnaire (SDQ), at all three
American Institutes for Research Evaluation of the Wraparound Zones Initiative: Report Two—62

schools (Strategy 2). All three schools were also implementing a case management system (Strategy 4). The ICMs at each of the schools had been working with the support of the district coordinator to provide services, especially counseling to those students in need of these services (Strategy 3). However, no respondents described the ICM working with a “student support team” (Strategy 1). This section describes two findings related to Priority Improvement Area 2: Identifying and Addressing Student Needs, and the evidence that supports these findings.
Identifying and Addressing Student Needs Finding 1. Each of the schools used the SDQ as well as teacher referrals and student data, including grades and attendance, to identify students of varying levels of need.
Analysis of interview data revealed that each of the schools had used the SDQ as the primary way to identify students of varying levels of need. The SDQ is a brief behavioral screening questionnaire that asks about emotional symptoms, conduct problems, hyperactivity or inattention, peer relationship problems, and prosocial behavior. The questionnaire can be used to generate an overall difficulties score. Two of the ICMs noted that using this questionnaire allowed them to identify students that they did not realize were struggling. For example, one of the ICMs noted following up on “surprising results” from the questionnaire by double-checking with teachers about those results. This ICM noted that the questionnaire identified students as at-risk or struggling that by other indicators (e.g., grades, attendance) appeared to be doing fine. The ICMs at the middle and high school noted following up with the students after the questionnaire to try to better understand the results and students’ needs.
According to the ICMs and the principals, the questionnaire helped them identify students in addition to those who would typically be identified by teachers or administrators as struggling because of their behavior in the classroom, grades, or attendance. The SDQ also provided the ICMs and principals with more information about particular areas (e.g., peer relationships or emotional symptoms) where students were struggling that were not always easily identified through other methods, such as teacher referrals. In analyzing the results of the SDQ, ICMs and principals were able to assess and tier students by level of need. In addition, respondents also reported using teacher referrals, grades, and attendance to identify or confirm needs. The schools decided to prioritize addressing the most “needy” students or those students with the most severe problems or highest number of difficulties according to the SDQ.
Identifying and Addressing Student Needs Finding 2. ICMs at all three schools were able to connect students with needed services, but there were challenges finding adequate services for some students and in getting students to access the needed services.
Analysis of interview data revealed that all three schools had been able to provide counseling or mental health services through partnerships with a community provider, as well as connect students with other supports or services in the community (e.g., housing assistance, assistance paying electric bills, or after school activities). For example, one ICM said, “I think a lot of connecting the kids to services does stem from just knowing what’s here in the community. I try to meet with my identified students two to three times a week. I have weekly communication with parents, whether it’s a phone call or an email.... I keep track of every service that I’ve given to a kid and track to the end.” Another ICM said, “When we did the inventory, we met as a team and we only identified the high-risk kids.... So we went around in a circle to see the ones we had
American Institutes for Research Evaluation of the Wraparound Zones Initiative: Report Two—63

already connected with different services...and from that inventory we realized we should start an anger management group.”
Analysis of interview data also indicated that there were challenges connecting students to services. For example, several respondents reported that there was a need in the community for Spanish-speaking therapists. One of the community partners had experienced difficulty in finding enough Spanish-speaking therapists to meet the need in the community. All of the ICMs noted that finding Spanish-speaking therapists for their students was difficult, and when they did find a Spanish-speaking therapist, there was often a long wait-list for services. One community partner’s organization was trying to hire more Spanish-speaking therapists to meet the need. Another challenge in connecting students to services had to do with transportation. Several respondents reported that many parents lacked transportation and that finding transportation so students could use the services that ICMs recommended had proven difficult. Interviewees also reported that many families were reliant on public transportation, and not all mental health services or other community services were accessible by public transportation. One ICM noted that she had wanted to connect students with an afterschool program but that the students could not attend because they did not have transportation to get to the program.
WAZ Priority Improvement Area 3—Community Coalitions
The WAZ Community Coalition Priority Improvement Area includes school-level practices intended to utilize a system to take stock of and access internal and external resources and supports; establish and coordinate partnerships to address student needs that cannot be met with internal resources; monitor the effectiveness of those partnerships and make changes where necessary; and convene internal and external partners and stakeholders to share information, collectively problem-solve, and collaborate on improvement efforts—all supported by district-level systems. To address this Improvement Area, Lawrence’s 2011–12 WAZ plan laid out the following four strategies:
1. Expand the APAN to include additional organizations to increase partnership options.
2. Formalize partnerships with a memorandum of understanding (MOU) that details roles, functions, and responsibilities.
3. Create an electronic bulletin board where information on available community services can be posted and updated regularly for easy access by school personnel.
4. Create a consistent referral system for support services within the school system and through community agencies.
Data collected from stakeholders during Year 1 revealed that Lawrence was working on or at least beginning implementation of the first two strategies. There was no evidence that Lawrence had created an electronic bulletin board (Strategy 3) or begun creating a consistent referral system (Strategy 4). This section describes two findings related to Priority Improvement Area 3: Community Coalitions, and the evidence that supports these findings.
Community Coalitions Finding 1. The existence of the APAN prior to the implementation of Wraparound Zones facilitated communication and formalization of relationships among community providers and schools.
American Institutes for Research Evaluation of the Wraparound Zones Initiative: Report Two—64

Analysis of interview data revealed that Lawrence relied on the APAN to serve as the “community coalition.” All of the ICMs reported regularly attending the APAN meetings to learn about organizations interested in partnering with the schools. Having the APAN in place provided a way for the ICMs to find or connect students with services that they and their families needed. For example, one ICM said, “If we need anything, everyone is right there to reach out to.” In addition, all of the key community partners interviewed noted that the APAN meetings were helpful in building relationships with the schools, now that the ICMs were attending the meetings. For example, one agency partner representative said, “The schools do a good job of communication with all of the agencies in town with their bimonthly APAN meetings. We get together with all of the ICMs and other partner agencies. It helps us collaborate across the different agencies and learn about events, and they can learn about us.” District administrators also noted that, through the APAN, they had been able to announce opportunities for agencies to be involved with the schools. One district administrator said, “It was easy to get community agencies on board with wraparound because we were already working with these agencies through the APAN. APAN has been a huge resource because we had it established already.”
Community Coalitions Finding 2. During Year 1, the district formalized relationships (through a MOU) with three mental health agencies to provide therapy and other mental health services to students in a designated school, and the agencies and the district were working to address challenges with the referral process.
Analysis of interview data and documentation revealed that each WAZ school in the district had a formalized relationship through an MOU with a community partner organization to provide clinical services on-site at each of the schools. One district administrator said, “We wanted to keep it consistent, with one agency in each building providing mental health services.” One ICM noted that currently through this MOU, a therapist came to the school once a week and did individual therapy with specific students. This ICM was hopeful that “eventually this agency will be able to provide some groups.” One of the community partners noted that her agency had worked closely with one particular school for years, and another community partner noted that the agency was at “the beginning stages of getting clinicians into the school.” One principal noted that a therapist came to the school two days a week and that the school had tried to integrate this therapist into the weekly counseling meetings at the school.
During Year 1, the district worked with the designated mental health partners for each school to make the referral process for services outside of the school “more smooth.” For example, initially the ICMs encountered challenges in assisting families to complete the intake forms for the different mental health agencies. One ICM noted that in the beginning, she would complete the referral or intake packets with parents, but inevitably she would get a call that something was missing, and she would have to bring a parent in again. This ICM noted that having an intake process that required multiple meetings with a parent was onerous. According to respondents, with the assistance of the district coordinator, the mental health agencies and the ICMs worked out a solution to this problem. Two ICMs noted that they had worked with their community partner to assist families complete the intake process at the school and had assisted families in completing intake forms. For example, one ICM noted that a process had been developed in which the clinician met with the parents at the school in the ICM’s office to complete the intake forms together.
American Institutes for Research Evaluation of the Wraparound Zones Initiative: Report Two—65

WAZ Priority Improvement Area 4—District Systems of Support
An important goal of the WAZ Initiative is to expand and enhance districtwide systems to support practices related to improving climate and culture, identifying and addressing student needs, and sustaining a community coalition. To address this, Lawrence included the following four strategies in its 2011–12 WAZ plan:
1. Use a district leadership team to spearhead and monitor implementation efforts across the schools and make recommendations for adjustments and possible expansion.
2. Review existing support systems for redundancy and needed revisions to develop a comprehensive approach to service access and delivery that is systematic and coordinated.
3. Communicate changes in the support service access and delivery system to stakeholders and train school personnel on this comprehensive approach.
4. Review current wellness programs (counseling, health, and nutrition) for vertical alignment through the grade levels, fidelity of implementation, and utilization rates.
Data collected from stakeholders during Year 1 revealed that Lawrence was beginning implementation of the first two strategies in its plan. For example, the district coordinator monitored and provided support to the ICMs (Strategy 1). In addition, the APAN had allowed ICMs to build knowledge of service providers in the community (Strategy 2). However, there was little, if any, evidence that the third and fourth strategies had been implemented. For example, no interview respondents noted changes in the support service access and delivery system other than the schools having personnel to coordinate connecting students with needed services (Strategy 3). In addition, no interview respondents reported that wellness programs were being reviewed (Strategy 4). This section describes two findings related to Priority Improvement Area 4: District Systems of Support, and the evidence that supports these findings.
District Systems of Support Finding 1. The district coordinator was a valuable resource for the ICMs, who monitored implementation and provided assistance when necessary.
As part of its WAZ application, Lawrence described the responsibilities of the district’s Student Support Services Coordinator as ensuring that Lawrence’s WAZ model was consistently implemented across schools and providing ongoing support to the ICMs to ensure that the needs of students and families were being identified and addressed effectively in a timely manner. Analysis of interview data revealed that the district coordinator was the primary source of support at the district level for the ICMs. ICMs reported talking and emailing with the district coordinator at least weekly. ICMs also noted that they connected with the district coordinator through APAN meetings, system of care meetings, and counseling staff meetings. All of the ICMs reported feeling supported by the district coordinator. In interviews there was no mention of challenges related to district support. For example, one ICM noted that the district coordinator “is our biggest advocate.” Another ICM said of the district coordinator, “He’s always available when we have silly questions. We meet regularly. He’ll tell us when the district is bringing something down the pipeline.”
American Institutes for Research Evaluation of the Wraparound Zones Initiative: Report Two—66

District Systems of Support Finding 2. Strong commitment and buy-in from district and school leaders helped ICMs implement the WAZ strategies in their schools.
Analysis of interview data indicated that strong district commitment and principal support assisted ICMs in implementing WAZ strategies in their schools. For example, one ICM said, “The district was able to get the principal to buy in right way. I haven’t heard any of the case managers say the principal isn’t supporting them. I think it is well received because it is coming from the central office.” Another ICM noted that the “assistant superintendent is very supportive and runs the APAN meetings.” One district administrator noted that “the most important piece is that the schools have a clear understanding of what the case managers do and sticking to that rule,” acknowledging that the district played a key role in building support for the work in the schools. Another district administrator noted that a team from the district did walk-throughs in the schools to see if staff members could articulate the goals for wraparound and to monitor PBIS implementation. This district administrator also noted that from the district perspective, “You really need a concrete plan and to think about the steps that are going to take you to where you want to go.” One community partner noted that the district’s commitment to wraparound helped because community agencies had a specific liaison to work as a bridge between the school and community organizations. This community partner also noted that wraparound had increased communication and removed obstacles to “get these kids services a lot quicker.”
Conclusion
In Year 1 of the WAZ Initiative, Lawrence began implementation of many of the strategies identified in its plan. In terms of climate and culture, implementation of PBIS was progressing in the elementary and middle school but had yet to begin in the high school and concerns remained among students and staff about school safety and student behavior. In terms of identifying and addressing students’ needs, all three schools used the SDQ in Year 1 to better identify students’ needs. Lawrence’s plan for WAZ included a strategy to use the student support team (SST) structure that was already in place at the schools to better inform staff and the ICMs of available in-school interventions and assess their utility. During Year 1, there was no evidence of this strategy being implemented. During Year 1, Lawrence relied on the APAN as a means of fostering connections and developing collaborative relationships with community partners. The district was able to easily establish and formalize relationships with community organizations to provide clinicians to each of the schools. In Year 1, ICMs noted feeling supported by the district coordinator and also appreciated the support of the assistant superintendent in building buy-in from principals for WAZ. The district was working to monitor and provide assistance to ICMs for implementing all of the WAZ strategies in Year 1.
Profile D: Lynn
Introduction
The purpose of this profile is to provide a description of the conditions and supports that existed in Lynn during Year 1 of the WAZ initiative—a planning year for Lynn—and to present key findings related to the district’s planning efforts for WAZ implementation. The data sources used
American Institutes for Research Evaluation of the Wraparound Zones Initiative: Report Two—67

to inform this profile are (a) stakeholder interviews conducted during the spring of 2012,22 (b) WAZ–related documents provided by the district and schools,23 (c) data from a staff survey administered by AIR, and (d) data from AIR’s Conditions for Learning (CFL) survey of students in Grades 2–8.24 Together, analysis of these data provides a comprehensive picture of the conditions in Lynn prior to WAZ implementation.
Lynn selected four schools to participate in the initiative (Cobbet, Connery, and Harrington Elementary Schools and Marshall Middle School). These schools were selected because they were Level 4 schools (Connery and Harrington), or Level 3 schools that were close to Level 4 status (Cobbet and Marshall). In addition, Cobbet and Harrington are feeder schools for Marshall, and the district felt that including these schools in the initiative could provide a level of continuity in WAZ-related practices for students as they moved from elementary to middle school. When the planning period began, the Level 4 schools (Connery and Harrington) were entering their second year of the redesign process.
The district engaged school staff members in the WAZ planning through their involvement in two primary committees set up to develop WAZ implementation strategies: The executive committee and the planning committee. The executive committee met monthly and included the principals from the four WAZ schools, a representative from the English Language Learners Department, a representative from the Special Education Department, the Race to the Top Program Specialist, and the deputy superintendent. The planning committee met two to three times during the year and included the social workers and principals from each WAZ school as well as community representatives (from the United Way and Norfolk Community College). In describing the roles of each committee, one stakeholder reported that the executive committee gathered information and made decisions which were then shared with the planning committee for suggestions and feedback. Table 18 presents demographic data for the four participating schools, as well as averages across the four schools, and for Lynn overall.
Table 18. Lynn WAZ School and District Demographics, 2011–12
Cobbet Elementar
yK-5
Connery Elementar
yK-5
Harrington Elementary
PK-5
Marshall Middle
6-8
Cross-WAZ School
AverageLynn
DistrictAccountability status Level 3 Level 4 Level 4 Level 3 N/A Level 4Enrollment 682 606 639 947 N/A 13,731Percentage low-income 90.8% 93.7% 88.3% 94.4% 92.0% 85.6%Percentage English language learners 41.6% 43.6% 32.9% 19.1% 32.7% 15.7%
22 These included interviews with district leaders, WAZ school principals, WAZ school social workers, and representatives from community organizations that partnered with the schools.23 The staff survey was administered to all teaching and nonteaching staff in the school building except for the principal and staff person serving in the WAZ coordinator role. 24 The student survey was administered in February 2012, and the staff survey was administered in May 2012.
American Institutes for Research Evaluation of the Wraparound Zones Initiative: Report Two—68

Cobbet Elementar
yK-5
Connery Elementar
yK-5
Harrington Elementary
PK-5
Marshall Middle
6-8
Cross-WAZ School
AverageLynn
DistrictPercentage with disabilities 10.4% 5.4% 14.2% 18.3% 12.8% 20.9%Percentage scoring proficient or higher on the English language arts section of the Massachusetts Comprehensive Assessment System (MCAS) 22.1% 27.9% 35.1% 44.2% 36.9% 40.1%Percentage scoring proficient or higher on mathematics section of MCAS 29.9% 33.3% 34.4% 18.0% 24.3% 28.5%Percentage African American/black 13.9% 10.2% 11.0% 13.6% 12.4% 12.0%Percentage Asian 11.9% 11.7% 5.3% 7.8% 9.0% 10.0%Percentage Hispanic 64.8% 68.2% 67.4% 60.9% 64.8% 51.0%Percentage white 6.6% 7.4% 12.7% 14.0% 10.6% 23.1%Percentage other 0.7% 0.5% 0.3% 0.1% 0.4% 3.8%
Source: Massachusetts Department of Elementary and Secondary Education.
In the remainder of this profile, we describe findings related to the conditions that existed in Lynn during the WAZ planning year. We first present overall findings that cut across WAZ Priority Improvement Areas or that reflect particularly strong themes that emerged in the Lynn data. We then present findings within each of the four WAZ Priority Improvement Areas.
Overview and Summary of Key Findings
Lynn’s WAZ plan for Year 1 included six strategies aimed at preparing for WAZ implementation at the school and district levels. Unlike in the other WAZ districts, these strategies were not organized by the four priority areas; instead, they cut across multiple areas to lay the groundwork for implementing WAZ during Year 2. These strategies were
American Institutes for Research Evaluation of the Wraparound Zones Initiative: Report Two—69

1. Secure buy-in and engagement from all individuals to be included in the WAZ Planning Committee.
2. The WAZ Planning Committee will create working groups that will actively collect and analyze all data required to successfully plan and implement the WAZ.
3. Form a working group that will develop a job description and requirements for a WAZ Program Manager, report to the planning committee for action, and hire a program manager.
4. The committee will identify a provider of services that the district may require to provide training and support for the WAZ Project Manager (professional development and ongoing support) and establish a schedule for delivery of services.
5. The committee will form a working group to identify a behavioral curriculum to be implemented in all four schools.
6. The committee will develop a cohesive and comprehensive implementation plan.
At the time of the AIR interviews, Lynn had accomplished three of the six strategies outlined in the 2011–2012 WAZ plan: Developing stakeholder buy-in and engagement (Strategy 1), establishing workgroups and hiring a district coordinator to lead WAZ planning efforts (Strategy 3), and identifying a behavioral curriculum to be implemented in the schools (Strategy 5). The strategy involving data collection (Strategy 2) and the development of a concrete implementation plan (Strategy 6) remained a work in progress. There was no evidence that the district had made progress toward identifying a provider of services (Strategy 4).
Overall, data from the evaluation revealed the following four key findings for Lynn, which describe the conditions that existed in the district during its planning year.
1. During the planning year, progress toward developing a comprehensive implementation plan occurred at a slower pace than originally intended.
2. The Level 4 schools were further along than the non-Level 4 schools in their efforts to develop processes that addressed students’ nonacademic needs, particularly with regard to school climate and culture.
3. Although there was evidence of strong buy-in for the importance of addressing student social and emotional (i.e., nonacademic) needs among school leaders and school staff, some staff members expressed concern about how the addition of a new initiative would affect their existing school improvement efforts.
4. Lynn had begun to gather data to help plan for and implement WAZ; however, there was a need for a more systematic approach to data collection and evaluation across schools.
Two sections follow that further elaboration on these findings. In the first section, we present a brief summary of the evidence supporting each of the four findings listed above. In the second section, further analysis and data for each of the WAZ Priority Improvement Areas are presented.
Overall Finding 1: During the planning year, progress toward developing a comprehensive implementation plan occurred at a slower pace than originally intended.
American Institutes for Research Evaluation of the Wraparound Zones Initiative: Report Two—70

One of the strategies in Lynn’s WAZ plan was to develop a cohesive and comprehensive implementation plan. Data gathered during Year 1 suggested that Lynn needed a more focused approach to fully develop this plan. The district’s two committees, an executive and a planning committee, as well as several workgroups, led the planning efforts. One of the goals was to hire a district WAZ coordinator who could dedicate 100 percent of his or her time to WAZ by January 2012. However, the hiring of the district coordinator did not occur until the end of April, and interview data suggested that this delay had an impact on the ability to develop an implementation plan. According to one interviewee, “I think the biggest piece of it is them hiring the coordinator.... I think once they hire the district-wide wraparound coordinator, they’ll be refining what it [the WAZ initiative] looks like.” Another stated, “I think hiring a district person is a really big priority because that will bring more formality to it.”
Additional data suggested that the delay in hiring the coordinator affected the ability to develop an implementation plan. For example, stakeholders on the planning committee had numerous competing responsibilities and reported difficulties following their timelines. They reported that having a district coordinator in place would have helped to address this issue. City Connects was brought in to help with the planning process, and although this organization provided some direction, interviewees still reported a need for someone in the district to dedicate time to developing a comprehensive plan and serve as the bridge between the district and schools. At the time of the AIR interviews, many school staff members were still trying to determine and understand how WAZ would be implemented in their school, and there were questions about the role that social workers would play. Prior to WAZ, social workers were responsible for coordinating processes to identify student needs and match them with services. One interviewee stated, “Oftentimes we are asked to attend meetings, but there’s been little information as to what our role will be once there is a wraparound zone coordinator in place and what that will actually look like.”
Overall Finding 2: The Level 4 schools were further along than the non-Level 4 schools in their efforts to develop processes that addressed students’ nonacademic needs, particularly with regard to school climate and culture.
Staff members in all schools spoke of the importance of addressing students’ nonacademic needs and had begun implementing related strategies that targeted those needs prior to and during the WAZ planning year. Interview data revealed that there was a high level of autonomy among the schools, and as a result, the manner in which they addressed these nonacademic needs varied by school. During the planning year, the Level 4 schools (Connery and Harrington) were in the second year of the implementation of their Level 4 redesign plan, and students’ social–emotional well-being was one of the primary components of their plans. With this explicit focus on nonacademic needs, these schools had a head start on the planning and implementation of key strategies, such as behavior management strategies. These schools also had additional resources (e.g., funding) that Level 3 schools (Cobbet and Marshall) did not have. Interview and staff survey data revealed some differences, particularly in the areas of school climate and culture. For example, more staff members at the Level 4 schools reported positive perceptions of their school’s behavior management procedures than at the Level 3 schools. In addition, school safety and student–student relationships were of greater concern among students and staff members at Cobbet Elementary compared to the other elementary schools (see the section on Climate and Culture for more details).
American Institutes for Research Evaluation of the Wraparound Zones Initiative: Report Two—71

Overall Finding 3: Although there was evidence of strong buy-in for the importance of addressing student social and emotional (i.e., nonacademic) needs among school leaders and school staff, some staff members expressed concern about how the addition of a new initiative would affect their existing school improvement efforts.
Principals at all of the WAZ schools emphasized the importance of focusing on student social and emotional well-being. In the two Level 4 schools (Connery and Harrington), student well-being had been included as one of the three primary components of the school redesign plans. Furthermore, the commitment of school leadership was consistently reported as a strength by many stakeholders. As one social worker stated, “We have a tight leadership team that believes heavily in the fact that if a student isn’t socially emotionally okay then they can’t learn. And the leadership team believes that. That trickles through the whole school. It’s important. I think we really have a good thing going here as far as that piece.” A community partner described the commitment of school staff by stating, “What we are seeing is school personnel going above and beyond the call of duty and working with other agencies. We go into the school as a guest agency and the relationships are collaborative.”
This existing focus on students’ nonacademic needs likely helped to generate buy-in among school and community stakeholders for the WAZ initiative and promoted engagement in the WAZ planning process.
However, data also revealed some uncertainty about what WAZ implementation would mean in terms of staff time and how it would fit into the work that schools were already doing. For example, one interviewee commented, “Everybody’s concern is what does this [WAZ] mean? Is this just another layer to what our teachers are going to have to do?” Another stated, “I think the idea of doing something globally is anxiety provoking.... And the idea of putting something new in place—we are really going to have to sell it as something that is going to decrease their load rather than another thing that teachers are going to have to keep track of or another thing the teachers have to do.” Another interviewee spoke of the potential challenges of adding a new initiative to the existing efforts: “There’s a lot that we are responsible for, a lot that we have to do and to add the wraparound zone to it, although it fits very nicely with what we’re already doing. You only have so much time and can only do so many initiatives and so we are doing it but we are at the very beginning stages of it.” These data suggest that there was need for better communication between the district and schools throughout the planning process about how WAZ implementation aligned with broader school and district priorities.
Overall Finding 4: Lynn had begun to gather data to help plan for and implement WAZ; however, there was a need for a more systematic approach to data collection and evaluation across schools.
A key component of Lynn’s Year 1 plan was to gather data to help guide decision making. Specifically, the district planned to (a) collect school-level data on students’ family, academic, health and social, emotional, and behavioral supports; (b) conduct a needs assessment of district strengths, weaknesses and gaps; and (c) conduct an assessment of community resources, frequency of use, and gaps in services. The district formed subcommittees to examine issues
American Institutes for Research Evaluation of the Wraparound Zones Initiative: Report Two—72

such as climate and culture and community partnerships. The data collection process included gathering data from the WAZ schools about strategies they are currently using, community resource mapping, and the administration of AIR school climate surveys and City Connect surveys. Schools had also engaged in their own data collection outside of what was done as part of the WAZ planning process. For example, the Level 4 schools (Connery and Harrington) had conducted parent, teacher, and student surveys, and at Connery, staff members were gathering data about students who received services at the community health center.
Several stakeholders reported the need for a more systematic approach to collecting and evaluating data. For example, when asked about areas of need, one stakeholder stated that Lynn needed “ways of systematically collecting data to let us know what initiatives are working, what partners are working, etc. Systems for reporting across the district and across the wraparound schools.” Another said, “How are we going to keep track of all these kids and track what’s the quality of those services?... If we don’t have a database, then we are going to be in the same confused state.” Another commented on how the lack of data had affected parents and staff: “There’s a lot of excitement on some of those projects, an optimism that we will increase parent involvement, but part of it has to be and is really organizing and keeping track of data and communicating out the results. Because some of what I see is parents and teachers feeling like there is no progress being made in some of those areas where we really do have progress but we don’t keep enough data that we can communicate it back.” The lack of a systematic approach to data collection affected the planning process because some of the data needed to make decisions and secure broad-based buy-in from parents and teachers were not readily available.
WAZ Priority Improvement Area 1—Climate and Culture
The WAZ Climate and Culture Priority Improvement Area includes school-level practices intended to ensure safety, effectively manage student behavior, teach and model strong social–emotional skills, establish positive relationships with families and the community, and cultivate a climate of high expectations and positive regard between leadership, staff, and students—all supported by district-level systems. This section describes three findings related to Priority Improvement Area 1: Climate and Culture, and the evidence that supports these findings.
Climate and Culture Finding 1: WAZ schools in Lynn were already implementing strategies that targeted climate and culture prior to the beginning of the WAZ planning grant. The district’s goal was to build on existing strategies and create more consistency in how behavior was managed across schools.
In each of the Lynn WAZ schools, climate and culture had already been identified as an important issue to address prior to involvement in the initiative. As a result, schools were already implementing strategies, such as behavior management programs and teacher professional development, to address this issue. For example, both Cobbet and Marshall were implementing the CHAMPS classroom behavior management program. CHAMPS is a program that provides teachers with training and tools on topics such as time management, organizational skills, strategies to increase on-task time, increasing motivation, and creating a positive classroom environment. It offers teachers a framework for setting classroom expectations related to the letters in the CHAMPS acronym: Conversation (how, why and to whom may students talk?); Help (how do students get help or teacher attention?); Activity (what is the task or end product of
American Institutes for Research Evaluation of the Wraparound Zones Initiative: Report Two—73

the activity?); Movement (when and why may students move around?); Participation (what does the on task behavior look like?) and Signal (how do you signal your students?). Cobbet and Connery were implementing the Second Step social skills program, a curriculum for teaching students social-emotional skills such as empathy, emotion management, and problem solving
Some schools were also providing professional development for teachers to help increase their capacity to address behavior issues in the classroom. For example, at Cobbet, staff members had engaged in a faculty-driven book study of “Discipline with Dignity,” a book which suggests appropriate consequences to give students when they do not adhere to expected behaviors. At Harrington, teachers received training on creating a trauma-sensitive classroom. The Level 4 schools reported some success related to school climate in recent years. For example, at one school a respondent reported, “We had a lot of behavioral challenges...but they have really been eliminated.” At another school, a respondent stated, “We have done a very good job of creating a culture of respect and creating a culture that speaks to how we address the social–emotional piece matters.”
As stated in its plan, Lynn established a workgroup to identify a behavioral curriculum to be implemented in the WAZ schools. The group identified two behavioral programs, Second Step and CHAMPS, which were already being implemented in some of the WAZ schools, and required that WAZ schools implement one of them. The Second Step program had been introduced to the elementary schools several years prior and was reportedly found to be successful in schools where the principals bought into it and implemented it with fidelity. One stakeholder reported that the district planned to “reenergize” the program by implementing it in the WAZ schools and eventually expanding implementation to include non-WAZ schools. CHAMPS was selected to help create consistency around classroom management practices. One respondent described the program by stating, “It has really supported classroom management. It’s been great for young teachers to have a framework to work on and gives common languages for different specialists to use. So CHAMPS has been a real asset and strength to the school.”
Climate and Culture Finding 2: Staff and student school climate survey data suggested that all schools had room for improvement in the areas of safety and student–student relationships within school buildings. However, these issues were of greater concern at Cobbett Elementary School.
Across schools, about two thirds of staff members reported feeling that their schools were safe (69 percent) or that students supported and respected one another (67 percent). However, when survey results were examined by school, the data showed that these issues were more likely to be perceived as challenges at Cobbet Elementary, where less than half of staff members felt their school was safe (45 percent) or that student–student relationships were positive (35 percent). By contrast, these perceptions of school climate were positive among staff members at the Level 4 elementary schools, where 86 percent (Connery) and 78 percent (Harrington) felt their schools were safe, and 86 percent (Connery) and 71 percent (Harrington) indicated that students had positive relationships with their peers (Table 19).
American Institutes for Research Evaluation of the Wraparound Zones Initiative: Report Two—74

Table 19. Staff Members’ Perceptions of School Climate
Staff Members Who Agree or Strongly Agree
Cobbet Elementary (n = 29)
Connery Elementary
(n = 36)
Harrington
Elementary (n = 58)
Marshall Middle (n = 53)
Lynn WAZ
overall (N = 176)
Their school is safe. 44.8% 86.1% 77.6% 60.4% 68.8%Students are respectful and supportive of one another. 34.5% 86.1% 70.7% 66.0% 66.5%
These differences between schools were relatively consistent with findings from the Conditions for Learning student survey, in which students at Cobbet reported less positive perceptions of climate and culture compared to the other WAZ schools (Table 20). Specifically, Cobbet had the highest percentage of students reporting that their school “needs improvement” on the Safe and Respectful Climate scale, which included items related to the physical and emotional safety of students (38 percent compared to 22 percent or below at the other WAZ elementary schools). Cobbet also had the highest percentage of students reporting that their school “needs improvement” on the Student Support scale, which includes items related to the quality of relationships between adults and students in the schools (23 percent compared to 12 percent or less at the other WAZ schools).
Table 20. Students’ Perceptions of School Climate
Students’ Reporting That Their School “Needs Improvement”
Cobbet Elementary
(n = 415)
Harrington (n = 314)
Marshall Middle (n = 775)
Connery (n = 309)
Lynn WAZ overall
(N = 1504)”Safe and Respectful Climate” 38% 20% 22% 22% 26%
”Student Support” 23% 12% 9% 10% 14%
The challenges at Cobbett Elementary could be due to a number of factors, including the fact that some of the initiatives designed to address school climate and culture at Cobbet were fairly new to the school. For example, Cobbet began implementation of the CHAMPS behavior management program with teacher training that occurred during the summer prior to the planning year, and the school social worker position had only been in place for three years. In addition, the other elementary schools were Level 4 schools and had been given additional resources and training that the other schools did not have. As one stakeholder noted, “I think the Level 4 schools have an advantage in a way because they’ve been required to do some of this work, and systemically they have some systems in place that they’ve been sort of made to have.” Finally, Level 4 schools had a certain level of autonomy that the other schools did not have. For example, due to the Level 4 status, the principal at Harrington was given more control over selecting her staff. She was able to hire staff who were committed to the goals of WAZ. Additionally, Harrington did not have to participate in Lynn’s “bidding and bumping” process, whereby teachers from any school can bid for an open job in any other school and “bump” a teacher with less seniority. Prior to Harrington’s Level 4 status, teachers were often “bumped” out of the school due to this process because of their relatively low level of seniority, and the principal had no control over this.
American Institutes for Research Evaluation of the Wraparound Zones Initiative: Report Two—75

When the school was designated as Level 4, the principal was allowed to make all the staffing decisions and none of the teachers could be removed through bidding and bumping. As a result, staff mobility had stabilized, which likely contributed to an improved school culture and climate.
Climate and Culture Finding 3: Staff members at the Level 4 schools had more positive perceptions of school-wide behavior management procedures than did staff members at the Level 3 schools.
The Level 4 schools made improving climate and culture a key component of their school redesign plans and were further along in implementing related initiatives than the Level 3 schools. Staff survey data reflected this finding, with more staff members at the Level 4 schools reporting positive perceptions of their school’s behavior management procedures than at the Level 3 schools. This was the case for every indicator of positive behavior management procedures that was included on the survey (see Table 21). For example, over 86 percent of staff members at Connery and Harrington reported that their school had clearly defined consequences for not meeting expected student behavior, compared to less than 50 percent at Marshall and Cobbet. In addition, 90 percent or more of staff members at Connery and Harrington reported that schoolwide procedures for behavior management were adequate for their classrooms, compared to 48 percent at Cobbet and 62 percent at Marshall.
Table 21. Staff Members’ Perceptions of Procedures for Schoolwide Behavior Management
Staff Members Who Agree or Strongly Agree
Cobbet Elementary
(n = 29)
Connery Elementary (n = 35–36)
Harrington Elementary (n = 58–59)
Marshall Middle
(n = 52–53)
Lynn WAZ overall
(N = 175–177)
Their school has clearly defined behavior expectations. 72.4% 97.2% 100.0% 82.6% 89.7%Their school has clearly defined consequences for not meeting expected student behaviors. 31.0% 86.2% 98.3% 49.0% 69.9%Schoolwide procedures for behavior management are adequate for their classroom. 48.3% 94.4% 89.6% 60.4% 75.0%All staff members in their school teach expected student behaviors. 72.4% 91.7% 96.6% 62.2% 81.3%All staff members in their school model expected student behaviors. 62.0% 91.7% 96.6% 68.0% 81.4%
American Institutes for Research Evaluation of the Wraparound Zones Initiative: Report Two—76

Staff Members Who Agree or Strongly Agree
Cobbet Elementary
(n = 29)
Connery Elementary (n = 35–36)
Harrington Elementary (n = 58–59)
Marshall Middle
(n = 52–53)
Lynn WAZ overall
(N = 175–177)
All staff members in their school positively reinforce expected student behaviors. 72.4% 91.6% 98.4% 77.3% 86.4%Their school has formal strategies for informing families about expected student behavior. 68.9% 80.5% 93.1% 79.3% 82.4%Schoolwide expected behaviors apply to nonclassroom settings. 82.7% 86.1% 98.3% 94.2% 92.0%Behavior is effectively managed in nonclassroom settings. 34.5% 74.3% 67.8% 52.8% 59.1%
At one of the Level 3 schools, a respondent described the challenges in behavior management by stating, “Having teachers that are not frustrated with kids’ behavior and having us all on the same page with consequences that are out there for kids that are not behaving appropriately is an issue because there’s range of teacher skills on how to redirect and how to relate to kids and how to keep kids in class. There’s a real range that we continue to work on.”
WAZ Priority Improvement Area 2—Identifying and Addressing Student Needs
The WAZ Identifying and Addressing Student Needs Priority Improvement Area includes school-level practices intended to assess the well-being of all students; effectively implement policies or programs to address the universal needs of students; establish structures and systems to create, monitor and adapt success plans for students requiring targeted assistance; and provide the necessary training and support to ensure that staff can effectively identify and address student needs—all supported by district-level systems. This section describes two findings related to Priority Improvement Area 2: Identifying and Addressing Student Needs, and the evidence that supports these findings.
Identifying and Addressing Student Needs Finding 1: During Lynn’s planning year, schools had informal procedures in place for identifying student needs. There was a need to implement a more systematic and consistent process for assessing student needs.
During its planning year, Lynn was working on developing a model for identifying student needs and delivering services. As part of the planning process, the district worked with City Connects to learn more about the organization’s approach and determine whether it would be a good fit for the district. In the meantime, schools were relying heavily on social workers to implement procedures for identifying and addressing students’ nonacademic needs. At each WAZ school, the social worker was responsible for receiving referrals about students experiencing social–emotional difficulties, and teachers served as the primary referral source.
American Institutes for Research Evaluation of the Wraparound Zones Initiative: Report Two—77

Schools had also developed informal processes for staff members to use to identify students who were experiencing nonacademic challenges. For example, during the WAZ planning year, Harrington implemented a classroom morning meeting time, with the purpose of giving teachers a dedicated time to observe students and get a feel for which students they might need to watch out for or may need to help that day. In addition, the school had instituted a specialized hall pass (the hornet’s pass) that teachers could use if they noticed that a student was struggling or needed a break from the classroom. If a student was sent to the main office or to see the social worker or nurse with the hornet’s pass, staff members would know that the student needed help. Staff members at Cobbet also described an informal referral process. Because there was no formalized screening tool to assess student needs, teachers reached out to the social worker and made referrals based on their experiences with students in the classroom. Interviewees at Cobbet reported that students sometimes self-referred to the social worker when they were experiencing difficulties. In addition, Marshall and Connery had implemented a tiered approach to service delivery;25 however, this process was not systematic, and staff members reported that they were waiting for the district to provide an assessment tool to help place students into tiers.
Findings from the staff survey also suggested that schools could benefit from a more structured approach for identifying and addressing student needs. Specifically, in an open-ended question on the survey, staff members were asked to report topics for which they would like to receive additional professional development or technical assistance related to students’ nonacademic needs. Developing a system for connecting students to services to meet nonacademic needs was the most commonly reported topic for which staff members wanted to receive additional support.
Some interviewees reported plans to use WAZ to expand their systems for assessing students’ needs to all students. For example, one staff member stated, “I’m really excited that each student in the whole school gets assessed for what they need. Not just the kids that are in crisis. I’m excited for our whole school body to get support, instead of just the kids who are identified with red flags.” Another stated, “I think when we expand into the wraparound zones model, obviously it will be more effective because we will be looking at all of the kids.”
Identifying and Addressing Student Needs Finding 2: School social workers had a wide range of responsibilities within the schools related to the identification and addressing of student needs, and there was some concern about how their roles and responsibilities would change once WAZ implementation began.
A key component of identifying and addressing student needs in Lynn was the relationship and collaboration between the social workers and teachers. Social workers served as a resource for teachers. For example, one social worker reported that teachers sought out her assistance with behavior planning. Another reported conducting consultations with teachers and staff about working with students who were having social–emotional difficulties. Another staff member indicated that the social worker was responsible for “communicating between the mental health therapist and teachers so that nobody falls through the cracks.”
25 The tiered approach provides interventions at the universal (Tier 1, all students), targeted (Tier 2, students identified as being at risk for behavioral issues) or intensive (Tier 3, students who display more severe behavioral or mental health care needs or are determined to be at higher levels of risk) level.
American Institutes for Research Evaluation of the Wraparound Zones Initiative: Report Two—78

Social workers reported a number of different responsibilities, including providing direct services to students, crisis management, bullying prevention, facilitating parent activities (e.g., PTO and parent groups), working with families to navigate crises occurring within the community (e.g., homelessness and house fires), making sure students’ basic needs are met (e.g., managing donations of winter wear to make sure students were dressed appropriately for cold weather), and facilitating the school’s behavior management program. They also coordinated the relationship between the school and community partners that worked in and out of the schools.
With so many different roles, most school staff members had some concern about how WAZ would impact the social worker’s role, and whether social workers would be able to effectively carry out their current responsibilities with the addition of WAZ. For example, one staff school administrator asked “how many hours a week would she [the social worker] be dedicating to wraparound and therefore who would be able to pick up her duties that she already does for the school?” At the time of the interviews, most school staff members reported little to no discussion about whether social workers’ roles would change during the next year. Reports about the nature of this role ranged from the belief that social workers would also serve as the school wraparound coordinators to a general uncertainty about whether any changes would occur. Staff members also described potential issues with the union, which has strict policies about school staff members’ roles and responsibilities. As one staff member reported, “We need to think about, with our unions, what that means for the social workers involved because it’s all unions in Lynn.”
WAZ Priority Improvement Area 3—Community Coalitions
The WAZ Community Coalition Priority Improvement Area includes school-level practices intended to utilize a system to take stock of and access internal and external resources and supports, establish and coordinate partnerships to address student needs that cannot be met with internal resources, monitor the effectiveness of those partnerships and make changes where necessary, and convene internal and external partners and stakeholders to share information, collectively problem-solve, and collaborate on improvement efforts—all supported by district-level systems. This section describes two findings related to Priority Improvement Area 3: Community Coalitions, and the evidence that supports these findings.
Community Coalitions Finding 1: Through existing community partnerships, WAZ schools were increasing their capacity to address student needs within the schools.
Data from Year 1 stakeholder interviews revealed that, although there was no formal community coalition in place prior to the receipt of the planning grant, schools had a history of working with the community to meet students’ nonacademic needs. As one social worker noted, “Our strengths are that we already have very solid relationships with community agencies.” A number of interviewees commented on the variety of resources available in Lynn to support children and families. For example, one interviewee stated, “we’ve always had an abundance of resources in Lynn, and I think that when the tough get going, we all support each other.” Another commented, “In a district like Lynn, there are a lot of support services that are available.”
During Year 1, all of the WAZ schools had community partners working in the schools to address students’ nonacademic needs, the primary one being Lynn Community Health Center
American Institutes for Research Evaluation of the Wraparound Zones Initiative: Report Two—79

(LCHC). During the planning year, LCHC established a school-based health center at each of the Level 4 schools (Connery and Harrington).26 Through this partnership, LCHC provided students with behavioral health services. This included counselors who were in the school five days a week and a psychiatrist who worked at the school one day a week. One school principal reported plans to add a health clinic at both Level 4 schools during the next school year. The clinic would include a nurse practitioner, a physician who would be in the school once a week, and a receptionist, and would further increase the school’s capacity to meet students’ needs in a timely and efficient manner. At Marshall, LCHC also provided a teen health center that included a nurse practitioner, mental health counselors, and a nutritionist. Therapists from other community agencies were also providing services at the schools, and social workers identified external agencies that they worked with on a regular basis.
Community Coalitions Finding 2: Relationships between schools and community partners were informal, and there was a lack of collaboration across schools to establish a more coordinated system for increasing access to services.
Although relationships with external partners were already in place in all of the WAZ schools, schools had independently and informally established these relationships. Data suggested that simply having these resources and relationships was not sufficient for systematically ensuring consistent and adequate access to high-quality services. For example, there did not appear to be much collaboration between schools about their work with community partners. One social worker commented on the need to pool resources by stating, “I like the idea of everyone being forced to pool their resources instead of hold back. Because we have some schools where people have all kinds of connections, and other schools where people have no connections and might not even live in the community.” Another described the lack of communication between the school and community organizations by stating, “We spend a lot of time passing each other. But we don’t spend a lot of time reflecting on what we need to know, and we don’t often really know who they [community organizations] are and what types of services they are offering.”
Staff survey data supported the need for more information about the types of services provided by community agencies. Specifically, between one quarter and half of survey respondents indicated that they did not know about the adequacy of supports provided by community partners (see Table 22). This is significant because this lack of knowledge likely affected staff members’ ability to make appropriate referrals, and it suggests that there may have been some untapped community resources. School staff members were hopeful that through WAZ, they would develop a comprehensive database or system to house information about available community resources and facilitate the referral process. For example, one community partner described the need for “one central place where Lynn public schools can funnel information,” and added, “We are hoping to get that up and running within the next year. That is part of the wraparound.” In describing how she hoped wraparound would impact community partnerships, one social worker stated, “I see them [partnerships] being tighter, and I see it making it easier for us to know exactly who to call for what.” Another interviewee hoped that, through WAZ, a similar resource would become available for parents: “It would be nice if this initiative could create some kind of community place that [parents] can get all the information no matter what their need is, that they would be able to go to this place and say, ‘Here’s what my need is; can you help me?’ and they would get information.”26 The development of school-based health centers at the Level 4 WAZ schools was independent of the WAZ initiative.
American Institutes for Research Evaluation of the Wraparound Zones Initiative: Report Two—80

Table 22. Staff Members’ Perceptions of Adequacy of Supports Provided by Community Partners
Staff Members’ Characterization of Nonacademic Supports Provided by External Partners in Their Schools
Cobbet Elementary (n = 25–
26)
Connery Elementary (n = 35–
36)
Harrington Elementary (n = 51–53)
Marshall Middle
(n = 46–47)
Lynn WAZ overall
(N = 158–162)
Very adequate 5.4% 9.8% 11.0% 8.8% 9.8%Adequate 20.1% 38.7% 14.0% 19.8% 25.3%Slightly adequate 15.5% 18.4% 23.7% 18.0% 16.4%Not adequate 26.4% 8.4% 12.9% 17.6% 14.8%Don’t know 32.6% 24.8% 38.5% 35.7% 33.7%
WAZ Priority Improvement Area 4—District Systems of Support
An important goal of the WAZ initiative is to expand and enhance districtwide systems to support practices related to improving climate and culture, identifying and addressing student needs, and sustaining a community coalition. This section describes two findings related to Priority Improvement Area 4: District Systems of Support, and the evidence that supports these findings.
District Systems of Support Finding 1: When the planning year of the WAZ grant was launched, there was evidence of strong buy-in and support among district leaders, related to the importance of addressing student social and emotional (i.e., nonacademic) needs.
Interview data revealed strong district-level buy-in and support for WAZ. During Year 1, district leaders worked alongside principals and other stakeholders on the WAZ planning committee, and their comments revealed a genuine commitment to addressing students’ social and emotional needs. As one district leader stated, “We now know that that [social–emotional needs] has to be a huge piece of what we address. If we don’t address that, it doesn’t matter how good our curriculum is going to be because kids aren’t going to be able to access the curriculum. And we realized we need that not just for the Level 4 schools but for all schools.” Recognizing this need, the district had recently allowed several schools to use funds to hire social workers whose primary roles included connecting students and their families to appropriate services so as to address nonacademic needs as well as implementing activities within the school that targeted these issues (e.g., therapy, social skills groups, and bullying prevention).
The support of district leaders was acknowledged by almost all of the other stakeholders interviewed. For example, one social worker stated, “Thus far, the leadership that they’ve shown to our leadership team—the cohesiveness has been very strong. That’s why we feel as a school very supported by them.” Another described a district leader as “very easy to work with, very forthcoming with information, and inclusive at meetings.” Community partners reported similar views about district leaders’ support of WAZ. One community partner stated, “Most importantly, I want to say that our superintendent has put a lot of great effort and work into this plan.”
American Institutes for Research Evaluation of the Wraparound Zones Initiative: Report Two—81

Another noted that the superintendent had made herself more available to support WAZ-related work than some past district leaders.
District Systems of Support Finding 2: There was a delay in the hiring of a WAZ district coordinator, which may have contributed to a lack of focus and guidance around the development of a comprehensive implementation plan at the district and school levels.
The district established several working groups to accomplish the subtasks that would prepare it for WAZ implementation. One group was charged with hiring a WAZ program manager. According to the plan, Lynn intended to hire a district coordinator by January 2012. Among other things, this person was to be the primary point of contact between the district and the schools and would play a key role in helping to establish school–community partnerships. This was to be a full-time position, with all time spent on WAZ-related activities. At the time of the site visit (early March 2012) this position had not been filled, and several stakeholders identified the selection of a district coordinator as a priority.
Interview data suggested that there were challenges related to not having someone in this position early on who could dedicate 100 percent of his or her time to the planning process. Stakeholders reportedly had numerous competing responsibilities, and therefore, even with the planning committees and workgroups, progress toward developing a comprehensive implementation plan was slower than originally intended. Several stakeholders acknowledged that sticking to the timelines was a challenge. To help address this issue, the district contracted with City Connects in late December–early January to help with the planning process. One stakeholder said, “Our biggest issue is meeting deadlines and staying on timelines, and that’s one of the reasons we had City Connects.... We were very invested, but it doesn’t seem like we had a lot of actions out of those meetings.” Another stated, “City Connects is contracted to do the planning year for us, which has been very helpful because we knew what we had to do but it was really hard getting us moving.”
Although City Connects helped bring some focus and direction to the planning process, interviewees expressed a need for someone who could move the planning process beyond data gathering and committee meetings to turn the district vision into a detailed plan of action. Most staff members seemed to be waiting for a coordinator to help develop the school- and district-level WAZ plans. As one stakeholder stated, “What I would love is once that person [the district coordinator] gets hired, to bring us all together, to start having meetings and building coalitions.” Another said, “Everyone’s busy, so I think unfortunately we’ve been waiting for this new person to be hired to really get things going.... We want someone whose only thing is working on wraparound. We need someone to dedicate their day.”
In addition, there was some degree of uncertainty among school staff members about how WAZ would be implemented at their school the following year. This uncertainty included questions about the role of the school social workers and how WAZ would fit into each school’s existing efforts. Subsequent data collection efforts in Year 1 revealed that the hiring of the district coordinator did eventually occur around the end of April, and that this helped to address the uncertainty and lack of progress. The coordinator met with school staff members, allowing them to share their vision of how WAZ would fit into their school. For example, one staff member reported that this meeting helped to clear up some misconceptions about how WAZ would be
American Institutes for Research Evaluation of the Wraparound Zones Initiative: Report Two—82

implemented in the school. Another described having a discussion with the district coordinator about how she could help facilitate parent engagement activities that were already being planned in the school. The district coordinator also helped to move plans to engage community partners one step further by organizing a community partner breakfast shortly after she was hired. This breakfast was reportedly designed to initiate the dialogue between the schools and community about how they could collaborate to meet the needs of students. The session was a tangible activity that went beyond the planning meetings to engage a wider network of stakeholders. One participant described this as “solid step forward,” and the effects of the meeting were immediate as one principal reported receiving a follow-up call from one of the participating agencies.
Conclusion
During the 2011–2012 school year, Lynn was the only WAZ district that had a planning grant, and the ultimate goal was to develop a comprehensive WAZ implementation plan. Data revealed that Lynn’s planning progressed at a slower pace than intended; this was attributed, in part, to the delayed hiring of the district coordinator—someone who could devote all of his or her time to the WAZ. There was also a need for a more systematic data collection and evaluation procedures, at the district level, to help inform implementation planning.
In terms of the four WAZ priority areas, the Level 4 schools were further along in their efforts to develop processes that addressed students’ nonacademic needs, particularly with regard to school culture and climate. However, all schools were implementing strategies that targeted climate and culture prior to receipt of the planning grant (Priority Improvement Area 1). All schools had social workers who played an integral role in identifying and addressing student nonacademic needs. In addition, informal processes were in place to ensure that students received services, but there was a need for a more systematic approach (Priority Improvement Area 2). It was also found that Lynn had many community resources, and schools had already increased their capacity to address student needs by establishing community partnerships and allowing these agencies to provide services to students within the schools (Priority Improvement Area 3). Finally, there was evidence of strong buy-in and support among district leaders around the importance of addressing students’ nonacademic needs. The hiring of the district coordinator provided schools with additional support, particularly around establishing community partners and creating a more explicit mechanism for district–school communications about the initiative.
Profile E: Springfield
Introduction
The purpose of this profile is to provide a description of the conditions and supports that existed in Springfield during Year 1 of the WAZ initiative and to present key findings related to the district’s efforts for WAZ implementation. The data sources used to inform this profile are (a) stakeholder interviews conducted during the spring of 2012;27 and (b) WAZ-related documents provided by the district and schools. Springfield did not participate in the staff survey administered by AIR or AIR’s Conditions for Learning (CFL) student survey. Analysis of these
27 These included interviews with district administrators, four WAZ school principals, WAZ school coordinators, and one adjustment counselor.
American Institutes for Research Evaluation of the Wraparound Zones Initiative: Report Two—83

data sources provides a comprehensive picture of the conditions in Springfield during the first year of WAZ implementation.
Springfield selected six elementary schools to participate in the first year of the initiative (Brightwood, Brookings, Gerena, Homer, White Street, and Zanetti).28 All six of these schools were Level 4 schools, and Springfield chose them to participate because their specific needs and elements of their turnaround plans aligned with WAZ priorities. For example, these schools were chosen because they all faced challenges related to their climate and culture, such as high rates of student absenteeism, student behavior problems (i.e., high suspension rates), lack of parent engagement, students with mental health issues, and neighborhood violence. In addition, these schools were chosen because their turnaround plans included elements that aligned with WAZ priorities such as implementing student behavior support programs or partnering with community agencies to provide mental health services to address student needs, or providing other supports for students’ nonacademic needs. Table 23 presents demographic data for the six participating schools, as well as averages across the six schools, and for Springfield overall.
Table 23. Springfield WAZ School and District Demographics, 2011–12
BrightwoodK-5
BrookingsPK-5
GerenaPK-5
HomerK-5
White StreetK-5
ZanettiPK-8
Cross-WAZ School
Average
Springfield District
Accountability status Level 4 Level 4 Level 4 Level 4
Level 4 Level 4 N/A Level 4
Enrollment 399 329 627 418 399 407 N/A 25,185
Percentage low-income 97.2% 95.1% 89.3% 95.0% 94.5% 66.6% 89.4% 85.6%
Percentage English language learners 33.1% 23.1% 23.9% 20.6% 29.6% 4.9% 22.6% 15.7%Percentage with disabilities 9.8% 19.8% 17.7% 15.1% 11.3% 7.1% 13.6% 20.9%Percentage scoring proficient or higher on the English language arts section of the Massachusetts Comprehensive Assessment System (MCAS) 16.1% 22.6% 21.4% 43.9% 19.1% 62.6% 31.7% 40.1%
Percentage scoring proficient or higher on mathematics section of MCAS 10.6% 27.8% 19.4% 45.2% 27.5% 54.2% 31.0% 28.5%
28 Brightwood, Homer, and White Street are K–5 schools. Brookings and Gerena are PK–5 schools, and Zanetti is a K–8 school.
American Institutes for Research Evaluation of the Wraparound Zones Initiative: Report Two—84

BrightwoodK-5
BrookingsPK-5
GerenaPK-5
HomerK-5
White StreetK-5
ZanettiPK-8
Cross-WAZ School
Average
Springfield District
Percentage African American/black 11.3% 22.2% 11.8% 24.4% 18.5% 30.0% 19.0% 20.7%Percentage Asian 0.0% 2.1% 0.2% 1.7% 10.3% 1.0% 2.3% 2.4%
Percentage Hispanic 86.5% 64.4% 79.3% 66.5% 63.4% 43.7% 68.4% 59.8%
Percentage white 2.0% 7.6% 7.5% 4.5% 6.0% 18.2% 7.6% 13.7%Percentage other 0.0% 0.0% 0.0% 0.2% 0.3% 0.0% 0.1% 3.3%
Source: Massachusetts Department of Elementary and Secondary Education.
In the remainder of this profile, we describe findings related to the conditions that existed in Springfield during Year 1 of WAZ implementation. We first present overall findings that cut across WAZ Priority Improvement Areas or that reflect particularly strong themes that emerged in the Springfield data. We then present findings within each of the four WAZ Priority Improvement Areas.
Overview and Summary of Key Findings
Overall, data from the evaluation revealed the following two key findings for Springfield, which describe the conditions and supports that existed in the district upon beginning implementation of its WAZ grant:
1. Springfield chose to use WAZ funding to implement the City Connects model, which provides supports to the “whole child.”
2. Although coordinators were all knowledgeable of the City Connects model, implementation varied across schools due to a lack of staff or principal buy-in and challenging “adult cultures” at some schools.
Two sections follow that further elaboration on these findings. In the first section, we present a brief summary of the evidence supporting each of the four findings listed above. In the second section, further analysis and data for each of the WAZ Priority Improvement Areas are presented.
Overall Finding 1: Springfield chose to use WAZ funding to implement the City Connects model, which provides supports to the “whole child.”
According to district level interview respondents, Springfield had decided to pursue a partnership with City Connects (formerly Boston Connects) prior to receiving WAZ funding, and the announcement of the availability of WAZ funds seemed to come just at the right time. City Connects is a school-based model that identifies the strengths and needs of every student and links each child to a tailored set of intervention, prevention, and enrichment services in the school or community. The City Connects model is designed to address the in-school and out-of-school factors that impact students’ academic, social–emotional, family, and physical well-being.
American Institutes for Research Evaluation of the Wraparound Zones Initiative: Report Two—85

At the core of the City Connects model is a full-time school site coordinator in each school. According to City Connects, these school site coordinators serve as a hub for student support activities and collaborate with families, school faculty and staff, and the Boston College leadership and research team. The school site coordinator works with the classroom teachers and other school staff members to assess each child’s strengths and needs in four domains: academic, social–emotional, health, and family. According to the City Connects model, the school site coordinator facilitates and enhances partnerships with community agencies to meet the identified needs of students, families, and schools. The coordinator is charged with assisting families to take the necessary steps to access the services and enrichment activities recommended for their children. The coordinator is also charged with collaborating with classroom teachers and community agencies to develop effective classroom interventions around behavioral, social–emotional, and health concerns.
Springfield chose to implement the City Connects model because its philosophy was “quite similar” to the philosophy of the “Springfield Improvement Framework,” a plan for district improvement that emphasized “cultivating a school climate and culture that is goal oriented, adaptive, and cohesive, and enhancing core instruction at each school.”
Springfield formed a partnership with City Connects during the 2010–2011 school year and used the year as a planning year prior to rolling out the City Connects model in six Level 4 elementary schools. As part of this planning year, Springfield hired a district coordinator in October 2010 to work with City Connects’ central organization. The district coordinator received ongoing training on the model as well as weekly supervision from the central City Connects Implementation Team. In addition, City Connects was supporting the implementation of its model in Springfield by providing training to the school site coordinators and evaluating or monitoring implementation through its own evaluation system.
Overall Finding 2: Although coordinators were all knowledgeable of the City Connects model, implementation varied across schools due to a lack of staff or principal buy-in and challenging “adult cultures” at some schools.
In Year 1 of WAZ, all of the coordinators generally reported that they were working to build relationships with principals and teachers to facilitate the implementation of the City Connects model, and in particular the whole class review, which required them to gather data on every student in the classroom. The degree to which coordinators were successful at building these relationships varied. The coordinators who reported having the least amount of difficulty scheduling and getting teacher buy-in for the whole class reviews were those coordinators who also reported intentionally reaching out to teachers to give teachers the opportunity to get to know them. For example, one coordinator noted that she had made an effort to offer to support teachers in their classrooms (e.g., offering tips on classroom management or to help with specific discipline issues) and that when she was given a choice of an office near the counselors or an office closer to classrooms, she chose the one closer to classrooms so that she would be physically closer so teachers could have easier access to her. The coordinators who reported successfully scheduling whole class reviews also reported having the principal’s support for doing these reviews. They also reported that the principal had assisted in garnering the support of the teachers for the whole class reviews.
American Institutes for Research Evaluation of the Wraparound Zones Initiative: Report Two—86

However, some coordinators also reported that the adult culture or climate at the school presented challenges to relationship building. For example, one coordinator said, “Teachers don’t want to stay past time.... Staff morale is low.... This is a high stress building.” Another coordinator noted that “adult issues” often got in the way of trying to support the students because staff did not see the value in Positive Behavioral Interventions and Supports (PBIS) or the City Connects model because they were new.
One district administrator expressed concern that implementing City Connects in addition to other changes related to the Level 4 status of schools might have been too much for schools to do at once, saying, “All the change in Level 4 schools might be impeding wraparound.” This district administrator acknowledged that staff and principal changes due to the Level 4 status of the WAZ schools might be affecting staff morale and making some staff members resistant to any additional changes or additional tasks. For example, in schools where there was a new principal or there were many new teachers because of the Level 4 status, staff often viewed City Connects as “one more thing they had to do.” Although the City Connects model included similar structures to those included in many of the Level 4 elementary schools’ school improvement plans, data showed that schools were not informed about the implementation of City Connects until after the school improvement plans had been written for the 2011–2012 school year.
Overall, stakeholders expressed concern about the way in which City Connects had been “placed” on the schools and indicated that this method of rolling out the initiative was affecting principal buy-in and impeding implementation progress across the schools. For example, two principals noted that they were “just told” that the district was going to be placing a City Connects coordinator in their school. One principal noted that she was not involved in the decision making about City Connects; however, she was told that she would be getting a City Connects coordinator and reported being provided with an overview of the City Connects model. This principal expressed concern that principals had not been consulted about how City Connects would be implemented in their individual schools. Another principal noted that she did not think her school needed City Connects or a coordinator to connect students with services and reported that what her school “really needed was an additional adjustment counselor.” In addition to some principals and a district administrator, one coordinator also noted concern about principal buy-in for City Connects. She noted that although her principal had been very supportive of her work as a coordinator, she had heard that other principals were not as supportive of City Connects. She said, “An important aspect of wraparound is having administration buy-in.... I don’t have to constantly paddle uphill to get something that is beneficial for the kids. If I come with a clear plan and show how it will succeed, I’m good to go. You can’t do anything without administration buy-in.” One district administrator noted that one lesson the district had learned during the first year was that making sure that principals are involved from the beginning stages is important because “you don’t want it [City Connects or WAZ] to be central office controlled.”
WAZ Priority Improvement Area 1—Climate and Culture
The WAZ Climate and Culture Priority Improvement Area includes school-level practices intended to ensure safety, effectively manage student behavior, teach and model strong social–emotional skills, establish positive relationships with families and the community, and cultivate a climate of high expectations and positive regard between leadership, staff, and students—all
American Institutes for Research Evaluation of the Wraparound Zones Initiative: Report Two—87

supported by district-level systems. To address this improvement area, Springfield’s 2011–12 WAZ plan laid out the following three strategies:
1. Develop a systematic approach to student support to address out-of-school factors that impact achievement.
2. PBIS or Responsive Classroom, or both, will be implemented.
3. Springfield Public Schools plans to develop an action plan based on Organizational Health Inventory results according to the ten dimensions: goal focus, communication adequacy, power equalization, resource utilization, cohesiveness, morale, innovativeness, autonomy, adaptation, and problem-solving adequacy.
Data collected from stakeholders during Year 1 revealed that the City Connects model had been implemented at least to some degree in all of the wraparound schools (Strategy 1). At one school, the City Connects model was implemented only at the beginning of the year because the coordinator left midyear. PBIS or Responsive Classroom, or both, were being implemented in all schools except for one (Strategy 2). One district administrator noted that the district was planning to take a closer look at Organizational Health Inventory data but that this had not yet been done (Strategy 3). This section describes two findings related to Priority Improvement Area 1: Climate and Culture, and the evidence that supports these findings.
Climate and Culture Finding 1: Progress in implementing and obtaining buy-in for PBIS or Responsive Classroom, or both, varied across schools in the district.
During Year 1 of WAZ, four of the six schools were implementing PBIS (Brookings, Gerena, White Street, and Zanetti), one school (Brightwood) was implementing Responsive Classroom, and one school (Homer) was not using any behavior management curriculum.
According to interviews with principals and coordinators, implementation of PBIS at three schools (Brookings, Gerena, and White Street) was going smoothly. For example, the coordinator at one of these schools noted that PBIS implementation was a strength: “PBIS gives us a specific language, a specific focus.” At another school, the principal and coordinator noted that data were showing a decrease in behavior problems, although the principal also noted that “We’re still in the process. I don’t think it’s perfect yet.” Stakeholders interviewed at two schools noted that in addition to having student behavior expectations posted throughout the school and rewarding students for positive behavior, the coordinators were working to implement check-in and check-out procedures for students with more severe behavior problems through strategies such as Breakfast Club (i.e., a program where students check in, have breakfast with a coordinator, and pick up a behavioral chart for the day).
In contrast to Brookings, Gerena, and White Street, stakeholders at Zanetti noted that getting teachers to buy in to PBIS had been challenging. Zanetti was a Montessori school that had previously used Responsive Classroom, which is a general approach to teaching that builds academic and social–emotional competencies through activities such as a morning meeting and collaborative problem solving. Staff at the school had also previously been trained in Playworks, a curriculum focused on conflict resolution and social–emotional skills on the playground and in the classroom. When WAZ began, school leadership decided to replace these programs with PBIS, because the PBIS model seemed to “meld” better with the Montessori motto of grace and
American Institutes for Research Evaluation of the Wraparound Zones Initiative: Report Two—88

courtesy than previous behavior management strategies the school had tried. However, the coordinator expressed a contrasting opinion when she said, “I came from a PBIS school, which is the antithesis to Montessori.” According to the coordinator, getting teachers to buy in to PBIS was a “huge hurdle” at the beginning of the school year, but at the end of the first year, she reported that more teachers were coming onboard. The coordinator, who was the co-lead of the PBIS team and facilitated professional development for the teachers on PBIS, was working on trying to show teachers the value of implementing PBIS. For example, she let teachers know that PBIS was not that different from Responsive Classroom, since staff members had all been onboard with implementing Responsive Classroom. She also put together newsletters each month for teachers around strategies the teachers could use for classroom management and how these strategies aligned with PBIS. However, she also said, “We need someone to say it [PBIS] is mandatory. You must do it [PBIS], and these are the organizational structures that will be put in place to support you.... At Gerena, they have one day a week designated for this, where, for example if you [a student] have 20 peace points, you can attend a fun event. They have an organizational structure that we don’t have.” Overall, the coordinator at Zanetti was working to build buy-in for PBIS among the teachers but reported that there still were teachers who were not onboard.
In contrast to the other schools, where PBIS was relatively new, Brightwood had been implementing Responsive Classroom for a few years and was continuing to do so under WAZ. Responsive Classroom had been put in place as part of the school’s turnaround plan. The coordinator did not note any specific challenges related to the implementation of Responsive Classroom; however, she did note that although there was a lot of communication and that “everybody does have the kids in mind,” the school was “a very high stress building.” She also reported that staff overall did not have the belief that “the kids can succeed” and that the school in general had many problems and was not addressing them, and that the climate at the school had become tense.
Homer chose not to implement PBIS or Responsive Classroom because the principal did not believe her school needed such a program. The principal at Homer noted that the district had offered to provide training for PBIS or Responsive Classroom but that she had declined. She noted that Responsive Classroom is “great for people that need it. I’m not going to put in a program to give someone a job or just because there is money. You have to have the need. I just don’t need it.” Overall, the principal noted that although the school had behavioral issues and much of the problem with underperforming schools was behavioral, that having good people or teachers was key, and if you had “solid” teachers you did not need Responsive Classroom or PBIS. She also noted that if “you don’t know what to do [in terms of handling student behavior], you should not be in the job.” The principal also noted that when she came to the school that there were 125 external suspensions, and that this year there were 25. The adjustment counselor also supported the assessment that, with the principal’s leadership, student behavior at the school had already improved.
Climate and Culture Finding 2: School safety was a concern at two schools.
The coordinators at Brightwood and Gerena mentioned school safety as a concern related to the climate of the school. For example, one coordinator noted that anyone in the community could easily walk through the school building at any time of day. She noted that the school was
American Institutes for Research Evaluation of the Wraparound Zones Initiative: Report Two—89

working on figuring out the best way to continue to have the school be a place where the community would be welcome while ensuring the safety of the students and limiting the number of “strangers” roaming the halls. At the other school, the coordinator reported that the neighborhood where the school was had previously had a poor reputation. In addition, the coordinator at this school said, “There are a lot of challenging things that go on that they [the students] should not see at such a young age.” However, this coordinator acknowledged that she had been told that conditions in the neighborhood had improved recently. During Year 1, although these coordinators noted concern about the safety of the school and neighborhoods, they did not note whether the schools were taking any steps to address the safety issues. Stakeholders at the other schools did not mention safety as a concern related to school climate.
WAZ Priority Improvement Area 2—Identifying and Addressing Student Needs
The WAZ Identifying and Addressing Student Needs Priority Improvement Area includes school-level practices intended to assess the well-being of all students; effectively implement policies or programs to address the universal needs of students; establish structures and systems to create, monitor, and adapt success plans for students requiring targeted assistance; and provide the necessary training and support to ensure that staff members can effectively identify and address student needs—all supported by district-level systems. To address this improvement area, Springfield’s 2011–12 WAZ plan laid out the following three strategies:
1. City Connects Coordinators will establish a schedule and prepare teachers for whole class reviews. The process involves developing a tailored student support plan and referring students to interventions.
2. The City Connects Coordinator will establish a Student–Teacher Assistance Team (STAT) and train the STAT. The STAT will meet regularly and conduct follow-up meetings.
3. The City Connects Coordinator will gather information regarding family needs during whole class reviews and STAT meetings.
Data collected from stakeholders during Year 1 revealed that Springfield was implementing whole class reviews in all six schools (Strategy 1), and coordinators were working to establish STATs and arrange regular meetings (Strategy 2). Stakeholder interviews revealed that coordinators gathered information regarding family needs during the course of their work in the schools, through both whole class reviews and STAT meetings as well as through more casual contact with students and teachers (Strategy 3). This section describes two findings related to Priority Improvement Area 2: Identifying and Addressing Student Needs, and the evidence that supports these findings.
Identifying and Addressing Student Needs Finding 1: Coordinators worked to establish the whole class review and STAT process with varying degrees of success.
All coordinators reported working to implement the whole class review process. In the whole class review process, the coordinator has a brief discussion with the teacher on the strengths and needs of every student in a class, in addition to documenting any services each student might
American Institutes for Research Evaluation of the Wraparound Zones Initiative: Report Two—90

currently be receiving. The coordinator is then charged with following up on the discussion to address the needs of each student by letting the student and parents know about available services to address the needs. Most coordinators were able to schedule and meet with all teachers and were able to get input from students or other sources about strengths and needs. For example, two coordinators mentioned having a process that included getting information from students themselves to help inform the whole class review with teachers.
Two coordinators reported having trouble getting teachers to schedule the time to do the whole class reviews. Two other coordinators also reported that having the time to follow up on every student and recommend services or supports was difficult. For example, one coordinator noted that City Connects stressed that after whole class reviews, the coordinator is supposed to get services in place within two weeks, but that she was not able to meet that timeline because “there is just so much paperwork and data entry that you’re supposed to be doing, and then there are actual real-life things happening in a school to respond to.” This coordinator noted that follow-up from whole class reviews was something that she wanted to improve on, but that it was difficult to fit in because she was often called on to help teachers with student behavior issues or conflict resolution. Another coordinator expressed a similar sentiment when she said, “All of the work to do in the school is so big and it needs to be done.... It feels too big. We could do 40 hours a week just doing one of those [e.g., whole class reviews, STAT, helping teachers with classroom management, running counseling groups, or reaching out to community organizations]. There is a lot of data entry, but it’s needed to support what we are doing. It is all very important but sometimes it feels like three separate jobs.” Overall, coordinators were able to conduct whole class reviews with almost, if not all, teachers in their schools, and some were even able to include information from other sources in their reviews. However, coordinators did have concerns about the time needed to follow up and get services in place.
In addition to whole class reviews, which allowed schools to identify and try to address the needs of every child, the wraparound schools in Springfield were implementing the STAT process, which focused on addressing the needs of students that were “the most needy” or were struggling. All coordinators acknowledged that the STAT process was a “work in progress,” but some schools made better progress in implementing STAT during the first year than others. The purpose of STAT meetings was to review students who were potentially in need of intervention, whether it be something the teacher could implement in the classroom (e.g., a behavior management strategy), support from an outside agency for mental health counseling, or assessing for special education. According to interview respondents, although STAT might look a little different at each school (i.e., in terms of the number of students discussed, whether parents were invited to attend, how frequently the team met, or how comfortable teachers were referring a student for STAT), across all schools, respondents reported that the purpose was to discuss students who were experiencing difficulties in school, whether academic or social–emotional, or both, and to problem-solve or discuss ways to support these students’ needs. Overall, coordinators noted that the STAT process was “moving along” but not it was not without challenges. For example, one coordinator reported having STAT meetings once a week to review the needs of three students each week, but others reported meeting less frequently or having trouble scheduling STAT meetings or getting teachers to refer students to STAT. Another coordinator noted that “ideally, an administrator would be there [at STAT meetings]” but that she rarely was able to have a principal attend because “they are always doing other stuff.” In contrast, one principal reported that her school has a STAT meeting every Friday and that it was
American Institutes for Research Evaluation of the Wraparound Zones Initiative: Report Two—91
important for her to attend to help problem-solve. Another coordinator noted that after each STAT meeting, the team was supposed to follow up about the particular students six to eight weeks later to see whether what had put in place was working or whether other strategies needed to be considered. However, this coordinator noted that the timeline for follow-up was rarely met, if at all.
Identifying and Addressing Student Needs Finding 2: Coordinators at all of the schools were working to connect students with needed services, but there were challenges in getting students to access the needed services.
Almost all of the coordinators reported challenges connecting students with services. For example, three coordinators reported that most community organizations had long wait-lists that presented a barrier to connecting students with needed services. These three coordinators also noted a particular need for tutoring services and that there were just not enough organizations or slots for tutoring available in the community. Two coordinators reported that transportation presented a challenge for connecting students with services. In addition, three coordinators mentioned that parents’ ability to pay for services, or the lack of free services, presented a challenge for connecting students to services. For example, one of these coordinators said, “Parents want the services, but if they can’t get their students there or they can’t pay, then we are kind of stuck.” Two coordinators also mentioned issues related to parents following up on recommended services. For example, one of these coordinators said, “The piece that falls down is we’re not going to walk them to the Y. If they don’t get the service, we don’t know.” Another coordinator noted that she had found that just sending information on programs or services home to parents was not working, so she started promoting the programs to students, and then the students were more likely to tell their parents about the programs or services, although parent follow-through continued to be a challenge. Other challenges that coordinators mentioned that impeded students access to services or supports were language barriers, child care, and the mobility of families. For example, one coordinator noted that the “population is transient, so we try to plug in services and then they [the families] are gone.”
WAZ Priority Improvement Area 3—Community Coalitions
The WAZ Community Coalition Priority Improvement Area includes school-level practices intended to utilize a system to take stock of and access internal and external resources and supports, establish and coordinate partnerships to address student needs that cannot be met with internal resources, monitor the effectiveness of those partnerships and make changes where necessary, and convene internal and external partners and stakeholders to share information, collectively problem-solve, and collaborate on improvement efforts—all supported by district-level systems. To address this improvement area, Springfield’s 2011–12 WAZ plan laid out the following two strategies:
1. Identify community-based resources by establishing a directory of local community services and documenting the services that are used.
2. Develop a Community Advisory Board.
Data collected from stakeholders during Year 1 revealed that Springfield was working on or at least beginning implementation of these two strategies. For example, the district coordinator was
American Institutes for Research Evaluation of the Wraparound Zones Initiative: Report Two—92

working to build a directory of community organizations (Strategy 1). There was no evidence that Springfield had developed a Community Advisory Board, but stakeholders reported that there were plans for the district to host a community event that would bring together community organizations from across Springfield (Strategy 2). This section describes two findings related to Priority Improvement Area 3: Community Coalitions, and the evidence that supports these findings.
Community Coalitions Finding 1: Coordinators at each of the WAZ schools were working to build relationships with community partners or to expand existing relationships.
All coordinators mentioned working to connect students with services or organizations in the community. Two schools had strong existing relationships with community organizations that they were working to expand. For example, one coordinator noted working with a number of counseling agencies to provide services to students. However, this coordinator said, “We have a lot of partners but not partnerships, but I think that is where we are headed.” In contrast, another coordinator noted a need to build or formalize a relationship with a mental health agency so that the school could have someone who would come to the school to provide counseling. Another coordinator reported having relationships with two mental health agencies that would sometimes make her students a priority or make sure that her students were seen without being placed on a wait-list. However, she noted that this was not a formal relationship. Three coordinators reported having a need to learn about organizations in the community providing tutoring services and wanting to build a relationship with such an organization. Overall, all coordinators were working to connect students to services, but some coordinators were working more consistently than others on building or expanding on existing partnerships.
Community Coalitions Finding 2: The district was planning an event for community partners to learn about City Connects and for the coordinators to learn more about the services available in the community.
All of the coordinators and one district administrator reported that the district was planning an event for community organizations to learn about City Connects and for the coordinators to learn more about the services available in the community. However, the coordinators had differing perspectives on the purpose of the event and how useful the event would be for them. For example, one coordinator who was trying to build a community coalition noted that this event was the kickoff and that there would be future meetings. In contrast, another coordinator reported that coordinators had a need to learn about organizations in the area and that all of the schools had a need for additional involvement of community partners; she stated that she was hoping the event would enable her to learn about additional organizations. This coordinator said, “Springfield does not want another coalition. What we need is better communication and collaboration between the district and community partners.” One district administrator reported a similar sentiment when she said, “We are trying to put together some intra-agency collaboration because we really need all of the agencies to be at the table.” One coordinator noted that she really did not have time to prioritize helping plan the event when what she really needed was assistance in getting a mental health counselor from an outside agency housed in the school. Overall, all of the coordinators expressed a need for more involvement of community organizations and more collaboration to provide needed supports to students, but coordinators’
American Institutes for Research Evaluation of the Wraparound Zones Initiative: Report Two—93

opinions differed on how to best connect with community organizations and whether the event would be productive for them.
WAZ Priority Improvement Area 4—District Systems of Support
An important goal of the WAZ initiative is to expand and enhance district-wide systems to support practices related to improving climate and culture, identifying and addressing student needs, and sustaining a community coalition. To address this, Springfield included the following two strategies in its 2011–12 WAZ plan:
1. Establish a district-level Committee for Student Support.
2. Provide supervision for City Connects Coordinators.
Data collected from stakeholders during Year 1 revealed that Springfield provided supervision for the City Connects Coordinators through the district coordinator (Strategy 2). However, there was no evidence that the district had established a district-level Committee for Student Support (Strategy 1). This section describes two findings related to Priority Improvement Area 4: District Systems of Support, and the evidence that supports this finding.
District Systems of Support Finding 1: During Year 1, the district coordinator’s maternity leave left coordinators to look for support from one another and from City Connects.
In October 2010, as part of the planning year prior to receiving Wraparound funds, Springfield hired a district coordinator to work with City Connects’ central organization and then to supervise the school site coordinators once implementation began. However, the district coordinator went out on maternity leave during the fall semester of 2011 and returned to work in late spring of 2012. All coordinators and one principal agreed that there was a lack of support from the district during her absence. Two coordinators noted that there was not anyone at the district level supporting the coordinators in the district coordinator’s absence and one said, “I would like a supervisor that’s more involved. I get that she left for maternity leave but no one replaced her.” Two coordinators noted that in the beginning of the school year, coordinators had weekly meetings with the district coordinator as a group and received guidance from her about navigating district processes but that now (spring 2012) those meetings were less frequent, and they missed the support of the district coordinator. For example, one of these coordinators said, “We miss her [district coordinator]. She helps us navigate everything we have to go through. She did a great job of setting up a lot of partnerships before we even got started.... District-wise, now, I don’t really know. We have not had much contact with anyone.” One principal also expressed concern about the lack of supervision from the district for her school site coordinator in the district coordinator’s absence. For example, this principal said, “Someone from the central office should be checking in on her [the coordinator].”
Once the district coordinator went on leave, almost all of the coordinators indicated that their biggest source of support was the other coordinators. Two coordinators noted that one of the coordinators at Gerena was taking the lead in overseeing the group of school site coordinators and coordinating with the Department of Elementary and Secondary Education and City Connects in the district coordinator’s absence. One coordinator said, “The biggest support for me is having the other five coordinators. We’ve been lucky and have been able to use each other for
American Institutes for Research Evaluation of the Wraparound Zones Initiative: Report Two—94

support. We constantly email each other about services.” Another coordinator reported checking in with other coordinators to see if she was on the “right track” with implementing the City Connects model. Another coordinator noted, “We [the coordinators] work really great as a team. We share our resources.” However, another coordinator noted that neighborhoods in Springfield were “very territorial” and that “you can have a wonderful service, but if it is across town, no one is going.” According to this coordinator, although it was helpful for the coordinators to share information about community organizations that they were working with at their individual schools, coordinators were not always able to make use of connections formed by other coordinators with community organizations because of transportation issues and the neighborhood culture in Springfield. However, coordinators generally noted that communicating with other coordinators was a valuable source of support during the first year.
In addition to support from one another, coordinators also reported receiving support from City Connects in Boston. For example, one coordinator noted that “City Connects is a huge resource and support system.” Another coordinator noted that, “Occasionally, they [City Connects] have sent representatives to support us.” Another coordinator reported communicating with coordinators in Boston for guidance. All of the coordinators reported receiving training on the City Connects model prior to or at the beginning of the school year.
District Systems of Support Finding 2: During Year 1, coordinators and principals expressed concerns related to district staff knowledge, support, and data systems for the wraparound efforts.
Overall, coordinators acknowledged not having much, if any, contact with the district other than with the district coordinator prior to her maternity leave. In addition, three coordinators expressed concerns about the lack of support or worried about the level of district knowledge about City Connects. For example, one coordinator specifically noted that she did not feel supported by the district and was concerned for the sustainability if the district did not value the work. Another coordinator reported that she was not sure that the district “knows the details of City Connects.” One principal expressed a similar concern when she noted that there was not clear articulation of what wraparound services are “from the top” (i.e., the district). A few principals and coordinators also expressed concern about support from the district with regard to data, including access to data, the City Connects data system, and the district data system. For example, one principal expressed concern that she would not be able to have access to data on wraparound and on connecting students to services to be able to see whether the City Connects model was working. Two coordinators noted that there were redundancies in their [the coordinators’] data entry obligations. For example, one coordinator explained that the district has student success plans that require coordinators to enter information into the district data system that they have already entered into the City Connects data system. Another coordinator complained about the amount of data she needed to enter for the City Connects data system and that data entry took her away from working with students and connecting students to services. One district administrator acknowledged that the district was trying to find a way to align the City Connects system with the district system. However, the district administrator also expressed frustration with the City Connects data reports because the district could only get reports at the aggregate level about interventions or types of services students were receiving. One principal also expressed concern related to the data system when she said, “In my opinion, City Connects and Springfield Schools need an official marriage about how do we best leverage what the direct
American Institutes for Research Evaluation of the Wraparound Zones Initiative: Report Two—95

resources can do, so there is a direct impact on students and families and not on paper work.” Overall, school level respondents expressed concerns about district knowledge and support for the wraparound efforts.
Conclusion
In Year 1, Springfield began implementation of many of the strategies identified in its plan. In terms of climate and culture, coordinators in Springfield were implementing the City Connects model, and all but one school were implementing PBIS or Responsive Classroom. However, some coordinators expressed concerns about adult culture at the schools interfering with their work to support students. School safety continued to be a concern for two schools. During Year 1, coordinators were working to identify and address student needs by implementing the whole class review and STAT process. However, implementation of the whole class reviews and STAT varied across the schools. In addition, coordinators faced challenges in connecting students with services and ensuring that students were able to access the services they recommended. To address WAZ Priority Improvement Area 3: Community Coalitions, Springfield was planning to host an event for community organizations at the end of Year 1. Overall, according to coordinators, most of the work to engage community organizations was occurring at the school level rather than at the district level. During Year 1, coordinators and principals generally did not feel supported by the district in their efforts to implement the City Connects model in their schools. However, most stakeholders attributed this lack of support to the fact that the district coordinator was out on maternity leave for a “good portion” of the first year.
Profile F: Worcester
Introduction
The purpose of this profile is to provide a description of the conditions and supports that existed in Worcester during Year 1 of the WAZ initiative, and to present key findings related to the district’s efforts for WAZ implementation. The data sources used to inform this profile are: (a) stakeholder interviews conducted during the spring of 2012,29 (b) WAZ-related documents provided by the district and schools, and (c) data from a staff survey administered by AIR.30 Worcester did not participate in AIR’s Conditions for Learning (CFL) student survey but did administer its own student survey about school climate. Together, analysis of these data provides a comprehensive picture of the conditions in Worcester during the first year of WAZ implementation.
Worcester selected seven schools to participate in the initiative: the district’s two Level 4 schools (Chandler Elementary and Union Hill) and five innovation schools: Chandler Magnet, Goddard School of Science and Technology, Goddard Scholars Academy (an Innovation School located inside Sullivan Middle School), University Park Campus School (UPCS), and Woodland Academy. Three of the schools (Goddard School of Science and Technology, UPCS, and Woodland Academy) had been included in a proposal for a United Way Promise Neighborhood
29 These included interviews with district leaders, including the district coordinator, WAZ school principals, Wraparound Outreach Coordinators, and community partners or representatives of community organizations.30 The staff survey was administered to all teaching and nonteaching staff members in the school building except for the principal and staff person serving in the WAZ coordinator role.
American Institutes for Research Evaluation of the Wraparound Zones Initiative: Report Two—96

grant, which was in the planning stages when the district applied for the WAZ grant. According to the Worcester WAZ application, the grant would support the school as a hub for community improvement and development. Through this proposal, Worcester district, school, and community stakeholders began conceptualizing a plan for the delivery of wraparound supports. Although the district did not receive funding, participating schools were reportedly able to build on this work to develop their WAZ implementation plans. Table 24 presents demographic data for the seven participating schools, as well as averages across the seven schools and for Worcester overall.
American Institutes for Research Evaluation of the Wraparound Zones Initiative: Report Two—97

Table 24. Worcester WAZ School and District Demographics, 2011–12
Chandler Elementary
PK-6
Chandler Magnet
PK-6
Goddard Scholars
6-8
Goddard School of Science & Technolog
yPK-6
Union Hill
PK-6
University Park
Campus School
7-12
Woodland Academy
PK-6
Cross-WAZ School
Average
Worcester District
Accountability status Level 4 Level 3 Level 3 Level 3
Level 4 Level 1 Level 3 N/A Level 4
Enrollment 350 452 776 598 392 244 510 N/A 24,411Percentage low-income 95.4% 84.3% 84.1% 94.5% 99.2% 82.4% 97.6% 90.9% 72.1%Percentage English language learners 66.3% 73.9% 27.1% 56.4% 38.8% 15.2% 66.9% 49.5% 28.6%Percentage with disabilities 13.1% 18.1% 27.2% 20.2% 21.9% 10.7% 12.2% 19.1% 21.1%Percentage scoring proficient or higher on the English language arts section of the Massachusetts Comprehensive Assessment System (MCAS) 20.5% 24.5% 51.0% 26.9% 36.1% 82.6% 25.7% 39.5% 51.5%
American Institutes for ResearchEvaluation of the Wraparound Zones Initiative: Report Two—98

Chandler Elementary
PK-6
Chandler Magnet
PK-6
Goddard Scholars
6-8
Goddard School of Science & Technolog
yPK-6
Union Hill
PK-6
University Park
Campus School
7-12
Woodland Academy
PK-6
Cross-WAZ School
Average
Worcester District
Percentage scoring proficient or higher on mathematics section of MCAS 17.1% 15.0% 28.2% 22.3% 29.3% 62.5% 21.4% 26.3% 40.6%Percentage African American/black 14.6% 4.6% 15.2% 10.9% 16.6% 9.0% 8.2% 11.6% 13.6%Percentage Asian 7.7% 10.6% 12.6% 13.0% 5.4% 22.5% 7.3% 11.0% 8.1%Percentage Hispanic 66.3% 65.7% 40.2% 62.5% 57.7% 44.3% 76.1% 58.3% 38.4%Percentage white 8.9% 17.0% 28.7% 11.0% 11.5% 24.2% 6.1% 16.0% 36.4%Percentage other 0.0% 0.0% 0.6% 0.5% 0.5% 0.0% 0.2% 0.3% 3.6%
Source: Massachusetts Department of Elementary and Secondary Education.
American Institutes for ResearchEvaluation of the Wraparound Zones Initiative: Report Two—99

In the remainder of this profile, we describe findings related to the conditions that existed in Worcester during Year 1 of WAZ implementation. We first present overall findings that cut across WAZ Priority Improvement Areas or that reflect particularly strong themes that emerged in the Worcester data. We then present findings within each of the four WAZ Priority Improvement Areas.
Overview and Summary of Key Findings
Overall, data from the evaluation revealed the following three findings for Worcester, which describe the conditions and supports that existed in the district upon beginning implementation of its WAZ grant:
1. A significant amount of time and resources during Year 1 were devoted to planning, data gathering, and refinement and clarification of WAZ strategies.
2. Upon launching the WAZ grant, the district did not have a clear and consistent definition of the roles and responsibilities for the Wraparound Outreach Coordinator (WAC), which created some confusion and delayed progress in some cases.
3. Despite initial confusion around roles, hiring the WAC for each WAZ school was critical to advancing the WAZ priority areas in Worcester.
Two sections follow that further elaboration on these findings. In the first section, we present a brief summary of the evidence supporting each of the four findings listed above. In the second section, further analysis and data for each of the WAZ Priority Improvement Areas are presented.
Overall Finding 1: A significant amount of time and resources during Year 1 were devoted to planning, data gathering, and refinement and clarification of WAZ strategies.
Year 1 data showed that Worcester was making progress toward the strategies set forth in the 2011–12 implementation plan. However, given the number and diversity of WAZ schools, the district used the implementation plan as a starting point for defining WAZ in each school and as a district-wide initiative. As one interviewee reported, part of the goal was “seeing the big picture about what the wraparound initiative is all about.” Thus, in addition to implementing the various components of the WAZ plan, Worcester spent time planning, gathering data, and reconceptualizing or refining WAZ implementation strategies. As one interviewee reported, “We’re kind of planning as we go along. In the beginning, there was just the implementation plan. As we have been meeting, we’ve been able to identify the needs in each school as well as in the district, so we have adjusted to what those needs are.” Another described the process by stating, “It’s felt like an organic process. Which is okay for now. As time has progressed, we’ve gotten a little more specific direction as to where things should be going. It was unclear what was expected of us individually, as a team, as a district. It was clear it was okay to develop as we’re going; I hope by the end of the year it becomes more clear what’s expected. Part of the lack of clarity is because each school is different, has different needs, a different population. It’s hard to implement this blanket protocol for Worcester wraparound coordinators. But there are certain elements I think we’ve all tried to work out together.”
American Institutes for Research Evaluation of the Wraparound Zones Initiative: Report Two—100

To help facilitate this process, almost all of the WAZ schools reported gathering data early on as an initial assessment of need. At some schools, this assessment occurred prior to the start of the initiative as part of ongoing school improvement efforts, and in other schools, these data were gathered by the WAC after WAZ began. According to one WAC, “One of the first things I did, my first day, I pulled every piece of data I could find. I started doing a very heavy analysis, finding out where the needs are. Then I got that information out to the staff.” Family engagement was a priority for Worcester, and at the time of the interviews, most of these efforts focused on gathering data from parents to identify what their needs were. A number of schools also reported plans to survey teachers and students. In addition to new data collection efforts, the district and school coordinators reviewed extant data, including: students’ formative and summative test data, educational plans, behavior data, mobility, and data from students connected to the Department of Family and Children (DCF). It also was reported that the district and school coordinators engaged in community resource mapping to identify available community resources.
In addition to gathering data, the WACs and district coordinator met weekly as a team to discuss and plan for WAZ implementation. Part of their work included developing a professional development plan for the WACs and examining each school’s school improvement plan (i.e., the innovation or Level 4 redesign plan) to determine its alignment with the WAZ implementation plan. According to one interviewee, schools were working toward “having your own school vision being met and supported by the wraparound system that we’re trying to create in the school. We have to look at each school, what their vision is, what their implementation plan is, and how wraparound fits in.”
These findings suggest that while Worcester has accomplished a lot during the first year of implementation, the district may not have addressed each priority area in depth. According to one interviewee, “In terms of the implementation plan, we are slightly touching on almost all aspects of it, but it’s a very light touch.”
Overall Finding 2: Upon launching the WAZ grant, the district did not have a clear and consistent definition of the roles and responsibilities for the Wraparound Outreach Coordinator (WAC), which created some confusion and delayed progress in some cases.
Despite the fact that the WAC role was generally described as beneficial, several school and district staff members reported that there was a lack of a clear definition for the WAC position, which contributed to some confusion regarding the WAC’s roles and responsibilities. At both the district and school levels, some staff initially struggled to understand how the WACs would fit into the existing school structure. One principal described efforts to clarify that the WAC was not there to provide direct services, but to provide additional support and outreach to “help us support ourselves in the long term.” This principal noted, “It took a long time for me to see that as the ultimate goal of this position.” At another school, the WAC’s responsibilities were not clearly spelled out, and so instead of setting up systems and procedures to manage student needs, this WAC focused mostly on addressing and reacting to immediate crises. This coordinator reported, “Because my role wasn’t 100 percent clear in the beginning, I went with what was happening within the school, and this school is in crisis.”
American Institutes for Research Evaluation of the Wraparound Zones Initiative: Report Two—101

Not having a well-defined role for the WACs also meant that staff members did not have a clear understanding of how to best utilize their coordinator. According to one coordinator, “I feel like staff don’t necessarily don’t fully understand my role. And a lot of times I’m pulled in a direction I don’t want to go. For example, I don’t think it would be beneficial for me to be doing a whole lot of direct service. There are only so many hours in the day. I think that because there is a lot of crisis intervention going on, a lot of times I’m being pulled in that direction. It’s a matter of clarifying the role.” Another coordinator reported, “There are some teachers who look to me and understand what the role is, but a lot don’t. We’re still trying to figure that out, even at the district level.”
Not having a clear definition of the role also impacted progress for some schools where coordinators were spending more time taking reactive measures to address student needs rather than developing proactive strategies and systems to help alleviate or prevent some of the challenges students were experiencing. As one coordinator noted, “Initially, because there was a lot of confusion about my role, the program was very slowed down.”
In addition, the lack of clarity around the WAC role reportedly created some tension with the Child Study Department at the district level. This department was in charge of overseeing the school psychologists and adjustment counselors, and there was some uncertainty about how the WAC responsibilities would differ from the responsibilities of these staff members. For example, one interviewee stated that the department felt “very threatened by wraparound,” and that “they feel like we are redundant and that we are working in a way that overlaps with them.” One WAC described this challenge by stating, “I think one ongoing conversation is ‘how does this role differ from the school adjustment counselor?’ We have an incredibly competent and active school adjustment counselor who is knowledgeable about resources in community, and very connected to those.... Most of what she does is very similar to the wraparound concept, but I think it is somewhat different.” This WAC also described how wraparound would add to the existing model: “I think what wraparound is trying to do is similar: expand options, rethink how those relationships are established. The model now is we have those connections, we make the referral, and that’s it. I think that wraparound is trying to make a relationship that’s not just about making the referral; it’s about making the connection and working together. It’s not the handoff that exists now.”
Overall Finding 2: Despite initial confusion around roles, hiring the WAC for each WAZ school was critical to advancing the WAZ priority areas in Worcester.
Worcester hired an external WAC for each of the WAZ schools. Although there was initial confusion about this role, and differences in how WACs were utilized in each school, interview data revealed that having the additional staff member in the school was beneficial. WACs were viewed as valuable assets in helping schools to address students’ nonacademic needs and advancing the WAZ priority areas in Worcester. Just having the additional position in the school helped to promote better communication among staff members (“Before, we were all running around and not really communicating. The wraparound piece has been good for communication.”); allowed schools to devote more focused energy to important strategies that they previously did not have the capacity to address (“We never really took on the parent piece before this year; now we’re even thinking we could make a difference on a big scale. Wraparound has really helped to address the parent need.”); expanded the schools’ capacity to
American Institutes for Research Evaluation of the Wraparound Zones Initiative: Report Two—102

build relationships with families (“We’ve had consistent, really solid turnouts with networking and communicating. A lot of it has to do with that consistent, relentless effort on our wraparound zone coordinator.”); and helped schools to develop a more coordinated system for establishing or improving partnerships within the community (“With the Boys and Girls Club, we have always been trying to [develop a partnership], but my wraparound coordinator this year has really solidified that relationship and coordinated additional services that we didn’t have prior to the wraparound position.”
Having the WAC position also helped to reduce the workload of other staff members, allowing them to focus on specific activities that were also critical for overall school improvement. For example, one principal reported, “I felt like I was pulled in many different directions last year, and as a result of this position [the WAC] being allowed here, I’ve been able to focus more on instructional leadership.” At another school, the WAC stated, “I’m the point person for outside providers, groups, agencies. That had been the function of the guidance counselor/principal. Prior to me, the principal was the only contact; now I’m able to be the person who facilitates programming with outside providers.” Another noted, “To streamline that task [coordinating with community agencies] to me takes a huge chunk off of their shoulders.”
WAZ Priority Improvement Area 1—Climate and Culture
The WAZ Climate and Culture Priority Improvement Area includes school-level practices intended to ensure safety, effectively manage student behavior, teach and model strong social–emotional skills, establish positive relationships with families and the community, and cultivate a climate of high expectations and positive regard between leadership, staff, and students—all supported by district-level systems. To address this improvement area, Worcester’s 2011–12 WAZ plan laid out the following three strategies:
1. Distribute and collect the Worcester Public Schools' Student Survey about student experiences in the school.
2. Develop systems within each school that will aid the family support teams to strengthen student and family support strategies.
3. The action plan at each participating school will be resourced, bringing additional interventions to bear, using contractual service providers as appropriate and available.
Data collected from stakeholders during Year 1 revealed that Worcester had completed the first strategy and had made some progress toward the second and third strategies. The Worcester Public Schools’ Student Survey was administered in 2012 (Strategy 1); however, there was no evidence from stakeholder interviews describing whether or how these data had been used. WAZ school coordinators were working with existing family support teams at their schools as part of efforts to strengthen student and family support strategies (Strategy 2). In addition, school coordinators reported that reaching out to and developing more formal relationships with service providers in the community was a key part of their role (Strategy 3). This section describes three findings related to Priority Improvement Area 1: Climate and Culture, and the evidence that supports these findings.
American Institutes for Research Evaluation of the Wraparound Zones Initiative: Report Two—103

Climate and Culture Finding 1: Most WAZ schools reported a positive school climate and culture and were at varying stages of implementing strategies that targeted this priority area.
Many school staff members described a fairly positive school culture. For example, at one school, the principal stated, “We have a strong culture and climate at this point. I think we’re at a very strong point in regards to a successful learning environment that has been created as well as a safe learning environment.” Another principal reported that “kids feel safe and supported here.” At another school, the coordinator described the school’s culture as “intimate and warm.” Staff survey results further support the finding that most staff members had a positive perception of their school’s climate and culture (Table 25). Survey data revealed that across schools, approximately three fourths of staff members reported feeling that their schools were safe (78 percent) and had positive student–student relationships (77 percent). In addition, almost all staff members who completed the survey reported positive staff–student relationships (97 percent). There was some variation across schools in these data. For example, 100% of staff at UPCS agreed that their school was safe and that students respected one another, compared to much lower percentages at Chandler Elementary (70% and 59%) and Goddard Scholars (40%).
The findings from the staff survey were relatively consistent with findings from the Worcester Public Schools Student Survey, which found that that majority of 4th- to 12th-grade students in the WAZ schools agreed with items indicating that their schools were safe (83 percent) and that they felt respected by other students in the school (72 percent). However, 76 percent of students reported agreement with “teachers at my school treat all students with respect,” which was less than the percentage of staff who indicated on the staff survey that “adults in my school are caring or respectful toward their students” (97 percent). This discrepancy suggests that more work could be done to improve students’ relationships with each other and school staff members.
American Institutes for Research Evaluation of the Wraparound Zones Initiative: Report Two—104

Table 25. Staff Members’ Perceptions of School Climate
Staff Members Who Agree or Strongly
Agree
Chandler Elementary (n = 32–33)
Chandler Magnet(n = 41)
Goddard Scholars (n = 4–5)
Goddard Science & Technical (n = 38–39)
Union Hill
(n = 22)
University Park
(n = 14)
Woodland Academy (n = 34)
Worcester WAZ Overall(N = 190–192)
Their school is safe. 69.7% 78.0% 40.0% 76.9% 81.8% 100.0% 82.4% 78.1%Students are respectful and supportive of one another. 59.4% 70.7% 40.0% 81.6% 81.8% 100.0% 91.2% 77.4%Adults in the school are caring and respectful toward students. 93.8% 95.1% 100.0% 97.4% 100.0% 92.9% 100.0% 96.8%
American Institutes for ResearchEvaluation of the Wraparound Zones Initiative: Report Two—105

Climate and Culture Finding 2: All WAZ schools were implementing strategies related to the management of student behavior, including Positive Behavioral Interventions and Supports (PBIS), a strategy which had been implemented prior to WAZ.
Worcester’s implementation of PBIS predates WAZ, with the program having been in the district for almost 10 years. Throughout that time, the program was not implemented district-wide, and schools could choose whether they wanted to participate. At the time of Year 1 data collection, PBIS was the primary behavior management strategy being used by five of the seven WAZ schools (all schools except Chandler Elementary and UPCS) to promote a safe and supportive school environment; however, the duration and level of implementation varied across schools. In some schools, PBIS seemed to be a significant component of the efforts to improve school climate and culture. For example, in one school, a staff member described PBIS as “a real strength of the school” and reported 97 percent fidelity. At another school, an interviewee stated, “There’s a huge pool of diligent, committed staff, a large committee committed to making it [PBIS] work.” On the other hand, in another school, it was reported that “teachers are well versed in PBIS, but their actions don’t always show that they’re using those strategies.” Although Chandler Elementary and UPCS were not implementing PBIS, they were implementing other strategies to address culture and climate. Through a partnership with the Center for Nonviolent Solutions, UPCS implemented a peace studies course and reported plans to develop a peer mediation program. At Chandler Elementary, a community-based team addressed school climate and culture, and it was reported that, unlike with PBIS, the approach was “not incentives driven.”
Survey data revealed that across schools, the majority of staff members had a positive perception of their school’s behavior management practices (Table 26). For example, across WAZ schools, 91 percent of staff members agreed that their school had clearly defined expectations for student behavior, 83 percent agreed that all staff members in their school taught expected student behaviors, and 81 percent agreed that behavior was effectively managed in non-classroom settings. However, relatively fewer staff members agreed that their school had clearly defined consequences for not meeting expected student behaviors (71 percent). These data suggest that the application of discipline or behavior management strategies may not have been consistent within schools, a challenge that could undermine each school’s efforts to improve climate and culture. Survey data also found that staff members wanted additional training and support on behavior management and discipline.
In some schools, percentages of staff reporting on various indicators of behavior management were considerably lower than the average. For example, at Goddard Scholars, 80 percent of staff (compared to 91 percent across all WAZ schools) agreed that their school had clearly defined expectations for student behavior; and only 60 percent agreed that their school had clearly defined consequences for not meeting expected student behaviors and that all staff members taught expected student behaviors (compared to 71 percent and 83 percent, respectively, across all WAZ schools). At Chandler Elementary School, only 63 percent of staff agreed that schoolwide procedures for behavior management were adequate for their classroom (compared to 77 percent or above at all other WAZ schools).
American Institutes for Research Evaluation of the Wraparound Zones Initiative: Report Two—106

Table 26. Staff Members’ Perceptions of Schoolwide Procedures for Behavior Management
Staff Members Who Agree or Strongly Agree
Chandler Elementary
(n = 32)
Chandler Magnet (n = 39)
Goddard Scholars
(n = 5)
Goddard Science & Technical (n = 38–39)
Union Hill
(n = 21)
University Park
(n = 14)
Woodland Academy (n = 32)
Worcester WAZ Overall (N = 185–186)
Their school has clearly defined behavior expectations. 87.6% 92.3% 80.0% 92.3% 90.5% 85.7% 100.0% 91.4%Their school has clearly defined consequences for not meeting expected student behaviors. 65.6% 69.2% 60.0% 71.1% 85.7% 78.6% 69.0% 71.4%Schoolwide procedures for behavior management are adequate for their classroom. 62.5% 79.4% 80.0% 76.9% 85.7% 92.8% 81.2% 78.0%All staff members in their school teach expected student behaviors. 78.1% 79.4% 60.0% 77.0% 85.7% 100.0% 90.6% 82.8%All staff members in their school model expected student behaviors. 87.5% 82.0% 80.0% 87.1% 90.5% 100.0% 81.3% 86.6%
American Institutes for ResearchEvaluation of the Wraparound Zones Initiative: Report Two—107

Staff Members Who Agree or Strongly Agree
Chandler Elementary
(n = 32)
Chandler Magnet (n = 39)
Goddard Scholars
(n = 5)
Goddard Science & Technical (n = 38–39)
Union Hill
(n = 21)
University Park
(n = 14)
Woodland Academy (n = 32)
Worcester WAZ Overall (N = 185–186)
All staff members in their school positively reinforce expected student behaviors. 84.4% 74.4% 80.0% 84.6% 95.2% 92.8% 84.4% 84.4%Their school has formal strategies for informing families about expected student behavior. 75.1% 82.1% 80.0% 84.6% 90.5% 100.0% 90.3% 85.4%Schoolwide expected behaviors apply to nonclassroom settings. 96.9% 92.3% 80.0% 89.5% 95.3% 100.0% 90.6% 93.0%Behavior is effectively managed in nonclassroom settings. 75.0% 82.1% 80.0% 69.2% 85.8% 100.0% 84.4% 80.6%
American Institutes for ResearchEvaluation of the Wraparound Zones Initiative: Report Two—108

Climate and Culture Finding 3: Parent or family engagement had been a longstanding challenge and was viewed as a priority for WAZ. Efforts to address this issue were underway in all of the WAZ schools.
In all of the WAZ schools, parent or family engagement was viewed as a priority, and schools were working on identifying how they could best support families and increase parent engagement. As part of their efforts, staff members at all schools reported administering or planning to administer a parent survey to gather data about the needs of parents and families or their perceptions about the climate and culture of the school. Schools were at different stages of gathering and using these data, but they were hoping to create a more welcoming environment for families. According to one principal, “We are trying to get parents to feel comfortable coming into the school and using the facilities that we have.” Surveys identified a number of needs, including translation services, GED and ESL classes, and childcare; as a result, some schools have begun to meet these needs. In addition, both Goddard Scholars Academy (Sullivan) and UPCS reported plans to start a parent–family academy that would provide workshops on topics such as fuel assistance; Women, Infants, and Children (WIC) assistance; and parenting techniques.
In addition to the surveys, school coordinators reported conducting informal check-ins with parents as a means of building relationships, following up with them about their child, and informing them about upcoming school activities. For example, one school coordinator stated, “I’ll go into the gym and introduce myself to parents at busy times. I’ll try to inform them of what’s going on, whether it be ESL class or GED or the fact that we’re offering childcare for those. Trying to make them aware, and in the process I’m introducing myself. Letting them know of my role and that they can communicate with me.” Another reported, “I can’t speak enough to that 5-second face time during dismissal. There are little things I might miss, so checking in was the way that everything was done—a very informal process.”
Interview data suggested that schools were seeing some success in their efforts to engage parents. One interviewee described past challenges with parent engagement, then spoke about the positive changes observed at the school: “I think that before, when the school was in restructuring, it was very closed. Parents weren’t welcome, and they didn’t feel like they had a place in the school community. I think that’s changed very much. I think that they feel welcome here, and I think that that’s a big part of having them feel comfortable enough to access services because before they knew they wouldn’t get any help.” Another said, “We’ve built a really trusting relationship with our families. We have a stronger home–school connection now. We have an active PTO with a lengthy number of parent volunteers that work every day in the building.”
WAZ Priority Improvement Area 2—Identifying and Addressing Student Needs
The WAZ Identifying and Addressing Student Needs Priority Improvement Area includes school-level practices intended to assess the well-being of all students; effectively implement policies or programs to address the universal needs of students; establish structures and systems to create, monitor and adapt success plans for students requiring targeted assistance; and provide the necessary training and support to ensure that staff members can effectively identify and address student needs—all supported by district-level systems. To address this improvement area, Worcester’s 2011–12 WAZ plan laid out the following four strategies:
1. Hire WACs for each Innovation School and Level 4 School.
American Institutes for Research Evaluation of the Wraparound Zones Initiative: Report Two—109

2. Develop a common system of case management across all WAZ schools supporting students and families while developing a system of aligned work with the school's student and family support team.
3. Identify a process of establishing the health–wellness needs of students and families and develop targeted intervention plans using data provided by the student support process (SSP) and the student and family support teams.
4. Support the family–community approach to the student profile by identifying community partners as resources in supporting the targeted needs of the student, families, and schools.
Data collected during Year 1 revealed that Worcester had addressed, or had started to address, all of the strategies. Each of the WAZ schools had hired a WAC (Strategy 1). At some schools, the WAC became a part of the school’s SSP or the work was reportedly aligned with that of the student and family support teams. Individual schools had developed processes for supporting students and their families, but the district was still working to identify commonalities across schools and develop common system for case management (Strategy 2). Although there was some evidence that WACs were using data from the SSP and student and family support teams to inform their work with students, these strategies were not consistent across schools (Strategy 3). Finally, at all schools, identifying appropriate resources and connecting families to the community was identified as a priority, and school coordinators were strengthening existing relationships and establishing new ones to support the family–community approach (Strategy 4). This section describes two findings related to Priority Improvement Area 2: Identifying and Addressing Student Needs, and the evidence that supports these findings.
Identifying and Addressing Student Needs Finding 1: Most schools had an existing process for identifying and addressing student needs, and WAZ helped to enhance and streamline the process.
Year 1 data revealed that all schools had an existing, team-based process in place to identify and address student needs (e.g., SSP and student and family support teams). In general, the referral began at the classroom level, where teachers identified students who were in need of services and referred these students to the adjustment counselor. Students were then discussed during the SSP meeting, where a team of school staff members would confer about the students’ challenges and identify the appropriate intervention to meet their needs. SSP staff often included school adjustment counselors, the school psychologist, a special education representative, and teachers.
Through WAZ, the WACs were integrated into the existing system. For example, one principal described the WAC as “the gatekeeper of our SSP process.” At some schools, the WAC became a part of the family support team, and in other schools, wraparound evolved into its own team. In addition, the coordinators played a significant role in connecting students and families to external community resources. Interview data suggested that having the WAC afforded schools the opportunity to enhance or streamline existing processes. In some cases, these efforts were intentional and planned, and in other instances, WACs began to make changes in response to specific needs they identified as they got more involved in the work. For example, at one school, the WAC reported realizing, upon starting the position, that the school did not have a sense of exactly where students were in terms of their needs. Using quantitative (student-record and demographic data) and qualitative data (conversations with teachers and with the family support team), the WAC developed a system to identify students who may be at risk.
American Institutes for Research Evaluation of the Wraparound Zones Initiative: Report Two—110
In most cases, there was no comprehensive system in place to document and track student data, and WACs played an integral role in helping to develop such systems. One WAC reported, “We wanted to address the social, emotional, and behavioral needs of students in a cohesive way. And there was never really anyone who could document that until my position was created.” At another school, it was reported that they “identified that one major gap we had was communication, and specifically, tracking interventions we’re doing with students. We realized that even the counselors are duplicating efforts. The actual counseling isn’t captured anywhere. So we developed a comprehensive tracking system that now has every student in our building, tier 1, 2, and 3, covered.”
Identifying and Addressing Student Needs Finding 2: There was a need for more consistent follow-up after students were referred for services.
Although WAZ schools had processes in place to refer students in need of support, there was a need for more structured procedures to follow up with students to track the interventions they received and their overall progress. Most follow-up efforts were informal, and it was unclear to what extent information was communicated back to teachers or other school staff members who worked with the student. In some cases, the WAC was responsible for following up on student progress, but several reported challenges. One interviewee reported on following up with parents: “Right now, what’s going is that I schedule follow-up meetings with parents. There has not been a family yet where I have been able to close the loop. But, the families I meet with, I try to check in with every week or every other week.” In addition to following up with parents, WACs reported following up with community agencies to which students had been referred. However, there was no apparent system in place to facilitate this process. One interviewee reported, “What happens too often is that you have a child who’s struggling in those domains. What happens is that the communication loop fails. If I send out a kid for therapy, we haven’t been good about following through.”
Despite these challenges, schools were trying to implement an internal, more systematic approach to following up with students, and the WACs were taking the lead in developing the approach. For example, one coordinator stated, “There is a form I’ve developed for wraparound support meetings. Whatever the issue may be is presented, the person identified to follow through, whatever action is necessary, the follow up is planned; they’re brought up again at another meeting.”
Staff survey data also supported this finding. Although 91 percent of respondents reported that they followed a formal process for sharing concerns about students in need of additional support, relatively fewer respondents had positive perceptions of the steps that occurred after identifying a student as needing additional support (see Table 27). Specifically, fewer staff members reported that they would receive follow-up communication about the steps being taken to address the student’s needs (70 percent), or that they would receive the information and tools necessary to provide services (76 percent). These percentages were especially low at Goddard Scholars (40 and 60 percent, respectively). Thus, when the WAC or counselor was following up with a student’s family or with a community agency, a staff member who made the initial referral might not always be informed about what was occurring with the student outside of the classroom. The one exception was UPCS, where over 92 percent of staff reported that they would receive follow-up communication and information.
American Institutes for Research Evaluation of the Wraparound Zones Initiative: Report Two—111

Table 27. Staff Members’ Perceptions of Procedures for Identifying and Addressing Student Needs
Staff Members’ Reports
Chandler Elementary
(n = 27)
Chandler Magnet
(n = 34–35)
Goddard Scholars (n = 4–5)
Goddard Science & Technical (n = 36–37)
Union Hill (n = 18–20)
University Park
(n = 12–13)
Woodland Academy
(n = 29–31)
Worcester WAZ Overall (N = 168–172)
Reports of’ “Likely” or “Very Likely” Actions Upon Identifying a Student With Nonacademic NeedsThe staff member would follow a systematic process for referral. 96.2% 85.7% 100.0% 88.9% 90.0% 84.7% 96.7% 91.3%The student would receive services in a timely manner. 74.1% 70.6% 80.0% 78.3% 75.0% 92.3% 83.9% 78.4%The services that the student receives would effectively address his or her needs. 85.2% 70.6% 40.0% 81.0% 80.0% 92.3% 83.9% 79.4%The staff member would receive follow-up about the steps being taken to address the student’s needs. 66.7% 65.7% 40.0% 70.2% 68.5% 92.4% 74.2% 70.1%The staff member would receive the information and tools necessary to provide services. 66.7% 71.4% 60.0% 80.6% 68.5% 92.3% 83.9% 75.9%
American Institutes for ResearchEvaluation of the Wraparound Zones Initiative: Report Two—112

WAZ Priority Improvement Area 3—Community Coalitions
The WAZ Community Coalition Priority Improvement Area includes school-level practices intended to utilize a system to take stock of and access internal and external resources and supports, establish and coordinate partnerships to address student needs that cannot be met with internal resources, monitor the effectiveness of those partnerships and make changes where necessary, and convene internal and external partners and stakeholders to share information, collectively problem-solve, and collaborate on improvement efforts—all supported by district-level systems. To address this Improvement Area, Worcester’s 2011–12 WAZ plan laid out the following four strategies:
1. Each school will identify existing community resources and agencies that support student and family needs and the school vision that exist in proximity to the school’s location.
2. Formalize school partnerships through a memorandum of understanding (MOU) that details agency roles, functions, and responsibilities.
3. Develop an ongoing plan to identify new community partners to support student, family, and schoolwide needs.
4. Each school will use the Houghton Mifflin Harcourt (HMH) Pinpoint system to identify the range of services needed to support a two-way system of communication between the school and community partners.
Data collected from stakeholders during Year 1 revealed that Worcester had begun to address all four of these strategies. Each school was identifying and building relationships with community partners (Strategies 1–3). Worcester was in the beginning stages of implementing the HMH Pinpoint system, a student information management system intended to facilitate more systematic data collection and management across schools and serve as a portal for connecting key stakeholders (e.g., teachers, parents, and community agencies) with the work being done with students. At the time of data collection, the HMH system was not in place, and there were no accounts of how it would be used to support school–community partnerships. This section describes two findings related to Priority Improvement Area 3: Community Coalitions, and the evidence that supports these findings.
Community Coalitions Finding 1: During Year 1, Worcester continued pre-WAZ efforts to develop and strengthen community–school partnerships.
Prior to the receipt of WAZ funding, developing effective partnerships with community agencies had been identified as a priority in Worcester, and work was already underway to achieve this goal. For example, the district’s Level 4 Redesign Plan had identified “creating and sustaining effective partnerships” as one of its strategic priorities. The district was therefore already planning and engaging in a mapping of school and community resources and services as part of its Level 4 school redesign process. For example, Union Hill, one of the two Level 4 WAZ schools, had recently undergone a mapping process to examine “key areas linked to student achievement across the domains of education, health, and family” as well as to make linkages to service providers and identify gaps in capacity. The mapping process was also a key component of the Promise Neighborhood grant planning, which involved three of the WAZ innovation
American Institutes for Research Evaluation of the Wraparound Zones Initiative: Report Two—113

schools. Therefore, Worcester was fairly well positioned to use these prior experiences to inform WAZ strategies.
All seven of the WAZ schools had existing, mostly informal, relationships with community agencies. For example, Big Brother Big Sister provided mentoring for students. A local family health center worked with schools to respond to student and family medical needs. TheUnited Way provided a number of different services such as providing students with uniforms, and offering a program for girls in grades 6-8 focused on communication, healthy/unhealthy relationships, and self-defense.
Schools were working to strengthen existing partnerships. For example, one interviewee reported that the MOU with Family Health was in the process of being redone so that services would be available for students and families in the neighborhood prior to enrollment. Another stated, “We are in the process of formalizing some strong community partnerships that we have, but it’s a bit inconsistent.” WACs were implementing school-based activities to help learn more about and build connections within the community. For example, one school held a Wraparound Day to allow families an opportunity to learn more about available community resources. The school invited community agencies within close proximity of the school, including those that represented housing, the local family health center, and the Salvation Army. This event reportedly helped the WAC begin to develop new relationships within the community. Another school reported plans to hold a similar event (a resource fair) that would include organizations to address the needs of all students, not just those identified as being at risk.
Community Coalitions Finding 2: During Year 1, Worcester made efforts to be more strategic about partnerships by establishing relationships with agencies that met specific needs at each school and by providing district-level support to the WACs for their community partnership work.
In order to create more sustainable partnerships, Worcester made efforts to be purposeful and selective about the external agencies that schools were choosing to partner with. There was evidence that schools were identifying gaps in services provided and using data to determine what types of partnerships would best address student needs. For example, one staff member stated, “I think we had some pretty solid connections in the community. We’ve also really looked in the mirror and tried to figure out what the holes are before we began this process.... It was about growing a system. And in order to do that, you had to look at what was missing.” At another school, an interviewee reported, “Hispanic males. If you look at our data, those are the kids that we are just not reaching. We’ve created a strategic partnership to address those. We’re still developing partnerships based on need. For example, we certainly run a safe building, but students are struggling with conflict resolution. So we’re developing a partnership with Center for Nonviolent Solutions to help train students in the conflict-resolution process.” School staff also spoke about accountability and increasing efforts to identify and work with the agencies that were most effective. For example, one coordinator stated, “There are agencies, but I don’t use them all. I use the ones that are most helpful, and the ones that do what they say they’re going to do. We’re going to work on contracts so we can hold them accountable.” Another interviewee reported, “It’s not just cataloguing those resources, but evaluating them in their efficacy and figuring out which resources are most efficient in helping kids, figuring out which do a better job than others. This wraparound initiative gives us an opportunity to rank-order them.”
American Institutes for Research Evaluation of the Wraparound Zones Initiative: Report Two—114

The extent to which schools were implementing this more strategic approach varied, and there was a need for a more systematic process for assessing the effectiveness of external partners and aligning resources with the specific needs of the schools and district. Some support was provided during weekly meetings the WACs had with the district coordinator. These meetings included professional development, an opportunity to learn about available community resources, and sharing of strategies for connecting with community-based agencies. For example, during one meeting, the YMCA spoke with the group about strategies for developing after-school programs for students. At another meeting, the Department of Children and Families (DCF) spoke with the group about new initiatives for homeless and foster-care children, and children with high mobility. WACs also reportedly benefitted from existing district resources, such as the parent guide to community services published by the Worcester Community Connections Coalition, and a quarterly convening of community agencies held by the WPS Child Study Department.
WAZ Priority Improvement Area 4—District Systems of Support
An important goal of the WAZ initiative is to expand and enhance district-wide systems to support practices related to improving climate and culture, identifying and addressing student needs, and sustaining a community coalition. To address this, Worcester included the following four strategies in its 2011–12 WAZ plan:
1. Use district leadership to monitor the delivery service and wraparound zone project effectiveness of schools’ efforts to connect students and families to wraparound support services.
2. Implement the HMH Pinpoint system.
3. Create a professional development plan to support WAC implementation of the HMH Pinpoint system.
4. Develop a process with district-level leadership for identification of community-based resources within the wraparound zone catchment area.
Data collected during Year 1 revealed that Worcester had begun to implement one of the strategies set forth in the plan for district systems of support. The district coordinator played an active role in efforts to identify community resources that could serve as partners for the schools and the district (Strategy 4). The school coordinators and district coordinator met regularly and during these meetings, they discussed potential community-based resources. There was no mention of a specific strategy for monitoring the delivery of services (Strategy 1), , but schools were connecting students and families to wraparound support services. The district was beginning implementation of the HMH Pinpoint system (Strategy 2). The district and schools had engaged in ongoing discussions about how they wanted this system to function, but the system had not yet been installed, and as a result, there was no mention of a professional development plan to support WACs in their implementation of the system (Strategy 3). This section describes two findings related to Priority Improvement Area 4: District Systems of Support, and the evidence that supports these findings.
American Institutes for Research Evaluation of the Wraparound Zones Initiative: Report Two—115
District Systems of Support Finding 1: The district coordinator was identified as a valuable resource by school leaders and coordinators. Under his leadership, the district had helped to facilitate communication and collaboration across the seven WAZ schools.
Worcester used WAZ funds to support a person in the district coordinator position who played a key role in supporting WAZ implementation. The coordinator had a long history of working with the school system in Worcester, and who, prior to taking this position, had been a principal at one of the WAZ schools. Principals and school coordinators spoke favorably about his efforts. For example, one coordinator described the district coordinator as being “extremely supportive of our development” and added that “it’s been great to know that I have that support at that level; anything I need, he’ll try his hardest to get it.” Others described him as “very supportive” and “very good at communication.” One interviewee explained, “He’s [the district coordinator] been able to establish good relationships with people in the district who aren’t familiar with this [WAZ]. A big part of that was Child Study and being able to work collaboratively with them.” The district coordinator’s existing relationships within the community was also identified as a positive. For example, one community partner reported, “That the district is committed to having a wraparound coordinator is huge. With him in particular it’s huge because there’s a lot of trust in the agencies with him.”
Part of the district coordinator’s role involved promoting communication and collaboration across the seven schools. These efforts included holding weekly meetings with the WAZ school coordinators, and sending newsletters and ongoing emails to keep all staff informed of district and state WAZ activities. Given the great amount of variation across schools (i.e., magnet schools, innovation, Level 4, and college prep), this was important in helping to develop a level of cohesiveness across the WAZ schools. Weekly meetings provided an opportunity for coordinators to explore their differences while also examining their commonalities and working to develop a common languages and practices across schools, where possible. The weekly meetings were also used to provide coordinators with professional development opportunities to strengthen their WAZ work in the schools.
District Systems of Support Finding 2: Perceptions of district-level support beyond that of the district coordinator were mixed.
Perceptions of support from other district leaders were mixed. In describing district support, one interviewee commented, “I think among my supervisor [WAZ district coordinator] and other district leaders, there is still a whole lot of excitement around wraparound and what it can be. There’s still a lot of flexibility and understanding that it’s not going to look the same in every school, and that that level of understanding has been helpful to us.” Another identified the Chief Academic Officer as a source of support and stated, “From the district, the strength has been support in allowing this to develop. There is not pressure to show results before we’ve figured out how we’re going to do our work. So that’s been helpful.” Another interviewee described the district’s visible support of efforts to build relationships with community agencies. According to this interviewee, “The district over the past two years, under Superintendent Boone, has worked toward getting community agencies aligned and clear on the goals of Worcester Public Schools. There have been two large days or workshops that the district gets all these organizations together.”
American Institutes for Research Evaluation of the Wraparound Zones Initiative: Report Two—116

In addition, despite initial concerns about tension regarding the role of the WAC in relation to adjustment counselors, one interviewee reported receiving support from the Child Study Department, through invitations to professional development workshops and sharing of documents. The Child Study Department also served as a valuable resource for WACs because it held the quarterly meetings that brought numerous community agencies together to discuss their work throughout the district.
Others felt that more district support for WAZ was needed. For example, one interviewee reported a need for more district engagement, particularly in terms of marketing the initiative to ensure that all district leaders had a clear understanding of it. This interviewee stated, “I think it would be great if a few of the other district leaders understood and were able to articulate the vision of what these schools are doing, and they’re not just doing it because they have a grant to be doing it, but they’re doing it because these schools will feed recommendations or some systemic ideas to the whole system.” Another interviewee commented, “I think people want this to happen, but I don’t feel like the district really puts a lot of tools into implementing it.” Finally, a community partner cited a “lack of trust” and “bureaucracy” within the district as a hindrance to developing effective school and community partnerships.
Conclusion
During the 2011–12 school year, Worcester initiated its WAZ implementation plan. The district selected seven fairly diverse schools (five innovation schools and two Level 4 schools) that had demonstrated a strong commitment to addressing students’ nonacademic needs in order to promote student success. Although Year 1 was an implementation year for Worcester, the diversity across schools warranted additional planning to help ensure that the district and schools were working toward a common vision while still meeting the unique needs of each school. Part of this process included clearly defining the role of the WAC. As the WACs established their identity in the schools, they also emerged as being critical to the implementation and advancement of WAZ strategies. Regarding the four Priority Improvement Areas, data revealed that Worcester made progress toward most of the strategies put forth in the implementation plan. Each school was implementing strategies to improve school climate and culture (Priority Improvement Area 1). The WAC role was integrated into existing systems for identifying and addressing student needs, and data suggested that the WACs helped to enhance these processes (Priority Improvement Area 2). In addition, establishing effective school–community partnerships was a priority, and the WACs at each school became the primary liaison between the school and external agencies. The school and district coordinators also worked as a team to identify community resources (Priority Improvement Area 3). Finally, although perceptions of district support were mixed, the district coordinator was consistently identified as a strong source of support who facilitated communication between the district and schools. The district demonstrated support through investment in the HMH student information management system. Among other things, this system will provide a mechanism through which the district can better monitor both academic and nonacademic supports (Priority Improvement Area 4).
American Institutes for Research Evaluation of the Wraparound Zones Initiative: Report Two—117

IV. ConclusionThis report’s findings can help ESE, school districts, individual schools, and other stakeholders understand conditions and supports that existed in WAZ districts during Year 1, and begin to think about the implications that these conditions might have for progress and sustainability of the grant during Years 2, 3 and beyond. The findings revealed several strengths that districts and schools can build upon as they progress through their WAZ grant. However, findings also revealed several challenges, some of which were barriers to progress during Year 1, and others that were subtle indicators that long-term sustainability could potentially be difficult to achieve.
In terms of strengths, data gathered during Year 1 demonstrated strong buy-in across all stakeholders for the purpose and goals of WAZ. Staff survey data showed that the majority of school staff felt that WAZ-related topics were “important” or “very important” to student success, and interview data included countless comments regarding the passion, commitment, and support that stakeholders at all levels were exhibiting toward WAZ. This strong buy-in could in large part be attributed to the fact that the WAZ districts were all finding ways to connect WAZ to other, related initiatives. This included initiatives focused on social–emotional learning, school–community partnerships, tiered referral and intervention systems, and family engagement. In addition, all of the WAZ districts, and many of the WAZ schools, were in Level 4 accountability status and had already included an emphasis on social–emotional needs as a component of their turnaround and improvement plans. The connections that district and school leaders made between social–emotional support and academic success were instrumental for communicating and gaining widespread support for the importance of WAZ.
On the other hand, districts and schools also faced challenges during their first year of implementing WAZ. For example, all of the WAZ districts and schools served populations of students and families with very high needs. Issues such as poverty, homelessness, transience, and crime were pervasive in the communities that the WAZ schools served. Many family members, and sometimes students, had poor English language skills and lacked access to adequate transportation. Interviewees reported ongoing challenges in communicating with families, engaging families in the school community, and ensuring that families were able to access needed services in the school and broader community. Interviewees also described school climates in which student behavior was disrespectful, and disruptive, and staff morale was low. These challenges were all compounded by the fact that many staff in the WAZ schools lacked sufficient experience, knowledge, and training on how to address the combination of these substantial needs.
In the first year, all districts and schools moved forward with planning or implementing strategies intended to target these needs. However, progress varied, and some evidence foreshadowed potential future challenges with respect to the sustainability of these strategies. For example, although all of the WAZ schools were building and enhancing partnerships with community agencies, district progress in establishing an infrastructure to coordinate the development and maintenance of these relationships had for the most part yet to to develop at the end of Year 1. With the exception of one district that already had an organization in place, none of the WAZ districts followed through on their plans to establish this infrastructure during Year 1. Although this did not seem to impede progress in the development of school–community
American Institutes for Research Evaluation of the Wraparound Zones Initiative: Report Two—118
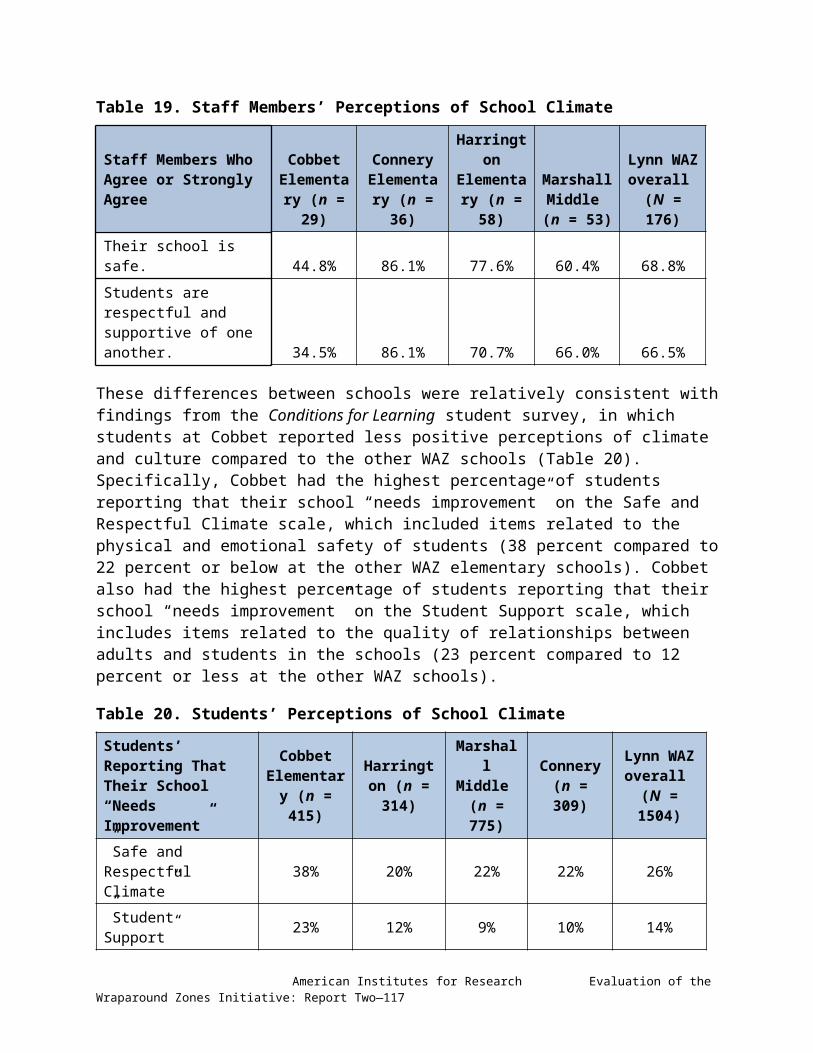
partnerships in Year 1, a continued lack of a district infrastructure in Years 2 and 3 could potentially compromise the sustainability of these partnerships.
Similarly, during Year 1, staff relied very heavily on people in district- and school-level WAZ staff positions to move the work forward. These included district and school wraparound coordinators who oversaw implementation of the WAZ plans and whose wide-ranging responsibilities included communicating with leaders, staff, and community members about WAZ; reviewing and analyzing relevant data; providing training on WAZ-related initiatives; managing processes for identifying and addressing student needs; and identifying and negotiating partnerships with community agencies. The extent to which these coordinators worked collaboratively with district and school leadership and staff around these responsibilities varied and will likely have a great impact on sustainability. In other words, districts and schools where coordinators were working with very active and engaged staff and leaders are likely to see success in sustaining these initiatives beyond the life of the grant, even if the coordinator positions can no longer be funded. On the other hand, districts and schools where coordinators were taking on much of this responsibility without the involvement of district and school staff may face greater challenges with sustainability. Evidence from Year 1 suggested that the WAZ-funded positions were critical for the planning and start-up phases of WAZ, but a gradual shift toward integrating these roles and responsibilities into the broader district and school staff will be important in Years 2 and 3.
AIR’s evaluation efforts are ongoing. Future reports will provide additional analyses of the interview, survey, and document data for each of the WAZ districts. Special emphasis will be placed on an analysis of how districts and schools progress and experience success with their WAZ grants in Year 2, and how they plan for sustainability in Year 3. AIR looks forward to producing meaningful results and recommendations that can effectively support district and school WAZ-related planning, implementation, sustainability, and replication.
American Institutes for Research Evaluation of the Wraparound Zones Initiative: Report Two—119

Appendix A: Research Questions, by Data Source
Research Questions
Data Sources
Doc
umen
t Rev
iew
s
Stak
ehol
der
Inte
rvie
ws
Tea
cher
Foc
us G
roup
s
Obs
erva
tions
of
Ext
ant D
ata
Ana
lysi
s
Stud
ent S
urve
y
Scho
ol S
taff
Sur
vey
Research Question Set A: Conditions and Supports. What are the district, school, and other conditions (e.g., school climate and culture) and supports that are in place at the beginning of the WAZ grants, and how are they facilitating or impeding planning and implementation?A1. What practices do the WAZ plans include?
A2. What initial assessment occurred at the district and school levels to inform planning and implementation? Were assets, capacities, and other resources assessed? What are students’ needs in the implementing schools, and to what extent are the WAZ plans a good fit for these needs?
A3. What policies/protocols are currently in place at the state, district, and school levels that support the WAZ initiative?
A4. What is the current awareness and understanding of WAZ and its theory of action among district and school staff, as well as community partners? For example, do stakeholders understand the connection between mental health and learning?
A5. How does the ESE support districts and schools in WAZ planning and implementation (e.g., planning grants, support, guidance, monitoring functions)?
A6. What types of external technical assistance do WAZ grantees request or need to support WAZ planning/implementation? What types of technical assistance needs have ESE and the WAZ technical assistance provider, School and Main Institute (SMI), identified for the districts and schools?
A7. What types of support does the WAZ technical assistance provider (SMI) provide to districts and schools in planning for and implementing the WAZ? What other WAZ-related technical assistance support do districts/schools receive? Does the technical assistance align with identified technical assistance needs of districts/schools? How does it facilitate planning and implementation?
American Institutes for Research Evaluation of the Wraparound Zones Initiative: Report Two—120

Research Questions
Data Sources
Doc
umen
t Rev
iew
s
Stak
ehol
der
Inte
rvie
ws
Tea
cher
Foc
us G
roup
s
Obs
erva
tions
of
Ext
ant D
ata
Ana
lysi
s
Stud
ent S
urve
y
Scho
ol S
taff
Sur
vey
A8. What is the role of the District Wraparound Coordinator in each district and to what extent are there similarities and differences in their roles across districts? What are their initial skills and experiences relative to WAZ and working in districts and schools? How are these coordinators securing resources, engaging stakeholders and the interagency coalition, communicating and collaborating within the district office as well as schools and service providers, and coordinating activities to ensure successful WAZ implementation?
A9. What is the role of the School Wraparound Coordinator in each school and to what extent are there similarities and differences in their roles across schools? What are their initial skills and experiences relative to WAZ and working in districts and schools? How are these coordinators ensuring that the appropriate resources and community services are deployed at the school level to promote positive school climate and the implementation of universal and targeted student supports? How are these coordinators interacting with the interagency coalitions and families?
A10. What roles do interagency coalitions and community partners have in WAZ planning and implementation? How are the interagency coalitions bringing together and facilitating coordination of the appropriate community partners to provide services in WAZ schools? What, if any, challenges do the interagency coalitions and community partners experience in supporting WAZ planning and implementation?
A11. How have families been involved in planning and early implementation of WAZ supports? What has supported or impeded their engagement?
A12. At the district level, what other factors contribute to WAZ planning and implementation? What is district leadership’s role (i.e., superintendent and other key leaders) and how is it best characterized (including its quality)? Others? Which resources are most necessary to support planning and implementation? What is the initial quality and strength of leadership and advocacy for the WAZ in districts?
American Institutes for Research Evaluation of the Wraparound Zones Initiative: Report Two—121

Research Questions
Data Sources
Doc
umen
t Rev
iew
s
Stak
ehol
der
Inte
rvie
ws
Tea
cher
Foc
us G
roup
s
Obs
erva
tions
of
Ext
ant D
ata
Ana
lysi
s
Stud
ent S
urve
y
Scho
ol S
taff
Sur
vey
A13. At the school level, what other factors contribute to WAZ planning and implementation? What is school leadership’s role and how is it best characterized (including its quality)? Staff’s role? Others? Which resources are most necessary to support planning and implementation? What is the initial quality and strength of leadership and advocacy for the WAZ in schools?
A14. Which conditions/supports are most important to facilitating planning and implementation? Why and how so?
A15. What are barriers to WAZ planning and implementation (in particular for the District and School Wraparound Coordinators)?
A16. What are key lessons learned as the WAZ in each district were/are planned and plans are revisited?
Research Question Set B: Early Evidence of Change. How are districts and schools progressing on early indicators of WAZ planning and implementation?B1. How have policies/procedures changed to support WAZ implementation?
B2. How much professional development and external technical assistance are WAZ grantees receiving, and in what areas (topics) are they receiving technical assistance?
B3. What types of systems for student support are WAZ schools implementing, or planning to implement as a result of the WAZ initiative and their plans?
B4. How are WAZ grantees using (or planning to use) data to screen and monitor student progress as a result of the WAZ initiative and their plans?
B5. How are the roles of community providers changing over the course of planning and implementation? Are they used more strategically and do they act more strategically? What types of services are they providing differently? How often are they meeting?
B6. How is the intersection of district and school factors contributing to or hindering WAZ planning and implementation? How are the roles of district and school leadership changing over the course of planning and implementation? In what ways are the roles or quality of leadership at the district and school levels seemingly contributing to or hindering WAZ planning and implementation? How so?
American Institutes for Research Evaluation of the Wraparound Zones Initiative: Report Two—122

Research Questions
Data Sources
Doc
umen
t Rev
iew
s
Stak
ehol
der
Inte
rvie
ws
Tea
cher
Foc
us G
roup
s
Obs
erva
tions
of
Ext
ant D
ata
Ana
lysi
s
Stud
ent S
urve
y
Scho
ol S
taff
Sur
vey
B7. Are there any state-level or ESE-related factors (e.g., state practices, policies, procedures) that are contributing to or impeding district and school progress toward WAZ implementation?
B8. Are districts and schools implementing WAZ with fidelity, based on their plans? If not, what are the changes and why have the changes occurred?
B9. What are key lessons learned as the WAZ in each district are implemented?
Research Question Set C: Outcomes. What are the outcomes associated with WAZ implementation?After receiving a WAZ implementation grant, is there evidence of:C1. Greater knowledge of WAZ and its theory of action among district and school staff as well as community partners?
C2. Increased interagency collaboration?
C3. Improved practices, policies, and procedures for the delivery of student supports?
C4. Greater coordination of service delivery for students and their families?
C5. Improved systems for assessment and monitoring of student progress and well-being?
C6. Increased use of programmatic evaluation data for continuous quality improvement?
C7. Greater financial efficiency (e.g., alignment of resources)? Likelihood of financial sustainability?
C8. Increased family involvement in the delivery of supports to students? How are they involved?
C9. Greater leadership and advocacy for the WAZ in districts and schools?
C10. Enhanced capacity for delivering student support systems to:Increase school and district staff knowledge of the functions and resources necessary to maintain WAZ supports?
Promote positive school climate, implement proactive systems for identifying student needs, and provide universal and targeted supports, over the long term at the school level?
Increase key community partner involvement in long-term relationships with WAZ schools? How are they involved?
American Institutes for Research Evaluation of the Wraparound Zones Initiative: Report Two—123

Research Questions
Data Sources
Doc
umen
t Rev
iew
s
Stak
ehol
der
Inte
rvie
ws
Tea
cher
Foc
us G
roup
s
Obs
erva
tions
of
Ext
ant D
ata
Ana
lysi
s
Stud
ent S
urve
y
Scho
ol S
taff
Sur
vey
C11. Barriers/challenges that inhibit the development of any of the above, C1-C10?
C12. Do stakeholders in WAZ schools experience improved perceptions of school climate after WAZ implementation?
C13. What student outcomes are associated with WAZ implementation? Specifically, compared to non-WAZ schools and controlling for selected background characteristics, do WAZ schools experience:Improved academic outcomes?
Improved attendance rates?
Improved promotion rates?
Improved graduation rates?
Lower dropout rates?
Lower suspension rates?
Fewer incidents of violence?
C14. In what ways is early evidence of change (Research Question Set B) associated with these outcomes?
C15. What are key lessons learned from our analysis of outcomes associated with the WAZ in each district?
Research Question Set D: Sustainability/Replication. Are WAZ sustainable at the district and school levels, and what supports or hinders (or will support/hinder) sustainability and replication in other districts and schools?D1. Do districts and schools have WAZ sustainability plans? At what point in WAZ planning/ implementation does sustainability planning begin? Do sustainability plans address the major challenges that individual schools/districts have experienced?
D2. What do key stakeholders identify as the biggest challenges to sustaining the WAZ supports after the Race to the Top funding has ended? In what ways have schools/districts prepared for these challenges?
D3. What resources from ESE support, or are needed to support, districts and schools in the implementation of integrated, comprehensive systems for student support, after WAZ funding ends? What should ESE do to support expansion of WAZ to other districts after Race to the Top funding ends?
American Institutes for Research Evaluation of the Wraparound Zones Initiative: Report Two—124

Research Questions
Data Sources
Doc
umen
t Rev
iew
s
Stak
ehol
der
Inte
rvie
ws
Tea
cher
Foc
us G
roup
s
Obs
erva
tions
of
Ext
ant D
ata
Ana
lysi
s
Stud
ent S
urve
y
Scho
ol S
taff
Sur
vey
D4. What aspects of WAZ do key stakeholders believe are sustainable? Is there evidence that non-WAZ schools in WAZ districts are implementing wraparound services during the program funding period? For example, in what ways are non-WAZ schools, in WAZ grantee districts, beginning to implement stronger student support delivery systems, focused on non-academic needs?
D5. What plans, funding, and infrastructure are present to continue interagency collaborations after WAZ funding ends?
D6. In what ways are families participating in development of district and school WAZ sustainability plans?
D7. What plans, funding, and infrastructure are present to ensure that the responsibilities and functions performed by the District and School Wraparound Coordinators continue after WAZ funding ends?
D8. What plans, funding, and infrastructure are present to ensure that professional development and technical assistance related to the delivery of integrated comprehensive student supports continue after WAZ funding ends? To ensure knowledge of WAZ is sustained?
D9. How will the quality and strength of leadership and advocacy for WAZ be sustained?
D10. What continuous quality improvement strategies are districts and schools implementing and planning to continue to sustain WAZ?
D11. How have barriers to WAZ planning, implementation, and sustainability/replication changed over time? How have districts and schools responded to these changing barriers?
D12. What are key lessons learned relative to WAZ replication and sustainability planning?
American Institutes for Research Evaluation of the Wraparound Zones Initiative: Report Two—125

Appendix B: 2011–12 Wraparound Zones Initiative Districts and SchoolsDistrict School Grade LevelFall River Carlton M. Viveiros Elementary School K–5Fall River John J. Doran Elementary School PK–6Fall River Matthew J. Kuss Middle School 6–8Holyoke Kelly Elementary School* K–8Holyoke Morgan Elementary School K–8Holyoke William R. Peck School K–8Lawrence Arlington Elementary School K–4Lawrence Arlington Middle School 5–8Lawrence Humanities & Leadership Development High School 9–12Lynn Cobbet Elementary* K–5Lynn E.J. Harrington School* PK–5Lynn Thurgood Marshall Middle School* 6–8Lynn William P. Connery* K–5Springfield Alfred G Zanetti School PK–8Springfield Brightwood School K–5Springfield Elias Brookings School PK–5Springfield Gerena School PK–5Springfield Homer Street School K–5Springfield White Street K–5Worcester Chandler Elementary Community School PK–6Worcester Chandler Magnet PK–6Worcester Goddard Academy 6–8Worcester Goddard School of Science and Technology PK–6Worcester Union Hill School PK–6Worcester University Park Campus School 7–12Worcester Woodland Academy PK–6
* Received a Year 1 WAZ planning grant—plans to apply for Year 2 implementation
American Institutes for Research Evaluation of the Wraparound Zones Initiative: Report Two—126

Appendix C: Sample Interview ProtocolPersonal Information/Background
I’d like to start by asking a couple of questions about your role and background.1. First, I’d like to ask about your background. How long have you been working in this school? In
this school district? Can you briefly describe your work—whether with the school or not—prior to becoming a School Wraparound Coordinator31? What previous skills and experiences do you have that makes this work a good fit for you? When and how did you first become involved with the wraparound initiative? (ask about planning if not mentioned)
2. What are your current coordinator responsibilities? Do you have responsibilities outside of this role? If so, can you briefly describe these and what percentage of your time you spend on these responsibilities?
School/District Context3. I realize that every school is unique in terms of its context, staff, students, and community. What
do you think are your school’s key strengths? Critical areas of need? In terms of: [Be sure to get information on both strengths and weaknesses]
a. School climate and culture
b. Delivery of non-academic supports related to students’ physical, mental, and social–emotional health
c. School staff
d. Students
e. The larger community (SES, community issues that may negatively impact students’ physical, social and emotional development)
f. Have these key strengths or critical areas of need changed since the planning/implementation of wraparound?
Wraparound Zones Initiative4. What role, if any, did you school have in applying for the wraparound grant?
5. Would you describe the wraparound strategies as new to the school, or do you believe they build on your school’s existing efforts to support students?
a. If new, how do you see wraparound connecting to existing improvement efforts? In what ways is it aligned?
b. If wraparound builds on existing efforts, how? (Probe: existing policies, partnerships)
6. Can you briefly describe the current status of wraparound planning/implementation at your school?
Probes:
31 AIR modified “school wraparound coordinator” using the appropriate terminology for the district (e.g., Student Support Coordinator in Fall River, Full Service Coordinator in Holyoke, Intensive Case Manager in Lawrence, School Site Coordinator in Springfield, and Wraparound Outreach Coordinator in Worcester). In Lynn, social workers are the school coordinator equivalent for 2011–12.
American Institutes for Research Evaluation of the Wraparound Zones Initiative: Report Two—127

a. Are any key aspects of wraparound still being planned?
b. Have you begun to implement a wraparound process? If currently implementing, when did implementation begin? What features are currently being implemented?
7. At this moment, what are your greatest priorities for planning/implementing the wraparound initiative in the district?
Can you describe what you think are the most important features of the wraparound initiative being [planned/ implemented] in this district? Why?
What school and student outcomes are you expecting will result from implementing wraparound in your district? (Interviewer should note if respondent mentions any of the key goals of the Wraparound initiative: to promote a positive school climate, implement proactive systems for identifying student needs, and provide universal and targeted supports)Listen for:
o Student academic outcomes
o Student socio-emotional outcomes
o Student engagement
o School climate
o Engaging in community partnerships
o Building school capacity
Wraparound Planning8. (Ask only if interviewee was involved in planning) Can you tell us about your school’s
wraparound planning process? Who was involved? (probe about key district and school roles)
What existing challenges were raised during the planning process? What existing strengths or supports were built into the planning for the school’s wraparound efforts?
9. Was there an initial assessment of student needs and/or capacities and resources for the wraparound initiative? If yes, how was this assessment conducted (formal/informal)? What did it include? Are there ongoing efforts to assess student needs?
Does the district help schools use data to determine student needs? How?
What types of student data are examined (e.g., MCAS, academic assessments, etc.)?
How frequently are student data examined to determine needs?
In what ways if any has this process changed as a result of wraparound?
10. [For districts that are in the planning phase: FOR LYNN ONLY] How will the school’s Wraparound Initiative meet the needs of students in your school?
a. Student Supports - What supports or services do you plan to have available for students? When? Which students will receive these supports (e.g., all students, a subgroup of students)? When? Note: Refer to student needs identified earlier]?
b. Identifying Student Needs - Is there a system in place? Assessments used? Specific data collection tools or database?
c. Staffing - Are there plans to hire new staff? Or will staff have new roles due to the initiative?
d. School Climate – Are any strategies being planned to address school climate
American Institutes for Research Evaluation of the Wraparound Zones Initiative: Report Two—128

Wraparound Implementation
Now AIR would like to learn more about how the Wraparound Zone Initiative is being implemented in your school [Note to Interviewer: With districts that are still planning, be sure to only refer to planning in the following set of questions.]
11. Could you describe this school’s process for connecting students with supports (i.e., from how students are identified for services to deciding what services the students should receive to connecting students with the appropriate service providers and follow-up )?
12. Could you describe your communications or interactions with other staff about wraparound?
With whom do you communicate/interact (at your school, from the district, which community-based service providers?
How often do you discuss wraparound and what types of topics do you discuss?
13. How are families involved in wraparound services?
How do you communicate with parents/families about wraparound?
Have there been any challenges or successes that you would like to share about parent involvement related to wraparound?
14. Who else from the school is involved in wraparound implementation? How so?
15. Can you describe the role of any external partners (e.g., community-based service providers, consultants), who are involved in the implementation of wraparound in this school?
Did these partnerships exist prior to the wraparound initiative or are they new?
How were these partnerships established? Did you play a role in the establishment of these partnerships?
How do you interact with these partners?
[for implementation districts} How do these partners support implementation?
Are there other agencies or organizations with which you would like to partner? Why?
16. Is there a formal district coalition that brings together agencies providing non-academic support services to students in this school? If yes, can you describe this coalition for us?
How has the coalition been involved in providing services to students?
Have there been any challenges associated with the coalition?
How do you interact with the coalition?
Wraparound Supports17. What resources (e.g., data systems, having a district or school coordinator in place) have been
most necessary to support the planning/implementation of the wraparound process in your school? Please describe any resources or support that you still need.
18. Do you receive or have you received support in planning/implementation of the wraparound initiative? If yes, please describe this support from:
a. School and Main
b. ESE?
c. Outside consultants
American Institutes for Research Evaluation of the Wraparound Zones Initiative: Report Two—129
d. How helpful is/was this support? How so?
19. Have you requested any professional development or external technical assistance for the planning or implementation of the wraparound initiative for your school? If yes,
Can you describe the type of professional development/technical assistance requested?
Has this need been addressed? How so?
20. What do you see as the primary role of the District Wraparound Coordinator? Do you feel supported by the District Wraparound Coordinator in your role as school coordinator? Why or why not?
21. How would you describe the quality and strength of district leadership related to wraparound?
Do you feel there is buy-in from district leadership? Why or why not?
Do you feel supported by district leadership in your role as coordinator? Why or why not?
22. How would you describe the quality and strength of school leadership for this initiative?
Do you feel there is buy-in from school leadership? Why or why not?
Do you feel supported by school leadership in your role as coordinator? Why or why not?
23. How would you characterize the level of staff knowledge about the wraparound initiative?
24. How would you characterize the level of school staff buy-in for this initiative? To what do you attribute the current level of buy-in?
25. Have you received any support in developing collaborative partnerships with organizations that provide wraparound services to students in your school? If yes, from whom have you received this support?
26. Are there any current policies or protocols that are hindering implementation of wraparound-related efforts? If yes, can you describe them?
Closing27. Are there any lessons that you have learned as you have planned and/or begun implementation? If
you could provide advice to another coordinator trying to implement a wraparound initiative in their school what would you tell them?
28. Is there anything else you would like to share about your experience or your school’s wraparound initiative that I have not already asked about?
American Institutes for Research Evaluation of the Wraparound Zones Initiative: Report Two—130

Appendix D: 2012 Massachusetts Conditions for Learning Surveys
American Institutes for Research Evaluation of the Wraparound Zones Initiative: Report Two—131

American Institutes for Research Evaluation of the Wraparound Zones Initiative: Report Two—132

American Institutes for Research Evaluation of the Wraparound Zones Initiative: Report Two—133

American Institutes for Research Evaluation of the Wraparound Zones Initiative: Report Two—134

American Institutes for Research Evaluation of the Wraparound Zones Initiative: Report Two—135

American Institutes for Research Evaluation of the Wraparound Zones Initiative: Report Two—136

American Institutes for Research Evaluation of the Wraparound Zones Initiative: Report Two—137

American Institutes for Research Evaluation of the Wraparound Zones Initiative: Report Two—138

American Institutes for Research Evaluation of the Wraparound Zones Initiative: Report Two—139

American Institutes for Research Evaluation of the Wraparound Zones Initiative: Report Two—140

Con
American Institutes for Research Evaluation of the Wraparound Zones Initiative: Report Two—141

American Institutes for Research Evaluation of the Wraparound Zones Initiative: Report Two—142

American Institutes for Research Evaluation of the Wraparound Zones Initiative: Report Two—143

Appendix E: Wraparound Zones Initiative Evaluation, School Staff SurveyQuestion Respondent
BACKGROUND: The following questions ask about your role and experience.
1 What is your primary role in this school? Select the answer that is most accurate.a. Regular education teacherb. Special education teacherc. English as a second language (ESL) teacherd. Assistant teacher/paraprofessionale. Specialist teacher (e.g., art, music, physical education)f. Administrator (e.g., assistant principal, dean)g. Academic specialist (e.g., literacy coach/specialist, math coach/specialist)h. Student support services (e.g., guidance counselor, health office or nurse, social worker)i. Related service provider (e.g., speech therapist, physical therapist, occupational therapist)j. Operational support services (food services, office staff, security, transportation)k. Other (please specify): _____________________________
ALL
2 Including the 2011–12 school year, how many years have you been teaching or working with students in Grades PreK–12? (Include years as a substitute or teacher-in-training; also include any partial school years as a full year.)
ALL
3 Including the 2011–12 school year, how many years have you been working in this school? (Include years as a substitute or teacher-in-training; also include any partial school years as a full year.)
ALL
4 Including the 2011–12 school year, how many years have you been working in this district? (Include years as a substitute or teacher-in-training; also include any partial school years as a full year.)
ALL
5 What student grades do you currently teach or serve? (Check all that apply.)a. Pre-K or K
ALL
American Institutes for ResearchEvaluation of the Wraparound Zones Initiative: Report Two—144

Question Respondent
b. Grade 1c. Grade 2d. Grade 3e. Grade 4f. Grade 5g. Grade 6h. Grade 7i. Grade 8j. Grade 9k. Grade 10l. Grade 11m. Grade 12n. Ungraded
SCHOOL CLIMATE: The questions in this section ask about how your school’s current climate and culture promote students’ positive social-emotional, physical, and intellectual development. These questions focus on different aspects of school climate, including school safety, relationships among students, relationships between staff and students, relationships among staff, and schoolwide procedures for managing student behavior.
6 How much do you agree with the following statements about your school? (Options: Strongly disagree, disagree, agree, strongly agree, I don’t know)
a. I worry about crime and violence in school.b. Students at the school are often bullied.c. Students at this school are often threatened.d. Students at this school are often teased or picked on.e. Students at this school are often bullied because of certain characteristics (for example, their race,
religion, weight, or sexual orientation).
ALL
American Institutes for ResearchEvaluation of the Wraparound Zones Initiative: Report Two—145

Question Respondent
7 How much do you agree with the following statements about student-student relationships in your school? (Options: Strongly disagree, disagree, agree, strongly agree, I don’t know)
Most students in this school:a. Do not really care about each other.b. Like to put others down.c. Do not get along together very well.d. Just look out for themselves.e. Treat each other with respect.f. Get into arguments when they disagree with people.g. Think it is ok to fight if someone insults them.h. Say mean things to other students when they think the other students deserve it.i. Try to work out their disagreements with other students by talking to them.
ALL
8 How much do you agree with the following statements about staff-student relationships in your school? (Options: Strongly disagree, disagree, agree, strongly agree, I don’t know)
Most adults in this school:a. Really care about every student.b. Acknowledge and pay attention to students.c. Are too busy to give students extra help.d. Listen to what students have to say.e. Want every student to do their best.f. Think that all students can be academically successful.g. Treat some students better than others.h. Treat every student with respect.
ALL
American Institutes for ResearchEvaluation of the Wraparound Zones Initiative: Report Two—146

Question Respondent
9 How much do you agree with the following statements about staff-staff relationships in your school? (Options: Strongly disagree, disagree, agree, strongly agree, I don’t know)
a. Staff members help and support each other.b. Staff members respect the professional competence of their teaching colleagues.c. Staff members accomplish their work with enthusiasm and pleasure.d. Staff members socialize with each other either during our outside of work.e. Administrative staff members are responsive to teacher and support staff needs.f. Staff members support each other to address challenges they experience in school.g. Faculty meetings are not productive.h. There is a small group of staff members who always oppose the majority in the school.i. Teachers and support staff have positive relationships with the school administration (principal,
assistant principal).j. Administrative staff listen to and support school staff suggestions.
ALL
10
How much do you agree with the following statements about schoolwide behavior management in your school? (Options: Strongly disagree, disagree, agree, strongly agree, I don’t know)
a. My school has defined a small number (3 to 5) of clearly stated and positively worded expectations for student behavior.
b. My school has clearly defined consequences for not meeting expected student behaviors.c. My school’s schoolwide procedures for managing behavior are adequate for my classroom.d. All staff in my school teach expected student behaviors.e. All staff in my school model expected student behaviors.f. All staff in my school positively reinforce (e.g., verbal acknowledgment, rewards) expected student
behaviors.g. My school has formal strategies for informing families about expected student behaviors at school
(e.g., written guidelines or handbooks sent home to all families).
ALL
American Institutes for ResearchEvaluation of the Wraparound Zones Initiative: Report Two—147

Question Respondent
h. Schoolwide expected student behaviors apply to non-classroom settings (e.g., hallways, cafeteria, playground, bus).
i. Behavior is effectively managed in non-classroom settings.
STUDENT SUPPORT: The questions in this section are about supporting student success. Some questions ask about your opinions and knowledge. Other questions ask about procedures in place at your school to support students. The questions refer to academic and non-academic supports. “Non-academic” supports address a student’s social-emotional, mental health and physical health needs, as well as basic needs such as food and shelter.
11
How important do you think each of the following is for student success in schools generally? (Options: not important, slightly important, important, very important, I don’t know)
a. A clear process for referring students for additional supportsb. A process for coordinating student support servicesc. Positive student mental healthd. Positive school climate (e.g., physical safety, students feel cared about, good staff-staff relationships)e. Positive behavioral interventions and supports f. Customizing the types and intensity of academic supports for students based on their different needsg. Customizing the types and intensity of non-academic supports for students based on their different
needsh. Using data to screen and monitor student progress in academic areas (e.g., grades, test scores)i. Using data to screen and monitor student progress in non-academic areas (e.g., discipline records,
attendance records, student needs survey, mental health screening)
ALL
12
How knowledgeable are you about each of the following concepts generally? (Options: Not knowledgeable, slightly knowledgeable, knowledgeable, very knowledgeable)
a. Relationship between student mental health and student learningb. Creating a positive school climate (e.g., physical safety, students feel cared about, good staff-staff
ALL
American Institutes for ResearchEvaluation of the Wraparound Zones Initiative: Report Two—148

Question Respondent
relationships)c. Positive behavioral interventions and supportsd. Customizing the types and intensity of academic supports for students based on their different needse. Customizing the types and intensity of non-academic supports for students based on their different
needsf. Using data to screen and monitor student progress in academic areas (e.g., grades, test scores)g. Using data to screen and monitor student progress in non-academic areas (e.g., discipline records,
attendance records, student needs survey, mental health screening)
13
If you identify a student who needs additional support in academic areas, how likely are the following to happen? (Options: Not likely, slightly likely, likely, very likely, I don’t know)
a. I would use data to screen for and confirm the need for academic support.b. I would follow a formal, systematic process (e.g., making a referral) for sharing my concerns with
other staff in the school.c. The student would receive services and supports in a timely manner to address the need(s) identified
in the referral. d. The services/supports that the student receives would effectively address his or her needs. e. The student’s academic progress would be monitored with systematic analysis of data.f. The services and supports would be provided as long as data indicates the student needs them.g. Multiple services for the student would be coordinated with one another.h. I would receive appropriate follow-up communication about the steps that are being taken to address
the student’s needs.i. I would receive information and tools necessary to provide supports to the student.j. The school would make an effort to involve the family in planning and delivery of supports and
services.
All except for operational support service providers (bus drivers, cafeteria workers, security personnel)
American Institutes for ResearchEvaluation of the Wraparound Zones Initiative: Report Two—149

Question Respondent
14
If you identify a student in crisis (e.g., is showing signs of serious anxiety or depression, is experiencing homelessness, needs food), how likely are the following to happen? (Options: Not likely, slightly likely, likely, very likely, I don’t know)
a. I would follow a formal, systematic process (e.g., alerting a designated administrator) for sharing my concerns with other staff in the school.
b. The student would receive services and supports in a timely manner to address the need(s) identified in the referral.
c. The services/supports that the student receives would effectively address his or her needs. d. The student’s progress would be monitored through updates from service providers.e. The services and supports would be provided as long as data indicates the student needs them.f. Multiple services for the student would be coordinated with one another.g. I would receive appropriate follow-up communication about the steps that are being taken to address
the student’s needs.h. I would receive information and tools necessary to provide supports to the student.i. The school would make an effort to involve the family in planning and delivery of supports and
services.
ALL for sub-items a,b,c,g,h
Only administrator or student support services for sub-items d,e,f,i
15
If you identify a student who needs additional support in non-academic areas (and the student is not experiencing a crisis; for example, the student has difficulty focusing), how likely are the following to happen? (Options: Not likely, slightly likely, likely, very likely, I don’t know)
a. I would use data to screen for and confirm the need for academic support.b. I would follow a formal, systematic process (e.g., making a referral) for sharing my concerns with
other staff in the school.c. The student would receive services and supports in a timely manner to address the need(s) identified
in the referral. d. The services/supports that the student receives would effectively address his or her needs.
All except for operational support service providers (bus drivers, cafeteria workers, security personnel)
American Institutes for ResearchEvaluation of the Wraparound Zones Initiative: Report Two—150

Question Respondent
e. The student’s non-academic progress would be monitored with systematic analysis of data (e.g., discipline data).
f. The services and supports would be provided as long as data indicates the student needs them.g. Multiple services for the student would be coordinated with one another.h. I would receive appropriate follow-up communication about the steps that are being taken to address
the student’s needs.i. I would receive information and tools necessary to provide supports to the student.j. The school would make an effort to involve the family in planning and delivery of supports and
services.
16
Who do you share your concerns with if you identify a student who:a. Needs additional support in academic areasb. Needs additional support in non-academic areas (e.g., has difficulty focusing, is easily distracted)c. Is in crisis (e.g., is showing signs of serious anxiety or depression, is experiencing homelessness, needs
food)[For each situation, check all that apply from following options:
a. Teachersb. Administratorsc. Support staff (e.g., reading specialists, school psychologists)d. External partners/providers working with the school.e. The students’ parents or guardians.f. Other (please specify)]g. No one
ALL
17
Do you have access to the following information about each of the students you currently teach or serve? (Options: No access, access to this information for the current school year only, access to this information for
All except for operational
American Institutes for ResearchEvaluation of the Wraparound Zones Initiative: Report Two—151

Question Respondent
previous school year(s) only, access to this information for the current and previous school years, N/A)a. Attendanceb. Disciplinary referralsc. Number of course failures d. Course grades e. Number of credits completed (HS only)f. Grade point average g. Tardinessh. Formative assessment data (e.g., DIBELS, MAP)i. State achievement test scoresj. Other student data __________ (please specify)
support service providers (bus drivers, cafeteria workers, security personnel)
18
During the current school year, on average how frequently do you review behavior data (e.g., disciplinary referrals, attendance, tardiness)? Please answer this question keeping in mind three or four students you have come in contact with during the past month who have the greatest non-academic needs.
a. Neverb. Once or a few times a semesterc. 1–2 times a monthd. 1–2 times a weeke. Daily or almost daily
All except for operational support service providers (bus drivers, cafeteria workers, security personnel)
FAMILY INVOLVEMENT: The questions in this section ask about how families are involved in decisions about, and the delivery of services for, meeting students’ non-academic needs.
19
During the current school year for students with the greatest non-academic needs, on average how often do you communicate with the students’ family members about supporting these needs? Please answer this
All except for operational
American Institutes for ResearchEvaluation of the Wraparound Zones Initiative: Report Two—152

Question Respondent
question keeping in mind three or four students you have come in contact with during the past month who have the greatest non-academic needs.
a. Neverb. Once or a few times a semesterc. 1–2 times a monthd. 1–2 times a weeke. Daily or almost daily
support service providers (bus drivers, cafeteria workers, security personnel)
20
For the students you teach or serve who receive non-academic supports, how would you characterize the average level of involvement that their parents/caregivers have in decisions about the delivery of these supports?
a. Not involvedb. Slightly involvedc. Moderately involvedd. Highly involved
All except for operational support service providers (bus drivers, cafeteria workers, security personnel)
21
During the current school year, how frequently do you use the following strategies to contact students’ parents/caregivers about supporting students’ non-academic needs? (Options: Daily, weekly, monthly, a few times, never)
a. Informal communication (e.g., quick conversations in passing)b. Scheduled meetings with parentsc. Phone calls as necessaryd. Email e. Informational meetings for parents with school staff (e.g., back-to-school night)f. Home visits
All except for operational support service providers (bus drivers, cafeteria workers, security
American Institutes for ResearchEvaluation of the Wraparound Zones Initiative: Report Two—153
Question Respondent
g. noneh. Other (please specify)
personnel)
STAFF GUIDANCE AND SUPPORT: The questions in this section ask about the degree to which you have received guidance/support on the following topics. The questions ask for information on who or what source has provided the guidance/support to you.
22
Regarding each of the following topics, from whom or what source have you received guidance/support during the current school year? (Options: Principal, counselors, School Wraparound Coordinator32, other services coordinator, District Wraparound Coordinator33, other district staff, outside professional development, other, I did not receive guidance or support on this topic) (check all that apply)
a. Processes for coordinating student support servicesb. Creating a school climate and culture that promotes positive intellectual, physical, and social-
emotional health and growth of studentsc. Identifying students needing additional academic servicesd. Identifying students needing additional non-academic servicese. Connecting students with academic services to meet their needsf. Connecting students with non-academic services to meet their needsg. Using data to screen and monitor student progress in academic areash. Using data to screen and monitor student progress in non-academic areasi. Implementing a consistent, schoolwide approach to managing behavior
ALL
23
On what topics would you like to receive more professional development or technical assistance? When answering this question, please think about the topics described in the previous question, or other topics that are related to supporting students’ non-academic needs.
ALL
32 “School wraparound coordinator” will be adapted for each site; for Lynn, we will use “school social worker.”33 “District wraparound coordinator” will be adapted for each site.
American Institutes for ResearchEvaluation of the Wraparound Zones Initiative: Report Two—154

Question Respondent
COMMUNITY SUPPORTS: The questions in this section ask about the involvement of community providers in the provision of academic and non-academic supports to students in your school. The section includes questions about the topics for which external providers have provided support, and questions about the helpfulness of that support.
24
In general, how adequate are the academic and non-academic supports your students are receiving from external partners/providers (i.e., individuals who are not employed by your district)? (Options: Not adequate, slightly adequate, adequate, very adequate, I don’t know)
a. Academic enrichmentb. Acceleration/college readinessc. At-risk behavior prevention (e.g., substance abuse)d. Basic needs (food, clothing)e. Before/after school programmingf. Career explorationg. Character education and life skillsh. Cultural enrichmenti. Extracurricular activities (e.g., sports, dance, singing)j. Family support (e.g., family counseling, food, parenting skills, shelter)k. Mental healthl. Mentoringm. Physical health (e.g., medical, nutrition, wellness)n. Tutoringo. Violence and delinquency prevention
All except for operational support service providers (bus drivers, cafeteria workers, security personnel)
American Institutes for ResearchEvaluation of the Wraparound Zones Initiative: Report Two—155

Question Respondent
25
Please identify any community providers who have provided you with guidance/support to meet your students’ academic and non-academic needs during the current school year. List up to 3, whom you know the most about:
All except for operational support service providers (bus drivers, cafeteria workers, security personnel)
26
During the current school year, how helpful has [Community Partner #1’s] guidance/support been? In thinking about this, how effectively did they meet your needs relative to the following: (Options: no guidance or support provided, not helpful, slightly helpful, helpful, very helpful)
a. Identifying students who need additional academic servicesb. Identifying students who need additional non-academic servicesc. Connecting students with academic services to meet their needsd. Connecting students with non-academic services to meet their needse. Using data to screen and monitor student progress in academic areasf. Using data to screen and monitor student progress in non-academic areasg. Implementing a consistent, schoolwide approach to managing behaviorh. Other (please specify the guidance/support they provided)
All except for operational support service providers (bus drivers, cafeteria workers, security personnel)
27
During the current school year, how helpful has [Community Partner #2’s] guidance/support been? In thinking about this, how effectively did they meet your needs relative to the following: (Options: no guidance or support provided, not helpful, slightly helpful, helpful, very helpful)
a. Identifying students needing additional academic servicesb. Identifying students needing additional non-academic services
All except for operational support service providers
American Institutes for ResearchEvaluation of the Wraparound Zones Initiative: Report Two—156

Question Respondent
c. Connecting students with academic services to meet their needsd. Connecting students with non-academic services to meet their needse. Using data to screen and monitor student progress in academic areasf. Using data to screen and monitor student progress in non-academic areasg. Implementing a consistent, schoolwide approach to managing behaviorh. Other (please specify the guidance/support they provided)
(bus drivers, cafeteria workers, security personnel)
28
During the current school year, how helpful has [Community Partner #3’s] guidance/support been? In thinking about this, how effectively did they meet your needs with respect to the following: (Options: no guidance or support provided, not helpful, slightly helpful, moderately helpful, very helpful)
a. Identifying students needing additional academic servicesb. Identifying students needing additional non-academic servicesc. Connecting students with academic services to meet their needsd. Connecting students with non-academic services to meet their needse. Using data to screen and monitor student progress in academic areasf. Using data to screen and monitor student progress in non-academic areasg. Implementing a consistent, schoolwide approach to managing behaviorh. Other (please specify the guidance/support they provided)
All except for operational support service providers (bus drivers, cafeteria workers, security personnel)
American Institutes for ResearchEvaluation of the Wraparound Zones Initiative: Report Two—157

Appendix F: Massachusetts Wraparound Zones Initiative 2011–12 Implementation Strategies, by Initiative Priority Improvement Area and School District
District Climate and Culture Identify and Address Student Needs
Community Coalitions District Systems of Support
Fall River Implement social emotional learning or healthy behavior curricula: Responsive Classroom and Playworks (elementary schools) and Guided Discipline (middle school)
Conduct a school climate and culture survey (students, staff, and parents) to establish baseline and determine areas of need
Continue implementation of the middle school advisory program designed to develop positive and collaborative relationships between students and promote student connection to school
Use existing CAT teams (Curriculum Accommodation Teams) as main referral, intervention, and case management team that fields teacher referrals, develops individualized student academic and social-emotional support plans, and tracks support
Develop/recast school-based Wellness Teams and use as main team responsible for WAZ implementation in the building and development of strategies that support overall needs of student body
Conduct resource mapping and needs assessment designed to identify existing resources and parent interests
Use findings of needs assessment to identify resource gaps and WAZ development priorities
Expand or develop activities, programs, or services designed to meet priority student and climate and culture needs
Identify valuable community WAZ partners and appropriate level and types of engagement
Establish more routine methods for reviewing and coordinating resources
Leverage existing community coalitions and mobilize support for wraparound strategies
Develop a Community Wellness Team or coalition to advise the district on school-community collaboration and develop strong student/wrap strategies
Provide professional development and coordination support for school-based WAZ implementation
Establish consistent systems, practices, and protocols across schools for core WAZ activities
Develop and maintain a community resource directory
Establish strong collaboration with FRPS parent engagement office and develop core WAZ activities for parents
Develop a Community Wellness Team
American Institutes for ResearchEvaluation of the Wraparound Zones Initiative: Report Two—158

District Climate and Culture Identify and Address Student Needs
Community Coalitions District Systems of Support
Holyoke School-wide teacher training and ongoing consultation on new Behavioral Responsive System (for both Peck and Morgan)
Establishment of the middle school CAT (Caring Adult Team) (Peck)
Establishment of school-wide intensive behavioral support program for targeted students (Peck)
Assess and make improvements to existing school-wide positive and responsive behavior management system (Morgan)
Establish comprehensive system to meet parents and family needs, including establishing a parent resource center, conducting a parent survey, hiring a family engagement coordinator, and offering family events (Morgan)
Establish meaningful roles for parents in school (Morgan)
Reconvene HUB family assistance team to provide communication and problem solving for students and families in
Identify target families in Peck attendance zone
Arrange ongoing visits to families (Peck)
Establish relationships with local formal and informal early education and care providers (Peck)
Design, recruit for, and facilitate monthly readiness workshops March-August 2012 (Peck)
Conduct a needs and assets assessment (Morgan)
Identify community partners to provide programs and services that align with identified student needs (Morgan)
Create FSCS project manager position that includes structures and systems to support an ongoing cycle of needs and assets identification and responsive programming (Morgan)
Create a Family Access and Engagement Coordinator position
Expansion of Peck FSCS Full Partnership to become district level FSCS partnership
Prepare for a district-wide FSCS feasibility study or planning process
Implement a district-level community of practice as a learning community for the three FSCS
Identify issues benefiting from district action or district-level policy implications
American Institutes for ResearchEvaluation of the Wraparound Zones Initiative: Report Two—159

District Climate and Culture Identify and Address Student Needs
Community Coalitions District Systems of Support
crisis (Morgan) Offer a variety of parent
and family workshops (Morgan)
Lawrence Survey staff, students and parents about climate and culture and analyze data to assess overall needs
Introduce or reintroduce PBS to each school
District team and consultant monitors and supports school-based PBS teams
Provide PD to staff and parents on key issues identified in survey data
Establish school-based support teams to address overall wellness issues
Conduct annual social-emotional or behavioral or health screening for all students
Assess the interventions available at each school for addressing SHE needs and bolster options as needed
Implement a school-based case management system
Expand the Agency Partnership Assistance Network
Formalize partnerships with the schools through an MOU
Create an electronic bulletin board where info on services can be shared
Create a consistent referral system for support services
Establish district leadership team to spearhead and monitor implementation efforts
Review existing support systems for redundancy and needed revisions
Communicate changes in the support service access and delivery system and train school personnel on new approach
Review the current wellness programs for vertical alignment and fidelity of implementation
Springfield Employ City Connects model and ensure teachers are aware of practices
PBIS and/or Responsive Classroom
Administer OHI and use to create action plans
Whole class reviews Individual student review
plans created by STAT teams (for students with intensive needs)
SSCs gather data on family needs and assist them with the referral process
Identify community based resources (asset mapping) and gaps in services
Development of a Community Advisory Board
Establish Committee for Student Support
Professional development and supervision for SSCs
Worcester Survey students, parents, and staff about school climate issues and needs
Develop systems within each school to aid the family support teams and strengthen support
Hire Wraparound Outreach Coordinators at each school
Develop common system of case management in alignment with the school’s student and family support team
Identify existing community resources and map geographically
Formalize key partnerships through MOUs
Develop an ongoing plan to identify new community
Use district leadership to monitor the delivery and effectiveness of WAZ
Implement the HMH Pinpoint System
PD plan to support the implementation of the
American Institutes for ResearchEvaluation of the Wraparound Zones Initiative: Report Two—160

District Climate and Culture Identify and Address Student Needs
Community Coalitions District Systems of Support
strategies Provide PD to staff to
address needs identified during the survey analysis
Each school brings in additional service providers as needed to meet needs
Develop process of establishing the health-wellness needs of students and developing targeted intervention plans
Identify community partners to meet the needs of the students, families, and schools
partners Use the HMH Pinpoint
System to facilitate a two-way system of communication between the schools and their partners
Pinpoint System Use district leadership to
develop a plan that identifies community based resources within the WAZ catchment area
American Institutes for ResearchEvaluation of the Wraparound Zones Initiative: Report Two—161

LOCATIONSDomesticWashington, D.C.Atlanta, GABaltimore, MDChapel Hill, NCChicago, ILColumbus, OHFrederick, MDHonolulu, HIIndianapolis, INNaperville, ILNew York, NYPortland, ORSacramento, CASan Mateo, CASilver Spring, MDWaltham, MAInternationalEgyptHondurasIvory CoastKenyaLiberiaMalawiPakistanSouth AfricaZambia
About American Institutes for Research
Established in 1946, with headquarters in Washington, D.C., American Institutes for Research (AIR) is an independent, nonpartisan, not-for-profit organization that conducts behavioral and social science research and delivers technical assistance both domestically and internationally. As one of the largest behavioral and social science research organizations in the world, AIR is committed to empowering communities and institutions with innovative solutions to the most critical challenges in education, health, workforce, and international development.

1000 Thomas Jefferson Street NWWashington, DC 20007-3835202.403.5000 | TTY 877.334.3499www.air.org