evaluation of the tti gyratory compactor · 2017-01-04 · evaluation qf the tti gyratory compactor...
TRANSCRIPT

EVALUATION QF THE TTI GYRATORY COMPACTOR
William l1,. Moore Associate Research Engineer
and
Lionel J. Milberger Research Ass6ciate
Research Report Number 99-3 Stress Distribution in Granular Masses
Research Study Number 2-8-65-99
Sponsored by
The Texas Highway Department In Cooperation with the
Uo S. Department of Transportation Federal Highway Administration
Bureau of Public Roads
February, 1968
TEXAS TRANSPORTATION INSTITUTE Texas A&M University
College Station, Texas


PREFACE
This is the third report· issued under Research Study
2-8-65-99, Stress Distribution in Granular Masses, being
conductea at the Texas Transportation Institute as part of
the cooperative research.program.with the Texas Highway
Department and u. s. Bureau of Public Roads.
The first two reports are:
"The Use of Particulate Mechanics in the Simulation of Stress~strain Cha~acteristics of Granular Materials," by James c. Armstrong and Wayne A. Dunlap, Research Report 99..11, Texas Transportation Institute, August, 1966.
"A Gyratory Compactor for Molding Large Diameter Triaxial Specimens of Granular Materials," by Lionel J. Milberger and Wayne A. Dunlap, Research Report 99-2, Texas Transportation Institute, October, 1966.
The authors wish to thank all members of the Institute
who assisted in this research. They would like to express
special appreciation to Mr. Frank H~ Scrivne~ for his advice
and assistance. His help throughout the study was particularly
valuable. Special gratitude is also expressed to Mr. George . .
Darroch. for his advice concerning experiment design and statis-
tics throughout the study, Mr. Chester Ho Michalak for his
suggestions during the development of the compaction procedure,
Messrs, Charles E. Schlieker and Donald J. Hollinger for their
i

help during the testing phase, and Mr. M. Be Phillips for his
help in preparing this report~
The authors also wish to thank Mr. James L. Brown, the
Texas Highway Department Study Contact Representative, for
his assistance and support in thisresearch.
The opinions, find£ngs,: and conclusions expressed in this
publication are those of the authors and not necessarily those
of the Bureau of Public Roadse
ii

ABSTRACT
This report. describes the evaluation· of a gyratory compac-
tor developed by the Texas Trans,ortation Institute for the
sole purpose·of producing spe9imens of high uniformity for
repetitive triaxial testing •. The material selected for use
in the evaluatien was a crushed limestone. In prior investi
gations-replicate specimens made. from this limestone exhi-
bited somewhat erratic behavior •. In-fact, of the several
materials tested this material w·as by far the most troublesome.
Nevertheless, it is an excellent flexible basematerial and wide-
ly_used in this-state.
The evaluatien of the compactor re~ulted in an c:;>perating
procedure that will produce nearly identical test specimens
of this material over a wide range of moisture contents and
densities. It was found that compacted specimens had replica-
tion errors in density of less than 0.4 pcf, in moisture content
of less than 0.1 per cent,. and in unconfined compressive strength
of less than 8 psi. The authors believe tha-t the observed
replication errors are smaller than is now possible with any . .
other known method of preparing similar specimens of granular
materials for testing. Also, it is believed that the replica-
tion errors are of the same order of magnitude as now accepted
in standard concrete, brick, and~wood. testing.
iii

Equations.were developed that relate the compacted density
and moisture content of the limestone· specimens to the molding
moisture content and compactor variablese These equations show
that test specimens can. be prepared over a wide range of
preselected m?isture contents and densities. Expected errors
in the preselected moisture contents and densities of test
specimens are less than 0.2 per cent for moisture content and
less than leO pcf for ~ensity.
iv

TABLE OF CONTE~TS
Page
LIST OF FIGURES • • e . ' . . . . ~ . . ' . . ' . . . . . LIST OF TABLES • • • • e • • • • • • • e • • • • • • • vii
1. INTROBUCTION • • . • • • • • • · • • • • • • • • '• • 1
MATERIALS AND SPECINEN PREPARATI0~ . . ' . . . • • • 4 ~
3., STABILIZED SPECIMENS USED IN DEVELOPMENT OF PROCEDURE· • • • • • • • • . • • · • • • • • • • • • • 8
4 .. DEVELOPMENT OF COMPACTION PROCEDURE • • .. • • . . 5. EXPERIMENT ·FOR BE'!'~RMINING C~MPACT0R CAPABILITIES • 22
6. . ANALYSIS· 0F THE· EXPERIMENT. ~.. • . . . . . ~ . . • 0 ~4
7. FINDINGS . . . . . . . '' . . . . . . . . . . . " • 30
8.. REFERENCES • • •. • • .. • • • • • • • • ... · , • • "32
APPENDIX A- 0PERATING PROCEE>URE •.•• ·• •••••• •33
APPENDIX·B- DENSITY VARIATIONS WITHIN STABILIZED SPECIMENS. • , . • " ·· • • • • • • .. • • • • 3 8
APPENDIX C - RESULTS USED TO DE~ERMINE COMPACTOR CAPABILITIES • .. • • • • • • . • • • • • • · • 41
APPENDIX D- REGRESSION TECHNIQUE USED FORDENSITY EQUATION • • • • • • • • • • • • • • • • • 50
v

LIST OF FIGURES
Figures Page
Compactor in Operation • ~ e "2
2. Fractions Used to Recombine Specimen • "' ~ ., ., .,7
3. Specimen Marked for Sawing Into Horizontal Sections 10
4. Specimen Sawed in Vertical Sections ., "' ., "' ., " . " 11
5" Dome Which Appeared on Initial Compacted Specimen ., 14
Range of Moisture-Pensity Combinations., •
Gyratory Compactor ., ., e • o ., ., • e • a
vi
" 26
" 34

LIST OF TABLES
Tables Page
1. Engineering Properties of· Servtex Crushed Limes tone • • .. • • . .. • • • • • • • • • .. • e 6
B-1. Density Variation in 12 in. High Specimens. • 39
B-2.
C-1.
C-2.
Density Variation in 8 in •. High Sam!i>les •
Moisture Content and Bensity.of Compacted Specimens • • • • . • • . • . , • • • • • • • •
Unconfined Compressien Test on Replicate Specimens • .. • . • • • • • , • • • • • ..
. . .. • 40
':42. e • e e
43
e e e .. 49
D-1.. Successive Values of Non-L.inear Regre~sion Con-s tan ts e G e e e e. e e . e .. e . e . e e . e e e e e e e e e 52
vii-·


1. INTRG>pUCTI0N
The preparatien of specimens of granular material for
laberatory testing.has traditianally been a difficult art ..
Dunlap reported erratic behavior 0f replicate· specimens of
granular mat~rials subjected to rapid, repetitive leading.which
he attributed, in_larg~ part, te the method ef preparing
test specimens (1).* He used_ the Texas Highway Department
impact method of cempactien, anq he felt that the hand finishing
required to level the cempact~d _specimen's, tap surface was an
ipherent weakn~ss in the .. methad·.
The first year's effert in this researc:P, study was devoted
to finding a better methad ef preparing test specimens. A
study· of all methods of specimeri preparation resulted in the
f~bricati~n af. a gyratory contpac.tor for molding large diameter
test specimens. Known. as the Texas·Transportatian Institute
Gyratery Compactqr, it is pictured in Figure 1, Details of
the design and· aperatien ef the compacter were reparted in, Re-
search Report.99-2 (2).
The purpose· of. this report•ii, t0 present an evaluation . ~
E>f the ability of_the c0mpact0r to accomplish its basic design
objectives. More specifically, the evaluation is directed
toward answering the following two questions: a) can the
compactor fabricate specimens which are uniform in density,
*Numbers in parentheses refer te reference numbers listed in. Section 8.
1
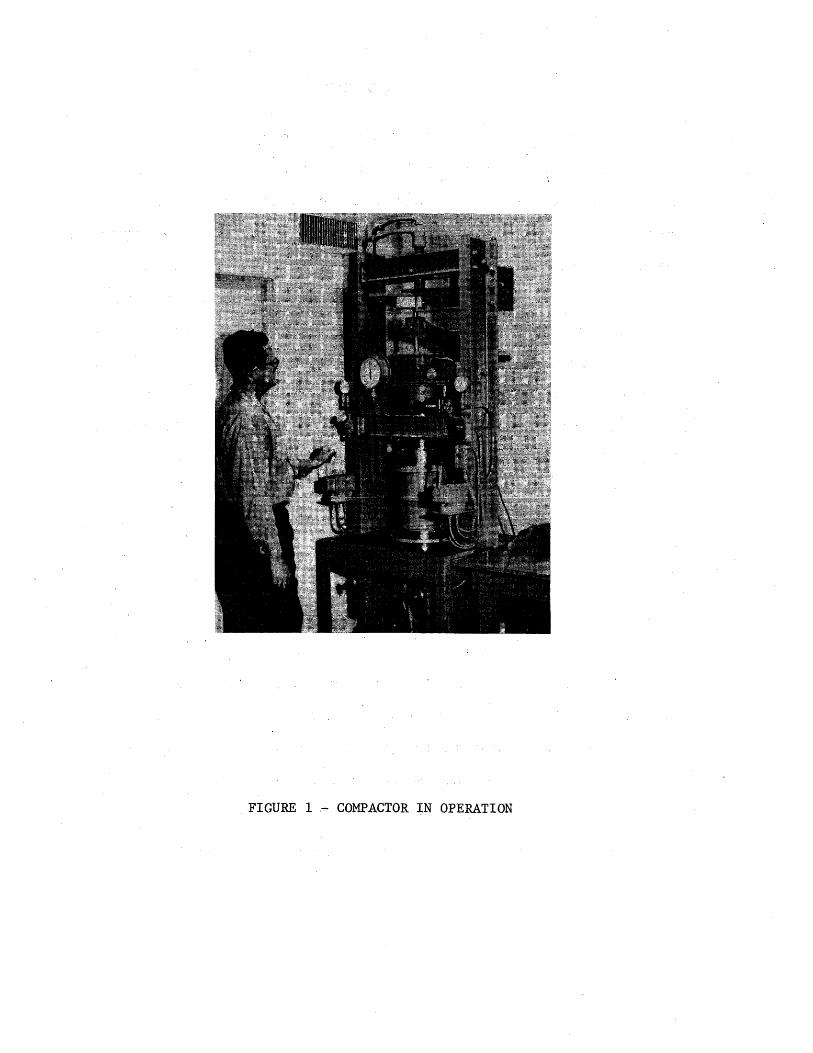
FIGURE 1 ~ COMPACTOR ~N OPERATION

moisture content, and gradation and b) can it fabricate
nearly identical replicate test specimens over wide ranges
of moisture content and density? It was felt that affirmative
answers to these two questions would result in more suitable
specimens for laboratory testing than had ever before been
possible.
The compactor evaluation was divided into two distinct
phases. The first, described in Sections 3 and 4, was the
development of a compaction procedure and the second, described
in Sections 5 and 6, was an evaluation of the compactor's capa
bility utilizing the procedure to fabricate nearly identical
replicate test specimens over a wide range of compactive effort.
As a result of the evaluation, a satisfactory operating pro
cedure was developed and is given in Appendix A. Also, it was
found that replicate specimens compacted in accordance with
the procedure were nearly identical and that they could
be prepared over a range of moisture contents and densities$
Thus, the evaluation led to affirmative answers to the questions
asked in the preceding paragraph. The authors believe that
the compactor produces more uniform.specimens over a wider
range of moisture content and density than was previously
possible.
3

2 .. MATERIAL AND SPECIMEN PREPARATION
The material selected for the compactor evaluation was
a crushed limestone. obtained from the Servtex Limestone
Company, New Braunfels, Texas. This material was selected
primarily because of past difficulties experienced in obtaining
similar behavior of replicate specimens made from the material .. ·
It has been by far the most troublesome of several materials
tried. Nevertheless, field experience has shown it to be an
excellent flexible base material, and it is widely used in
this state& Table 1 gives a summary of its engineering proper
ties,
In processing, the material was air dried for at least
four. days, oven dried at 140°F. for at least 48 hours, and
then separated on a Gilson sieve-shaker on sieves of the following
sizes: 1 1/2", 1", 3/4", 3/8", #4, #10, and pan.. These
fractions; which are illustrated in Figure 2 1 were stored in
separate containers until needed for the recombination of a
sample.. Throughout the research the fractions were combined
in order to make approximately 2" of compacted specimen having
the gradation given in Table 1. The material fractions were
combined with water to obtain the desired moisture content and
mixed in a counter-current batchmixer for two minutes. After
mixing, the material for each 2" layer was stored separately
in a humid room in an air-tight container for a minimum of
4

24 hours to allow for uniform distribution of moisturee
The material was then ready for compaction. It should be
noted that the material was not compacted in layers, only
mixed and placed in the mold in layers in order to achieve
uniformity in moisture and particle distributione
5

TABLE 1
ENGINEERING PROPERTIES OF SERVTEX CRUSHED LIMESTONE
WET L.A. SPECIFIC TEXAS LL PI SL LS SR BALL A BRAS· GRAVITY CLASS- GRADATION
MI:...L I· ON JFICATION 0"1
15 4 12 1.0 1.97 31 32 2.66 TYPE A PERCENT RETAINED ON GRADE I
OPENING- in. SIEVE NUMBER OPENING-mm.
I 11. l
2 I 3/4 3/8 4 10 20 40 80 200 1 .05 .005 .001 ~oo1
0 16 26 42 50 57,73 80 85 88 90 93 97 100 , __

FIGURE 2 - FRACTIONS USED TO RECOMBINE SPECIMEN

3. STABILIZED SPECIMENS USED IN DEVELOPMENT OF COMPACTION PROCEDURE
Many variations in compaction procedure were tried in
order to develop a. suitable method of molding specimens and
each procedure was evaluated primarily by examining the density
variations within the compacted specimens. During this phase
of the investigation, the specimens were cement-stabilized in
a manner similar to the procedure used by Parsons (3). After
compaction and curing, they were sawed into parts, coated
with wax, and the density determined on the several parts~
These specimens were prepared as described in the follow-
ing paragraphse A specific quantity of minus 200 material
(6 per cent of total dry weight) was sieved from each two-
inch layer of the sample~ The layer was mixed with 94
per cent of the required water for the desired moisture con-
tent, and then allowed to cure in air-tight containers for 24
hours in a humid room. Just before compaction, cement
( equal in weight to the weight of minus 200 material removed)
was mixed with the soil and the remaining 6.per cent of the
required water was added while mixing. After compaction,
the specimens were placed in a humid room with membranes
over them and allowed to cure for seven days in capillarity~
The specimens were then oven-dried at 105°C. to a constant
8

weight (a minimum of 48 hours), their weight was recorded, and
they were marked for sawing into several horizontal sections,
as shown in Figure 3. The specimens were sawed by means of
a Clipper masonry saw with a diamond blade. The individual
parts were again dried at 105°C. to a constant weight (a
minimum of 48 hours) and the dry weights recorded~ The parts
were then coated with Humble Microvan wax as described belowe
The wax was heated above the melting temperature and
allowed to cool until a thin film formed on top, immediately
after which the parts were coated. Three dippings were
required to thoroughly coat each parts Specific gravity of
the wax was determined each time that the container was
heated or new wax was added. After coating, the parts were
allowed to cool to room temperature. Their weight was
then taken both in air and in water. From this information
the density of each part was calculated.
Several specimens were also sawed into vertical sections
as shown in Figure 4 and the density was determined of the
individual parts. It was found that the horizontal density
gradient determined from these parts was not significant when
compared to the vertical gradient found from the samples
sawed into horizontal sections.
9

FIGURE 3 - SPECIMEN MARKED FOR SAWING INTO HORIZONTAL SECTIONS

FIGURE 4 - SPECIMEN SAWED IN VERTICAL SECTIONS

4. DEVELOPMENT OF COMPACTION PROCEDURE
The first phase of the compactor evaluation was the
development of a compaction procedure for the Texas Transporta-
tion Institute Gyratory Compactor that would produce uniform
specimens suitable for testing. The compactor was designed
solely for this purpose. A wide latitude in compactive effort
can be obtained with the compactor through the manipulation
of the following four compactor variables:*
a) The average vertical pressure on a specimen can be
varied up to 500 psi~
b) The maximum gyratory angle can be varied up to 4
degrees, and it can be returned to zero to level
the specimen at any desired rate.
c) The number of gyrations can be preset at any number
up to the limit of the counter switch (5 digits).
d) The speed of gyration can be adjusted up to a maximum
of 25 gyrations per minute.
After a period of trial operation of the compactor, a
limi.ted number of specimens 6 inches in diameter and 12 inches.
in height were compacted. The procedure used is outlined below:
a) The average vertical pressure was held constant at
250 psi.
* Complete details of the compactor variables are given in reference 2.
12

b) The maximum gyratory angle was set at 3 degrees and
the last three gyrations were used to level the
specimen ..
c) 100 was set on the counter switch .. (At count 97 the
operator began to decrease the gyratory angle at a
rate so that the angle would be zero at count 100 .. )
d) The speed of gyration was set at 10 gyrations per minute ..
Many specimens were similarly compacted at vertical pressures
ranging from 200 to 400, maximum gyratory angles ranging from
1 to 4 degrees, number of gyrat'ions ranging from 5 to 20
gyrations per minute.
The last three gyrations were always used to level the
specimen. Replicate specimens compacted using this procedure
seemed to be almost identical and cross-sections of the specimens
show-ed no particle segregation. However, two major problems
were noted.. The first wa~ the presence of a significant
vertical density gradient in the specimens; the top and bottom
were considerably denser than the center.. The other problem
was the appearance of a "dome" on the ends of the specimen
(see.Figure 5). The dome and the density gradient appeared
to be more pronounced on specimens compacted at the higher
levels of compactive efforte
Initially it was thought that the solution to these two
problems lay in the development of a proper procedural use of
13

FIGURE 5 - DOME WHICH APPEARED ON INITIAL COMPACTED SPECIMEN

the various compactor variables. In other words, it was felt
that good test specimens could be made if the right combination
of compactor variables was used,
Many variations in procedure were then tried in an attempt
to produce suitable test specimens by eliminating the domes
and density gradients. The more significant ones are outlined
below:
a) Provision was made on the compactor for applying the
vertical load at a very slow rate (as low as eOS inch/
minute) after gyration was begun, Trials were made
at applying the full load over the first five
gyrations, This variation in procedure had no signi
ficant effect on the compacted specimens,
b) Although it was not the purpose of the compactor to
compact specimens in l~yers, .several methods were
tried for compacting in layers. Attempts included
two 6" layers, an 8" layer with two 2" layers on top
and bottom, and six separate 2" layers., In all
instances the results obtained were highly unsatis
factory. The six 2" layers did seem t.o reduce the
density gradient, but the compacted specimens were
distinctly layered and were not suitable for
test specimens.
c) Each layer of the specimen was compacted statically
15

and then the entire specimen was compacted dynamically.
After each layer of the sample was placed in.the mold,
the: vertical load to be used during compaction was
applied. The entire sample was then gyrated for
various numbers of revolutions. This variation in
procedure resulted in slightly higher densities; how
ever, it did not have any significant effect on the
two major problems.
d) A variation of the Texas Highway Department method
for compacting gyratory asphalt specimens was tried®
An average vertical pressure of 50 psi was applied
to the sample and the distance between the upper and
lower plates held constant by closing a hydraulic
valve. The specimen was then gyrated for five revo
lutions. The vertical pressure was again applied,
the hydraulic valve closed, and the specimen gyrated
again for five revolutions.
repeated for several cycles.
This procedure was
The sample was then
leveled and a seating load equal to an average ver
tical pressure of 500 psi was applied. The·purpose
of the seating load was to make a right circular
cylinder. The specimens that were made using this
procedure might have been more satisfactory if the
final seating load could have been considerably higher
(the compactor was designed for a maximum average
16

vertical pressure of 500 psi).
e) In addition to using a Teflon impregnated ceramic
lined mold, several specimens were compacted using
sheet Teflon to line the mold. The Teflon lining
seemed to reduce the density gradient somewhat, but
the lining wrinkled and shredded during compactionc
The surfaces of the specimens were extremely rough
and were not suitable for test specimens®
f) Various lubricants were tried on the mold to reduce
the friction between the soil particles and the walls
of the moldc Ordinary grease, motor oil and graph
ite, with both heavy and light coats were usedc These
lubricants also seemed to reduce the density gradientf
but specimens impregnated with lubricant were not
suitable for testing.
g) Two air vibrators were installed on the mold chuck,
and several specimens were gyrated while also being
vibrated. The time of vibration and the number of
gyr~tions were variede No effect from the.vibrators
could be noted.
h) An experiment was conducted in which the number of
revolutions used to level the specimen was variedo
From the results obtained from this experiment it was
found that the dome at the top and bottom of the specimen
17

could be reduced or eliminated when the specimen was
leveled over the entire number of revolutions selec
ted to compact the specimen. After this finding the
procedure became standard~ That is, the maximum
vertical pressure was applied to the specimen and
then the gyratory angle was applied. At the same
time that gyration was started, the flow restric
tor valve that controlled the gyratory angle was
opened, and the angle was slowly returned to zero~
The rate of change of gyratory angle was held con
stant, and it was set so that on the desired last
count the angle was equal to zero~ This procedure
required the installation of a more accurate flow
restrictor valve than had been used previously.
i) In an experiment to determine the effect of the
compactor variables, it was found that the first
three, the vertical pressure, the gyratory angle,
and the number of gyrations greatly influenced the:
density of the specimens, wher~ the last variable,
the speed of gyration, had little or no effect. Thus,
to simplify the evaluation, an arbitrary operating
speed of 10 gyrations per minute was chosen and this
speed was used throughout the remaining tests.
18

At this point in the evaluation there seemed to remain
but one major problem, the large vertical density gradient~
In order to determine which of the three remaining variables
had the most effect on the density gradient, a special
experiment was conducted. The results of this experiment
are given in Table B-1, Appendix B. The only significant
finding of the experiment was that the density gradient
increased as the compactive effort increased, that is, speci-
mens having the highest density also had the highest density
gradient., This gradient was about 11 pcf in specimens having
an average density of about 139 pcf, and it was about 5 pcf
in specimens having an average density of 131 pcf., The
standard deviation of the density of the specimen parts
from their mean value was 4.07 pcf.
To the authors' knowledge, the problem of density
gradients in compacted specimens has been given little treat-
ment in technical literature. Because other gyratory com-
* pactors known to the authors were designed primarily to
compact asphaltic specimens having a height to diameter ratio
of one or less, ·it appeared that short~r specimens should be
attempted. Several 6" high specimens were prepared and
compacted, and the results of these tests were very encouraging~
The 6" specimens had density gradients of about 2 pcf or less0
*The gyratory compactors designed by the Waterways Experiment Station (4) (5); Ohib Department of Highways (6), and the Texas Highway Deparment.
19

With the success obtained in compacting 6" high speci
mens, additional specimens having a height of 8" were pre
pared and compacted. The results of these tests are given
in Table B-2, Appendix B. Density gradients in these spec
imens also appeared to be very small. The standard deviation
of the density of the specimen parts from their mean value
was 1~31 pcf. That is, about two thirds of the time the
variation of the specimen parts from their mean value was
less than 1.31 pcf.
A few specimens were compacted at heights of 9", 10" and
ll"e Severe density gradients were present in all of these
specimens. It mightbe noted, however, that for these tests
wooden blocks were used for spacers as expedients. It is
believed that these blocks may have contributed somewhat
to the increase in density gradient. In any event these
tests were very limited and are not considered to be con
clusive ..
Since 8 inches is the height used for triaxial test-
ing by the Texas Highway Department and since satisfactory
results were obtained when compacting specimens of 8 inches,
it was decided to use this height as standard for test
specimens® The shorter height will magnify the compression
end effect problem, i.e., the effect of frictional forces
acting on the ends of the specimens (7). But the end effects
20

· must· be- considered· in stress-strain· analysis regardless· of· the
·height chosen; therefore,· the advantage of having more· homo
genous test specimens· is· believed· to outweigh the disadvan
tage of the increased· end· effect.
· Details· of the· compaction· procedure that evolved· from the
testing described· in· this section· are· given in Appendix A. It
invo-lves two· major· changes· in· the initial operating procedure.
The· gyration· angle· is decreased at a constant rate over the
entire number of· gyrations,· and a height· of· 8" is· used· instead
of· 12".
. 21

So EXPERIMENT FOR DETERMlNING COMPACTOR CAPABILITIES
Once a definite compaction procedure was settled upon as
described in the previous section, the second phase of the com
pactor evaluation was begune The purpose of this phase was
to determine the capability of the compactor to produce test
specimens of various moisture contents and densities utilizing
the newly developed procedure. The results of the experi
ments conducted during this phase are given in Appendix Co
In this phase of the investigation three levels of each
of three compactor variables--vertical pressure, gyratory
angle, and number of gyrations--were used to encompass
approximately the practical range of compactive effort.
Because of the finding in the first phase that the fourth
con:tpactor variable, rate of gyration, had no significant
effect on compactive effort, the rate was held constant
at 10 gyrations per minute~ The levels of the compactor
variables used are as follows:
a) Vertical pressure - 100, 200, and 300 psi.
b) Gyratory angle - 2, 3, and 4 degrees~
c) Number of gyrations - 10, 30, and 50 ..
During this experiment specimens were prepared as if they
were to be used as test specimens.. They were not stabilized
and their heights were maintained at 8 inches plus or minus
22

OclO incho The height requirement made it necessary to adjust
the weights of materials used in each layer based on the expec
ted compacted densityo
Specimens were compacted at molding moisture contents
ranging from 0 to 7 per cent., The specimens compacted at 0
per cent moisture were very difficult to replicate, and they
would not stay in one piece when the mold was removedo Never
theless, the density of many of these specimens could be obtained
without removing them from the mold" The specimens molded
at moisture contents of 1 percent and higher had sufficient
cohesion to permit removal from the mold, and they could have
been used for triaxial testing.,
Moisture and fines bled from the ends of the mold when
the molding moisture content was 6 per cent and higher" This
phenomenon was also observed by both Parsons (3) and Al-Layla
(8)., The bleeding was so severe in specimens molded at 7 per
cent moisture and higher that it was extremely difficult to
replicate specimens., Because of the large loss of fines in
specim~ns experiencing - s~vere bleeding f/ those. molded at 7 per
cent moisture and higher were not considered to be suitable
for testing nor for further studyo
23

6~ ANALYSIS OF THE EXPERIMENT
A prime objective of Research Study 2-8-65-99 is "to test
the validity of and refine as necessary a deformation hypothesis
developed in Study 2-8-62-27, particularly as the hypothesis
relates to in-situ gradations, moisture contents, and densities
existing during the life of a flexible pavement structure"
(9)o In order to relate accurately the effect-of moisture
content and density to the behavior of materials, it is nece
ssary to be able to pre-select the moisture content and density
of test specimens. The most practical means of accomplishing
this goal was to develop mathematical models relating test
specimen moisture content and density to the molding moisture
content and the compactor variables. A well fitting mathemati'cal
model would also serve the purpose of defining the magnitude
of the error that would exist in experiments dependent upon
controlling moist~re content and density.
The variables considered for inclusion in the model were
the molding moisture.content, the compactor variables (vertical
pressure, . gyratory angle 1 an~ number-of gyrations) 1 the final
moisture content and the final compacted densitye The molding
moisture content and the compactor variables were the indepen
dent or controlled variables entering into the model. The
final moisture content and the compacted density were both
dependent or response variable~0 The results from tests
24

performed on 171 specimens that were used in the analysis lead
ing to the modeling of these variables are given in Table C-1,
Appendix c., Figure 6 illustrates graphically the range of the
moisture-density combinations covered by the experimento
Early in the analysis it was observed that the final
moisture content after compaction was primarily a function of
the molding moisture content and not a function of the compac
tor variables. In fact the final moisture content could be
estimated from the following equation which has a standard dev
iation of 0.,11% moisture.,
w = m- 0.,0141m2 (1)
where
w = Final moisture content, per cent of dry weight
m = Molding moisture content, per cent of dry weight
The replication error for moisture content (determined in a
standard analysis of variance) was 0.,08 per cento Because it
is impossible for any mathematical model to have a standard
deviation less than or equal to the replication error, the
above equation was considered satisfactory., As indicated by
the equation, specimens molded at 6 per cent moisture were
found to contain about 5oS per cent moisture after compactiono
The loss in molding moisture indicated by the second term of
the equation must have been largely due to losses occurring
during mixing, storing, and compaction and not the compactor
variables"'
25

140 ~ ~ 0. .. >-!::: CJ)
-z lJJ 0
>-a: 0
130
120 '-------------------'-------....._____, 0 2 4 6
MOISTURE CONTENT 1 °/o
FIGURE 6 - RANGE OF MOISTURE- DENSITY COMBINATIONS COVERED BY THE EXPERIMENT.
26

Many different. mathematical models were tried for pre
dicting the compacted density fromthe compactor variables and
the molding moisture content$ It was found that the model
could be greatly simplified if the final density based on
total weight of the wet specimen was used instead of the
conventional_density based on the oven dried condition"' The
conventional density based on the dry weight of the specimen
can be easily calculated if the compact~d density based on
the wet weight and the final moisture content are known0
From the mathematical models tried, the following equation
was found t6 be the most satisfactory"'
y w = 13 8 "' 10 + 0 " 0 4 7 8 41-U 3 < + 1 .. 912Q + 0 • 119 8111Q (2)
where
yw * compacted density based on total weight, pcfo
m = molding moisture content, per cent of dry weight.
Q = compactor variable function that is defined by the
following equation:
. = (Rev\(~\ ll. 6 s 1 (GA )1. a as Q loge 30 1 200} 3 (3)
and
Rev = number of gyrations
VP = applied vertical pressure
GA = maximum gyratory angle
27

The linear numerical coefficients in the above equa
tion for compacted density and the exponents in the compactor
variable function were found by using a least square regres
sion technique that is described in Appendix D0
The standard deviation of the compacted density equation
was Oa96 pcf which is greater than the replication error of
Oa33 pcf determined in an analysis of variance.. It should be
recognized, however, that the data used to determine the
replication error were somewhat biased by discarding (as out
lined in Section 5) those specimens that did not meet the
height requirement of 8 inches plus or minus 0.1 inch, a
procedure that tended to minimize density replication errors ..
Nevertheless, the standard deviation of internal variations
in density within a specimen was 1 .. 31 pcf (see Section 4);
thus, the model's prediction error lies between that value
and the replication error.. The model was, therefore, con
sidered satisfactory~ It is the authors' hope that the same
model, perhaps with different regression constants, will
adequately represent materials other than the crushed lime
stone used for this evaluation~
In addition to developing a mathematical model relating
the experimental variables, and determining replication errors,
additional sets of specimens were prepared for performing
28

standard unconfined compression tests. For this experiment
three replicate specimens were compacted at three different
compactive efforts and at two or three levels of moisture
content (see Table C-2, Appendix C). The within sample stan
dard deviation for the unconfined compressive strength was
7el psi.and the coefficient of variation was 13 per cento
Similarly, the within sample standard deviation of per cent
strain was 0&11 per cent, and the coefficient of variation
was 11 per cent.
The authors believe that replication errors reported
here for the crushed limestone are comparable to replication
errors found when testing many other materials and are,
therefore, indicative of very small differences in specimensa
It is concluded that the Texas Transportation Institute
Gyratory Compactor can be used to make very satisfactory
test specimens for repetitive triaxial testing.
29

7e FINDINGS
Listed below are the more significant findings which
were reached as a result of the investigation discussed in
this report:
1) The procedure given in Appendix A for the Texas Trans
portation Institute Gyratory Compactor can be used
to prepare specimens 8" in height and 6" in dia-
meter that will be suitable for triaxial testing®
Generally, specimens having a greater height will
not be suitable.
2) By controlling the molding moisture content and
varying the compactive effort over a wide range,
specimens having a range of densities and moisture
contents can be produced. These specimens may be
used in studying the effect of moisture content and
density on the deformation characteristics of mater
ial subjected to repetitive loading with expected
errors in the test specimens less than 0.11 per cent
for moisture content and 1.0 pcf for density,
3) The highest densities of the research material (Serv
tex Crushed Limestone). can be obtained at moisture
contents approaching complete saturation; however,
fines and moisture bleed from these specimens making
30

it very difficult to secure reproducilo1lit~:t·-under::
these conditions.
4) Variation between replicate specimens prepared with
the compactor are no greater than variations encoun-'
tered between replicate specimens for use in standard
concrete or wood testing. For example, the replica
tion error in density is 0.6, and in unconfined com
pressive strength the replication error is 6 psi5
During the investigation, it was found that the compac
tor needed ·two modifications not described in Research Report
99-2. That report indicated that a set of plans and a parts
list were available to interested parties. These plans have
been changed to include the modifications listed below~
1) A more accurate flow ·restrictor valve controlling the
gyratory angle.
2) A 4" high spacer block for use in compacting 8"
high specimens in accordance with the recommended
procedure given in Appendix Ae
31

8. REFERENCES
1. Dunlap, Wayne, A.. "Deformation Characteristics of Granular Materials Subjected to Repetitive Triaxial Loading .. " Research Report 27-4, Texas Transportation Institute, College Station, Texas, 1966.
2.. Milberger, L .. J. and Dunlap, Wayne A. "A Gyratory Compactor for Molding Large Diameter Triaxial Specimens of Granular Materials .. " Research Report 99-2, Texas Transportation Institute, College Station, Texas, October, 1966 ..
3. Parsons, W .. Ho "Compaction Characteristics of Crushed Limestone Using the Gyratory Testing Machine." Unpublished Mo S .. Thesis, Texas A&M University, College Station, Texas, 1963 ..
4.. u .. s .. Army Engineer Waterways Experiment Station, Corps of Engineers, Technical Memorandum 3-271, Vicksburg, Mississippi, a series of 9 reports.
5.. Uo S .. Army Engineer Waterways Experiment Station, Corps o£ Engineers, Technical Report 3-595, Vicksburg, Mississippi, Febrriary, 1962.
6o Kimble, F .. W .. and Gibboney, W. B.. "Some Preliminary Investigations in Bituminous Concrete Mix Design and Control Using a Gyratory Compactor." Proceedin2s, Association of Asphalt Paving Technologists, Ann Arbor, Michigan, February, 1961 ..
7 .. Moore, William M .. , "Effect of Variations in Poissons Ratio on Soil Triaxial Testing, "Highway Research Record No., 108, Highway Research Board, Washington, De C .. , ppe 19-30, 1966e
8,. Al.-Layla, M,. T. H. "~ffect of Compaction Method on the CBR Value for Crushed Gravel." Unpublished M .. s. Thesis, Texas A&M University, College Station, Texas, 1966 ..
9.. "Stress Distribution of Granular Masses" Research Proposal for Study No. 2-8-65-99 to the Texas Highway Department from the Texas Transportation Institute ..
32

APPENDIX A - OPERATING PROCEDURE
The operating procedure for the Texas Transportation
Institute Gyratory Compactor reported herein is divided into
two parts. The first part deals with adjustments and settings
of the various compactor variables which, once set, remain
constant for a given series of tests. The second part of the
procedure describes the steps to be allowed for compacting
a specimen with·' the gyratory compactor. Refer to Figure A-1.,
I. Compactor Settings and Adjustments
A. Turn on pump unit using Switch z. Allow pump to run
for a minimum of 15 minutes before using to allow
hydraulic oil to reach a uniform temperature.
B., Gyratory angle The maximum angle of gyration is set
by moving stop screw "A" on upper rotating plate ..
To change the gyratory angle, loosen the large retain
ing nut and turn the stop screw the required number
of revolutions to obtain the desired angle setting.
(12 1/4 revolutions of the stop crew equals approximately
10) .,
c., Number of revolutions - Pre-set counter "B" to cut off
the compactor at the desired number of gyrationsa
D., Vertical pressure - Vertical pressure on the sample
is set on gage C or D. With pump unit running and
33

FIGURE A-1 -GYRATORY COMPACTOR

valve "E" closed, move handle of valve "F" to "Load
On"e Adjust pressure regulator "G" for the desired
vertical load$ Pressure gauqe reading should be first
calibrated with vertical load.
Ee The pressure needed to decrease the gyratory angle and
level the sample is read on gauge "H 11., Move handle
on valve "I" to "Angle On" and adjust regulator "J"
until gauge "H" indicates 500 psi ..
Fe Speed of gyration - Set speed of gyration to 10 gyrations
per minute with hand crank "K"e The speed should be
calibrated with dial settingse
G., Set the micrometer flow restrictor valve "L" so that
the angle is brought back to zero in the desired
number of revolutionse The valve should be calibrated
for various angles and numbers of revolutionso
With these preliminary settings of the compactor variables
made, the compactor is ready f6r operationo It should be
noted that once made, these settings need not be changed for
any series of similar tests., However, if desired, any one
or all the variables can be changed by repeating the appro
priate steps outlined above.,
IIo Compaction of Specimens
A. Place slip rings on the base plate, tighten the cir
cumferential bands around the mold and place the mold on
35

the base plate.,
Be Place one layer of the sample in the molde Insure
that a thin layer of fines is on the bottom next to
the base plate6 After placement of each layer, evenly
distribute the large aggregates in the layer and light
ly spade its periphery with a spatula., Repeat this
process until all 4 layers have been placed in the mold~
leaving a small amount of fines for the top of the
samplee Place a disc of filter paper on top of the
specimen.. Insert the top bearing plate and grease its
top surface with approximately 10 g .. of ordinary gun
greaseo Place the 4" spacer on the bearing plate with
the groove hole to the right ..
c. Place the mold and base plate on the compactor table
and fasten it in place., Install front of mold~ chuck
and tighten the mold boltss
D., Close valve "E" and move handle on valve "F" to "Load
On". With the spacer in the alignment groove on the
pressure head., Open valve "E" and allow pressure
head to apply load to specimen., When vertical move
ment has stopped, the spacer may be releasede Release
load by moving valve "F" to 11 Load Off"" When load is
completely released, close valve "E 11, move valve "F"
to center position and remove split rings from beneath
mold.,
36

Ee Again, hold the 4" spacer in the alignment groove of
the pressure head, open valve "E" and move valve "F"
to "Load On". When vertical movement stops, the 4"
spacer may be released. Apply angle by moving handle
on valve "I" to "Angle On". To start gyration, simul
taneously turn switch "M'' to "On" and move valve "I"
to "Angle Off".
F. When gyration has ended, turn switch "M" to "Off",
set revolution counter to zero and move valve "F" to
"Load Off"o When pressure head has retracted, close
valve "E".
G., Remove the front of···the. mold chuck, loosen the base
plate and slide the mold and base plate slightly for
ward. Remove the circumferential bands from the mold
and separate the mold. Remove the specimen from the
base plate. Height and weight of the sample are recor
ded, and the specimen is ready for testing.,
37

APPENDIX B - DENSITY VARIATIONS WITHIN STABILIZED SPECIMENS
This Appendix contains the data used to compare the density
variations between the 8-inch and 12-inch high compacted speci
mens. The data were obtained by sawing (perpendicular to the
height axis) cement stabilized spe~imens into about 2-inch
high parts. The 12-inch high specimens were, therefore, divided
into six parts (see Table B-1) and the 8-inch high specimens
were divided into 4 parts (see Table B-2). The part numbers
were numbered from the top down; thus, in Table B-1 parts 1
and 6 are the top and bottom respectively. The initial speci
mens (up to specimen No. 1246) were compacted using a Teflon
impregnated ceramic lined mold.
38

TABLE B-1 - DENSITY VARIATION IN 12 IN. HIGH SPECIMENS
Vert. Mold Samp. Pres.· Gyr Ang No. Moist. Mean Std.
No. (psi) (Deg.) Reb. (%) 1 2 3 4 5 6 Value Dev. 1208 150 4 100 2.0 142.2 136.7 132.2 130.6 135.0 142.0 136.4 7.7 1209 150 4 20 2.0 139.6 135.8 133.0 130.0 136.4 138.5 135.6 5.6 1210 250 2 100 2.0 138.7 135.8 132.1 132.7 136.4 140.8 136.1 5.3 1211 250 2 20 2.0 134.0 133.1 130.0 130.3 135.9 136.5 133.3 4.3 1212 150 2 20 2.0 135.6 134.3 131.4 130.3 133.5 137.4 133.8 4.2 1213 150 2 100 6.0 140.2 137.4 132.2 132.8 138.3 144.9 137.6 7.5 1214 150 2 20 6.0 138.4 134.7 133.3 132.1 139.3 139.8 136.3 5.2 1216 250 4 100 6.0 146.1 140.3 135.0 136.5 142.1 146.8 141.1 7. 7 1217 200 3 so 6.0 144.5 139.6 133.5 133~1 138.4 144.6 139.0 8.0 1218 200 3 50 2.0 139.8 136.3 132.6 131.8 136.2 140.4 136.4 5.7 1219 250 4 20 6.0 143.6 140.0 135.1 134.5 139.6 142.8 139.3 6.0 1220 200 3 50 4.0 141.0 137.4 131.4 132.1 138.3 140.5 136.8 6.5 1221 200 2 50 4.0 138.6 135.9 132.1 129.2 136.3 139.3 135.2 6.2
w 1222 200 4 50 4.0 145.0 138.1 132.1 132.5 139.0 142.6 138.2 8.2 \.0 1223 200 3 20 4.0 139.9 134.3 129.8 130.8 136.1 138.3 134.9 6~4
1224 200 3 100 4.0 142.8 138.9 133.3 133.9 144.8 136.7 138.4 7.4 1225 200 3 50 4.0 144.6 140.2 136.5 136.2 140.2 144.4 140.4 5.8 1226 200 3 50 4.0 142.7 137.7 132.1 132.4 136.7 142.1 137.3 7.2 1227 150 3 50 4.0 139.6 137.8 131.4 131.7 135.8 141.6 136.3 6.6 1228 250 3 50 4.0 141.4 138.1 133.1 132.7 138.6 143.5 137.9 6.9 1247 200 2 20 6.0 137.9 136.3 131.3 133.8 136.1 139.1 135.8 4.5 1248 200 2 100 6.0 142.9 136.5 131.5 134.8 139.8 144.~4 138.3 7.8 1249 200 4 20 (:).0 144.4 138.8 134.2 131.7 137.8 143.5 .138.4 7.9 1250 200 4 100 6.0 146.2 140.8 133.9 135.0 140.5 146.2 140.4 8.3 1253 200 4 20 2.0 137.2 133.7 130.4 129.8 133.2 136.1 133.4 4.7 1254 200 4 100 2.0 138.8 135.0 129.6 128.1 134.2 139.9 134.3 7;;5 1255 200 2 100 2.0 137.3 133.5 129.9 130.3 133.7 137.8 133.8 5.3 1256 200 2 20 2 •. 0 134.6 134.1 130.8 130.8 133.7 135.7 133.3 3.2
Analysis of Variance: Within Treatment Standard Deviation -- 4.07 pcf. Within Treatment Coefficient of Variation -- 3.0%

w::::. 0
TABLE B-2 - DENSITY VARIATION IN 8 IN. HIGH SAMPLES
Vert. Mold Samp. Pres. Gyr Ang No. Moist.
No·. (psi) (Deg.) Rev (%) 1 1276 100 4 10 6.0 137.7 1277 300 4 30 6.0 142.2 1278 300 2 10 6.0 138.1 1279 100 2 30 6.0 135.3 1280 100 2 10 2.0 131.4 1281 300 2 30 2.0 137.5 1282 300 4 10 2.0 138.6 1283 100 4 30 2.0 137.8 1284 300 4 10 6.0 140.5 1285 100 4 30 6.0 139.6 1286 100 2 10 6.0 133.3 1287 300 2 30 6.0 138.4 1288 300 2 10 2.0 134.5 1289 100 2 30 2.0 133.9 1290 100 4 10 2.0 134.0 1291 300 4 30 2.0 141.0
Analysis of Variance: Within Treatment Standar Deviation -- 1.31 pcf. Within Treatment Coefficient of variation-- 1 •. 0%.
Density of Sections 2 3
134.7 136.8 143.4 144.4 137.3 136.6 136.3 136.2 133.3 133 .. 4 138.3 139.0 .139. 9 139.2 134.5 133.8 139.9 140.9 137.4 136.4 134.0 133.7 139.7 140.3 134.0 134.3 134.4 135.6 135.2 133.2 140.2 140.1
Mean Std. 4 Value Dev.
138.4 136.9 2.0 145.4 143.8 1.7 139.6 137.9 1.6 138.1 -136.5 1.5 133.2 132.8 1.2 139.1 138.5 0.9 141.3 139.8 1 .. 4 138.1 1-36.0 2.7 140.2 140.4 0.6 141.8 138.8 3.0 133.9 133.7 0.4 140.8 139.8 1.3 136 .. 6 134.8 1.5 136.3 135.0 1.4 135.8 134.6 1.4 142.2 140.9 1.2

APPENDIX C - TEST RESULTS USED TO DETERMINE COMPACTOR CAPABILITIES
This Appendix contains the data used to determine the cap
ability of the compactor to produce specimens of various mois
ture contents and densities suitable for testinge Replication
errors and the equations for moisture content were determined
from the data given in Table C-1~ Estimates baseq on the equa
tions given in Section 5 are also shown in this table., Repli
cation errors for unconfined compressive s·trength and per cent
strain were determined from the data given in Table C-2o
41

TABlE C-1 MOISTURE CONTENT AND DENSITY Of COMPACTED SPECIMENS
MOISTURE CONTENT WET DENSITY
GYRATORY VERT SPECIME·N ANGLE PRESS REVS MOLD MEAS CALC MEAS CALC
1417 3 200 30 6.00 5.48 5.49 149.0 148.4 1418 3 200 30 2.00 1.91 1.94 138.4 138.5 1419 3 200 30 4.00 3.8(t 3.77 141.0 141.2 1420 3 200 30 2.00 1.92 1.94 139.3 138.5 1421 3 200 30 6.00 5.55 5.49 148.3 148.4 1422 3. 200 30 4.00 3.82 3.77 139.8 141.2 1423 3 20·0 30 3.00 2.82 2.87 140.4 139 •. 4
If::,. 1424 3 200 30 1.00 0.91 0.99 137.5 138.2 N 1425 3 200 30 s.oo 4.69 4.65 144.7 144.1
1426 3 200 30 1.00 0.91 o.qq 138.0 138.2 1427 3 200 30 3.00 2.81 2.87 139.4 139.4 1428 3 200 30 5.00 4.79 4.65 144.2 144.1 1430 3 200 30 o.o o.o o.o 140.4 138.1 143Z 3 200 30 3.00 2.89 2.87 139.4 139.4 1433 3 200 30 1.00 0.91 0.99 137.8 138.2 1434 3 200 30 4.00 3.85 3.77 141.0 141.2 1435 3 200 30 6.00 5.53 5.49 149.5 148.4 1436 3· 200 30 2.00 2.01 1.94 139.1 138.5 1438 3 300 30 1.00 0.95 0.99 140.0 139.5 1439 3 300 30 6.00 5.46 5.49 149.8 150.2 1440 3 300 30 2.00 1.92 1.94 139.9 140.0 1441 3 300 30 3.00 2.86 2.87 141.4 140.1t 1442 3 300 30 4.00 3.83 3.77 142.0 142.8 1443 3 300 30 s.oo 4.79 4.65 146.4 145.8 1447 3 1()0 30 2.00 1.90 1.94 136.7 136.0 1449 3 100 30 3.00 2.86 2.87 135.9 136.7 1451 3 100 30 1.00 0.94 0.99· 135.6 135.&

TABLE C-1 fCONTINUEDl
MOISTURE CONTENT WET DENSITY
GYRATORY VERT SPECIMEN ANGLE PRESS REVS MOLD MEAS CALC MEAS CALC
1453 3 100 30 1.00 0.93 0.99 135.2 135.8 1454 3 100 30 6.00 5.62 5.49 147.4 145.4 1456 3 10'0 30 s.oo 4.80 4.65 142.9 141.2 1457 3 100 30 4.00 3.79 3.77 138.8 138.4 1458 .3 100 30 2.00 1.96 1.94 136.0 136.0 1460 3 100 30 3.00 2.85 2.87 137.3 136.7 1466 3 '200 50 3.00 2.89 2.87 141.0 140.6
.r:=:. 1467 3 200 50 2.00 1.95 1.94 140.3 139.6 w
1468 3 200 50 1.00 0.90 0.99 139.3 139.2 1474 3 200 50 3.00 2.85 2.87 141.0 140.6 1475 3 200 50 5.00 4.84 4.65 145.4 145.4 1476 3 zo·o 50 4.00 3.72 3.77 141.8 142.4 1477 3 zoo 50 1.00 0.88 0.99 139.4 139.2 1478 3 200 50 2.00 1.86 1.94 139.9 139.6 1481 3 200 50 o.o o.o o.o 140.5 139.1 1483 3 200 10 3.00 2.85 2.87 138.1 136.9 1484 3 200 10 z.oo 1.98 1.94 136.4 136.1 1485 3 200 10 1.00 0.97 0.99 136.0 135.9 1487 3 200 10 5.00 4.77 4.65 142.0 141.3 1490 3 200 10 o.o o.o o.o 136.2 136.0 1492 3 200 10 5.00 4.58 4.65 142.2 141.3 1493 3 200 10 6.00 5.54 5.49 145.4 145.5 1494 3 200 10 2.00 1.85 1.94 137.1 136.1 1495 3 200 10 3.00 2.80 2.87 137.3 136.9 1496 3 200 10 4.00 3.75 3.77 137.9 138.5 1498 3 200 10 6.00 5.64. 5.49 145.2 145.5 1499 3 200 10 3.00 2.97 2.87 137.3 136.9

TABLE C-1 tCONTJNUEDl
MOISTURE CONTENT WET DENSITY
GYRATORY VERT SPECIMEN ANGLE PRESS REVS MOLD MEAS CALC MEAS CALC
1500 3 200 10 5.00 4.57 4.65 140.7 141.3 1501 3 200 10 t.oo 0.97 0.99 137.0 135.9 1502 3 200 10 z.oo 1.95 1.94 137.0 136.1 1505 3 200 10 o.o o.o o.o 135.8 136.0 1506 3 200 10 4.00 3.88 3.77 137.6 138.5 1507 3 200 10 6.00 5.52 5.49 145.3 145.5 1508 3 200 10 1.00 0.99 0.99 136.9 135.9
~ 1510 3 200 10 4.00 3.78 . 3. 77 137.2 138.5 ~ 1512 3 200 10 o.o o.o o.o 136.3 136.0
1513 3 200 30 5.00 4.78 4.65 145.3 144.1 1515 3 200 50 5.00 4.72 4.65 146.5 145.4 1516 3 200 50 3.00 2.96 2.87 140.5 140.6 1517 3 200 50 6.00 5.17 5.49 150.0 149.8 1518 3 200 50 1.00 0.95 0.99 138.6 139.2 1519 3 200 50 4.00 3.93 3.77 142.7 142.4 1520 3 200 50 2.00 z.oo 1.94 140.1 139.6 1523 3 200 50 6.00 5.28 5.49 150.7 149.8 1524 3 200 50 4.00 3.93 3.77 143.2 142.4 1526 3 200 50 6.00 5.51 5.49 150.0 149.A 1527 3 200 50 o.o o.o o.o 140.1 139.1 1530 3 100 30 2.00 1.95 1.94 135.9 136.0 1531 3 100 30 4.00 3.85 3.77 137.4 138.4 1532 3 100 30 6.00 5.72 5.49 147.1 145.4 15.33 3 100 30 5.00 4.83 4.65 142.6 141.2 1534 3 100 30 1.00 0.97 0.99 135.7 135. 8 1537 3 100 30 4.00 3.82 3.77 137.5 138.4 1538 3 100 30 5.00 5.00 4.65 143.5 141.2

TABLE C-1 tCONTINUEO)
MOISTURE CONTENT WET DENSITY
GYRATORY VERT SPECIMEN ANGLE PRESS REVS MOLD MEAS CALC MEAS CALC
1542 3 ~00 30 s.oo 4.78 4.65 147.1 145.8 1543 3 300 30 4.00 3.89 3.77 143.3 142.8 1545 3 300 30 3.00 2.93 2.87 141.2 140.9 154~ 3 300 30 1.oo 1.07 0.99 139.5 139.5 1547 3 300 30 2.00 2.03 1.94 140.7 140.0 1550 3 300 30 1.00 1.06 0.99 139•4 139.5 1551 3 300 30 2.00 1.90 1.94 140.5 140.0
.a:::., .1553 3 300 30 3.00 2.87 2.87 142.2 140.9 U1 1554 3 300 30 4.00 3.79 3.77 143.5 142.8
1557 3 100 30 3.00 2.89 2.87 137.3 136.7 1558 3 100 30 6.00 5.59 5.49 146.1 145.4 1563 4 200 30 2.00 1.91 1.94 139.2 139.7 1565 4 200 30 4.00 3.81 3.77 141.9 142.5 1566 4 200 30 1.00 0.98 0.99 138.8 139.3 1569 4 200 30 o.o 0.09 o.o 1-38.9 139.1 1574 2 200 30 3.00 2.91 2.87 138.2 137.7 1581 4 200 30 2.00 1.82 1.94 140.4 139.7 1582 4 200 30 1.00 0.90 0.99 140.2 139.3 1583 4 200 30 o.o 0.;02 o.o 138.0 139.1 1584 3 300 30 6.00 5.29 5.49 151.9 150.2 1585 3 300 30 5.00 4.75 4.65 147.9 145.8 1591 4 200 30 1.00 0.99 0.99 139.9 139. 3 1594 4 200 30 4.00 3.80 3.77 142.3 142.5 1597 4 200 30 6.00 5.38 5.49 149.6 149.9 1602 2 200 30 6.00 5.46 5.49 145.9 146. 4 1604 2 200 30 1.oo 0.84 0.99 136.8 136. 6 1606 2 200 30 3.00 2.83 2.87 138.0 137 4 7

TABLE C-1 tCONTINUEDl
MOISTURE CONTENT WET DENSITY
GYRATORY VERT SPECIMEN ANGLE PRESS REVS MOLD MEAS CALC MEAS CALC
1607 2 zoo 30 4.00 3.71 3.77 137.5 139.3 1616 3 200 50 5.00 4.70 4.65 145.7 145.4 1622 4 zoo 30 6.00 5.33 5.49 149.8 149.9 1628 4 200 30 o.o 0.04 o.o 138.1 139.1 1634 4 200 30 2.00 1.76 1.94 139.0 139.7 1637 2 200 30 1.00 0.84 0.99 135.9 136.6 1638 2 200 30 2.00 1.82 1.94 136.7 136.8
~ 1639 2 200 30 3.00 2.73 2.87 137.7 137.7
"' 1640 2 200 30 4.00 3.72 3.77 138.3 139.3 1641 3 200 30 o.o 0.10 o.o 139.2 138.1 1642 3· 200 30 o.o o.os o.o 138.4 138.1 1646 2 200 30 6.00 5.40 5.49 147.5 146.4 1649 3 300 30 6.00 5.00 5.49 149.8 150.2 1654 2 200 30 1.00 0.15 0.99 -137.4 136.6 1657 4 200 30 6.00 4.99 5.49 149.1 149.9 1659 4 200 30 4.00 3.54 3.77 141.2 . 142.5 1669 4 200 30 3.00 2.89 2.87 140.4 140.6 1671 4 200 30 5.00 4.64 4.65 146.0 145.4 1673 2 200 30 o.o 0.15 o.o 136.8 136.6 1679 4 200 30 3.00 2.91 2.81 139.9 140.6 1682 3 200 50 o.o 0.06 o.o 138.1 139.1 1685 2 200 30 5.00 4.73 4.65 141.8 142.2 1686 4. 200 30 5.00 4.69 4.65 146.0 145.4 1687 4 200 30 5.00 4.68 4.65 145.9 145.4 1688 4 200 30 3.00 2.83 2.87 141.3 140.6 1689 2 200 30 2.00 1.85 1.94 137.9 136.8 1691 2 200 30 4.00 3.71 3.77 138.0 139.3

TABLE C-1 tCONTINUEDJ
MOISTURE CONTENT WET DENSITY
GYRATORY VERT SPECIMEN ANGLE PRESS REVS MOlD MEAS CALC MEAS CALC
1692 2 zo-o 30 6.00 5.62. 5.49 145.5- 146.4 1693 2 200 30 o.o o.os o.o 136.5 136.6 1695 2 200 30 2.00 1.84 1.94 137.2 136.8 1696 2 200 30 5.00 4.68 4.65 143.4 142.2 1697 2 200 30 5.00 4.69 4.65 143.1 142.2 1699 2 200 30 o.o 0.10- o.o 136.1 136.6 1705 4 300 50 1.00 1.02 0.99 139.6 141.7
If::>, 1706 4 300 50 3.00 2.89 2.87 142.5 143.3
-....] 1714 2 300 50 1.00 0.99 0.99 137.9 139.0 1715 ? 300 50 3.00 2.97 2.87 140.3 140.4 1719 2 10·0 10 s.oo 4.73 4.65 134.8 136.5 1723 4 300 50 5.00 4.70 4.65 148.6 148.4 1724 4 100 50 1.00 0.89 0.99 136.6 137.9 1726 4 100 50 5.00 4.59 4.65 142.9 143.8 1727 2 300 50 5.00 4.62 4.65 145.0 145.2 1728 4 300 10 1.00 0.88 0.99 137.5 138.4 1730 4 300 10 5.00 4.65 4.65 143.6 144.4 1731 4 300 10 3.00 3.05 2.87 139.6 139.7 1732 4 100 50 3.00 3.08 2.87 137.5 139.1 1733 2 100 10 1.00 1.19 0.99 131.1 132.0 1734 2 100 10 3.00 3.09 2.87 132.4 132.s 1738 4 300 50 2.00 1.63 1.94 142.2 142.2 1740 4 300 50 6.00 5.15 5.49 151.5 153.0 1742 2 100 10, 4.00 3.89 3.77 132.3 133.9 1744 2 300 50 2.00 1.89 1.94 139.7 139.4 1748 4 300 10 4.00 3.81 3.77 141.5 141. 5 1755 4 300 10 6.00 5.85 5.49 147. 2 . 148. 8

~ 00
TABLE C-1 tCONTINUEDl
MOISTURE CONTENT WET DENSITY
GYRATORY VERT SPECIMEN ANGLE PRESS REVS MOLD
1757 2 300 50 4.00 1758 2 300 50 6.00 1759 4 300 50 4.00 1763 2 100 10 6.00 1765 4 300 10 z.oo 1767 4 100 50 2.00 1768 4 100 50 4.00 1769 4 100 50 6.00 1770 2 100 10 2.00
MOisture Content Analysis of Variance: Within Treatment Standard Deviation--0.08% Within Treatment Coefficient of Variation--2.7%
MEAS CALC MEAS CALC
3.84 3.77 140.1 142.2 5.36 5.49 145.5 149.6 3.71· 3.77 143.9 145.3 5.54 5.49 139.7 140.5 1.84 1.94 138.3 138.8 1.84 1.94 137.4 138.2 3.73 3.77 139.0 140.9 4.61 5.49 146.6 148.1 2.04 1.94 131.0 132.0
Wet Density Analysis of Variance: Within Treatment Standard Deviation--0.33 pcf Within Treatment Coefficient of Variation--0.23%

TABLE C-2 - RESULTS OF UNCONFINED COMPRESSION TEST ON REPLICATE SPECIMENS
Vert. Mold Treat. Press. No. Gyr Angle Moist. Comp Str Mean Std. Percent Mean Std.
No. (psi) Rev (Degrees) (%) (Esi) Value Dev. Strain Value Dev. 29.4 0.74
1 100 10 1 2 29.9 28.9 1.4 0.86 0.82 0.07 27.3 0.86
16.3 0.99 2 100 10 1 6 24.3 18.5 6.5 0.97 0.98 0.01
15.1 0.98
75.8 1.23 3 200 30 2 2 66.1 71.2 1.7 1.35 1.23 0.13
71.6 1.10 .1:::-1..0 38.1 1.09
4 200 30 2 6 30.5 33.5 4.0 0.96 1.04 0.07 32.0 1.08
92.1 0.99 5 300 50 1 2 98.8 96.7 3.9 0.86 0.86 0.13
99.0 0.74
79~5 1.00 6 300 50 1 4 86.1 88.8 12.7 1.00 0.96 0.24
100.6 0.87
37.0 1.37 7 300 50 1 6 50.3 37.6 12.4 1.00 1.24 0.21
25.5 1.34
Compressive Strength Analysis of Variance: Per cent Strain Analysis of variance: Within Treatment Standard Deviation -- 7.10 psi. Within Treatment Standard Deviation -- 0.113%. Within Treatment Coefficient of Variation -- 13.3% Within Treatment Coefficient of Variation -- 11.15.

APPENDIX D - REGRESSION TECHNIQUE USED FOR DENSITY EQUATION
Often in the analysis of research data, it becomes desi-
rable to utilize non~linear mathematical models to represent
data. Such models usually require special treatment because
there is no generally applicable solution for handling non-
linear regressions, nor are there existing general computer
programs for such use. The model selected in the analysis of
the density data reported in Section 4 was of this type because
it contained some non-linear ~egression constants. The authors
believe that the technique used may be of some general interest
because many non-linear regressions could be solved in a similar
manner.
As may be varified by inspection of equation 2, the model
used was of the following form:
Y = Ao + A1Xf + AzQ + A3XiQ
Where Y = Dependent Variable
B1 Bz Q = loge (XzXs X4 )
~i, Xz, Xa, X4 =Independent variables
Ao, Al, Az, A3 =Linear ~egression constants.
S1; Sz ~Non-linear regression constants
The critericn for solving the regression constants is the
same as that used for a standard linear regression which minimizes
the mean squared error which occurs when
/
50

1 n A
2:· (Y, - Y;) 2 = Minimum value m i=l 1 1
where y, = ith of n observations of the dependent variable, Y .. J..
Y ,: = Estimated value of Y, from model., 1 1
m = n - number of regression constants.,
The procedure used for evaluating the regression constants
was first to select arbitra~ily three different values for 8 1 ,
'centered around its expected approximate valueo Similarly,
three values were selected for 8 2 • There are 9 possible combi-
nations of the three values for each of the two Bwso For each
of the 9 combinations the mean squared error was found using
a standard linear, multiple regression computer programo A
second degree response surface was then used to relate the S 8 s
to the mean squared error. Again a standard linear multiple
regression computer program was used to determine the best fit
for the response surface. The data for this second regression
were the 9 mean squared errors (dependent variable} and the
corresponding sets of B's (independent variables)o The partial
derivative of the response surface equation with respect to 8 2
gives a linear equation in the two B's., Differentiating with
respect to 82 results in an additional linear equation in the
two B's. Differentiating with respect to 82 results in an
additional. linear equation in the two S 1 s.. The resulting set
of simultaneous equations were then solved for new estimates
51

of the approximate values for the s•s. The process can be
repeated over and over again until the changes in the s•s
become as small as desired.
Table D-1 contains the successive central trial values
used in the determination of the non-linear regression
constants reported in Chapter 4. The three trial values
used in an .·iteration for S. were s. - R. S., and J_ J_ J., J_
s. + R. (i = 1 or 2). Convergence was assumed when the J_ J_
changes in the central values of the s•s became less than
O.OOle
After suitable values for the s•s are found, they are
used in the original model to determine the linear regres-
sion constants.
TABLE D-1 - SUCCESSIVE VALUES OF NON-LINEAR REGRESSION CONSTANTS
:;:I-teration S1 S2 R1 R2 Mean Squared Error
0 1.0000 1.0000 .5000 .5000 1.23146
1 le5103 1 .. 6880 .2500 .3654 .92601
2 1'"6759 1.8756 .1250 .. 1700 .91455
3 1 .. 6844 1.8890 .0625 .0825 .. 91454
4 1 .. 6825 1.8867 .0313 .0412 .. 91454
5 1.6813 1.8856 .0156 .0206 .91454
6 1 .. 6810* 1 .. 8853* .91454
* Convergence criterion met.
52