evaluation of the storm model storm-time corrections for middle latitude
DESCRIPTION
Evaluation of the STORM model storm-time corrections for middle latitude. D. Buresova (1) , L-A. McKinnell (2) , T.Sindelarova (1) , I. Blanco Alegre (3) and B. De La Morena (3) (1) Institute of Atmospheric Physics, Prague, Czech Republic - PowerPoint PPT PresentationTRANSCRIPT
Evaluation of the STORM model storm-time corrections for middle
latitude
D. Buresova(1), L-A. McKinnell(2), T.Sindelarova(1), I. Blanco Alegre(3) and B. De La Morena(3)
(1) Institute of Atmospheric Physics, Prague, Czech Republic
(2) Hermanus Magnetic Observatory, Hermanus, South Africa (3) Ionospheric observatory, El Arenosillo, Huelva, Spain
Outline:
IRI simulation of ionospheric storm effects:STORM model design and results of the previous validations
Occurrence of the positive and negative effects of ionospheric storms over European middle latitudes
Evaluation of the quality of the STORM model ionospheric storm-time corrections over middle latitudes
New results
Conclusions
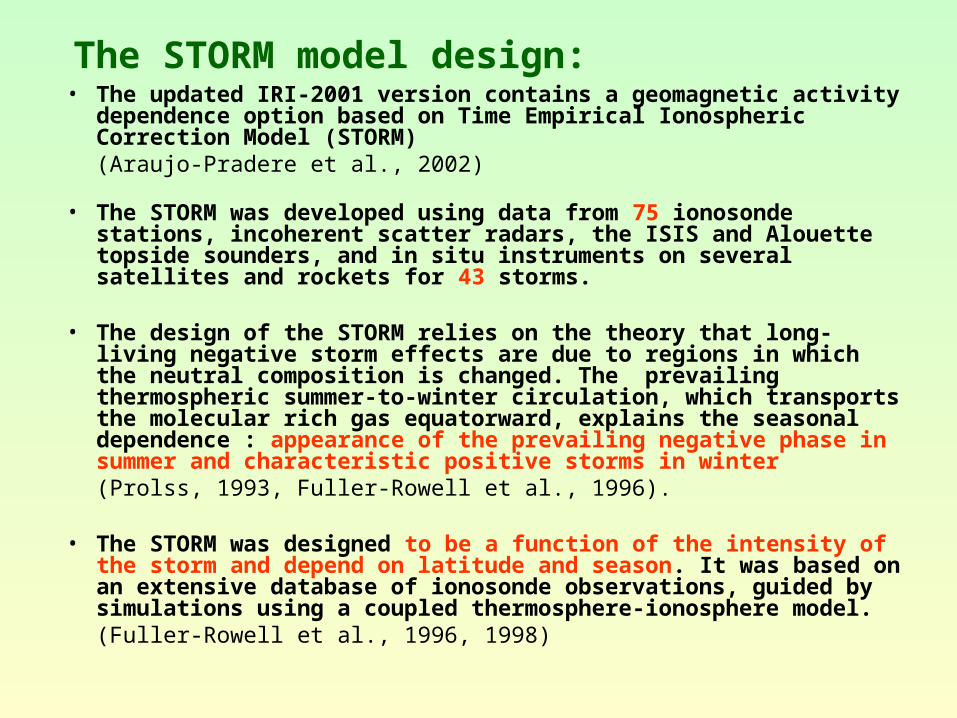
The STORM model design:• The updated IRI-2001 version contains a geomagnetic activity
dependence option based on Time Empirical Ionospheric Correction Model (STORM)(Araujo-Pradere et al., 2002)
• The STORM was developed using data from 75 ionosonde stations, incoherent scatter radars, the ISIS and Alouette topside sounders, and in situ instruments on several satellites and rockets for 43 storms.
• The design of the STORM relies on the theory that long-living negative storm effects are due to regions in which the neutral composition is changed. The prevailing thermospheric summer-to-winter circulation, which transports the molecular rich gas equatorward, explains the seasonal dependence : appearance of the prevailing negative phase in summer and characteristic positive storms in winter (Prolss, 1993, Fuller-Rowell et al., 1996).
• The STORM was designed to be a function of the intensity of the storm and depend on latitude and season. It was based on an extensive database of ionosonde observations, guided by simulations using a coupled thermosphere-ionosphere model.(Fuller-Rowell et al., 1996, 1998)
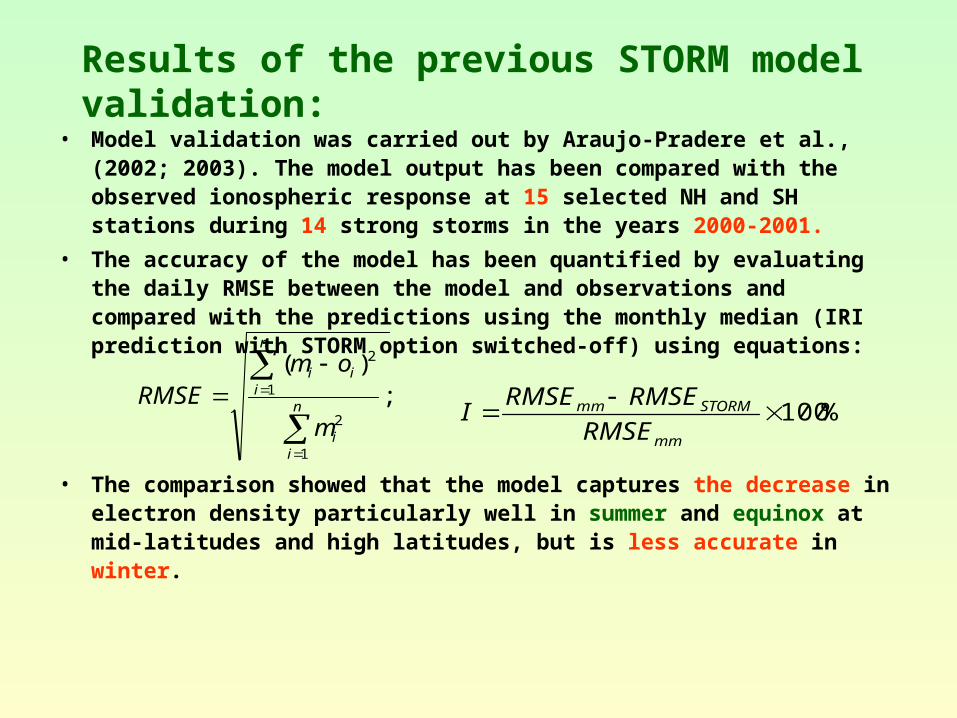
Results of the previous STORM model validation:
• Model validation was carried out by Araujo-Pradere et al., (2002; 2003). The model output has been compared with the observed ionospheric response at 15 selected NH and SH stations during 14 strong storms in the years 2000-2001.
• The accuracy of the model has been quantified by evaluating the daily RMSE between the model and observations and compared with the predictions using the monthly median (IRI prediction with STORM option switched-off) using equations:
• The comparison showed that the model captures the decrease in electron density particularly well in summer and equinox at mid-latitudes and high latitudes, but is less accurate in winter.
;)(
1
2
1
2
n
ii
n
iii
m
omRMSE
%100
mm
STORMmm
RMSE
RMSERMSEI
Results of the previous STORM model validation:
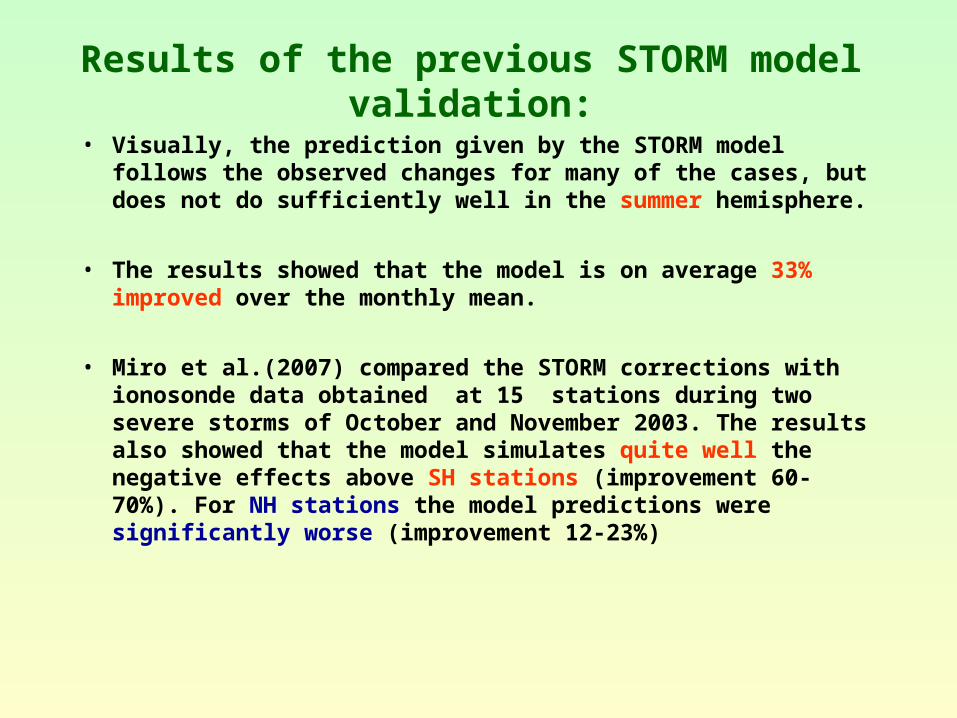
• Visually, the prediction given by the STORM model follows the observed changes for many of the cases, but does not do sufficiently well in the summer hemisphere.
• The results showed that the model is on average 33% improved over the monthly mean.
• Miro et al.(2007) compared the STORM corrections with ionosonde data obtained at 15 stations during two severe storms of October and November 2003. The results also showed that the model simulates quite well the negative effects above SH stations (improvement 60-70%). For NH stations the model predictions were significantly worse (improvement 12-23%)
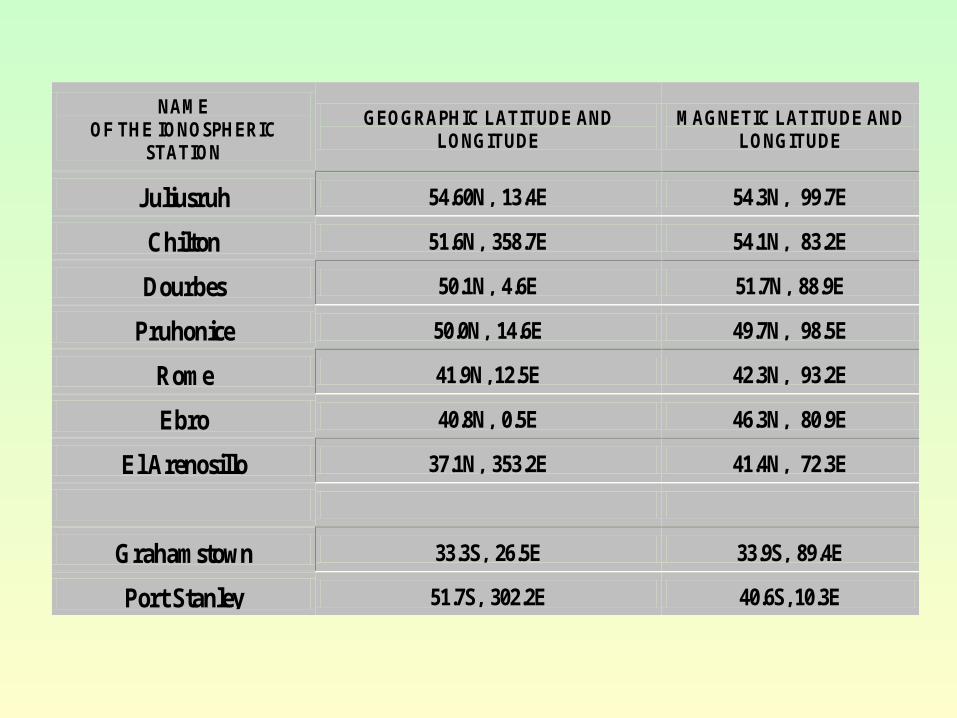
NAME OF THE IONOSPHERIC
STATION
GEOGRAPHIC LATITUDE AND LONGITUDE
MAGNETIC LATITUDE AND LONGITUDE
Juliusruh 54.60N, 13.4E 54.3N, 99.7E
Chilton 51.6N, 358.7E 54.1N, 83.2E
Dourbes 50.1N, 4.6E 51.7N, 88.9E
Pruhonice 50.0N, 14.6E 49.7N, 98.5E
Rome 41.9N, 12.5E 42.3N, 93.2E
Ebro 40.8N, 0.5E 46.3N, 80.9E
El Arenosillo 37.1N, 353.2E 41.4N, 72.3E
Grahamstown 33.3S, 26.5E 33.9S, 89.4E
Port Stanley 51.7S, 302.2E 40.6S, 10.3E
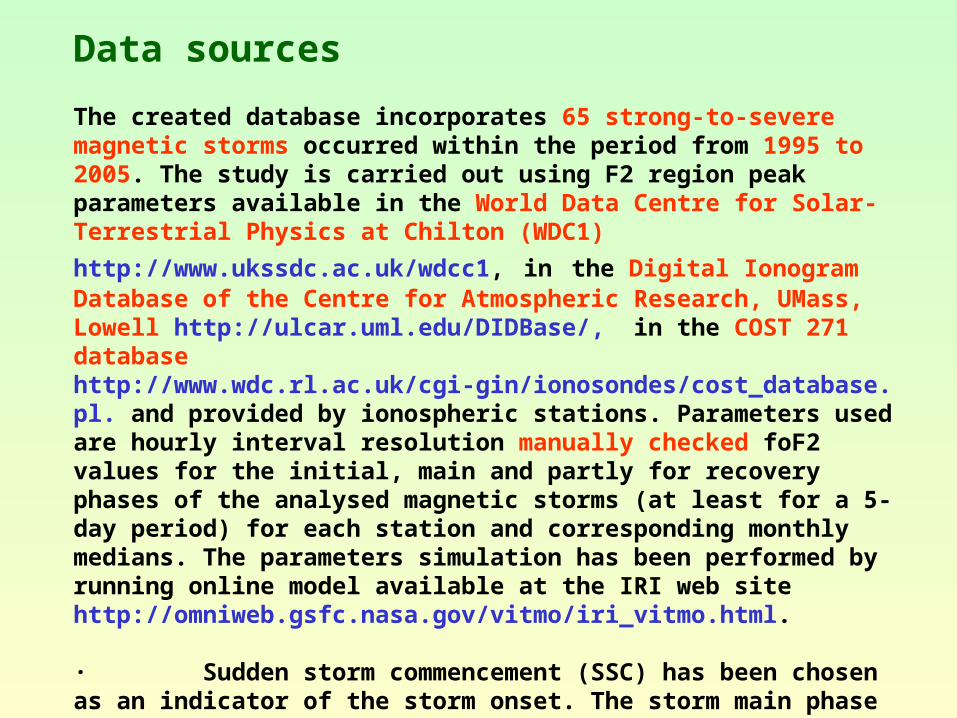
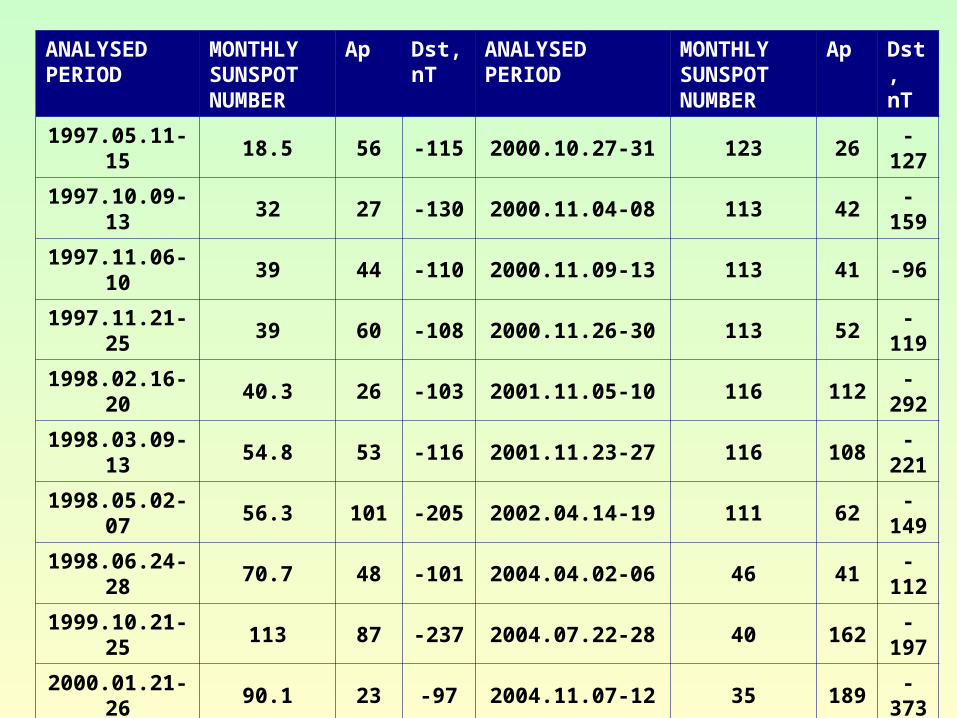
Data sources
The created database incorporates 65 strong-to-severe magnetic storms occurred within the period from 1995 to 2005. The study is carried out using F2 region peak parameters available in the World Data Centre for Solar-
Terrestrial Physics at Chilton (WDC1) http://www.ukssdc.ac.uk/wdcc1, in the Digital Ionogram Database of the Centre for Atmospheric Research, UMass, Lowell http://ulcar.uml.edu/DIDBase/, in the COST 271 database http://www.wdc.rl.ac.uk/cgi-gin/ionosondes/cost_database.pl. and provided by ionospheric stations. Parameters used are hourly interval resolution manually checked foF2 values for the initial, main and partly for recovery phases of the analysed magnetic storms (at least for a 5-day period) for each station and corresponding monthly medians. The parameters simulation has been performed by running online model available at the IRI web site http://omniweb.gsfc.nasa.gov/vitmo/iri_vitmo.html.
· Sudden storm commencement (SSC) has been chosen as an indicator of the storm onset. The storm main phase is defined by the decrease of Dst (decrease in magnetic field strength) and the subsequent recovery phase by its gradual reversal to quiet conditions. · Strong storm conditions were defined when Dst ≤ -100 nT for at least 2 consecutive hours. Storm conditions prevail till Dst < -50 nT.
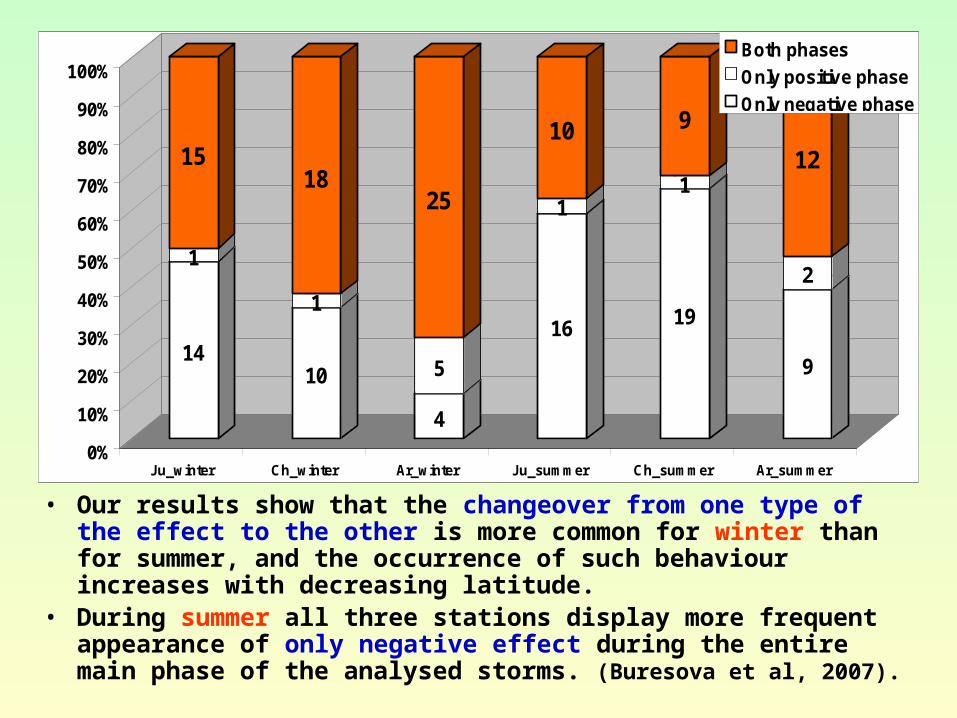
• Our results show that the changeover from one type of the effect to the other is more common for winter than for summer, and the occurrence of such behaviour increases with decreasing latitude.
• During summer all three stations display more frequent appearance of only negative effect during the entire main phase of the analysed storms. (Buresova et al, 2007).
14
1
15
10
1
18
4
5
25
16
1
10
19
1
9
9
2
12
0%
10%
20%
30%
40%
50%
60%
70%
80%
90%
100%
Ju_winter Ch_winter Ar_winter Ju_summer Ch_summer Ar_summer
Both phases
Only positive phase
Only negative phase
ANALYSEDPERIOD
MONTHLY SUNSPOT NUMBER
Ap Dst, nT
ANALYSED PERIOD
MONTHLY SUNSPOT NUMBER
Ap Dst, nT
1997.05.11-15 18.5 56 -115 2000.10.27-31 123 26 -127
1997.10.09-13 32 27 -130 2000.11.04-08 113 42 -159
1997.11.06-10 39 44 -110 2000.11.09-13 113 41 -96
1997.11.21-25 39 60 -108 2000.11.26-30 113 52 -119
1998.02.16-20 40.3 26 -103 2001.11.05-10 116 112 -292
1998.03.09-13 54.8 53 -116 2001.11.23-27 116 108 -221
1998.05.02-07 56.3 101 -205 2002.04.14-19 111 62 -149
1998.06.24-28 70.7 48 -101 2004.04.02-06 46 41 -112
1999.10.21-25 113 87 -237 2004.07.22-28 40 162 -197
2000.01.21-26 90.1 23 -97 2004.11.07-12 35 189 -373
2000.02.11-16 103 52 -133 2005.05.06-10 29 40 -127
2000.04.05-09 103 56 -288 2005.05.14-18 29 105 -263
2000.08.10-14 117 109 -235 2005.08.22-27 28 110 -216
2000.10.03-07 123 96 -175 2005.08.22-27 28 36 -128
2000.10.13-17 123 42 -107

May 1997 magnetic storm
Observed values and output of the STORM model as foF2 ratio for May 1997 storm. The dashed line shows the output of the IRI model, the black line is the observation. An empty square represents the daily RMSE for STORM, and the cross is the IRI with STORM option switched off.
-150
-100
-50
0
50D
st, n
T
0
0.4
0.8
1.2
1.6
Rfo
F2
Juliusruh (54.6°N; 13.4°E)
Chilton (51.6°N; 358.7°E)
14/5/97 15/5/97 16/5/97 17/5/97 18/5/97 19/5/97Days
0
0.4
0.8
1.2
1.6
Rfo
F2
0
0.4
0.8
1.2
1.6
Rfo
F2
0
0.4
0.8
1.2
1.6
Rfo
F2
Rome (41.9°N; 12.5°E)
Tortosa (40.8°N; 0.5°E)
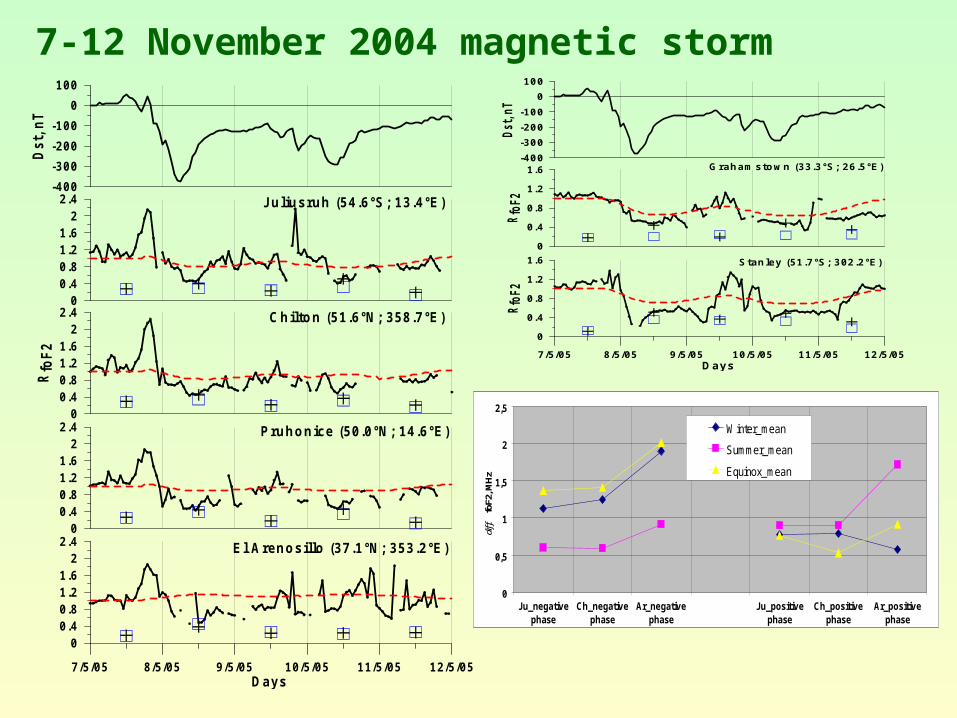
7-12 November 2004 magnetic storm
-400
-300
-200
-100
0
100
Dst
, nT
7/5/05 8/5/05 9/5/05 10/5/05 11/5/05 12/5/05Days
0
0.4
0.8
1.2
1.6
Rfo
F2
Grahamstown (33.3°S; 26.5°E)
Stanley (51.7°S; 302.2°E)
0
0.4
0.8
1.2
1.6
Rfo
F2
-400
-300
-200
-100
0
100
Dst
, nT
00.40.81.21.6
22.4
Juliusruh (54.6°S; 13.4°E)
Pruhonice (50.0°N; 14.6°E)
7/5/05 8/5/05 9/5/05 10/5/05 11/5/05 12/5/05Days
00.40.81.21.6
22.4
00.40.81.21.6
22.4
00.40.81.21.6
22.4
Rfo
F2
Chilton (51.6°N; 358.7°E)
El Arenosillo (37.1°N; 353.2°E)
0
0,5
1
1,5
2
2,5
Ju_negativephase
Ch_negativephase
Ar_negativephase
Ju_positivephase
Ch_positivephase
Ar_positivephase
diff.
foF2
, MH
z
Winter_mean
Summer_mean
Equinox_mean
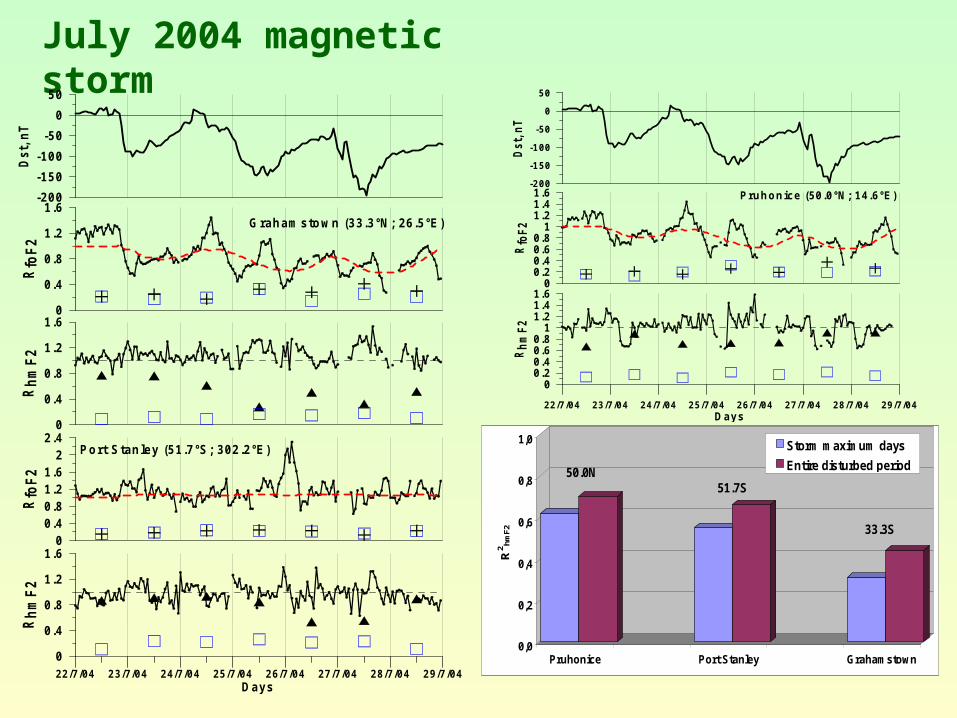
July 2004 magnetic storm
-200
-150
-100
-50
0
50
Ds
t, n
T
00.40.81.21.6
22.4
Rfo
F2
Grahamstown (33.3°N; 26.5°E)
Port Stanley (51.7°S; 302.2°E)
22/7/04 23/7/04 24/7/04 25/7/04 26/7/04 27/7/04 28/7/04 29/7/04Days
0
0.4
0.8
1.2
1.6
Rh
mF
2
0
0.4
0.8
1.2
1.6
Rfo
F2
0
0.4
0.8
1.2
1.6
Rh
mF
2
-200
-150
-100
-50
0
50
Ds
t, n
T
Pruhonice (50.0°N; 14.6°E)
00.20.40.60.8
11.21.41.6
Rfo
F2
22/7/04 23/7/04 24/7/04 25/7/04 26/7/04 27/7/04 28/7/04 29/7/04Days
00.20.40.60.8
11.21.41.6
Rh
mF
2
50.0N51.7S
33.3S
0,0
0,2
0,4
0,6
0,8
1,0
R2
hm
F2
Pruhonice Port Stanley Grahamstown
Storm maximum days
Entire disturbed period
0
5
10
15
20
25
Mea
n i
mp
rove
men
t, %
Winter Summer Equinox
Northern Hemisphere
0
2
4
6
8
10
12
14
16
18M
ean
impr
ovem
ent,
%
Juliusruh Chilton Pruhonice Rome Tortosa ElArenosillo
Northern HemisphereStorm maximum days
Entire disturbed period
0
2
4
6
8
10
12
14
16
18
Mea
n im
prov
emen
t, %
Port Stanley Grahamstown
Southern Hemisphere
Storm maximum days
Entire disturbed period
0
5
10
15
20
25
Mea
n im
prov
emen
t, %
Winter Summer Equinox
Southern Hemisphere
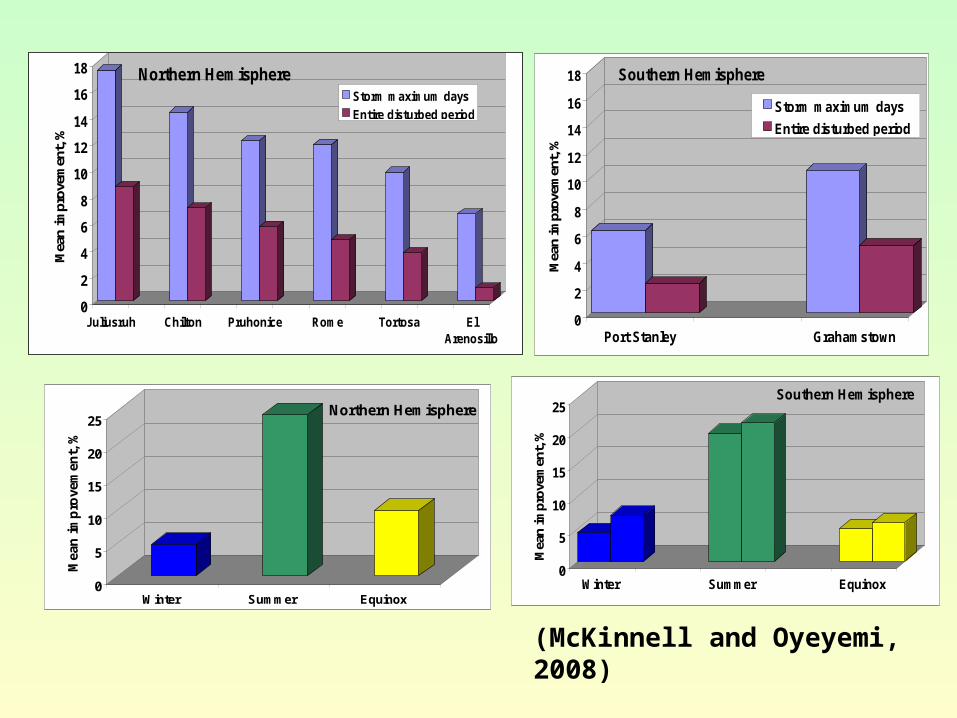
(McKinnell and Oyeyemi, 2008)
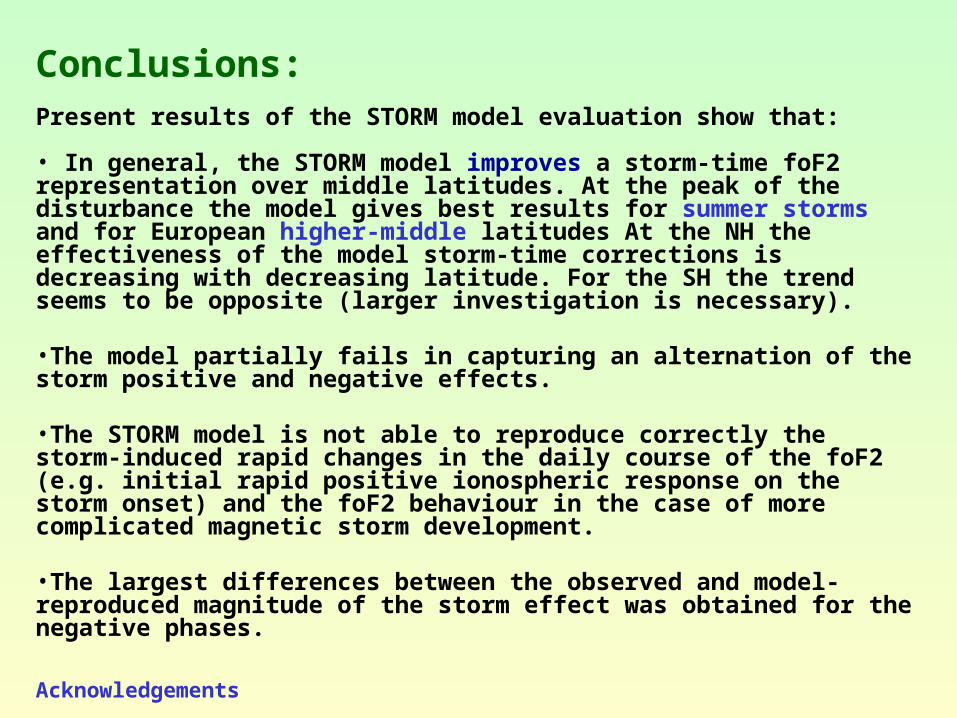
Conclusions:Present results of the STORM model evaluation show that:
• In general, the STORM model improves a storm-time foF2 representation over middle latitudes. At the peak of the disturbance the model gives best results for summer storms and for European higher-middle latitudes At the NH the effectiveness of the model storm-time corrections is decreasing with decreasing latitude. For the SH the trend seems to be opposite (larger investigation is necessary).
•The model partially fails in capturing an alternation of the storm positive and negative effects.
•The STORM model is not able to reproduce correctly the storm-induced rapid changes in the daily course of the foF2 (e.g. initial rapid positive ionospheric response on the storm onset) and the foF2 behaviour in the case of more complicated magnetic storm development.
•The largest differences between the observed and model-reproduced magnitude of the storm effect was obtained for the negative phases.
Acknowledgements
This work has been supported by Grant 1QS300120506 of the Academy of Sciences of the Czech Republic and by Grant 205/08/1356 of the Grant Agency of the Czech Republic. We also thank all data centers and ionospheric observatories for supplying us with data.
Outline of current activities:
• To analyse the storm-time behavior of main ionospheric parameters (e.g. foF2, foF1, hmF2) above single localities.
• To compare the IRI-calculated and observed monthly medians.
• To use the created database for other ionospheric model validation.
• To use the database for NN training.
References:Araujo-Pradere, E. A., and T. J. Fuller-Rowell: A model of a perturbed ionosphere using
the auroral power as the input, Geof. Int., 39(1), 29--36, 2000.Araujo-Pradere E.A, Fuller-Rowell T.J, M.V. Codrescu: STORM: An empirical storm-
time ionospheric correction model –1. Model description, Radio Sci., 37 (5), doi: 10.1029/2001RS002467, 2002.
Araujo-Pradere E.A, T.J. Fuller-Rowell: Storm: An empirical storm-time ionospheric correction model – 2. Validation, Radio Sci., 37 (5), 1071, 2002.
Araujo-Pradere E.A, Fuller-Rowell T.J, M.V. Codrescu, A.Anghel: Evaluation and prospects for storm-time corrections in the International Reference Ionosphere, Adv. Space Res, 33, 908-909, 2004.
Bilitza D.: International reference ionosphere 2002: Examples of improvements and new features, Adv. Space Res, 31 (3), 757-767, 2003.
Buresova, D., J. Lastovicka, and G. de Franceschi: Manifestation of strong geomagnetic storms in the ionosphere above Europe. Space Weather Research towards Applications in Europe, pp. 185-202, ed. J. Lilensten, Springer, Dordrecht, 2007.
Fuller-Rowell, T.J., D. Rees, S. Quegan, R.J. Moffett, M.V. Codrescu, and G.H. Millward: A coupled thermosphere-ionosphere model (CTIM), in STEP: Handbook of Ionosphereic Models, ed. by R. Schunk, 239-279, 1996.
Miro Amarante, G., Cueto Santamaria, M., Alazo, K., and Radicella, S.M.: Validation of the STORM model used in IRI with ionosonde data, Adv. Space Res., 39, 681-686, 2007.
Prölss, G.W.: On explaining the local time variation of ionospheric storm effects, Ann. Geophys. 11, 1-9, 1993.