evaluation of the relationship between capillary and...
TRANSCRIPT
LUND UNIVERSITY
PO Box 117221 00 Lund+46 46-222 00 00
Evaluation of the relationship between capillary and venous plasma glucoseconcentrations obtained by the HemoCue Glucose 201+ system during an oral glucosetolerance test
Ignell, Claes; Berntorp, Kerstin
Published in:Scandinavian Journal of Clinical & Laboratory Investigation
DOI:10.3109/00365513.2011.619703
Published: 2011-01-01
Link to publication
Citation for published version (APA):Ignell, C., & Berntorp, K. (2011). Evaluation of the relationship between capillary and venous plasma glucoseconcentrations obtained by the HemoCue Glucose 201+ system during an oral glucose tolerance test.Scandinavian Journal of Clinical & Laboratory Investigation, 71(8), 670-675. DOI:10.3109/00365513.2011.619703
General rightsCopyright and moral rights for the publications made accessible in the public portal are retained by the authorsand/or other copyright owners and it is a condition of accessing publications that users recognise and abide by thelegal requirements associated with these rights.
• Users may download and print one copy of any publication from the public portal for the purpose of privatestudy or research. • You may not further distribute the material or use it for any profit-making activity or commercial gain • You may freely distribute the URL identifying the publication in the public portal

Take down policyIf you believe that this document breaches copyright please contact us providing details, and we will removeaccess to the work immediately and investigate your claim.
Download date: 10. Jul. 2018
1 (1)
Evaluation of the relationship between capillary and venous plasma glucose concentrations
obtained by the HemoCue Glucose 201+ system during an oral glucose tolerance test
Claes Ignell1 & Kerstin Berntorp
2
1Department of Obstetrics and Gynaecology, Hospital of Helsingborg, Helsingborg, Sweden
2Department of Endocrinology, Lund University, Skåne University Hospital, Malmö, Sweden
Short title: Capillary versus venous plasma glucose
Correspondence to:
Dr Claes Ignell
Department of Obstetrics and Gynaecology
Hospital of Helsingborg
SE-251 87 Helsingborg
Sweden
Phone: +46 42 4062213; Fax: +46 42 4062258; E-mail: [email protected]

1 (16)
Abstract
In 55 women with previous gestational diabetes mellitus, simultaneous capillary and venous
plasma glucose concentrations were measured at 0, 30 and 120 min during a 75 g oral glucose
tolerance test (OGTT). The aims of the study were to examine the relationship between
capillary and venous glucose measurements, and to establish equations for the conversion of
capillary and venous glucose concentrations using the HemoCue Glucose 201+ system.
Additionally, the correlation between the capillary and venous glucose concentrations with
the diagnostic cut-off limits proposed by the WHO 1999 was evaluated. Capillary glucose
concentrations were consistently higher than venous glucose concentrations at all time points
of the OGTT (p < 0.001), and the correlations between the measurements were statistically
highly significant (p < 0.001). The differences between the samples were greatest in the non-
fasting state as revealed by the 95% prediction intervals (mmol/L) in Bland-Altman plots; ±
0.54 at 0 min, ± 2.01 at 30 min, and ± 1.35 at 120 min. Equivalence values for capillary
plasma glucose concentrations derived from this study tended to be higher than those
proposed by the WHO as diagnostic cut-off limits. Stratifying subjects by glucose tolerance
status according to the WHO criteria revealed disagreements related to glucose values close to
the diagnostic cut-off points. The study findings highlight the uncertainty associated with
derived equivalence values. However, capillary plasma glucose measurements could be
suitable for diagnostic purposes in epidemiological studies and when translating results on a
group basis.
Key Words: Agreement, Bland-Altman plot, comparison method, conversion algorithm,
correlation
2 (16)
Introduction
An oral glucose tolerance test (OGTT) is the standard of choice to diagnose diabetes mellitus
or impaired glucose tolerance (IGT) in population studies [1]. While the American Diabetes
Association recommend venous plasma to be used for diagnostic purposes [2], the World
Health Organization (WHO) provides cut-off limits for both venous and capillary glucose
concentrations [1]. However, they give no evidence for their statements. Several reports have
evaluated differences between capillary and venous glucose measurements in whole blood
and plasma [3-6]. Most studies [3-5] indicate no difference in the fasting state, but after a
glucose load the levels are consistently higher in capillary than in venous samples. Several
factors affect the results of the glucose measurements, including the kind of sample material
used [7-9]. Since capillary blood samples are easier to obtain and require less skill, it would
be desirable, both from a scientific and a clinical point of view, if capillary and venous
glucose values could be used interchangeably along the concentration scale by the use of
conversion algorithms. However, this may not be applicable to all analytical systems and
there is a need for more data from the manufacturers to provide reliable information on the
different sample procedures.
Women with gestational diabetes mellitus are at increased risk for the development of
diabetes after pregnancy and should therefore be screened for diabetes postpartum [1, 10]. In
southern Sweden women with gestational diabetes mellitus are offered a 75 g OGTT one year
after delivery to detect those with abnormal glucose tolerance postpartum. Capillary samples
are analyzed using the HemoCue Glucose 201+ system, converting blood glucose to
equivalent plasma glucose concentrations [11, 12]. The aims of the present study were to
examine the relationship between capillary and venous glucose measurements obtained by the
3 (16)
HemoCue device during the OGTT and to establish equations for the conversion of capillary
and venous glucose concentrations. An additional aim was to evaluate the correspondence
between the capillary and venous glucose concentrations obtained in this study with the
diagnostic cut-off limits proposed by the WHO 1999 [1].
Material and methods
Study population
Subjects were recruited from an on-going study in southern Sweden evaluating the effects of
different categories of glucose tolerance during pregnancy on the development of diabetes
mellitus and IGT postpartum [13]. For the present study 55 consecutive non-smoking women
undergoing an OGTT five years after the index pregnancy were included; median (range) age
37 (29--48) years, and BMI 24.4 (18.3--36.2) kg/m2. Participants were predominantly
Scandinavians, with 31% non-European representation and 9% representing other countries in
Europe. During pregnancy 44 women were classified as having abnormal glucose tolerance
and 11 as having normal glucose tolerance.
Measurements
Glucose tolerance was defined according to the WHO 1999 criteria [1] and was measured by
a standard 75 g OGTT, which was performed by one specially trained laboratory assistant.
The test procedure followed the following sequence: after an overnight fast, a Venflon
catheter (Becton Dickinson, Helsingborg, Sweden) was inserted into an antecubital vein.
Duplicate samples of 5 l blood were collected in HemoCue Glucose cuvettes and
immediately analyzed in a HemoCue Glucose 201+ Analyzer (HemoCue, Ängelholm,
4 (16)
Sweden), which converts blood glucose concentrations to equivalent plasma glucose
concentrations by multiplying by an adjustment factor of 1.11 [11, 12]. Immediately
thereafter, glucose concentration was measured in duplicate samples of capillary blood from
the third or fourth fingertip of the non-dominant hand according to the same procedure.
Subsequently, 75 g anhydrous glucose dissolved in 300 mL water was given. The sampling
and measurement procedures were then repeated after 30 and 120 min. All calculations were
performed on mean values from the duplicates.
The study was carried out in accordance with the World Medical Association Declaration of
Helsinki and the Ethics Committee, Lund University, approved the study protocol (LU 259-
00).
Statistical methods
Statistical analysis was performed by SPSS 19.0.0 for Windows (SPSS Inc., Chicago, IL,
USA). Data are presented as mean ± standard deviation (SD). A two-sided p-value of less
than 0.05 was considered significant. The statistical significance of difference between mean
capillary and venous glucose concentrations at each time interval was evaluated by Student’s
paired t-test. Correlations were performed by Pearson’s test. Results obtained for venous and
capillary plasma glucose measurements were compared using the method of Bland and
Altman, in which differences between paired measurements are plotted against the mean of
each pair [14]. Conversion equations were derived according to the method described for not
constant differences [15]. To study the agreement between categories of glucose tolerance
obtained by either capillary or venous glucose measurements a cross table was made. The
overall indicator kappa (κ) was calculated. A value of 0 indicates that agreement is no better

5 (16)
than chance, while values larger than 0.80 indicate very good agreement. Values between
0.61--0.80 may be taken to represent good agreement [16].
Results
Mean imprecision (coefficient of variation) of the duplicate capillary analyses performed in
this study was 1.8%, and of the venous analyses 1.6%.
Mean capillary and venous glucose concentrations obtained during the OGTT are shown in
Table I. For two women venous samples were missing in the fasting state and for three
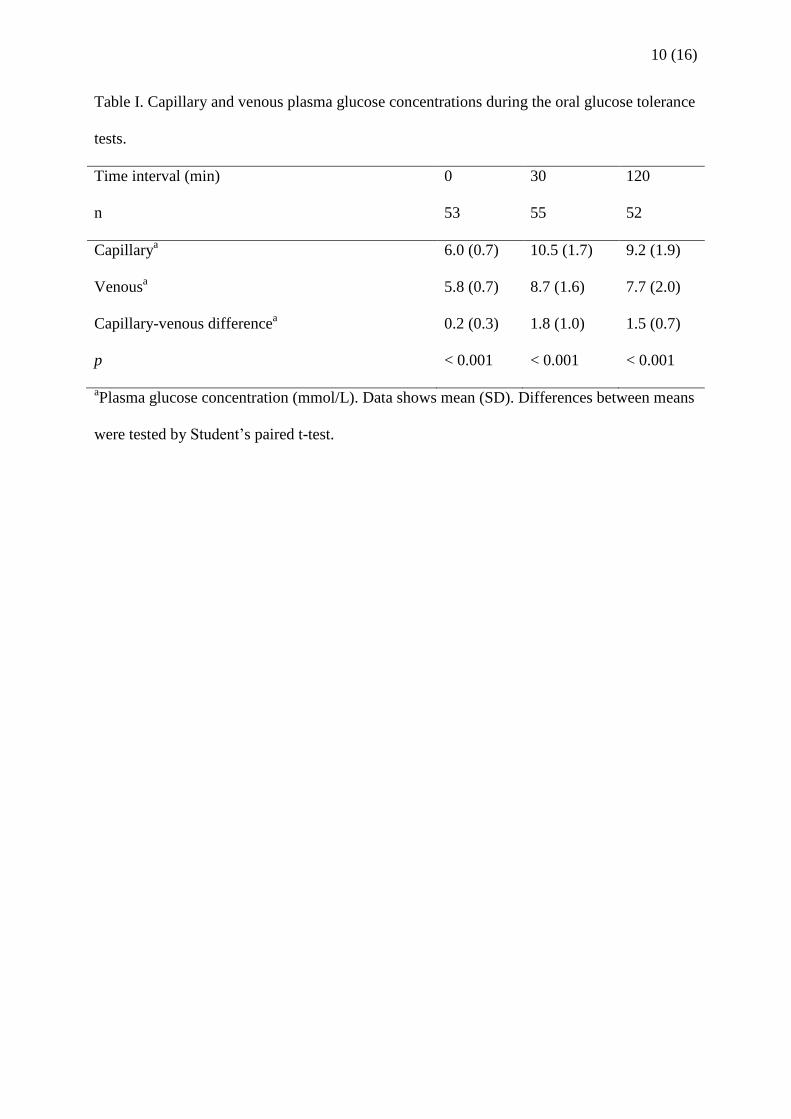
women at 120 min post load. Capillary plasma glucose values were significantly higher than
venous plasma glucose values at all the time points. However, the deviation between the
samples was greatest in the non-fasting state.
The relation between the capillary and venous plasma glucose concentrations at the different
time points of the OGTT are shown in Figure 1, panel a--c. A high correlation was found
during fasting (r = 0.93; p < 0.001), at 120 min post load (r = 0.94; p < 0.001), and to a lesser
extent at 30 min post load (r = 0.81; p < 0.001).
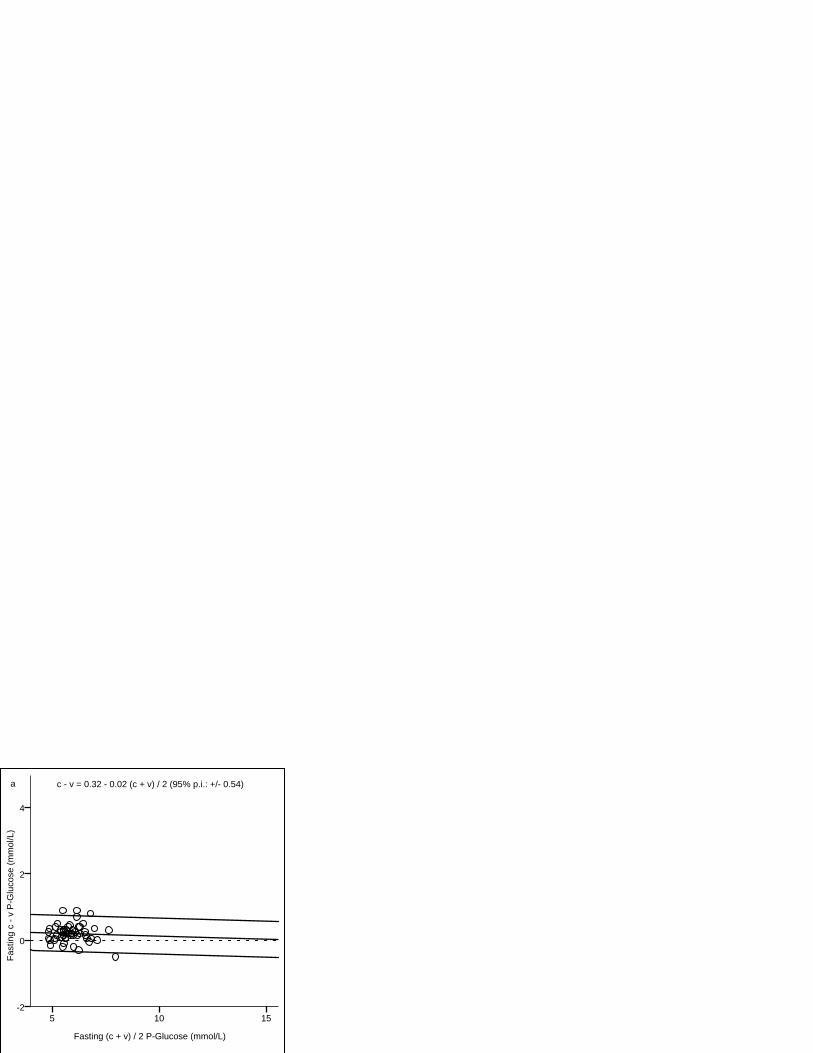
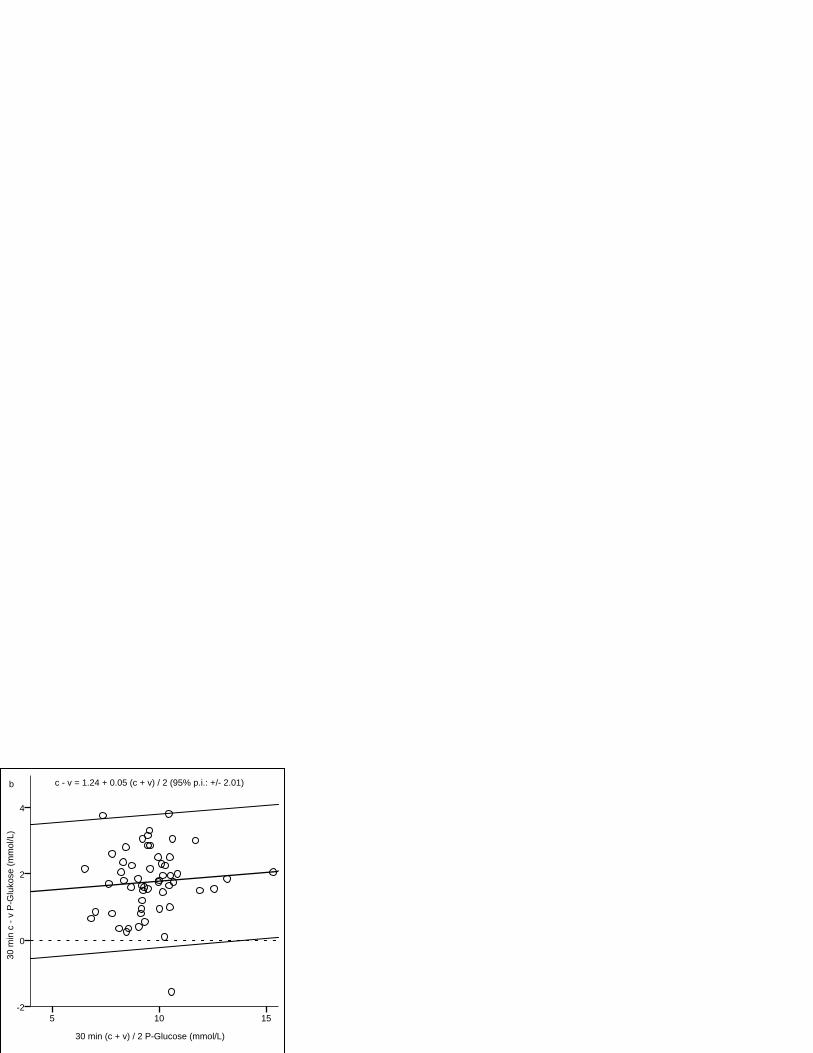
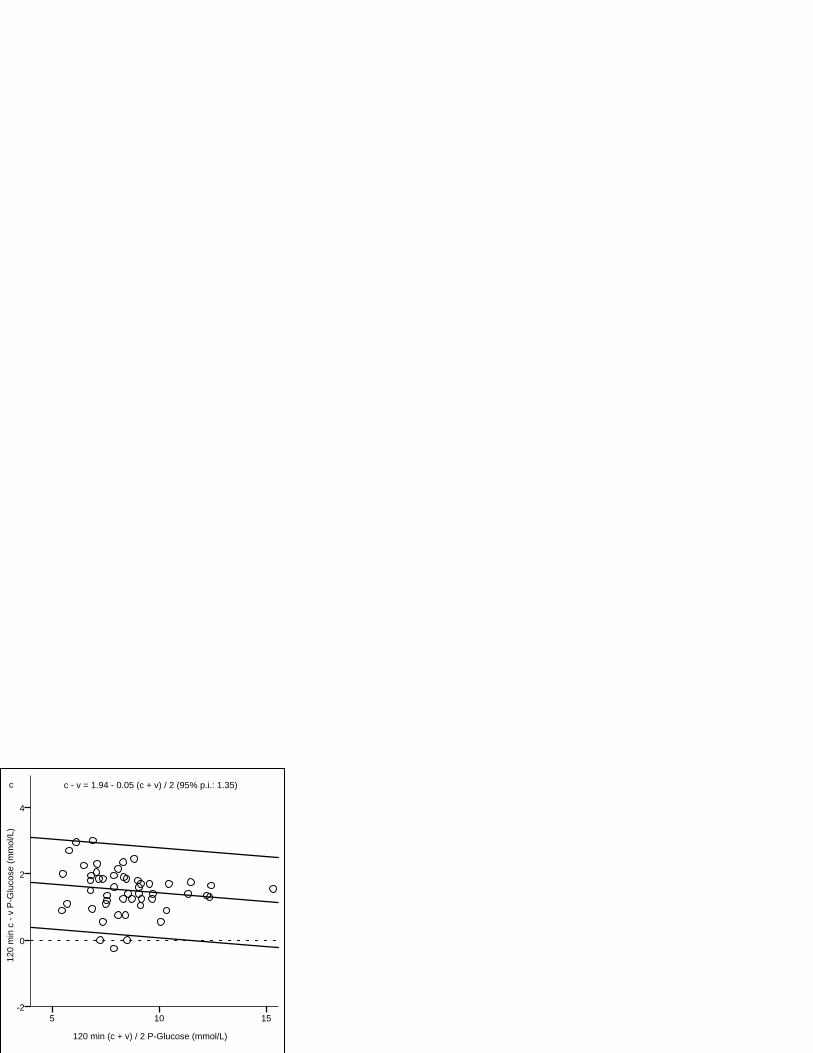
The Bland-Altman difference plots are shown in Figure 2, panel a--c. Capillary glucose
concentrations were consistently higher than venous. Best agreement was found in the fasting
state with data points clustered near the regression line, resulting in a narrow 95% prediction
interval (p.i.). The 30 min glucose values showed the widest p.i., reflecting a greater variation
of differences between capillary and venous samples. Furthermore, the difference increased
6 (16)
with increasing glucose concentrations. In contrast, the regression line for the fasting and 120
min glucose values showed a negative slope with smaller differences between the methods
with increasing glucose values.
According to Carstensen [15], equations were calculated for conversions between the two
measurement methods. The equations, conversion lines and 95% p.i. are shown in Figure 1.
We tested the formulae to compare the equivalence values obtained in this study for venous
and capillary plasma glucose with the corresponding equivalence values published by the
WHO for diagnostic levels of IGT and diabetes [1]. In the fasting state, the capillary plasma
glucose value equivalent to a venous plasma glucose of 7.0 mmol/L derived from this study
was 7.2 mmol/L, compared with the WHO value of 7.0 mmol/L. Similarly, for the venous 2-h
post load values of 7.8 mmol/L and 11.1 mmol/L, the capillary equivalence values were 9.3
mmol/L and 12.4 mmol/L respectively, compared with the WHO values of 8.9 mmol/L and
12.1 mmol/L. The differences were within the 95% p.i.
The women with complete data (n = 50) were stratified by glucose tolerance status as diabetes
mellitus, IGT, or normal glucose tolerance (NGT) according to the WHO 1999 criteria [1]
using either venous (v) or capillary (c) plasma glucose concentrations (Table II). The
consistency in classifying between capillary and venous glucose measurements was 82%
(41/50) and κ was 0.70, indicating good agreement. All women classified as having diabetes
based on venous samples were also classified as having diabetes based on capillary samples.
In the NGT category five out of 26 women were classified as IGT by capillary glucose
criteria. Their capillary 2-h glucose concentrations were in the range 9.0--10.0 mmol/L vs.
7.0--7.7 mmol/L for venous samples. Of the women classified as IGT by venous criteria,
capillary concentrations indicated NGT in three women (2-h venous glucose concentrations in

7 (16)
the range 8.0--8.5 mmol/L vs. 7.8--8.8 for capillary samples), and diabetes in one woman (2-h
venous glucose concentration 10.6 mmol/L vs. 12.4 mmol/L for capillary sample).
Discussion
The HemoCue device is widely used in Sweden for diagnostic purposes. In 2004 glucose
measurements in Sweden switched from blood to plasma glucose and a transformation factor
of 1.11 was agreed on [12]. The HemoCue Glucose 201+ Analyzer was introduced to comply
with the IFCC’s recommendation of reporting plasma glucose. The instrument, which
converts blood glucose concentrations to equivalent plasma glucose concentrations by
multiplying by an adjustment factor of 1.11, has been shown to satisfy the requirements for
diagnostic determination of plasma glucose [11].
The present study found capillary plasma glucose levels to be consistently higher than the
venous levels at all the time points of the OGTT. This finding is in contrast to other published
results that did not find any difference between capillary and venous measurements in the
fasting state [3-5]. However, a more recent study based on a considerably larger number of
subjects (n = 350) reported results similar to ours [6]. In agreement with previous reports [3-
6], the differences were of a greater magnitude after glucose ingestion and were most
pronounced at 30 min post load, coincident with the peak of the glucose curve. Additionally,
as shown by the Bland-Altman plot, the differences at 30 min post load increased with
increasing glucose concentrations. In contrast, glucose concentrations in the fasting state and
at 120 min post load were negatively associated with the differences between the
measurements and the p.i. were not as wide as for the 30 min glucose differences, indicating
8 (16)
less variation. The observed differences may be explained by individual and physiological
variations [17], in part related to glucose uptake and elimination, the capillary samples
primarily reflecting the uptake while the venous values more reflect the elimination.
Equivalence values for capillary plasma glucose concentrations derived from this study
tended to be higher than those proposed by the WHO as diagnostic cut-off limits [1],
especially the 2-h measurements. These results are in agreement with the findings by
Colagiuri et al. [18]. Contrary results were reported by Carstensen et al. [8], who also
demonstrated a greater variability in measurements based on capillary blood compared with
other specimens.
When comparing the classification of glucose tolerance status according to the WHO 1999
criteria [1] for capillary and venous plasma glucose concentrations best agreement was found
among subjects with NGT and diabetes. Scrutinizing measurements of all individuals revealed
discrepancies close to the cut-off limits for either glucose category. Similar results were
obtained in the study by Kruijshoop et al [6], who argued that the lesser agreement in the IGT
category could be due to an artefact, caused by the narrow range of defined cut-off points for
2-h glucose concentrations in IGT. The results are supported by previous studies of the
reproducibility of the OGTT, showing a high intra-individual variation in the 2-h plasma
glucose concentrations, resulting in low reproducibility of the IGT category in particular [19-
21]. As glucose levels increase, the diagnostic impact of the variation in 2-hour glucose
concentrations decreases [19].
A limitation of the study is the rather low number of participants, especially when considering
the number of measurements in the upper glucose range. Furthermore, the study was restricted
9 (16)
to the female gender. Due to these circumstances we are unable to draw any generalized
conclusions from our results. However, our main concern was to focus on differences in a
subsample of women with previous gestational diabetes mellitus as a guide for further
evaluations and decisions.
In conclusion, the study findings highlight the uncertainty associated with derived
equivalence values, which may lead to misclassification when used for diagnostic purposes on
an individual basis. However, capillary plasma glucose measurements could be suitable for
diagnostic purposes in epidemiological studies and when translating results on a group basis.
The results underline the need for more conclusive data from the manufacturers of the
different measuring systems regarding sample impact and correlation.
10 (16)
Table I. Capillary and venous plasma glucose concentrations during the oral glucose tolerance
tests.
Time interval (min) 0 30 120
n 53 55 52
Capillarya 6.0 (0.7) 10.5 (1.7) 9.2 (1.9)
Venousa 5.8 (0.7) 8.7 (1.6) 7.7 (2.0)
Capillary-venous differencea 0.2 (0.3) 1.8 (1.0) 1.5 (0.7)
p < 0.001 < 0.001 < 0.001
aPlasma glucose concentration (mmol/L). Data shows mean (SD). Differences between means
were tested by Student’s paired t-test.

11 (16)
Table II. Classification of glucose tolerance status according to the WHO 1999 criteria for
capillary (c) and venous (v) plasma glucose concentrations.
NGT
(v)
IGT
(v)
Diabetes
(v)
Total
(c)
NGT (c) 21 3 0 24
IGT (c) 5 14 0 19
Diabetes (c) 0 1 6 7
Total (v) 26 18 6 50
Data show numbers. Complete data were available for 50 women.
NGT, normal glucose tolerance; IGT, impaired glucose tolerance
12 (16)
Legends to figures
Figure 1. Scatter plots of capillary (c) and venous (v) plasma glucose concentrations during
oral glucose tolerance test; panel a fasting (n = 53), panel b 30 min (n = 55), panel c 120 min
(n = 52). Equations for the conversions are given. Conversion lines and 95% prediction
intervals (p.i.) are drawn.
Figure 2. Bland-Altman plots of capillary and venous differences (c - v) versus capillary (c)
and venous (v) mean ((c + v) / 2) of plasma glucose concentrations during oral glucose
tolerance test; panel a fasting (n = 53), panel b 30 min (n = 55), panel c 120 min (n = 52).
Lines for the regressions and 95% prediction intervals (p.i.) are drawn. Equations for the
regressions are given.

Fasting vP-Glucose (mmol/L)
15105
Fast
ing
cP-G
luco
se (m
mol
/L)
15
10
5
c = 0.32 + 0.98 v (95% p.i.: +/- 0.53)v = -0.33 + 1.02 c (95% p.i.: +/- 0.55)
a

30 min vP-Glucose (mmol/L)
15105
30 m
in c
P-G
luco
se (m
mol
/L)
15
10
5
c = 1.28 + 1.06 v (95% p.i.: +/- 2.07)v = -1.21 + 0.95 c (95% p.i.: +/- 1.96)
b

120 min vP-Glucose (mmol/L)
15105
120
min
cP
-Glu
cose
(mm
ol/L
)
15
10
5
c = 1.89 + 0.95 v (95% p.i.: +/- 1.32)v = -1.99 + 1.05 c (95% p.i.: +/- 1.39)
c
Fasting (c + v) / 2 P-Glucose (mmol/L)
15105
Fast
ing
c - v
P-G
luco
se (m
mol
/L)
4
2
0
-2
c - v = 0.32 - 0.02 (c + v) / 2 (95% p.i.: +/- 0.54)a
30 min (c + v) / 2 P-Glucose (mmol/L)
15105
30 m
in c
- v
P-G
luko
se (m
mol
/L)
4
2
0
-2
c - v = 1.24 + 0.05 (c + v) / 2 (95% p.i.: +/- 2.01)b
120 min (c + v) / 2 P-Glucose (mmol/L)
15105
120
min
c -
v P
-Glu
cose
(mm
ol/L
)
4
2
0
-2
c - v = 1.94 - 0.05 (c + v) / 2 (95% p.i.: 1.35)c
13 (16)
References
[1] World Health Organisation. Definition, Diagnosis and Classification of Diabetes Mellitus
and its Complications. Report of a WHO consultation. Part 1: Diagnosis and Classification of
Diabetes Mellitus. Geneva: World Health Organization 1999.
[2] American Diabetes Association. Screening for Type 2 Diabetes. Diabetes care
1998;21:20S-2S.
[3] Larsson-Cohn U. Differences between capillary and venous blood glucose during oral
glucose tolerance tests. Scand J Clin Lab Invest 1976;36:805-8.
[4] Eriksson KF, Fex G, Trell E. Capillary-venous differences in blood glucose values during
the oral glucose tolerance test. Clin Chem 1983;29:993.
[5] Kuwa K, Nakayama T, Hoshino T, Tominaga M. Relationships of glucose concentrations
in capillary whole blood, venous whole blood and venous plasma. Clin Chim Acta
2001;307:187-92.
[6] Kruijshoop M, Feskens EJ, Blaak EE, de Bruin TW. Validation of capillary glucose
measurements to detect glucose intolerance or type 2 diabetes mellitus in the general
population. Clin Chim Acta 2004;341:33-40.
[7] Dungan K, Chapman J, Braithwaite SS, Buse J. Glucose measurement: confounding issues
in setting targets for inpatient management. Diabetes care 2007;30:403-9.
[8] Carstensen B, Lindstrom J, Sundvall J, Borch-Johnsen K, Tuomilehto J. Measurement of
blood glucose: comparison between different types of specimens. Ann Clin Biochem
2008;45:140-8.
[9] Dimeski G, Jones BW, Tilley V, Greenslade MN, Russell AW. Glucose meters:
evaluation of the new formulation measuring strips from Roche (Accu-Chek) and Abbott
(MediSense). Ann Clin Biochem 2010;47:358-65.
14 (16)
[10] American Diabetes Association. Gestational diabetes mellitus. Diabetes care 2004;27
Suppl 1:S88-90.
[11] Fogh-Andersen N. Evaluation of HemoCue Glucose Meter (201+): Converting B-
Glucose to P-Glucose. Point of Care 2004;3:172-5.
[12] Burnett RW, D'Orazio P, Fogh-Andersen N, Kuwa K, Kulpmann WR, Larsson L,
Lewnstam A, Maas AH, Mager G, Spichiger-Keller U. IFCC recommendation on reporting
results for blood glucose. Clin Chim Acta 2001;307:205-9.
[13] Anderberg E, Kallen K, Berntorp K. The impact of gestational diabetes mellitus on
pregnancy outcome comparing different cut-off criteria for abnormal glucose tolerance. Acta
Obstet Gynecol Scand 2010;89:1532-7.
[14] Bland JM, Altman DG. Statistical methods for assessing agreement between two
methods of clinical measurement. Lancet 1986;1:307-10.
[15] Carstensen B. Comparing methods of measurement: Extending the LoA by regression.
Statistics in Medicine 2010;29:401-10.
[16] Altman DG. Practical statistics for medical research. London: Chapman and Hall; 1991.
[17] Stahl M, Brandslund I, Jorgensen LG, Hyltoft Petersen P, Borch-Johnsen K, de Fine
Olivarius N. Can capillary whole blood glucose and venous plasma glucose measurements be
used interchangeably in diagnosis of diabetes mellitus? Scand J Clin Lab Invest 2002;62:159-
66.
[18] Colagiuri S, Sandbaek A, Carstensen B, Christensen J, Glumer C, Lauritzen T, Borch-
Johnsen K. Comparability of venous and capillary glucose measurements in blood. Diabet
Med 2003;20:953-6.
[19] Balion CM, Raina PS, Gerstein HC, Santaguida PL, Morrison KM, Booker L, Hunt DL.
Reproducibility of impaired glucose tolerance (IGT) and impaired fasting glucose (IFG)
classification: a systematic review. Clin Chem Lab Med 2007;45:1180-5.

15 (16)
[20] Schousboe K, Henriksen JE, Kyvik KO, Sorensen TI, Hyltoft Petersen P. Reproducibility
of S-insulin and B-glucose responses in two identical oral glucose tolerance tests. Scand J
Clin Lab Invest 2002;62:623-30.
[21] Mooy JM, Grootenhuis PA, de Vries H, Kostense PJ, Popp-Snijders C, Bouter LM,
Heine RJ. Intra-individual variation of glucose, specific insulin and proinsulin concentrations
measured by two oral glucose tolerance tests in a general Caucasian population: the Hoorn
Study. Diabetologia 1996;39:298-305.
16 (16)
Acknowledgements
This study was supported by grants from Thelma Zoéga’s Foundation, the Research Funds of
Malmö University Hospital and the Foundation of the County of Skåne. Vera Gunnarsson is
acknowledged for skilful technical assistance. We are also indebted to Helene Jacobsson,
biostatistician, Competence Centre for Clinical Research, Skåne University Hospital, Lund,
Sweden, for good advice when performing the statistical analyses.
Declaration of interest: The authors report no conflict of interest. The authors alone are
responsible for the content and writing of the paper.