evaluation of the north dakota personal … of the north dakota personal transitional yield...
TRANSCRIPT

Evaluation of the North Dakota Personal
Transitional Yield Insurance Program and
Feasibility Study for National Expansion
Deliverable 1 (Revised)
Evaluation of the North Dakota
Personal Transitional Yield Insurance Program
Contract Number: 1406-N10PC18078/0001
US Department of Interior, Acquisition Services Directorate
Solicitation Number 1406-04-09-CS-21443
Submitted to:
USDA/RMA
Attn: Charles Naglich
6501 Beacon Drive
Kansas City, MO 64133-4676
Submitted by:
Watts and Associates, Inc.
4331 Hillcrest Road
Billings, Montana 59101
July 23, 2010
This document includes data that shall not be disclosed outside of the Government and shall not be duplicated, used,
or disclosed, in whole or in part, for any purpose. The Government shall have the right to duplicate, use, or disclose
the data to the extent provided in Contract 1406-N10PC18078. All pages of this document are subject to this
restriction.

Use or disclosure of information or data Risk Management Agency
contained on this sheet is subject to the Contract No: 1406-N10PC18078 restrictions on the title page of this report.
i
Table of Contents
Section I. Executive Summary ........................................................................................................ 1
Section II. Introduction ................................................................................................................... 3
Section III. Data .............................................................................................................................. 6
Section IV. Program Procedures ..................................................................................................... 8
Section V. Stakeholder Input .......................................................................................................... 9
Section VI. Insurance Experience ................................................................................................. 14
Section VII. Alternative PTY Calculations .................................................................................. 23
Section VIII. Additional Analyses ................................................................................................ 25
Section IX. Summary of Findings ................................................................................................ 42
List of Tables
Table 1. Summary of Business Data for All Eligible Crops Aggregated by
Type of Approved Yield, North Dakota 2007-2009 ....................................................... 15
Table 2. Frequency of Loss among Units by Category of Unit .................................................... 17
Table 3. Liability and Premium per Acre by Category of Approved Yield ................................. 17
Table 4. Summary of Business Data for Crops with Highest Number of Acres
with PTY, 2007-2009 ...................................................................................................... 17
Table 5. Liability per Acre by Designated Category, Selected Crops .......................................... 19
Table 6. Counties in which Acres with PTY Exceeded State Average ........................................ 20
Table 7. Eligible Units that Used T-yield Procedures: Data Standardized to Calculated
Average Yield ................................................................................................................. 21
Table 8. Change in Experience Data and Resultant Loss Ratios and Loss Cost Ratios with
Ineligible Units Excluded and Data Standardized to Average Calculated Yield ............ 22
Table 9. Estimated Experience and Change for Eligible Units that Originally Used T-yield
Procedure when Simple Average PTY is Substituted (Standardized Data).................... 22
Table 10. Estimated Experience for Units Using PTY (Standardized Data) and Change
when T-yield is Substituted for PTY ............................................................................ 23
Table 11. Estimated Experience for Eligible Units that Originally Used T-yield Procedure
when Production-weighted Average PTY is Substituted (Standardized Data) ............ 24
Table 12. Estimated Experience for Eligible Units that Originally Used T-yield
Procedure when Acre-Weighted Average PTY is Substituted (Standardized Data) .... 24
Table 13. Loss Cost Ratios and Loss Ratios for Standardized Data and Three Alternative
Calculations of PTY ...................................................................................................... 24
Table 14. Estimated Experience for Units Using PTY (Standardized Data) when Production
or Acreage-weighted PTYs is Substituted for the Simple Average PTYs ................... 25
Table 15. Effects of Excluding Preventing Planting (PP) Indemnities and Replanting
Payments on Indemnities and Loss Ratios ................................................................... 26
Table 16. Original Standardized Indemnities, Standardized Indemnities without Prevented
Planting and Replanting, and Effects of Substituting T-yield for PTY ........................ 26
Table 17. Number of Annual Actual Yields Used to Construct PTY ........................................... 27
Table 18. Experience Data for Policies with PTY Summary Database and Policies
without PTY Summary Database 2007-2009, North Dakota ....................................... 29
Table 19. Increase in Acres, Liability, Premium, and Indemnity for Units Involving
Proxy Yield Other than as T-yield Type Relative to Original Data ............................. 30

Use or disclosure of information or data Risk Management Agency
contained on this sheet is subject to the Contract No: 1406-N10PC18078 restrictions on the title page of this report.
ii
Table 20. Distribution According to Yield Limitation Flag for Original Type 15
Data, by Batch (Normalized Data) ............................................................................... 31
Table 21. Percentage Distribution According to Yield Limitation Flag, by Batch ...................... 32
Table 22. Distribution According to Yield Limitation Flag After Substitution of PTY
for T-yield and T-yield for PTY (Normalized Data) .................................................... 33
Table 23. Percentage Distribution According to Yield Limitation Flag after
Substitution, by Batch ................................................................................................... 34
Table 24. Changes in Distribution According to Yield Limitation Flag After
Substitution of PTY for T-yield and T-yield for PTY (Normalized Data) ................... 35
Table 25. Movement among Yield Limitation Flags with PTY Substituted for T-yield
and T-yield for PTY, All Years (Normalized Data) ..................................................... 37
Table 26. Distribution among Yield Limitation Flags after Substitution of
Acre-Weighted PTY ..................................................................................................... 38
Table 27. Percentage Distribution of Net Acres and Liability According to Yield
Limitation Flag after Substitution of Acre-Weighted PTY .......................................... 39
Table 28. Distribution among Yield Limitation Flags after Substitution of
Production-Weighted PTY ........................................................................................... 40
Table 29. Percentage Distribution of Net Acres and Liability According to Yield
Limitation Flag after Substitution of Production-Weighted PTY ................................. 41
Table 30. Comparisons of Loss Cost Ratio and Loss Ratio for the Various Scenarios ................ 41
Table 31. Changes in Liability, Premium, and Indemnity, by Percentile of Change in Approved
Yield ................................................................................................................................ 42
List of Appendices
Appendix A. North Dakota Personal Transitional Yield Pilot Insurance Program Sample
Listening Session Agenda
Appendix B. North Dakota Personal Transitional Yield Pilot Insurance Program Insurance
Experience

Use or disclosure of information or data Risk Management Agency
contained on this sheet is subject to the Contract No: 1406-N10PC18078 restrictions on the title page of this report.
1
SECTION I. EXECUTIVE SUMMARY
The United States Department of Agriculture (USDA) Risk Management Agency (RMA)
engaged the Contractor to evaluate the North Dakota Personal Transitional Yield (PTY) Pilot
Program. The contracted evaluation addresses three unique elements. The first is an assessment
of the impact of requiring use of the PTY within the pilot area, as opposed to allowing insureds
to elect the use of the PTY program as an option. The second is an assessment of an alternative
PTY calculation approach using a weighted average in the PTY summary database. These two
elements are specifically addressed in this report. The third element of this contracted
evaluation, an assessment of the feasibility of expanding the program beyond North Dakota
using either the existing PTY calculation procedures or the alternative PTY calculation
procedures, is addressed in a subsequent report as required by the contract. The Contractor has
focused the report on quantitative analysis and stakeholder input, as required by the contract, and
does not provide recommendations concerning any elements of the analysis.
Under the current pilot program, a PTY is calculated using a summary database that combines all
basic and optional unit acreage and production history by crop, practice, type, variety, and
Transitional Yield Map Area (P/T/V/TMA) for a crop policy. Yield for a crop year in the PTY
summary database is the total production divided by the total acreage within that crop year for
the P/T/V/TMA. The PTY is the simple average of the annual values from the summary PTY
database. The calculations require a minimum of four crop years of data, one of which must be
an actual yield. The summary database may contain as many as ten consecutive crop years of
actual or assigned production values. RMA describes these PTY procedures in detail in an
attachment (PM-06-028.1) to the Product Management Bulletin: Informational Memorandum
PM-06-028 announcing the program.
Two primary data sources are used in the required assessments: the crop insurance experience
data collected and maintained by RMA and stakeholder input from listening sessions and trade
show attendees in regions of North Dakota. Data from the RMA crop insurance experience
database for the eligible crops1 were initially segmented into four categories: units using PTY,
units using T-yields, units with all actual yields, and unclassified units. Only data from units
using PTY and from units using T-yields were initially used to evaluate the impact of the use of
the PTY. Unclassified yield records included units coded with yield indicator of K, but with no
annual yields based on any T-yield type. Many of these unclassified units were “added land”
whose approved yields were based on added land procedures. The experience data were
subsequently separated into two mutually exclusive groups: those with a PTY summary
database and those without. These data were used in an analysis that included consideration of
the effects of PTY approaches in North Dakota on cups, floors, and yield substitution.
The Contractor had the opportunity to discuss the PTY Pilot with approximately 150 individuals,
most of whom were North Dakota producers. As a group, the North Dakota producers were
quite pleased with the PTY Pilot program, were enthusiastic about its continuation, and saw few
barriers to its expansion. Two insureds expressed concern about the effects of crop insurance in
general and the PTY program in particular on the prices of agricultural land. One of these two
1 Barley, Canola/Rapeseed, Corn, Dry Beans, Dry Peas, Flax, Grain Sorghum, Millet, Mustard, Oats, Rye, Safflower, Soybeans,
Sunflower Seed, and Wheat.

Use or disclosure of information or data Risk Management Agency
contained on this sheet is subject to the Contract No: 1406-N10PC18078 restrictions on the title page of this report.
2
felt it is particularly important to consider the impact of land prices on entry-level farmers,
particularly if the PTY program encourages a new generation of farmers to begin independent
production. Most producers indicated having a choice between T-yields and PTYs was one of
the most attractive features of the pilot. Those who did not were primarily producers with lesser
need to establish an approved yield for a unit using any proxy yield procedures. Almost all the
insureds indicated they depended on insurance agents to complete all program calculations and
made their decisions based on the liability and premium information supplied by the agents. All
the insurance industry personnel were pleased to be able to offer the PTY option. They had a
strong preference to continue the program as an option rather than as a requirement. None of the
insurance industry personnel expressed concern about the added administrative burden of the
program. A limited number of agents and most insureds indicated they were not aware of the
surcharge associated with the option.
This report includes a detailed quantitative evaluation of the effects of requiring the use of PTY.
To do so, a PTY was calculated for units that had used the standard T-yield approach originally.
Similarly, the standard T-yield replaced the PTY for those units that had used the PTY
originally. Approximately 13 percent of policies and units that originally used the standard T-
yield procedure and 10 percent of net insured acres were eliminated from these calculations due
to lack of one actual yield for the policy. Premiums and indemnities were standardized to the
Type 15 average yields to avoid the confounding effects of the various rating and indemnity
calculations on the subsequent analyses.
The standardized data were used to evaluate the effects of requiring the use of the PTY
procedures. The estimated impact of requiring the use of PTY procedures for those units that
had used the T-yield is small. Some units had higher guarantees; some had lower. The net effect
was a reduction in liability (-0.3 percent), an increase in premium (+1.7 percent), and a reduction
in indemnities (-2.8 percent). However, it should be noted, the premium increase is less than the
5 percent surcharge associated with the PTY. Furthermore, if North Dakota is representative of
all states, a substantial number of policies and units will not have the single actual yield required
to use the PTY procedure.
Substituting the T-yield for PTY on units that originally used PTY results in a substantial
reduction in loss cost ratio and loss ratio for those units. However, unit performance before
substitution was substantially the same as units that used the T-yield. The short data series and
the variable results by year, crop, etc. limits the utility of any test of significance. One could
conclude that program performance was adversely affected in a relative sense by use of the PTY:
losses potentially would have been lower if those units had been forced to use the T-yield
procedures. But, producers also have options to use added land procedures and other methods.
It is quite possible that some units that used PTY might have used those alternatives. Hence, it is
not possible to state unequivocally that losses would have been substantially lower if the PTY
had not been available.
The Contractor evaluated the effect of using an alternative “weighted average” PTY procedure in
place of the current simple average procedure. Each annual average yield was weighted with
either the total production or the total acreage for that year. The production-weighted PTY
approach increases the loss ratio and loss cost ratio. The acreage-weighted PTY calculation

Use or disclosure of information or data Risk Management Agency
contained on this sheet is subject to the Contract No: 1406-N10PC18078 restrictions on the title page of this report.
3
results in substantially the same values as those obtained using the simple average PTY. These
results are similar for units that originally used the T-yield and for units that originally used the
PTY.
At the request of RMA, the Contractor conducted additional analyses regarding the impact of the
PTY on floors, cups, and yield substitution. Information about the distribution of effects over the
crop insurance portfolio is presented to supplement the original analysis which focused on
average outcomes. Within each of the two mutually exclusive groups (policies with a PTY
summary database and policies without this database), units (by P/T/V/TMA if necessary) were
further separated into groups according to yield limitation flag. Substitutions of PTY for
published T-yield and T-yield for published PTY then were made.
The section of the report on these supplemental analyses focuses on the aggregate effects for all
crops included under the pilot for all counties in North Dakota, since relatively few substantive
differences were found among crops or counties. Relatively small changes in loss cost ratios and
loss ratios are observed.
As requested during the Oral Report, the Contractor examined the changes to liability, premium,
and indemnity according to percentile of change in the approved yield resulting from alternative
T-yield approaches. The subset of data used for this purpose included only policies that had at
least one T-yield type in a Type 15 record or that utilized a floor or yield substitution, and that
had at least one actual yield at the policy level. Replacing the simple average PTY for the T-
yield resulted in no change in the liability, a small decrease in premium, and a small increase in
indemnity for this group. The changes were small at all percentiles of change in the approved
yield.
SECTION II. INTRODUCTION
The United States Department of Agriculture (USDA) Risk Management Agency (RMA)
through the Federal Crop Insurance Corporation (FCIC) provides a range of crop insurance
programs for agricultural producers. Actual Production History (APH) insurance, Revenue
Assurance (RA) insurance, and Crop Revenue Coverage (CRC) insurance are structured around
individual producer historical yield databases (APH Databases). The creation and management
of these APH Databases follow published procedures and require considerable attention from the
insured and the agent, especially in cases where the operation is large and multiple crops are
grown. Much of the complexity required by the APH Database system derives from the wide
range of species and varieties, practices, land, and cooperative agreements involved in the
production of crops on large and diverse operations in addition to producer choices regarding
creation of optional units.
An approved yield derived from the APH Database determines the guarantee for most federally-
subsidized crop insurance policies (e.g., more than 80 percent of the book of business in 2009).
In the APH Database, yearly actual, assigned, adjusted transitional-yields and/or unadjusted
transitional yields are summed and the sum is divided by the number of yields. The APH
Database must include at least four yields and may contain up to ten consecutive crop years of
actual or assigned yields. The approved yield used to determine the production guarantee may

Use or disclosure of information or data Risk Management Agency
contained on this sheet is subject to the Contract No: 1406-N10PC18078 restrictions on the title page of this report.
4
incorporate yield adjustments elected under applicable policy provisions, yield revisions/
reductions, or other limitations according to FCIC approved procedures applied when calculating
the approved yield.2
Separate APH Databases are required in many circumstances: basic and optional units and by
P/T/V/TMA to match the actuarial documents. Acreage grown under an organic practice also
requires a separate APH Database. If a producer has fewer than four years of actual data in a
particular APH Database, the database is “completed” using transitional yields (T-yields)
established by RMA. T-yields have played an important role in insurance under the APH
insurance plan and other plans3 that use these values as the basis for establishing an insured’s
expected yield. In North Dakota, almost 40 percent of the acreage insured under the plans using
APH Databases in 2009 was insured using some form of T-yield.
Long crop rotations limit the ability of some insureds to provide four years of actual records for
some APH Databases. Under long rotational patterns involving a variety of crops grown on a
single unit, accumulating four years of actual yields in all APH Databases may require many
years of farming on the unit. While these longer rotations may address best production practices,
using these rotations effectively requires the use of T-yields in an insured’s APH Database. If T-
yields underestimate a producer’s production capabilities, as some producers believe, the
guarantee for a unit would be reduced; the premium could be increased; and as a consequence a
producer’s decisions about crop insurance may be affected.
For the 2000 and 2001 crop years, a Basic Unit APH Transitional Yield Pilot Program (Basic
Unit T-yield Pilot) was offered for five Montana counties (Daniels, Fergus, Hill, Pondera, and
Yellowstone). The T-yields used under this Basic Unit T-yield Pilot were called “personal
transitional yields” (PTY) in a 2000 USDA Manager’s Bulletin.4 The crop year 2000 pilot
applied to eligible crops5 with November 30 and December 31 contract change dates. For 2001,
the pilot procedures were initially intended to apply only to crops with a June 30, 2000 contract
change date. However, the Basic Unit T-yield Pilot was expanded to include crops with
November and December contract change dates for the 2001 crop year and extended to include
the 2002 and 2003 crop years in a 2001 Manager’s Bulletin.6 It is important to note the Basic
Unit T-yield Pilot did not apply to all plans of insurance nor to all coverage levels.7 The
Contractor was not able to find references to the Basic Unit T-yield Pilot program in publicly
available RMA or FCIC documents after the end of the program in the 2003 crop year.
The current PTY Pilot Program was created after, “Some North Dakota policyholders expressed
concern that crop rotations limit their ability to provide four years of actual records and eliminate
the use of T-yields.”8 The Pilot was effective beginning with the 2007 crop year. No precise
duration was specified for the pilot, but Informational Memorandum PM 06-028 stated the
2 USDA, RMA, 2006, 2007 Crop Insurance Handbook, page 7. 3 CRC and RA in particular. 4 USDA, RMA, 2000, Manager’s Bulletin MGR-00-007. 5 Except sugar beets, potatoes, and dry peas (which are authorized for Master Yields which are generally believed to reflect a
producers production capabilities) 6 USDA, RMA, 2000, Manager’s Bulletin MGR-01-005. 7 For example, it was not available for to revenue or CAT insurance programs. 8 http://www.rma.usda.gov/bulletins/rd/2006/PDF/pm06-028.pdf, accessed February 2, 2010.

Use or disclosure of information or data Risk Management Agency
contained on this sheet is subject to the Contract No: 1406-N10PC18078 restrictions on the title page of this report.
5
bulletin was in effect until “rescinded, revised, or upon publication of superseding procedures.”
The FCIC Board of Directors, in consideration of Docket No. CI - Personal T-yield Program –
06-01, Exhibit No. 2834, authorized the PTY Pilot Program through the evaluation period, as
authorized under section 508(g)(B)(ii)(III) of the Federal Crop Insurance Act.9
The current PTY Pilot Program is for eligible Category B APH crops in North Dakota. Eligible
crops under the pilot include barley, canola/rapeseed, corn, dry beans, dry peas, flax, grain
sorghum, millet, mustard, oats, rye, safflower, soybeans, sunflower seed, and wheat. The
purpose of the program is to provide APH procedures that more accurately reflect individual
producer capabilities.10
Under the current PTY program, the insured must provide an acceptable
production report that contains at least one crop year with actual yields for the crop for which the
PTY option is elected. The PTY is then calculated using the insured’s actual yield(s) and
assigned yields, as necessary. The PTY is then used in place of T-yields published in the
Actuarial Documents (or other calculated T-yields authorized by the FCIC 18010 Crop Insurance
Handbook (CIH), such as Simple Average (SA) T-yields for added land).
Under current procedures, the agent completes the summary database by P/T/V/TMA for the
crop elected by the insured. Values in each PTY summary database are total production divided
by total acreage within a crop year. The PTY is then calculated as the simple average of the
annual values from the summary PTY database. An attachment to the RMA informational notice
announcing the pilot11
describes the PTY procedures in detail. The calculations require:
Determining an acre-weighted average of actual/assigned yields for each crop
year for all APH Databases by crop/P/T/V/TMA by dividing total
production by total acres for crop/P/T/V/TMA for each APH crop year;
Calculating the simple average of such annual yields by summing the results for
each crop year as derived above and dividing by the number of APH crop
years;
Including at least 4 but not more than the 10 most recent APH crop year
actual/assigned yields; and
Using county T-yields (adjusted if necessary) to complete four crop years in the
APH Database if there are not at least 4 years of actual/assigned
production.
While these steps appear to be relatively simple, the application of the procedures by crop
P/T/V/TMA has the potential to add substantial complexity, especially when a large variety of
crops and types are grown. Nonetheless, producer and insurance industry response to the PTY
pilot has been substantial and enthusiastic.
RMA engaged the Contractor to evaluate the PTY pilot, including:
(1) An assessment of the impact of requiring use of the PTY within the pilot area, as
opposed to allowing producers to elect it as an option;
9 http://www.rma.usda.gov/fcic/2006/118minutes.pdf, accessed February 2, 2010. 10 USDA, RMA, 2006, Informational Memorandum: PM-06-028. 11 USDA, RMA, 2006, Personal Transitional Yield (PTY) Pilot Program Procedures (North Dakota),
http://www.rma.usda.gov/bulletins/rd/2006/PDF/pm06-028.1-attach.pdf, accessed January, 2009.

Use or disclosure of information or data Risk Management Agency
contained on this sheet is subject to the Contract No: 1406-N10PC18078 restrictions on the title page of this report.
6
(2) An assessment [of] an alternative PTY using a weighted average among years in the
PTY summary database; and
(3) An assessment of the feasibility of expanding the program beyond North Dakota as a
program requirement, as either the existing Pilot PTY or Alternative PTY12
The scope of this evaluation is substantially limited compared to a program evaluation as
described in the Program Evaluation Handbook (FCIC-22010 (09-2005)). Accordingly, the
scope of this report does not address many of the components of a program review identified in
that document. The focus is upon an assessment of the impact use of PTY may have had on
program outcomes during crop years 2007 through 2009 in North Dakota and upon documenting
the reactions of producers and other interested parties in that state regarding the procedure. The
Contractor has structured the remainder of the report to incorporate seven sections including:
An overview of the data considered in the report;
An evaluation of current program procedures;
Discussion of specific themes from the listening sessions including both positive and
negative attributes of the pilot PTY program, potential enhancements, and program
deficiencies as expressed by participants in the listening sessions and interviews;
A preliminary review and evaluation of the existing PTY program in North Dakota;
including an analysis of the impact of the elective nature of the PTY program and an
assessment of the impact of requiring the use of the PTY program in the pilot area;
An assessment of the impact of two alternative PTY calculation procedures;
An assessment of the effects of prevented planting indemnity and replant payments on
the patterns reflected in the previous assessments;
An assessment of the impact of the PTY procedures on cups, floors, and yield
substitutions; and
A summary of the findings in the report.
A subsequent report under this contract addresses issues that might affect the feasibility of
expanding the PTY program beyond North Dakota as a program requirement, using either the
existing or alternate PTY calculation procedures. Pursuant to the instructions in the contract, the
Contractor has focused the report on analysis and does not provide recommendations concerning
any elements of the analysis.
SECTION III. DATA
Two primary data sources are used in these assessments: the crop insurance experience data
collected and maintained by RMA and stakeholder input from listening sessions and trade show
interactions in various regions of North Dakota. Data from the RMA crop insurance experience
database for the eligible crops13
were initially subdivided into categories using the following
criteria applied to the Type 15 data records of the Data Acceptance System administered by
RMA:
12 United States Department of Interior, National Business Center, Acquisition Services Directorate, 2009, Solicitation Number:
14060409CS21443 13 Barley, Canola/Rapeseed, Corn, Dry Beans, Dry Peas, Flax, Grain Sorghum, Millet, Mustard, Oats, Rye, Safflower, Soybeans,
Sunflower Seed, and Wheat.

Use or disclosure of information or data Risk Management Agency
contained on this sheet is subject to the Contract No: 1406-N10PC18078 restrictions on the title page of this report.
7
(1) Units using PTY: Yield indicator is K, the PY common option code is present, and one
or more annual yields has yield type equal to C, E, I, IL, IX, L, N, S, T, TX, or X.14
(2) Units using T-yields but not PTY: Yield indicator is not K, the PY common option
code is not present, and one or more annual yields has yield type equal to C, E, I, IL,
IX, L, N, S, T, TX, or X.
(3) Units with all actual yields: Yield indicator is not K and yield types C, E, I, IL, IX, L,
N, S, T, TX, or X are not present.
(4) Unclassified units. Any unit that did not have characteristics specified for category 1
through 3 was included in this category: Many units in this category had yield indicator
of K, the PY option code was present, but no yield types equal to C, E, I, IL, IX, L, N,
S, T, TX, or X were present.
Only data from Category 1 and an appropriate subset of data from Category 2 were used in the
initial evaluation of the impact of the choice of using PTYs or T-yields by insureds. Units in
Category 2 not including at least one actual yield at the policy level are ineligible for the PTY
program and consequently were eliminated from the dataset used in the evaluation. Categories 3
are not subject to the PTY or T-yield procedures, except when cups, floors, or yield substitutions
are used. Otherwise, approved yields are not based on transitional yield types. As noted
previously, Category 4 records included units coded with yield indicator of K, but with no annual
yields based on the T-yield types. Many of these were added land using an average of the
approved yields and similar situations.
The procedures for calculating the approved yield are complex, involving factors such as
cupping, 60 percent yield substitution, and others. Furthermore, premium calculations involve
many factors, such as optional unit, enterprise unit, and whole farm unit discounts; optional
coverage such as higher levels of prevented planting; late planting reductions; and others.
Indemnity calculations can involve multi-crop reduction, liability adjustment, and other factors.
These calculations can be very complicated in some circumstances and ultimately will affect the
performance of a crop insurance product. The Contractor did not attempt to recreate all the
complexities of the Data Acceptance System for analysis of the effects of requiring PTY
procedures nor for comparison of a simple average PTY and production-weighted or acreage-
weighted PTY calculation procedures. To provide the most transparent analyses, calculations of
liability, premium, and indemnity for these comparisons were standardized to the average yield
from the Type 15 record. The base data from the experience database were recalculated using
the average of the actual data entered in the Type 15 record. The results of these calculations
were then used for comparison of the effects of alternative PTY calculation procedures (i.e.,
simple average PTY, production-weighted PTY, and acreage-weighted PTY) and for the
assessment of the impact of using PTY procedures for all transitional yields after the first year
(so the insured has the requisite production record for establishing a PTY).
Regarding stakeholder input data, the Contractor gathered these data during discussions with
interested and affected parties. The Contractor collected this input during three listening
sessions, two trade shows, and numerous personal and telephonic conversations outside these
14 The term yield indicator refers to a characteristic of the data used to calculate the approved yield. Yield type is associated with
the data for a particular year. Yield types are defined in the Exhibits to the Type 15 record of the Data Acceptance System.
See http://www.rma.usda.gov/FTP/Publications/M13_Handbook/2007/approved/REC15EXH.PDF for the 2007 version.

Use or disclosure of information or data Risk Management Agency
contained on this sheet is subject to the Contract No: 1406-N10PC18078 restrictions on the title page of this report.
8
more structured stakeholder input gathering exercises. The listening sessions were held in Grand
Forks, Williston, and Minot, North Dakota. The trade show stakeholder information gathered
took place at the Prairie Grains Conference and the KMOT Ag Expo. The conversations outside
these venues were held in conjunction with the listening sessions and tradeshows generally
during organized social gatherings for producers and exhibitors.
SECTION IV. PROGRAM PROCEDURES
W&A examined documents that control the program procedures and evaluated these against the
data that have been accumulated under the pilot. There are two documents that specifically
govern the PTY Pilot: a set of procedures issued as an attachment to Product Management
Bulletin: Informational Memorandum PM-06-028 (designated as PM-06-028.1) and the edits
contained in the Appendix III for the Type 15 records. W&A’s interpretation of PM-06-028.1 is
that the choice of using PTY was to be identified by the common option code “PY” included in
the appropriate field in both the Type 11 and the Type 15 records to flag the policies that had
chosen this option. Secondly, the Type 15 record was to include a yield indicator of “K” to
indicate the use of PTY. In other words, if PTY was used in any way to establish the approved
yield for the unit represented by the Type 15 record, the yield indicator field was to be “K.”
However, if the approved yield did not incorporate a PTY in its determination, the yield indicator
was to be any other authorized value. This would facilitate extraction of data for the particular
units on which the PTY was applied.
Extraction of the data for the analysis was hampered because the interpretation outlined above
appeared to the Contractor to have not been followed in all cases. In the three years of available
data for North Dakota, the Contractor found 45,788 units earning premium that had Type 15
records with yield indicator of “K” and a common option code of “PY,” but where all data
entered into the records were actual yields, zero planting years, assigned yields, and similar non-
transitional yields. Summary totals for these records included 5.8 million acres, $1.4 billion of
liability, $251 million of premium, and $157 million of indemnities. The loss ratio for these
records is approximately 0.63, very similar to the loss ratio for units with all actual yields (or
derivatives thereof). The yield indicator “K” was expected to have identified use of the PTY
procedures for establishing the approved yield, but that was not necessarily the case. The
Contractor also identified records with the “PY” common option code (but no PTY summary
database) that used published T-yields for calculating the approved yield.
One criterion used by the Contractor to identify units that used PTY was to search for the “PY”
common option code in both the Type 11 and the Type 15 records. However, during
reconciliation of data for the finalization of this report, the Contractor identified a small number
of units for which PTYs were used, but whose data did not include the “PY” common option
code in both the Type 11 and Type 15 records. The Contractor noted the coding instructions
appear to have caused the PTY procedure to over-ride other yield indicator flags such as an
added land flag.

Use or disclosure of information or data Risk Management Agency
contained on this sheet is subject to the Contract No: 1406-N10PC18078 restrictions on the title page of this report.
9
SECTION V. STAKEHOLDER INPUT
The Contractor gathered stakeholder input during discussions with producers, insurance industry
representatives, extension agents, producer organization representatives, and USDA staff,
including RMA Regional Office staff. The Contractor collected this input during three listening
sessions, two trade shows, and numerous personal and telephonic conversations outside these
more structured stakeholder input gathering exercises. The listening sessions were held in Grand
Forks, North Dakota, on December 9, 2009; in Williston, North Dakota, on January 25, 2010;
and in Minot, North Dakota, on January 29, 2010. The trade shows wherein stakeholder
information was gathered took place at the Prairie Grains Conference at the Alerus Center in
Grand Forks, North Dakota, on December 9 and 10, 2009; and at the KMOT Ag Expo at State
Fair Center on the North Dakota State Fairgrounds in Minot, North Dakota, on January 27
through 29, 2010. Most of the conversations outside these venues were held in conjunction with
the listening sessions and trade shows during social gatherings organized as optional elements of
the trade shows.
Grand Forks
The Contractor staffed a booth in the exhibitor area of the Prairie Grains Conference. Paid
attendance at the conference for 2009 was estimated by the conference organizers at
approximately 600. Attendance in 2009 was down slightly from historical levels due to a period
of extremely cold winter weather. The trade show organizers stated producers with livestock
were less likely to attend in 2009 than in earlier years due to the weather. Paid attendees at the
Prairie Grains Conference were almost exclusively producers, although some of these producers
also serve as agents for companies selling crop insurance. In addition, there were approximately
100 individuals staffing trade show booths at the conference, including insurance industry (4),
financial (2), and government representatives (2). The Contractor made an effort to speak to all
the insurance, finance, and government stakeholders exhibiting at the conference.
The theme of the Contractor’s booth at the conference was “Crop Insurance: North Dakota
Personal Transitional Yield Pilot Program Assessment.” The Contractor’s presence in Grand
Forks was well advertised through producer group emailing, announcements at conference
sessions, and the trade show banners. The Contractor was prepared to supply as much
information about the PTY option as a visitor wished and to receive comments and suggestions
concerning the PTY program from any stakeholders who wished to supply such information.
Those who stopped at the booth were provided a very brief summary of the program elements
and encouraged to express their opinions concerning the PTY Pilot, its tender as an option, and
the possibility that a PTY approach might be expanded outside North Dakota.
The North Dakota Barley Council semi-annual meeting and the North Dakota Grain Growers
Association annual meeting are held in conjunction with the Prairie Grains Conference. During
these meetings, the Contractor made brief announcements about the opportunity to assist in the
evaluation of the North Dakota PTY Pilot Program through individual conversations during the
exhibition and through the more structured listening session whose time and location were
announced.
Use or disclosure of information or data Risk Management Agency
contained on this sheet is subject to the Contract No: 1406-N10PC18078 restrictions on the title page of this report.
10
Listening Session
The Contractor conducted a traditional listening session in Grand Forks on December 9, 2009.
In compliance with the constraints imposed by the Paperwork Reduction Act, the listening
session was driven by an agenda (Appendix A) rather than by specific questions addressed to the
participants. The agenda reviewed the use of T-yields, the history of the PTY concept, the
current PTY procedures, and invited comments concerning benefits and problems with the
program, as well as a period inviting general comment.
Seven producers attended the full session and two participants whose profession was not
identified joined the session while it was in progress. The discussion at the listening session was
lively and informative. Three of the self identified producers used the PTY option for some or
all their crops and four did not use the option. Three of those who did not use the option did not
qualify for use because they had complete sets of actual historical values in all their APH
Databases which did not require yield floors and yield substitution. The other producer who
chose not to use the option had a single year of actual history characterized by very poor
production. His agent advised him to use T-yields.
Trade Show Stakeholder Input
During the 20 hours of open exhibits, the Contractor representatives held more than 40
conversations on the PTY program. Most of these conversations were with individuals who had
not attended the listening session, although a small number of stakeholders from the listening
session stopped by to expand on their comments about the program or to share information they
did not care to present in a more public forum. The conversations ranged from less than 4
minutes to more than 20 minutes in length. The briefest conversations identified stakeholder
reaction to the PTY program. The more protracted conversations included both detailed
discussions of the PTY approach and extensive exploration of the perceived effect of the
program on producer risk management. The participants in these conversations included 36 self-
identified producers and 4 insurance industry representatives who sell crop insurance throughout
North Dakota. The producers who discussed the PTY concept ranged in age from the mid 20s to
approximately 80 and included a very small proportion of female producers. A very limited
number of apparently Hispanic stakeholders stopped for discussions, although from their
comments they appeared to have a limited stake in the insurance of production.
The producer population is characterized primarily by producers who grow at least five crops.
The largest number of crops produced by those who communicated with the Contractor was 15.
Most producers grow their crops on both land they own and land owned by others. Relatively
few operations are vertically integrated (including both production and processing operations).
The overall assessment of the North Dakota PTY Pilot Program was quite positive. Producers
expressed their appreciation of the opportunity to compare PTY with the T-yields and to elect the
more favorable of the two. A number of producers from Minnesota voiced positive reactions to
a potential expansion of the pilot nationwide.
The North Dakota audience was not at all reticent to engage in conversations about insurance in
general. Not all producers who discussed the PTY concept with the Contractor use T-yields.
Only two producers were completely unfamiliar with the option. Both producers and agents
found the PTY concept to be relatively intuitive and of great potential value. Approximately 40
Use or disclosure of information or data Risk Management Agency
contained on this sheet is subject to the Contract No: 1406-N10PC18078 restrictions on the title page of this report.
11
percent of the producers who discussed the PTY option with the Contractor at the trade show
indicated they had no need for PTY, largely because they had complete APH Databases for all
their crops and land. While precluded from surveying the participants by the Paperwork
Reduction Act, the Contractor was able to determine that at least three-fourths of the producers
who expressed an opinion considered the PTY approach a potentially useful tool for risk
management and worthy of expansion. For those who expressed an interest in the PTY concept,
almost all indicated the option to use PTY or T-yields was an important element of the program.
Informal Information Gathering
All totaled, in Grand Forks, the Contractor had conversations outside the more structured venues
with 15 individuals. These included producers, producer organization representatives, and
insurance and financial industry representatives. In general, these conversations reflected a great
deal of enthusiasm for the pilot. Most individuals were aware of the PTY Pilot in general, but
were not aware of some of the program details. Most indicated the evolution of agricultural
production and enterprises required some change from the current system of T-yields.
Summary
In Grand Forks, the Contractor had the opportunity to discuss the PTY Pilot with approximately
60 individuals, most of whom were producers. These producers collectively grow barley,
canola, corn, dry beans, dry peas, flax, oats, safflower, soybeans, sunflower seed, and wheat.
They represented 17 counties in North Dakota and 4 counties in Minnesota. As a group, the
North Dakota producers were quite pleased with the PTY Pilot program, were enthusiastic about
its continuation, and saw no barriers to its expansion. Of those who expressed an opinion about
having a PTY program, most indicated that having a choice between T-yields and PTYs was one
of the most attractive features of the pilot. However, most indicated they depended on agents to
complete all program calculations and made their decisions based on the liability and premium
information supplied by the agents, rather than on an understanding of the details of the program
itself. All the insurance industry personnel were pleased to be able to offer the PTY option.
None expressed concern about the added administrative burden. However, two of the agents
were not aware of the surcharge associated with the option and indicated they did not believe this
element of the program was covered in their training.
Williston
The Contractor conducted a traditional listening session in Williston, North Dakota, at the
Williston Research Extension Center on January 25, 2010. In compliance with the constraints
imposed by the Paperwork Reduction Act, the listening session was intended to be agenda
driven. Extreme winter snows limited participation. Nonetheless, one producer, who was also
an agricultural educator, and one Billings, Montana, RMA Regional Office (RO) representative
attended the session. Due to the limited attendance, the session was conducted as an open forum
although all the topics contained on the agenda were discussed at some point. The discussion at
the listening session was frank and informative.
The producer did not use the PTY option because of his limited production of category B crops.
The RO representative reported general enthusiasm for the current PTY Pilot. He reviewed
elements of the original Basic Unit program in Montana. The RO found the producers in North
Dakota generally enthusiastic for the pilot. Neither producers nor insurance industry personnel
Use or disclosure of information or data Risk Management Agency
contained on this sheet is subject to the Contract No: 1406-N10PC18078 restrictions on the title page of this report.
12
find the program particularly burdensome. Relatively few circumstances have required special
efforts on the part of the RO to support the pilot. Both participants anticipated substantial
producer attendance at the KMOT Ag Expo, and indicated the poor attendance in Williston
should not limit stakeholder input substantially.
Minot
The Contractor shared a large booth in the exhibitor area of the KMOT Ag Expo with the North
Dakota Barley Council and the North Dakota Grain Growers Association. Attendance at the
conference is free. Total attendance for 2010 was estimated by the conference organizers at
25,000 to 28,000. These figures may be misleading because a single individual attending all
three days is counted three times by the organizers. Exhibitors are also included in attendance
estimates. With 350 exhibits, exhibitors may account for at least 1,000 and possibly as many as
3,000 in the total attendance estimate. Furthermore, the Ag Expo attracts many families. A wide
variety of people, both with and without agricultural responsibilities, attend the KMOT Ag Expo.
Attendance in 2010 was down slightly from historical levels due to a period of extremely cold
winter weather. Travel on some secondary routes was limited and producers with livestock were
much less likely to attend in 2010 than at past conferences. The Contractor estimates that
between 1,500 and 2,500 producers with decision-making responsibilities attended the KMOT
Ag Expo.
Exhibitors attending the conference include insurance industry, financial, producer organization,
and government representatives. The Contractor made an effort to speak to at least one
representative in each of the insurance, finance, producer organization, and government exhibit
at the conference. Since producer organization representatives are often producers themselves,
the Contractor stopped for conversations at those exhibits multiple times during the trade show.
The theme of the Contractor’s posters in the booth at the Ag Expo was “A Penny for your
Thoughts on the North Dakota Personal Transitional Yield Pilot Program.” This theme
generated substantial traffic as attendees inquired about the pilot and about the nature of the
thoughts that were solicited. The Contractor was prepared to supply as much information about
the PTY option as a visitor wished. At the least, those who stopped at the booth were provided a
summary of the program elements and encouraged to express their opinions concerning the PTY
Pilot, its tender as an option, and the possibility that such a T-yield approach might be expanded
outside North Dakota. Producers had been notified by email about both the listening session and
the trade show presence. During the Ag Expo, the Contractor was interviewed by Clear Channel
Radio, with the interview broadcast locally. Before the interview the Contractor discussed the
terms of the contract restricting public disclosure and announcements about award with the
interviewer. The interview focused on the nature of the PTY Pilot, the listening session agenda,
and information sought from stakeholders during the review. Following the interview, there was
substantial traffic to the trade show booth, although it is impossible to establish the effects of the
interview on participation.
Listening Session
The Contractor conducted a traditional listening session in Minot on January 29, 2010. In
compliance with the constraints imposed by the Paperwork Reduction Act, the listening session
was driven by an agenda rather than by specific questions to the participants. Five producers

Use or disclosure of information or data Risk Management Agency
contained on this sheet is subject to the Contract No: 1406-N10PC18078 restrictions on the title page of this report.
13
attended the full session. Four of these producers did not use the PTY option because they did
not qualify for use (i.e., they had four or more actual values in all databases which did not
require yield floors and yield substitution). Two insurance industry representatives, one USDA
representative, and one extension officer also attended and participated in the discussion at the
listening session, which was animated and informative. Those attending were all supportive of
the availability of PTYs. They had experienced the effects of T-yields and believed the current
optional PTY approach provided an appropriate mechanism to address some of the disadvantages
of T-yields. One participant was particularly concerned with the effects of PTYs on land values
and commented that an unintended consequence of the program might be to elevate land prices
to the point where entry into farming might be a challenge for new producers.
Trade Show Stakeholder Input
During the 20 hours the two Contractor’s representatives staffed the exhibit, 98 attendees
stopped to discuss the PTY program in particular and crop insurance in general. Fifty-six of
these identified themselves as producers. Six were insurance industry representatives. The
overall assessment of the North Dakota PTY Pilot Program was positive. Producers expressed
their enthusiasm for the opportunity to compare PTYs with the T-yields and to elect the more
favorable of the two. Producers from outside the pilot area (Minnesota, Montana, and
Wisconsin) all voiced positive reactions to a potential expansion of the pilot.
Individual conversations about the PTY program ranged from less than 3 minutes to more than
30 minutes in length. The briefest conversations identified stakeholder reaction to the PTY
program. The more protracted conversations included detailed discussions about the PTY
approach and calculations and extensive exploration of the perceived effect of the program on
producer risk management.
The producers who discussed the PTY concept ranged in age from approximately 20 to more
than 85, and included approximately 15 percent female producers. The producer population was
characterized by producers who grew from 1 to 17 crops. Most producers grow crops on both
land they own and land owned by others. Relatively few operations are vertically integrated,
including both production and processing operations.
While precluded from surveying the participants by the Paperwork Reduction Act, the
Contractor was able to determine that approximately 45 percent of the producers who discussed
the pilot program concept with the Contractor used PTYs. Most of the remaining producers
indicated they had no need for PTY, largely because they had complete APH Databases for all
their crops and land. Two producers were unsure whether they used PTYs although they did use
some form of transitional yields. For those who expressed an interest in the PTY concept, almost
all indicated that the option to use PTY was an important element of the program.
Informal Information Gathering
In Minot, the Contractor had conversations outside the more structured venues with 6
individuals. These included producers and producer organization representatives. In general,
these conversations also reflected a great deal of enthusiasm for the pilot. Most individuals were
aware of the PTY Pilot in general, and some were aware of program details. Most indicated the
changes in agricultural production practices and enterprise structure required some changes from

Use or disclosure of information or data Risk Management Agency
contained on this sheet is subject to the Contract No: 1406-N10PC18078 restrictions on the title page of this report.
14
a system focused on T-yields as crops “migrated” across the state and producers diversified their
operations.
Summary
All totaled, in Minot, the Contractor had the opportunity to discuss the PTY Pilot with more than
110 individuals, more than half of whom were producers. These producers collectively grow
barley, canola, corn, dry beans, dry peas, flax, lentils, mustard, oats, soybeans, sunflower seed,
and wheat. They represented 24 counties in North Dakota. As a group, the North Dakota
producers were happy with the PTY Pilot program, were enthusiastic about its continuation, and
saw no barriers to its expansion. Of those who expressed an opinion about having PTY as a
transitional yield program requirement, most indicated that having a choice between T-yields and
PTYs was a feature of the pilot that contributed to their enthusiasm. Nonetheless, most
producers indicated they depended on agents to complete all program calculations and made
their decisions based solely on the liability and premium information supplied by the agents. All
of the insurance industry personnel were pleased to be able to offer the PTY option. None
expressed concern about the added administrative burden. Several indicated they based their
assessment of the value of the program to a producer on calculations completed using Approved
Insurance Provider (AIP) software. Discussions concerning this software suggested that the
materials available from different AIPs were quite variable.
SECTION VI. INSURANCE EXPERIENCE
This section discusses the analysis required in Statement of Work (SOW) 2.4.1(a) and trends
discovered through that evaluation. Summary statistics regarding election of the option at the
aggregate level for each of the years 2007, 2008, and 2009 are contained in Table 1.15
The
primary focus of this evaluation is on the effect at the aggregate level since this is the level at
which the legal requirement of actuarial adequacy applies to RMA.16
Hence, much of the
discussion will focus on the state-level data that aggregates all crops and counties. However,
certain crop and county comparisons will be made to identify marked differences from the
overall pattern. In 2009, of all the acreage insured with any kind of T-yields in North Dakota,
almost one-third was insured using approved yields established with PTYs. Acreage insured
with PTYs increased from almost 2.0 million in 2007 to almost 2.7 million in 2009. During that
same period, acreage insured using other T-yields decreased from just fewer than 6.3 million to
just fewer than 5.4 million.17
15 Data records Type 11 (acreage) and 15 (APH report) were obtained from RMA as of January 13, 2010. These data are
believed to be nearly complete for the crop year. The record Type 21 (indemnity) data were obtained on the same date, and
likely do not include all indemnities paid for the 2009 crop year. However, the results in percentage terms are believed to be
representative of the frequency of election of the PTY option. Data extracted from the insurance experience dataset and
organized at a variety of different levels are presented in Appendix B. Data by year, crop, and county (a table with more than
6,450 rows) is available upon request. 16 “Rate adequacy can and should be determined for the system as a whole. Adequacy at this level ensures that the system is
financially sound.” From “A Comprehensive Review of RMA APH and Combo Ratemaking Methodology,” page 45. 17 The Contractor’s Underwriting Department using USDA RMA data.

Use or disclosure of information or data Risk Management Agency
contained on this sheet is subject to the Contract No: 1406-N10PC18078 restrictions on the title page of this report.
15
Table 1. Summary of Business Data for All Eligible Crops Aggregated by Type of
Approved Yield, North Dakota 2007-2009
Year
Policies
Earning
Premium
Units
Earning
Premium
Policies
Indemnified
Units
Indemnified
Net
Insured
Acres
(1,000)
Liability
($1,000)
Total
Premium
($1,000)
Indemnity
($1,000)
Loss
Cost
Ratio
Loss
Ratio
Units With All Actual Yields
2007 17,098 39,576 5,800 9,544 3,477 524,662 83,682 54,163 0.10 0.65
2008 16,721 39,654 6,924 13,786 3,640 1,023,225 182,798 132,918 0.13 0.73
2009 16,373 34,576 5,171 7,128 3,666 687,109 114,452 51,279 0.07 0.45
Total 50,192 113,806 17,895 30,458 10,784 2,234,997 380,932 238,360 0.11 0.63
Percent of All
Relevant Data 21 19 20 19 18 18 17 17
Unclassified Units
2007 23,501 75,088 8,268 16,117 7,824 1,201,843 201,632 112,546 0.09 0.56
2008 23,481 76,218 10,998 28,137 8,243 2,331,010 438,117 344,220 0.15 0.79
2009 23,756 68,269 8,514 13,995 8,556 1,613,709 280,610 124,521 0.08 0.44
Total 70,738 219,575 27,780 58,249 24,623 5,146,562 920,359 581,286 0.11 0.63
Percent of All
Relevant Data 30 37 32 36 41 42 42 41
Units Using T-yield
2007 32,618 71,460 9,942 15,490 6,251 857,291 155,734 86,717 0.10 0.56
2008 29,131 63,514 13,257 24,594 5,694 1,388,028 271,233 235,095 0.17 0.87
2009 28,445 55,361 8,560 11,899 5,338 901,212 171,064 86,221 0.10 0.50
Total 90,194 190,335 31,759 51,983 17,283 3,146,531 598,031 408,033 0.13 0.68
Percent of All
Relevant Data 38 32 36 33 29 26 27 28
Units Using PTY
2007 6,432 19,020 2,096 3,662 1,979 342,769 58,251 26,657 0.08 0.46
2008 8,657 25,330 4,245 9,739 2,656 785,250 143,485 119,416 0.15 0.83
2009 9,230 22,201 3,909 5,856 2,674 556,594 99,332 61,207 0.11 0.62
Total 24,319 66,551 10,250 19,257 7,308 1,684,613 301,068 207,280 0.12 0.69
Percent of All
Relevant Data 10 11 12 12 12 14 14 14
All Units
2007 79,649 205,144 26,106 44,813 19,531 2,926,565 499,298 280,083 0.10 0.56
2008 77,990 204,716 35,424 76,256 20,234 5,527,514 1,035,633 831,650 0.15 0.80
2009 77,804 180,407 26,154 38,878 20,234 3,758,624 665,458 323,227 0.09 0.49
Total 235,443 590,267 87,684 159,947 59,999 12,212,703 2,200,390 1,434,960 0.12 0.65
For the three years, 2007 through 2009, approximately 60 million acres of the eligible crops in
North Dakota, excluding acres insured under CAT, were insured under Federal crop insurance
programs, generating about $12 billion of liability and about $2.2 billion of total premium.
Indemnities were about $1.4 billion, resulting in an overall loss ratio of approximately 65
percent. Units on which the PTY option was elected by insureds represented approximately 12
percent of acres, and about 14 percent of liability, premium, and indemnities. The loss ratio for
the units using PTY for their approved yields was marginally higher than the state average loss

Use or disclosure of information or data Risk Management Agency
contained on this sheet is subject to the Contract No: 1406-N10PC18078 restrictions on the title page of this report.
16
ratio for these crops (excluding CAT) at 69 percent versus 65 percent.18
Policies and units
insured using PTY procedures represent 10 to 11 percent of policies earning premium and units.
T-yields were used for substantially more policies, units, and acres than were PTYs. However, it
would not be correct to state that all the insureds using T-yields “chose” to use them, since some
of the insureds using T-yields were ineligible for the PTY option (i.e., they had no actual yield in
the required database for the policy, crop, type, practice, variety, or TMA). An unknown number
of insured using T-yields in North Dakota may have been unaware the PTY was available. A
discussion of the awareness of producers regarding the PTY option is contained in the section
addressing stakeholder input. Based on the self-selected sample of people who provided input,
awareness was quite high.
Regardless of cause, policies insured using assigned (non-PTY) T-yields represent 26 to 29
percent of liability, premium, indemnity, and acres (in the order of the range), slightly more than
twice the same measures for PTY. The loss ratio for this category at 68 percent also exceeded
the state average at 65 percent. This group represented more than 38 percent of policies earning
premium and 32 percent of insured units.
Loss ratios among categories of procedures used to establish approved yields are consistent with
results observed from previous work. Typically, the loss ratio on units where the approved yield
is based on all actual yield types is lowest. That is the case for this dataset. Since insureds opted
into the PTY procedures, one would expect they were doing so seeking a higher guarantee. The
use of any proxy yields in the calculations for approved yield is generally characterized by a
higher loss ratio. That is the case with these data. Both the T-yield dataset and the PTY dataset
have a loss ratio that exceeds the loss ratio of units having the approved yield based on all actual
yields. The PTY dataset has a slightly higher loss ratio than the T-yield dataset. This also seems
logical, since it is likely the units with the highest level of proxy yields will have a higher loss
ratio. However, the difference between the T-yield and the PTY datasets is less than one
percentage point.
After an initial surge in 2007, participation in PTY has grown slowly. About two million acres
had the approved yield based on PTY in 2007, which increased to about 2.7 million acres in
2008 and grew only marginally in 2009.
Units whose approved yields were established using PTY were marginally more likely to have a
loss (Table 2). The percentage of units with a loss was approximately two percentage points
greater for PTY units than units in the other three categories. The pattern among years is not
consistent. Units whose approved yields were established using PTY had the lowest frequency
of loss in 2007, essentially tied with T-yield units in 2008, but were five to six percentage points
greater than the other categories in 2009. There are insufficient data to establish any pattern in
these differences.
18 Although the indemnity data for 2009 may not be complete, there is no reason to believe the relative relationship will change
dramatically once all indemnity data are available.

Use or disclosure of information or data Risk Management Agency
contained on this sheet is subject to the Contract No: 1406-N10PC18078 restrictions on the title page of this report.
17
Table 2. Frequency of Loss among Units by Category of Unit
Year Actual (%) Unclassified (%) T-yield (%) PTY (%) Average (%)
2007 24.1 21.5 21.7 19.3 21.8
2008 34.8 36.9 38.7 38.4 37.2
2009 20.6 20.5 21.5 26.4 21.6
Average 26.8 26.5 27.3 28.9 27.1
Units for which PTY was used to establish the approved yield consistently had the highest
average liability per acre (Table 3). Again it should be noted, if a proxy yield is used to establish
the amount of insurance; insureds will often choose the method that provides the greatest amount
of insurance per acre. Units whose approved yields were established using PTY had an average
liability per acre nearly 27 percent greater than units whose approved yields were established
using T-yields. It is important to note the average liability on units with a PTY was greater than
the average liability on units with all actual yields.
Table 3. Liability and Premium per Acre ($) by Category of Approved Yield
Year All Actual Yields Unclassified Units with T-yield Units with PTY All Units
Liability Premium Liability Premium Liability Premium Liability Premium Liability Premium
2007 151 24 154 14 137 14 173 29 150 14
2008 281 50 283 42 244 41 296 54 273 41
2009 187 31 189 15 169 16 208 37 186 16
3-years 207 35 209 24 182 24 231 41 204 24
Units with the approved yield based in part on PTYs were reported for 14 of the 15 eligible crops
for at least 1 of the 3 years the pilot has been available. No units were reported for millet during
these years; units were reported for grain sorghum only in 2007. Summary of business data for
all crops with more than 100,000 net insured acres with PTY are shown in Table 4. In order,
these crops are wheat, corn, soybeans, barley, canola, sunflower, dry peas, dry beans, and flax.
These crops collectively accounted for 98.8 percent of all net insured acres of eligible crops
during these three years and 99.5 percent of acres with PTYs. Data for grain sorghum, millet,
mustard, oats, rye, and safflower are excluded from these analyses as the data available for these
eligible crops have been deemed insufficient to support meaningful analysis in this context.
Table 4. Summary of Business Data for Crops with Highest Number of Acres with PTY,
2007-2009
Category
Policies
Earning
Premium
Units
Earning
Premium
Policies
Indemnified
Units
Indemnified
Net
Insured
Acres
Liability Total
Premium Indemnity
Loss
Cost
Ratio
Loss
Ratio
Wheat
Actual 24,566 59,578 7,558 13,170 5,557 1,009,171 184,173 95,704 0.09 0.52
Unclassified 26,240 108,404 9,659 23,598 12,668 2,332,630 423,857 250,294 0.11 0.59
T-yield 22,468 55,155 7,160 13,270 5,384 874,490 163,809 110,307 0.13 0.67
PTY 5,677 18,753 2,110 4,498 2,093 415,050 71,175 50,244 0.12 0.71
Total 78,951 241,890 26,487 54,536 25,702 4,631,340 843,015 506,549 0.11 0.60
Percent PTY 7 8 8 8 8 9 8 10

Use or disclosure of information or data Risk Management Agency
contained on this sheet is subject to the Contract No: 1406-N10PC18078 restrictions on the title page of this report.
18
Category
Policies
Earning
Premium
Units
Earning
Premium
Policies
Indemnified
Units
Indemnified
Net
Insured
Acres
Liability Total
Premium Indemnity
Loss
Cost
Ratio
Loss
Ratio
Corn
Actual 4,473 8,776 1,856 2,771 949 320,039 62,251 38,247 0.12 0.61
Unclassified 8,842 22,357 3,442 6,300 2,589 881,048 182,562 92,609 0.11 0.51
T-yield 12,330 23,846 3,882 5,958 2,159 610,971 137,398 68,158 0.11 0.50
PTY 4,944 12,381 2,334 4,014 1,499 522,769 106,735 60,818 0.12 0.57
Total 30,589 67,360 11,514 19,043 7,197 2,334,826 488,947 259,832 0.11 0.53
Percent PTY 16 18 20 21 21 22 22 23
Soybeans
Actual 8,944 22,350 4,693 9,055 2,422 591,529 84,289 69,360 0.12 0.82
Unclassified 11,095 36,646 6,002 14,685 4,449 1,056,958 162,975 133,118 0.13 0.82
T-yield 14,375 31,270 6,354 10,784 2,863 581,174 99,545 76,489 0.13 0.77
PTY 3,861 11,330 2,098 4,324 1,184 257,149 45,763 36,831 0.14 0.80
Total 38,275 101,596 19,147 38,848 10,919 2,486,810 392,572 315,798 0.13 0.80
Percent PTY 10 11 11 11 11 10 12 12
Barley
Actual 4,019 7,323 1,020 1,347 601 74,570 10,624 4,973 0.07 0.47
Unclassified 7,639 17,347 2,211 3,298 1,852 227,570 32,628 16,402 0.07 0.50
T-yield 8,538 16,474 2,369 3,463 1,594 174,143 25,840 16,170 0.09 0.63
PTY 2,214 5,446 638 1,064 696 93,638 12,440 6,610 0.07 0.53
Total 22,410 46,590 6,238 9,172 4,742 569,920 81,532 44,156 0.08 0.54
Percent PTY 10 12 10 12 15 16 15 15
Canola
Actual 1,484 2,789 615 932 231 51,070 8,218 7,831 0.15 0.95
Unclassified 4,274 9,426 1,950 3,358 955 213,247 35,390 35,118 0.16 0.99
T-yield 6,746 13,437 2,868 4,465 1,220 230,978 39,359 36,189 0.16 0.92
PTY 2,087 5,163 1,034 1,856 502 110,440 16,932 18,380 0.17 1.09
Total 14,591 30,815 6,467 10,611 2,907 605,736 99,899 97,519 0.16 0.98
Percent PTY 14 17 16 17 17 18 17 19
Sunflowers
Actual 2,240 3,385 954 1,271 251 50,729 10,179 9,636 0.19 0.95
Unclassified 4,772 9,026 2,130 3,299 854 172,096 35,378 27,981 0.16 0.79
T-yield 8,530 16,430 3,782 5,946 1,544 291,668 62,031 56,010 0.19 0.90
PTY 1,665 3,994 787 1,417 465 108,584 19,887 17,573 0.16 0.88
Total 17,207 32,835 7,653 11,933 3,114 623,078 127,476 111,199 0.18 0.87
Percent PTY 10 12 10 12 15 17 16 16
Dry Peas
Actual 1,153 4,047 307 692 414 69,894 8,902 5,045 0.07 0.57
Unclassified 606 1,101 123 211 92 14,324 2,327 1,259 0.09 0.54
T-yield 4,712 10,696 1,196 2,087 885 107,614 17,662 10,280 0.10 0.58
PTY 1,427 3,554 339 612 359 58,602 8,049 4,378 0.07 0.54
Total 7,898 19,398 1,965 3,602 1,749 250,434 36,940 20,961 0.08 0.57
Percent PTY 18 18 17 17 21 23 22 21

Use or disclosure of information or data Risk Management Agency
contained on this sheet is subject to the Contract No: 1406-N10PC18078 restrictions on the title page of this report.
19
Category
Policies
Earning
Premium
Units
Earning
Premium
Policies
Indemnified
Units
Indemnified
Net
Insured
Acres
Liability Total
Premium Indemnity
Loss
Cost
Ratio
Loss
Ratio
Dry Beans
Actual 1,284 2,598 352 507 199 52,017 9,009 5,015 0.10 0.56
Unclassified 3,181 8,513 1,091 1,786 765 199,801 36,558 17,754 0.09 0.49
T-yield 4,045 9,288 1,403 2,160 751 170,102 35,453 17,350 0.10 0.49
PTY 1,303 3,587 524 874 319 87,049 16,018 8,746 0.10 0.55
Total 9,813 23,986 3,370 5,327 2,035 508,970 97,038 48,865 0.10 0.50
Percent PTY 13 15 16 16 16 17 17 18
Flax
Actual 605 830 191 238 47 6,325 926 804 0.13 0.87
Unclassified 1,830 3,065 660 931 223 33,600 4,833 4,687 0.14 0.97
T-yield 4,312 7,429 1,664 2,371 518 69,940 9,873 10,131 0.14 1.03
PTY 786 1,747 300 476 150 26,441 3,295 3,081 0.12 0.94
Total 7,533 13,071 2,815 4,016 939 136,306 18,927 18,703 0.14 0.99
Percent PTY 10 13 11 12 16 19 17 16
Selected Crops
Actual 48,768 111,676 17,546 29,983 10,671 2,225,344 378,571 236,614 0.11 0.63
Unclassified 68,479 215,885 27,268 57,466 24,446 5,131,274 916,509 579,222 0.11 0.63
T-yield 86,056 184,025 30,678 50,504 16,918 3,111,080 590,971 401,085 0.13 0.68
PTY 23,964 65,955 10,164 19,135 7,268 1,679,722 300,294 206,661 0.12 0.69
Total 227,267 577,541 85,656 157,088 59,304 12,147,420 2,186,345 1,423,582 0.12 0.65
Percent PTY 11 11 12 12 12 14 14 15
Participation in the PTY program was highest in corn and dry peas, both with about 21 percent of
all net insured acres included in a unit using PTYs. Wheat had the lowest net acreage of the
crops with more than 100,000 net insured acres at 8 percent. Liability per acre for units using
PTYs typically was the highest of the four designated categories; when it was not the highest
value (i.e., for soybeans, canola, and dry peas), it was only slightly less than the highest value
(Table 5). The liability per acre for units using PTY often exceeded the liability per acre for
units using all actual yields. One potential reason for this outcome is the nature of the PTY
calculations compared to calculations used to establish approved yields in units with all actual
yields. An APH Database for a unit with all actual yields may include one or more very low
yields that substantially reduce the average. However, inasmuch as the PTY is based on the
average of the yields for all units for a policy; the impact of a low yield in an individual unit
using PTYs is likely to be smaller.
Table 5. Liability per Acre ($) by Designated Category, Selected Crops
Category Wheat Corn Soybeans Barley Canola Sunflower Dry Peas Dry Beans Flax Average
Actual 182 337 244 124 221 202 169 261 134 209
Unclassified 184 340 238 123 223 202 156 261 151 210
T-yield 162 283 203 109 189 189 122 226 135 184
PTY 198 349 217 135 220 234 163 273 176 231
Average 180 324 228 120 208 200 143 250 145 205

Use or disclosure of information or data Risk Management Agency
contained on this sheet is subject to the Contract No: 1406-N10PC18078 restrictions on the title page of this report.
20
Geographic Concentration of Use of PTY
Use of PTY has been concentrated in the central regions of North Dakota. Use exceeded 20
percent of net insured acres in 6 counties, and exceeded the state average of 12.2 percent in an
additional 13 counties (Table 6). Generally, these counties are contiguous beginning in Barnes
County in the southeastern part of the state and extending northwesterly to the Canadian border.
The exception was Golden Valley County, which is in the extreme western part of the state.
These 19 counties accounted for slightly more than 60 percent of all acres insured with PTY but
less than 40 percent of all insured acres (Table 6).
Table 6. Counties in which Acres with PTY Exceeded State Average
County PTY Acres T-yield
Acres
Net Insured
Acres Percent PTY
Percent T-
yield
Percent
Proxy
Yield
Foster 243 178 886 27 20 48
Renville 348 335 1,305 27 26 52
Wells 373 344 1,575 24 22 46
Bottineau 434 593 2,022 21 29 51
Ward 484 628 2,304 21 27 48
Mountrail 288 519 1,449 20 36 56
Stutsman 423 485 2,200 19 22 41
Mercer 79 181 410 19 44 63
Logan 104 197 550 19 36 55
Benson 272 487 1,438 19 34 53
McLean 365 576 2,026 18 28 46
Kidder 83 177 470 18 38 55
Eddy 84 159 496 17 32 49
Burke 168 358 1,022 16 35 52
Sheridan 107 217 676 16 32 48
Pierce 141 264 946 15 28 43
McHenry 171 357 1,152 15 31 46
Barnes 261 347 1,916 14 18 32
Golden Valley 40 130 318 12 41 53
Sub-total 4,467 6,530 23,160 19 28 47
State total 7,308 17,283 59,999 12 29 41
% of State 61.1 37.8 38.6
Use of either a T-yield or PTY exceeded the state average of 41 percent, often by a substantial
margin, in 18 of the 19 counties. Among this group of counties, only Barnes County had less
than the state average use of a proxy yield in the establishment of approved yields. Use of PTY
was lower than use of T-yields in 16 of these counties. Consequently, although insureds in this
group of counties were more likely to elect to use PTY than were insureds elsewhere in the state,
in virtually all of the state the use of T-yields predominated.
Recalculating Approved Yields Assuming Use of the PTY Option in Lieu of T-yield
The information developed from the comparison of experience provides little guidance for
evaluating the performance of the PTY procedure. While PTY performed no worse (and for that
matter, no better) than the T-yield procedure, use was relatively limited (30 percent of all acres

Use or disclosure of information or data Risk Management Agency
contained on this sheet is subject to the Contract No: 1406-N10PC18078 restrictions on the title page of this report.
21
with a proxy yield) and may not constitute the results of informed choices made by each insured
who elected to adopt either the PTY or to remain with a T-yield.
One test of the impact of wider use of PTYs is to calculate the insurance experience of units that
used the T-yield as if those units had used PTYs. This involves calculating the PTY according to
the procedure, then substituting appropriate values into the production history for those units
with fewer than four actual yields. That is, if a unit had two actual yields, 80 percent of the PTY
would be substituted for the 80 percent of T-yield if that value actually was used to calculate the
average yield.
As noted earlier, the procedures for calculating the approved yield are complex, involving factors
such as cupping, 60 percent yield substitution, and others. Premium calculations involve many
factors such as optional unit discount, enterprise unit discount, whole farm unit discount,
optional coverage such as higher levels of prevented planting, late planting reductions, and
others. Indemnity calculations can involve multi-crop reduction factors, liability adjustment
factors, and others. These calculations can be very complex in some circumstances.
Consequently, all calculations of liability, premium, and indemnity were standardized to the
average yield from the Type 15 record. The base data from the experience database were
recalculated using the average of the actual data entered in the Type 15 record. These results
then became the base for comparison of the alternatives: simple average PTY, production-
weighted PTY, and acreage-weighted PTY.
The effects on the insurance experience of using standardized data for units that had used the T-
yield procedure and qualified for PTY19
are shown in Table 7. The loss ratio on these policies
collectively over the three years of the pilot was about 67 percent. About 13 percent of policies
and units from the original T-yield category, and 10 percent of net insured acres, were eliminated
due to ineligibility (Table 8). If North Dakota is representative of all states, a substantial number
of policies and units will not have even the single actual yield required to use the PTY procedure.
Table 7. Eligible Units that Used T-yield Procedures: Data Standardized to Calculated
Average Yield
Year
Policies
Earning
Premium
Units
Earning
Premium
Policies
Indemnified
Units
Indemnified
Net
Insured
Acres
(1,000)
Liability
($1,000)
Total
Premium
($1,000)
Indemnity
($1,000)
Loss
Cost
Ratio
Loss
Ratio
2007 28,259 63,963 8,998 14,094 5,623 775,029 126,945 79,034 0.10 0.62
2008 25,150 56,686 11,500 21,864 5,112 1,266,322 194,046 147,470 0.12 0.76
2009 25,043 49,991 8,135 11,341 4,854 857,765 141,514 82,748 0.10 0.58
Totals 78,452 170,640 28,633 47,299 15,589 2,899,115 462,505 309,252 0.11 0.67
19 Recall the earlier statement that many units did not qualify for PTY since there was not at least one actual yield at the policy
level.
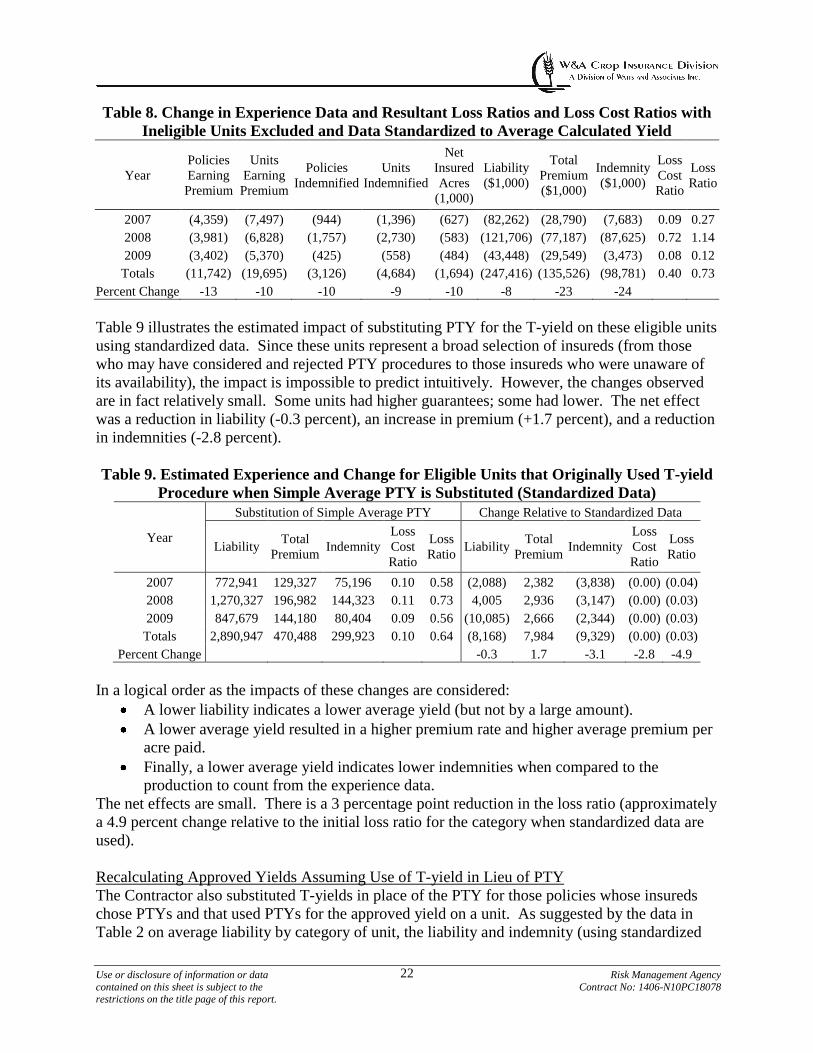
Use or disclosure of information or data Risk Management Agency
contained on this sheet is subject to the Contract No: 1406-N10PC18078 restrictions on the title page of this report.
22
Table 8. Change in Experience Data and Resultant Loss Ratios and Loss Cost Ratios with
Ineligible Units Excluded and Data Standardized to Average Calculated Yield
Year
Policies
Earning
Premium
Units
Earning
Premium
Policies
Indemnified
Units
Indemnified
Net
Insured
Acres
(1,000)
Liability
($1,000)
Total
Premium
($1,000)
Indemnity
($1,000)
Loss
Cost
Ratio
Loss
Ratio
2007 (4,359) (7,497) (944) (1,396) (627) (82,262) (28,790) (7,683) 0.09 0.27
2008 (3,981) (6,828) (1,757) (2,730) (583) (121,706) (77,187) (87,625) 0.72 1.14
2009 (3,402) (5,370) (425) (558) (484) (43,448) (29,549) (3,473) 0.08 0.12
Totals (11,742) (19,695) (3,126) (4,684) (1,694) (247,416) (135,526) (98,781) 0.40 0.73
Percent Change -13 -10 -10 -9 -10 -8 -23 -24
Table 9 illustrates the estimated impact of substituting PTY for the T-yield on these eligible units
using standardized data. Since these units represent a broad selection of insureds (from those
who may have considered and rejected PTY procedures to those insureds who were unaware of
its availability), the impact is impossible to predict intuitively. However, the changes observed
are in fact relatively small. Some units had higher guarantees; some had lower. The net effect
was a reduction in liability (-0.3 percent), an increase in premium (+1.7 percent), and a reduction
in indemnities (-2.8 percent).
Table 9. Estimated Experience and Change for Eligible Units that Originally Used T-yield
Procedure when Simple Average PTY is Substituted (Standardized Data)
Year
Substitution of Simple Average PTY Change Relative to Standardized Data
Liability Total
Premium Indemnity
Loss
Cost
Ratio
Loss
Ratio Liability
Total
Premium Indemnity
Loss
Cost
Ratio
Loss
Ratio
2007 772,941 129,327 75,196 0.10 0.58 (2,088) 2,382 (3,838) (0.00) (0.04)
2008 1,270,327 196,982 144,323 0.11 0.73 4,005 2,936 (3,147) (0.00) (0.03)
2009 847,679 144,180 80,404 0.09 0.56 (10,085) 2,666 (2,344) (0.00) (0.03)
Totals 2,890,947 470,488 299,923 0.10 0.64 (8,168) 7,984 (9,329) (0.00) (0.03)
Percent Change -0.3 1.7 -3.1 -2.8 -4.9
In a logical order as the impacts of these changes are considered:
A lower liability indicates a lower average yield (but not by a large amount).
A lower average yield resulted in a higher premium rate and higher average premium per
acre paid.
Finally, a lower average yield indicates lower indemnities when compared to the
production to count from the experience data.
The net effects are small. There is a 3 percentage point reduction in the loss ratio (approximately
a 4.9 percent change relative to the initial loss ratio for the category when standardized data are
used).
Recalculating Approved Yields Assuming Use of T-yield in Lieu of PTY
The Contractor also substituted T-yields in place of the PTY for those policies whose insureds
chose PTYs and that used PTYs for the approved yield on a unit. As suggested by the data in
Table 2 on average liability by category of unit, the liability and indemnity (using standardized

Use or disclosure of information or data Risk Management Agency
contained on this sheet is subject to the Contract No: 1406-N10PC18078 restrictions on the title page of this report.
23
data) are reduced significantly by this substitution (Table 10). However, premium is essentially
unchanged since the lower yields increase the yield ratio and premium rate. The loss ratio
decreases about 26 percent with this substitution relative to the PTY category units using
standardized data.
Table 10. Estimated Experience for Units Using PTY (Standardized Data) and Change
when T-yield is Substituted for PTY
Year
Standardized Units Using PTY T-yield Substituted for PTY
Liability Total
Premium Indemnity
Loss Cost
Ratio
Loss
Ratio Liability
Total
Premium Indemnity
Loss Cost
Ratio
Loss
Ratio
2007 344,437 50,858 26,393 0.08 0.52 285,927 51,918 19,297 0.07 0.37
2008 785,668 106,641 75,024 0.10 0.70 658,331 107,599 49,574 0.08 0.46
2009 578,177 90,175 61,076 0.11 0.68 490,460 89,471 51,990 0.11 0.58
Totals 1,708,282 247,675 162,493 0.10 0.66 1,434,719 248,988 120,860 0.08 0.49
Percent Change 1 -18 -22 -23 -5 -16 1 -26 -11 -26
SECTION VII. ALTERNATIVE PTY CALCULATIONS
The Solicitation requested an evaluation of the effect of using an alternative, weighted PTY in
place of the current simple average PTY, but was silent as to the weight to be applied. The
Contractor considered both a production-weighted and an acreage-weighted PTY calculation
procedure. In either case, the simple average of all annual yields (including T-yields if fewer
than four actual annual yields were certified) was calculated for each year that actual yields were
certified. Each of these annual average yields then was weighted by the total production or the
total acreage for that year. The sum of the weighted annual yields then was divided by the sum
of the weights to obtain a PTY.
The estimated impact of the various substitutions is reported in Tables 11 and 12, which indicate
the effect of a single approach to calculating PTY compared to the value realized using the T-
yields. The loss cost ratios and the loss ratios of the standardized data and the alternative
weighting methods are summarized in Table 13. The simple average calculation method results
in a slight reduction in the loss cost ratio and loss ratio (as reported earlier); the production-
weighted approach results in an increase in the two measures of performance; and the acre-
weighted method results in substantially the same values as those obtained using the T-yields for
the standardized data.

Use or disclosure of information or data Risk Management Agency
contained on this sheet is subject to the Contract No: 1406-N10PC18078 restrictions on the title page of this report.
24
Table 11. Estimated Experience for Eligible Units that Originally Used T-yield Procedure
when Production-weighted Average PTY is Substituted (Standardized Data)
Year
Substitution of Production-weighted PTY Change Relative to Standardized Data
Liability Total
Premium Indemnity
Loss Cost
Ratio
Loss
Ratio Liability
Total
Premium Indemnity
Loss Cost
Ratio
Loss
Ratio
2007 736,951 113,740 76,610 0.10 0.67 (38,077) (13,204) (2,425) 0.00 0.05
2008 1,231,220 176,408 152,640 0.12 0.87 (35,101) (17,638) 5,170 0.01 0.11
2009 824,615 130,104 81,331 0.10 0.63 (33,149) (11,410) (1,416) 0.00 0.04
Totals / Percent Change 2,792,787 420,253 310,581 11.1% 73.9% (106,328) (42,252) 1,329 0.5% 7.0%
Table 12. Estimated Experience for Eligible Units that Originally Used T-yield Procedure
when Acre-Weighted Average PTY is Substituted (Standardized Data)
Year
Substitution of Acre-Weighted PTY Change Relative to Standardized Data
Liability Total
Premium Indemnity
Loss
Cost
Ratio
Loss
Ratio Liability
Total
Premium Indemnity
Loss
Cost
Ratio
Loss
Ratio
2007 693,918 114,578 69,283 0.10 0.60 (81,110) (12,367) (9,752) (0.00) (0.02)
2008 1,162,917 176,920 132,908 0.11 0.75 (103,405) (17,125) (14,562) (0.00) (0.01)
2009 777,939 130,515 76,817 0.10 0.59 (79,826) (11,000) (5,930) 0.00 0.00
Totals / Percent Change 2,634,774 422,013 279,008 10.6% 66.1% (264,341) (40,492) (30,244) -0.1% -0.8%
Table 13. Loss Cost Ratios and Loss Ratios for Standardized Data and Three Alternative
Calculations of PTY
Year Standardized Data
Simple Average
PTY
Production-weighted
PTY Acre-Weighted PTY
Loss Cost
Ratio
Loss
Ratio
Loss Cost
Ratio
Loss
Ratio
Loss Cost
Ratio
Loss
Ratio
Loss Cost
Ratio
Loss
Ratio
2007 0.10 0.62 0.10 0.58 0.10 0.67 0.10 0.60
2008 0.12 0.76 0.11 0.73 0.12 0.87 0.11 0.75
2009 0.10 0.58 0.09 0.56 0.10 0.63 0.10 0.59
Totals / Percent Change 0.11 0.67 0.10 0.64 0.11 0.74 0.11 0.66
The impact of the simple average PTY, the acre-weighted PTY, and the production-weighted
PTY were also calculated by crop within year, by county within year, and by crop by county
within year. Since the overall impact of the various substitutions was relatively small, as
demonstrated above, these data are not presented in this report, but are instead available digitally
for those interested in a specific element of the analysis.
The Contractor also substituted production and acreage-weighted PTY in place of the simple
average PTY for that category of units. These results are reported in Table 14. The production-
weighted PTY increases the loss ratio from 65.6 percent in the standardized data to 72.5 percent,
while the acreage-weighted PTY results in essentially the same loss ratio as the standardized
data. The results are quite comparable to those realized with the substitutions of production and
acreage-weighted PTY into the units that originally used T-yield.

Use or disclosure of information or data Risk Management Agency
contained on this sheet is subject to the Contract No: 1406-N10PC18078 restrictions on the title page of this report.
25
Table 14. Estimated Experience for Units Using PTY (Standardized Data) when
Production or Acreage-weighted PTYs is Substituted for the Simple Average PTYs
Year
Production-weighted PTY Acreage-weighted PTY
Liability Total
Premium Indemnity
Loss Cost
Ratio
Loss
Ratio Liability
Total
Premium Indemnity
Loss Cost
Ratio
Loss
Ratio
2007 274,203 38,395 21,385 0.08 0.56 254,285 37,748 18,970 0.07 0.50
2008 637,298 80,927 68,196 0.11 0.84 594,691 79,127 56,276 0.09 0.71
2009 478,642 69,955 47,629 0.10 0.68 448,575 68,328 44,643 0.10 0.65
Totals 1,390,142 189,278 137,210 0.10 0.72 1,297,552 185,204 119,889 0.09 0.65
SECTION VIII. ADDITIONAL ANALYSES
In addition to the specifically contracted analyses, the Contractor examined the available data to
determine if other patterns might impact the Government’s decisions about the PTY program.
These analyses included an examination of the indemnity type (i.e., a production-based
indemnity versus a prevented planting indemnity or a replant payment) and an examination of
years of participation in the program. The first informs consideration of program expansion,
since if prevented planting and replant payments cause a substantial change in loss ratio and loss
cost ratio patterns, those changes would need to be considered if the program is to be required or
expanded. The second is a measure of the validity of the available data and their capacity to
support meaningful analyses after a relatively short pilot period.
Effects of Prevented Planting Indemnities
A substantial portion of the indemnities reported under this analysis represent prevented
planting. Consequently, there is a linear effect on the changes in liability under these
circumstances, since indemnities for prevented planting are simply a percentage of the liability.
Since this situation may not be representative of much of the country (e.g., North Dakota may
have a higher frequency of prevented planting than other regions), the Contractor examined the
effects of the use of PTYs when prevented planting indemnities are excluded from the analysis.
The Contractor also eliminated replanting payments so the evaluations are made only with
respect to production losses.20
These adjustments reduced the loss ratios substantially for the 2009 crop year (Table 15),
possibly because the Type 21 data for production losses for 2009 were not complete when the
data were extracted. Prevented planting indemnities are paid separately from production loss
indemnities on a unit and hence could have been processed much earlier in 2009 than
indemnities for a production loss. However, the reduction in the loss ratio in 2007, at
approximately 10 percentage points for units using PTYs and units using T-yields, was relatively
large. It is worth noting that the overall impact on units of both types was approximately the
same, with a reduction of about 25 percent in indemnities for units with PTYs and 19 percent for
units with T-yields. It seems appropriate to infer the possibility of a prevented planting
indemnity did not influence the choice of PTY to a substantial extent.
20 The Contractor acknowledges some indemnities may be due to quality adjustment, and notes that it is not possible to make any
adjustment for this factor. However, this potential outcome should be unknown to the producer when the choice of PTY must
be made.

Use or disclosure of information or data Risk Management Agency
contained on this sheet is subject to the Contract No: 1406-N10PC18078 restrictions on the title page of this report.
26
Table 15. Effects of Excluding Preventing Planting (PP) Indemnities and Replanting
Payments on Indemnities and Loss Ratios
Year
Units Using PTY Units Using PTY Units Using T-yield Units Using T-yield
Amount of Indemnity Loss Ratio Amount of Indemnity Loss Ratio
Original No PP Original No PP Original No PP Original No PP
2007 26,657 20,739 0.46 0.36 86,717 70,432 0.56 0.45
2008 119,416 114,890 0.83 0.80 235,095 227,221 0.87 0.84
2009 61,207 20,157 0.62 0.20 86,221 32,729 0.50 0.19
Total 207,280 155,787 0.69 0.52 408,033 330,382 0.68 0.55
Percent Change -24.8 -24.8 -19.0 -19.0
The effects of substituting the simple average PTY or the T-yield, as appropriate, are shown in
Table 16. Substituting the T-yield for PTY on the units that originally used PTY reduced the
loss ratio by 26 percent when the prevented planting indemnities are included (see Table 10) and
by 31 percent when those indemnities are excluded (Table 16). The loss ratio for units that
originally used the T-yield was reduced by three percent in both cases when the substitution was
made. Hence, it does not appear likely that the presence of relatively high levels of prevented
planting indemnities has any substantive effect on the overall indications inherent in the analysis
presented earlier.
Table 16. Original Standardized Indemnities, Standardized Indemnities without Prevented
Planting and Replanting, and Effects of Substituting T-yield for PTY
Year
Standardized Indemnity
Without PP
Indemnities After
Substitution21
Units Using
PTY
Units Using
T-yield
Units Using
PTY
Units Using
T-yield
2007 20,428 63,397 14,124 59,941
2008 70,499 140,197 45,683 137,133
2009 20,117 30,693 16,671 29,378
Total 111,044 234,288 76,478 226,453
Percent Change -31 -3
Number of Years Used to Construct PTY
The Contractor examined the data to determine the distribution of number of years of annual data
used to construct the PTY. This review considered the data in the PTY summary database
associated with each policy (by type, practice, variety, and TMA). Consequently, the results do
not indicate the total number of yields used to establish the PTY, but rather the number of crop
years of data used in those calculations. This is because the PTY summary database consists of
acre-weighted averages of the yields certified for each crop year from all the units on which the
crop was produced that crop year. The individual unit records for each of the historic years are
not available. Slightly more than one-half of policies had five or more crop years included in the
calculation of the PTY (Table 17). More than one-quarter had ten crop years of history. It
21
Substitution of PTY when T-yield was originally used and PTY when T-yield was originally used.

Use or disclosure of information or data Risk Management Agency
contained on this sheet is subject to the Contract No: 1406-N10PC18078 restrictions on the title page of this report.
27
appears insureds who chose the PTY generally had substantial prior yield history to certify.22
A
search of RMA documents did not identify similar analyses for the number of years of Actual
Yields used to calculate T-yield or APH yields without T-yields.
Table 17. Number of Annual Actual Yields Used to Construct PTY
No. of Actual
Yields No. of Policies
Percent of
Total
Cumulative
Percent
1 2,277 9 9
2 2,666 10 19
3 2,738 10 29
4 2,339 9 38
5 2,170 8 47
6 2,036 8 54
7 1,713 7 61
8 1,440 6 66
9 1,220 5 71
10 7,577 29 100
Total 26,176 100
Continuity of Participation
The Contractor examined the APH Database to determine the number of years an insured had
elected the PTY option for a particular policy. This examination depends on consistency of
policy identifying data. However, the review did find a relatively high level of continuity: 44
percent of policies utilized PTY all three years it has been available, 33 percent utilized PTY two
years, and only 23 percent utilized PTY one year.
The initial analytic approach was supplemented by further consideration of the experience data.
The policies for the eligible crops were segregated into two mutually exclusive groups: those
with a PTY summary database and those without. The PTY summary database contains an
average of all actual yields for each year such yields are certified at the policy level. Traditional
transitional yields (T-yields) supplement actual yields to the extent that fewer than four actual
yields are available for each practice/type/variety/t map area (P/T/V/TMA) included under the
policy. All policies for which the PTY has been elected must create a summary database for
each P/T/V/TMA.
After creating the two groups of policies, each unit was examined to determine if a T-yield type
was used to determine the average yield, or if a T-yield was used to determine a floor yield or for
the purpose of 60 percent yield substitution. For those policies that originally used PTY, the
published T-yield was used as a replacement. For those policies that originally used the
published T-yield, a PTY was calculated and used as the replacement. The Contractor notes the
PTY so constructed may not exactly replicate the PTY that would be calculated in practice since
only the Type 15 records reported by the Approved Insurance Provider (AIP) were available. In
practice, the history of the policy may include Type 15 records for units that are not planted to
22 The number of policies earning premium is greater than the numbers reported with experience since these data are segmented
by type/practice/variety/T map area. Hence, one policy might have irrigated and non-irrigated acreage of the crop with six
years certified for one practice and three for the other. This policy would be counted twice in this summation.

Use or disclosure of information or data Risk Management Agency
contained on this sheet is subject to the Contract No: 1406-N10PC18078 restrictions on the title page of this report.
28
the crop in a particular year and thus are not required to be reported for the current crop year.
However, the certified yields for such units must be used by the AIP to construct the PTY
summary database. Except for situations wherein only one or two actual yields are included in
the reported Type 15 records (but more would have been available), the Contractor does not
believe this condition will have substantive impacts on the findings of the study.
Summary of the Population of Policies
The data in Table 18 separate the total population of policies for eligible crops in North
Dakotainto four groups denoted as follows:
Batch PTY = policies with a PTY summary database
T = policies without a PTY summary database
AnyT NoT = units without a T-yield type, floor, or yield substitution
T = units with a T-yield type, floor, or yield substitution

Use or disclosure of information or data Risk Management Agency
contained on this sheet is subject to the Contract No: 1406-N10PC18078 restrictions on the title page of this report.
29
Table 18. Experience Data for Policies with PTY Summary Database and Policies
without PTY Summary Database 2007-2009, North Dakota
Batch AnyT Crop
Year
Policies
Earning
Premium
Units Earning
Premium
Policies
Indemnified
Units
Indemnified
Net
Acres Liability Premium Indemnity
Loss
Cost
Ratio
Loss
Ratio
-- thousands -- % %
PTY NoT 2007 2,278 4,406 656 979 500 97,934 15,691 9,270 9.5 59.1
PTY NoT 2008 3,386 6,745 1,436 2,458 779 262,017 45,724 33,940 13.0 74.2
PTY NoT 2009 4,042 6,876 1,562 2,006 902 210,213 34,905 22,419 10.7 64.2
PTY NoT Total 9,706 18,027 3,654 5,443 2,181 570,164 96,320 65,629 11.5 68.1
PTY T 2007 7,605 28,423 2,691 5,458 3,087 526,176 92,420 41,591 7.9 45.0
PTY T 2008 10,463 39,877 5,240 14,635 4,410 1,302,447 247,825 197,464 15.2 79.7
PTY T 2009 11,348 35,268 5,115 8,778 4,617 934,815 169,354 95,813 10.2 56.6
PTY T Total 29,416 103,568 13,046 28,871 12,114 2,763,438 509,599 334,868 12.1 65.7
PTY All 2007 9,883 32,829 3,347 6,437 3,587 624,110 108,111 50,861 8.1 47.0
PTY All 2008 13,849 46,622 6,676 17,093 5,189 1,564,464 293,549 231,404 14.8 78.8
PTY All 2009 15,390 42,144 6,677 10,784 5,519 1,145,028 204,259 118,232 10.3 57.9
PTY All Total 39,122 121,595 16,700 34,314 14,295 3,333,602 605,919 400,497 12.0 66.1
T NoT 2007 16,728 33,631 5,228 7,827 3,308 575,229 80,329 59,986 10.4 74.7
T NoT 2008 15,563 31,588 6,441 12,021 3,147 985,525 154,296 123,871 12.6 80.3
T NoT 2009 14,727 26,632 4,541 5,799 3,018 645,687 93,907 49,243 7.6 52.4
T NoT Total 47,018 91,851 16,210 25,647 9,473 2,206,441 328,532 233,100 10.6 71.0
T T 2007 49,173 138,026 16,714 30,373 12,635 1,727,225 310,856 169,235 9.8 54.4
T T 2008 44,809 125,814 20,634 46,814 11,895 2,977,523 587,786 476,372 16.0 81.0
T T 2009 43,667 110,370 14,275 22,240 11,695 1,967,907 367,290 155,750 7.9 42.4
T T Total 137,649 374,210 51,623 99,427 36,225 6,672,655 1,265,932 801,357 12.0 63.3
T All 2007 65,901 171,657 21,942 38,200 15,943 2,302,454 391,185 229,221 10.0 58.6
T All 2008 60,372 157,402 27,075 58,835 15,042 3,963,048 742,082 600,243 15.1 80.9
T All 2009 58,394 137,002 18,816 28,039 14,713 2,613,594 461,197 204,993 7.8 44.4
T All Total 184,667 466,061 67,833 125,074 45,698 8,879,096 1,594,464 1,034,457 11.7 64.9
All All 2007 75,784 204,486 25,289 44,637 19,530 2,926,564 499,296 280,082 9.6 56.1
All All 2008 74,221 204,024 33,751 75,928 20,231 5,527,512 1,035,631 831,647 15.0 80.3
All All 2009 73,784 179,146 25,493 38,823 20,232 3,758,622 665,456 323,225 8.6 48.6
All All Total 223,789 587,656 84,533 159,388 59,993 12,212,698 2,200,383 1,434,954 11.7 65.2

Use or disclosure of information or data Risk Management Agency
contained on this sheet is subject to the Contract No: 1406-N10PC18078 restrictions on the title page of this report.
30
Note the total policy and unit counts differ from the data reported in the initial analyses, but
acres, liability, etc., all are substantially the same. Policy and unit counts are difficult to interpret
in these comparisons. Some units on a crop policy might have been classified as PTY/NoT
while other units on the same policy might have been classified as PTY/T. In this case, the
policy would be counted twice. Unit counts have a similar issue. One line of a unit might have
been classified PTY/NoT while another line (a different P/T/V/TMA) might have been classified
as PTY/T. For this reason, policy and unit counts will not be the major element used to describe
usage of PTY or its impact. Instead, acres and liability are dominant since these variables cannot
be counted multiple times in the classification schema. These are a better measure of
participation than policy and unit counts for the reason stated herein.
Differences from the Data Included in Original Deliverable 1 Analysis
Table 19 summarizes the difference in acres, liability, premium, and indemnity for units that
involved a proxy yield for a purpose other than a T-yield type. These units primarily involve
floor yields and yield substitutions, although a cup may be involved if a T-yield type resulted in a
drop of 10 percent or more from a previous approved yield. Increases were greatest for units
involving published T-yields. Acres and liability for units using published T-yields more than
doubled while the data for units using PTY increased about 65 percent relative to the data
reported in the original Deliverable 1 analysis. Overall, a proxy yield was involved in some
manner for determining the approved yield on about 80 percent of all net insured acres.
Table 19. Increase in Acres, Liability, Premium, and Indemnity for Units Involving Proxy
Yield Other than as T-yield Type Relative to Original Data
Year Batch Net Acres Liability Premium Indemnity
Loss Cost
Ratio Loss Ratio
-- thousands -- % %
2007 PTY 1,108 183,407 34,169 14,934 8.1 43.7
2008 PTY 1,754 517,197 104,340 78,048 15.1 74.8
2009 PTY 1,943 378,221 70,022 34,606 9.1 49.4
Total PTY 4,806 1,078,825 208,531 127,588 11.8 61.2
2007 T 6,384 869,934 155,122 82,518 9.5 53.2
2008 T 6,201 1,589,495 316,553 241,277 15.2 76.2
2009 T 6,357 1,066,695 196,226 69,529 6.5 35.4
Total T 18,942 3,526,124 667,901 393,324 11.2 58.9
Distribution of Data by Yield Limitation Flags
Table 20 contains the aggregation of normalized experience data according to the yield limitation
flags in the original Type 15 data.23
The category APH (yield limitation flag = 1, i.e., the
approved yield is the average of the data in the Type 15 record) in this table includes both units
which include four or more actual yields as well as those that utilize a proxy yield to determine
the approved yield.
23 Recall that “normalized” indicates the liability, premium, and indemnity are calculated using the average yield from the Type
15 records.

Use or disclosure of information or data Risk Management Agency
contained on this sheet is subject to the Contract No: 1406-N10PC18078 restrictions on the title page of this report.
31
Table 20. Distribution According to Yield Limitation Flag for Original Type 15 Data, by
Batch (Normalized Data)
Year Batch Flag Net Acres Liability Premium Indemnity Loss Cost Ratio Loss Ratio
-- thousands -- % %
2007 PTY APH 2,437 434,476 62,363 34,397 7.9 55.2
2008 PTY APH 3,364 1,035,580 135,334 93,117 9.0 68.8
2009 PTY APH 3,491 786,168 119,538 81,026 10.3 67.8
Total PTY APH 9,292 2,256,224 317,235 208,540 9.2 65.7
2007 PTY Cup 1 346 46 4 1.2 8.7
2008 PTY Cup 13 3,918 557 391 10.0 70.2
2009 PTY Cup 23 3,985 647 296 7.4 45.7
Total PTY Cup 37 8,249 1,250 691 8.4 55.3
2007 PTY Floor 81 10,996 1,817 832 7.6 45.8
2008 PTY Floor 144 37,355 5,436 2,508 6.7 46.1
2009 PTY Floor 172 29,923 4,820 2,412 8.1 50.0
Total PTY Floor 397 78,274 12,073 5,752 7.3 47.6
2007 PTY Substitution 1,062 180,506 29,148 15,128 8.4 51.9
2008 PTY Substitution 1,655 485,127 68,908 55,689 11.5 80.8
2009 PTY Substitution 1,825 363,058 57,753 34,253 9.4 59.3
Total PTY Substitution 4,542 1,028,691 155,809 105,070 10.2 67.4
All PTY Total 14,268 3,371,438 486,367 320,053 9.5 65.8
2007 T APH 10,342 1,593,461 225,828 151,462 9.5 67.1
2008 T APH 9,787 2,730,128 357,713 249,806 9.2 69.8
2009 T APH 9,223 1,814,135 261,968 139,299 7.7 53.2
Total T APH 29,352 6,137,724 845,509 540,567 8.8 63.9
2007 T Cup 151 15,997 2,978 1,836 11.5 61.7
2008 T Cup 86 18,951 3,090 3,804 20.1 123.1
2009 T Cup 171 25,090 4,310 1,781 7.1 41.3
Total T Cup 408 60,038 10,378 7,421 12.4 71.5
2007 T Floor 638 67,630 14,025 11,391 16.8 81.2
2008 T Floor 594 113,000 22,158 15,034 13.3 67.8
2009 T Floor 966 120,408 22,880 9,943 8.3 43.5
Total T Floor 2,198 301,038 59,063 36,368 12.1 61.6
2007 T Substitution 4,162 549,013 92,494 56,457 10.3 61.0
2008 T Substitution 3,975 977,989 152,295 112,443 11.5 73.8
2009 T Substitution 3,854 646,966 106,412 49,955 7.7 46.9
Total T Substitution 11,991 2,173,968 351,201 218,855 10.1 62.3
All T Total 43,949 8,672,768 1,266,151 803,211 9.3 63.4
All All Total 58,217 12,044,206 1,752,518 1,123,264 9.3 64.1
Between 65 and 71 percent of the acres and liability for both batches were encoded as APH
(yield limitation flag = 1). Yield substitution (yield limitation flag 9) accounted for nearly all the
remaining acres and liability, but was about four percentage points greater for the PTY batch
than for the T batch (Table 21). Another relatively large difference between the batches is the
higher share of batch T with units having a floor (yield limitation flags 05, 07, and 08).
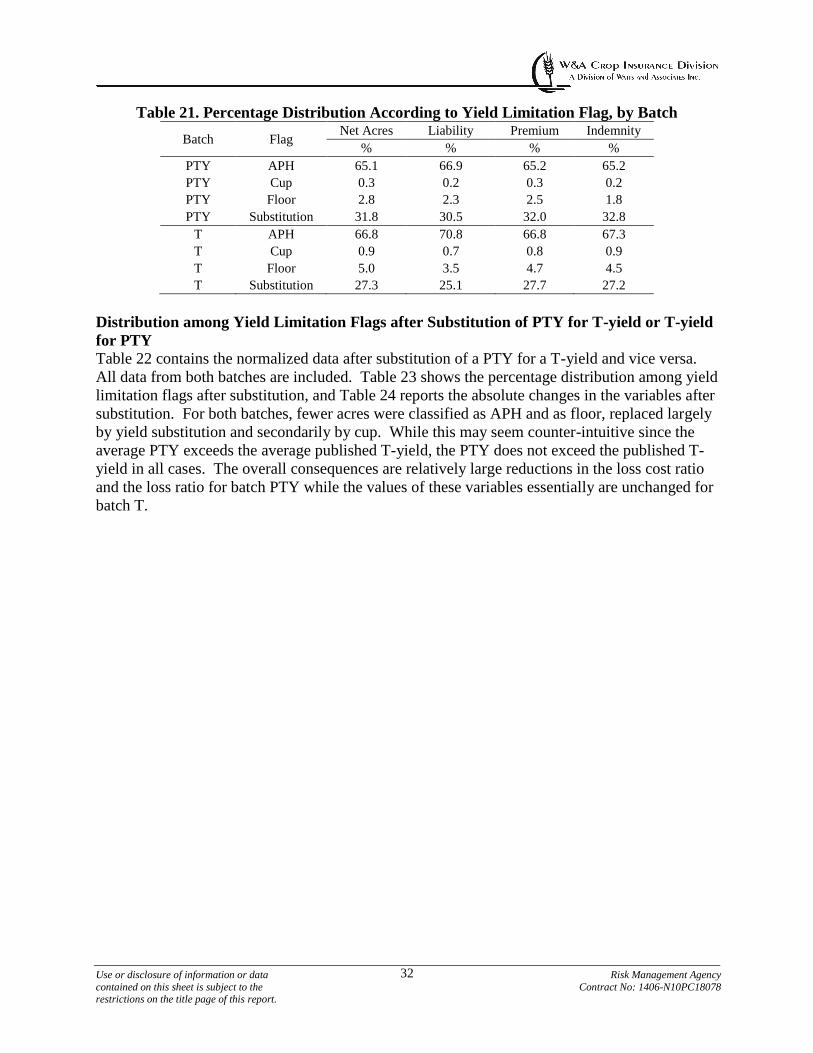
Use or disclosure of information or data Risk Management Agency
contained on this sheet is subject to the Contract No: 1406-N10PC18078 restrictions on the title page of this report.
32
Table 21. Percentage Distribution According to Yield Limitation Flag, by Batch
Batch Flag Net Acres Liability Premium Indemnity
% % % %
PTY APH 65.1 66.9 65.2 65.2
PTY Cup 0.3 0.2 0.3 0.2
PTY Floor 2.8 2.3 2.5 1.8
PTY Substitution 31.8 30.5 32.0 32.8
T APH 66.8 70.8 66.8 67.3
T Cup 0.9 0.7 0.8 0.9
T Floor 5.0 3.5 4.7 4.5
T Substitution 27.3 25.1 27.7 27.2
Distribution among Yield Limitation Flags after Substitution of PTY for T-yield or T-yield
for PTY
Table 22 contains the normalized data after substitution of a PTY for a T-yield and vice versa.
All data from both batches are included. Table 23 shows the percentage distribution among yield
limitation flags after substitution, and Table 24 reports the absolute changes in the variables after
substitution. For both batches, fewer acres were classified as APH and as floor, replaced largely
by yield substitution and secondarily by cup. While this may seem counter-intuitive since the
average PTY exceeds the average published T-yield, the PTY does not exceed the published T-
yield in all cases. The overall consequences are relatively large reductions in the loss cost ratio
and the loss ratio for batch PTY while the values of these variables essentially are unchanged for
batch T.

Use or disclosure of information or data Risk Management Agency
contained on this sheet is subject to the Contract No: 1406-N10PC18078 restrictions on the title page of this report.
33
Table 22. Distribution According to Yield Limitation Flag After Substitution of PTY for T-
yield and T-yield for PTY (Normalized Data)
Year Batch Flag Net Acres Liability Premium Indemnity Loss Cost Ratio Loss Ratio
-- thousands -- % %
2007 PTY APH 2,120 342,402 55,249 25,752 7.5 46.6
2008 PTY APH 2,715 764,154 110,852 55,351 7.2 49.9
2009 PTY APH 2,709 564,788 95,141 60,858 10.8 64.0
Total PTY APH 7,544 1,671,344 261,242 141,961 8.5 54.3
2007 PTY Cup 101 14,705 2,496 921 6.3 36.9
2008 PTY Cup 375 102,540 14,050 8,331 8.1 59.3
2009 PTY Cup 518 103,578 15,698 9,694 9.4 61.8
Total PTY Cup 994 220,823 32,244 18,946 8.6 58.8
2007 PTY Floor 55 6,412 1,266 243 3.8 19.3
2008 PTY Floor 47 10,368 1,489 617 6.0 41.5
2009 PTY Floor 52 8,414 1,385 769 9.1 55.6
Total PTY Floor 154 25,194 4,140 1,629 6.5 39.3
2007 PTY Substitution 1,306 204,666 34,567 15,928 7.8 46.1
2008 PTY Substitution 2,038 561,070 82,934 60,156 10.7 72.5
2009 PTY Substitution 2,232 416,281 68,929 37,920 9.1 55.0
Total PTY Substitution 5,576 1,182,017 186,430 114,004 9.6 61.2
All PTY Total 14,268 3,099,378 484,056 276,540 8.9 57.1
2007 T APH 7815 1235074 174663 119648 9.7 68.5
2008 T APH 7290 2075120 270498 179391 8.6 66.3
2009 T APH 6841 1379975 200544 112481 8.2 56.1
Total T APH 21,946 4,690,169 645,705 411,520 8.8 63.7
2007 T Cup 223 26657 5157 3387 12.7 65.7
2008 T Cup 189 40624 7426 6638 16.3 89.4
2009 T Cup 225 35003 6816 5044 14.4 74.0
Total T Cup 637 102,284 19,399 15,069 14.7 77.7
2007 T Floor 7 853 147 81 9.6 55.7
2008 T Floor 6 1670 222 88 5.3 39.6
2009 T Floor 10 1711 251 103 6.0 41.0
Total T Floor 23 4,234 620 272 6.4 43.9
2007 T Substitution 7249 964819 158859 92068 9.5 58.0
2008 T Substitution 6957 1735165 261882 191546 11.0 73.1
2009 T Substitution 7138 1178295 192330 79661 6.8 41.4
Total T Substitution 21,344 3,878,279 613,071 363,275 9.4 59.3
All T Total 43,950 8,674,966 1,278,795 790,136 9.1 61.8
All All Total 58,218 11,774,344 1,762,851 1,066,676 9.1 60.5

Use or disclosure of information or data Risk Management Agency
contained on this sheet is subject to the Contract No: 1406-N10PC18078 restrictions on the title page of this report.
34
Table 23. Percentage Distribution According to Yield Limitation Flag after Substitution, by
Batch
Batch Flag Net Acres Liability Premium Indemnity
% % % %
PTY APH 52.9 53.9 54.0 51.3
PTY Cup 7.0 7.1 6.7 6.9
PTY Floor 1.1 0.8 0.9 0.6
PTY Substitution 39.1 38.1 38.5 41.2
T APH 49.9 54.1 50.5 52.1
T Cup 1.4 1.2 1.5 1.9
T Floor 0.1 0.0 0.0 0.0
T Substitution 48.6 44.7 47.9 46.0
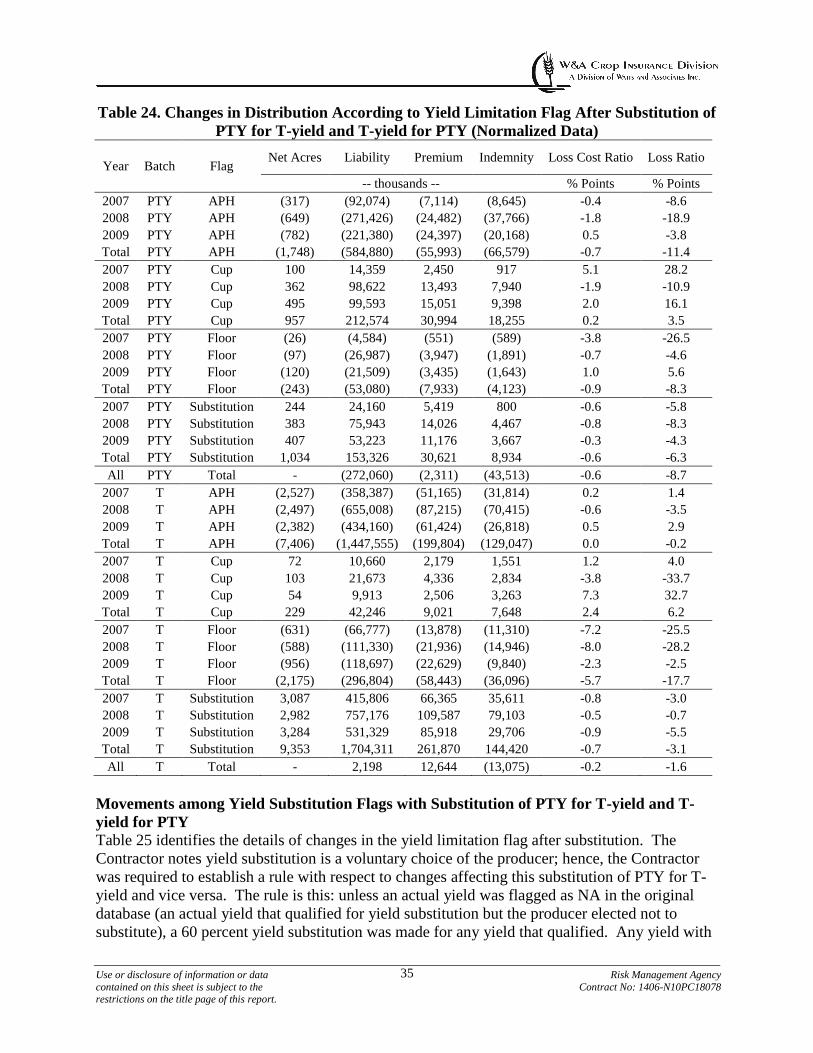
Use or disclosure of information or data Risk Management Agency
contained on this sheet is subject to the Contract No: 1406-N10PC18078 restrictions on the title page of this report.
35
Table 24. Changes in Distribution According to Yield Limitation Flag After Substitution of
PTY for T-yield and T-yield for PTY (Normalized Data)
Year Batch Flag Net Acres Liability Premium Indemnity Loss Cost Ratio Loss Ratio
-- thousands -- % Points % Points
2007 PTY APH (317) (92,074) (7,114) (8,645) -0.4 -8.6
2008 PTY APH (649) (271,426) (24,482) (37,766) -1.8 -18.9
2009 PTY APH (782) (221,380) (24,397) (20,168) 0.5 -3.8
Total PTY APH (1,748) (584,880) (55,993) (66,579) -0.7 -11.4
2007 PTY Cup 100 14,359 2,450 917 5.1 28.2
2008 PTY Cup 362 98,622 13,493 7,940 -1.9 -10.9
2009 PTY Cup 495 99,593 15,051 9,398 2.0 16.1
Total PTY Cup 957 212,574 30,994 18,255 0.2 3.5
2007 PTY Floor (26) (4,584) (551) (589) -3.8 -26.5
2008 PTY Floor (97) (26,987) (3,947) (1,891) -0.7 -4.6
2009 PTY Floor (120) (21,509) (3,435) (1,643) 1.0 5.6
Total PTY Floor (243) (53,080) (7,933) (4,123) -0.9 -8.3
2007 PTY Substitution 244 24,160 5,419 800 -0.6 -5.8
2008 PTY Substitution 383 75,943 14,026 4,467 -0.8 -8.3
2009 PTY Substitution 407 53,223 11,176 3,667 -0.3 -4.3
Total PTY Substitution 1,034 153,326 30,621 8,934 -0.6 -6.3
All PTY Total - (272,060) (2,311) (43,513) -0.6 -8.7
2007 T APH (2,527) (358,387) (51,165) (31,814) 0.2 1.4
2008 T APH (2,497) (655,008) (87,215) (70,415) -0.6 -3.5
2009 T APH (2,382) (434,160) (61,424) (26,818) 0.5 2.9
Total T APH (7,406) (1,447,555) (199,804) (129,047) 0.0 -0.2
2007 T Cup 72 10,660 2,179 1,551 1.2 4.0
2008 T Cup 103 21,673 4,336 2,834 -3.8 -33.7
2009 T Cup 54 9,913 2,506 3,263 7.3 32.7
Total T Cup 229 42,246 9,021 7,648 2.4 6.2
2007 T Floor (631) (66,777) (13,878) (11,310) -7.2 -25.5
2008 T Floor (588) (111,330) (21,936) (14,946) -8.0 -28.2
2009 T Floor (956) (118,697) (22,629) (9,840) -2.3 -2.5
Total T Floor (2,175) (296,804) (58,443) (36,096) -5.7 -17.7
2007 T Substitution 3,087 415,806 66,365 35,611 -0.8 -3.0
2008 T Substitution 2,982 757,176 109,587 79,103 -0.5 -0.7
2009 T Substitution 3,284 531,329 85,918 29,706 -0.9 -5.5
Total T Substitution 9,353 1,704,311 261,870 144,420 -0.7 -3.1
All T Total - 2,198 12,644 (13,075) -0.2 -1.6
Movements among Yield Substitution Flags with Substitution of PTY for T-yield and T-
yield for PTY
Table 25 identifies the details of changes in the yield limitation flag after substitution. The
Contractor notes yield substitution is a voluntary choice of the producer; hence, the Contractor
was required to establish a rule with respect to changes affecting this substitution of PTY for T-
yield and vice versa. The rule is this: unless an actual yield was flagged as NA in the original
database (an actual yield that qualified for yield substitution but the producer elected not to
substitute), a 60 percent yield substitution was made for any yield that qualified. Any yield with

Use or disclosure of information or data Risk Management Agency
contained on this sheet is subject to the Contract No: 1406-N10PC18078 restrictions on the title page of this report.
36
an NA yield type remained with that yield type regardless of the change in the level of the T-
yield or PTY, as appropriate. Accordingly, the number of yield substitutions likely is overstated
as some unknown (but most likely small) portion of producers may have opted not to substitute
in these units under this scenario.
Most acres and liability originally classified as APH or yield substitution remained in the same
classification after substitution of PTY for T-yield and T-yield for PTY. The most common
change for batch PTY is movement from APH to cup, which reflects the generally lower T-yield
for this batch. Those units requiring a proxy yield to complete four yields in the database
generally would have had a lower average yield after substitution. Movement from APH to
substitution in this batch reflects the fact that the published T-yield is not always less than the
PTY. More yields became eligible for substitution on such units. As stated earlier, the
Contractor cannot state unequivocally that all such eligible substitutions would occur in practice.
Batch T is more diverse in terms of the relationship of PTY to published T-yield. There is
relatively more movement from APH to substitution than in batch PTY, a movement reflecting a
higher PTY on some units. There also is relatively more movement from floor to yield
substitution, again reflecting a higher PTY on some units.

Use or disclosure of information or data Risk Management Agency
contained on this sheet is subject to the Contract No: 1406-N10PC18078 restrictions on the title page of this report.
37
Table 25. Movement among Yield Limitation Flags with PTY Substituted for T-yield and
T-yield for PTY, All Years (Normalized Data)
Batch Flag Before Flag After Net Acres Liability Premium Indemnity
Loss
Cost
Ratio
Loss
Ratio
-- thousands -- % %
PTY APH APH 7,520 1,666,681 260,604 141,677 8.5 54.4
PTY APH Cup 984 218,471 31,886 18,733 8.6 58.8
PTY APH Floor 127 20,569 3,464 1,243 6.0 35.9
PTY APH Substitution 660 134,915 19,188 12,834 9.5 66.9
PTY Cup Cup 6 1,669 253 155 9.3 61.3
PTY Cup APH - 105 13 - 0.0 0.0
PTY Cup Floor - - - - - -
PTY Cup Substitution 31 5,801 991 437 7.5 44.1
PTY Floor Floor 27 4,584 670 387 8.5 57.8
PTY Floor APH 22 4,110 558 264 6.4 47.3
PTY Floor Cup 2 513 76 39 7.8 51.8
PTY Floor Substitution 346 60,324 10,984 4,032 6.7 36.7
PTY Substitution Substitution 4,539 980,976 155,266 96,700 9.9 62.3
PTY Substitution APH 2 447 68 20 4.6 30.2
PTY Substitution Cup 1 169 28 18 10.8 64.6
PTY Substitution Floor - 41 6 - 0.0 0.0
PTY All All 14,267 3,099,375 484,055 276,539 8.9 57.1
T APH APH 21,829 4,672,173 642,741 410,405 8.8 63.9
T APH Cup 579 92,723 17,714 13,922 15.0 78.6
T APH Floor 14 2,698 383 197 7.3 51.4
T APH Substitution 6,929 1,412,896 190,352 118,413 8.4 62.2
T Cup Cup 20 3,794 647 549 14.5 85.0
T Cup APH 17 3,958 528 326 8.2 61.8
T Cup Floor - - - - - -
T Cup Substitution 371 49,863 9,513 5,667 11.4 59.6
T Floor Floor 9 1,536 238 76 5.0 32.0
T Floor APH 86 11,713 1,980 524 4.5 26.5
T Floor Cup 21 2,943 514 189 6.4 36.8
T Floor Substitution 2,080 237,660 60,047 23,119 9.7 38.5
T Substitution Substitution 11,962 2,177,859 353,160 216,075 9.9 61.2
T Substitution APH 14 2,325 455 265 11.4 58.2
T Substitution Cup 15 2,824 523 409 14.5 78.1
T Substitution Floor - - - - - -
T All All 43,946 8,674,965 1,278,795 790,136 9.1 61.8
Distribution among Yield Limitation Flags after Substitution of Acre-Weighted PTY
Table 26 contains the distribution among yield limitation flags after substitution of the acre-
weighted PTY. Table 27 compares the distribution from Table 20 to the distribution resulting
from Table 26 for batch PTY and the distribution from Table 22 to the distribution resulting from
Table 26 for batch T. This provides a direct comparison of the simple average PTY to the acre-
weighted PTY for both batches.

Use or disclosure of information or data Risk Management Agency
contained on this sheet is subject to the Contract No: 1406-N10PC18078 restrictions on the title page of this report.
38
With regard to batch PTY, fewer acres and liability are included in the yield limitation flag APH
than was the case with the original data. Use of the cup increases significantly and use of the
floor is reduced sharply. In both cases, the number of observations in these categories remains
very small. Yield substitution accounts for most of the movement from APH and floor. With
regard to batch T, there is little change from the case when the simple average PTY was
substituted.
Table 26. Distribution among Yield Limitation Flags after Substitution of Acre-Weighted
PTY
Year Batch Flag Net Acres Liability Premium Indemnity Loss Cost Ratio Loss Ratio
-- thousands -- % %
2007 PTY APH 2,309 386,313 54,722 31,920 8.3 58.3
2008 PTY APH 3,140 905,741 115,871 82,536 9.1 71.2
2009 PTY APH 3,238 703,404 105,869 76,268 10.8 72.0
Total PTY APH 8,687 1,995,458 276,462 190,724 9.6 69.0
2007 PTY Cup 18 2,616 555 227 8.7 40.9
2008 PTY Cup 45 10,924 1,846 1,168 10.7 63.3
2009 PTY Cup 88 15,422 2,638 1,547 10.0 58.7
Total PTY Cup 151 28,962 5,039 2,942 10.2 58.4
2007 PTY Floor 3 358 60 9 2.6 15.3
2008 PTY Floor 4 1,086 155 103 9.5 66.5
2009 PTY Floor 6 1,100 165 134 12.2 81.5
Total PTY Floor 13 2,544 380 246 9.7 64.7
2007 PTY Substitution 1,252 204,250 32,925 16,274 8.0 49.4
2008 PTY Substitution 1,987 572,419 81,014 63,229 11.0 78.0
2009 PTY Substitution 2,179 424,445 67,342 37,802 8.9 56.1
Total PTY Substitution 5,418 1,201,114 181,281 117,305 9.8 64.7
All PTY Total 14,269 3,228,078 463,162 311,217 9.6 67.2
2007 T APH 7,995 1,187,771 164,706 118,193 10.0 71.8
2008 T APH 7,454 2,014,607 256,981 175,630 8.7 68.3
2009 T APH 6,985 1,342,048 191,386 112,809 8.4 58.9
Total T APH 22,434 4,544,426 613,073 406,632 8.9 66.3
2007 T Cup 552 57,824 12,554 8,212 14.2 65.4
2008 T Cup 466 90,749 18,411 15,401 17.0 83.7
2009 T Cup 536 74,542 15,923 9,815 13.2 61.6
Total T Cup 1,554 223,115 46,888 33,428 15.0 71.3
2007 T Floor 6 717 127 62 8.7 49.1
2008 T Floor 7 1,650 233 124 7.6 53.6
2009 T Floor 10 1,457 236 106 7.3 45.1
Total T Floor 23 3,824 596 292 7.6 49.0
2007 T Substitution 6,740 910,314 147,303 84,930 9.3 57.7
2008 T Substitution 6,516 1,650,132 244,798 178,260 10.8 72.8
2009 T Substitution 6,683 1,116,760 179,244 72,619 6.5 40.5
Total T Substitution 19,939 3,677,206 571,345 335,809 9.1 58.8
All T Total 43,950 8,448,571 1,231,902 776,161 9.2 63.0
All All Total 58,219 11,676,649 1,695,064 1,087,378 9.3 64.1

Use or disclosure of information or data Risk Management Agency
contained on this sheet is subject to the Contract No: 1406-N10PC18078 restrictions on the title page of this report.
39
Table 27. Percentage Distribution of Net Acres and Liability According to Yield Limitation
Flag after Substitution of Acre-Weighted PTY
Batch Flag Net Acres Liability Net Acres Liability
% % % %
From Table 4 From Table 9
PTY APH 65.1 66.9 60.9 61.8
PTY Cup 0.3 0.2 1.1 0.9
PTY Floor 2.8 2.3 0.1 0.1
PTY Substitution 31.8 30.5 38.0 37.2
T APH 66.8 70.8 51.0 53.8
T Cup 0.9 0.7 3.5 2.6
T Floor 5.0 3.5 0.1 0.0
T Substitution 27.3 25.1 45.4 43.5
Distribution among Yield Limitation Flags after Substitution of Production-Weighted PTY
Tables 28 and 29 correspond to Tables 26 and 27. These tables illustrate the impact of
substituting a production-weighted PTY rather than the simple average PTY.

Use or disclosure of information or data Risk Management Agency
contained on this sheet is subject to the Contract No: 1406-N10PC18078 restrictions on the title page of this report.
40
Table 28. Distribution among Yield Limitation Flags after Substitution of Production-
Weighted PTY
Year Batch Flag Net Acres Liability Premium Indemnity Loss Cost Ratio Loss Ratio
-- thousands -- % %
2007 PTY APH 2,224 383,388 53,126 32,293 8.4 60.8
2008 PTY APH 3,033 897,877 112,908 87,136 9.7 77.2
2009 PTY APH 3,146 699,768 103,839 76,011 10.9 73.2
Total PTY APH 8,403 1,981,033 269,873 195,440 9.9 72.4
2007 PTY Cup 13 1,718 369 139 8.1 37.7
2008 PTY Cup 29 6,824 1,209 545 8.0 45.1
2009 PTY Cup 47 8,554 1,585 1,081 12.6 68.2
Total PTY Cup 89 17,096 3,163 1,765 10.3 55.8
2007 PTY Floor 6 925 144 40 4.3 27.6
2008 PTY Floor 7 1,882 258 189 10.1 73.4
2009 PTY Floor 8 1,557 227 142 9.1 62.4
Total PTY Floor 21 4,364 629 371 8.5 59.0
2007 PTY Substitution 1,340 224,294 35,198 18,109 8.1 51.4
2008 PTY Substitution 2,106 620,555 85,907 69,782 11.2 81.2
2009 PTY Substitution 2,309 461,235 71,673 40,996 8.9 57.2
Total PTY Substitution 5,755 1,306,084 192,778 128,887 9.9 66.9
All PTY Total 14,268 3,308,577 466,443 326,463 9.9 70.0
2007 T APH 7,665 1,169,566 158,059 120,458 10.3 76.2
2008 T APH 7,119 1,973,234 245,725 181,259 9.2 73.8
2009 T APH 6,663 1,313,696 183,650 113,130 8.6 61.6
Total T APH 21,447 4,456,496 587,434 414,847 9.3 70.6
2007 T Cup 388 38,722 8,653 5,932 15.3 68.6
2008 T Cup 334 63,085 13,184 11,039 17.5 83.7
2009 T Cup 374 51,033 11,292 7,301 14.3 64.7
Total T Cup 1,096 152,840 33,129 24,272 15.9 73.3
2007 T Floor 15 1,785 288 121 6.8 42.1
2008 T Floor 14 3,285 482 143 4.4 29.6
2009 T Floor 15 2,299 334 141 6.1 42.2
Total T Floor 44 7,369 1,104 405 5.5 36.7
2007 T Substitution 7,224 1,004,223 156,513 95,085 9.5 60.8
2008 T Substitution 6,975 1,810,533 260,031 203,964 11.3 78.4
2009 T Substitution 7,162 1,232,744 190,774 80,695 6.5 42.3
Total T Substitution 21,361 4,047,500 607,318 379,744 9.4 62.5
All T Total 43,948 8,664,205 1,228,985 819,268 9.5 66.7
All All Total 58,216 11,972,782 1,695,428 1,145,731 9.6 67.6

Use or disclosure of information or data Risk Management Agency
contained on this sheet is subject to the Contract No: 1406-N10PC18078 restrictions on the title page of this report.
41
Table 29. Percentage Distribution of Net Acres and Liability According to Yield Limitation
Flag after Substitution of Production-Weighted PTY
Batch Flag Net Acres Liability Net Acres Liability
% % % %
From Table 4 From Table 11
PTY APH 65.1 66.9 58.9 59.9
PTY Cup 0.3 0.2 0.6 0.5
PTY Floor 2.8 2.3 0.1 0.1
PTY Substitution 31.8 30.5 40.3 39.5
T APH 66.8 70.8 48.8 51.4
T Cup 0.9 0.7 2.5 1.8
T Floor 5.0 3.5 0.1 0.1
T Substitution 27.3 25.1 48.6 46.7
Summary of Loss Cost Ratios and Loss Ratios for the Various Scenarios
Table 30 contains the loss cost ratios and the loss ratios calculated for the various scenarios
developed for this report. The first line reports the data as extracted from the experience
database, while the second line shows the effect of normalizing the data by using the average
yield calculated from the Type 15 records to determine premium and indemnity. Although the
loss cost ratios declined significantly in the normalization process, the loss ratios were largely
unchanged. The normalized data are the basis for comparison of the effects of the various
substitutions.
The line “Initial Substitution” refers to the substitution of published T-yield for PTY and PTY
for published T-yield in the two batches. The lines for “Acre-Weighted Substitution” and
“Production-Weighted Substitution” are self-explanatory. There is a decrease in the loss cost
ratio and loss ratio for batch T with simple average substitution while both variables are
essentially unchanged from the normalized data with acre-weighted substitution. Production-
weighted substitution increases both variables relative to the normalized data. While forcing use
of the published T-yield would have reduced the loss cost ratio and the loss ratio relatively
significantly, the acre-weighted PTY resulted in a small increase in both variables. Similar to
batch T, the production-weighted PTY increased both variables. These results correspond with
the findings from the initial analysis.
Table 30. Comparisons of Loss Cost Ratio and Loss Ratio for the Various Scenarios Batch PTY Batch T All Data
Scenario Loss Cost
Ratio
Loss
Ratio
Loss Cost
Ratio
Loss
Ratio
Loss Cost
Ratio
Loss
Ratio
% % % % % %
Original Data 12.0 66.1 11.7 64.9 11.7 65.2
Normalized Data 9.5 65.8 9.3 63.4 9.3 64.1
Initial Substitution 8.9 57.1 9.1 61.8 9.1 60.5
Acre-Weighted Substitution 9.6 67.2 9.2 63.0 9.3 64.1
Production-Weighted Substitution 9.9 70.0 9.5 66.7 9.6 67.6

Use or disclosure of information or data Risk Management Agency
contained on this sheet is subject to the Contract No: 1406-N10PC18078 restrictions on the title page of this report.
42
Changes in Batch T by Percentile
Table 31 is constructed from a subset of batch T having these characteristics: at least one T-yield
type was used, or a floor or yield substitution was employed, and the policy had at least one
actual yield. The intent of this Table is to demonstrate the range of changes that occurred in
these records as a result of substituting the PTY for the T-yield actually used.
Table 31. Changes in Liability, Premium, and Indemnity, by Percentile
Of Change in Approved Yield. Percentile Acres Liability Premium Indemnity
10 7.5% -0.6% -0.1% -0.7%
20 9.8% -0.4% -0.1% -0.5%
30 11.0% -0.3% -0.1% -0.5%
40 11.3% -0.2% -0.1% -0.3%
50 13.2% -0.2% 0.0% -0.4%
60 11.8% -0.2% 0.0% -0.3%
70 14.4% 0.2% -0.1% 0.5%
80 9.6% 0.2% 0.0% 0.5%
90 5.5% 0.4% -0.1% 1.0%
100 5.9% 1.1% -0.5% 2.9%
Total 100.0% 0.0% -1.2% 2.2%
Overall, there is no net change in liability since the PTY reduced this variable in the lower
percentiles but increased it in the higher percentiles. This is due to the fact that the PTY does
exceed the T-yield in many cases. The estimated premium decreased slightly due to a reduction
at all percentiles. At the lower percentiles, this appears to be the effect of a relatively larger
reduction in liability while at the higher percentiles the yield ratio effect might be lowering the
premium rate under the RMA rating formula. Estimated indemnities are lower at the lower
percentiles (consistent with the lowered liability) but greater at the higher percentiles, resulting
overall in an increase in indemnities for this set of records. However, the overall effects are
small.
SECTION IX. SUMMARY OF FINDINGS
The key objectives of the PTY Pilot evaluation are “to determine if the program is meeting the
risk management needs of insured producers, is not subject to program abuse, and is actuarially
appropriate so that the [FCIC] Board of Directors can determine whether the pilot program
should be made permanent, be modified and further evaluated, should be terminated or could be
made more Broadly [sic] available.”24
Under the current PTY Pilot, the PTY is calculated by combining data from all basic and
optional unit acreage and production history for a crop/policy/county on a PTY summary
database. Yield for a crop year in the PTY summary database is an acre-weighted average of the
yield values within that crop year for the crop, practice, type, variety, and TMA. The PTY for
the insured, crop, practice, type, variety, and TMA is then the simple average of the annual
values from the summary PTY database.
24 USDA, RMA, 2009, Statement of Work, page 6.

Use or disclosure of information or data Risk Management Agency
contained on this sheet is subject to the Contract No: 1406-N10PC18078 restrictions on the title page of this report.
43
As a group, insureds who participated in listening sessions and informal discussions were quite
pleased with the PTY Pilot program, were enthusiastic about its continuation, and saw few
barriers to its expansion. Most insureds indicated having a choice between T-yields and PTYs
was one of the most attractive features of the pilot. Almost all the insureds indicated they
depended on agents to complete all program calculations and made their decisions based on the
liability and premium information supplied by the agents. All the insurance industry personnel
were pleased to be able to offer the PTY option. They had a strong preference to continue the
program as an option rather than as a requirement. Such a structure does create the issue of
adverse selection as insureds choose the approach which provides the highest guarantee,
regardless of their production capabilities. The data analysis indicates this is not a major issue
with respect to the procedure. None of the insurance industry personnel expressed concern about
the added administrative burden of the program. A limited number of the agents and most of the
insureds were not aware of the surcharge associated with the option.
The Contractor generated standardized data for units that had used the T-yield procedure and
qualified for the use of the PTY option to evaluate the effects of such an action. Approximately
13 percent of policies and units from the original T-yield category and 10 percent of net insured
acres are eliminated due to ineligibility. The estimated impact of requiring the use of PTY for
policies using the T-yield on eligible units, relative to the outcome of using T-yield procedures
based on the standardized data is rather limited. Some units had higher guarantees; some had
lower. Replacing the T-yield calculated using standard procedures with the simple average PTY
resulted in no change in the liability, a small decrease in premium, and a small increase in
indemnity for this group when cups, floors and yield substitutions are considered. Changes are
small at all percentiles of change in the approved yield.
The production-weighted PTY calculation approach results in a small increase in loss ratio and
loss cost ratio for units that originally used T-yield; while the acre-weighted PTY calculation
approach results in substantially the same values as those obtained using the T-yields for the
normalized data. It is important to note that the pilot has been operating for just three years, and
none of the loss ratios calculated by any of these methods exceeded 1.0. Due to data limitations,
it is impossible to test the statistical significance of these results.
Substituting the T-yield for PTY on units that originally used PTY results in a substantial
reduction in loss cost ratio and loss ratio for those units. However, unit performance before
substitution was substantially the same as units that used the T-yield. Thus, one could conclude
that program performance was adversely affected in a relative sense by use of the PTY: losses
potentially would have been lesser if those units had been forced to use the T-yield procedures.
But, producers also have options to use added land procedures and other methods. It is quite
possible that some of the units that used PTY might have used those alternatives. Hence, it is not
possible to state unequivocally that losses would have been substantially lower if the PTY had
not been available. One may infer that producers opted to use PTY when it benefited them to do
so, when the average of their own yields exceeded the T-yield values they might otherwise have
used.
Use or disclosure of information or data Risk Management Agency
contained on this sheet is subject to the Contract No: 1406-N10PC18078 restrictions on the title page of this report.
Appendix A.
North Dakota Personal Transitional Yield Pilot Insurance
Program Sample Listening Session Agenda

Use or disclosure of information or data Risk Management Agency
contained on this sheet is subject to the Contract No: 1406-N10PC18078 restrictions on the title page of this report.
Agenda
• Introductions The Contractor
Attendees
• Purpose Gather impressions of the program
Learn about possible improvements
Make recommendation to USDA about the
program
• Background FCIC Insurance Development Contracts
History of PTY
• 2000 MT test
• 2007 ND Pilot
• Feedback Use
Experiences
Surprises
Improvements
Changes
• Questions

Use or disclosure of information or data Risk Management Agency
contained on this sheet is subject to the Contract No: 1406-N10PC18078 restrictions on the title page of this report.
Appendix B.
North Dakota Personal Transitional Yield Pilot Insurance
Program Insurance Experience
Table B1. Data Extracted from Experience Database for all Eligible Crops
and Counties, North Dakota: By Year
Table B2. Data Extracted from Experience Database for all Eligible Crops
and Counties, North Dakota: By Crop and Year
Table B3. Data Extracted from Experience Database for all Eligible Crops
and Counties, North Dakota: By County and Year

Use or disclosure of information or data Risk Management Agency
contained on this sheet is subject to the Contract No: 1406-N10PC18078 restrictions on the title page of this report.
B1
Table B1. Data Extracted from Experience Database for all Eligible Crops and Counties,
North Dakota: By Year
Crop
Year
Policies Earning
Premium
Units Earning
Premium
Policies
Indemnified
Units
Indemnified
Net Insured
Acres Liability
Total
Premium Indemnity
Units Using PTY
2007 6,432 19,020 2,096 3,662 1,978,894 342,769,304 58,250,505 26,656,640
2008 8,657 25,330 4,245 9,739 2,656,020 785,250,341 143,485,490 119,416,390
2009 9,230 22,201 3,909 5,856 2,673,514 556,593,809 99,332,445 61,207,463
Units Using T-yield
2007 32,618 71,460 9,942 15,490 6,250,874 857,290,653 155,734,427 86,717,246
2008 29,131 63,514 13,257 24,594 5,694,444 1,388,028,315 271,232,710 235,094,739
2009 28,445 55,361 8,560 11,899 5,338,138 901,212,454 171,063,918 86,220,886
Unclasssified Units
2007 23,501 75,088 8,268 16,117 7,824,171 1,201,843,000 201,631,578 112,545,798
2008 23,481 76,218 10,998 28,137 8,242,951 2,331,010,058 438,117,399 344,220,129
2009 23,756 68,269 8,514 13,995 8,555,982 1,613,708,583 280,609,701 124,520,518
All Actuals
2007 17,098 39,576 5,800 9,544 3,477,387 524,662,050 83,681,569 54,163,377
2008 16,721 39,654 6,924 13,786 3,640,133 1,023,225,242 182,797,730 132,918,392
2009 16,373 34,576 5,171 7,128 3,666,036 687,109,260 114,452,245 51,278,514

Use or disclosure of information or data Risk Management Agency
contained on this sheet is subject to the Contract No: 1406-N10PC18078 restrictions on the title page of this report.
B2
Table B2. Data Extracted from Experience Database for all Counties, North Dakota: By
Crop and Year
Crop Year Crop ID
Policies
Earning
Premium
Units
Earning
Premium
Policies
Indemnified
Units
Indemnified
Net Insured
Acres Liability
Total
Premium Indemnity
Units Using PTY
2007 11 1,436 5,050 413 765 540,060 69,216,723 10,845,395 4,904,086
2008 11 2,064 7,170 923 2,576 766,212 212,237,760 40,205,795 38,171,938
2009 11 2,177 6,533 774 1,157 787,023 133,595,291 20,123,884 7,168,241
2007 15 688 1,826 308 537 174,382 27,701,540 4,130,317 3,607,778
2008 15 695 1,738 366 714 169,290 52,517,741 8,301,930 9,195,159
2009 15 704 1,599 360 605 158,248 30,221,198 4,499,955 5,577,056
2007 16 84 144 20 29 8,832 710,733 116,346 57,331
2008 16 75 107 21 30 6,156 886,451 153,000 116,520
2009 16 123 177 21 22 8,739 956,671 159,030 49,175
2007 17 0 0 0 0 0 0 0 0
2008 17 0 0 0 0 0 0 0 0
2009 17 0 0 0 0 0 0 0 0
2007 31 214 467 60 94 39,412 4,037,260 463,697 283,717
2008 31 290 643 105 171 56,119 12,643,245 1,505,374 1,424,815
2009 31 282 637 135 211 54,902 9,760,825 1,325,665 1,372,142
2007 41 1,226 3,767 406 729 414,685 128,264,876 24,938,662 8,378,358
2008 41 1,766 4,991 864 1,732 533,915 222,128,601 44,053,371 21,623,210
2009 41 1,952 3,623 1,064 1,553 550,414 172,375,060 37,743,031 30,816,166
2007 47 377 1,056 174 297 90,619 19,304,780 3,524,727 2,248,976
2008 47 411 1,132 126 223 104,404 31,551,797 5,632,236 2,332,447
2009 47 515 1,399 224 354 124,376 36,192,549 6,860,798 4,164,267
2007 49 19 52 1 1 4,670 331,548 53,951 2,675
2008 49 16 27 13 17 2,598 344,958 55,551 128,479
2009 49 11 25 0 0 1,858 308,677 55,618 0
2007 51 0 0 0 0 0 0 0 0
2007 67 384 1,024 41 60 103,506 9,030,676 1,243,196 268,607
2008 67 536 1,363 157 352 138,004 27,308,150 3,582,078 2,846,209
2009 67 507 1,167 141 200 117,505 22,263,294 3,223,700 1,263,404
2007 69 8 16 4 9 3,045 383,771 45,822 65,863
2008 69 5 7 3 5 1,462 482,422 63,825 181,416
2009 69 3 10 0 0 1,245 263,367 35,306 0
2007 78 456 1,181 147 253 137,400 21,039,981 3,217,415 1,793,736
2008 78 557 1,437 363 778 165,465 55,216,586 10,563,044 12,699,266
2009 78 652 1,376 277 386 162,098 32,327,406 6,106,489 3,080,437
2007 81 968 2,933 384 674 287,719 46,827,008 7,694,604 4,137,824
2008 81 1,403 4,408 1,068 2,608 441,657 124,010,747 22,918,484 26,228,792
2009 81 1,490 3,989 646 1,042 454,618 86,310,885 15,150,115 6,464,342
2007 91 570 1,498 136 210 174,449 15,904,468 1,973,943 903,109
2008 91 838 2,300 235 528 270,502 45,901,509 6,445,576 4,454,816
2009 91 806 1,648 267 326 250,866 31,831,675 4,020,722 1,252,233
2007 94 2 6 2 4 115 15,940 2,430 4,580
2008 94 1 7 1 5 236 20,374 5,226 13,323
2009 94 8 18 0 0 1,622 186,911 28,132 0

Use or disclosure of information or data Risk Management Agency
contained on this sheet is subject to the Contract No: 1406-N10PC18078 restrictions on the title page of this report.
B3
Crop Year Crop ID
Policies
Earning
Premium
Units
Earning
Premium
Policies
Indemnified
Units
Indemnified
Net Insured
Acres Liability
Total
Premium Indemnity
Units Using T-yield
2007 11 7,905 20,324 2,330 3,875 1,911,806 210,477,098 36,899,859 19,206,872
2008 11 7,363 18,559 3,152 7,048 1,763,038 416,349,962 85,850,473 78,347,201
2009 11 7,200 16,272 1,678 2,347 1,709,322 247,662,735 41,058,533 12,753,268
2007 15 2,673 5,647 1,005 1,606 511,294 71,667,854 12,098,084 10,852,501
2008 15 2,019 4,025 917 1,462 362,329 99,647,761 17,530,121 14,726,860
2009 15 2,054 3,765 946 1,397 346,102 59,662,825 9,731,064 10,609,938
2007 16 1,298 1,978 264 347 99,647 5,642,846 1,283,993 528,657
2008 16 876 1,246 401 543 53,559 5,261,328 1,218,413 1,699,955
2009 16 1,109 1,638 107 122 73,115 5,612,514 1,351,097 286,645
2007 17 6 8 2 2 307 12,812 3,206 2,886
2008 17 5 6 0 0 327 21,262 4,819 0
2009 17 3 3 0 0 117 5,663 1,056 0
2007 31 1,522 2,694 581 853 181,955 14,926,697 2,014,098 1,842,024
2008 31 1,302 2,256 513 757 162,105 29,831,767 4,054,976 4,441,469
2009 31 1,488 2,479 570 761 174,161 25,181,403 3,803,914 3,847,820
2007 41 4,752 10,037 1,090 1,690 869,550 220,942,800 47,204,755 17,160,267
2008 41 3,907 7,950 1,452 2,393 679,971 235,260,283 51,046,807 25,622,931
2009 41 3,671 5,859 1,340 1,875 609,758 154,767,824 39,146,769 25,374,506
2007 47 1,548 3,682 592 945 285,033 51,658,562 10,730,962 5,539,622
2008 47 1,197 2,787 315 495 237,273 61,613,349 12,279,778 4,965,705
2009 47 1,300 2,819 496 720 228,941 56,830,132 12,442,290 6,844,896
2007 49 177 332 38 67 28,574 1,738,471 336,696 149,079
2008 49 99 170 45 70 13,720 1,472,888 330,290 371,479
2009 49 89 147 11 17 13,307 1,783,710 374,853 120,385
2007 51 0 0 0 0 0 0 0 0
2007 67 1,754 3,977 330 553 323,178 22,834,208 3,706,589 1,582,059
2008 67 1,417 3,234 543 1,081 262,603 39,594,714 6,215,044 6,372,428
2009 67 1,541 3,485 323 453 298,787 45,184,760 7,740,660 2,325,115
2007 69 107 154 58 79 23,698 2,490,920 359,790 546,476
2008 69 143 219 94 144 28,801 7,832,435 1,179,202 2,787,492
2009 69 54 106 14 22 12,574 2,167,416 386,370 230,007
2007 78 3,100 6,124 1,143 1,696 548,141 70,817,484 13,141,176 9,541,496
2008 78 2,790 5,724 1,601 2,851 534,046 143,601,637 31,381,018 35,717,599
2009 78 2,640 4,582 1,038 1,399 461,716 77,249,347 17,508,789 10,750,609
2007 81 4,592 10,124 1,657 2,521 874,340 137,927,543 21,300,703 15,319,072
2008 81 4,887 11,037 3,248 6,187 988,773 261,410,800 47,067,877 50,508,900
2009 81 4,896 10,109 1,449 2,076 1,000,174 181,835,874 31,176,811 10,661,251
2007 91 3,141 6,298 837 1,234 588,906 45,822,984 6,599,285 4,343,668
2008 91 3,089 6,238 965 1,548 604,560 85,853,450 13,032,263 9,500,125
2009 91 2,308 3,938 567 681 400,356 42,466,185 6,208,035 2,326,488
2007 94 43 81 15 22 4,444 330,374 55,231 102,567
2008 94 37 63 11 15 3,337 276,679 41,629 32,595
2009 94 92 159 21 29 9,708 802,066 133,677 89,958

Use or disclosure of information or data Risk Management Agency
contained on this sheet is subject to the Contract No: 1406-N10PC18078 restrictions on the title page of this report.
B4
Crop Year Crop ID
Policies
Earning
Premium
Units
Earning
Premium
Policies
Indemnified
Units
Indemnified
Net Insured
Acres Liability
Total
Premium Indemnity
Unclassified Units
2007 11 8,775 37,103 2,982 6,156 4,030,688 500,203,007 84,066,193 34,265,098
2008 11 8,770 37,867 3,903 12,417 4,274,462 1,138,084,590 226,496,082 186,547,648
2009 11 8,695 33,434 2,774 5,025 4,362,822 694,342,029 113,295,108 29,480,754
2007 15 1,497 3,353 653 1,172 328,141 53,680,938 8,760,041 10,883,572
2008 15 1,372 2,933 636 1,036 299,882 95,848,780 16,284,142 12,238,226
2009 15 1,405 3,140 661 1,150 326,803 63,717,123 10,345,367 11,996,218
2007 16 805 1,346 145 211 65,496 4,145,356 1,052,390 337,297
2008 16 651 1,075 285 468 48,347 5,234,301 1,363,268 1,423,707
2009 16 716 1,141 58 67 51,285 4,468,064 1,192,836 145,494
2007 17 2 2 1 1 72 3,759 958 1,721
2008 17 1 1 0 0 24 1,518 278 0
2009 17 1 1 0 0 61 5,486 641 0
2007 31 584 950 205 307 65,188 5,649,725 779,789 633,039
2008 31 595 982 212 305 72,943 14,519,985 1,979,318 1,844,949
2009 31 651 1,133 243 319 84,903 13,430,379 2,073,827 2,209,179
2007 41 2,801 7,976 866 1,802 823,425 246,243,248 48,496,181 20,767,556
2008 41 2,920 8,126 1,139 2,242 863,619 353,824,712 71,879,030 27,164,455
2009 41 3,121 6,255 1,437 2,256 902,343 280,979,680 62,187,276 44,677,297
2007 47 1,103 2,953 411 695 262,602 54,456,728 10,086,330 5,493,878
2008 47 997 2,626 270 435 232,628 68,692,119 12,077,961 4,427,500
2009 47 1,081 2,934 410 656 269,898 76,652,545 14,394,020 7,832,430
2007 49 22 30 2 3 3,086 188,971 34,460 3,284
2008 49 17 29 9 16 2,937 355,976 62,124 40,780
2009 49 10 17 0 0 1,520 226,082 44,425 0
2007 51 0 0 0 0 0 0 0 0
2007 67 176 326 25 44 23,456 1,999,383 302,445 98,978
2008 67 193 356 60 112 31,021 5,642,677 853,315 839,961
2009 67 237 419 38 55 37,430 6,681,629 1,171,055 319,651
2007 69 7 8 4 5 878 102,370 16,330 19,020
2008 69 7 11 4 4 1,038 310,820 33,749 60,211
2009 69 8 10 0 0 994 151,947 28,574 0
2007 78 1,680 3,291 649 978 300,463 41,286,572 7,512,537 6,106,907
2008 78 1,504 2,999 823 1,381 275,753 80,360,524 16,903,713 15,309,535
2009 78 1,588 2,736 658 940 277,545 50,449,169 10,962,129 6,564,215
2007 81 3,455 11,488 1,576 3,567 1,296,781 239,437,239 32,918,270 29,368,260
2008 81 3,709 12,695 2,894 8,512 1,468,169 461,797,551 74,368,844 86,352,392
2009 81 3,931 12,463 1,532 2,606 1,683,994 355,723,440 55,687,972 17,397,533
2007 91 2,591 6,258 749 1,176 623,723 54,427,606 7,602,683 4,567,188
2008 91 2,740 6,509 760 1,202 671,656 106,289,588 15,805,847 7,939,876
2009 91 2,308 4,580 702 920 556,128 66,852,951 9,219,602 3,895,260
2007 94 3 4 0 0 171 18,098 2,971 0
2008 94 5 9 3 7 471 46,917 9,728 30,889
2009 94 4 6 1 1 255 28,059 6,869 2,487
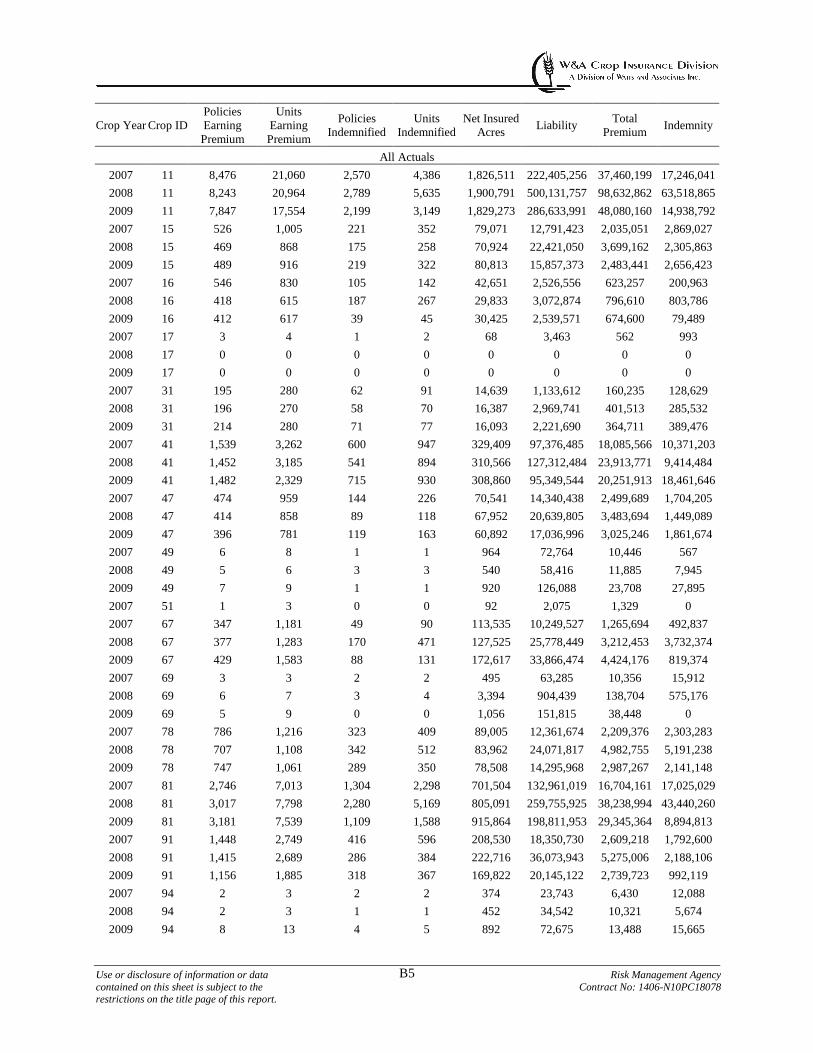
Use or disclosure of information or data Risk Management Agency
contained on this sheet is subject to the Contract No: 1406-N10PC18078 restrictions on the title page of this report.
B5
Crop Year Crop ID
Policies
Earning
Premium
Units
Earning
Premium
Policies
Indemnified
Units
Indemnified
Net Insured
Acres Liability
Total
Premium Indemnity
All Actuals
2007 11 8,476 21,060 2,570 4,386 1,826,511 222,405,256 37,460,199 17,246,041
2008 11 8,243 20,964 2,789 5,635 1,900,791 500,131,757 98,632,862 63,518,865
2009 11 7,847 17,554 2,199 3,149 1,829,273 286,633,991 48,080,160 14,938,792
2007 15 526 1,005 221 352 79,071 12,791,423 2,035,051 2,869,027
2008 15 469 868 175 258 70,924 22,421,050 3,699,162 2,305,863
2009 15 489 916 219 322 80,813 15,857,373 2,483,441 2,656,423
2007 16 546 830 105 142 42,651 2,526,556 623,257 200,963
2008 16 418 615 187 267 29,833 3,072,874 796,610 803,786
2009 16 412 617 39 45 30,425 2,539,571 674,600 79,489
2007 17 3 4 1 2 68 3,463 562 993
2008 17 0 0 0 0 0 0 0 0
2009 17 0 0 0 0 0 0 0 0
2007 31 195 280 62 91 14,639 1,133,612 160,235 128,629
2008 31 196 270 58 70 16,387 2,969,741 401,513 285,532
2009 31 214 280 71 77 16,093 2,221,690 364,711 389,476
2007 41 1,539 3,262 600 947 329,409 97,376,485 18,085,566 10,371,203
2008 41 1,452 3,185 541 894 310,566 127,312,484 23,913,771 9,414,484
2009 41 1,482 2,329 715 930 308,860 95,349,544 20,251,913 18,461,646
2007 47 474 959 144 226 70,541 14,340,438 2,499,689 1,704,205
2008 47 414 858 89 118 67,952 20,639,805 3,483,694 1,449,089
2009 47 396 781 119 163 60,892 17,036,996 3,025,246 1,861,674
2007 49 6 8 1 1 964 72,764 10,446 567
2008 49 5 6 3 3 540 58,416 11,885 7,945
2009 49 7 9 1 1 920 126,088 23,708 27,895
2007 51 1 3 0 0 92 2,075 1,329 0
2007 67 347 1,181 49 90 113,535 10,249,527 1,265,694 492,837
2008 67 377 1,283 170 471 127,525 25,778,449 3,212,453 3,732,374
2009 67 429 1,583 88 131 172,617 33,866,474 4,424,176 819,374
2007 69 3 3 2 2 495 63,285 10,356 15,912
2008 69 6 7 3 4 3,394 904,439 138,704 575,176
2009 69 5 9 0 0 1,056 151,815 38,448 0
2007 78 786 1,216 323 409 89,005 12,361,674 2,209,376 2,303,283
2008 78 707 1,108 342 512 83,962 24,071,817 4,982,755 5,191,238
2009 78 747 1,061 289 350 78,508 14,295,968 2,987,267 2,141,148
2007 81 2,746 7,013 1,304 2,298 701,504 132,961,019 16,704,161 17,025,029
2008 81 3,017 7,798 2,280 5,169 805,091 259,755,925 38,238,994 43,440,260
2009 81 3,181 7,539 1,109 1,588 915,864 198,811,953 29,345,364 8,894,813
2007 91 1,448 2,749 416 596 208,530 18,350,730 2,609,218 1,792,600
2008 91 1,415 2,689 286 384 222,716 36,073,943 5,275,006 2,188,106
2009 91 1,156 1,885 318 367 169,822 20,145,122 2,739,723 992,119
2007 94 2 3 2 2 374 23,743 6,430 12,088
2008 94 2 3 1 1 452 34,542 10,321 5,674
2009 94 8 13 4 5 892 72,675 13,488 15,665
Use or disclosure of information or data Risk Management Agency
contained on this sheet is subject to the Contract No: 1406-N10PC18078 restrictions on the title page of this report.
B6
Table B3. Data Extracted from Experience Database for all Eligible Crops, North Dakota:
By County and Year
Crop
Year
County
FIPS
Policies
Earning
Premium
Units Earning
Premium
Policies
Indemnified
Units
Indemnified
Net
Insured
Acres
Liability Total
Premium Indemnity
Units Using PTY
2007 001 15 56 1 2 8,487 857,535 168,227 25,192
2007 003 206 622 79 142 72,140 20,099,825 3,919,552 1,062,277
2007 005 262 774 112 191 69,004 10,634,383 2,034,577 1,088,651
2007 007 3 3 0 0 556 66,041 11,572 0
2007 009 340 984 54 80 117,615 14,596,569 2,176,935 508,205
2007 011 25 64 6 12 6,181 568,764 97,091 36,478
2007 013 106 418 20 30 41,207 4,605,113 730,844 235,291
2007 015 66 192 11 17 23,714 3,328,316 619,141 121,812
2007 017 149 488 80 149 63,859 22,394,073 3,391,826 2,274,835
2007 019 166 458 74 124 41,523 6,917,597 1,211,260 917,888
2007 021 145 412 99 177 41,150 11,511,474 2,283,589 2,128,498
2007 023 77 254 23 35 21,307 2,276,277 322,215 192,752
2007 025 16 80 8 27 14,392 1,749,119 296,226 208,339
2007 027 94 216 22 29 18,015 2,593,794 429,073 123,536
2007 029 66 196 4 6 26,905 5,148,145 1,702,138 47,127
2007 031 211 479 62 93 67,131 10,465,907 1,712,955 659,981
2007 033 14 49 2 4 7,626 853,852 149,523 79,354
2007 035 123 338 16 19 30,518 7,056,856 1,317,579 108,482
2007 037 26 80 6 11 9,250 906,216 171,334 159,569
2007 039 67 137 24 30 18,187 3,984,001 785,243 131,711
2007 041 43 154 8 12 21,301 2,631,198 402,205 79,563
2007 043 80 161 16 22 17,875 2,628,486 393,401 151,531
2007 045 166 382 84 134 38,408 11,530,672 2,269,219 1,073,020
2007 047 126 359 43 80 33,102 4,625,332 859,551 551,789
2007 049 198 491 55 89 44,274 6,287,806 971,899 405,173
2007 051 54 179 24 47 15,606 2,224,776 423,569 126,957
2007 053 19 72 6 14 7,550 649,038 108,119 33,618
2007 055 353 1,263 112 212 119,922 15,776,910 2,086,110 1,225,943
2007 057 28 188 10 61 20,965 2,493,665 413,596 350,924
2007 059 34 107 7 9 11,432 1,382,203 263,599 71,876
2007 061 204 686 53 90 66,928 7,938,379 1,119,730 392,618
2007 063 160 442 76 145 37,641 5,958,402 1,180,410 847,370
2007 065 18 54 3 3 3,643 468,911 78,773 14,953
2007 067 99 251 29 41 22,849 4,550,231 775,662 439,874
2007 069 201 524 78 157 35,900 5,192,224 968,487 758,511
2007 071 181 409 94 145 35,088 5,921,684 1,250,833 880,151
2007 073 76 183 39 64 19,142 5,906,084 909,357 450,177
2007 075 297 773 36 55 103,529 13,728,158 1,932,315 509,919
2007 077 69 177 47 90 19,106 6,590,263 915,809 738,957
2007 079 75 166 16 20 14,156 1,841,904 313,638 49,660
2007 081 116 355 68 164 26,415 8,848,391 1,569,934 1,356,106
2007 083 97 308 15 26 28,407 3,473,215 554,288 93,867
2007 085 8 21 3 8 3,511 618,392 136,405 46,380
2007 087 19 48 1 1 8,775 912,354 141,513 2,080
2007 089 31 103 3 15 15,237 2,178,019 358,514 89,120
Use or disclosure of information or data Risk Management Agency
contained on this sheet is subject to the Contract No: 1406-N10PC18078 restrictions on the title page of this report.
B7
Crop
Year
County
FIPS
Policies
Earning
Premium
Units Earning
Premium
Policies
Indemnified
Units
Indemnified
Net
Insured
Acres
Liability Total
Premium Indemnity
Units Using PTY
2007 091 43 97 12 16 8,840 2,503,047 508,157 218,904
2007 093 305 1,018 121 204 114,537 25,532,012 4,297,809 1,624,152
2007 095 120 424 65 97 28,998 4,099,171 802,784 486,561
2007 097 53 144 16 23 16,818 5,719,098 896,349 249,074
2007 099 121 340 33 48 28,264 6,498,313 1,153,912 377,320
2007 101 447 1,371 145 278 142,913 19,193,322 2,695,979 1,993,452
2007 103 306 957 60 85 106,427 18,127,464 3,089,674 593,231
2007 105 108 513 15 29 62,567 6,126,323 878,005 263,831
2008 001 35 126 25 76 18,000 3,554,493 803,929 1,279,170
2008 003 295 811 146 302 99,032 39,177,320 7,800,750 3,195,985
2008 005 328 1,093 163 397 98,244 26,165,261 5,519,054 4,811,345
2008 007 5 16 5 16 2,014 519,574 116,025 425,986
2008 009 439 1,253 159 337 152,127 39,813,371 6,967,267 4,501,248
2008 011 40 139 32 98 17,285 3,573,482 768,158 1,397,698
2008 013 162 593 43 104 62,142 14,430,568 2,430,999 897,685
2008 015 94 246 48 95 27,924 7,659,480 1,518,904 1,406,586
2008 017 186 580 73 147 79,285 37,498,674 6,075,464 2,260,912
2008 019 223 582 83 142 57,881 18,342,114 3,558,128 1,869,652
2008 021 182 479 135 289 45,167 18,612,354 3,807,530 3,066,600
2008 023 95 266 31 62 23,937 5,497,911 890,061 334,429
2008 025 27 118 26 114 19,114 4,903,579 1,083,207 3,529,405
2008 027 149 369 55 112 32,681 8,125,708 1,437,831 789,958
2008 029 100 249 57 113 30,668 8,145,581 2,138,784 1,686,218
2008 031 232 581 126 245 82,870 23,094,515 4,102,036 4,121,640
2008 033 33 120 29 93 16,656 3,900,404 820,610 1,830,698
2008 035 153 459 60 126 47,388 17,847,935 3,245,782 1,371,529
2008 037 40 117 22 61 13,395 2,667,858 621,758 669,672
2008 039 95 222 54 100 29,852 9,769,861 1,866,035 1,030,491
2008 041 78 240 60 168 33,935 9,044,209 1,731,867 3,636,778
2008 043 131 290 53 82 30,637 7,449,029 1,426,284 914,389
2008 045 185 455 116 217 47,508 20,339,570 3,942,536 2,201,411
2008 047 157 444 88 214 37,990 10,234,655 2,269,324 2,261,625
2008 049 293 679 94 159 63,478 16,981,072 2,806,958 1,492,536
2008 051 79 218 40 90 19,829 5,529,170 1,184,498 978,010
2008 053 45 211 39 182 20,085 3,534,567 639,399 1,995,395
2008 055 410 1,429 301 886 131,481 33,960,640 5,219,902 10,387,617
2008 057 36 272 32 202 29,561 7,315,547 1,345,483 3,124,260
2008 059 60 209 33 79 18,877 4,544,837 1,006,599 1,821,136
2008 061 285 1,098 171 549 112,535 26,687,405 4,201,172 6,090,940
2008 063 175 480 115 246 40,061 11,489,270 2,418,966 1,954,157
2008 065 23 62 16 36 7,136 1,873,984 344,138 549,701
2008 067 164 461 45 71 49,032 16,759,664 3,105,299 1,026,385
2008 069 269 743 126 217 54,347 13,768,382 2,652,522 1,809,330
2008 071 217 593 141 269 48,992 13,947,946 3,064,128 2,591,726
2008 073 109 246 53 93 24,738 10,617,344 1,883,087 794,568
2008 075 356 878 100 170 118,361 30,924,733 4,985,380 1,867,491
2008 077 111 260 53 81 23,018 10,708,277 1,629,923 718,207
2008 079 90 185 39 61 16,016 4,246,655 811,602 573,625

Use or disclosure of information or data Risk Management Agency
contained on this sheet is subject to the Contract No: 1406-N10PC18078 restrictions on the title page of this report.
B8
Crop
Year
County
FIPS
Policies
Earning
Premium
Units Earning
Premium
Policies
Indemnified
Units
Indemnified
Net
Insured
Acres
Liability Total
Premium Indemnity
Units Using PTY
2008 081 139 413 89 185 30,655 14,242,583 2,584,919 1,701,639
2008 083 147 413 66 97 39,171 9,704,282 1,653,127 812,305
2008 085 7 35 4 8 5,669 1,667,715 350,353 362,296
2008 087 38 107 37 97 15,324 3,356,077 595,367 1,804,562
2008 089 58 156 58 150 16,939 4,354,371 835,535 3,153,220
2008 091 76 176 25 43 15,675 6,354,946 1,222,949 408,427
2008 093 453 1,371 291 746 162,246 56,123,756 10,029,069 9,605,051
2008 095 174 470 46 81 39,983 10,124,713 1,945,761 742,168
2008 097 98 219 29 41 24,072 10,638,997 1,762,969 362,328
2008 099 155 426 58 123 37,627 14,314,927 2,794,015 1,930,700
2008 101 598 1,857 197 372 178,602 48,963,977 7,895,814 2,979,691
2008 103 387 1,194 170 426 134,244 37,238,297 7,031,003 4,818,483
2008 105 141 621 88 269 72,532 14,908,701 2,543,230 3,469,326
2009 001 43 121 7 10 22,042 2,675,286 516,845 71,540
2009 003 320 595 167 248 89,462 26,925,332 5,515,709 2,402,061
2009 005 373 1,007 239 401 104,437 19,568,803 4,254,480 4,126,784
2009 007 1 2 0 0 205 28,043 6,389 0
2009 009 462 1,012 190 230 164,715 27,428,699 4,064,006 979,313
2009 011 40 129 6 12 19,312 2,364,750 426,423 55,028
2009 013 163 530 37 48 64,921 10,895,375 1,448,331 212,688
2009 015 89 246 11 13 35,137 6,037,260 1,102,719 91,981
2009 017 221 473 83 107 77,487 26,978,487 4,859,307 3,466,502
2009 019 248 636 150 301 66,863 13,457,126 2,650,258 4,393,510
2009 021 188 354 121 161 47,376 14,351,066 3,127,117 3,148,950
2009 023 81 221 1 1 19,004 3,265,512 392,844 660
2009 025 26 92 2 2 17,703 2,188,090 437,044 4,811
2009 027 151 336 72 114 32,840 5,814,150 1,061,284 859,176
2009 029 104 143 11 12 30,574 6,365,883 1,530,386 55,983
2009 031 275 584 168 286 92,694 17,231,096 2,921,350 2,172,561
2009 033 25 106 2 5 15,462 2,322,180 473,112 33,161
2009 035 197 482 72 134 52,610 15,411,745 2,879,153 2,556,289
2009 037 54 130 5 7 15,890 2,055,288 433,972 65,028
2009 039 103 231 53 89 32,437 7,474,240 1,324,608 767,147
2009 041 82 256 7 14 40,540 6,658,476 1,050,759 109,037
2009 043 135 246 31 40 34,444 5,968,025 1,075,920 208,292
2009 045 222 430 117 180 55,292 17,104,497 3,506,884 1,919,397
2009 047 156 336 31 35 33,266 6,282,713 1,397,202 88,082
2009 049 310 600 174 275 63,218 11,215,881 1,822,764 1,738,843
2009 051 84 180 20 23 17,619 3,450,696 759,630 160,905
2009 053 31 128 1 2 10,271 1,363,605 223,672 9,454
2009 055 333 1,133 73 112 113,493 20,404,760 2,764,566 359,639
2009 057 33 223 3 3 28,200 4,184,526 712,714 8,306
2009 059 75 211 5 5 20,456 3,186,964 699,380 31,670
2009 061 281 974 36 45 108,154 18,188,672 2,342,780 166,413
2009 063 162 433 90 144 43,255 8,248,023 1,678,322 1,373,034
2009 065 26 89 0 0 9,671 1,626,177 331,205 0
2009 067 196 540 87 179 59,410 15,203,450 2,852,165 3,610,657
2009 069 282 613 143 206 50,865 9,155,408 1,760,169 1,042,812

Use or disclosure of information or data Risk Management Agency
contained on this sheet is subject to the Contract No: 1406-N10PC18078 restrictions on the title page of this report.
B9
Crop
Year
County
FIPS
Policies
Earning
Premium
Units Earning
Premium
Policies
Indemnified
Units
Indemnified
Net
Insured
Acres
Liability Total
Premium Indemnity
Units Using PTY
2009 071 226 562 139 199 52,957 10,691,877 2,605,256 2,267,558
2009 073 121 219 79 99 27,053 8,546,987 1,648,754 1,215,857
2009 075 394 832 183 278 126,168 22,136,679 3,045,120 1,376,713
2009 077 112 198 35 42 22,637 7,930,036 1,336,604 602,538
2009 079 131 299 62 90 24,124 4,405,660 804,808 416,902
2009 081 151 284 102 136 31,236 10,667,851 2,129,992 2,084,723
2009 083 161 432 69 99 39,718 7,112,697 1,008,480 431,164
2009 085 10 38 2 2 7,613 1,157,388 269,688 2,004
2009 087 30 83 1 1 12,302 1,660,382 268,256 6,780
2009 089 46 143 5 5 15,232 2,383,905 432,821 15,291
2009 091 91 134 40 47 16,862 5,835,041 1,115,281 640,625
2009 093 527 1,138 296 413 146,159 34,895,950 6,487,780 4,529,039
2009 095 213 469 101 132 44,089 8,551,685 1,612,220 1,298,574
2009 097 124 181 43 55 28,741 9,594,880 1,703,964 1,866,171
2009 099 214 490 92 144 48,593 12,926,426 2,363,924 2,990,699
2009 101 613 1,522 225 347 162,920 30,142,837 4,397,723 2,771,126
2009 103 402 1,017 209 303 131,989 26,061,349 4,748,754 2,238,471
2009 105 92 338 11 20 45,794 6,811,895 949,551 163,514
Units Using T-yield
2007 001 281 689 74 126 78,240 6,607,529 1,462,386 812,802
2007 003 765 1,513 321 444 136,166 27,061,193 4,915,087 2,330,619
2007 005 999 2,291 384 629 177,735 24,043,786 4,918,102 3,057,485
2007 007 86 168 17 24 16,962 1,500,131 298,826 75,297
2007 009 1,046 2,236 125 194 217,232 24,473,955 3,932,056 800,459
2007 011 223 531 64 117 61,238 5,286,005 1,002,353 532,853
2007 013 727 1,600 160 241 143,735 13,937,284 2,463,843 856,373
2007 015 503 1,047 115 180 92,525 9,657,147 2,097,733 766,741
2007 017 805 1,460 384 567 175,859 43,780,172 6,484,601 7,403,739
2007 019 1,006 2,272 403 643 231,519 34,048,378 6,536,798 5,981,215
2007 021 451 911 238 356 87,193 18,665,043 3,573,097 3,099,764
2007 023 801 1,978 201 344 164,371 14,268,316 2,362,150 1,021,645
2007 025 316 699 112 187 68,614 6,248,700 1,104,876 787,951
2007 027 395 761 109 136 59,438 7,352,115 1,316,215 553,450
2007 029 674 1,376 94 128 115,590 14,177,016 3,693,664 591,959
2007 031 345 590 90 114 76,825 12,131,292 2,132,479 611,201
2007 033 203 507 38 56 48,726 4,154,913 894,515 163,606
2007 035 1,116 2,530 178 261 212,434 38,391,539 7,105,218 1,823,893
2007 037 463 992 107 165 77,631 5,910,407 1,403,577 733,181
2007 039 452 858 124 162 82,962 13,688,918 2,580,423 750,246
2007 041 420 956 62 108 115,296 12,810,726 2,361,868 599,398
2007 043 373 754 128 192 57,250 6,033,213 1,283,188 704,120
2007 045 553 1,116 296 448 104,223 23,258,447 4,237,042 3,681,315
2007 047 333 680 114 169 63,628 7,910,395 1,929,203 1,078,096
2007 049 870 1,732 203 318 129,809 13,958,211 2,120,493 951,475
2007 051 499 1,042 150 220 86,300 10,828,520 2,601,554 1,244,384
2007 053 427 1,530 155 434 122,582 10,087,543 1,767,719 1,460,241
2007 055 1,141 2,580 335 539 191,682 19,840,291 2,709,250 1,946,255
2007 057 262 634 86 142 53,999 4,859,396 804,774 481,036

Use or disclosure of information or data Risk Management Agency
contained on this sheet is subject to the Contract No: 1406-N10PC18078 restrictions on the title page of this report.
B10
Crop
Year
County
FIPS
Policies
Earning
Premium
Units Earning
Premium
Policies
Indemnified
Units
Indemnified
Net
Insured
Acres
Liability Total
Premium Indemnity
Units Using T-yield
2007 059 588 1,232 111 180 86,898 7,836,244 1,811,435 685,028
2007 061 936 2,450 259 441 214,346 19,930,667 3,061,898 1,489,909
2007 063 772 1,610 353 566 118,784 15,737,058 3,493,995 2,321,610
2007 065 248 603 54 100 41,832 4,329,723 774,085 414,263
2007 067 675 1,808 208 355 167,835 28,803,453 5,667,080 2,924,061
2007 069 715 1,440 262 406 94,484 11,167,026 2,048,028 1,626,317
2007 071 1,166 2,712 622 1,000 219,205 32,430,969 7,918,201 5,189,698
2007 073 386 739 212 307 55,656 11,850,783 1,820,053 2,077,400
2007 075 647 1,260 108 136 137,465 14,954,473 2,226,971 726,872
2007 077 683 1,216 348 507 99,335 26,489,682 3,824,876 3,639,984
2007 079 557 1,084 119 148 79,399 9,946,628 1,830,076 591,446
2007 081 380 641 212 284 46,523 10,477,558 1,694,604 2,057,033
2007 083 446 1,021 96 188 76,364 7,793,393 1,230,605 539,522
2007 085 89 182 17 26 20,055 1,564,949 386,882 76,876
2007 087 208 411 52 72 47,245 4,165,802 709,205 414,430
2007 089 383 926 52 81 79,895 7,856,706 1,378,030 282,792
2007 091 562 1,201 125 173 106,466 25,164,623 4,806,671 1,667,462
2007 093 893 1,989 343 543 188,053 32,544,281 5,659,007 2,838,912
2007 095 938 2,011 321 502 179,191 22,043,578 4,417,665 3,079,775
2007 097 587 1,240 92 109 117,747 29,919,364 4,822,431 898,284
2007 099 1,041 2,169 364 551 169,321 28,044,974 5,052,965 3,473,529
2007 101 1,385 2,758 364 562 246,411 26,977,791 3,790,718 2,445,568
2007 103 774 1,615 156 188 136,107 19,239,164 3,319,784 753,821
2007 105 1,024 3,109 225 421 272,491 23,051,183 3,896,072 1,601,855
2008 001 262 640 141 304 75,414 13,049,839 3,287,622 3,830,880
2008 003 592 1,187 316 562 115,125 36,447,692 6,585,385 4,558,349
2008 005 877 1,981 416 690 161,308 36,598,332 8,036,367 6,149,536
2008 007 98 170 94 164 19,441 3,479,316 806,132 2,883,007
2008 009 909 1,964 333 548 194,065 44,571,732 8,274,574 5,019,001
2008 011 206 504 139 328 57,141 9,582,047 2,117,843 3,464,663
2008 013 557 1,251 144 212 111,606 22,588,954 4,102,665 1,714,344
2008 015 513 1,122 205 367 101,606 20,444,051 4,436,786 3,786,439
2008 017 780 1,406 274 379 173,306 64,090,366 10,265,070 4,316,154
2008 019 914 2,022 348 528 204,240 58,534,617 12,145,337 6,177,831
2008 021 425 928 251 461 88,647 28,930,557 5,887,069 3,998,025
2008 023 761 1,888 280 530 161,538 29,622,243 5,370,851 2,827,855
2008 025 283 689 238 555 69,166 12,625,770 2,757,553 7,382,088
2008 027 329 604 128 195 50,664 10,576,528 2,094,328 1,526,974
2008 029 657 1,359 217 370 125,232 29,954,134 7,927,165 4,788,238
2008 031 247 442 90 132 60,888 15,436,031 2,872,980 1,483,800
2008 033 173 415 140 296 41,269 6,842,784 1,533,949 2,524,450
2008 035 1,072 2,387 328 520 203,732 59,366,053 11,148,428 4,582,005
2008 037 443 989 208 364 80,821 12,128,458 3,126,094 2,523,094
2008 039 395 799 206 383 76,975 20,072,996 4,039,770 2,989,599
2008 041 356 794 280 558 101,905 23,125,483 4,803,272 8,552,734
2008 043 367 748 190 325 61,657 12,073,003 2,882,608 2,925,839
2008 045 486 949 303 545 91,902 31,865,531 5,980,189 4,912,336
2008 047 336 679 167 334 60,052 13,812,668 3,328,935 3,805,603

Use or disclosure of information or data Risk Management Agency
contained on this sheet is subject to the Contract No: 1406-N10PC18078 restrictions on the title page of this report.
B11
Crop
Year
County
FIPS
Policies
Earning
Premium
Units Earning
Premium
Policies
Indemnified
Units
Indemnified
Net
Insured
Acres
Liability Total
Premium Indemnity
Units Using T-yield
2008 049 721 1,445 212 335 112,874 24,276,038 4,135,622 2,342,531
2008 051 457 990 216 409 90,233 21,629,487 5,382,306 4,259,039
2008 053 415 1,305 353 1,048 110,521 18,659,870 3,715,061 10,071,574
2008 055 1,007 2,238 520 1,045 185,655 39,728,823 6,178,738 10,508,211
2008 057 267 684 221 500 60,848 11,348,181 2,241,706 4,919,665
2008 059 603 1,202 323 591 85,932 14,933,633 3,725,427 5,563,633
2008 061 758 1,810 390 796 156,798 30,184,826 5,313,339 6,598,354
2008 063 682 1,473 363 698 102,903 24,501,558 5,783,286 4,736,151
2008 065 239 541 178 380 39,075 7,900,132 1,546,119 3,048,164
2008 067 595 1,600 188 371 149,190 43,840,684 8,507,770 4,761,582
2008 069 637 1,287 303 460 83,828 18,368,800 3,623,528 2,853,374
2008 071 1,015 2,414 568 1,053 195,787 46,512,277 11,440,393 9,551,631
2008 073 391 735 215 366 57,362 19,771,479 3,306,911 2,676,499
2008 075 524 1,006 107 170 109,766 24,599,305 4,030,083 1,776,583
2008 077 678 1,230 286 452 99,463 38,352,208 5,880,993 3,884,399
2008 079 558 1,092 195 318 85,515 21,048,089 4,233,449 2,784,198
2008 081 360 672 243 434 48,459 17,478,673 3,089,453 3,282,630
2008 083 403 902 159 258 71,558 13,806,350 2,399,623 1,276,284
2008 085 109 229 47 76 25,440 4,160,121 1,099,239 969,825
2008 087 189 374 167 333 46,084 8,681,229 1,728,963 5,302,301
2008 089 344 775 321 719 76,020 15,178,291 3,049,076 11,272,579
2008 091 510 1,012 189 361 89,857 30,453,706 5,895,357 3,868,156
2008 093 733 1,606 368 722 155,598 43,354,432 7,992,736 6,993,924
2008 095 833 1,737 209 292 154,071 37,448,427 7,928,663 2,730,344
2008 097 540 1,116 184 325 104,873 37,252,594 6,228,667 2,880,920
2008 099 957 2,007 333 476 161,277 45,700,560 8,809,355 4,442,672
2008 101 1,102 2,179 257 370 198,953 45,349,938 7,149,889 2,538,729
2008 103 608 1,246 202 300 109,442 24,887,911 4,891,196 2,434,596
2008 105 858 2,690 504 1,286 239,362 42,801,508 8,114,790 10,043,347
2009 001 245 508 41 54 70,691 7,507,534 1,764,590 475,933
2009 003 562 960 235 342 95,568 20,087,333 3,626,264 1,718,383
2009 005 855 1,630 479 676 148,143 23,446,520 5,425,172 4,871,052
2009 007 118 197 5 11 22,505 2,517,542 520,506 26,808
2009 009 931 1,711 327 430 181,576 28,762,385 4,843,015 1,488,224
2009 011 196 490 22 24 57,711 6,353,979 1,240,809 118,045
2009 013 560 1,093 71 88 102,643 15,050,663 2,185,740 376,999
2009 015 491 937 86 110 93,033 12,424,497 2,541,872 540,087
2009 017 686 1,090 119 139 153,961 39,433,445 6,775,395 1,755,178
2009 019 886 1,850 503 822 188,422 34,473,201 7,006,725 9,717,689
2009 021 421 836 181 260 82,627 19,443,102 4,485,001 2,222,273
2009 023 678 1,728 79 113 153,037 23,077,580 3,559,079 427,477
2009 025 309 635 12 19 67,991 8,077,922 1,609,339 158,823
2009 027 332 591 159 222 48,539 7,197,373 1,529,978 1,249,097
2009 029 678 1,081 86 97 137,461 22,590,403 5,609,284 429,875
2009 031 226 355 128 169 40,784 7,229,418 1,425,921 930,326
2009 033 158 366 15 17 40,232 5,347,603 1,059,807 98,215
2009 035 986 2,162 243 380 182,669 38,763,053 6,986,037 3,809,552
2009 037 417 792 23 32 76,326 7,962,950 1,838,430 117,986

Use or disclosure of information or data Risk Management Agency
contained on this sheet is subject to the Contract No: 1406-N10PC18078 restrictions on the title page of this report.
B12
Crop
Year
County
FIPS
Policies
Earning
Premium
Units Earning
Premium
Policies
Indemnified
Units
Indemnified
Net
Insured
Acres
Liability Total
Premium Indemnity
Units Using T-yield
2009 039 375 658 127 165 64,793 11,639,538 2,181,024 796,702
2009 041 359 702 6 6 102,013 14,434,923 2,686,370 23,877
2009 043 388 689 72 108 57,908 7,905,568 1,876,085 410,011
2009 045 478 790 195 264 81,982 19,742,123 4,045,649 1,886,543
2009 047 321 570 43 59 72,864 11,737,475 2,873,639 258,680
2009 049 811 1,443 361 461 113,897 15,593,651 2,539,747 1,917,094
2009 051 414 777 78 101 93,231 15,199,746 3,685,156 494,842
2009 053 387 1,012 60 99 97,680 12,053,737 2,052,045 578,936
2009 055 1,050 2,348 154 205 198,261 29,849,709 4,199,819 813,025
2009 057 288 688 23 46 65,737 8,259,399 1,422,754 227,220
2009 059 605 1,110 13 18 86,194 10,100,031 2,421,391 48,978
2009 061 669 1,576 63 73 147,660 20,847,703 3,051,282 445,029
2009 063 649 1,320 356 557 94,494 15,735,897 3,603,863 3,139,540
2009 065 228 447 13 17 37,517 5,053,553 952,547 50,418
2009 067 569 1,304 255 374 126,845 27,582,513 4,920,369 3,951,012
2009 069 684 1,259 292 400 85,718 13,121,267 2,554,287 1,615,605
2009 071 1,009 1,967 610 884 173,277 28,757,290 8,401,766 8,244,321
2009 073 368 612 197 248 54,821 13,126,636 2,198,573 1,785,679
2009 075 527 852 181 243 87,825 13,664,648 1,916,959 789,910
2009 077 690 1,130 238 297 104,035 28,852,626 4,582,096 2,869,478
2009 079 511 907 179 250 72,636 11,213,823 2,146,327 1,198,751
2009 081 347 562 171 223 42,439 10,770,847 2,075,478 1,732,582
2009 083 414 815 101 127 69,364 9,760,333 1,610,395 424,820
2009 085 88 181 10 10 25,203 2,576,132 647,334 182,094
2009 087 184 286 13 14 46,378 5,754,891 1,052,598 125,179
2009 089 417 714 8 11 78,765 9,562,792 1,815,012 42,561
2009 091 491 846 128 163 84,919 20,010,572 4,296,273 2,616,986
2009 093 681 1,248 273 364 141,597 26,948,264 4,719,559 2,293,912
2009 095 826 1,547 373 525 141,293 22,689,232 4,756,785 3,438,716
2009 097 503 832 97 140 91,047 23,634,211 4,326,651 3,348,811
2009 099 909 1,753 425 605 139,980 28,487,259 5,237,120 5,257,970
2009 101 1,101 1,988 334 456 182,347 28,070,599 3,789,048 2,602,171
2009 103 587 1,053 227 256 98,359 16,192,098 3,004,719 1,345,659
2009 105 782 2,363 70 125 233,142 32,536,865 5,388,234 731,752
Unclassified Units
2007 001 162 608 43 102 84,296 8,050,830 1,730,434 880,570
2007 003 728 2,357 366 707 270,875 51,794,306 8,095,857 4,469,565
2007 005 586 1,754 238 366 175,314 23,460,411 4,683,544 1,867,302
2007 007 47 115 18 37 12,031 1,050,616 213,882 108,532
2007 009 724 2,075 69 93 238,125 27,859,157 4,416,321 336,277
2007 011 167 620 46 83 78,345 7,366,775 1,374,975 511,104
2007 013 350 1,105 82 141 114,036 12,843,138 2,197,896 829,226
2007 015 306 850 77 120 91,487 10,562,537 1,898,284 586,076
2007 017 777 2,717 466 1,106 346,764 77,471,643 10,194,245 13,238,143
2007 019 845 3,217 422 940 351,975 53,406,298 10,136,369 10,209,839
2007 021 413 1,524 248 561 167,194 41,896,114 8,300,587 6,551,940
2007 023 393 1,450 113 223 140,442 14,613,236 2,351,642 686,388
2007 025 219 740 79 215 95,701 9,966,018 1,573,215 1,199,431

Use or disclosure of information or data Risk Management Agency
contained on this sheet is subject to the Contract No: 1406-N10PC18078 restrictions on the title page of this report.
B13
Crop
Year
County
FIPS
Policies
Earning
Premium
Units Earning
Premium
Policies
Indemnified
Units
Indemnified
Net
Insured
Acres
Liability Total
Premium Indemnity
Unclassified Units
2007 027 250 609 61 80 64,078 7,678,862 1,259,297 372,048
2007 029 514 1,288 68 110 127,986 15,275,014 3,392,611 449,423
2007 031 324 809 112 177 107,568 15,077,591 2,380,645 895,869
2007 033 90 261 21 35 29,783 3,092,020 637,245 115,185
2007 035 826 2,531 109 148 225,796 38,345,064 6,580,762 793,064
2007 037 322 1,013 91 191 102,327 9,174,088 2,064,794 1,041,427
2007 039 343 827 103 157 80,174 12,455,026 2,038,156 554,441
2007 041 268 1,378 51 88 194,693 24,398,666 4,043,092 479,691
2007 043 233 480 61 94 41,308 4,754,698 917,115 315,964
2007 045 605 1,888 369 816 212,891 47,907,412 8,614,594 7,519,730
2007 047 259 567 81 128 57,104 6,831,302 1,309,246 762,940
2007 049 527 1,392 128 200 129,991 15,545,693 2,358,087 732,710
2007 051 369 981 112 172 98,100 11,984,884 2,561,848 1,036,731
2007 053 252 1,025 97 300 100,962 9,757,692 1,610,312 1,310,890
2007 055 754 2,561 234 474 241,834 29,390,216 3,801,449 2,571,342
2007 057 133 353 33 60 39,019 4,405,226 688,933 453,560
2007 059 486 1,706 114 225 143,119 14,443,277 3,120,430 1,145,426
2007 061 437 1,420 125 233 139,537 15,352,751 2,404,696 836,335
2007 063 499 1,480 229 424 140,412 19,596,890 3,929,847 1,884,743
2007 065 150 497 46 94 44,099 5,426,101 907,362 414,975
2007 067 521 1,941 177 289 197,204 34,760,027 5,826,100 2,044,394
2007 069 604 1,620 252 416 130,051 15,717,491 2,709,816 1,703,386
2007 071 771 2,365 420 791 235,938 33,054,954 7,454,199 4,743,764
2007 073 368 1,103 210 402 115,213 26,097,005 3,841,593 3,996,614
2007 075 460 1,179 75 111 135,221 16,153,271 2,375,436 723,581
2007 077 710 2,683 477 1,106 273,668 71,470,638 9,861,114 6,794,970
2007 079 390 1,026 83 123 87,340 11,234,109 2,066,377 459,586
2007 081 457 1,822 328 912 161,288 37,687,390 5,831,185 6,279,724
2007 083 320 948 60 93 85,601 9,423,660 1,367,196 297,067
2007 085 65 198 17 39 22,301 2,193,305 494,345 240,490
2007 087 135 583 39 120 95,280 10,045,085 1,593,192 1,036,379
2007 089 293 1,184 46 87 128,190 14,149,875 2,407,474 404,914
2007 091 498 1,576 119 177 151,084 31,034,488 4,992,506 2,052,749
2007 093 813 2,630 418 869 309,841 54,816,042 8,884,438 6,826,662
2007 095 598 1,752 227 360 168,430 22,578,565 4,475,097 2,297,789
2007 097 532 1,766 112 161 184,720 44,463,849 6,830,150 1,106,466
2007 099 657 2,152 210 351 195,395 33,591,431 5,820,444 2,168,827
2007 101 881 2,656 261 481 267,716 33,344,004 4,860,430 2,502,396
2007 103 615 1,863 134 175 195,257 28,290,968 4,750,011 1,134,931
2007 105 455 1,843 91 154 197,068 20,503,291 3,402,703 570,222
2008 001 157 610 114 370 88,234 17,296,136 4,356,498 6,195,637
2008 003 653 2,211 373 1,099 261,169 86,174,436 14,452,419 11,095,023
2008 005 611 1,751 257 427 171,267 42,544,389 9,308,720 5,006,861
2008 007 49 113 49 113 12,679 2,322,193 557,624 2,008,908
2008 009 716 2,008 228 443 242,495 56,740,035 10,345,872 4,110,026
2008 011 160 633 120 469 84,824 17,070,124 3,753,191 6,924,363
2008 013 335 1,213 102 209 131,663 30,668,676 5,756,859 1,703,455
2008 015 325 943 131 262 97,572 22,269,359 4,488,481 2,023,889

Use or disclosure of information or data Risk Management Agency
contained on this sheet is subject to the Contract No: 1406-N10PC18078 restrictions on the title page of this report.
B14
Crop
Year
County
FIPS
Policies
Earning
Premium
Units Earning
Premium
Policies
Indemnified
Units
Indemnified
Net
Insured
Acres
Liability Total
Premium Indemnity
Unclassified Units
2008 017 762 2,684 310 918 345,087 128,319,977 19,747,701 8,786,253
2008 019 843 3,177 316 555 349,308 107,049,466 22,553,145 6,848,828
2008 021 439 1,586 299 864 187,222 72,096,845 14,794,737 10,154,455
2008 023 370 1,491 156 403 149,455 32,875,913 6,187,918 2,662,652
2008 025 205 702 186 648 96,663 20,820,632 4,072,174 15,201,670
2008 027 253 619 72 90 65,803 14,598,785 2,726,074 793,525
2008 029 525 1,325 157 314 139,964 33,800,222 8,089,084 3,072,411
2008 031 310 760 136 244 107,711 27,999,385 4,936,313 2,878,838
2008 033 87 274 73 200 36,978 8,696,501 1,944,820 3,256,199
2008 035 849 2,625 229 425 240,931 74,846,300 14,019,252 2,969,381
2008 037 320 1,059 168 436 107,174 19,683,752 4,874,458 4,654,931
2008 039 306 820 139 328 83,580 23,683,188 4,295,975 3,044,201
2008 041 274 1,346 237 1,072 195,805 51,613,446 10,030,473 21,664,677
2008 043 253 550 100 163 51,226 11,489,383 2,451,248 1,430,365
2008 045 611 1,998 392 1,164 227,371 83,300,595 15,472,779 13,382,691
2008 047 268 604 123 234 66,156 16,007,243 3,602,791 2,912,785
2008 049 582 1,590 173 277 149,899 35,906,012 6,249,122 2,211,594
2008 051 335 975 155 321 101,782 24,545,251 5,496,390 3,187,311
2008 053 253 1,112 224 951 113,313 23,318,079 4,659,157 14,200,652
2008 055 768 2,655 487 1,390 257,440 64,636,994 10,066,392 16,508,495
2008 057 132 351 109 265 36,772 8,073,069 1,530,491 4,141,032
2008 059 507 1,679 285 889 150,310 30,509,158 7,361,014 11,827,452
2008 061 491 1,587 292 838 168,438 38,443,557 7,129,228 8,531,462
2008 063 524 1,540 290 548 145,709 39,219,788 8,824,991 4,500,214
2008 065 149 519 109 373 48,311 11,977,550 2,315,648 4,125,053
2008 067 518 1,897 150 257 204,554 69,350,206 12,259,202 4,620,686
2008 069 552 1,528 235 405 124,137 29,979,645 5,608,553 2,757,375
2008 071 788 2,401 419 772 239,894 61,645,393 15,124,162 7,881,176
2008 073 397 1,139 225 537 126,438 48,635,823 8,018,548 4,488,350
2008 075 481 1,246 94 142 160,322 38,792,828 6,632,969 1,323,040
2008 077 691 2,633 335 786 272,496 109,270,416 16,490,895 8,015,353
2008 079 382 1,043 138 234 96,281 24,477,308 4,950,523 1,803,812
2008 081 454 1,775 342 1,146 162,400 61,728,484 10,493,433 9,795,519
2008 083 330 958 129 209 90,355 20,662,219 3,493,877 1,658,406
2008 085 52 169 20 35 20,551 4,079,471 978,852 381,061
2008 087 118 526 109 492 91,607 20,856,250 3,845,743 13,508,555
2008 089 288 1,253 270 1,205 144,924 34,503,866 6,852,327 25,530,701
2008 091 481 1,557 205 521 160,876 53,790,510 9,571,534 5,202,693
2008 093 801 2,761 459 1,344 334,176 105,887,211 19,143,636 17,472,665
2008 095 605 1,791 130 189 182,357 49,915,275 10,714,648 2,205,796
2008 097 547 1,746 208 494 181,927 67,284,278 10,830,969 4,316,248
2008 099 636 2,174 162 260 199,578 66,411,262 12,450,523 2,464,000
2008 101 878 2,801 267 462 291,144 78,091,284 13,477,929 3,491,395
2008 103 609 1,842 187 292 210,497 56,330,163 10,601,172 3,488,741
2008 105 451 1,868 323 1,053 236,126 50,721,727 10,126,865 11,799,268
2009 001 160 548 36 81 88,754 10,236,399 2,194,179 1,196,747
2009 003 680 1,926 368 600 293,697 67,889,063 11,734,585 4,776,023
2009 005 626 1,501 350 565 172,984 28,785,776 6,150,525 4,706,386

Use or disclosure of information or data Risk Management Agency
contained on this sheet is subject to the Contract No: 1406-N10PC18078 restrictions on the title page of this report.
B15
Crop
Year
County
FIPS
Policies
Earning
Premium
Units Earning
Premium
Policies
Indemnified
Units
Indemnified
Net
Insured
Acres
Liability Total
Premium Indemnity
Unclassified Units
2009 007 56 102 0 0 14,050 1,502,035 344,522 0
2009 009 724 1,659 290 433 261,510 40,194,165 6,027,614 1,818,645
2009 011 153 504 20 27 78,996 9,754,754 1,872,738 160,682
2009 013 350 1,095 62 88 131,240 20,579,620 2,994,161 362,307
2009 015 327 871 49 65 104,781 15,152,135 2,795,620 342,792
2009 017 715 2,287 163 232 370,006 93,594,907 14,844,133 3,856,772
2009 019 803 3,016 472 1,101 356,067 68,527,721 13,709,860 13,394,451
2009 021 440 1,211 253 423 185,610 51,740,829 11,382,977 10,159,978
2009 023 362 1,412 37 56 148,759 22,883,574 3,321,301 247,451
2009 025 212 638 8 9 102,930 12,919,431 2,306,297 99,560
2009 027 270 643 123 209 66,863 10,585,944 1,992,301 1,096,959
2009 029 559 1,039 75 90 157,835 24,232,467 5,319,481 407,654
2009 031 337 780 193 339 116,372 20,744,197 3,420,077 2,144,429
2009 033 85 247 8 11 32,740 4,386,954 955,480 36,697
2009 035 836 2,484 218 328 254,589 55,735,678 9,152,634 3,220,572
2009 037 307 907 14 19 109,070 11,921,619 2,732,711 55,978
2009 039 325 712 117 161 92,473 17,807,417 2,847,297 766,497
2009 041 281 1,231 9 15 184,493 28,373,943 4,541,359 79,057
2009 043 261 472 55 64 53,010 8,111,430 1,588,704 273,670
2009 045 616 1,700 333 545 222,214 55,797,225 10,845,129 5,541,918
2009 047 279 534 40 47 64,411 9,859,008 2,097,709 233,934
2009 049 613 1,373 322 494 153,940 23,643,011 3,741,402 2,518,057
2009 051 324 822 65 100 106,128 17,115,842 3,634,951 428,159
2009 053 245 940 32 52 123,226 15,641,523 2,716,315 164,330
2009 055 775 2,685 126 166 280,070 45,178,309 5,851,704 466,694
2009 057 148 355 12 14 39,563 5,220,795 908,640 131,109
2009 059 511 1,545 10 13 150,345 18,544,592 4,166,649 75,738
2009 061 454 1,433 51 62 166,980 25,548,658 3,628,196 207,365
2009 063 495 1,513 257 501 156,303 27,331,932 5,240,951 2,610,396
2009 065 153 400 13 13 45,322 6,407,377 1,103,244 26,520
2009 067 530 1,937 254 479 212,334 48,921,759 7,197,852 4,684,318
2009 069 614 1,481 303 473 134,310 20,872,517 3,817,387 2,078,443
2009 071 767 2,001 482 826 243,387 42,979,460 11,044,616 10,377,527
2009 073 392 938 244 350 123,461 32,447,688 5,397,685 4,324,634
2009 075 500 1,077 201 305 167,201 26,752,191 3,650,538 1,149,393
2009 077 734 2,224 336 553 290,105 83,478,661 12,827,551 6,662,248
2009 079 380 960 139 200 95,063 16,156,383 3,024,380 829,053
2009 081 459 1,449 291 586 167,644 45,241,754 8,357,515 5,515,339
2009 083 337 944 122 171 96,376 14,539,303 2,083,040 718,605
2009 085 47 162 5 6 19,927 2,669,101 679,861 25,992
2009 087 120 475 4 5 92,849 12,374,173 2,034,105 13,040
2009 089 297 935 12 20 151,096 20,821,190 3,732,090 67,624
2009 091 458 1,422 149 221 169,479 40,244,934 7,285,363 2,127,440
2009 093 841 2,354 437 701 358,530 75,246,463 12,755,263 5,957,561
2009 095 566 1,734 266 496 183,374 31,963,345 6,006,359 2,942,490
2009 097 533 1,390 113 157 182,632 48,291,023 7,911,400 4,953,367
2009 099 706 2,104 312 513 211,001 47,759,599 7,343,847 4,268,223
2009 101 940 2,744 364 573 311,735 51,775,499 7,217,892 3,689,513
2009 103 620 1,592 272 389 221,866 41,138,857 6,620,229 2,234,591
2009 105 433 1,761 27 48 238,282 34,086,353 5,459,282 293,590

Use or disclosure of information or data Risk Management Agency
contained on this sheet is subject to the Contract No: 1406-N10PC18078 restrictions on the title page of this report.
B16
Crop
Year
County
FIPS
Policies
Earning
Premium
Units Earning
Premium
Policies
Indemnified
Units
Indemnified
Net
Insured
Acres
Liability Total
Premium Indemnity
All Actuals
2007 001 117 341 42 95 32,798 2,967,649 633,653 281,993
2007 003 714 1,722 360 583 150,009 24,813,352 3,491,939 2,930,004
2007 005 270 630 110 165 49,927 6,176,178 1,356,745 570,383
2007 007 42 79 12 24 7,705 714,251 128,655 53,894
2007 009 553 1,041 50 61 79,014 8,852,832 1,401,712 152,351
2007 011 93 180 30 48 14,522 1,313,942 236,126 167,787
2007 013 275 554 60 90 36,456 3,785,063 662,794 245,623
2007 015 163 321 28 45 27,503 2,532,838 512,303 141,579
2007 017 965 2,480 495 906 288,141 57,151,528 6,779,658 8,995,149
2007 019 542 1,604 252 437 165,442 23,283,617 4,542,173 3,270,303
2007 021 359 750 239 373 82,334 20,107,213 3,864,073 4,111,768
2007 023 397 1,078 95 165 74,978 7,438,390 1,092,803 389,736
2007 025 170 419 67 132 41,851 3,758,935 610,256 422,005
2007 027 131 241 22 30 20,706 2,524,823 465,467 149,573
2007 029 336 721 48 69 63,618 6,964,325 1,413,309 178,271
2007 031 204 435 67 103 44,568 5,673,777 929,185 386,025
2007 033 75 176 19 32 16,631 1,622,781 317,752 104,363
2007 035 449 1,113 50 62 85,092 14,041,606 2,351,692 245,220
2007 037 232 483 60 103 42,432 3,489,640 785,039 379,736
2007 039 291 596 93 124 47,349 7,039,713 1,190,919 384,832
2007 041 162 471 25 32 56,891 6,762,360 1,033,622 100,142
2007 043 151 279 51 77 22,645 2,548,210 492,545 188,417
2007 045 545 1,276 330 530 115,650 24,475,906 4,214,560 3,479,818
2007 047 139 234 54 72 20,732 2,232,438 448,205 201,143
2007 049 489 988 101 153 62,956 6,796,767 1,048,457 358,443
2007 051 138 273 39 56 23,465 2,374,562 452,919 205,570
2007 053 123 299 48 100 21,225 2,117,384 330,764 268,640
2007 055 582 1,380 132 226 107,081 11,948,442 1,499,435 802,487
2007 057 87 201 27 58 12,935 1,232,924 193,880 132,128
2007 059 260 612 36 50 52,238 4,919,198 1,045,122 151,088
2007 061 364 730 61 98 55,368 5,724,581 883,401 279,395
2007 063 256 557 97 149 44,516 6,194,948 1,233,559 631,873
2007 065 90 225 27 56 20,715 2,319,487 422,861 294,066
2007 067 230 547 63 76 49,227 8,270,339 1,321,587 332,003
2007 069 345 746 118 190 49,593 5,625,264 950,159 545,442
2007 071 349 795 176 267 81,311 10,632,334 2,462,247 1,285,090
2007 073 400 827 249 369 80,303 19,011,378 2,953,073 3,054,385
2007 075 285 531 30 48 43,713 4,831,650 666,650 187,056
2007 077 860 2,371 529 1,004 220,366 50,628,558 6,320,083 5,245,189
2007 079 259 545 58 89 38,171 4,388,342 858,411 318,219
2007 081 497 1,171 367 617 104,650 22,286,089 3,461,950 4,728,177
2007 083 197 368 34 57 27,134 2,880,479 431,863 139,486
2007 085 51 108 13 21 11,706 823,331 232,098 84,869
2007 087 123 292 36 63 30,111 2,818,832 452,768 264,790
2007 089 229 577 38 76 63,511 6,172,862 1,085,191 237,894
2007 091 471 1,059 84 137 75,993 14,354,717 2,107,120 1,135,557
2007 093 483 990 210 313 91,616 14,084,037 2,345,985 1,814,518
Use or disclosure of information or data Risk Management Agency
contained on this sheet is subject to the Contract No: 1406-N10PC18078 restrictions on the title page of this report.
B17
Crop
Year
County
FIPS
Policies
Earning
Premium
Units Earning
Premium
Policies
Indemnified
Units
Indemnified
Net
Insured
Acres
Liability Total
Premium Indemnity
All Actuals
2007 095 406 1,046 143 228 92,804 11,473,790 2,375,208 1,606,475
2007 097 485 1,158 74 122 113,511 23,621,694 3,258,278 626,873
2007 099 291 738 85 134 57,503 8,889,615 1,634,131 638,811
2007 101 617 1,254 125 193 94,399 10,590,005 1,537,538 570,420
2007 103 353 856 70 111 79,090 10,533,469 1,864,767 342,599
2007 105 403 1,108 71 125 85,179 8,845,605 1,296,879 351,719
2008 001 103 326 68 168 38,453 7,422,565 1,770,794 2,217,268
2008 003 705 1,733 327 759 161,123 50,988,592 8,130,663 5,707,165
2008 005 269 636 105 163 54,071 13,230,350 3,030,606 1,225,865
2008 007 44 87 44 85 9,129 1,674,262 390,621 1,391,041
2008 009 533 1,038 143 233 85,841 19,529,873 3,436,942 1,381,920
2008 011 92 176 62 103 15,472 2,723,193 600,641 877,383
2008 013 284 579 57 92 41,964 9,153,393 1,652,003 377,988
2008 015 163 316 41 64 29,862 5,872,291 1,273,267 822,298
2008 017 998 2,472 420 923 293,074 99,046,116 13,929,602 8,205,317
2008 019 518 1,542 163 276 170,024 49,865,757 10,748,016 2,500,007
2008 021 347 716 220 393 74,816 28,766,633 5,684,738 4,140,241
2008 023 367 1,001 130 246 78,916 16,878,731 2,817,963 932,124
2008 025 154 419 143 394 47,068 9,128,835 1,787,223 6,399,919
2008 027 124 249 22 35 19,243 4,379,868 864,174 278,419
2008 029 323 684 115 222 66,394 15,415,224 3,579,501 2,323,596
2008 031 203 414 71 105 43,263 11,000,669 2,064,725 925,718
2008 033 62 142 44 75 13,638 2,730,136 588,014 887,362
2008 035 430 1,095 100 158 82,337 25,101,484 4,654,173 1,073,486
2008 037 242 478 132 213 43,653 7,507,706 1,906,941 1,690,230
2008 039 257 551 89 160 40,403 11,600,291 2,169,273 961,536
2008 041 165 493 143 412 66,026 17,014,000 3,082,184 7,795,579
2008 043 137 236 53 69 20,170 4,520,582 914,737 360,781
2008 045 501 1,245 298 687 119,798 42,726,559 7,686,630 7,083,520
2008 047 135 233 53 70 21,668 5,096,744 1,134,299 973,105
2008 049 469 951 78 110 65,368 14,938,966 2,680,818 950,193
2008 051 140 270 42 61 22,636 4,879,983 1,019,755 469,047
2008 053 137 340 103 242 26,779 5,794,310 1,029,882 2,758,649
2008 055 555 1,336 273 622 108,290 26,053,709 3,780,626 6,008,384
2008 057 76 155 60 114 12,692 2,784,823 510,598 1,459,529
2008 059 261 669 129 302 56,201 10,726,364 2,581,679 3,500,680
2008 061 324 713 192 373 57,850 12,680,183 2,217,520 2,630,361
2008 063 247 554 82 120 47,070 12,586,883 2,771,199 601,998
2008 065 92 216 71 151 22,112 4,870,718 1,057,206 1,815,115
2008 067 225 642 45 58 56,739 18,942,071 3,384,132 814,084
2008 069 334 756 107 170 52,941 12,578,881 2,369,984 887,579
2008 071 343 788 151 240 79,888 18,783,370 4,823,809 2,406,902
2008 073 384 809 198 344 77,702 29,202,906 4,844,855 2,401,502
2008 075 303 587 37 48 57,716 13,420,424 2,178,531 311,062
2008 077 877 2,606 429 946 236,863 87,169,253 12,144,770 7,561,141
2008 079 280 577 53 78 41,461 10,230,098 2,063,768 475,566
2008 081 490 1,245 343 799 111,692 39,728,205 6,616,033 6,532,181
2008 083 185 360 48 68 26,543 6,019,080 1,068,203 361,391

Use or disclosure of information or data Risk Management Agency
contained on this sheet is subject to the Contract No: 1406-N10PC18078 restrictions on the title page of this report.
B18
Crop
Year
County
FIPS
Policies
Earning
Premium
Units Earning
Premium
Policies
Indemnified
Units
Indemnified
Net
Insured
Acres
Liability Total
Premium Indemnity
All Actuals
2008 085 56 128 18 32 12,320 2,140,061 543,824 395,790
2008 087 124 275 111 245 31,983 6,754,573 1,163,797 4,222,969
2008 089 214 563 211 547 64,280 13,490,803 2,831,153 10,023,507
2008 091 474 1,131 166 319 83,967 27,142,814 4,483,188 2,260,885
2008 093 451 968 177 322 95,106 27,805,019 5,101,349 3,617,506
2008 095 390 966 69 92 91,164 23,714,097 5,217,129 1,020,101
2008 097 499 1,214 200 374 125,091 43,614,282 6,645,784 2,872,857
2008 099 294 768 62 74 61,815 19,709,062 4,001,563 565,505
2008 101 632 1,311 115 196 107,976 26,246,972 4,324,959 773,985
2008 103 323 790 71 122 74,840 19,032,570 3,828,044 941,578
2008 105 386 1,105 240 512 94,642 20,810,908 3,615,842 3,746,477
2009 001 99 286 24 38 37,310 3,904,327 896,471 433,895
2009 003 729 1,609 352 524 171,380 34,776,544 5,409,284 2,212,488
2009 005 266 545 172 248 55,821 8,563,483 1,830,690 1,149,974
2009 007 38 61 0 0 7,983 830,721 203,622 0
2009 009 524 885 143 169 87,440 13,141,485 2,002,458 430,768
2009 011 83 135 5 6 16,088 1,892,377 353,020 8,389
2009 013 255 483 24 29 39,999 6,392,936 912,793 138,328
2009 015 164 290 26 28 30,987 4,189,615 759,530 87,116
2009 017 888 2,017 184 231 288,459 66,272,902 9,614,135 2,260,376
2009 019 473 1,277 266 496 158,943 28,219,099 5,706,012 5,114,126
2009 021 356 589 214 272 86,519 23,053,835 4,921,877 4,652,245
2009 023 367 1,023 35 48 83,200 13,506,726 1,864,765 121,538
2009 025 147 337 12 14 46,523 5,037,846 960,807 95,283
2009 027 124 216 64 85 16,844 2,664,977 579,279 366,039
2009 029 264 421 20 22 51,902 7,558,494 1,591,241 111,199
2009 031 212 387 107 141 44,828 7,128,983 1,177,592 675,694
2009 033 50 141 5 7 18,228 3,010,682 568,154 67,316
2009 035 424 1,031 95 114 85,804 17,406,484 2,724,300 728,123
2009 037 212 380 17 23 40,344 4,007,891 991,882 74,460
2009 039 285 556 90 124 47,872 8,766,817 1,549,672 394,444
2009 041 168 525 7 8 73,807 10,896,203 1,727,981 20,289
2009 043 136 223 30 34 22,122 3,354,807 650,429 149,751
2009 045 550 1,146 293 420 130,535 31,314,918 5,669,676 3,020,737
2009 047 128 181 17 19 18,918 2,964,867 634,559 90,532
2009 049 474 854 191 240 62,760 8,915,310 1,466,180 879,372
2009 051 149 278 22 24 26,635 3,827,806 766,147 107,989
2009 053 123 291 13 26 24,360 3,675,473 575,729 61,019
2009 055 487 1,064 72 95 90,494 14,961,984 1,882,259 331,603
2009 057 66 119 4 4 9,642 1,332,550 226,254 5,283
2009 059 254 531 7 7 50,752 5,854,590 1,300,740 19,071
2009 061 317 649 28 34 54,528 8,546,748 1,114,049 64,249
2009 063 263 514 111 162 42,855 7,549,264 1,454,520 586,903
2009 065 106 211 6 7 24,507 3,313,950 616,722 35,452
2009 067 215 557 93 157 54,381 11,995,063 1,677,782 1,312,597
2009 069 327 685 159 224 49,910 7,315,244 1,348,699 644,497
2009 071 335 684 187 263 80,394 12,419,187 3,134,024 3,092,154
2009 073 399 700 227 296 82,688 21,497,590 3,889,166 4,573,175
Use or disclosure of information or data Risk Management Agency
contained on this sheet is subject to the Contract No: 1406-N10PC18078 restrictions on the title page of this report.
B19
Crop
Year
County
FIPS
Policies
Earning
Premium
Units Earning
Premium
Policies
Indemnified
Units
Indemnified
Net
Insured
Acres
Liability Total
Premium Indemnity
All Actuals
2009 075 311 520 105 128 58,009 9,566,573 1,199,052 322,695
2009 077 845 2,075 301 404 225,441 56,921,386 7,681,094 3,028,775
2009 079 252 489 78 122 40,148 6,320,436 1,258,961 784,721
2009 081 504 1,092 285 392 114,724 27,849,994 4,974,656 3,740,977
2009 083 178 320 53 65 25,215 3,546,003 573,323 310,577
2009 085 55 102 9 14 11,608 1,111,175 289,430 42,293
2009 087 120 244 1 1 36,479 4,622,391 767,662 11,135
2009 089 216 502 3 3 67,290 8,138,205 1,665,124 18,135
2009 091 480 984 129 173 82,874 18,078,956 3,007,630 875,356
2009 093 487 907 212 267 102,687 19,498,909 3,149,962 1,390,162
2009 095 377 852 157 228 88,305 14,468,633 2,831,182 1,007,632
2009 097 459 931 77 95 128,737 31,456,439 4,845,546 2,859,783
2009 099 284 676 116 164 59,479 12,510,638 1,908,842 788,459
2009 101 649 1,239 165 219 118,537 19,747,357 2,472,167 711,771
2009 103 318 657 134 173 76,592 13,601,882 2,320,826 899,148
2009 105 381 1,105 24 41 114,152 19,608,505 2,754,288 370,421