evaluation of the great kererū ount and/media/about-wellington/research-and... · evaluation of...
TRANSCRIPT
Evaluation of the Great Kererū Count 2014 and
Recommendations for Future Citizen Science Projects
Photo: Tony Stoddard 2014/Kererū Discovery
Anni Brumby, Stephen Hartley & Rhian Salmon
Victoria University of Wellington
February 2015

2
CONTENTS EXECUTIVE SUMMARY ....................................................................................................................................................... 3
1. INTRODUCTION .............................................................................................................................................................. 5
2. PRINCIPLES OF CITIZEN SCIENCE .................................................................................................................................... 6
3. THE GREAT KERERŪ COUNT 2014 .................................................................................................................................. 8
3.1 Background ............................................................................................................................................................... 8
3.2 Why kererū? ............................................................................................................................................................. 9
3.3 Data collection ........................................................................................................................................................ 10
3.4 Data analysis and methods .................................................................................................................................... 10
4. PRELIMINARY RESULTS OF THE GKC 2014 ................................................................................................................... 12
4.1 Participant and report characteristics .................................................................................................................... 12
4.2 Observation categories .......................................................................................................................................... 14
4.3 Nationwide kererū report distribution ................................................................................................................... 17
4.4 Kererū reports in the Wellington City .................................................................................................................... 20
5. SURVEY METHOD ......................................................................................................................................................... 23
6. SURVEY RESULTS .......................................................................................................................................................... 23
6.1 Participant and report characteristics .................................................................................................................... 23
6.2 Promotion............................................................................................................................................................... 25
6.3 Participant experiences of the Great Kererū Count ............................................................................................... 25
6.4 Public awareness and engagement ........................................................................................................................ 33
6.5 Future projects ....................................................................................................................................................... 35
7. DISCUSSION AND EVALUATION OF THE GREAT KERERŪ COUNT 2014 ...................................................................... 36
7.1 Promotion and communications ............................................................................................................................ 36
7.2 Duration and timing of the count ........................................................................................................................... 37
7.3 Participant characteristics ...................................................................................................................................... 38
7.4 Participant Experiences and Outcomes for Individual GKC Participants ................................................................ 39
7.5 Data quality and the User Interface ....................................................................................................................... 41
7.6 Analysis of preliminary results of the GKC 2014 .................................................................................................... 45
8. RECOMMENDATIONS FOR FUTURE KERERŪ COUNTS ................................................................................................ 48
9. CONCLUSION ................................................................................................................................................................ 50
References ........................................................................................................................................................................ 52
APPENDIX A ...................................................................................................................................................................... 54
Map of eBird Kererū reports ........................................................................................................................................ 54
APPENDIX B ...................................................................................................................................................................... 55
Kererū presence reports and number of kererū sightings in Wellington City.............................................................. 55
APPENDIX C ...................................................................................................................................................................... 56
Copy of the information sheet and survey questions .................................................................................................. 56
APPENDIX D ...................................................................................................................................................................... 62
A list of useful citizen science websites, reports and special issues ............................................................................. 62

3
EXECUTIVE SUMMARY The Great Kererū Count (the GKC) is an annual citizen science project organised by Kererū Discovery Project
(a partnership between WWF New Zealand and Wellington City Council) and Forest & Bird’s Kiwi
Conservation Club (KCC). The GKC 2014 took place nationwide from 22 September to 5 October 2014.
During the duration of the count, 14 days in total, people were encouraged to report presence or absence
of kererū and other details about the sighting. There are many potential benefits of organising a citizen
science project focused on kererū, including increased public awareness of the threats to kererū, its
significance in New Zealand ecosystems, what actions can be taken to help kererū, and the potential to gain
early warning of population decline.
The main purpose of this report was to create recommendations for future GKCs and other citizen science
projects. This was done by evaluating the GKC 2014 from a citizen science perspective, by addressing the
following questions:
1. Is the GKC data that was gathered useful for scientific purposes?
2. Did the GKC participants feel engaged with the project? For example, did the participants gain new
knowledge or did participating in the project change their behaviour?
Thundermaps website and mobile app were used for kererū data collection. The GKC 2014 dataset was
manually cleaned, and then analysed using ArcGIS 10.2.2 for spatial analysis and Excel for data summaries.
Some of the main findings were:
7,029 reports made, and 14,086 kererū observed.
6,662 reports were kererū presence reports and 367 reports were kererū absence reports.
50.45% of the GKC participants were 18 years or older, 44.13% did not disclose their age.
The most popular food source associated with kererū was kōwhai, followed by plum and pūriri.
The kererū report numbers are not proportional to household numbers. Some areas, for example
Wellington, have a higher number of reports submitted per household than others. It is unclear
whether this is due to the region having more kererū, and/or the GKC 2014 having more publicity in
the region, and/or because more people from the area were actively looking for kererū in order to
participate.
In Wellington City, most of the kererū presence reports were made in either built-up areas, or
native forest remnants, and nearly all kererū presence reports were made within 500 metres of
parks, reserves and pest controlled areas.
The kererū presence-absence dataset was affected by high occurrence of duplicate reports, incorrect report
locations and report times, several incomplete reports and the inability to verify them due to the
anonymous reporting option.
A GKC 2014 participant survey was initiated as a part of the summer scholarship project. The survey was
voluntary and anonymous, and it was developed using Qualtrics software. The survey was open from 16
December 2014 until 5 January 2015. The total number of respondents to the survey was 241. According to
the survey results the survey respondents learned more about kererū, its ecological importance, and how
kererū can be helped; many respondents are taking action to help kererū thrive; and most respondents had
either very good or good experience of the GKC, and they would participate again, not only in the GKC but
also in other citizen science projects. A large proportion of survey respondents (24.75%) indicated that
contributing to scientific research was the main reason for them participating in the GKC 2014, and they
considered it very important that the data gathered will be used scientifically. The majority of the problems

4 that respondents encountered while participating in the GKC were related to user interface of the GKC
website/mobile app. It should be noted, that the GKC survey respondents were a self-selected group, and
therefore may not be a fully representative sample of the GKC 2014 participants.
Based on the evaluation of the GKC 2014, recommendations for future GKCs were created. The main
recommendations are:
1. A specific research question or hypothesis should be identified prior to designing and delivering the
GKC.
2. The methods of data gathering should be designed and developed based on the research question
or the hypothesis, to ensure that the process and results match the purpose of the project.
3. It should be clear in advance who will use the data, how it will be analysed and how results will be
communicated back to the citizen scientists.
4. Data gathering methods should be piloted before going live.
5. Communications between GKC partners must be clear and well documented.
6. For data validation purposes, anonymous reporting is not desirable.
7. Instructions for submitting the reports should be more detailed.
8. Participant surveys should be carried out before and after the GKC.
There is a lot of potential in a nationwide kererū presence- absence dataset, for example the data gathered
could benefit local councils by providing information on kererū distribution and numbers, suitable habitats,
and by providing evidence of effective pest control efforts. Meaningful analysis must take into account the
distribution of the human population of observers and how this influences the perception of kererū
distribution. However, this potential cannot be fully utilised until a specific research question is identified,
and the data gathering process is designed to match the purpose of the study.

5
1. INTRODUCTION What do the following, seemingly very different, projects have in common?
Real-time tracking of invasive species, with the aim to create a national network of invasive species
distribution data that is shared with educators, land managers, conservation biologists, and beyond
(EDDMapS – Early Detection and Distribution Mappings System, http://www.eddmaps.org/)
Volunteers sharing North America’s bumble bee observations online in order to help researchers
determine the status and conservation needs of bumble bees, and to help locate rare or endangered
populations (Bumble Bee Watch, http://bumblebeewatch.org/).
Volunteers reporting on plant phenophases (leafing, flowering, and fruiting of plants), so that
scientists can learn more about the responsiveness of individual plant species to changes in climate
locally, regionally, and nationally (Project BudBurst, http://budburst.org/home).
They all involve citizen science, one of the fields of Public Participation in Scientific Research (PPSR). Shirk et
al. (2012) define PPSR “as intentional collaborations in which members of the public engage in the process
of research to generate new science-based knowledge”.
The Great Kererū Count (hereafter referred to as the GKC) is an annual citizen science project organised by
Kererū Discovery Project (a partnership between WWF New Zealand and Wellington City Council) and
Forest & Bird’s Kiwi Conservation Club. The aim of this report is to create recommendations for future GKCs
and other citizen science projects. This report is produced as part of a summer scholarship project, funded
by the Wellington City Council (WCC) and Victoria University of Wellington. The two main questions that
WCC are interested in are:
1. What can be learned from the GKC 2014?
2. How can citizen science be used in Wellington?
In order to be able to answer these questions, this reports aims to evaluate the GKC from a citizen science
perspective, by addressing the following questions:
1. Is the GKC data that was gathered useful for scientific purposes?
2. Did the GKC participants feel engaged with the project? For example, did the participants gain new
knowledge or did participating in the project change their behaviour?
This report consists of four components:
1. A short literature review of citizen science.
2. The Great Kererū Count 2014:
a. Preliminary results of the count.
b. The results of the participant survey.
c. Discussion and Evaluation of the GKC 2014.
3. Recommendations for future GKCs.
4. Conclusion.

6
2. PRINCIPLES OF CITIZEN SCIENCE One of the pioneers in the field of citizen science and PPSR in ecological and conservation studies is the
Cornell Lab of Ornithology (CLO), a unit of Cornell University and a non-profit environmental organisation.
On their citizen science website (Cornell Lab of Ornithology, 2014) they describe the terms of PPSR and
citizen science as follows: “The growing field of PPSR includes citizen science, volunteer monitoring, and
other forms of organized research in which members of the public engage in the process of scientific
investigations: asking questions, collecting data, and/or interpreting results”. Projects involving PPSR may
be driven by different goals, such as education or management of social-ecological systems, but what
defines PPSR projects is the aim to contribute to scientific research and/or monitoring (Shirk et al., 2012).
In the recent years volunteer participation has become one of the pillars of ecological studies concerning
conservation of biodiversity (Dickinson et al., 2010). It is likely that the number of citizen science projects
has increased in recent years not only because of the wide availability new technologies, such as mobile
applications (apps), wireless sensor networks, and online computer/video gaming (Newman et al., 2012),
but also because the scientific community has recognised the potential of citizen science to gather data on
a large geographic scale and over a long time period for minimal cost (Cohn, 2008). Mass data collection,
and the potential gains it can offer to scientists, only represents one side of citizen science. Citizen science
can also provide an efficient way to engage the public with science. For example, participating in a citizen
science project may encourage participants to engage in scientific thinking processes (Trumbull et al.,
2000), improve scientific literacy of the participants (Cronje et al., 2011), and increase the participants’
knowledge or change their behaviour (Evans et al., 2005). This report uses the term participant for a
volunteer citizen scientist, and the term citizen science is used throughout the report to describe a project
that involves mass data collection by volunteer participants.
Many of the principles behind planning and organising a citizen science project are general to all of science,
for example, the methods of data collection must be well designed and standardised and the data collected
by the public must be validated (Silvertown, 2009). Shirk et al. (2012) have created a framework (Fig. 1) that
considers how public and scientific interests can be negotiated in order to create a successful citizen
science project, i.e. to enhance the outcomes for individuals, science and social-ecological systems. A link to
a more detailed version of the framework can be found in Appendix E. CLO has used the data collected by
volunteer citizen scientists in a variety of projects over the past two decades, and during this time CLO has
developed a model (Fig. 2) for building and operating citizen science projects (Bonney et al., 2009).
Figure 1. Framework for public participation in scientific research projects (Shirk et al., 2012).

7
The scope of past and existing citizen science projects varies enormously, ranging from projects such as
volunteers classifying images of galaxies (Galaxy Zoo, http://www.galaxyzoo.org/#/) to citizens scientists
searching through old ships’ log books for weather observations (Weather Detective,
http://www.weatherdetective.net.au/). Many of the citizen science initiatives are conservation and
environment related. A book dedicated to environmental citizen science (edited by Janis L. Dickinson and
Rick Bonney, 2012) and a recent report made for the European Union (University of the West of England,
2013) provide overviews of environmental citizen science. A special issue of the journal Frontiers in Ecology
and the Environment featuring citizen science was published in 2102 and another special issue on the topic
will be published in 2015 in The Journal of Science Communication. See Appendix D for the direct links and
full references. Some examples of conservation and ecology related citizen science projects are given
below.
Probably one of the best known examples of citizen science projects in New Zealand is the annual Garden
Bird Survey - a joint initiative between Landcare Research, the Ornithological Society of New Zealand, and
the Royal Forest and Bird Protection Society of New Zealand. The annual survey has been carried out since
2007 for the purpose of monitoring the distribution and population trends of common garden birds in New
Zealand, in the hope that the survey could potentially act as an early-warning system if currently common
native species start declining (Landcare Research, 2014). There is one main question that the Garden Bird
Survey aims to answer, and that is: “Are common bird populations increasing or decreasing?” (Landcare
Research, 2014). The method of the New Zealand Garden Bird survey is based on the Big Garden Birdwatch
(https://www.rspb.org.uk/birdwatch/) in the UK (Spurr, 2012). Garden bird surveys are common and
popular citizen science projects – other ongoing projects include Great Backyard Bird Count, originally in
North America but global since 2013 (http://gbbc.birdcount.org/), and Project FeederWatch
(http://feederwatch.org/) in North America.
Spurr (2012) has analysed the first four years of the Garden Bird survey, and was able to conclude that
despite some methodology and data issues, the Garden Bird survey has the potential to detect changes in
the distribution and abundance of species that may require a management response. The survey cannot
identify the reasons for population changes, but it can alert authorities to investigate potential reasons for
declines, such as disease outbreaks (Spurr, 2012). Also, the results of the Garden Bird survey could provide
Model for developing a citizen science project (Bonney et al., 2009):
1. Choose a scientific question.
2. Form a scientist/educator/technologist/evaluator team.
3. Develop, test, and refine protocols, data forms, and educational support materials.
4. Recruit participants.
5. Train participants.
6. Accept, edit, and display data.
7. Analyse and interpret data.
8. Disseminate results.
9. Measure outcomes.
Figure 2. Model for developing a citizen science project (Bonney et al., 2009).
8 local council and other biodiversity management authorities with circumstantial evidence of their pest
control and restoration planting efforts (Spurr, 2012).
Another example of a citizen science project is The Great Koala Count. Koalas, classified as ‘vulnerable’ over
much of their natural range, are predicted to be high in numbers in South Australia, but before the Great
Koala Count 2012 no one had ever counted them (University of South Australia, 2012). November 28th
2012, from 6am until 8pm, the Great Koala Count participants were encouraged to go out and look for
koala and to enter koala presence/absence observations along with a photo validation and GPS coordinates
(University of South Australia, 2012). Sequeira et al. (2014) analysed the results of the Great Koala Count
2012, providing estimates of the habitat suitability and population numbers in the study area. They
proposed that citizen science data can be used to predict species’ distribution, if the potential biases and
uncertainties are accounted for (Sequeira et al., 2014).
3. THE GREAT KERERŪ COUNT 2014
3.1 Background The third annual Great Kererū Count, organised by Kererū Discovery Project -a partnership between WWF
New Zealand and WCC- and Forest & Bird’s Kiwi Conservation Club (KCC), took place from 22 September to
5 October 2014 nationwide (WWF, 2014).
According to KCC’s project plan, the general aims of the GKC are:
To gain the New Zealand public’s participation in a meaningful science project.
To gather scientific data about the nationwide distribution and population of kererū.
To educate New Zealanders about the ecological importance of the kererū.
To show New Zealanders that science is fun, achievable and rewarding.
During the duration of the count, 14 days in total, people were encouraged to record their kererū reports,
including observations on what the kererū were doing, and to also report if after 5 minutes of looking there
were no kererū sightings (Forest & Bird, 2014).
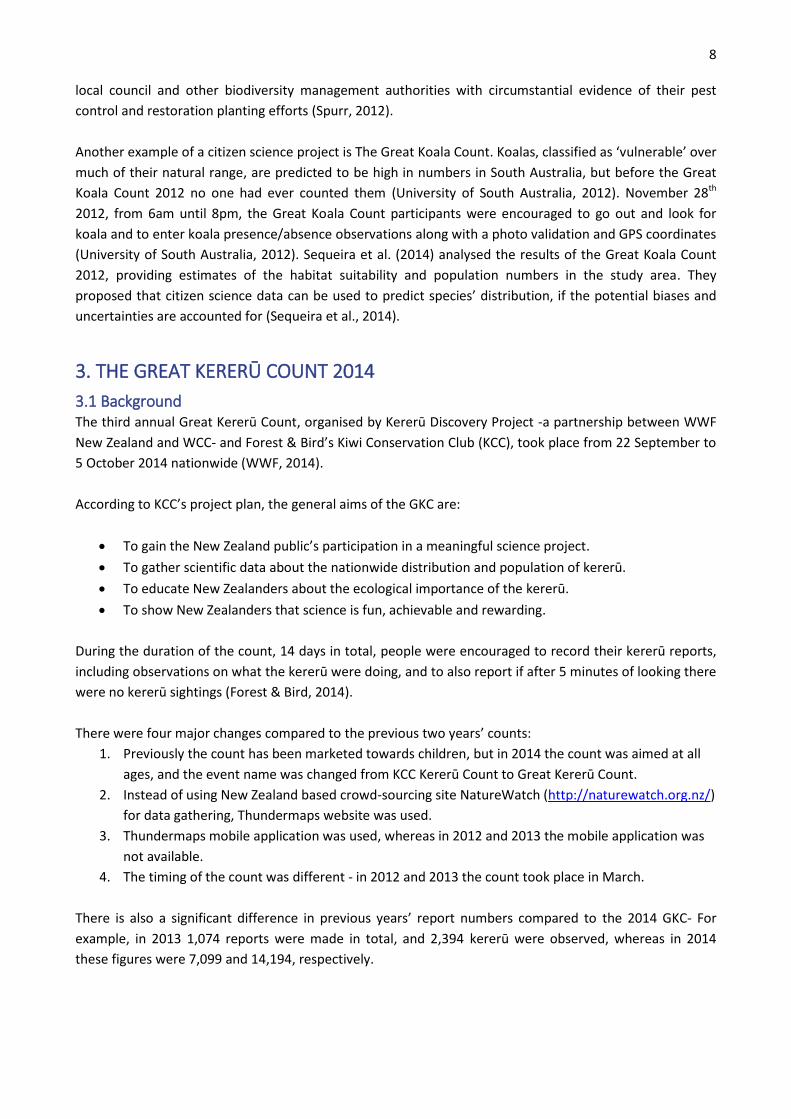
There were four major changes compared to the previous two years’ counts:
1. Previously the count has been marketed towards children, but in 2014 the count was aimed at all
ages, and the event name was changed from KCC Kererū Count to Great Kererū Count.
2. Instead of using New Zealand based crowd-sourcing site NatureWatch (http://naturewatch.org.nz/)
for data gathering, Thundermaps website was used.
3. Thundermaps mobile application was used, whereas in 2012 and 2013 the mobile application was
not available.
4. The timing of the count was different - in 2012 and 2013 the count took place in March.
There is also a significant difference in previous years’ report numbers compared to the 2014 GKC- For
example, in 2013 1,074 reports were made in total, and 2,394 kererū were observed, whereas in 2014
these figures were 7,099 and 14,194, respectively.

9
3.2 Why kererū? Kererū, also known as native pigeon or
wood pigeon, is the more common of the
two subspecies of the endemic Hemiphaga
novaeseelandiae, the New Zealand pigeon
(Heather & Robertson, 2005). Kererū is
currently considered to be common and
widespread in native forests and
increasingly in urban areas throughout the
North/South Islands, Stewart
Island/Rakiura and large offshore islands;
however, due to illegal hunting kererū is
becoming rare in some parts of New
Zealand (Scofield & Stephenson, 2013).
Other threats to kererū include habitat loss
through forest clearance, predation by rats,
stoats, possums and cats, and competition
for food (leaves, flowers, fruit) with possums (Department Of Conservation, 2014).
Kererū is not currently classified as threatened, but its conservation is considered very important, not only
for its intrinsic value but also because its decline creates a serious threat to New Zealand’s native forests.
Kererū provide effective dispersal by moving most seeds away from the parent tree and enhancing seed
and seedling survival, and it has been shown that both dispersal failure and introduced mammals
negatively affect the regeneration of large-seeded trees in New Zealand (Wotton, 2007). In their report
‘Monitoring and management of kererū (Hemiphaga novaeseelandiae)’ Mander at al. (1998) outline the
need for monitoring kererū populations:
Kererū is a keystone species of native mixed podocarp-broad-leaf forests – it is one of the most
important seed dispersing bird species in New Zealand because of its widespread distribution,
mobility and the wide range of fruit it eats, and because it is the only common bird capable of
dispersing large-fruited species, such as karaka (Corynocarpus laevigatus), tawa (Beilschmiedia
tawa), tarairi (Beilschmiedia taraire) and pūriri (Vitex lucens);
Kererū have relatively low reproductive rate, and they are vulnerable to predation by introduced
mammals - therefore they can be useful as an indicator species to assess the effectiveness of
mainland island management programmes and other restoration projects;
Kererū populations are declining in Northland, and are widely perceived to be declining other parts
of the country, partly because of illegal harvesting;
The development and implementation of a nationally coordinated monitoring programme is a
necessary first step in the development of a kererū conservation strategy (Mander at al., 1998).
Based on these factors there are many potential benefits of a citizen science project focused on kererū,
including increased public awareness of the threats to kererū, its significance in New Zealand ecosystems,
what actions can be taken to help kererū, and the potential to gain early warning if the populations appear
to be in decline in some parts of the country. By taking action to help kererū, other native and endemic
species may be also helped as a result. Also, kererū is an excellent target species for a citizen science
project, as it is widespread, relatively common, and large and distinguishable, making it easy to identify.
Kererū perching in a tree. Photo: Tony Stoddard 2014/ Kererū Discovery

10
3.3 Data collection Data was collected via Thundermaps website or mobile app. The user would drag and drop a pin on the
Google map to add a location of the kererū observation. A street address would then be generated from
the latitude and longitude coordinates. If the marked location was in a non-residential area such as park or
forest, the system would pull through the nearest possible street address, or a non-street location. If the
marked location was too far from an address, e.g. in the sea, then no address would have been applied. The
user would then add more information by using dropdown boxes and open comment fields.
The first question appearing was ‘Did you see a kererū?’. Answer options were either Yes or No, with Yes
option having different categories (Preening, Mating display, Flying, Eating, Other). If Eating was selected,
then another field would appear with a drop down box for different food items – flowers, leaves, fruit, or
other.
Depending on the answer (Yes or No) more fields would display. If the answer was Yes, a question ‘How
many kererū?’ would appear with options up to 30 plus. If the answer was No, a new drop down box would
appear, with a question ‘How long did you look for?’.
The next question was ‘How old are you?’. Then the date and time could be added. There were also options
to add a photo, other details (open text field) and to tick a Post anonymously box. Clicking ‘Next step’
would take the participant to personal details field if Post anonymously box was not selected.
3.4 Data analysis and methods After the initial data clean up done by the Kererū Discovery, the total figures showed 7,099 kererū reports
made and 14,194 kererū observed. This is an almost seven-fold increase on the 2013 survey which recorded
1,074 reports and 2,394 kererū. The following steps were taken for further data clean up:
Record ID added for every report.
‘Blank’ added for all empty fields.
Some observations were done before the count started on 22 September, and others were made
after the count ended on 5 October. A new column was added for values BEFORE, AFTER and
DURING the kererū count based on the date column.
All columns that had no necessary information for data analysis were deleted.
All columns that had two different types of data, e.g. age group and the time spent looking for
kererū, were separated into two different columns.
New column ‘Presence/Absence’ added: Absence = 0, Presence = 1. All ‘Blanks’ checked and
changed to ‘1’ or ‘0’ based on comments and the number of kererū observed.
Nine reports were made via email, and did not include latitude and longitude information, or the
time that observations were made. Therefore for spatial analysis purposes these data were
determined invalid, even though in the comment section there may have been information about
the number of kererū seen.
Four observations that reported a dead kererū were deleted.
If the observation was an obvious duplicate (exactly the same comment, coordinate and time), it
was deleted. In total 50 observations were deleted as duplicates after going through the comment
section manually.
Seven reports that had invalid coordinates for data analysis purposes, i.e. the location was in the
sea, or in another country, were deleted.

11 After these steps were taken the report numbers (including the reports made outside the official count
period) were 7,029 kererū reports made and 14,086 kererū observed. During the 14 day count period,
6,372 reports were made and 12,533 kererū observed.
To further cross-validate the broad-scale distributional patterns displayed by the GKC data it was visually
compared against eBird’s kererū dataset. According to the metadata sheet attached to the Bird dataset, all
the observations that have status ‘Approved’ mean that the record is deemed acceptable by eBird’s review
process. The kererū reports on eBird were obtained by requesting access to the dataset from eBird
(http://ebird.org/ebird/data/request). All kererū reports between the years 2010-2014 that had status
‘Approved’ were then added to ArcGIS 10.2.2, and the distribution map was compared to the distribution
map based on the GKC dataset.
Spatial analysis was completed by using ArcGIS 10.2.2. After the GIS operations were completed and
analysed, it was discovered that out of 7,029 reports 315 were incomplete – they all had the exact same
coordinates in central Wellington, when in fact the report could have come from anywhere. This occurred
because the default report location (the ‘pin’ on the map) on the GKC website and app had been set to
Latitude -41.280314 and Longitude 174.7671192 (12 Glenmore Street, Wellington). Initially the default
point had been in the ocean, but after it was discovered that some participants did not change the default
location when submitting their record, and reports from the ocean kept appearing on the automatically
generated online maps, the default location was changed to 12 Glenmore Street at the request of the GKC
organisers. This information was not initially passed on when the GKC dataset changed hands. The majority
of the figures in the Results chapter therefore include these 315 points, unless otherwise specified for
particular spatial analyses, in which case 315 records were subtracted from the Wellington total since their
true location is unknown.
Most spatial datasets used were obtained from WCC. NZ Coastlines and Islands Polygons-dataset was
obtained from Land Information New Zealand (https://data.linz.govt.nz/layer/1153-nz-coastlines-and-
islands-polygons-topo-150k/). Vegetation and landcover dataset was obtained from Land Resource
Information Systems (LRIS) portal (https://lris.scinfo.org.nz/layer/304-lcdb-v30-deprecated/), but it was
then modified by merging categories on ArcGIS.
For analysis the area of interest (New Zealand) was divided into 16 regions according to New Zealand
Government Regional Council classification, so that the figures could be compared with New Zealand
census data. The definition of Regional Council Area is available on: http://www.stats.govt.nz/Census/2013-
census/info-about-2013-census-data/2013-census-definitions-forms/definitions/r.aspx. These 16 regions
are:
Auckland
Bay of Plenty
Canterbury
Gisborne
Hawke's Bay
Manawatu Wanganui
Marlborough
Nelson
Northland
Otago
Southland

12
Taranaki
Tasman
Waikato
Wellington
West Coast
The report numbers made in each region were compared against the national household numbers based
on the latest (2013) household census data from Statistics New Zealand. The dataset is available on the
Statistics New Zealand website (http://www.stats.govt.nz/Census/2013-census/info-about-2013-census-
data/information-by-variable/household-composition.aspx).
The kererū point locations were intersected with the census region polygons, and the attribute tables were
then exported to Excel to get the final report numbers for each region. Using this method the total report
figures were 6,408 reports made and 12,790 kererū observed. Excluded from these numbers are:
315 incomplete reports (reports without reliable spatial location data).
306 reports made outside the 16 regional areas, of which 72 (23.53%) points in total were
determined as ‘off-shore points’, with 11 of them having no identifiable location based on the
comment/address section. The number of ‘off-shore points’ was determined by selecting all the
points that were outside 1,000 metres range from either the mainland or islands by using the buffer
tool.
Finer-scale spatial analysis was done for the Wellington City area. Pest controlled areas and parks and
reserves within Wellington were brought together by the union tool. 200 metre and 500 metre buffers
were created around the park and pest control area polygons, and the proportion of kererū presence and
absence points falling within the buffer was calculated. The categories in the vegetation and landcover
dataset were merged as follows: The new category ‘Built-up areas’ includes built-up areas (urban and
suburban areas), transport infrastructure areas, surface mines (quarries) and landfills. The new category
‘Indigenous forest’ includes broadleaved indigenous hardwoods and other indigenous forests. The new
category ‘Exotic forest and shelterbelts’ includes all other exotic forest types except pine forests, which has
its own category. ‘Native forest remnant’ (areas of original native forests) dataset was added to the
vegetation and landcover layer, and then the layer was intersected with a dataset containing Wellington
suburb polygons. The new vegetation and landcover layer was intersected with kererū presence and
absence data, and the attribute table was exported to Excel for data summaries.
4. PRELIMINARY RESULTS OF THE GKC 2014 N.B. The totals in the Tables and Figures may not add up to 100.00% due to rounding.
4.1 Participant and report characteristics Including the reports made outside the official count period, the final figures were 7,029 kererū reports
made, and 14,086 kererū observed. 6,662 reports were kererū presence reports and 367 reports were
kererū absence reports. 8.59% of all the reports were made before the count officially started on 22 of
September, and 0.75% of the reports were made after the last day of the count, 5 October (Table 1). The
total numbers showed 6,372 (90.65% of all reports) kererū reports made and 12,533 kererū observed
during the 14 day count period. It is unclear if date and time figures are reliable, as it appears that often
participants had not changed the system default time (current date and time) when submitting their
reports. Therefore these numbers may not reflect the actual time when the observation was made, but
rather the time when the observation was entered in the system.

13
Time of the report made Number of reports
made
Percentage Number of kererū
observed
Percentage
After the count 53 0.75% 118 0.84%
Before the count 604 8.59% 1435 10.19%
During the count 6,372 90.65% 12,533 88.97%
Total 7,029 100.00% 14,086 100.00%
Table 1. The total number of kererū reports made and the total number of kererū observed before, during and during the GKC
2014.
More reports (3,927 in total) were made during the first week of the count than during the second week of
the count (2,445 in total). The school holiday period started on Friday 26 September, and the week during
the school holidays had fewer observations. The trend appears to be the same for both weeks – more
observations were done early in the week, and the least number of reports were made during the weekend
(Fig. 3).
Figure 3. A graph showing the total kererū report numbers made during the GKC 2014.
49.42% of the total reports made (3,508 out of 7,099) had no contact details added to the report. As there
was an option to report anonymously, it is not possible to confirm the total number of people who
participated in the GKC. Approximately half of the GKC participants who disclosed their age, were in the age
group ’18 or older’, while 44.13% did not disclose their age (Table 2).
Age group Reports made Percentage
Age 0 to 5 27 0.38%
Age 5 to 12 317 4.51%
Age 13 to 17 37 0.53%
Age 18 or older 3,546 50.45%
Undisclosed 3,102 44.13%
Total 7,029 100.00%
Table 2. Table showing how many kererū reports were made in the different age groups.
618 639
620
550 559
482 459
422
564
500
337 300
270
52
0
100
200
300
400
500
600
700
Mon22/09
Tue23/09
Wed24/09
Thu25/09
Fri26/09
Sat27/09
Sun28/09
Mon29/09
Tue30/09
Wed1/10
Thu2/10
Fri3/10
Sat4/10
Sun5/10
Nu
mb
er
of
rep
ort
s su
bm
itte
d
Date

14
Figure 5. A graph showing the percentages of different observations made during the two week period, with ‘Blank’
indicating an uncategorised kererū observation, and ‘Absence’ indicating that no kererū were sighted during the
observation.
4.2 Observation categories
To make comparison easier with future GKCs, all figures in this chapter only include the reports made in the
correct time period (during the 14 days of the count). This chapter includes the 315 reports made on the
default location.
People were encouraged to add a report if they went looking for a kererū, and did not see any. 335 reports,
5.26% of the total, showed absence of kererū and the remaining 6,037 (94.74%) reported presence of
kererū. If absence was reported, the person making the report could then add how long they had been
looking for kererū. 100 reports, almost one third (29.85%) of all the absence reports, were made after
people had spent 5-10 minutes looking for kererū while the remaining two thirds of the absence reports
each formed ≤13% of the total (Fig. 4).
Figure 4. Time spent looking for kererū if kererū absence was reported, for example ‘5-10 minutes’ means that the participant was
looking for kererū for five to ten minutes, but did not see one. If the participant did not add any information on how long they
spent looking for kererū the report is categorised as ‘Undisclosed’.
The three most common kererū observation categories were Flying (36.10%), Eating (24.70%) and Other
(21.14%), with 2.17% of the observations not reporting any sighting category, and 5.26% reporting absence
(Fig. 5).
0.00%
5.00%
10.00%
15.00%
20.00%
25.00%
30.00%
35.00%
5 -10minutes
10-15minutes
15 - 30minutes
30 - onehour
1 - 3 hours Half a day A wholeday
Undisclosed
Pe
rce
nta
ge
Time spent looking for kererū
Flying Eating Other Preening AbsenceMatingdisplay
Blank
Total 36.10% 24.70% 21.14% 8.29% 5.26% 2.35% 2.17%
0.00%
5.00%
10.00%
15.00%
20.00%
25.00%
30.00%
35.00%
40.00%
Pe
rce
nta
ge
Category

15 If the kererū was reported to be eating, the participant could then choose a food category. 1,247 reports
out of 1,574 reports made in the ‘Eating’ category had information on the type of food the kererū was
eating. The majority of people reported the kererū was eating either flowers or leaves (Table 3).
Food category Number of
reports made
Percentage Number of kererū
observed
Percentage
Flowers 442 35.45% 1,017 33.00%
Leaves 385 30.87% 1,004 32.58%
Fruit 184 14.76% 401 13.01%
Other (comments could be
added)
236 18.93% 660 21.41%
Total 1,247 100.00% 3,082 100.00%
Table 3. Table showing the food items recorded if ‘Eating’ category was selected when submitting a report.
Some participants had added information on what the bird was eating in the comment section (open text
field). The search function on Excel was used to identify the most common plants eaten by kererū. The
plants that were searched for included every exotic and native plant species in Project Kererū documents
(available on http://www.projectkererū.org.nz/how-can-you-help). Names of exotic plant species were
mentioned in the comment section 582 times in total. The most popular word appearing was Plum
(33.51%) followed by Tree Lucerne (17.70%) and Pear (13.23%). See Table 4.
Exotic plant (common name) Number of times species
name mentioned
Percentage
Plum 195 33.51%
Tree Lucerne 103 17.70%
Pear 77 13.23%
Cherry tree 73 12.54%
Gum 39 6.70%
Elm 26 4.47%
Apple 15 2.58%
Rose 10 1.72%
Magnolia 9 1.55%
Apricot 8 1.37%
Laburnum 8 1.37%
Peach 8 1.37%
Hibiscus 6 1.03%
Almond 5 0.86%
Total 582 100.00%
Table 4. Names of the exotic plant species that the GKC 2014 participants had mentioned in their
comments (in the open text field). For example, the word ‘plum’ was mentioned 195 times.

16 Native plant species were mentioned in the comment section 808 times in total. The most common word
appearing was Kōwhai (59.41%), followed by Pūriri 13.99%) and Nīkau (6.19%). See Table 5.
Native plant (common
name/Maori name)
Number of times species
name mentioned
Percentage
Kōwhai 480 59.41%
Pūriri 113 13.99%
Nīkau 50 6.19%
Ngaio 29 3.59%
Tea tree/Mānuka 21 2.60%
Tōtara 15 1.86%
Karaka 15 1.86%
Cabbage tree/Tī kōuka 15 1.86%
White pine/Kahikatea 11 1.36%
Miro 9 1.11%
Tawa 8 0.99%
Red pine/Rimu 7 0.87%
Lacebark 6 0.74%
Ribbonwood/Mānatu 5 0.62%
Tītoki 4 0.50%
Lancewood/Horoeka 4 0.50%
Tree fuchsia/Kōtukutuku 3 0.37%
Māhoe 3 0.37%
Wineberry/Makomako 3 0.37%
Broadleaf 3 0.37%
Black pine/Mataī 2 0.25%
Matipo 1 0.12%
Supplejack/Kareao 1 0.12%
Total 808 100.00%
Table 5. Names of the native plant species that the GKC 2014 participants had mentioned in their
comments (in the open text field). For example, the word ‘kōwhai’ was mentioned 480 times.
Kererū in a flowering Kōwhai tree. Photo: Tony Stoddard 2014/ Kererū Discovery
17
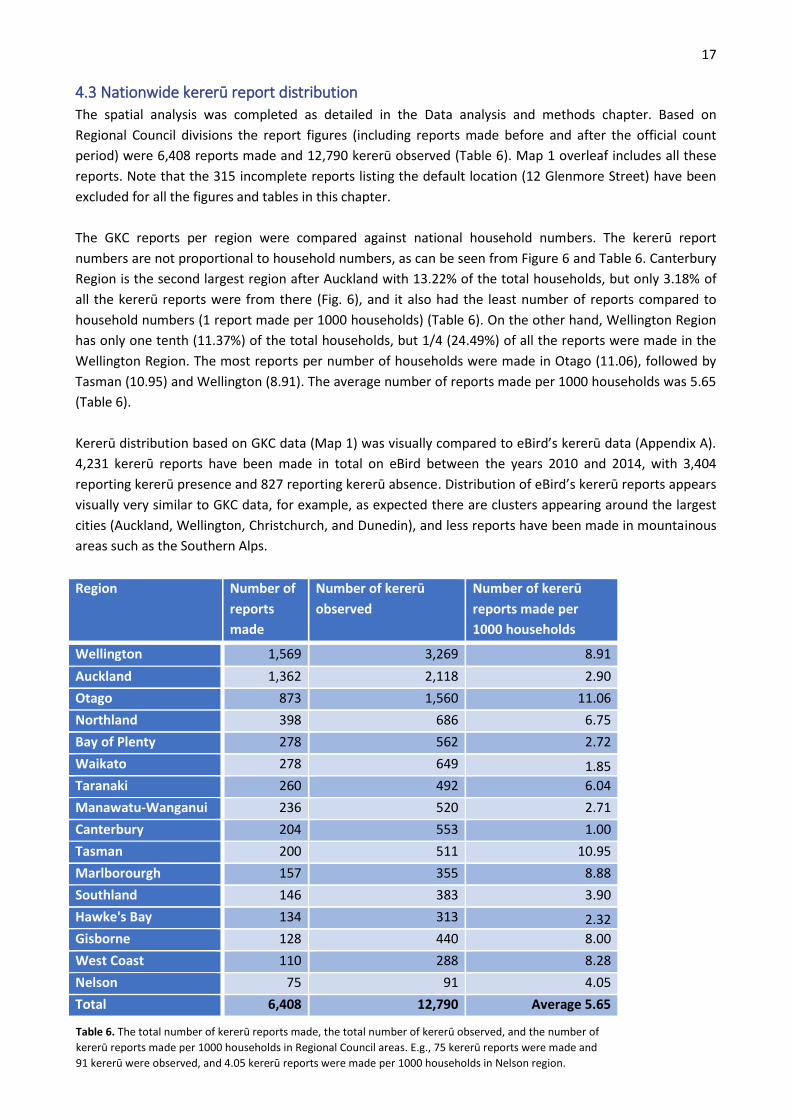
4.3 Nationwide kererū report distribution
The spatial analysis was completed as detailed in the Data analysis and methods chapter. Based on
Regional Council divisions the report figures (including reports made before and after the official count
period) were 6,408 reports made and 12,790 kererū observed (Table 6). Map 1 overleaf includes all these
reports. Note that the 315 incomplete reports listing the default location (12 Glenmore Street) have been
excluded for all the figures and tables in this chapter.
The GKC reports per region were compared against national household numbers. The kererū report
numbers are not proportional to household numbers, as can be seen from Figure 6 and Table 6. Canterbury
Region is the second largest region after Auckland with 13.22% of the total households, but only 3.18% of
all the kererū reports were from there (Fig. 6), and it also had the least number of reports compared to
household numbers (1 report made per 1000 households) (Table 6). On the other hand, Wellington Region
has only one tenth (11.37%) of the total households, but 1/4 (24.49%) of all the reports were made in the
Wellington Region. The most reports per number of households were made in Otago (11.06), followed by
Tasman (10.95) and Wellington (8.91). The average number of reports made per 1000 households was 5.65
(Table 6).
Kererū distribution based on GKC data (Map 1) was visually compared to eBird’s kererū data (Appendix A).
4,231 kererū reports have been made in total on eBird between the years 2010 and 2014, with 3,404
reporting kererū presence and 827 reporting kererū absence. Distribution of eBird’s kererū reports appears
visually very similar to GKC data, for example, as expected there are clusters appearing around the largest
cities (Auckland, Wellington, Christchurch, and Dunedin), and less reports have been made in mountainous
areas such as the Southern Alps.
Region Number of
reports
made
Number of kererū
observed
Number of kererū
reports made per
1000 households
Wellington 1,569 3,269 8.91
Auckland 1,362 2,118 2.90
Otago 873 1,560 11.06
Northland 398 686 6.75
Bay of Plenty 278 562 2.72
Waikato 278 649 1.85
Taranaki 260 492 6.04
Manawatu-Wanganui 236 520 2.71
Canterbury 204 553 1.00
Tasman 200 511 10.95
Marlborourgh 157 355 8.88
Southland 146 383 3.90
Hawke's Bay 134 313 2.32
Gisborne 128 440 8.00
West Coast 110 288 8.28
Nelson 75 91 4.05
Total 6,408 12,790 Average 5.65
Table 6. The total number of kererū reports made, the total number of kererū observed, and the number of
kererū reports made per 1000 households in Regional Council areas. E.g., 75 kererū reports were made and
91 kererū were observed, and 4.05 kererū reports were made per 1000 households in Nelson region.

18
0.86%
1.03%
1.14%
1.18%
1.20%
2.42%
2.78%
3.72%
3.80%
5.09%
5.61%
6.60%
9.69%
11.37%
13.22%
30.30%
1.72%
2.00%
2.45%
3.12%
1.17%
2.28%
4.06%
2.09%
6.21%
13.62%
3.68%
4.34%
4.34%
24.49%
3.18%
21.25%
0.00% 5.00% 10.00% 15.00% 20.00% 25.00% 30.00% 35.00%
West Coast Region
Gisborne Region
Marlborough Region
Tasman Region
Nelson Region
Southland Region
Taranaki Region
Hawke's Bay Region
Northland Region
Otago Region
Manawatu-Wanganui Region
Bay of Plenty Region
Waikato Region
Wellington Region
Canterbury Region
Auckland Region
Reports compared to household numbers
Number of kererū reports made Total number of households (2013)
Figure 6. A comparison of the frequency of kererū reporting against the percentage of nationwide households in
each region. E.g. Wellington contains 11.37% of the nation’s households, but recorded 24.49% of the kererū
sightings submitted to the GKC. The household percentage for each region is taken from 2013 Census, the total
household number in occupied private dwellings being 1,549,635.

19
Map 1. Nationwide distribution of 6,408 kererū presence and absence reports in the Regional Council areas.
20
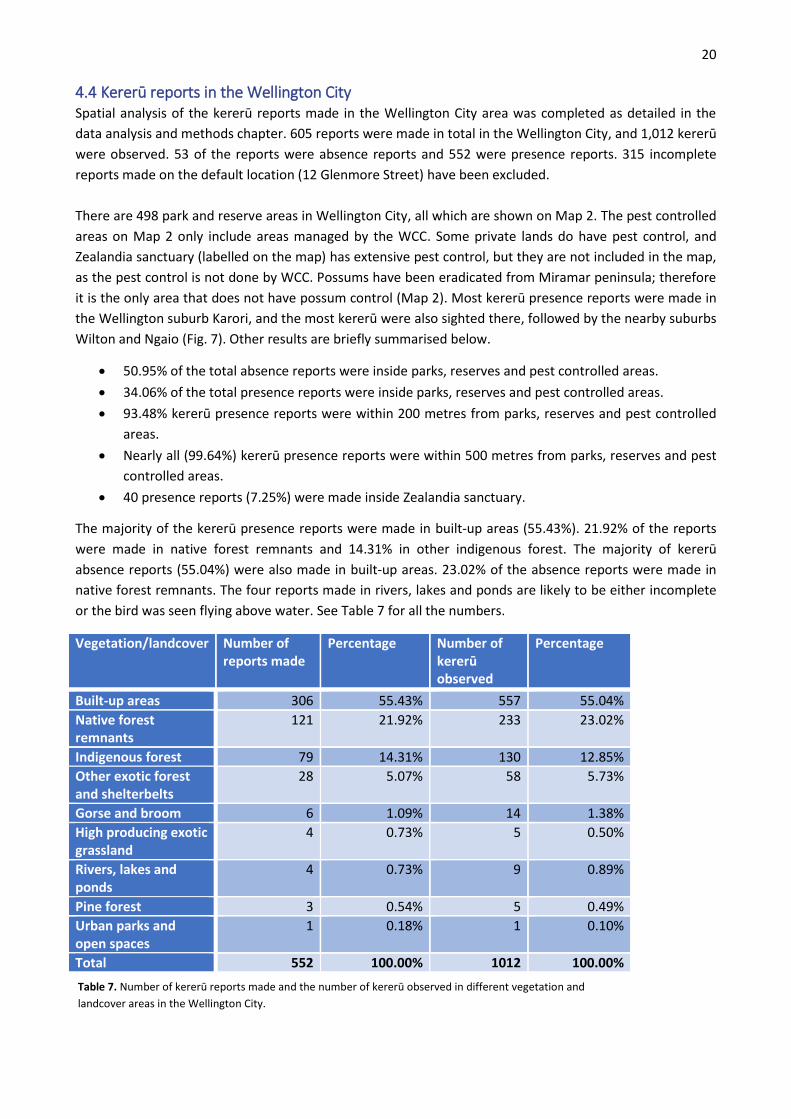
4.4 Kererū reports in the Wellington City Spatial analysis of the kererū reports made in the Wellington City area was completed as detailed in the
data analysis and methods chapter. 605 reports were made in total in the Wellington City, and 1,012 kererū
were observed. 53 of the reports were absence reports and 552 were presence reports. 315 incomplete
reports made on the default location (12 Glenmore Street) have been excluded.
There are 498 park and reserve areas in Wellington City, all which are shown on Map 2. The pest controlled
areas on Map 2 only include areas managed by the WCC. Some private lands do have pest control, and
Zealandia sanctuary (labelled on the map) has extensive pest control, but they are not included in the map,
as the pest control is not done by WCC. Possums have been eradicated from Miramar peninsula; therefore
it is the only area that does not have possum control (Map 2). Most kererū presence reports were made in
the Wellington suburb Karori, and the most kererū were also sighted there, followed by the nearby suburbs
Wilton and Ngaio (Fig. 7). Other results are briefly summarised below.
50.95% of the total absence reports were inside parks, reserves and pest controlled areas.
34.06% of the total presence reports were inside parks, reserves and pest controlled areas.
93.48% kererū presence reports were within 200 metres from parks, reserves and pest controlled
areas.
Nearly all (99.64%) kererū presence reports were within 500 metres from parks, reserves and pest
controlled areas.
40 presence reports (7.25%) were made inside Zealandia sanctuary.
The majority of the kererū presence reports were made in built-up areas (55.43%). 21.92% of the reports
were made in native forest remnants and 14.31% in other indigenous forest. The majority of kererū
absence reports (55.04%) were also made in built-up areas. 23.02% of the absence reports were made in
native forest remnants. The four reports made in rivers, lakes and ponds are likely to be either incomplete
or the bird was seen flying above water. See Table 7 for all the numbers.
Vegetation/landcover Number of reports made
Percentage Number of kererū observed
Percentage
Built-up areas 306 55.43% 557 55.04%
Native forest remnants
121 21.92% 233 23.02%
Indigenous forest 79 14.31% 130 12.85%
Other exotic forest and shelterbelts
28 5.07% 58 5.73%
Gorse and broom 6 1.09% 14 1.38%
High producing exotic grassland
4 0.73% 5 0.50%
Rivers, lakes and ponds
4 0.73% 9 0.89%
Pine forest 3 0.54% 5 0.49%
Urban parks and open spaces
1 0.18% 1 0.10%
Total 552 100.00% 1012 100.00%
Table 7. Number of kererū reports made and the number of kererū observed in different vegetation and
landcover areas in the Wellington City.

21
Map 2. Kererū presence and absence reports in the Wellington City. The pest control types in the
Wellington City are:
Predators = Traps (pest control of stoats, weasels, ferrets and rats). N.B. Only in Miramar peninsula as
possums have been eradicated from there.
Possums = A network of possum bait stations.
Possums and Predators =Both traps and bait stations.

22
Figure 7. Kererū presence reports and number of kererū seen in percentages for the 15 Wellington City suburbs that had
the most kererū reports. Category ‘Other’ includes all the reports and kererū numbers from the remaining 19 Wellington
City suburbs. The exact figures for all suburbs can be seen from Appendix B.
1.09%
1.27%
1.45%
1.81%
2.17%
2.72%
3.99%
4.17%
4.71%
5.43%
6.34%
7.43%
8.70%
14.49%
16.30%
17.93%
1.38%
1.88%
1.19%
1.78%
1.68%
3.06%
3.56%
4.15%
4.15%
4.64%
4.84%
8.20%
7.91%
13.54%
17.89%
20.16%
0.00% 5.00% 10.00% 15.00% 20.00% 25.00%
Newlands
Wellington Central
Brooklyn
Highbury
Aro Valley
Wadestown
Mount Victoria
Northland
Kelburn
Tawa
Crofton Downs
Other
Khandallah
Ngaio
Wilton
Karori
Kererū presence reports and number of kererū sighted in the Wellington City
Number of kererū observed Number of reports made

23
5. SURVEY METHOD To gather information about GKC participant experiences, an online survey was developed using Qualtrics
software. The aim of the survey was to use the data collected to help to assess how the GKC and other
citizen science projects could be promoted and run. The survey consisted of 26 questions. The survey
questions and design were created in collaboration with all GKC partners to ensure all GKC stakeholders
would benefit from the results. The data collected is shared between the GKC partners. The survey was
voluntary and anonymous, and it was approved by the Victoria University of Wellington’s Human Ethics
Committee. Please see Appendix C for more details, including a copy of the survey questions.
The survey was open from 16 December 2014 until 5 January 2015. The recruitment was done by emailing
1,156 GKC participants who had given their email address when reporting sightings. The email was sent to
participants by KCC. Further recruitment was done on Forest & Bird’s Facebook page.
The survey resulted in 264 anonymous responses. Only completed responses (surveys that had been
successfully submitted by the respondent) were included in the analysis. After partial responses
(incomplete responses that were closed automatically after a certain period of time or manually by the
survey administrator) were excluded, the total survey response number was 241. The dropout rate was
therefore 8.7%.
After the survey closed, the data was exported from Qualtrics into Excel. The survey results have been
divided into five themes in the survey results section below. These themes are: participant and report
characteristics, promotion, participant experiences of the Great Kererū Count, public awareness and
engagement, and future projects.
6. SURVEY RESULTS N.B. The questions below have been organised by themes and therefore numbered differently from the
original survey questions (Appendix C). All results, including the tables and graphs, are using n=241. The
totals in the Tables and Figures may not add up to 100.00% due to rounding.
6.1 Participant and report characteristics
Question 1: I identify my gender as…
32.37% of respondents identified their gender as male, and 66.80%% as female. 0.83% preferred not to
disclose their gender identity.
Question 2: What is your age?
The majority of the survey respondents were adults. Almost half of the respondents were in the age groups
55-64 and 45-54, forming 23.76% and 21.78% of the total respondents respectively (Fig. 8).

24
Figure 8. The GKC 2014 participant survey respondents’ age groups (based on 241 respondents).
Question 3: In which region did you do most of your kererū observations?
All regions had at least one observation made, but the majority (over 60%) of the survey respondent
observations were made in Auckland and Wellington regions (Table 8).
Region Number of responses Percentage
Wellington 79 33.33%
Auckland 72 30.30%
Otago 30 12.12%
Northland 25 10.10%
Canterbury 8 3.03%
Southland 4 2.02%
Waikato 4 2.02%
Manawatu-Wanganui 4 2.02%
Bay of Plenty 3 1.01%
Gisborne 3 1.01%
West Coast 2 1.01%
Nelson 2 1.01%
Taranaki 2 1.01%
Hawke's Bay 1 0.00%
Marlborough 1 0.00%
Tasman 1 0.00%
Total 241 100.00%
Under 12 12-17 18-24 25-34 35-44 45-54 55-64 65-7475 yearsor older
Total 1.98% 0.00% 2.97% 10.89% 19.80% 21.78% 23.76% 13.86% 4.95%
0.00%
5.00%
10.00%
15.00%
20.00%
25.00%P
erc
en
tage
Age group
Table 8. Table showing where in New Zealand the GKC 2014 survey respondent
observations were made. The division of regions is based on New Zealand
Government Regional Council classification.

25 Question 4: How many observations did you record in total (approximately)?
22.82% of the respondents did not remember how many observations they had recorded during the GKC,
the remaining 77.18% reported a range of observations made, varying from 0 to 170, with a mean of 4.97
and standard deviation of 14.04.
6.2 Promotion
Question 5: How did you find out about the Great Kererū Count? Any number of boxes can be ticked.
The most common answers were Forest & Bird e-newsletter and Facebook page forming over 30% of the
total answers in the given categories, followed by local newspaper (11.81%) and Friends/family/colleagues
(10.42%). Table 9 shows the total figures for all categories.
Category Number of responses Percentage
Forest & Bird e-newsletter 64 18.75%
Forest & Bird Facebook page 55 15.97%
Local newspaper 40 11.81%
Friends/family/colleagues 35 10.42%
Other 28 8.33%
Radio 27 7.64%
Forest & Bird website 26 7.64%
Kererū Discovery Facebook page 17 4.86%
Wild Things (KCC magazine) 12 3.47%
WWF-New Zealand 11 3.47%
KCC e-newsletter 9 2.78%
TV 8 2.08%
Kiwi Conservation Club (KCC) website 6 1.39%
School/Early Childhood Centre 3 0.69%
Poster 2 0.69%
Library 0 0.00%
Total 343 100.00%
Table 9. Table showing how the survey respondents had found out about the GKC 2014.
If category ‘Other’ was chosen (8.33% of the total responses), the respondent could then specify further.
These answers included: Zealandia flyers and newsletters, Twitter, Enhancing the Halo email and website,
newsletter from WCC councillor, KCC camp, NatureWatch website, Thundermaps App, internet (for
example: article on internet, ifeelnatty.com, came across by accident, neighbourhood website), Friends of
Whau newsletter, Enviroschool newsletter, NZ Greens Facebook page, University. Two respondents said
that they knew about this year’s count because they had participated in previous years’ counts.
6.3 Participant experiences of the Great Kererū Count
Question 6: Did you think the duration of the Great Kererū Count (2 weeks) was:
The majority of the respondents thought that the duration of the Great Kererū Count (2 weeks) was about
right (67.63%). 30.29% thought that the duration was too short, and 2.07% thought it was too long.
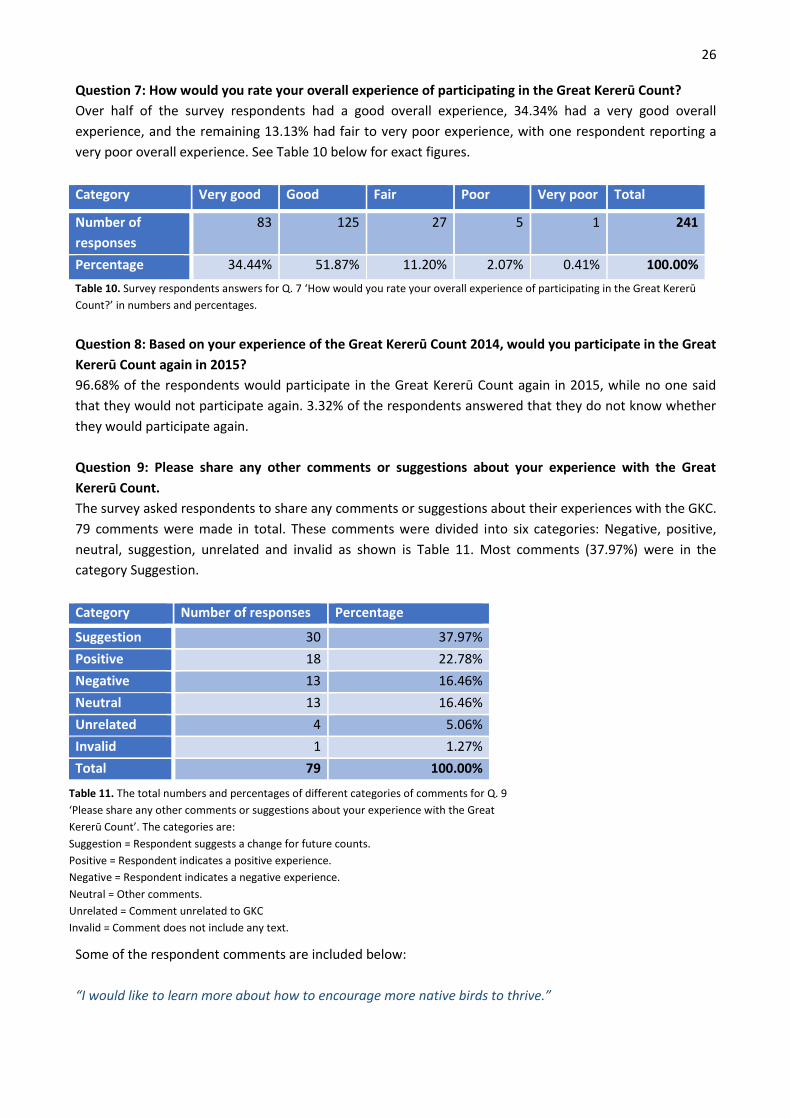
26 Question 7: How would you rate your overall experience of participating in the Great Kererū Count?
Over half of the survey respondents had a good overall experience, 34.34% had a very good overall
experience, and the remaining 13.13% had fair to very poor experience, with one respondent reporting a
very poor overall experience. See Table 10 below for exact figures.
Category Very good Good Fair Poor Very poor Total
Number of
responses
83 125 27 5 1 241
Percentage 34.44% 51.87% 11.20% 2.07% 0.41% 100.00%
Table 10. Survey respondents answers for Q. 7 ‘How would you rate your overall experience of participating in the Great Kererū
Count?’ in numbers and percentages.
Question 8: Based on your experience of the Great Kererū Count 2014, would you participate in the Great
Kererū Count again in 2015?
96.68% of the respondents would participate in the Great Kererū Count again in 2015, while no one said
that they would not participate again. 3.32% of the respondents answered that they do not know whether
they would participate again.
Question 9: Please share any other comments or suggestions about your experience with the Great
Kererū Count.
The survey asked respondents to share any comments or suggestions about their experiences with the GKC.
79 comments were made in total. These comments were divided into six categories: Negative, positive,
neutral, suggestion, unrelated and invalid as shown is Table 11. Most comments (37.97%) were in the
category Suggestion.
Category Number of responses Percentage
Suggestion 30 37.97%
Positive 18 22.78%
Negative 13 16.46%
Neutral 13 16.46%
Unrelated 4 5.06%
Invalid 1 1.27%
Total 79 100.00%
Some of the respondent comments are included below:
“I would like to learn more about how to encourage more native birds to thrive.”
Table 11. The total numbers and percentages of different categories of comments for Q. 9
‘Please share any other comments or suggestions about your experience with the Great
Kererū Count’. The categories are:
Suggestion = Respondent suggests a change for future counts.
Positive = Respondent indicates a positive experience.
Negative = Respondent indicates a negative experience.
Neutral = Other comments.
Unrelated = Comment unrelated to GKC
Invalid = Comment does not include any text.

27 “Amazingly, I did win a couple of prizes. I doubt that the Great Kererū Count was of any scientific value.
Participants were self-selected and data couldn't be verified. But I figure it was a great consciousness-
raising exercise and enjoyable as well.”
“There was no option for kererū just sitting I couldn't always tell what they were eating as they were too far
away.”
“It was amazing how many times the kererū count came up in conversations with friends and others. And I
find I'm still making note of any kererū I see, even though the count ended months ago.”
“The Thundermaps website was a bit unstable for me. Felt that all the observations were not shown and
some were in the wrong place on the map. Numbers in a given area fluctuated as you zoomed in which was
a bit weird/confusing. Maybe the infographic side of the website could be made a bit more user friendly -
perhaps a bar graph or similar to show numbers in each area.”
Question 10: How would you rate the Great Kererū Count website in terms of user-friendliness?
Almost 80% of respondents rated the user-friendliness of the website either very good or good, while
approximately 6% rated the website user-friendliness very poor or poor. See Figure 9 for all the
percentages.
Figure 9. Survey respondents’ ratings of the user-friendliness of the GKC website in percentages, e.g. 41.41% of the survey
respondents answered ‘Very good’.
Question 11: Please add any comments about the Great Kererū Count website (optional).
60 comments regarding the website were made in total, with 39 of them indicating an issue with the
website. These 39 comments were divided into seven categories based on what type of issue the comment
refers to. See the Figure 10 for details.
41.41% 38.38%
10.10%
4.04% 2.02%
4.04%
0.00%
5.00%
10.00%
15.00%
20.00%
25.00%
30.00%
35.00%
40.00%
45.00%
Very good Good Fair Poor Very poor I did not usethe Great
Kererū Countwebsite
Pe
rce
nta
ge
Respondent experience
User-friendliness of the GKC 2014 website

28
Figure 10. A graph showing the percentages of different categories of comments about the GKC 2014 website. The categories are
defined as follows:
Map and location = Comment relates to the functionality of the map and the process of adding a sighting location i.e. using the 'pin'
on the map.
Other technical = Comments related to all other technical issues.
Missing report = Respondent has made a report but unable to see it on the map, or unable to see other reports.
Can't remember = Respondent had some issues but can't remember exactly what.
Content = Comment relates to the questions on the website (about the kererū sighting), or the information available on the
website.
Photos = Comment relates to some issues with adding a photo on the website.
Registering = Respondent did not want to register to Thundermaps or download app.
Some respondent comments related to Maps and location below:
“It was hard to sort out the exact spot on the aerial mapping.”
“First step selecting location was not clear.”
“The mapping technology was difficult for me. And when I returned to make a second sighting I found it was
going to take me as long again so I gave up. Last year (I think) I noted lots of different sightings but this year
I couldn't be bothered with the hassle.”
There were also positive comments with regard to Maps and location:
“Awesome interactive map with report locations and details - loved it!”
“Interesting to see the spread of kererū on the map.”
Question 12: How would you rate the Great Kererū Count Thundermaps Mobile App in terms of user-
friendliness?
Over half of the respondents did not use the mobile app (Fig. 11), whereas only 4.04% did not use the GKC
website (Fig. 9).The total percentage of very good or good ratings for the mobile app was 31.54% and
approximately 7% of the respondents rated the mobile app very poor or poor (Fig. 11).
Map andlocation
Othertechnical
Missingreport
Can'tremember
Content Photos
Total 33.33% 23.08% 17.95% 12.82% 7.69% 5.13%
0.00%
5.00%
10.00%
15.00%
20.00%
25.00%
30.00%
35.00%P
erc
en
tage
Comment category

29
Figure 11. Survey respondents’ ratings of the user-friendliness of the GKC mobile app in percentages, e.g. 13.28% of the survey
respondents answered ‘Very good’.
Question 13: Please add any comments about the Great Kererū Count Thundermaps Mobile App
(optional).
38 comments regarding the GKC mobile app were made in total, with 25 of them indicating an issue with
the app. These 25 comments were divided into eight categories based on what type of issue the comment
refers to. See figure 12 for details.
Some comments about the app below:
“Need to be able to add a photo from file - by the time you get to the point of adding a photo in the app the
bird is gone, however could take the photo first then use the app and upload the photo.”
“Dreadful. Difficult to use. Am a frequent user of apps and found this one difficult to use and incomplete.”
“I am actually not certain that the map registered my kererū count.”
“When recording sightings it was really hard to navigate to the right place, and it was hard to tell whether
your sighting had been recorded. The messages were unclear and it almost put me off recording sightings.”
13.28%
18.26%
9.54% 5.39%
1.66%
51.87%
0.00%
10.00%
20.00%
30.00%
40.00%
50.00%
60.00%
Very good Good Fair Poor Very poor I did not usethe Great
Kererū CountThundermaps
Mobile App
Pe
rce
nta
ge
Respondent experience
User-friendliness of the GKC 2014 mobile app

30
Figure 12. A graph showing the percentages of the comments made regarding the mobile app. The categories are the same as for
the Fig. 10, except there is one more category: Unable to create a report = Respondent has been unable to send a report via mobile
app.
Question 14: What was your primary reason for participating in the Great Kererū Count? Please select
one reason only.
The three most popular answers were ‘Because I wanted to share my local kererū observations with
others’, ‘To contribute to science’ and ‘Because I am interested in birds’, forming almost 80% of the total
answers (Fig. 13).
Question 15: Which were additional factors for participating in the Great Kererū Count? Any number of
boxes can be ticked, or no boxes can be ticked.
The three most popular categories were the same as for the primary reason, forming over 60% of the total
answers. Figure 13 shows the total percentages for all categories both for primary reason and additional
factors. 3.96% of the respondents stated ‘Other’ as their primary reason, and 4.92% added ‘Other’ as an
additional factor for participating in GKC. Below are some reasons in the category ‘Other’:
“I love kererū and want to see their numbers increase.”
“To be part of something bigger than me and collectively contribute to a population estimate of kererū in
Wellington.”
“I am proud of having kererū in my backyard of one acre. I would like to see these birds viewed as our
treasures so I am keen to support anything that values and protects the.”
“To get my daughter interested in the environment.”
Othertechnical
Map andlocation
Unable tocreate areport
ContentMissingreport
Registering PhotosCan't
remember
Total 32.00% 20.00% 16.00% 12.00% 8.00% 4.00% 4.00% 4.00%
0.00%
5.00%
10.00%
15.00%
20.00%
25.00%
30.00%
35.00%P
erc
en
tage
Comment category

31
Figure 13. Survey respondents’ primary and additional reasons for participating in the GKC 2014 in percentages.
Question 16: Can you think of other benefits from having taken part in the Great Kererū Count?
41.91% responded ‘Yes’ and 37.76% responded ‘No’. The remaining 20.33% responded ‘I don’t know’.
Question 17: If you answered yes, what were those benefits?
99 comments were made in total. These were divided into 10 categories. The most comments were in the
category ‘Sharing knowledge and interest in birds and conservation’ (Fig. 14).
4.17%
3.79%
1.52%
7.95%
4.92%
4.55%
12.12%
22.73%
18.18%
20.08%
0.00%
0.00%
0.99%
2.97%
3.96%
4.95%
6.93%
23.76%
24.75%
31.68%
0.00% 5.00% 10.00% 15.00% 20.00% 25.00% 30.00% 35.00%
To learn more about science
As a reason to go outdoors more often
Other people who I know were doing it
As an educational experience
Other
I have participated before and wanted to do itagain
It sounded interesting or fun
Because I am interested in birds
To contribute to science
Because I wanted to share my local kererūobservations with others
Reasons for participating in the GKC 2014
Primary reason Additional factors

32
Figure 14. Graph showing the benefits that the survey respondents got as a result of participating in the GKC 2014. The frequency
of different answers in shown in percentages, e.g. 23.23% of the total comments made were in the category ‘Sharing knowledge
and interest in birds and conservation’. The comments have been categorised as follows:
Sharing knowledge and interest in birds and conservation = Participating was beneficial for the respondent because it provided a
way to share their knowledge and interest in birds and conservation with others.
Increased awareness of kererū and kererū conservation = The comment indicates that participating increased awareness of kererū
and how they can be helped.
Helping kererū = Benefit relates to the sense of being able to help kererū.
Contributing to science = The comment indicates that participating was beneficial because it gave a sense of contributing to
research and science.
Learning about distribution and numbers of kererū = Respondent found it beneficial to participate, because they learned something
about kererū distribution and numbers.
Learning about birds and nature in general = The benefit of participating was educational.
Enjoyment = Participating in GKC brought enjoyment.
Skills = Participating in GKC provided new skills, such as observational skills.
Outdoors = Participating in GKC was beneficial because the respondent spent more time outdoors.
Family time = The benefit relates to the opportunity to spend time with family.
Some of the respondent comments are included below:
“Spending quality time outdoors with family.”
“Improving my observational skills.”
“I think it will help the birds to survive, if people know where they are, and more people plant trees they can
feed on.”
2.02%
3.03%
5.05%
5.05%
6.06%
9.09%
10.10%
15.15%
21.21%
23.23%
Family time
Outdoors
Skills
Enjoyment
Learning about birds and nature in general
Contributing to science
Helping kererū
Increased awareness of kererū and kererūconservation
Learning about distribution and numbers of kererū
Sharing knowledge and interest in birds andconservation
Benefits of participating in the GKC 2014

33 “Has made me feel more connected to birds in general and Kererū in particular.”
“Just enjoying seeing them in my backyard, free and safe.”
“Highlighting to others the value of predator control. We utilise aerial 1080 every 3 years as part of our kiwi
conservation effort and others need to realise how valuable this is to ensure all our native species thrive.”
6.4 Public awareness and engagement
Question 18: How important is it for you that the data gathered from the Great Kererū Count will be used
in scientific research?
A great majority (over 90%) of the respondents consider it either very important or important, that the data
gathered from the GKC will be used in scientific research (Table 12).
Category Number of responses Percentage
Very important 157 65.15%
Important 66 27.39%
Neither Important nor Unimportant 14 5.81%
Somewhat important 3 1.24%
Not at all important 1 0.41%
Total 241 100.00%
Table 12. Survey respondents’ answers for Q. 18 ‘How important is it for you that the data gathered from the Great Kererū Count
will be used in scientific research?’ in numbers and percentages.
Question 19: In your opinion have kererū become more abundant, less abundant or stayed about the
same in your current region over the past three years?
The majority of the people (45.64%) thought that kererū numbers have stayed about the same in their
region over the past three years, and less than 10% thought that kererū have become more abundant (Fig.
15).
Figure 15. Graph showing the survey respondents’ opinions on kererū abundance in their current region over the past three years.
45.64%
27.39%
17.43%
9.54%
0.00%
5.00%
10.00%
15.00%
20.00%
25.00%
30.00%
35.00%
40.00%
45.00%
50.00%
About the same More abundant I don't know Less abundant
Pe
rce
nta
ge
Respondent answer

34 Question 20: Has your knowledge about the kererū and their ecological importance increased as a result
of your involvement in the Great Kererū Count?
The most common answer category for this questions was Yes, with almost half (47%) of the respondents
thinking that their knowledge about the kererū and their ecological importance has increased as a result of
their involvement in the GKC. See Table 13 for all the figures.
Category Number of responses Percentage
Yes 113 46.89%
No, as this is knowledge I already had before
participating in the Great Kererū Count
90 37.34%
No 29 12.03%
I don't know 9 3.73%
Total 241 100.00%
Table 13. Survey respondents’ answers for Q. 20 ‘Has your knowledge about the kererū and their ecological importance increased
as a result of your involvement in the Great Kererū Count? in numbers and percentages.
Question 21: Has your involvement in the Great Kererū Count raised your awareness of the threats to
kererū?
38.17% answered yes, and 12.45% answered no. Most respondents (47.72%) answered no, as they were
already aware of the threats to kererū before participating in the GKC. 1.66% of the respondents were
undecided.
Question 22: Has your involvement in the Great Kererū Count raised your awareness of the ways you
could help kererū to thrive in New Zealand?
The majority of the respondents were already aware of threat to kererū before participating in the GKC.
See Fig 16.
Figure 16. Survey respondents’ answers in percentages for Q.22 ‘Has your involvement in the Great Kererū Count raised your
awareness of the ways you could help kererū to thrive in New Zealand?’.
47.72%
38.17%
12.45%
1.66%
0.00%
10.00%
20.00%
30.00%
40.00%
50.00%
60.00%
No, as I was alreadyaware of the threats to
kererū beforeparticipating in the Great
Kererū Count
Yes No I don't know
Pe
rce
nta
ge
Respondent answer

35 Question 23: Have you taken any actions to help kererū thrive?
The majority of the respondents had either taken some actions to help kererū thrive (109 respondents) or
they were planning to (82 respondents) (Fig. 17).
Question 24: In your opinion, how important is conservation of kererū?
Most survey respondents consider conservation of kererū to be either very important or important and
none of the respondents had selected the answer category ‘Not at all important’ (Table 14).
Category Number of responses Percentage
Very Important 204 84.65%
Important 35 14.52%
Not at all Important 0 0.00%
Neither Important nor Unimportant 1 0.41%
Somewhat important 1 0.41%
Total 241 100.00% Table 14. Survey respondents’ answers for Q.24 ‘In your opinion, how important is conservation of kererū?’ in numbers and
percentages.
6.5 Future projects
Question 25: Would you consider participating in a similar citizen science project in the future?
92.12% of the respondents said that they would you consider participating in a similar citizen science
project in the future. One person said no, and 7.47% did not know.
Question 26: If you answered yes to the previous question, please tick any number of projects you would
consider participating in:
32.05% of the total 691 responses were bird projects, but other categories (pest, plant, insect) were also
popular (Table 15). If the ‘Other’- category was selected, the respondent could then specify. 16 comments
were made in total, and they included a variety of projects ranging from freshwater fish, sea mammal, bat,
seashore flora and fauna and reptile observations/monitoring to water quality and pollution monitoring.
45.23%
34.02%
20.75%
Have you taken action to help kererū?
Yes
No
Not yet, but I am planning to
Figure 17. Survey respondents’ answers in percentages for Q.23 ‘Have you taken action to help kererū thrive?’.

36
Citizen science project Number of
responses
Percentage
Bird observations or monitoring 221 32.05%
Pest mammal observations or monitoring 153 22.12%
Plant observations 166 24.04%
Insect observations 135 19.55%
Other 16 2.24%
Total 691 100.00%
Table 15. Other types of citizen science projects that GKC survey respondents would consider participating in.
7. DISCUSSION AND EVALUATION OF THE GREAT KERERŪ COUNT 2014 This discussion and evaluation of the GKC 2014 is based on the feedback and discussions with GKC partners,
the preliminary analysis of the GKC results, and the results of the GKC participant survey.
7.1 Promotion and communications
The GKC was promoted on GKC partners’ websites, e-newsletters and social media, on KCC magazine, and
locally at libraries, schools and Early Childhood Centres. The majority of the survey respondents had found
out about GKC from the Forest & Bird e-newsletter and Facebook page, forming over 30% of the total
answers (Table 9). It should be taken into consideration that the survey advertisement was done via Forest
& Bird Facebook page and therefore it is expected that people who follow Forest & Bird on Facebook would
have seen the GKC invitation, and the survey invitation, making the numbers high. However, it is also likely
that a large number of people who took part in the GKC are in fact Forest & Bird members, and would have
heard about the GKC via Forest & Bird channels.
The GKC increased its nationwide publicity this year with coverage on TV, newspapers and radio, which is
also indicated in the survey results, as 11.81% of the respondents had heard about the count via local
newspaper. All GKC parties agree that the promotion of the GKC 2014 was successful, and this is shown by
the almost seven-fold increase in report numbers from previous years’ counts.
While analysing the GKC Participant Survey results, it was discovered that some people had added their
kererū observations on NatureWatch instead of the GKC website or mobile app:
“I started using the Thundermaps App as directed by the website, but then found that NatureWatch was
also contributing to the project. I wish I'd known this as I use NatureWatch for my other observations and I
didn't find Thundermaps App that easy to use.” GKC Survey Respondent.
“I had difficulties using the app so used NatureWatch.” GKC Survey Respondent.
The confusion may have arisen because NatureWatch does have a page for the GKC, with a button ‘Add
observations to this project’. After a CSV of kererū reports was downloaded from the NatureWatch
webpage, it was discovered that 109 kererū reports were created in the system within the 14 day count
period. Not all of these reports had the information on the actual time when the observation was made,
but 32 sighting reports were confirmed by the reporter to have been made during the GKC 2014. These
kererū observations made on NatureWatch have not been included in the analysis as it was not known until
the survey comments were analysed that some participants had added observations to NatureWatch.

37 Therefore, potentially up to 109 kererū reports that could have been included in the analysis were excluded
because of unclear communications. To prevent this happening in the future counts, it would be best to
have only one designated place, where the reports can be added, or else make it clear to everyone that
there are two data entry points.
Some issues in relation to communications can arise because there are several partners. To prevent
miscommunications and double ups and to maximise promotional efforts, it is important to keep everyone
up to date with the process, for example, to have all parties to read over media release drafts (The Great
Kererū Count, 2014). It has also been discovered that pre-event media exposure and pre-event give-aways
seem to be an efficient way of promotion, so all GKC partners have agreed that more promotion could be
done prior to the GKC in the future (The Great Kererū Count, 2014).
7.2 Duration and timing of the count
As mentioned in the Background chapter, the timing of the count was different in 2014 compared to
previous years’ counts, and this is one of the reasons the 2014 data is analysed separately from 2012 and
2013 data. In 2012 and 2013 the count was run in March and in 2014 it was run in September. The change
in the timing was largely guided by the scientists on the wider team, and the two main reasons were:
1. As September is the beginning of the kererū breeding season, the birds are out and about and easy
to spot;
2. and because of this, the participants could have a chance to see kererū mating displays (T Stewart
2015, pers. comm., 9 February).
The least number of reports were made during the weekends (Fig. 3), perhaps because people are occupied
with other things during the weekends. The school holiday week from 26 September until 5 October had
less observations than the first week of the count. Suggested reasons for this could be that teachers may
have promoted the count and school groups did observations during school time, or people may have been
away from home during the holiday week. It is also possible that participants who were aware of the count
and wanted to participate, did so immediately once the count started, but stopped participating after
making a couple of reports. Or simply, the weather could have been worse during the second week,
stopping people from venturing outdoors.
Due to the option to report anonymously, it is not possible to confirm how many reports on average each
person submitted, or to see whether individual participants did more observations in the beginning of the
GKC. According to survey results, most participants would have made more than one report, with the mean
number of reports submitted per person = 4.97. The wide range of reports made (from 0 to 170) is
probably explained by the ambiguity of the survey question – some respondents may have understood that
the question was about the number of kererū sighted, not the number of reports (observations) made. This
could also explain the two zero observations reported. It is likely though that many participants did add
more than one report, and some comments also indicate that:
“I got into a real habit of recording them, that I had to remind myself that the count had finished - I'd be half
way down the hall to the computer for a couple of days before that sunk in.” GKC Survey Respondent.
The duration of the GKC is 14 days. When planning citizen science projects, consideration should be given
as to whether or not organisers/participants/funding bodies are being requested to make a long- or short-
term commitment in terms of time and resources (Donnelly et al., 2014). According to the survey results,

38 the majority of the respondents thought that the duration of the Great Kererū Count was about right (68%).
30% thought that the duration was too short, and only 2% thought it was too long. A shorter count time
can work well in some countries, e.g. one day count for the Great Koala Count in Australia, but can be risky
because of unpredictable New Zealand weather - if the weather is particularly bad, people would probably
not leave the house, and even if they did, the birds may be in hiding. However, with duration of the count
being two weeks, it may be impossible to estimate population numbers, as the same birds may have been
reported several times. This was also pointed out by GKC participants, who were wondering if they should
keep adding their reports about the same kererū:
“It was hard to know sometimes if the kererū I was seeing was the same as the day before. In this case I
didn’t count them twice when I thought they were the same as they live in their own area.” GKC Survey
Respondent.
If the aim of the GKC was to estimate population numbers, it may have been better to limit the duration of
the count to prevent participants from the counting the same kererū several times. But if the aim of the
GKC was to predict kererū distribution or habitat suitability, a longer time period would provide more
presence-absence data. In other words, the duration of the GKC should be decided based on the research
question and the overall aims of the GKC and this should be explained to the participants. However, a large
part of the kererū count is about education and raising awareness. If the count period was very short, then
that would reduce the time for educational opportunities, and most of the promotion would have to be
done prior to the start of the count. Also, two weeks allows enough time for participants to have a chance
to share their observations and photos on social media. The survey results suggest that sharing local kererū
observations are the primary reason for people to participate in the GKC (Fig. 13), so it is important that
participants feel that they have enough time to do so. In terms of public engagement, the two week period
seems appropriate. Participants could be encouraged to add any observations made outside the count
period to other crowdsourcing sites where they contribute to a wider knowledgebase.
7.3 Participant characteristics
Previously the GKC has been aimed at school-aged children through the Kiwi Conservation Club, and it was
called KCC Kererū Count. In 2014, the name was changed to the Great Kererū Count, and the event was
deliberately marketed as an event for all (T Stewart 2015, pers. comm., 14 January). The GKC 2014 data
suggests that the majority of the observers are adults, although almost as many people did not disclose
their age information (Table 2). The majority of the 241 survey respondents were also adults, and only a
small proportion (1.98%) were children (Fig. 8). The three most common age groups amongst the survey
respondents were 35-44, 45-54 and 55-64. This is an encouraging result from a local council perspective, as
these are the target age groups that WCC aims to get involved in volunteering and is a younger cohort than
their usual volunteer demographic. If people are already participating in volunteer citizen science projects,
they may also be more likely to get involved in other nature related volunteering or monitoring tasks. The
survey results also showed that people who participated in the GKC would consider participating in other
citizen science projects (Table 15).
A large portion of participants (44.13%) did not disclose their age (Table 2). The option to report
anonymously is slightly problematic, even though it does not affect the data itself. It is not possible to
confirm how many people participated in the GKC in total, how many reports each participant submitted,
or what proportion of the GKC participants completed the survey.

39 The kererū report numbers are not proportional to household numbers (Fig. 6 and Table 6). Most reports
per number of households were made in Otago and Tasman, with both regions having over 10 reports per
1,000 households. In comparison, Wellington region had 8.91 reports made per 1,000 households, and
Canterbury had only 1 report made per 1,000 households. Wellington region had the most reports in the
whole country, but because of the anonymous reporting the number of people participating is unknown.
Most survey respondents (33.33%) also did the majority of their kererū observations in the Wellington
region (Table 8). Similar results were found for the Garden Bird Survey, with especially high report returns
from Wellington in years 2008 and 2009, when The Dominion Post published the Garden Bird survey form
(Spurr, 2012). It is not possible to conclude whether the GKC results are due to:
a) Wellington region having more kererū, and/or
b) The GKC 2014 having more publicity in Wellington region, and/or
c) Some other reason why people from Wellington are more likely to participate in the GKC.
If, in fact, more people from Wellington region are participating in the GKC, it would be interesting to
identify why. It would also be interesting to see whether the trend continues in future GKCs. Meaningful
analysis must take into account the distribution of the human population of observers and how this
influences the perception of kererū distribution.
7.4 Participant Experiences and Outcomes for Individual GKC Participants
Most GKC survey respondents had either very good overall experience or good experience of participating
in the GKC 2014 (Table 10), and nearly all (96.68% survey respondents) said they would participate in the
GKC again (Q. 8). However, the GKC survey respondents were a self-selected group and not necessarily
representative of the GKC participants as a whole. There are two factors that need to be considered: 1. The
survey was sent out to the participants who had shared their contact details with the GKC 2014, which may
indicate that these are the people who felt most engaged with the project to start with. 2. Based on survey
results, many of the respondents consider conservation of kererū very important (Table 14), and they
appear to have had knowledge about kererū before they participated in the GKC (Q. 20-23), indicating that
the respondents are interested in conservation and environment.
Despite the positive response, many participants expressed their frustration with the issues they
experienced while participating in the GKC. The majority of the comments relating to the GKC website and
mobile app were made in regards to the functionality of the map and the process of adding a sighting
location i.e. using the 'pin' on the map, or other technical issues (Fig. 10 & Fig. 12). Comments made by the
survey respondents show that they are hoping these issues will be fixed in future counts:
“I'd probably give it one more try again next year, but if the website is still playing up, I won't bother after
that as it’s not very good research.” GKC Survey respondent.
“Making it easier to participate would encourage me. I watch the birds constantly anyway but the counting
process was hard for me.” GKC Survey respondent.
The survey results suggest that one of aims of the GKC 2014, ‘To educate New Zealanders about the
ecological importance of the kererū’ appears to have been fulfilled. Many GKC survey respondents gained
increased knowledge of kererū and their ecological importance, the threats to kererū, and how kererū can
be helped (Q. 20-22). Results also showed that majority of the respondents have either taken action to help
kererū, or are planning to (Fig. 17). Comments that GKC participants had made on their kererū sighting
reports also indicate that participants are taking action, or would like to help kererū and other birds:

40 “Spent four hours on predator control in the Te Puna Quarry Park - fabulous 88 acre community reserve - 17
years of replanting natives - but have never done predator control - I have kicked off a control program
about three months ago - place is full of possums, rats and probably stoats - but they are going to be
removed and we will get the birds back.” GKC participant.
“Was looking in rural garden surrounded by paddocks. Have native trees but never seen a wood pigeon.
Occasional bell bird but would love to encourage more native birds.” GKC participant.
It appears that participants like to observe birds in general, and if they did not see kererū they were happy
to share other observations:
“Went for a 3 hour walk through Fernhill Escarpment (Totara Forest) and the Landing in Albany. We saw
and heard lots of Tui and Eastern Rosella but no Kererū.” GKC participant.
“Saw lots of fantails, tuis and very friendly bellbirds, and a hawk but no kererū.” GKC participant.
In the future counts, participants should be advised to add their other bird observations, or kererū
observations that have been made outside the count, on NatureWatch or eBird, so that data can be used in
other projects. Encouraging participants to record observations of other animals or plants could also
provide a way to standardise the search efforts for kererū absence records, i.e. recording something else
provides confirmation that participants were searching for kererū in that area.
Most of the aims of the GKC relate to science, either producing ‘meaningful’ science or getting people
engaged with science. The second most popular reason for participating in the GKC was ‘To contribute to
science’ (Fig. 13), and 9.09% of comments for other benefits also indicated that participating was beneficial
because it gave a sense of contributing to research and science (Fig. 14). Evans et al. (2005) found similar
results for the Neighbourhood Nestwatch (NN) program in The United States: every NN participant that
completed the survey had selected ‘the desire to help out in an authentic research project’ as a reason for
participating (Evans et al., 2005). Although a citizen science project’s main goal may be related to
education, the participants need to know that their participation results in “real” science that leads to
analysis and publication (Dickinson & Bonney, 2012).
Despite these encouraging survey results in terms of participant experiences and engagement, it is
important to note that as there was no pre-GKC survey, the post-GKC survey results cannot be compared
with anything. As Druschke & Seltzer (2013) conclude, in order to find out whether the learning objectives
of a citizen science project are met, the researchers should survey citizen scientists before and after
participation. To quantify the education benefits, future GKCs should include pre- and post- GKC surveys.
The GKC 2014 participant survey was not part of the GKC’s project plan. The survey was initiated as a part
of this summer scholarship project for the WCC, and therefore it was sent out over 10 weeks after the
count had finished. Many of the survey respondents commented that the survey was sent out too late:
“Send out this survey a lot sooner so I can remember a bit better.” GKC Survey respondent.
“This survey would have been more appropriate closer to the time of the count. I have forgotten most of the
details of the count in the intervening weeks.” GKC Survey respondent.
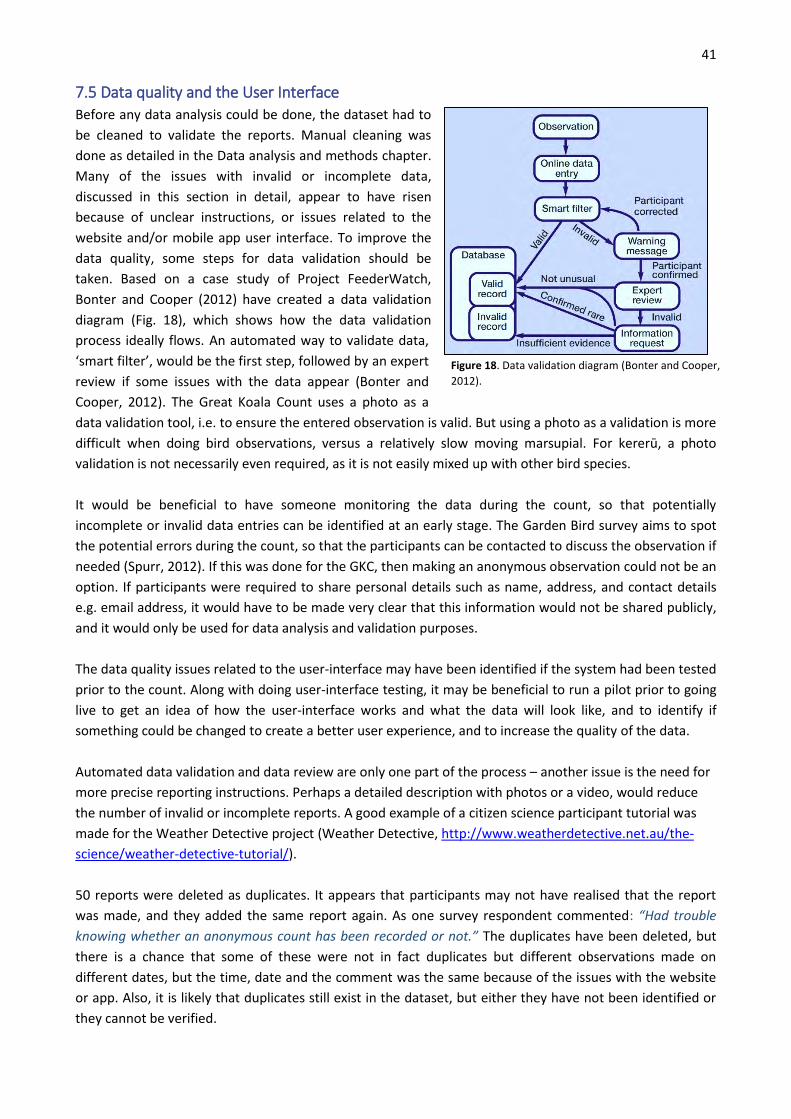
41
7.5 Data quality and the User Interface
Before any data analysis could be done, the dataset had to
be cleaned to validate the reports. Manual cleaning was
done as detailed in the Data analysis and methods chapter.
Many of the issues with invalid or incomplete data,
discussed in this section in detail, appear to have risen
because of unclear instructions, or issues related to the
website and/or mobile app user interface. To improve the
data quality, some steps for data validation should be
taken. Based on a case study of Project FeederWatch,
Bonter and Cooper (2012) have created a data validation
diagram (Fig. 18), which shows how the data validation
process ideally flows. An automated way to validate data,
‘smart filter’, would be the first step, followed by an expert
review if some issues with the data appear (Bonter and
Cooper, 2012). The Great Koala Count uses a photo as a
data validation tool, i.e. to ensure the entered observation is valid. But using a photo as a validation is more
difficult when doing bird observations, versus a relatively slow moving marsupial. For kererū, a photo
validation is not necessarily even required, as it is not easily mixed up with other bird species.
It would be beneficial to have someone monitoring the data during the count, so that potentially
incomplete or invalid data entries can be identified at an early stage. The Garden Bird survey aims to spot
the potential errors during the count, so that the participants can be contacted to discuss the observation if
needed (Spurr, 2012). If this was done for the GKC, then making an anonymous observation could not be an
option. If participants were required to share personal details such as name, address, and contact details
e.g. email address, it would have to be made very clear that this information would not be shared publicly,
and it would only be used for data analysis and validation purposes.
The data quality issues related to the user-interface may have been identified if the system had been tested
prior to the count. Along with doing user-interface testing, it may be beneficial to run a pilot prior to going
live to get an idea of how the user-interface works and what the data will look like, and to identify if
something could be changed to create a better user experience, and to increase the quality of the data.
Automated data validation and data review are only one part of the process – another issue is the need for
more precise reporting instructions. Perhaps a detailed description with photos or a video, would reduce
the number of invalid or incomplete reports. A good example of a citizen science participant tutorial was
made for the Weather Detective project (Weather Detective, http://www.weatherdetective.net.au/the-
science/weather-detective-tutorial/).
50 reports were deleted as duplicates. It appears that participants may not have realised that the report
was made, and they added the same report again. As one survey respondent commented: “Had trouble
knowing whether an anonymous count has been recorded or not.” The duplicates have been deleted, but
there is a chance that some of these were not in fact duplicates but different observations made on
different dates, but the time, date and the comment was the same because of the issues with the website
or app. Also, it is likely that duplicates still exist in the dataset, but either they have not been identified or
they cannot be verified.
Figure 18. Data validation diagram (Bonter and Cooper,
2012).

42 It appears that sometimes participants kept adding reports of the same kererū within a short time period.
This can skew the results, and it would be best to add clear instructions, e.g. ‘If you are confident you see
the same kererū within x time period, then only add one report’. Another issue that might have had an
effect on the final number of kererū observed is that the system did not have an option to add the exact
number of birds – you could only add the exact number of birds for up to 5, if there were more than that,
the participant would have to select a range of numbers (6-10, 11-20, 21-30 or 30 plus). For example, one
person reported 170 kererū with a photo validation, but this could not have been entered in the system.
Instead of having two separate questions (‘Did you see a kererū?’ and then asking how many if the answer
was Yes) it might be better to have one question, ‘How many kererū did you see?’. The answer box could
be an open text field so that any number can be added. If the number is above 10 for example, a photo
validation could be requested. This would also mean that, instead of “absence”, 0 (zero) could be added if
no kererū were seen. The data of the kererū numbers would then already be in a usable format, and it
would be easier to analyse kererū absence-presence data.
Because it was possible to proceed with the report without filling in all the fields, and it was possible to
post anonymously, in the dataset there are many fields that have been left blank. This results in incomplete
reports, with the information requested only partially filled. To avoid this in the future, it should not be
possible to skip sections when making the report.
When checking the data manually, comments about dead birds were discovered:
“Freshly dead, most likely hit by car or other vehicle. Also saw another dead kererū about 1km north of this
one in the previous week.” GKC Participant.
“We did not see the bird but we have kererū in our garden every day and yesterday (Thursday 25 Sep) found
the feathers of one killed a cat, probably when using our bird bath. Not the first killed by a cat in our garden,
but the first for 5 years. We don't have a cat.” GKC Participant.
“The kererū was dead on the veranda. I think it had flown towards the big glass plate window.” GKC
Participant.
All the observations that reported a dead bird have been deleted from final figures. One of the answer
categories for ‘Did you see a kererū?’ was ‘Yes- Other (add comments)’, therefore it is a fair assumption
that any observations could be added there. The fact that these reports had been added shows that the
instructions need to be clearer, and include advice of what to do if a dead kererū is found (i.e. contact local
DOC or National Banding Office if the bird is banded), and perhaps advise how to minimise threats to
kererū, such as applying window decals to prevent window strikes.
As discussed in the Data analysis and methods chapter, there was a default ‘pin’ location on the map,
however not all users realised they were supposed to move the pin, resulting in 315 records at the default
location, which was set to a location in central Wellington. A comment from a survey respondent sums up
the issue: “Didn't realise at first that the area kererū were seen in was supposed to be exactly identified with
the 'pin'. I thought the pin was just for the general area and specifics would then be given in text. Once I
realised my mistake I was unable to go back and edit my original 'pin point'.”

43 As the survey respondent pointed out, the instructions were not clear enough, and as there was no option
to go back and edit your report, a number of incomplete reports have probably been made. These aspects
lead to the following recommendations:
1. It should not be possible to submit a report without changing the default location first.
2. The default location on the map should not be a realistic location for a kererū report (in this
case, 12 Glenmore Street). Had the default location been in the ocean, the invalid points would
have been excluded from the total numbers while doing spatial analysis.
3. When there are several parties organising a project and handling the data, precise
documentation of the process, and sharing the knowledge, are essential.
4. Participants should not be anonymous: if participants had provided contact details, they could
have been contacted about the actual location. Some of these 315 reports could have
therefore been corrected for location information after the GKC.
5. There should be an option to edit your report at any stage.
One third of the survey respondents’ comments about the GKC website were made with regard to category
‘Map and location’. Based on comments both by GKC participants and the survey participants, there
seemed to have been problems with dragging and dropping the pin in the correct location.
“Map loaded slowly and I could not place my observation accurately.” GKC Survey Respondent. “I had real issues marking the spot I saw the observations.” GKC Survey Respondent. Seven reports were deleted because of invalid coordinates during the second data clean up, and a further
306 reports located outside the 16 regional areas were excluded for spatial analysis. Three hundred and
fifteen reports have incorrect coordinates (the default location), and there is still an unknown number of
reports with inaccurate coordinates in the dataset. Another way to increase the accuracy of the data and
reduce data clean up time could be a buffer around the mainland and islands, i.e. the participant could not
add a report location further than 1,000 metres from landmass. Also, instead of moving the pin on the map,
it may be better if the reporting system would automatically record the location of the report by using a
mobile phone’s GPS, or if the participant does not have a mobile phone, they could add the coordinates on
the website based on the address of the report location. There are several free websites and apps that can
transform addresses into coordinates, or this feature could also be integrated into the software. This may
appear more challenging for some participants, but if it was made clear that these steps are required to
ensure the data gathered will be useful for science, most people would be likely to accept this. As discussed
in the previous chapter, one of the main reasons people participate in GKC is to contribute to science, and
the majority of participants consider it important that data will be used in scientific research. To increase
the accuracy of the data for data analysis purposes, it is crucial that the issue of inaccurate report location
will be solved in future GKCs.
Some participants had included the total number of kererū in all their reports, if they saw more than one
kererū at the same time. This results in incorrect total numbers. There needs to be instructions for what to
do if a person sees more than one kererū, and the kererū are doing different things (one is eating, another
is flying), i.e. it would be best to report them separately. Another issue in relation to the sighting categories
is that participants might not actually know what a mating display looks like, for example? If these sighting
categories are still used in the future counts, perhaps they should include some explanations with photos or
videos, not only for educational purposes but to increase participants’ confidence in the accuracy of their
report.

44 A substantial proportion of all the reports (657 reports, 9.34%) were done outside the official count time
(Table 1), which implies that the instructions for the period of the count might not have been clear enough.
However, the actual times and dates of the observations may be different from the ones reported. The
system automatically showed the current time and date (i.e. when the report was entered, not necessarily
when the kererū was seen).By looking at the data and comment section it was obvious that a large number
of participants did not change the default time. For example, if someone made two separate observations,
which can be confirmed based on the comment, the number of birds, or latitude and longitude, the time of
the report was exactly the same. Some people had added the actual time on the comment section, along
with other information such as what the birds were doing and the location. It would have been too time
consuming to check and validate all the potentially invalid times and dates manually, and therefore it was
not done. Also, there was no way to verify the reports, because of the option to report anonymously. This is
an issue that may affect data analysis, and it is important to try to improve in the future. The comments
participants wrote indicate these issues with the user-interface:
“Can’t record time on the website?” GKC Participant.
“Slider for time didn't work on iPad.” GKC Participant.
“Can't work the time buttons - early afternoon on the day of the 17th September 2014. Just saw another
one on the 22nd in Chelsea View Drive early afternoon.” GKC Participant.
“Cannot make time work but it was about 1600 Sat 4 Oct, flying from lower Brooklyn to Aro Valley. A pair,
and sometimes 3, are resident in this area.” GKC Participant.
“Trying to put in 16.45 this aft. A Kererū was flying across Route One near Raumati towards the bush.” GKC
Participant.
“Can't write the time of the sighting above. Time 17.30 on Thursday 2nd October. A hawk was flying near
them. They were flying in the direction of where a pair has a nest. We think there is a second nest nearby as
we often see another adult sitting on the electricity wires near the pair.” GKC Participant.
The assumption should not be that everyone is technology savvy and knows intuitively how to use websites
and apps. The instructions for adding observations should be very clear. Some comments indicate that
participants may have been put off because of technical issues:
“I find your web page difficult to understand, I have trouble using the android to record the kererūs we see
daily.” GKC Participant.
“Don't like your survey! Can't make it work. Five Kererū. Three in Kōwhai tree playing. Two resting in a tree
each. At 6.20pm. Thursday 2nd October.” GKC Participant.
Newman et al (2012) have created recommendations (Fig. 19) of how to use technologies appropriately
and efficiently in citizen science projects.

45
Recommendations for Citizen Science Projects (Newman et al., 2012):
Choose appropriate technology for your participants
Evaluate new technologies with make-versus-buy and cost-benefit analyses, paying
particular attention to reliability.
Adopt well-established, well-documented, and well-supported technologies.
Consider interoperable, customisable, open-source solutions where possible.
Follow best practises and use standardised data-collection and data-management
protocols where available.
The first recommendation in the above figure is about choosing the appropriate technology for the
participants of the projects. For example the user-interface should probably be different if the majority of
the participants are primary schoolers versus groups of adults. As discussed in the chapter ‘Participant
characteristics’, the majority of the GKC participants appear to be adults, but a large proportion of the
participants did not disclose their age. In a situation where the demographics of the participants are not
clear, it is probably best to choose as “well-established, well-documented, and well-supported
technologies” (Newman et al., 2012).
7.6 Analysis of preliminary results of the GKC 2014 One of the aims of GKC according to KCC’s project plan is ‘to gather scientific data about the nationwide
distribution and population of kererū.’ After the GKC 2013, it was identified that the objectives and goals of
the count should be more refined (The Great Kererū Count, 2013). Despite this, no research question was
identified for the GKC 2014. In order to obtain useful scientific data when planning a citizen science project
(a factor also shown to be important to the participants), it is essential to have a hypothesis or research
question in mind, such as ‘how is X changing’ or ‘how is Y distributed’ (Silvertown, 2009). An example of a
citizen science project that has a simple and focussed question, is the Garden Bird Survey which collects
data to answer the question “Are common bird populations increasing or decreasing?”. There is a great
deal of potential in the data that participants are gathering for the GKC. If a more specific research question
is identified for future GKCs, it would then be possible to design and implement the data gathering process
to match the purpose.
For efficient management of conservation projects, description of a species’ geographical distribution or
use of habitats may be required (Pearce & Boyce, 2006). For example, species extinctions are more likely in
areas with low habitat suitability or in areas where species are less abundant, making appropriate species
distributions data important for conservation planning (Brotons et al., 2004). Traditionally presence-
absence data is used to model distribution or predict habitat suitability. There is a growing interest in
developing statistical models to utilise presence-only data, and it has been suggested that presence-only
records can provide insight into the vulnerability, historical distribution and conservation status of species,
but the approach depends on the quality of the presence-only data (Pearce & Boyce, 2006). According to
Brotons et al. (2004), if absence data is available, methods using presence-absence data rather than
presence-only data should be used in most situations when predicting bird habitat suitability. The GKC 2014
Figure 19. Recommendations for citizen science projects (Newman et al., 2012).

46 gave the participants the option to report kererū absence. Of the 6,372 reports made (all the reports made
during the count) only 335 reports were absence reports. Perhaps the importance of absence reports in
terms of GKC results was not emphasized enough. As one GKC survey respondent commented “I found I
had a tendency to report/participate in the count when I saw a kererū, rather than deliberately going out
and reporting (equally important) zero sightings. I suspect this would have been a common response
amongst participants, and might skew the overall results.” As discussed in the chapter Experiences and
Outcomes for Individual GKC Participants, one way to potentially increase the number of absence records,
and to provide a more standardised way of structuring search efforts, could be to encourage participants to
record observations of other animals and plants while searching for kererū.
Many absence reports were made in places where kererū had been previously seen and some included
comments which indicate that GKC participants feel that kererū numbers may be in decline in some areas:
“I've been talking to a lot of locals about kererū these past two weeks and they all say that they haven't
seen them for the past couple of years. The pair I spotted last week appear to be an anomaly...” GKC
participant.
“We are quite concerned as we are not observing any kererū at the moment. We normally do have visits due
to the remote location. We even rescued one last year and we could release it again after treatment. We do
have Kōwhai and tagasaste which they love. However, we do not see or hear them which is unusual and
sad: We miss them!” GKC participant.
“Unusually this year (as opposed to previous years) we have not had any backyard visits from our local
kererū. I have been looking for them every day both at home and on my walks around The Brook area and
haven't seen a single one.” GKC participant.
“I live on the eastern edge of Nelson and usually see kererū at this time of year amongst the Kōwhai, but
this year, I saw none.” GKC participant.
2014 was a beech mast year and the predator numbers may have increased as a result. While these
comments are not enough to show the decline in numbers, it will be interesting to compare the GKC 2014
data to the GKC 2015 numbers to see whether the numbers of presence-absence reports changes. Despite
several comments related to possible decline of kererū in some areas, most GKC survey respondents
thought that the numbers of kererū have either remained about the same in their regions over the last
three years, or the kererū numbers have increased (Fig. 15).
The instructions for adding an absence record may not have been clear enough, as some participants
thought that the time spent looking for kererū should not have been more than five minutes:
“The five-minute period for spotting kererū was frustrating because, although I live in an area of native bush
with fairly numerous kererū, it would be possible to choose a period when I wouldn't see any because it is of
such short duration. For this reason, my son and I walked around our property and through our bush and did
three separate five-minute observations. I'm sure people who are committed to this survey would be happy
to watch for at least 10 minutes, to get an accurate count.” GKC Survey respondent.

47 For kererū distribution and abundance estimation purposes, not all absence reports are equal. For example,
looking for kererū for 5 minutes and not seeing one, is quite different from not having seen kererū for ten
years, or not seeing one ever:
”Have not seen a kererū for about ten years. At that time, just one passing through. I have planted heaps of
puriri and karaka for them but they have not arrived yet. I live in hope.” GKC participant.
“I've lived here for 30 years and never seen a kererū. Not ever.” GKC participant.
Perhaps there could be different categories for absence that would reflect the nature of the absence report
more appropriately, and also emphasize the importance of these observations within the whole data set.
Wellington is a ‘green city’, with 498 park and reserve areas and extensive pest control. The spatial analysis
showed that nearly all (99.64%) kererū presence reports were made within 500 metres of parks, reserves
and pest controlled areas. McCaffrey concludes in her paper ‘Using Citizen Science in Urban Bird Studies’
(2005) that results from studies based on citizen science data can be invaluable in identifying key areas of
ecological importance within a city. Most kererū presence reports in the Wellington City were made in
Karori, and the most kererū were also sighted there (Fig. 7). Notably, Zealandia sanctuary is situated in
Karori, but Karori is also Wellington’s (and New Zealand’s) largest suburb (Wellington City Library, 2014).
Kererū have historically been sighted around Otari-Wilton’s Bush and were re-introduced to Zealandia
sanctuary in years 2002-2005; since then their numbers have increased to the extent that they are often
seen foraging outside the sanctuary in the neighbouring suburbs (Zealandia, 2014).
It is becoming increasingly important to determine how populations of native wildlife can be sustained in
ever-expanding urban areas, and the data produced by citizen science may be crucial in doing so
(McCaffrey, 2005). The majority of the kererū presence reports in Wellington City were made in built-up
areas, followed by native forest remnants and other indigenous forest, implying that kererū appear to be
fairly common in residential areas, at least in Wellington city. Many GKC participant also indicated in their
comments that kererū have taken a liking to their gardens and especially the exotic fruit trees such as plum
and pear (Table 4), although it appears that native plants are still favoured by kererū with a native species
name being mentioned 808 times (Table 5) versus exotic plant names being mentioned 582 times (Table 4).
‘Eating’ was the second most common sighting category with 24.70% of the reports indicating that the bird
was eating something. Participants were able to leave a comment about what the bird was eating in an
open text field. 4,284 comments were made in total, and they were not categorised in any way during the
data gathering. As there were no instructions describing what to write, and it was an open text field, there
is a great deal of variation among the comments. For example, this comment section includes participants’
addresses and contact details, their experiences of the GKC, estimates of kererū numbers, and descriptions
of what the bird was doing or eating. To identify the plant species that participants had seen kererū feeding
on, key words were searched for in the Excel data sheet. The search function for key words is likely to have
caused incomplete figures; for example, searching for a word ‘Kōwhai’ brought up 480 hits, but because
comments were not then checked manually, it is unknown whether these comments also included
addresses and place names, and whether the bird was actually eating this particular plant, or just perching
on it or flying over etc. Another problem is that if the participant had spelled the plant species name
incorrectly, it would not have been found with the search.

48 From a local council’s point of view, the information on the plant species that kererū are feeding on is very
useful. A large portion of kererū reports are made in people’s backyards and suburban areas, and the
information on what kererū are feeding on could be used to encourage people to plant natives in their
gardens. Also, this information could be used by local councils and conservation groups in decision making,
e.g. what species to plant to encourage more kererū in the area. Instead of an open text field for comments
it may be more useful to have a list of plants (with images) that the participant can select by ticking boxes.
This would reduce the data analysis time and increase the quality of the reports, and it would be also be an
educational experience for the participants, especially if the plant species were accompanied with a photo
for identification purposes.
8. RECOMMENDATIONS FOR FUTURE KERERŪ COUNTS The following recommendations are based on the preliminary analysis of the GKC data, meeting minutes
(involving all the GKC Partners), discussions with the GKC key people, literature cited in the report, and the
GKC participant survey results, discussed in more detail above.
1. A specific research question or hypothesis should be identified prior to designing and delivering the
GKC. Based on the research question or the hypothesis the following points can then be
considered:
The duration and timing of the GKC should be determined by the research question
(currently set to two weeks in September-October), and only the observations made in the
GKC period should be included in the data analysis. Observations made during any other
times can be added to NatureWatch or eBird, where they contribute to a wider
knowledgebase and potentially to other research projects.
Any sighting categories that do not contribute to the research question should be
removed, i.e. if it is not required to know what the bird is doing, e.g. flying, then there is no
need to gather this information.
2. If kererū absence data is gathered, depending on the research question the following aspects
should be considered:
Search effort should be more standardised to provide more accurate absence data. For
example, the period of searching for kererū should always be the same length. Or, there
should be clear categories to reflect the nature of the absence report, as not seeing kererū
for five minutes or not seeing one ever are not equal observations.
Encouraging participants to record other plant or animal observations could be used as a
way to ascertain where people are active participants, but not observing kererū.
3. Collaboration with universities throughout the project would enable input into the research design,
delivery and analysis. Universities can also utilise student capacity (e.g. honours research projects,
summer scholars, masters students) to carry out initial data analysis within a larger research
framework.
4. Communications and documenting the process must be clear when there are multiple partners
involved in the project. To ensure maximum efficiency and reliability of the data, it may be
beneficial to hire a primary investigator/data analyst, who is involved in all the steps of the data
collection, clean up and analysis.

49
5. There should be only one designated entry point, or if there are several entry points that should be
made clear to both the participants and the GKC partners.
6. Anonymous reporting should ideally not be an option. Participants should at least leave a name and
email so that they can be contacted if there is something unclear about their report.
7. As it is important for the participants that the data will be used for science, the data and outcomes
from the study should be reported back to the participants as a standard part of the programme –
this provides an additional incentive for participants to provide contact details, to demonstrate the
scientific process and scientific validity of the project, to share research outcomes, and to recruit
observers for future studies.
8. A small pilot should be run prior to the annual event, to test for software bugs or any issues with
the user interface. This could be tested by students and/or council employees so as to not lose the
support and enthusiasm of potential GKC participants.
9. To increase the accuracy of the kererū observation locations, there should either be:
No default location at all, e.g. the participant would have to enter in the coordinates, or the
mobile app should record the coordinates based on the current location, or,
a clear “null” default location for the report on the sighting map, such as the middle of the
ocean.
10. While submitting a kererū report, it should not be possible to move forward without confirming:
That the report location is correct.
That the time when the observation was made is correct.
That all the required fields have been filled. It should also be possible for participants to
edit their report at any time in case they realise they have made an error.
11. The instructions for adding reports need to be clearer in order to avoid inconsistent, invalid and/or
incomplete reports, to minimise manual data cleaning, and to ensure all reports are submitted to
the same database. To increase participants’ confidence in the accuracy of their reports and to gain
full educational benefits, the instructions should be as detailed as possible, and they could be
accompanied with videos and photos. Depending on the research question the following steps
could be taken:
Instructions need to cover unexpected issues such as what to do if a dead kererū is found.
Instruction should advise what to do if the participant is confident that they see the same
kererū within a short period of time, i.e. the bird should not be reported twice. Or, if
participants observe more than one kererū and the kererū are doing different things, i.e.
one is flying, another one is eating, the total number of birds should not be submitted
multiple times.
12. Support data such as details about plants, feeding patterns, or other observations of relevance to
the research question needs to be included in a defined manner (not as an open text field), such as
multiple answer or checkbox, e.g. list of plants with images. There should only be one open text
field at the end of the survey for additional comments and feedback.

50
13. Data validation needs to be automated, at least the very first step of it (rather than manually going
through every observation). Any data flagged ‘incomplete’ by the automated process could then be
manually checked.
14. Data should be monitored during the count to identify incomplete reports and potential real-time
issues as well as to contact participants (if they have granted permission for this) about suspected
data errors. This could also be coupled with a real-time discussion forum where participants can
submit queries during the project.
15. To find out if the education goals of the GKC are met, and to learn about the participant
experiences and how the GKC can be improved, pre- and post- GKC survey should be implemented.
To ensure that the number of potential survey respondents is maximised and that the answers they
provide are as accurate as possible, the post GKC survey should be designed and developed prior to
the end of the GKC, so it can be sent out to participants as soon as the GKC finishes.
9. CONCLUSION Overall, it seems that the GKC 2014 was a success in terms of participant experiences and individual
outcomes. The survey respondents learned more about kererū, its ecological importance, and how kererū
can be helped; many respondents are taking action to help kererū thrive; and most respondents had either
very good or good experience of the GKC, and they would participate again. Two survey results are
especially interesting in terms of WCC’s goals to get more people involved in nature related volunteering or
monitoring tasks: 92.12% of the respondents said that they would you consider participating in other
citizen science projects in the future, and the majority of the survey respondents are within the age groups
that WCC aims to get involved in volunteering. The survey respondents were a self–selected group, and
therefore may not be a fully representative sample of the GKC 2014 participants. It is possible that
participants who felt most engaged with the GKC 2014 chose to respond to the survey, as these were likely
to be the participants who had initially shared their contact details with the GKC 2014. This should be taken
into consideration when viewing the results of the survey and conclusions of this report.
The kererū presence-absence dataset was affected by high occurrence of duplicate reports, incorrect report
locations and report times, several incomplete reports and the inability to verify them due to anonymous
reporting option. These issues were mainly caused by the design and functionality of the user interface that
was used for data gathering. The need for more precise reporting instructions was also clear. In addition,
the lack of a clear scientific research question – or mechanism and funding to analyse the data – led to a
high likelihood that this data was primarily a public engagement exercise with no scientific outputs. This is a
problem not only from a scientific perspective, but also because a significant proportion of survey
respondents (24.75%) indicated that contributing to scientific research was the main reason for them
participating in the GKC 2014, and they considered it very important that the data gathered will be used
scientifically. Ensuring the scientific value of the project is therefore critical in order to deliver on public
engagement goals, and ensure ongoing support and participation in citizen science activities. It is therefore
crucial that a more specific research question is identified and integrated into future GKCs, so that the
data gathering process can be designed to match the purpose, the GKC participants can be confident of
contributing to excellent research, and that the potential that lies within a large nationwide kererū
presence-absence dataset can be fully utilised.

51 Judging by the high number of kererū reports made in 2014, and the positive GKC participants survey
result, the public is ready to engage with science – but in order to do so, the science must be an integral
part of a citizen science project. If a citizen science project is well planned and executed, it has the potential
to increase the awareness of environmental issues among the public and provide chances for learning and
new experiences. If the data quality of the GKC can be improved by addressing the issues detailed in this
report, the GKC could benefit local councils by providing information on kererū distribution and numbers,
suitable habitats, and by providing evidence of their pest control efforts. There are many areas in the fields
of ecology and conservation where citizen science could be used in New Zealand and in Wellington, and the
recommendations created based on the lessons learned from the GKC 2014 could be applied to other
citizen science projects.

52
References BONNEY, R., COOPER, C. B., DICKINSON, J., KELLING, S., PHILLIPS, T., ROSENBERG, K. V. & SHIRK, J. 2009. Citizen Science: A
Developing Tool for Expanding Science Knowledge and Scientific Literacy. Bioscience, 59, 977-984.
BONTER, D. N. & COOPER, C. B. 2012. Data validation in citizen science: a case study from Project FeederWatch. Frontiers in Ecology and the Environment, 10, 305-307.
BROTONS, L., THUILLER, W., ARAÚJO, M.B. & HIRTZEL, A.H. 2004. Presence–absence versus presence-only modelling methods for predicting bird habitat suitability. Ecography, 27, 437–448.
COHN, J. P. 2008. Citizen Science: Can Volunteers Do Real Research? BioScience, 58, 192-197.
CORNELL LAB OF ORNITHOLOGY 2014, What is Citizen Science and PPSR?. Available from: http://www.birds.cornell.edu/citscitoolkit/about/defining-citizen-science/. Accessed on 1 December 2014.
CRONJE, R., ROHLINGER, S., CRALL, A. & NEWMAN, G. 2011. Does Participation in Citizen Science Improve Scientific Literacy? A Study to Compare Assessment Methods. Applied Environmental Education & Communication, 10, 135-145.
DEPARTMENT OF CONSERVATION 2014, New Zealand pigeon/ kererū/kūkū/kukupa. Available from: http://www.doc.govt.nz/conservation/native-animals/birds/birds-a-z/nz-pigeon-kererū/. Accessed on 17 November 2014.
DICKINSON, J. L. & BONNEY, R. 2012. Overview of Citizen Science. In: Dickinson, J. L & Rick Bonney (eds.) 2012. Citizen Science: Public Participation In Environmental Research, Comstock Publishing Associates, Ithaca, United States, pp. 19-26.
DICKINSON, J. L., ZUCKERBERG, B. & BONTER, D. N. 2010. Citizen Science as an Ecological Research Tool: Challenges and Benefits. In: FUTUYMA, D. J., SHAFER, H. B. & SIMBERLOFF, D. (eds.) Annual Review of Ecology, Evolution, and Systematics, Vol 41.
DONNELLY, A., CROWE, O., REGAN, E., BEGLEY, S. & CAFFARRA, A. 2014. The role of citizen science in monitoring biodiversity in Ireland. International Journal of Biometeorology, 58, 1237-1249.
EVANS, C., ABRAMS, E., REITSMA, R., ROUX, K., SALMONSEN, L. & MARRA, P. P. 2005. The Neighborhood Nestwatch Program: Participant Outcomes of a Citizen-Science Ecological Research Project. Conservation Biology, 19, 589-594.
FOREST & BIRD 2014, National kererū survey needs Kiwis’ help. Available from: http://www.forestandbird.org.nz/what-we-do/publications/media-release/national-kerer%C5%AB-survey-needs-kiwis%E2%80%99-help. Accessed on 28 November 2014.
HEATHER, B.D. & ROBERTSON, H.A. 2005. The field guide to the birds of New Zealand. Viking, Auckland.
LANDCARE RESEARCH 2014, Garden Bird Survey. Available from: http://www.landcareresearch.co.nz/science/plants-animals-fungi/animals/birds/garden-bird-survey. Accessed on 17 November 2014.
MANDER, C. J., HAY, R. & POWLESLAND, R. 1998. Monitoring and management of kererū (Hemiphaga novaeseelandiae). DEPARTMENT OF CONSERVATION TECHNICAL SERIES No. 1 Wellington, N.Z.
MCCAFFREY, R. E. 2005. Using Citizen Science in Urban Bird Studies. Urban Habitats, 3 (1). 70-86.
NEWMAN, G., WIGGINS, A., CRALL, A., GRAHAM, E., NEWMAN, S. & CROWSTON, K. 2012. The future of citizen science: emerging technologies and shifting paradigms. Frontiers in Ecology and the Environment, 10, 298-304.
PEARCE, J. L. and BOYCE, M. S. 2006. Modelling distribution and abundance with presence-only data. Journal of Applied Ecology, 43: 405–412.
SCOFIELD, P. & STEPHENSON, B. 2013. Birds of New Zealand: A Photographic Guide. Auckland University Press, Auckland.
SEQUEIRA, A. M. M., ROETMAN, P. E. J., DANIELS, C. B., BAKER, A. K. & BRADSHAW, C. J. A. 2014. Distribution models for koalas in South Australia using citizen science-collected data. Ecology and Evolution, 4, 2103-2114.
SHIRK, J. L., BALLARD, H. L., WILDERMAN, C. C., PHILLIPS, T., WIGGINS, A., JORDAN, R., MCCALLIE, E., MINARCHEK, M., LEWENSTEIN, B. V., KRASNY, M. E. & BONNEY, R. 2012. Public Participation in Scientific Research: a Framework for Deliberate Design. Ecology and Society, 17.
SILVERTOWN, J. 2009. A new dawn for citizen science. Trends in Ecology & Evolution, 24, 467-471.

53
SPURR, E. B. 2012. New Zealand Garden Bird Survey - analysis of the first four years. New Zealand Journal of Ecology, 36, 287-299.
UNIVERSITY OF SOUTH AUSTRALIA 2012, The Great Koala Count. Available from: http://www.unisa.edu.au/Research/Barbara-Hardy-Institute/Past-Key-Projects1/The-Great-Koala-Count/. Accessed on 19 December 14.
THE GREAT KERERŪ COUNT. 2014. Forest & Bird and Kererū Discovery, Great Kererū Count 2014 Debrief 1 Summary. (19 November 2014).
THE GREAT KERERŪ COUNT. 2013. Forest & Bird, Great Kererū Count 2013 Summary. (Date unknown).
TRUMBULL, D. J., BONNEY, R., BASCOM, D. & CABRAL, A. 2000. Thinking scientifically during participation in a citizen-science project. Science Education, 84, 265-275.
WELLINGTON CITY LIBRARY 2014, Heritage > Karori. http://www.wcl.govt.nz/heritage/karori.html. Accessed on 27 January 2014.
WOTTON, D. M. 2007. Consequences of dispersal failure: kererū and large seeds in New Zealand. A thesis submitted in fulfilment of the requirements of a Doctor of Philosophy School of Biological Sciences, University of Canterbury.
WWF 2014, Great Kererū Count Takes Flight. Available from: http://www.wwf.org.nz/?12221/Great-Kererū-Count-takes-flight. Accessed on 28 November 2014.
ZEALANDIA 2014, Kererū / Wood pigeon, NZ. http://www.visitzealandia.com/species-member/ kererū/. Accessed on 27 January 2014.

54
APPENDIX A
Map of eBird Kererū reports

55
APPENDIX B
Kererū presence reports and number of kererū sightings in Wellington City Suburb Number of presence
reports made Percentage Number of kererū
observations made Percentage
Karori 99 17.93% 204 20.16%
Wilton 90 16.30% 181 17.89%
Ngaio 80 14.49% 137 13.54%
Khandallah 48 8.70% 80 7.91%
Crofton Downs 35 6.34% 49 4.84%
Tawa 30 5.43% 47 4.64%
Kelburn 26 4.71% 42 4.15%
Northland 23 4.17% 42 4.15%
Mount Victoria 22 3.99% 36 3.56%
Wadestown 15 2.72% 31 3.06%
Aro Valley 12 2.17% 17 1.68%
Highbury 10 1.81% 18 1.78%
Brooklyn 8 1.45% 12 1.19%
Wellington Central
7 1.27% 19 1.88%
Newlands 6 1.09% 14 1.38%
Mount Cook 5 0.91% 9 0.89%
Paparangi 4 0.72% 6 0.59%
Broadmeadows 3 0.54% 10 0.99%
Johnsonville 3 0.54% 6 0.59%
Ohariu 3 0.54% 4 0.40%
Newtown 3 0.54% 12 1.19%
Miramar 3 0.54% 6 0.59%
Thorndon 2 0.36% 2 0.20%
Kaiwharawhara 2 0.36% 4 0.40%
Island Bay 2 0.36% 2 0.20%
Makara 2 0.36% 9 0.89%
Horokiwi 2 0.36% 3 0.30%
Ngauranga 1 0.18% 3 0.30%
Churton Park 1 0.18% 1 0.10%
Karaka Bays 1 0.18% 1 0.10%
Te Aro 1 0.18% 2 0.20%
Lyall Bay 1 0.18% 1 0.10%
Owhiro Bay 1 0.18% 1 0.10%
Vogeltown 1 0.18% 1 0.10%
Total 552 100.00% 1012 100.00%

56
APPENDIX C
Copy of the information sheet and survey questions
The Great Kererū Count 2014: Participant Survey
Welcome to the Great Kererū Count participant survey and thank you for taking part! This survey will help
us to evaluate and improve the Great Kererū Count. Response to this survey is voluntary and anonymous.
The survey will require no more than 5-10 minutes to complete. Information collected during this survey
will not be used to identify individuals.
Data collected during this survey will be used to help to assess how the Great Kererū Count and other
citizen science projects could be promoted and run. The data will be shared with the Great Kererū Count
partners; Forest & Bird's Kiwi Conservation Club (KCC) and Kererū Discovery (a partnership between WWF-
New Zealand and WCC). The results of this survey will be part of a written report produced for the WCC and
may form part of an academic publication researching the use of citizen science. It will not be possible to
identify participants from the data or from any written reports or publications.
This project has been approved by the Victoria University of Wellington’s Human Ethics Committee.
Participants are free to withdraw from the research project at any stage without affecting their status now
or in the future. Information collected during this survey will not be used to identify individuals. We will
take every care to remove from responses any identifying material as early as possible. Likewise individual's
responses will be kept confidential by the researcher and will not be identified in the reporting of the
research. However, the researcher cannot guarantee the confidentiality or anonymity of material
transferred by email or the Internet.
The data will be stored on servers in secure facilities at Victoria University of Wellington. It will be stored
for no more than 5 years. This length of time will allow the analysis of the data and publication of results,
and to respond to any queries about the outcomes of the project. If you have any questions or concerns
about this survey, please contact Anni Brumby ([email protected]) or Dr Rhian Salmon
([email protected]). By clicking "Continue" you are indicating that you consent to participate in this
study.

57
1 What is your age?
Under 12 years old (1)
12-17 years old (2)
18-24 years old (3)
25-34 years old (4)
35-44 years old (5)
45-54 years old (6)
55-64 years old (7)
65-74 years old (8)
75 years or older (9)
2 I identify my gender as…
Male (1)
Female (2)
Fill in the blank: (3) ____________________
Prefer not to disclose (4)
3 How did you find out about the Great Kererū Count? Any number of boxes can be ticked.
Forest & Bird Facebook page (1)
Forest & Bird website (2)
Kiwi Conservation Club (KCC) website (3)
Wild Things (KCC magazine) (4)
Kererū Discovery Facebook page (5)
TV (6)
Radio (7)
Friends/family/colleagues (8)
Forest & Bird e-newsletter (9)
KCC e-newsletter (10)
School/Early Childhood Centre (11)
Library (12)
Poster (13)
Local newspaper (14)
WWF-New Zealand (16)
Other - please specify: (15) ____________________
4 How many observations did you record in total (approximately)?
Add any number: (1) ____________________
I don't remember (2)

58 5 In which region did you do most of your kererū observations?
Northland (1)
Auckland (2)
Waikato (3)
Bay of Plenty (4)
Gisborne (5)
Hawke's Bay (6)
Taranaki (7)
Manawatu-Wanganui (8)
Wellington (9)
Marlborough (10)
Nelson (11)
Tasman (14)
West Coast (12)
Canterbury (13)
Otago (15)
Southland (16)
6 How would you rate the Great Kererū Count website in terms of user-friendliness?
I did not use the Great Kererū Count website (1)
Very good (2)
Good (3)
Fair (4)
Poor (5)
Very poor (6)
7 Please add any comments about the Great Kererū Count website (optional):
8 How would you rate the Great Kererū Count Thundermaps Mobile App in terms of user-friendliness?
I did not use the Great Kererū Count Thundermaps Mobile App (1)
Very good (2)
Good (3)
Fair (4)
Poor (5)
Very poor (6)
9 Please add any comments about the Great Kererū Count Thundermaps Mobile App (optional):

59 10 What was your primary reason for participating in the Great Kererū Count? Please select one reason
only.
To contribute to science (1)
To learn more about science (2)
It sounded interesting or fun (3)
Because I wanted to share my local kererū observations with others (4)
As an educational experience (5)
As a reason to go outdoors more often (6)
Because I am interested in birds (7)
I have participated before and wanted to do it again (8)
Other people who I know were doing it (9)
Other - please specify: (10) ____________________
11 Which were additional factors for participating in the Great Kererū Count? Any number of boxes can be
ticked, or no boxes can be ticked.
To contribute to science (1)
To learn more about science (2)
It sounded interesting or fun (3)
Because I wanted to share my local kererū observations with others (4)
As an educational experience (5)
As a reason to go outdoors more often (6)
Because I am interested in birds (7)
I have participated before and wanted to do it again (8)
Other people who I know were doing it (9)
Other - please specify: (10) ____________________
12 Can you think of other benefits from having taken part in the Great Kererū Count?
Yes (1)
No (2)
I don’t know (3)
Answer If Can you think of other benefits from having taken part in the Great Kererū Count? Yes Is Selected
13 If you answered yes, what were those benefits?
14 Has your knowledge about the kererū and their ecological importance increased as a result of your
involvement in the Great Kererū Count?
Yes (1)
No (2)
No, as this is knowledge I already had before participating in the Great Kererū Count (3)
I don't know (4)

60 15 In your opinion have kererū become more abundant, less abundant or stayed about the same in your
current region over the past three years?
More abundant (1)
About the same (2)
Less abundant (3)
I don't know (4)
16 In your opinion, how important is conservation of kererū?
Very Important (1)
Important (2)
Neither Important nor Unimportant (3)
Somewhat important (4)
Not at all Important (5)
17 Has your involvement in the Great Kererū Count raised your awareness of the threats to kererū?
Yes (1)
No (2)
No, as I was already aware of the threats to kererū before participating in the Great Kererū Count (3)
I don't know (4)
18 Has your involvement in the Great Kererū Count raised your awareness of the ways you could help
kererū to thrive in New Zealand?
Yes (1)
No (2)
No, as I was already aware of the different ways you can help kererū to thrive before participating in
the Great Kererū Count (3)
I don't know (4)
19 Have you taken any actions to help kererū thrive?
Yes (1)
No (2)
Not yet, but I am planning to (3)
20 How important is it for you that the data gathered from the Great Kererū Count will be used in scientific
research?
Very important (1)
Important (2)
Neither Important nor Unimportant (3)
Somewhat important (4)
Not at all important (5)

61 21 Did you think the duration of the Great Kererū Count (2 weeks) was:
Too long (1)
About right (2)
Too short (3)
22 How would you rate your overall experience of participating in the Great Kererū Count?
Very good (1)
Good (2)
Fair (3)
Poor (4)
Very poor (5)
23 Based on your experience of the Great Kererū Count 2014, would you participate in the Great Kererū
Count again in 2015?
Yes (1)
No (2)
I don't know. (3)
24 Please share any other comments or suggestions about your experience with the Great Kererū Count.
25 Would you consider participating in a similar citizen science project in the future?
Yes (1)
No (2)
I don't know (3)
Answer If Would you consider participating in a similar citizen science project in the future? Yes Is Selected
26 If you answered yes to the previous question, please tick any number of projects you would consider
participating in:
Bird observations or monitoring (not kererū, but another New Zealand native bird) (1)
Pest mammal observations or monitoring (2)
Plant observations (3)
Insect observations (4)
Other - please specify: (5) ____________________

62
APPENDIX D
A list of useful citizen science websites, reports and special issues
Report about environmental citizen science:
Science Communication Unit, University of the West of England, Bristol (2013). Science for
Environment Policy In-depth Report: Environmental Citizen Science. Report produced for the
European Commission DG Environment, December 2013. Available at:
http://ec.europa.eu/environment/integration/research/newsalert/pdf/IR9_en.pdf
A book about environmental citizen science:
Janis L. Dickinson and Rick Bonney (eds.) 2012, Citizen Science: Public Participation In
Environmental Research, Comstock Publishing Associates, Ithaca, United States.
Special issue on citizen science:
Frontiers in Ecology and the Environment: Available at: http://www.esajournals.org/toc/fron/10/6
Citizen science toolkits and design models:
A comprehensive citizen science online toolkit by the Cornell Lab of Ornithology. Available at:
http://www.birds.cornell.edu/citscitoolkit/toolkit
Public Participation in Scientific Research: Converging on Effective Design Strategies: Available at:
http://www.birds.cornell.edu/citscitoolkit/conference/ppsr2011/workshop-
posters/Shirk%20et%20al%202011%20Framework%20for%20effective%20design%20POSTER.pdf