evaluation of test/analysis correlation methods for …mln/ltrs-pdfs/nasa-2001-57ahs-khl.pdf1...
TRANSCRIPT

1
Evaluation of Test/Analysis Correlation Methods for Crash Applications
Karen H. [email protected]
NASA Langley Research Center, Hampton, VALindley W. Bark
[email protected], Costa Mesa, CA
Karen E. [email protected]
US Army Vehicle Technology Directorate, Hampton, VA
AbstractA project has been initiated to improve crash
test and analysis correlation. The work in this paperconcentrated on the test and simulation results for afuselage section. Two drop tests of the section wereconducted. The first test was designed to excite thelinear structural response for comparison with finiteelement modal analysis results. The second test wasdesigned to provide data for correlation with crashsimulations. An MSC.Dytran model was developed togenerate nonlinear transient dynamic results. Followingminor modifications, the same model was executed inMSC.Nastran to generate modal analysis results. Theresults presented in this paper concentrate onevaluation of correlation methodologies for crash testdata and finite element simulation results.
IntroductionIn the last decade significant advances have
occurred in finite element simulation of crash energymanagement and experimental data acquisitionsystems. For example, full-scale crash simulationsperformed with nonlinear, transient dynamic, finiteelement codes can incorporate structural complexitiessuch as: geometrically accurate models; humanoccupant models; and advanced material models toinclude nonlinear stress-strain behaviors, laminatedcomposites, and material failure. Development of thesedetailed finite element models and analysis of thesimulation results require investment in substantiallyskilled analysts and computer resources. However,schedule and budget constraints often force analysts tominimize efforts to analyze and correlate the resultswith experimental data. Often, the assessment of thecorrelation accuracy is based on the comparison ofparameters such as crash pulse duration and peak ormean acceleration of the large masses. Theseparameters provide valuable information with regard tothe global response of the aircraft. However,correlations of these gross parameters are insufficientto adequately evaluate structural modeling details.__________________________________________Presented at the American Helicopter Society 57th Annual Forum,Washington, D.C., May 9-11, 2001. This paper is a work of the U. S.Government and is therefore in the public domain.
The research to be presented in this paper isbased on the need to better quantify the accuracy ofcrash simulation results generated by nonlinear,transient dynamic, finite element codes. Specifically,this paper will concentrate on an evaluation of dataanalysis and signal processing techniques forcorrelation of crash test data and finite elementsimulation results.
BackgroundTwo examples of data recently acquired from
full-scale crash tests at the NASA Langley ImpactDynamics Research Facility (IDRF) [1] are shown inFigures 1 and 2. The data shown in Figure 1 arevertical seat rail accelerometer responses for amodified Learfan aircraft that was crash tested onOctober 15, 1999. A report describing the test anddetails about the data is currently being prepared. Notethat all acceleration responses in this paper are filteredwith an SAE Channel Filter Class (CFC) 60, unlessotherwise noted, as specified in SAE J211-1, Ref [2].All four curves demonstrate a well-defined “crashpulse” with essentially a monotonically increasing andthen monotonically decreasing behavior. Such curvesare well suited to be defined and correlated withsimulation results defined by peak acceleration, time ofthe peak acceleration, and acceleration pulse duration.
Figure 1. Sample acceleration responses for Learfan teston October 15, 1999.

2
Figure 2 shows sample acceleration responsedata obtained from a June 22, 1999 crash test of theSikorsky Advanced Composite Airframe Program(ACAP) helicopter, see Ref [3]. The response of the leftengine exhibits a well-defined crash pulse after thefuselage contacts at 0.1 sec. The three remainingacceleration responses of the pilot and troop floor andthe bulkhead show considerable oscillatory behavior.The absence of a well-defined crash pulse leads one toquestion whether the traditional response quantificationis appropriate. Are peak acceleration, time of the peakacceleration, and crash pulse duration the appropriatecorrelation parameters to quantify these curves? Howdo current correlation practices affect these quantities?Can such curves provide sufficient information to guidedesigns in the future?
Figure 2. Sample acceleration responses acquiredduring the Sikorsky ACAP helicopter crash tested on
June 22, 1999.
The difficulties in correlating test and analysisresults are compounded by the increasing use of crashsimulations utilizing detailed finite element models. Thekinematic approaches developed in the 1980’s usemodels that are generally composed of less than 100elements (concentrated masses, beams and crushsprings). Simplification of the complex structure of anaircraft to less than 100 elements requires significantengineering judgement and numerous approximations.On the other hand, these kinematic simulations enablequick computations and are well suited for early designsimulations where structural details are not defined.Current modeling capabilities enable analysts toconstruct detailed finite element models with accurategeometric and material property information. Thesedetails allow inclusion of complex failure behavior inthe material property specifications. This attention tothe structural details will allow prediction of not only thelarge mass accelerations, but also simulation ofprimary and secondary structural responses.
Based on the aforementioned information, theneed to re-evaluate the current crash data analysis and
correlation methodologies for use with detailed finiteelement model simulations has been identified. Aproject has been initiated through the NASA AviationSafety Program to better quantify the accuracy of crashsimulation results. The motivation for the project is: todocument modeling improvements; to evaluate designconfigurations analytically; and to enable certificationby analysis. The primary objective of the project is toevaluate several methodologies, both in the time andfrequency domains, for application to the correlation ofcrash finite element model results with measured crashdata. An overview to include preliminary results for thisproject is contained in Ref. [4].
Two types of structural models are beingemployed in the evaluation of the correlationmethodologies, they are: simple metallic beam andplate structures; and a representative advanced-concept, composite fuselage section. The beam andplate efforts are intended to allow evaluation of timeand frequency domain analysis techniques on verysimple structures. The techniques deemed viable fromthe simpler structural applications are then applied tothe fuselage section. The fuselage section resultsenable evaluation of these techniques on a morerealistic structure. The correlation of test and analysisfor the advanced-concept, composite fuselage sectionis the focus of the present paper.
Description of test structureAn advanced-concept, composite full-scale
fuselage aircraft section with an energy absorbingsubfloor, see Figure 3, was recently impact tested atthe NASA Langley IDRF. The purpose of the test wasto acquire a high quality and detailed data set for usein the test and analysis correlation project. Thefuselage section was selected for several reasons.Extensive experience in both modeling and testing ofthe section has been gained over the past 4 years.This experience enabled the authors to concentrate onthe evaluation of correlation practices rather thandevote significant resources to structural design, finiteelement model development, and test preparation. Inaddition, the structure was considerably more complexthan the simple metallic structures. This complexityallows the evaluation of several techniques on a morerealistic structure. It should be noted that the energyabsorbing fuselage section was designed for a specificfloor loading and impact velocity. The floor loading andimpact velocity for the data presented in this paperwere selected to facilitate the evaluation of correlationmethodologies. These parameters vary substantiallyfrom the original design values. Therefore theaccelerations presented in this paper should not beused to evaluate the efficacy of the crashworthydesign.

3
Figure 3. Photograph of fuselage section.
The fuselage section is 64 in. long with adiameter of 60 in. The design includes a very stiff floorthat produces an essentially uniform global crushing ofthe energy absorbing subfloor. The upper section wasdesigned to withstand typical aircraft pressurizationloads and provide a protective shell for the occupants.Details regarding the fuselage section design andprevious tests are documented in Ref. [5]. In thecurrent configuration, the fuselage section containedten 100-lb. lead weights symmetrically distributed onthe fuselage floor, see Figure 4. Numerous video andhigh-speed film cameras as well as still camerasrecorded the test. In addition, data were recorded from73 accelerometers at 10 kHz sampling rate by an on-board digital data acquisition system.
The accelerometers on the floor were orientedvertically. The accelerometers at Stations I, III, V, VII,and IX were located on the bolts securing the largelead masses to the aluminum seat rails. For Stations II,IV, VI, and VIII the outboard accelerometers weremounted on blocks to the seat rails. The inboardaccelerometers were mounted on blocks to the dataacquisition system support plates. The accelerometerspositioned between the seat rails were mounted onblocks adhered directly to the floor. Theaccelerometers on the upper section were oriented tomeasure the radial acceleration, see Figure 5 andTable I. Standard crash-type accelerometers werelocated at three axial locations, Stations I, V, and IX. Inaddition, inexpensive accelerometers (~ $100 each)were located at Stations II and VIII. The inexpensiveaccelerometers were being evaluated for use in areasof high risk for damage or where the weight of thestandard accelerometer may significantly affect theresponse.
100 lb. lead weights
Subfloor foam
x
z
Data acquisition
01
04
03
02
05
06
07
08
09
10
11
12
13
14
15
16
17
18
42
45
44
43
46
47
48
49
50
33
36
35
34
37
38
39
40
41
19
20
21
22
23
24
25
26
51
52
53
54
55
56
57
58
01 Position number
I
II
III
IV
V
VI
VII
VIII
IX
Station
Figure 4. Top view schematic of fuselage section withinstrumentation.
+
x
y
-90o
-45o
0o
+45o
+90o
Figure 5. Front view schematic of fuselage section withinstrumentation.

4
Table I. Designation of position numbers for radialaccelerometers.
Circumferential angle, degreesStation -90 -45 0 +45 +90
I 65 66 67 68 69II - 91 88 89 -V 70 71 72 73 74
VIII - 85 84 86 -IX 75 76 77 78 79
To obtain data for correlation with the finiteelement model, two drop tests of the fuselage sectionwere conducted. The first test excited only the linearresponse of the fuselage without significant damage tothe fuselage. The response for the first test will becorrelated with modal analysis results generated byMSC.Nastran. The comparison of test and analysis willfocus on the free vibration frequencies and relativephasing of the accelerations. The second test wasdesigned to substantially crush the subfloor withoutdamaging the upper portion of the section. Post-testclose-up photographs of the subfloor after the 1.75-in.(37 in/sec) and 10-ft (307 in/sec) drop tests are shownin Figures 6 and 7, respectively. The 1.75-in. dropcaused 0.25-in. crush of the subfloor. This amount ofcrush was barely perceptible and not consideredsufficient to significantly affect the fuselage responseduring the 10-ft drop test. No other damage to thestructure was evident. The maximum crush resultingfrom the 10-ft drop was 3.75 in. This drop testproduced no other discernable damage to structureabove the subfloor.
Figure 6. Photo of subfloor after 1.75-in drop.
Figure 7. Photo of subfloor after 10-ft drop.
Summary of test data evaluationsBefore correlating with simulation results,
extensive and detailed analyses of the data from bothdrop tests were performed. These analyses wereintended to insure that sufficient data existed to
evaluate trends. In addition, the volume of dataacquired proved valuable for identifying similarities andanomalies in the results. These analyses utilized thesymmetry of the test structure and desired impactcondition. A one-degree pitch of the section wasevident in the data. Note that the predictions will bebased on the a priori impact velocity from the specifieddrop height with no pitch or roll.
A brief summary of the data analyses will bepresented in this section. Additional data evaluationresults can be found in Ref. [4].
The measured accelerations of the left andright inboard seat rails at either end of the section areshown in Figure 8. The position designations in thelegend correspond to those shown in Figure 4.Although variations up to 20 g in the time history exist,the effect on the mean acceleration (indicated in thelegend) over the first 0.050 sec is 0.5 g. It was difficultto equitably determine the time duration for the meancomputation since the pulse duration for each positionwas different. The time duration does significantlyaffect the mean value, but has a lesser influence onthe variation of the mean values. The correspondingvelocities computed by numerically integrating theunfiltered accelerations are shown in Figure 9. A one-degree pitch attitude at impact is evident from the timedelay in the onset for in both the acceleration andvelocity curves.
As the data was being examined, a variety ofsubtle and pronounced differences between testchannels was noted. Specific individual characteristicsof acceleration data, e.g. peak and meanaccelerations, were studied. These characteristics mayindividually be relatively unimportant or may berelatively important depending on the type and use ofthe data. It is difficult to assess the quality ofcorrelation, as the channel-to-channel scatter of“symmetric” test data may be greater than thedifference between measured and predicted results.Therefore, from a correlation standpoint, it is importantto examine the characteristics of the measured andpredicted results in a more systematic approach inwhich not only individual characteristics are examinedand compared, but calculated values are compared aswell. Such calculated values are designed to couple avariety of parameters, and may include considerationof factors such as duration, time over a thresholdvalue, peak acceleration, onset rate, frequencycontent, and others. The present paper includesseveral such comparisons.

5
Figure 8. Comparison of the response of symmetricallylocated accelerometers (mean in parentheses).
Figure 9. Comparison of the computed velocities basedon the accelerometer responses in Figure 8.
At this point, results from the computation ofthe 1-D Dynamic Response Index (DRI), Ref [5], arepresented. The computations in this paper were basedon fuselage floor acceleration and, therefore, shouldnot be compared with established human tolerancecriteria. The DRI were simply calculated in order toevaluate the significance of data scatter on DRI-typecomputations. The 1-D DRI approximates the humanresponse with a mass-spring-damper system. Thisrepresentation is translated to a forced 2nd-order ODEwhere the fundamental frequency is 8.4 Hz and thedamping is 0.224. The DRI responses were computedfrom the filtered accelerations plotted in Figure 8. Thelarge scatter in time history values is greatly diminishedwhen processed through the DRI, see Figure 10.
The measured accelerations and subsequentcalculated results shown in Figures 8 through 10 areobtained from accelerometers mounted on the largemasses. Additional questions arise as to the effect ofthe mass on which an accelerometer is mounted onthe acceleration response. The filtered acceleration
responses at three closely spaced locations (identifiedin Figure 4) are shown in Figure 11. Position 01 islocated on a large mass mounted to the outer seat rail.Position 02 is located on a mounting block attached tothe seat rail. Position 19 is located directly to the flooron a mounting block. Note that the location on the floorshows a much flatter response from .010 to .040 sec.The scatter in mean acceleration values is 1.1 g for thefirst 0.050 sec. The corresponding velocities and DRIresponses are shown in Figures 12 and 13,respectively. Although the details of the time historiesvary substantially, the gross parameter comparisonsshow very little variation. The results verify the initialintent for the design concept where the rigid floor actsto globally crush the subfloor.
Figure 10. Computed DRI values based on theaccelerometer responses in Figure 8.
Figure 11. Effect of the mounting mass on the responseof closely spaced accelerometers (mean in parenthesis).

6
Figure 12. Effect of the mounting mass on velocity forclosely spaced accelerometers.
Figure 13. Effect of the mounting mass on the DRI forclosely spaced accelerometers.
Finally, a comparison of accelerationresponses on the upper fuselage section as measuredby the inexpensive, or ~ $100, (positions 84 and 85)and the standard crash-type (positions 77 and 76)accelerometers is shown in Figure 14. The
accelerometer pairs at – 45o (positions 76 & 85) and 0
o
(positions 77 & 84) are axially separated by 11 in. Theimpact loading and attitude produced a fuselageresponse with very little axial variation. The pairs showa nearly identical response. The slight discrepanciesare assumed to result from a combination ofmeasurement inaccuracy and the axial separation. Theavailability and reliability of inexpensive and lightweightaccelerometers will enable applications where:damage is probable; the effect of the accelerometerweight would significantly alter the structural response;or greater instrumentation density is needed.
Figure 14. Comparison of accelerations for ~$100 (85and 84) and standard accelerometers (76 and 77).
Based on the findings from the extensive dataevaluations, the experimental data is considered to beof sufficiently high quality to adequately evaluate, aswell as to guide, the development of the correlationmethodologies.
Description of finite element modelThe finite element model is shown in Figure
15. The model is comprised of approximately 30,000elements and 30,000 nodes. The rigid floor has beenmodeled as two laminated composite face sheets witha foam core. The foam core is represented using solidelements assigned linear elastic material properties.
Figure 15. Schematic of fuselage finite element model.
The composite face sheets are represented with linearelastic orthotropic material properties. The uppersection is also modeled with a foam core withlaminated composite orthotropic face sheets. Thesubfloor section has solid elements with orthotropicface sheets on the interior surfaces. The accuracy ofthe crash simulations for this model is directly

7
dependent on the accuracy of the subfloor foammaterial properties. A stress-strain table was suppliedfor the FOAM2 material properties in the model.Additional details regarding the modeling approach arefound in Ref [6]. This model was used in bothMSC.Nastran for modal analysis and MSC.Dytran forcrash analysis.
Correlation of MSC.Nastran modal results with testdata
Analytical modal analysis results are correlatedwith test data from the 1.75-in. drop to ascertain theaccuracy of the global mass and stiffness distributionof the finite element model. The modal analysis resultswere generated by MSC.Nastran after converting theMSC.Dytran input file to MSC.Nastran input format.The conversion required changing the Case Controlsection and eliminating certain material propertyspecifications (such as material failure) not recognizedby the modal analysis solver.
To adequately evaluate the test data forcomparison with modal results, several factors wereconsidered. A summary of this information is presentedin Figures 16 through 20. First, several test data resultswill be presented upon which the correlations arebased. Sample floor and upper structure accelerationresponses for the 0.5 sec after fuselage contact areshown in Figure 16. Note the nearly constant amplitudeoscillatory behavior for the first 0.2 sec. This behavioris followed by a general decay of the structuralresponse.
Figure 16. Experimental acceleration responses from theflexible upper structure and floor (1.75-in. drop).
Decaying acceleration responses from anoutboard and an inboard floor accelerometer at StationV are shown in Figure 17. The radial accelerations atStation V at three circumferential locations are shown
in Figure 18. Note that the – 90o and 0
o responses are
similar in characteristic but out-of-phase. The response
at – 45o has a very different time history characteristic.
Figure 17. Decaying acceleration responses of two flooraccelerometers (1.75-in. drop).
Figure 18. Decaying acceleration responses of threeupper structure accelerometers (1.75-in. drop).
The measured data was further evaluated forsuitability based on power spectral density (PSD),transfer function, and coherence. The reference for thetransfer function and coherence computations is theresponse at the top of the section (position 72). All ofthe frequency results have been computed such that 4averages are used with a frequency resolution of 0.3Hz. The normalized PSDs for the accelerometers atStation V on the floor and on the upper structure areshown in the Figures 19 and 20, respectively. EachPSD curve was normalized by the respective maximumvalue from 0 – 100 Hz, because frequencies below 100Hz dominated the spectra for most positions and forconsistency with the plotted filtered accelerations. Both26 and 68 Hz results will be correlated with predictedmodal responses.

8
Figure 19. Normalized PSDs on the floor at Station V.
Figure 20. Normalized PSDs of upper structure locationsat Station V.
Frequency domain results at 26 Hz as afunction of position are shown in Figures 21 through
23. The coherence for –/+ 90o, positions 70 and 74,
respectively, is nearly 1. This result indicates that the
measured response for –/+ 90o, are linearly related to
the response at the top, position 72, with insignificantcontamination from noise or multiple sources. Thecoherence for the outboard seat rails, positions 05 and
37, and at + 45o, position 73, on the upper structure
are substantially less. The magnitude of the transferfunction shows that the low coherence values couldresult from significantly lower signals – a difference ofmore that 20 dB. This information is needed to assessthe accuracy of the transfer function phase information,shown in Figure 23.
Figure 21. Coherence for 26 Hz.
Figure 22. Magnitude of transfer function for 26 Hz.
Figure 23. Phase of transfer function for 26 Hz.
The deformed plot as generated by theanalytical modal analysis is shown in Figure 24 for26.87 Hz with displacement magnitude shading. Therelative phasing of the deformed shape agrees with themeasured phase results in Figure 23.

9
Figure 24. Analytical model shape with displacementshading (26.87 Hz).
Frequency domain results for 68 Hz as afunction of position are shown in Figures 25 through27. The coherence for the floor locations is significantlyless than 1 and in fact approaches 0. This findingindicates that the transfer function phase results for thefloor positions are not reliable. Unlike the response at
26 Hz, the –/+ 45o locations (positions 71 and 73) are
well correlated with the response at the top, position72. The magnitudes of the responses are also very
close. The magnitude of the transfer function at –/+ 90o
(positions 70 and 74) is 10 dB less than that forposition 72. Based on the above information, the phaseinformation for only the upper structure can berealistically compared with modal results. The phasesfor the floor have not been included in Figure 27because of questionable accuracy.
Figure 25. Coherence for 68 Hz.
Figure 26. Magnitude of transfer function for 68 Hz.
Figure 27. Phase of transfer function for 68 Hz.
The analytical modal deformed results for70.51 Hz are shown in Figure 28. As for 26 Hz, therelative phasing of the deformed shapes of the upperstructure agrees with the measured phase results, inFigure 27.
Figure 28. Analytical model shape with displacementshading (70.51 Hz).

10
It was desired that the low drop informationcould be used directly for modal comparison. However,for this particular example, the upper structuredynamics are nearly uncoupled from the floor section.The symmetric impact conditions in conjunction withthe fuselage section design thus reduced theinformation available for comparison with thepredictions, as all anti-symmetric modes wererepressed.
Nonetheless, the data was sufficient toevaluate the merit of the linear response and modalanalysis approach for future applications. The phasinginformation enabled validation of the predicted modeshapes.
The measured free vibration frequency at 26Hz compared well with the predicted value of 27 Hzwhile the measured value of 68 Hz correlated with thepredicted values at 70.5 Hz. The error in modalfrequency is less than four percent. This level ofaccuracy indicates that the global stiffness and massdistribution for the modal analysis were wellrepresented in the finite element model. Thereforeerrors in simulation and test data for the 10-ft. dropshould not be attributed to global stiffness and massdistribution inaccuracies.
Correlation of MSC.Dytran results with test dataSeveral methods have been used to correlate
the crash simulation results with the test data from the10-ft drop test. As for the modal response, the floorresponses exhibit characteristics that are very differentfrom those of the flexible upper section.
The measured accelerations at four symmetricinboard locations have been overplotted with thepredicted accelerations, see Figure 29. The predictedacceleration curve was computed by averaging thecorresponding symmetric simulation nodal results. Thescatter of predicted accelerations as a function of timefor the four nodes was less than 4 g, while the variationin measured acceleration is up to 20 g. Based on thisknowledge, two concerns arose regarding: the mostappropriate means to compare the test and analysis;and the significance of the variations on humanresponse and injury. The following comparisons are aninitial attempt to address these concerns.
The measured and predicted floor accelerationtime histories at Station V are shown in Figures 30through 33. Note that both the measured and predictedresponses show two local maxima. As stated earlier,the predictions were not altered by impact conditions tocorrespond with the actual test conditions in order toevaluate pre-test simulation correlation capabilities withtest data. The measured and predicted outboardaccelerations, see Figures 30 and 32, have a lesssteep onset rate than the inboard positions, seeFigures 31 and 33.
Comparisons from these figures are providedin Table II. It is interesting to note that the measuredand predicted peak accelerations for 3 of the 4 curvesis within 5%, while at position 05 the difference is 11%.The time at which the predicted peak occurs variessubstantially from the measured values because of thepresence of the double peak.
Table II. Percent error in peak and time of peakfor four symmetric accelerometer positions.
% errorPosition Peak Time of peak
05 11.3 85.914 0.1 18.737 4.6 3.646 3.1 6.6
Figure 29. Measured and predicted accelerations resultsfor symmetric positions.
Figure 30. Left outboard measured and predictedaccelerations, position 05.

11
Figure 31. Left inboard measured and predictedaccelerations, position 14.
Figure 32. Right outboard measured and predictedaccelerations, position 37.
Figure 33. Right inboard measured and predictedaccelerations, position 46.
Measured and predicted radial accelerations atStation V are shown in Figures 34 through 38.Unfortunately the code does not output accelerationsdefined by a coordinate system which moves with thestructure. Therefore, the predicted results werecomputed by assuming a fixed orientation for the
acceleration. In other words, the orientation of thepredicted acceleration did not change with time withrespect to the global coordinate system. Thisassumption appears to be valid for this particular case.
Figure 34. Left side, – 90o, measured and predicted radial
accelerations, position 70.
Figure 35. Left side – 45o, measured and predicted radial
accelerations, position 71.
Figure 36. Top measured and predicted radialaccelerations, position 72.
12
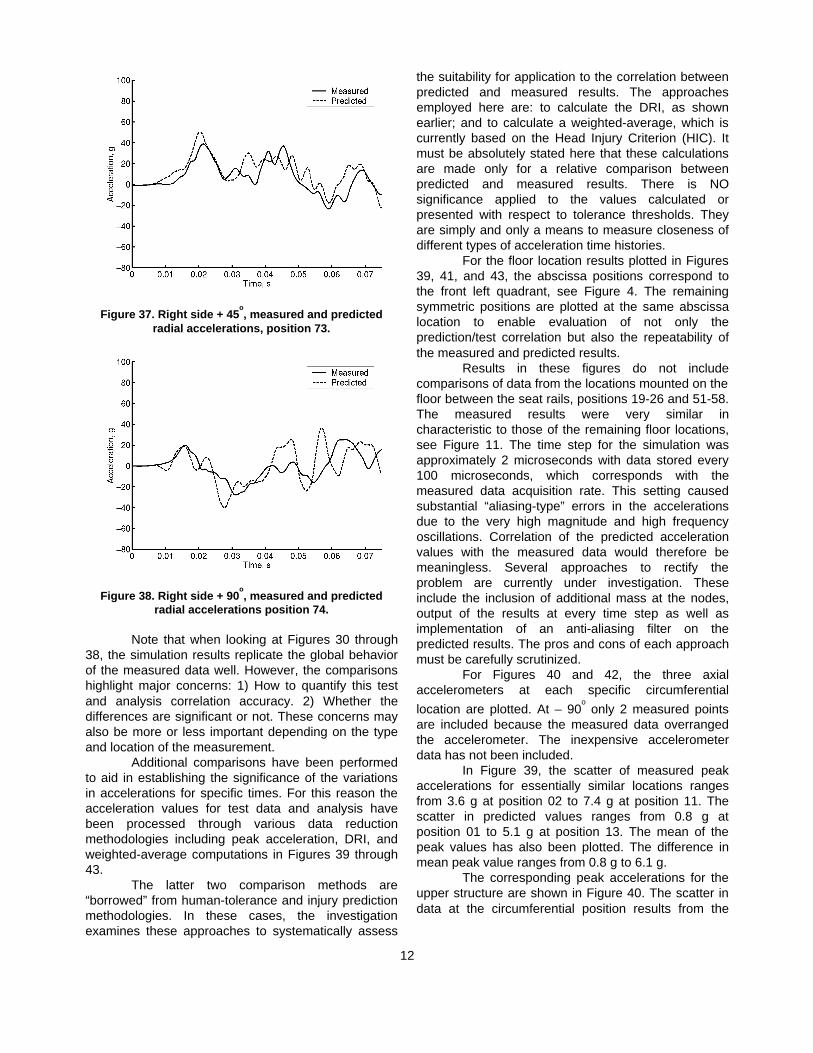
Figure 37. Right side + 45o, measured and predicted
radial accelerations, position 73.
Figure 38. Right side + 90o, measured and predicted
radial accelerations position 74.
Note that when looking at Figures 30 through38, the simulation results replicate the global behaviorof the measured data well. However, the comparisonshighlight major concerns: 1) How to quantify this testand analysis correlation accuracy. 2) Whether thedifferences are significant or not. These concerns mayalso be more or less important depending on the typeand location of the measurement.
Additional comparisons have been performedto aid in establishing the significance of the variationsin accelerations for specific times. For this reason theacceleration values for test data and analysis havebeen processed through various data reductionmethodologies including peak acceleration, DRI, andweighted-average computations in Figures 39 through43.
The latter two comparison methods are“borrowed” from human-tolerance and injury predictionmethodologies. In these cases, the investigationexamines these approaches to systematically assess
the suitability for application to the correlation betweenpredicted and measured results. The approachesemployed here are: to calculate the DRI, as shownearlier; and to calculate a weighted-average, which iscurrently based on the Head Injury Criterion (HIC). Itmust be absolutely stated here that these calculationsare made only for a relative comparison betweenpredicted and measured results. There is NOsignificance applied to the values calculated orpresented with respect to tolerance thresholds. Theyare simply and only a means to measure closeness ofdifferent types of acceleration time histories.
For the floor location results plotted in Figures39, 41, and 43, the abscissa positions correspond tothe front left quadrant, see Figure 4. The remainingsymmetric positions are plotted at the same abscissalocation to enable evaluation of not only theprediction/test correlation but also the repeatability ofthe measured and predicted results.
Results in these figures do not includecomparisons of data from the locations mounted on thefloor between the seat rails, positions 19-26 and 51-58.The measured results were very similar incharacteristic to those of the remaining floor locations,see Figure 11. The time step for the simulation wasapproximately 2 microseconds with data stored every100 microseconds, which corresponds with themeasured data acquisition rate. This setting causedsubstantial “aliasing-type” errors in the accelerationsdue to the very high magnitude and high frequencyoscillations. Correlation of the predicted accelerationvalues with the measured data would therefore bemeaningless. Several approaches to rectify theproblem are currently under investigation. Theseinclude the inclusion of additional mass at the nodes,output of the results at every time step as well asimplementation of an anti-aliasing filter on thepredicted results. The pros and cons of each approachmust be carefully scrutinized.
For Figures 40 and 42, the three axialaccelerometers at each specific circumferential
location are plotted. At – 90o only 2 measured points
are included because the measured data overrangedthe accelerometer. The inexpensive accelerometerdata has not been included.
In Figure 39, the scatter of measured peakaccelerations for essentially similar locations rangesfrom 3.6 g at position 02 to 7.4 g at position 11. Thescatter in predicted values ranges from 0.8 g atposition 01 to 5.1 g at position 13. The mean of thepeak values has also been plotted. The difference inmean peak value ranges from 0.8 g to 6.1 g.
The corresponding peak accelerations for theupper structure are shown in Figure 40. The scatter indata at the circumferential position results from the

13
low-frequency oscillatory nature of the response asevident in Figures 34 through 38.
Figure 39. Measured and predicted floor maximumaccelerations (Positions: Outboard 01 02 03 04: Inboard
10 11 12 13: Mass 01 03 10 12: Seat rail 02 04 11 13).
Figure 40. Measured and predicted upper structuremaximum accelerations.
A second method for evaluating thecorrelations between test and analysis results was toprocess the filtered accelerations through the DRImodel, see Figures 41 and 42. As shown in the dataanalysis section, the DRI computation greatlysmoothes oscillatory behavior. These computations forthe positions on the floor, Figure 41, indicate that thelarge variations in time histories are nearly insignificantfor the DRI, which acts like an 8.4 Hz filter. Unlike peakacceleration, the DRI computation clearly delineatedthe measured and predicted results such that thedifference in mean DRI curves are nearly constant at 8.The maximum DRI values for the upper section, seeFigure 42, show large scatter for the measured andpredicted values, with similar trends in the meancurves.
Figure 41. Measured and predicted maximum DRI valueson the floor (Positions: Outboard 01 02 03 04: Inboard 10
11 12 13: Mass 01 03 10 12: Seat rail 02 04 11 13).
Figure 42. Measured and predicted maximum DRI valuesfor the upper structure.
The computed weighted-average results(based on the HIC parameters) for the floor locationsare shown in Figure 43. The data in the figure wasbased on acceleration curves filtered with a CFC 60.As for the DRI, a distinct variation is evident inmeasured and predicted values where the difference inmean value ranges from 38 to 68.
The effect of the SAE filter class on theweighted-average computation is shown in Table III. Allof the positions are on the left outboard seat rail. Thedata with a white background are for positions on thelarge masses, whereas the gray background valuescorrespond to seat rail positions. Note that with a CFCof 60, the effect of mounting mass is small such thatthe scatter for the measured values is 14% and thepredicted scatter is 8.3%. The percent differencebetween measured and predicted values is 48%. Whenthe filter frequency is increased an order of magnitudeto CFC 1000, both the measured and predicted valuesincrease substantially for the seat rail locations with

14
minimal changes for the large masses. For themeasured data the scatter at the large masses is 8.7%,while that for the predicted results is 3.9%. The scatterat the seat rails is 43% for the measured data and 39%for the predicted results. The percent error betweenmeasured and predicted results when separating themass and seat rail data is 45% and 175%,respectively.
The evaluations of the correlation procedurespresented in this paper are not measured by thepercent error between experimental and analyticalresults. Rather, the evaluation of correlationprocedures are based on whether the method candelineate differences between measured and predictedresults that could produce structural deterioration orhuman injury.
Figure 43. Correlation of measured and predictedmaximum weighted-average values for the floor
positions (Positions: Outboard 01 02 03 04: Inboard 1011 12 13: Mass 01 03 10 12: Seat rail 02 04 11 13).
Table III. Effect of filtering frequency on weighted-average.
Position Measured(CFC 60)
Predicted(CFC 60)
Measured(CFC 1000)
Predicted(CFC 1000)
01 110 176 112 176
02 100 178 576 710703 111 181 112 18104 111 190 453 853605 112 183 114 18306 110 177 376 581007 114 181 114 18108 112 175 470 645909 115 181 122 182
Concluding RemarksThis paper described an activity to better
quantify the accuracy of crash test and analysiscorrelation. The work in this paper concentrated on thetest and simulation results for an advanced-concept,
full-scale fuselage section. Two drop tests of thesection were conducted. The first test was designed toexcite the linear structural response for comparisonwith finite element modal analysis results. The secondtest was designed to provide data for correlation withcrash simulations. A detailed finite element model wasdeveloped for execution in MSC.Dytran to generatecrash simulations. Following minor modifications, themodel was executed in MSC.Nastran to generatemodal analysis information.
The results presented in this paper start withexisting algorithms such as peak and meanacceleration, DRI, and weighted-averaging (HIC-type)computations. As stated previously, the calculatedresults are simply and only a means to measurecloseness of different types of acceleration timehistories. It is clearly understood that the sensitivity ofthe HIC-type calculation to peak acceleration andduration is defined based on information known abouthead impacts. Metallic and composite structure willhave differing sensitivities to loading and duration andthese will most probably be different than that used todevelop the HIC.
The following information is a compilation ofconclusions and “lessons-learned”:• Extensive analyses of the measured results
showed that high quality data from both drop testsof a fuselage section were acquired. The volume ofmeasured data proved valuable for identifyingsimilarities and anomalies in the results. Inaddition, transducer placement should be basednot only for concept evaluation, but also for thecorrelation with simulations.
• For essentially symmetric positions, the scatter inacceleration time histories was large, nearly 20 g,when compared to the maximum values of 40g.However, several calculated results, to includemean and peak accelerations and DynamicResponse Index (DRI), indicated that the globalvariation was significantly less. A major concernwas raised as to how to appropriately quantify notonly the correlation of test and analysis but alsochannel-to-channel variations based on the timehistory and calculated results.
• Frequencies from the finite element modal analysiswere within 4% of the measured values. Sufficientdata was available to establish the correlation ofmode shapes based on relative phasing.
• Future crash finite element model developmentcould be expedited by correlation withexperimental modal analysis results. The accuracyof the modal correlation depends on the accuracyof the global stiffness and mass distribution for thefinite element model. In addition, this approachprovides a second experimental data set forcorrelation. This information is particularly

15
important in crash applications where traditionallyonly one data set is acquired since the testspecimen is destroyed. In these cases, there existslittle opportunity to evaluate data quality forcorrelation with crash simulations.
• Evaluation of the crash finite element simulationaccuracy requires the comparison of results inseveral formats. Filtered time history accelerationsand velocities enable evaluation of correlationdetails. However, the significant variations betweeneven symmetrically located positions makemeaningful quantification of the results difficult tointerpret. Several proposed reasons for thediscrepancies include: geometric defects, materialvariations, and inaccurate estimate of the impactconditions.
• Several methods for evaluating the comparison ofmeasured and predicted results were presented.These included peak acceleration, DRI, andweighted-average. These approaches allowedevaluation of the significance of scatter in the timehistory data in combination with factors such asduration, peak acceleration, onset rate, frequencycontent, and mean. The methods enable thepresentation of all data positions on one figure.Such a presentation can be valuable for evaluatingglobal modeling as well as highlighting both thesubtle and pronounced differences between testand analysis.
References:1. Vaughan, V. L., Jr.; and Alfaro-Bou, E.: Impact
Dynamics Research Facility for Full-Scale AircraftCrash Testing. NASA TN D-8179, April 1976.
2. Society of Automotive Engineers, RecommendedPractice: Instrumentation for Impact Test – Part 1,Electronic Instrumentation, SAE J211/1, March1995.
3. Fasanella, E. L.; Jackson, K. E.; and Lyle, K. H.:Finite Element Simulation of a Full-Scale CrashTest of a Composite Helicopter. Proceedings ofAHS 56th Annual Forum, Virginia Beach, VA, May2-4, 2000.
4. Bark, L. W.; and Lyle, K. H.: Progress TowardUnderstanding Correlation of Crash Test withCrash Simulation. Proceedings of the ThirdInternational KRASH Users’ Seminar, Tempe, AZ,January 8-10, 2001.
5. Stech, E. L., and Payne, P. R.:Dynamic Models ofthe Human Body. Frost Engineering andDevelopment Corporation, AMRL Technical Report66-158, Aerospace Medical Research Laboratory,Wright-Patterson AFB, OH, November 1969.
6. Jackson, K. E.; Fasanella, E. L.: Development of aCrashworthy Composite Fuselage Concept.Proceedings of the 2000 Advances in AviationSafety Conference (P-355), Daytona Beach, FL,April 11-13, 2000.