evaluation of sporicidal wipes and liquid agents for
TRANSCRIPT
EPA/600/R-16/149 | July 2016www.epa.gov/homeland-security-research
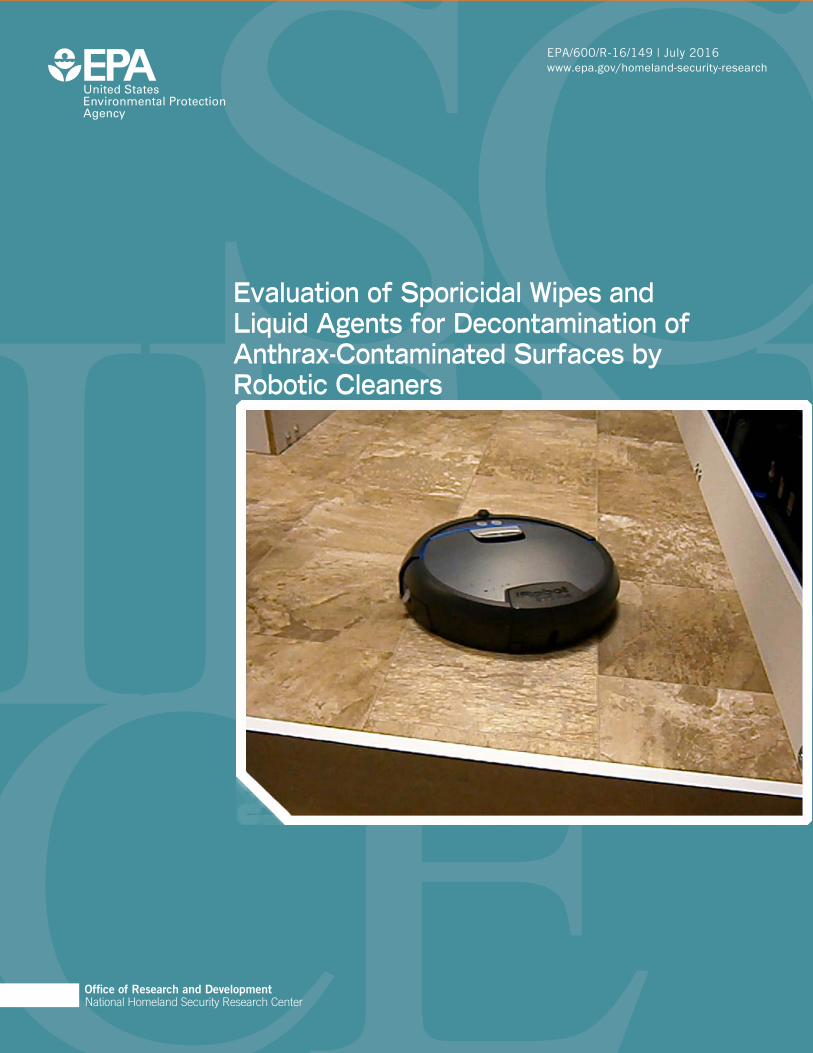
Evaluation of Sporicidal Wipes and Liquid Agents for Decontamination of Anthrax-Contaminated Surfaces by Robotic Cleaners
Office of Research and Development National Homeland Security Research Center

EPA/600/R-16/149 July 2016
Evaluation of Sporicidal Wipes and Liquid Agents for Decontamination of
Anthrax-Contaminated Surfaces by Robotic Cleaners
National Homeland Security Research Center Office of Research and Development
U.S. Environmental Protection Agency Research Triangle Park, NC 27711

Disclaimer
The U.S. Environmental Protection Agency (EPA), through its Office of Research and Development’s National Homeland Security Research Center, funded and managed this investigation through Contract No. EP-C-09-027, Work Assignment 72 with ARCADIS U.S., Inc. (ARCADIS), and Contract No. EP-C-15-008 with Jacobs Technology Inc. (Jacobs). This report will be peer and administratively reviewed and will be approved for publication as an EPA document. This report does not necessarily reflect the views of the EPA. No official endorsement should be inferred. This report includes photographs of commercially available products. The photographs are included for the purposes of illustration only and are not intended to imply that EPA approves or endorses the products or their manufacturers. EPA does not endorse the purchase or sale of any commercial products or services.
Questions concerning this document and its application should be addressed to the following individual:
Sang Don Lee, Ph.D. U.S. Environmental Protection Agency Office of Research and Development National Homeland Security Research Center 109 T.W. Alexander Dr. (E343-06) Research Triangle Park, NC 27711 Telephone No.: (919) 541-4531 Fax No.: (919) 541-0496 e-Mail Address: [email protected]
i

Acknowledgments
The following individuals and organizations are acknowledged for review of this document:
United States Environmental Protection Agency Leroy Mickelsen Lukas Oudejans Doris Betancourt
ii
Table of Contents Disclaimer ..................................................................................................................................................... i Acknowledgments ...................................................................................................................................... ii Figures ........................................................................................................................................................ iv Tables ........................................................................................................................................................ iv Acronyms and Abbreviations .................................................................................................................... v Executive Summary ................................................................................................................................... vi 1 Introduction ......................................................................................................................................... 1 2 Experimental Approach ...................................................................................................................... 2
Project Objectives and Robots Tested ......................................................................................... 2 Experimental Methods and Materials ........................................................................................... 3
2.2.1 Test Coupon Preparation and Sterilization ...................................................................... 4 2.2.2 B. atrophaeus Spore Preparation .................................................................................... 4 2.2.3 Coupon Inoculation .......................................................................................................... 5 2.2.4 Robotic Cleaner Decontamination Procedures ............................................................... 7
2.2.4.1 R1 Decontamination Procedure ...................................................................... 7 2.2.4.2 R2 Decontamination Procedure ...................................................................... 7
Data Reduction ............................................................................................................................. 8 3 Sampling Approach ............................................................................................................................ 9
Sampling Site Environmental Conditions ..................................................................................... 9 Sampling Media ............................................................................................................................ 9 Wipe Sampling Procedures .......................................................................................................... 9 Sampling Frequency ................................................................................................................... 10 Critical Measurements ................................................................................................................ 11 Prevention of Cross-Contamination of Samples during Sampling ............................................. 11 Collection of Representative Samples ........................................................................................ 12 Sample Storage and Preservation .............................................................................................. 12
4 Analytical Procedures for Microbiological Analyses .................................................................... 13 5 Test Results ....................................................................................................................................... 14
R1 (Mint Automatic Floor Cleaner 4200) Test Results ............................................................... 14 R2 (iRobot Scooba® 390) Test Results ...................................................................................... 16
6 Quality Assurance and Quality Control .......................................................................................... 20 Criteria for Critical Measurements/Parameters .......................................................................... 20 Quality Control Checks ............................................................................................................... 21
6.2.1 Integrity of Samples and Supplies ................................................................................. 21 6.2.2 NHRSC Biolab Control Checks ..................................................................................... 21
QA/QC Sample Acceptance Criteria........................................................................................... 21 6.3.1 QA/QC Test Results Validation ..................................................................................... 23 6.3.2 Sample Holding Time .................................................................................................... 23
7 Summary ............................................................................................................................................ 24 8 References ......................................................................................................................................... 25 Appendix A: Spatial Sampling Data ...................................................................................................... A-1 Appendix B: Sample Holding Time ....................................................................................................... B-1
iii

Figures
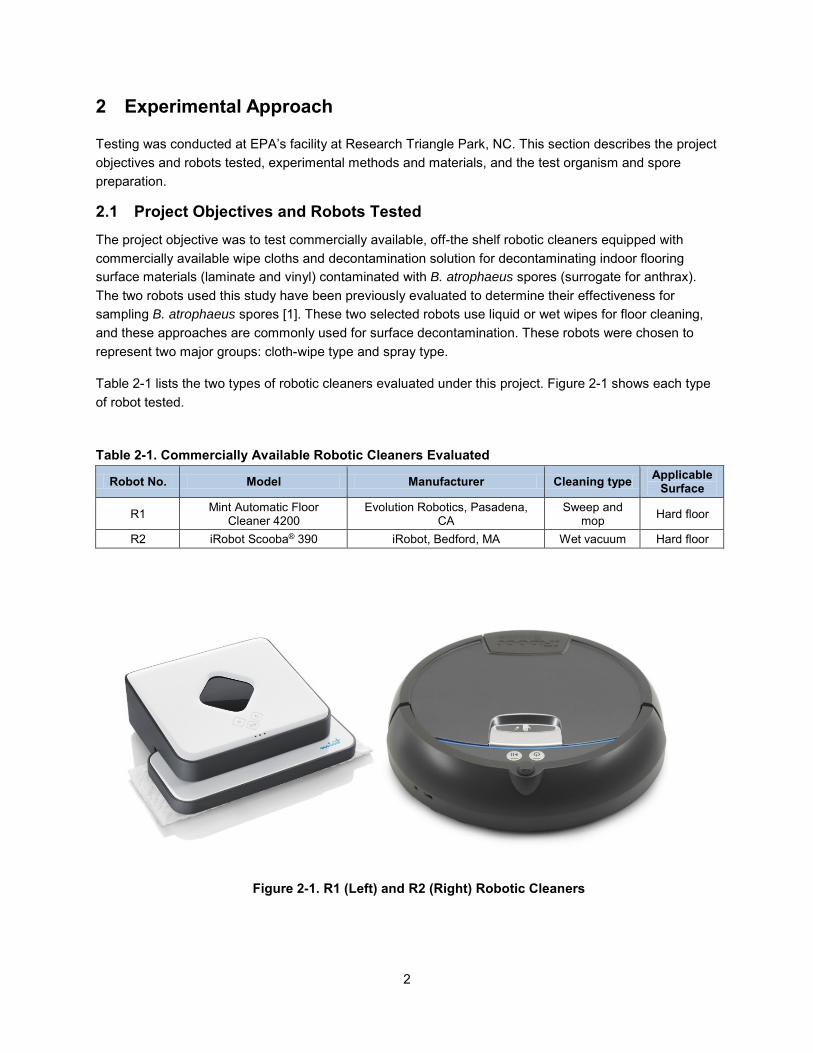
Figure 2-1. R1 (Left) and R2 (Right) Robotic Cleaners ................................................................................ 2
Figure 2-2. ADA ............................................................................................................................................ 5
Figure 2-3. MDI and MDI Actuator ................................................................................................................ 5
Figure 2-4. Large Coupon Hot Spot Test Inoculation Area (Section e) ........................................................ 6
Figure 2-5. Large Coupon Broad Area Test Inoculation Areas (Sections a, e, and i) .................................. 6
Figure 4-1. Dilution Plate (Left) and Filter Plate (Right) Showing Colonies of B. atrophaeus ....................13
Figure 5-1. R1 Vinyl Hot Spot Test Results, Replicate 1 of (a) Hype-WipeTM Cloth and (b) pAB Cloth........................................................................................................................ 15
Figure 5-2. Highest R2 Hot Spot LR Results for: (a) pAB on Vinyl, Replicate 2; and (b) Spor- Klenz® on Vinyl, Replicate 1, and (c) pAB on Laminate.......................................................17
Figure 5-3. Highest R2 LR Results, Broad Area Inoculation ...................................................................... 19
Tables
Table 2-1. Commercially Available Robotic Cleaners Evaluated.................................................................. 2
Table 2-2. Test Matrix for Robotic Cleaners ................................................................................................. 3
Table 2-3. Robotic Cleaner Decontamination Test Coupon Material Specifications .................................... 4
Table 3-1. Sampling Frequency.................................................................................................................. 10
Table 3-2. Critical and Noncritical Measurements ...................................................................................... 11
Table 5-1. R1 Decontamination Results Summary..................................................................................... 14
Table 5-2. R2 Decontamination Results Summary..................................................................................... 16
Table 6-1. Critical Measurement Criteria .................................................................................................... 20
Table 6-2. QA/QC Sample Acceptance Criteria.......................................................................................... 22
Table 6-3. QA/QC Test Results .................................................................................................................. 23
iv

Acronyms and Abbreviations
ADA aerosol deposition apparatus Anthrax Bacillus anthracis ATCC American Type Culture Collection B. Bacillus Biolab National Homeland Security Research Center Biocontaminant Laboratory CFU colony forming unit(s) DQI data quality indicator DQO data quality objective EPA U.S. Environmental Protection Agency EtO ethylene oxide ft2 square foot/feet HSPD Homeland Security Presidential Directive H2O2 hydrogen peroxide Lowe’s Lowe’s Home Improvement LR log reduction MDI metered-dose inhaler mL milliliter(s) MOP miscellaneous operating procedure NHSRC National Homeland Security Research Center NIST National Institute of Standards and Technology PAA peracetic acid pAB pH-adjusted bleach PBST phosphate-buffered saline with 0.05% Tween® 20 PRB polyester rayon blend QA quality assurance QAPP quality assurance project plan QC quality control RH relative humidity STD standard deviation STS sodium thiosulfate TSA tryptic soy agar VHP® vaporized hydrogen peroxide
v

Executive Summary
In 2001, U.S. Postal Service system facilities were contaminated through the introduction of a few letters containing Bacillus anthracis (anthrax) spores. The likelihood of occurrence of another such incident has prompted the U.S. Environmental Protection Agency (EPA) to develop strategies, guidelines, and plans for decontaminating persons, equipment, and facilities to mitigate the risks of contamination after a biological weapons attack. This work is being conducted in accordance with Homeland Security Presidential Directives (HSPDs)-5, -7, -8, and -10 in a coordinated effort with other federal agencies.
During the response to the U.S. Postal Service incident, fumigation was used primarily in heavily contaminated facilities. Other cleaning methods were used in (1) secondarily contaminated areas (areas handling cross-contaminated letters potentially in contact with the letters containing the anthrax spores and areas where anthrax contamination was tracked from primarily contaminated areas), and (2) primarily contaminated areas showing a minimal presence of anthrax spores. These other cleaning methods included combinations of disposal of contaminated items, vacuuming, and the use of liquid sporicides such as a pH-adjusted (pAB) bleach solution.
The use of commercially available robotic cleaners is a potentially effective decontamination technique for the complete removal or inactivation of Bacillus (B.) spores. This report discusses a project that investigated the ability of robotic cleaners to apply sporicidal liquid/wipe to floor surfaces and inactivate/remove B. atrophaeus spores, formerly known as B. globigii, as a surrogate for anthrax spores. Specifically, this report addresses the operational aspects of decontamination using robotic cleaners for large surface areas tested under conditions that mimic their realistic field use.
This project evaluated the robotic cleaners for deactivation of B. atrophaeus on two test material surfaces: laminate and vinyl. The decontamination procedures were performed using the following two robotic cleaners:
• Mint Automatic Floor Cleaner 4200 supplied with a North Star navigation system to track thearea cleaned tested with ready-to-use Hype-Wipe™ cloths or the manufacturer’s cloth wettedwith a decontamination solution of pAB;
• iRobot Scooba® 390 that uses a four-stage, hard-floor cleaning process (preparation,washing, scrubbing, and using squeegees) tested with pAB or Spor-Klenz® directly sprayedonto the floor surface and then vacuumed back up.
The Mint Automatic Floor Cleaner 4200 tests using both the Hype-Wipe™ cloths and the pAB-treated cloths demonstrated a very low decontamination efficacy, with an overall log reduction (LR) in viable spores of less than 1. Furthermore, a set of experiments was conducted to determine the extent of the potential spreading of contamination by the Mint Automatic Floor Cleaner 4200 robotic cleaner using both types of cloths, and results show that not only is the robotic cleaner ineffective at decontaminating a hot-spot area, the Mint Automatic Floor Cleaner 4200 robotic cleaner also increases the total area contaminated by spreading the contamination.
The iRobot Scooba® 390 tests showed better decontamination efficacy, with Spor-Klenz® showing better results than pAB in limiting the spread of contamination outside the inoculation zone. However, the iRobot Scooba® decontamination efficacy was below a 3 LR in viable spores overall regardless of the type of liquid decontaminant used. For laboratory based testing, demonstration of a 6 LR is the target for an
vi
effective sporicide under the Federal Insecticide, Fungicide, and Rodenticide Act (FIFRA).
In summary, neither robotic cleaner successfully showed a decontamination efficacy of a 6 LR, in total spore count nor significantly reduced the surface contamination amount. The maximum result was a 2.9 LR for the iRobot Scooba® 390 using Spor-Klenz® on vinyl. However, the average efficacy result for all three replicates was only a 2.29 LR. Spor-Klenz® appears to be more successful at decontamination than pAB on these surfaces with this application type, and increasing the reservoir volume of the iRobot Scooba® 390 may increase the LR. Spor-Klenz® did help limit the spread of contamination to new areas, although some spread was still observed.
vii
1 Introduction
In 2001, the introduction of a few letters containing Bacillus anthracis (anthrax) spores into the U.S. Postal Service system resulted in the contamination of several facilities. Although most of the facilities in which these letters were processed or received were heavily contaminated, the facilities were successfully remediated using approaches such as fumigation with chlorine dioxide or Vaporous Hydrogen Peroxide (VHP®). The likelihood of occurrence of another such incident has prompted the U.S. Environmental Protection Agency (EPA) to develop strategies, guidelines, and plans for decontaminating persons, equipment, and facilities to mitigate the risks of contamination after a biological weapons attack. This work is being conducted in accordance with Homeland Security Presidential Directives (HSPDs)-5, -7, -8, and -10 in a coordinated effort with other federal agencies. It is well agreed that available, effective, and economical decontamination methods that can be used over wide areas (outdoors and indoors) are required to increase preparedness to respond to such releases.
During the response to the U.S. Postal Service incident, fumigation was used primarily in heavily contaminated facilities. Other cleaning methods were used in (1) secondarily contaminated areas (areas handling cross-contaminated letters potentially in contact with the letters containing the anthrax spores and areas where anthrax contamination was tracked from primarily contaminated areas) and (2) primarily contaminated areas showing a minimal presence of anthrax spores. These other cleaning methods included combinations of disposal of contaminated items, vacuuming, and the use of liquid sporicides such as a pH-adjusted (pAB) bleach solution.
The use of commercially available robotic cleaners is a potentially effective decontamination technique for the complete removal or inactivation of Bacillus (B.) spores. This report discusses a project that investigated the ability of robotic cleaners to apply sporicidal liquid/wipe to floor surfaces and inactivate/remove B. atrophaeus spores, formerly known as B. globigii, as a surrogate for anthrax spores. Specifically, this report addresses the operational aspects of decontamination using robotic cleaners for large surface areas tested under conditions that mimic their realistic field use.
The primary objective of this project is to provide agencies responding to occurrences of toxic biological contamination with operational criteria that would lead to safe and efficacious decontamination of bacterial agents on various materials and surfaces. This report specifically addresses the use of two commercially available robotic cleaners in the removal or inactivation of B. anthracis spores under various conditions (type of sporicide and type of surface).
Consistent with sporicidal efficacy tests used to register sporicides under FIFRA, the current study utilized the generally accepted criterion of 6 Log Reduction to consider an approach effective. Tests were conducted using commonly used surface materials and environmental conditions. Recovery of no viable spores following treatment was considered highly effective.
Section 2 of this report discusses the experimental approach, Section 3 discusses the sampling approach, Section 4 discusses analytical procedures for microbial analysis, Section 5 presents the test results, and Section 6 discusses quality assurance (QA) and quality control (QC) for the project.
1
Robot No. Model Manufacturer Cleaning type Applicable Surface
Mint Automatic Floor Evolution Robotics, Pasadena, Sweep and R1 Hard floor Cleaner 4200 CA mop R2 iRobot Scooba® 390 iRobot, Bedford, MA Wet vacuum Hard floor
Table 2-1. Commercially Available Robotic Cleaners Evaluated
2 Experimental Approach
Testing was conducted at EPA’s facility at Research Triangle Park, NC. This section describes the project objectives and robots tested, experimental methods and materials, and the test organism and spore preparation.
Project Objectives and Robots Tested The project objective was to test commercially available, off-the shelf robotic cleaners equipped with commercially available wipe cloths and decontamination solution for decontaminating indoor flooring surface materials (laminate and vinyl) contaminated with B. atrophaeus spores (surrogate for anthrax). The two robots used this study have been previously evaluated to determine their effectiveness for sampling B. atrophaeus spores [1]. These two selected robots use liquid or wet wipes for floor cleaning, and these approaches are commonly used for surface decontamination. These robots were chosen to represent two major groups: cloth-wipe type and spray type.
Table 2-1 lists the two types of robotic cleaners evaluated under this project. Figure 2-1 shows each type of robot tested.
Figure 2-1. R1 (Left) and R2 (Right) Robotic Cleaners
2

The R1 robotic cleaner is the Mint Automatic Floor Cleaner 4200 supplied with a North Star navigation system to track the area cleaned. This robotic cleaner uses dry or wet disposable cleaning cloths or reusable microfiber cleaning cloths. The North Star navigation system tracks the area cleaned so that the cleaner will not miss a spot. For this project, the R1 used ready-to-use Hype-Wipe™ cloths or the manufacturer’s cloth wetted with a decontamination solution of pH adjusted bleach (pAB).
The R2 robotic cleaner is the iRobot Scooba® 390, which uses a four-stage, hard-floor cleaning process (preparation, washing, scrubbing, and using squeegees). For this project, the R2 used pAB or Spor-Klenz® in the cleaner’s reservoir directly sprayed onto the floor surface and then vacuumed back up. The amount of liquid remaining in the R2 reservoir was measured as an indication of further cleaning capacity. Table 2-2 summarizes the test matrix. This matrix was tested in triplicate.
Table 2-2. Test Matrix for Robotic Cleaners
Surface Material
Laminate
Vinyl
Vinyl
Laminate
Test Area Size
42 by 336 inches, L shape
Robot
R1
R2
R1
R2
R1
R2
R1
R2
Decontamination Wipe or Solution Inoculated Area
pAB
Hot spot test area measuring 12 by 12 inches inoculated at minimum target
concentration of 107 spores per square foot (ft2)
Hype-Wipe™ pAB
Spor-Klenz®
pAB Hype-Wipe™
pAB Spor-Klenz®
pAB
Broad area inoculation test areas include 12- by 12- inch sections inoculated at a
minimum target concentration of 106
spores/ft2
Hype-Wipe™ pAB
Spor-Klenz®
pAB Hype-Wipe™
pAB Spor-Klenz®
Experimental Methods and Materials This section describes the experimental testing and materials, including test coupon preparation and sterilization, B. atrophaeus spore preparation, coupon inoculation, and the robotic cleaner decontamination procedures. Digital video was collected during inoculation and decontamination. Photographs were taken of selected material coupons with any visible change due to the decontamination procedure.
3
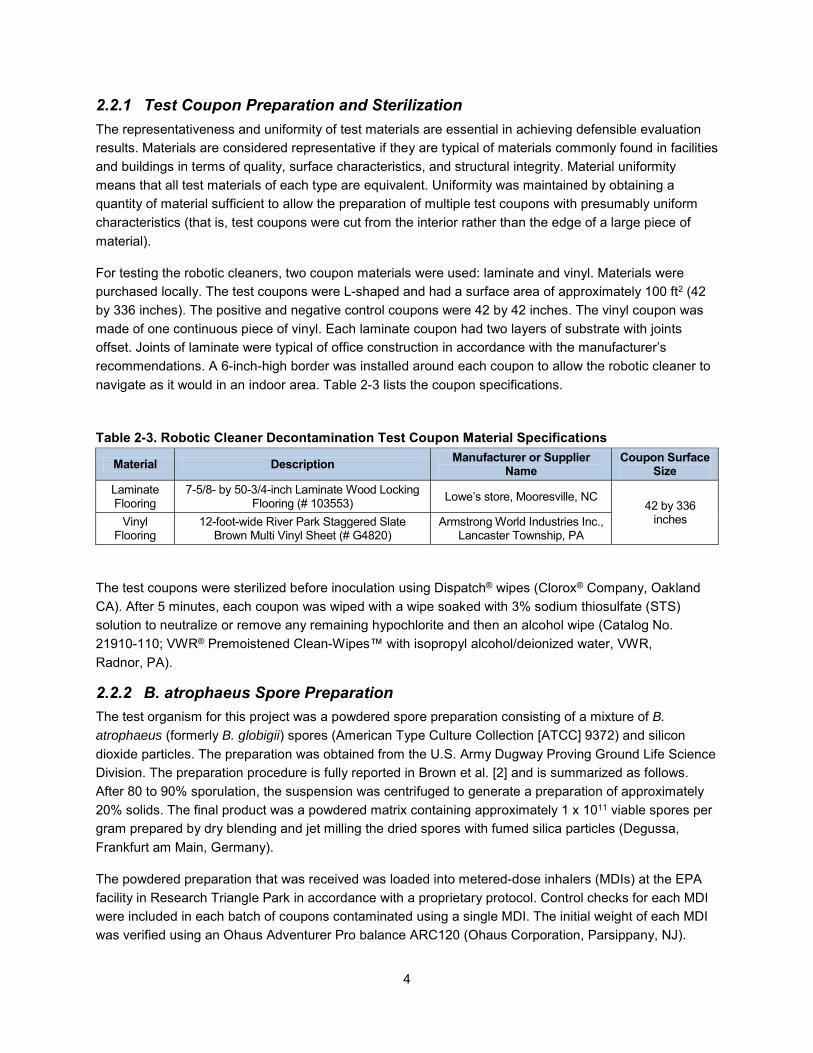
2.2.1 Test Coupon Preparation and Sterilization The representativeness and uniformity of test materials are essential in achieving defensible evaluation results. Materials are considered representative if they are typical of materials commonly found in facilities and buildings in terms of quality, surface characteristics, and structural integrity. Material uniformity means that all test materials of each type are equivalent. Uniformity was maintained by obtaining a quantity of material sufficient to allow the preparation of multiple test coupons with presumably uniform characteristics (that is, test coupons were cut from the interior rather than the edge of a large piece of material).
For testing the robotic cleaners, two coupon materials were used: laminate and vinyl. Materials were purchased locally. The test coupons were L-shaped and had a surface area of approximately 100 ft2 (42 by 336 inches). The positive and negative control coupons were 42 by 42 inches. The vinyl coupon was made of one continuous piece of vinyl. Each laminate coupon had two layers of substrate with joints offset. Joints of laminate were typical of office construction in accordance with the manufacturer’s recommendations. A 6-inch-high border was installed around each coupon to allow the robotic cleaner to navigate as it would in an indoor area. Table 2-3 lists the coupon specifications.
Table 2-3. Robotic Cleaner Decontamination Test Coupon Material Specifications
Material
Laminate Flooring
Vinyl Flooring
Description
7-5/8- by 50-3/4-inch Laminate Wood Locking Flooring (# 103553)
12-foot-wide River Park Staggered Slate Brown Multi Vinyl Sheet (# G4820)
Manufacturer or Supplier Name
Coupon Surface Size
Lowe’s store, Mooresville, NC 42 by 336
inches Armstrong World Industries Inc., Lancaster Township, PA
The test coupons were sterilized before inoculation using Dispatch® wipes (Clorox® Company, Oakland CA). After 5 minutes, each coupon was wiped with a wipe soaked with 3% sodium thiosulfate (STS) solution to neutralize or remove any remaining hypochlorite and then an alcohol wipe (Catalog No. 21910-110; VWR® Premoistened Clean-Wipes™ with isopropyl alcohol/deionized water, VWR, Radnor, PA).
2.2.2 B. atrophaeus Spore Preparation The test organism for this project was a powdered spore preparation consisting of a mixture of B. atrophaeus (formerly B. globigii) spores (American Type Culture Collection [ATCC] 9372) and silicon dioxide particles. The preparation was obtained from the U.S. Army Dugway Proving Ground Life Science Division. The preparation procedure is fully reported in Brown et al. [2] and is summarized as follows. After 80 to 90% sporulation, the suspension was centrifuged to generate a preparation of approximately 20% solids. The final product was a powdered matrix containing approximately 1 x 10¹¹ viable spores per gram prepared by dry blending and jet milling the dried spores with fumed silica particles (Degussa, Frankfurt am Main, Germany).
The powdered preparation that was received was loaded into metered-dose inhalers (MDIs) at the EPA facility in Research Triangle Park in accordance with a proprietary protocol. Control checks for each MDI were included in each batch of coupons contaminated using a single MDI. The initial weight of each MDI was verified using an Ohaus Adventurer Pro balance ARC120 (Ohaus Corporation, Parsippany, NJ).
4

Ongoing control checks for each MDI were included in the batches of coupons contaminated using a single MDI. The ongoing checks were performed using a Mettler-Toledo PL303 balance (Mettler-Toledo, Inc., Columbus, OH).
2.2.3 Coupon Inoculation Both the test and positive control coupons were inoculated independently with spores of B. atrophaeus in a separate dosing chamber called an aerosol deposition apparatus (ADA) designed to fit one 14- by 14-inch coupon of any thickness [3]. The ADA consisted of a stainless-steel hood sized to exactly cover the square test coupon. In the center at the top of the hood was an opening to attach an MDI and an MDI actuator. ADAs were sterilized with a 250-part-per-million, four-hour VHP® sterilization cycle, and MDI actuators were sterilized with ethylene oxide (EtO). Figures 2-2 and 2-3 show the ADA and MDI and MDI actuator used in this project.
Figure 2-2. ADA Figure 2-3. MDI and MDI Actuator
The MDI was discharged a single time into the ADA. The MDIs are claimed to provide 200 discharges per MDI. The number of discharges per MDI was tracked so that use did not exceed this value. Additionally, the weight of each MDI was determined after completion of the contamination of each coupon. The 14- by 14-inch stainless steel contamination control coupons were inoculated as the first and last coupons within a single group of coupons inoculated by any one MDI within a single test. Spores were allowed to settle onto the coupon surfaces for a minimum of 18 hours.
For the robotic cleaner hot spot tests, coupons were divided into eight areas (42- by 42-inch per area, Areas A through H), each area containing nine 14- by 14-inch sections (sections a through i). Section e of Area A was inoculated as shown in Figure 2-4.
5

Figure 2-4. Large Coupon Hot Spot Test Inoculation Area (Section e)
The minimum target concentration was 107 spores/ft2. The robotic cleaner decontamination test was started in section c of Area B.
For the robotic cleaner broad area inoculations, coupons were divided into 42- by 42-inch areas (Areas A through H), each containing nine 14- by 14-inch sections (sections a through i). Sections a, e, and i of Areas A, B, C, and D were inoculated as shown in Figure 2-5.
Figure 2-5. Large Coupon Broad Area Test Inoculation Areas (Sections a, e, and i)
The minimum target concentration was 106 spores/ft2 for this test. The robotic cleaner decontamination test was started in section c of Area B with the robot facing Area C. Routinely, the depositions exceeded 107 spores/ft2. In one of the broad area replicate tests, this minimum target concentration was not reached. However, the results for this test did not differ significantly from results for the other two replicate tests. Similar sections of all replicate test and positive control coupons were inoculated before moving on to the next section. All section “a” areas were dosed before the section “e” areas, which were dosed before the section “i” areas.
A log was maintained for each set of coupons dosed. Each record in this log recorded the unique coupon identifier, the MDI unique identifier, the date, the operator, the weight of the MDI before dissemination into the ADA, the weight of the MDI after dissemination, and the difference between these two weights. The coupon codes were pre-printed on the log sheet before coupon inoculation (dosing) began.
6
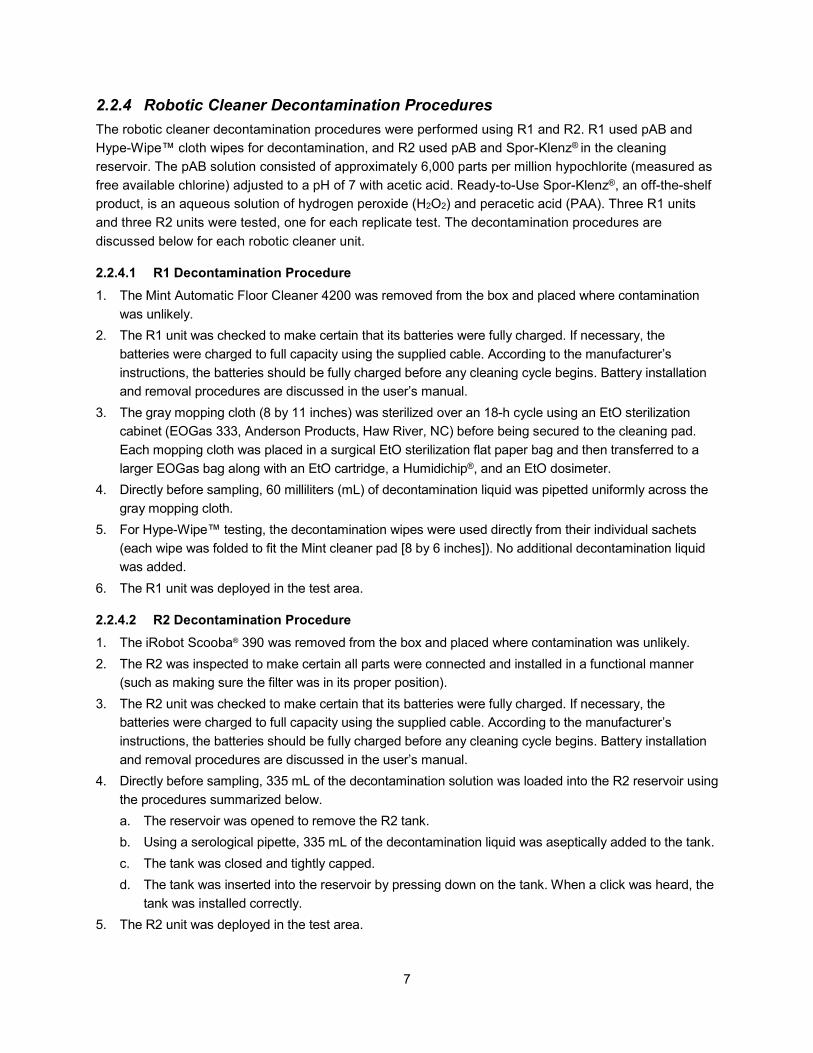
2.2.4 Robotic Cleaner Decontamination Procedures The robotic cleaner decontamination procedures were performed using R1 and R2. R1 used pAB and Hype-Wipe™ cloth wipes for decontamination, and R2 used pAB and Spor-Klenz® in the cleaning reservoir. The pAB solution consisted of approximately 6,000 parts per million hypochlorite (measured as free available chlorine) adjusted to a pH of 7 with acetic acid. Ready-to-Use Spor-Klenz®, an off-the-shelf product, is an aqueous solution of hydrogen peroxide (H2O2) and peracetic acid (PAA). Three R1 units and three R2 units were tested, one for each replicate test. The decontamination procedures are discussed below for each robotic cleaner unit.
2.2.4.1 R1 Decontamination Procedure 1. The Mint Automatic Floor Cleaner 4200 was removed from the box and placed where contamination
was unlikely. 2. The R1 unit was checked to make certain that its batteries were fully charged. If necessary, the
batteries were charged to full capacity using the supplied cable. According to the manufacturer’s instructions, the batteries should be fully charged before any cleaning cycle begins. Battery installation and removal procedures are discussed in the user’s manual.
3. The gray mopping cloth (8 by 11 inches) was sterilized over an 18-h cycle using an EtO sterilization cabinet (EOGas 333, Anderson Products, Haw River, NC) before being secured to the cleaning pad. Each mopping cloth was placed in a surgical EtO sterilization flat paper bag and then transferred to a larger EOGas bag along with an EtO cartridge, a Humidichip®, and an EtO dosimeter.
4. Directly before sampling, 60 milliliters (mL) of decontamination liquid was pipetted uniformly across the gray mopping cloth.
5. For Hype-Wipe™ testing, the decontamination wipes were used directly from their individual sachets (each wipe was folded to fit the Mint cleaner pad [8 by 6 inches]). No additional decontamination liquid was added.
6. The R1 unit was deployed in the test area.
2.2.4.2 R2 Decontamination Procedure 1. The iRobot Scooba® 390 was removed from the box and placed where contamination was unlikely. 2. The R2 was inspected to make certain all parts were connected and installed in a functional manner
(such as making sure the filter was in its proper position). 3. The R2 unit was checked to make certain that its batteries were fully charged. If necessary, the
batteries were charged to full capacity using the supplied cable. According to the manufacturer’s instructions, the batteries should be fully charged before any cleaning cycle begins. Battery installation and removal procedures are discussed in the user’s manual.
4. Directly before sampling, 335 mL of the decontamination solution was loaded into the R2 reservoir using the procedures summarized below. a. The reservoir was opened to remove the R2 tank. b. Using a serological pipette, 335 mL of the decontamination liquid was aseptically added to the tank. c. The tank was closed and tightly capped. d. The tank was inserted into the reservoir by pressing down on the tank. When a click was heard, the
tank was installed correctly. 5. The R2 unit was deployed in the test area.
7

Data Reduction Data reduction was performed on measurements of the total spores (CFU) recovered from each replicate coupon, average recovered CFU, and standard deviation (STD) for each group of coupons. The groups of coupons included the following for each combination of material type and extracted sample type:
• Positive control areas (replicate CFU, average recovered CFU, and STD);• Test areas (replicate CFU, average recovered CFU, and STD);• Procedural blank coupons.
Efficacy is defined as the extent (by LR) to which the agent recovered from the surface of the coupons after decontamination has been reduced compared to the positive control areas (not decontaminated). Efficacy was calculated using Equation 2-1, below, for each material within each combination of decontamination procedure (i) and test material (j).
LR = ∑ log( CFU ) / N −∑ log( CFU ) / N [2-1] ij ijc ijc ijk ijkc=1 k =1
Where,
LRi = Average LR of spores on a specific material surface
Average of the logarithm of the number of viable spores (determined ∑ log( ) /CFU ijc N C = by CFU) recovered on the control coupons [C = control, j = coupon c=1
number, and NC = number of coupons (1, j)] Average of the logarithm of the number of viable spores (determined by CFU) remaining on the surface of a decontaminated coupon [S =∑ log( ) /
k CFU ijk N ijk = decontaminated coupon, k = coupon number, and Nt = number of
coupons tested (1, k)]
When no viable B. atrophaeus spores were detected, the detection limit of the sample was used, and the efficacy was reported as greater than or equal to the value calculated using Equation 2-1.
The pooled standard error for the LR was calculated using Equation 2-2 as follows:
[2-2]
Where,
𝑆𝑆𝑈𝑈𝑈𝑈 = STD of LR values for untreated carriers (positive controls)
𝑆𝑆𝑇𝑇𝑇𝑇 = STD of LR values for treated carriers (post-decontamination samples) 𝑁𝑁𝑈𝑈𝑈𝑈 = Number of control samples 𝑁𝑁𝑇𝑇𝑇𝑇 = Number of post-decontamination samples
8

3 Sampling Approach
This section discusses the sampling approach, including sampling site environmental conditions, sampling media, wipe sampling procedures, sampling frequency, critical measurements, prevention of cross-contamination during sampling, collection of representative samples, sample storage and preservation, and sample holding time. Digital video was collected during sampling. Photographs were taken of selected material coupons with any visible change due to the sampling procedure.
Sampling Site Environmental Conditions Ambient environmental conditions such as temperature, relative humidity (RH), and barometric pressure can affect the evaporation rate of liquids from surfaces. All tests were conducted at room temperature, ambient RH, and ambient barometric pressure. RH and temperature were monitored during testing, and tests were conducted on days when environmental conditions were within 35 to 60% RH and 20 to 25 ºC. All coupons were conditioned at ambient conditions for one week before use.
Sampling Media Polyester rayon blend (PRB) 2- by 2-inch wipe (CurityTM All Purpose Sponges, Covidien, Mansfield, MA) samples were collected from each 42- by 14-inch section (three linear 14- by 14-inch sections labeled a, b, and c in Figure 2-4) of the positive control and test coupons. The PRB wipe samples were collected from coupon surfaces after the surfaces had dried following decontamination. A typical drying time of 30 minutes was used unless some combination of surface and decontamination method was still visually wet after that time.
The used cloths from R1 and liquid from the reservoirs from R2 were collected, neutralized, and plated as samples for initial tests. Wipe sampling always began in Area H. The robot decontamination always started in Area B (section g), but the robot always followed a random path. Stainless-steel coupons (14 by 14 inches) were sampled to provide results indicating the MDI stability during inoculation.
Wipe Sampling Procedures Wetted wipe sampling is typically used for small sample areas on nonporous smooth surfaces such as ceramics, vinyl, metals, painted surfaces, and plastics. The general approach is to use a moistened, sterile, nonwoven PRB cloth to wipe a specified area to recover bacteria, viruses, and biological toxins. The protocol used for this project was adapted from that provided by Brown et al [2]. The wetted wipe was used to sample a 14- by 42-inch area. Wipe samples were extracted in 20 mL of Phosphate Buffered Saline with 0.05% TWEEN® 20 (PBST), sonicated, vortexed, and subjected to serial 10-fold dilution and spread-plating. The sampling sequence started from Area H (sections c, f, and i or strip H3) and ended in Area A (sections a, d, g or strip A1).
LR was determined using the sum of viable spores collected on wipes from all sections of each coupon compared to the number of viable spores collected on wipes from positive control coupons not subjected to decontamination.
9

Sampling Frequency Table 3-1 lists the sampling frequency for all samples collected.
Table 3-1. Sampling Frequency Sample Type or Measurement Quantity Frequency Location or
Condition Purpose
Test Coupon Samples
Three samples per coupon section for a total of 24 wipe samples (8 sections)
One set per test Decontaminated To determine the number of viable spores after decontamination
Negative Control Coupon Samples
One per test coupon replicate for a total of 3 samples
One per decontamination
Not decontaminated
To determine extent of cross-contamination and the sterility of coupons
Positive Control Coupon Samples
One per test coupon replicate for a total of 3 samples
One set per material
Not decontaminated
To determine the number of viable spores recoverable from the coupons
MDI Control Coupon (stainless steel) Samples
At least two per inoculation event as the first and the last actuation of the MDI
One set per inoculation
Not decontaminated
To determine the number of viable spores deposited onto the coupons, and to assess the stability of the MDI
Laboratory Material Blank Samples Three per material One per use of
material Not applicable To demonstrate sterility of extraction and plating materials
Material Sterility Check (swab) Samples
One per sterilized batch of ADAs, coupons, and robots
Once before testing Not applicable To demonstrate sterility of
ADAs
Decontamination Liquid Test-dependent Once before and
after each test Not applicable
To determine the concentration of active ingredients in the solution, and to verify the solution is within the target concentration
RH and Temperature 1 Logged every 10
seconds Glovebox To determine environmental conditions during decontamination
10

Critical Measurements Table 3-2 lists critical and noncritical measurements for each relevant sample type.
Table 3-2. Critical and Noncritical Measurements
Sample Type Critical Measurements Non-critical Measurements
Test Coupon Samples
Plated volume, incubation temperature, extracted volume, and colony forming units (CFU)
Storage time and temperature
Negative Control Coupon Samples Plated volume, incubation temperature, extracted volume, and CFU Storage time and
temperature Positive Control Coupon Samples Plated volume, incubation temperature, extracted volume, and CFU Storage time and
temperature Field Blank Coupon Samples Plated volume, incubation temperature, extracted volume, and CFU Storage time and
temperature Laboratory Blank Coupon Samples Plated volume, incubation temperature, extracted volume, and CFU Storage time and
temperature Laboratory Material Blank Samples Plated volume, incubation temperature, extracted volume, and CFUs Storage time and
temperature pAB pH, hypochlorite concentration, and storage time Temperature Spor-Klenz® pH, H2O2 concentration, PAA concentration, and storage time Temperature
Prevention of Cross-Contamination of Samples during Sampling Sampling posed a potentially significant opportunity for cross-contamination of samples. To minimize the possibility of cross-contamination, the management controls summarized below were followed.
• Lines were drawn with a permanent marker to delimit the sampling sections, and sampling was contained within these lines.
• In accordance with aseptic technique, a two-person sampling team was used, consisting of a “sampler” and a “sample handler.”
• The sample handler was designated as the only person to operate the automated dosing apparatus (ADA) and handle the test coupons during the sampling event.
• The sampler handled only the sampling media (wipes and liquids) and performed the surface sampling of the test coupons.
• At the completion of each sampling event, each member of the sampling team changed gloves in preparation for working with the next sample.
As a further precaution to avoid cross-contamination of samples, the order of coupon sampling was from coupons expected to be the least contaminated with B. atrophaeus to those expected to be most contaminated as follows: (1) all blank coupons, (2) all decontaminated coupons, and (3) positive control coupons.
The National Homeland Security Research Center (NHSRC) Biocontaminant Laboratory (biolab) located at the EPA facility in Research Triangle Park, NC, analyzed the samples with strict adherence to aseptic laboratory techniques to recover, plate, culture, and analyze samples. The order of analysis was the same as the order of sampling as follows: (1) all blank coupons, (2) all decontaminated coupons, and (3) all positive control coupons.
11

Collection of Representative Samples The representativeness and uniformity of test coupon materials was considered essential in achieving defensible evaluation results. Material representativeness was achieved by using materials typical of those currently used in buildings and facilities in terms of quality, surface characteristics, and structural integrity. The materials conformed to industry standards or specifications for indoor use. Material uniformity was achieved by obtaining a quantity of material sufficient to allow multiple test samples to be prepared with presumably uniform characteristics.
Sample Storage and Preservation After sample collection, sample integrity was accomplished through triple containment of the samples in: (1) a sample collection container, (2) a sterile bag with the exterior sterilized during the sample packaging process, and (3) a clean container holding all samples from a test. All individual sample containers remained sealed in the coupon decontamination laboratory and during transport to the NHSRC Biocontaminant Laboratory. The sampling person did not handle any samples after they were relinquished to the sample handler during placement into the primary sample container.
All samples received were stored in a refrigerator at 4 °C ± 2 °C until analysis. All samples were allowed to stabilize at room temperature for one hour before analysis.
12

4 Analytical Procedures for Microbiological Analyses
This section discusses analytical procedures for microbiological analyses, including the filtration and plating of bacteria from the PRB wipe samples used to determine the spores remaining on the coupons. The NHSRC Biocontaminant Laboratory analyzed all samples for spore presence (sterility check samples) and to quantify the CFU per sample. A laboratory notebook was used to document the details of each sampling event (or test).
Spores were extracted from the PRB wipe samples by adding 20 mL PBST to each tube, then agitating the tubes using a vortex mixer (set to maximum rotation) for wo minutes in ten-second intervals. For all sample types, after extraction, the liquid extracts were serially diluted ten-fold (in PBST). The PBST buffer used was subjected to a five-stage serial dilution (10-1 to 10-5). Then 0.1 mL of the extract was spread-plated onto tryptic soy agar (TSA) plates in triplicate and incubated overnight (18 to 24 hours) at 35 °C ± 2 °C. CFU were enumerated visually. Only dilution plates containing between 30 and 300 CFU were used for recovery estimates. Extracts were diluted and replated if none of the 10-fold dilutions resulted in all three plates containing CFU counts within the acceptable range.
Total spore recovery was calculated by multiplying the mean CFU counts from triplicate plates by the inverse of the volume plated, by the dilution factor, and finally by the total volume of the extract. Any samples with CFU counts below the acceptable range (30 to 300 CFU) on the primary dilution plates were subsequently filter-plated through 0.2-micrometer-pore-size filters (Nalgene, Rochester, NY), with the filters placed onto TSA plates, followed by incubation at 35 °C ± 2 ºC for 18 to 24 hours. The CFU counts from these plates were used to calculate recovery in these circumstances. Figure 4-1 shows a dilution plate and a filter plate with colonies of B. atrophaeus.
Figure 4-1. Dilution Plate (Left) and Filter Plate (Right) Showing Colonies of B. atrophaeus
13
5 Test Results
This section discusses data reduction and the results of the tests evaluating the R1 and R2 robotic cleaners for inactivating B. atrophaeus on two test material surfaces (laminate and vinyl). Appendix A to this report provides a complete set of spatial sampling data for each test condition.
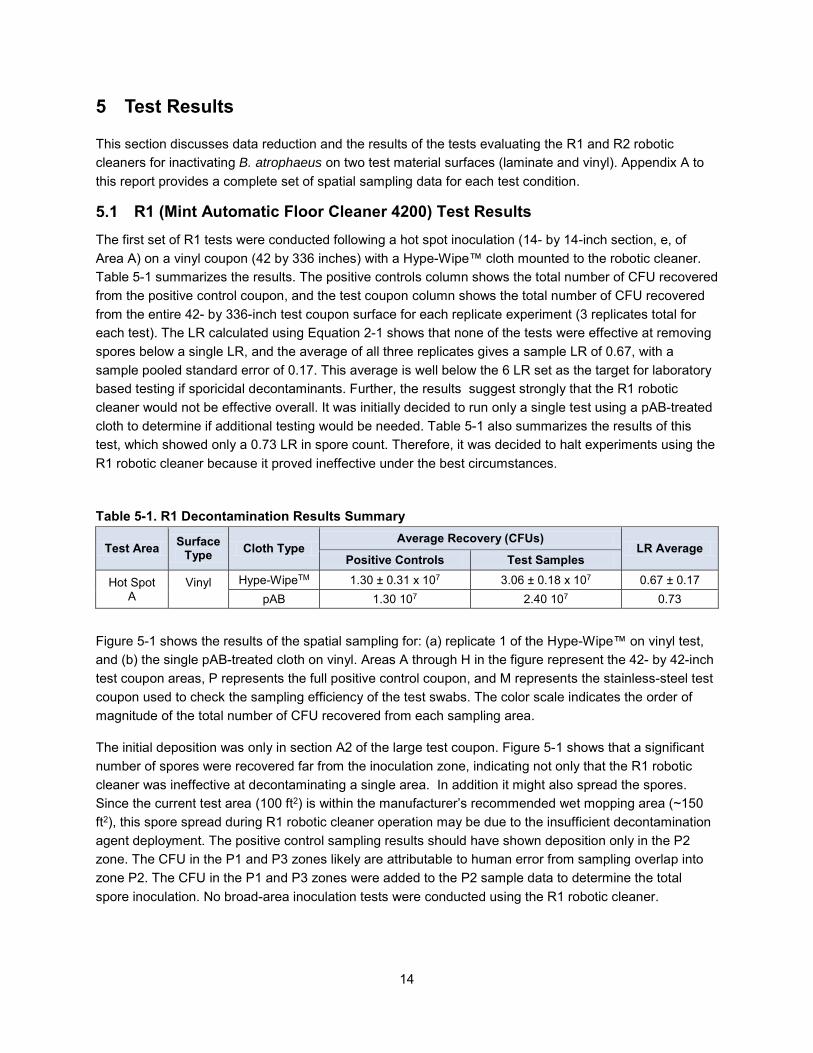
R1 (Mint Automatic Floor Cleaner 4200) Test Results The first set of R1 tests were conducted following a hot spot inoculation (14- by 14-inch section, e, of Area A) on a vinyl coupon (42 by 336 inches) with a Hype-Wipe™ cloth mounted to the robotic cleaner. Table 5-1 summarizes the results. The positive controls column shows the total number of CFU recovered from the positive control coupon, and the test coupon column shows the total number of CFU recovered from the entire 42- by 336-inch test coupon surface for each replicate experiment (3 replicates total for each test). The LR calculated using Equation 2-1 shows that none of the tests were effective at removing spores below a single LR, and the average of all three replicates gives a sample LR of 0.67, with a sample pooled standard error of 0.17. This average is well below the 6 LR set as the target for laboratory based testing if sporicidal decontaminants. Further, the results suggest strongly that the R1 robotic cleaner would not be effective overall. It was initially decided to run only a single test using a pAB-treated cloth to determine if additional testing would be needed. Table 5-1 also summarizes the results of this test, which showed only a 0.73 LR in spore count. Therefore, it was decided to halt experiments using the R1 robotic cleaner because it proved ineffective under the best circumstances.
Table 5-1. R1 Decontamination Results Summary
Test Area Surface Type Cloth Type
Average Recovery (CFUs) LR Average
Positive Controls Test Samples
Hot Spot A
Vinyl Hype-WipeTM 1.30 ± 0.31 x 10⁷ 3.06 ± 0.18 x 10⁷ 0.67 ± 0.17 pAB 1.30 107 2.40 107 0.73
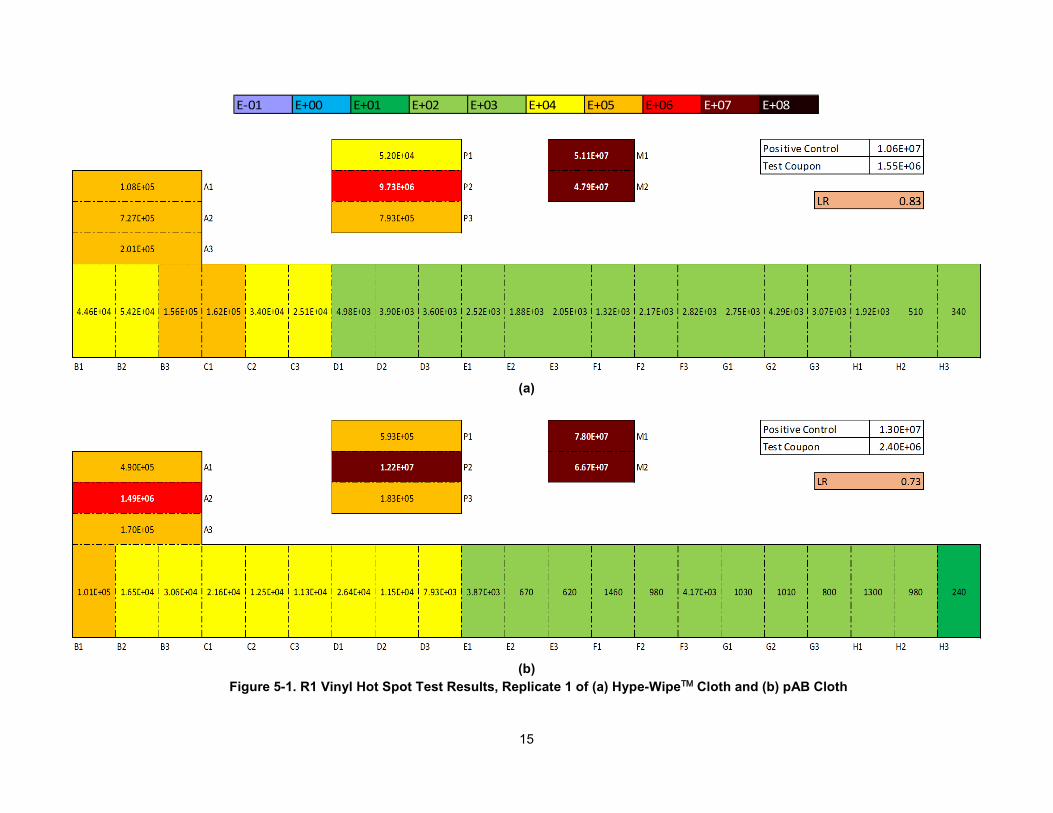
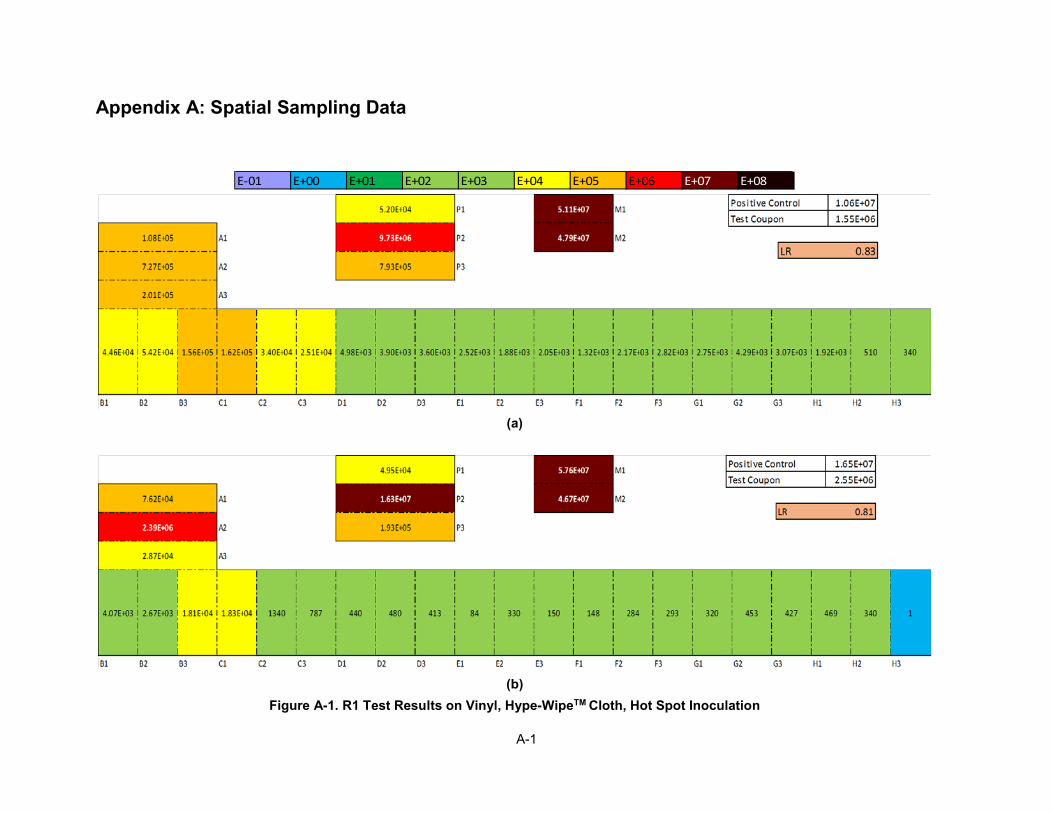
Figure 5-1 shows the results of the spatial sampling for: (a) replicate 1 of the Hype-Wipe™ on vinyl test, and (b) the single pAB-treated cloth on vinyl. Areas A through H in the figure represent the 42- by 42-inch test coupon areas, P represents the full positive control coupon, and M represents the stainless-steel test coupon used to check the sampling efficiency of the test swabs. The color scale indicates the order of magnitude of the total number of CFU recovered from each sampling area.
The initial deposition was only in section A2 of the large test coupon. Figure 5-1 shows that a significant number of spores were recovered far from the inoculation zone, indicating not only that the R1 robotic cleaner was ineffective at decontaminating a single area. In addition it might also spread the spores. Since the current test area (100 ft2) is within the manufacturer’s recommended wet mopping area (~150 ft2), this spore spread during R1 robotic cleaner operation may be due to the insufficient decontamination agent deployment. The positive control sampling results should have shown deposition only in the P2 zone. The CFU in the P1 and P3 zones likely are attributable to human error from sampling overlap into zone P2. The CFU in the P1 and P3 zones were added to the P2 sample data to determine the total spore inoculation. No broad-area inoculation tests were conducted using the R1 robotic cleaner.
14
E-01 E+00 E+01 E+02 E+03 E+04 E+05 E+06 E+07 E+08
(a)
(b)Figure 5-1. R1 Vinyl Hot Spot Test Results, Replicate 1 of (a) Hype-WipeTM Cloth and (b) pAB Cloth
15
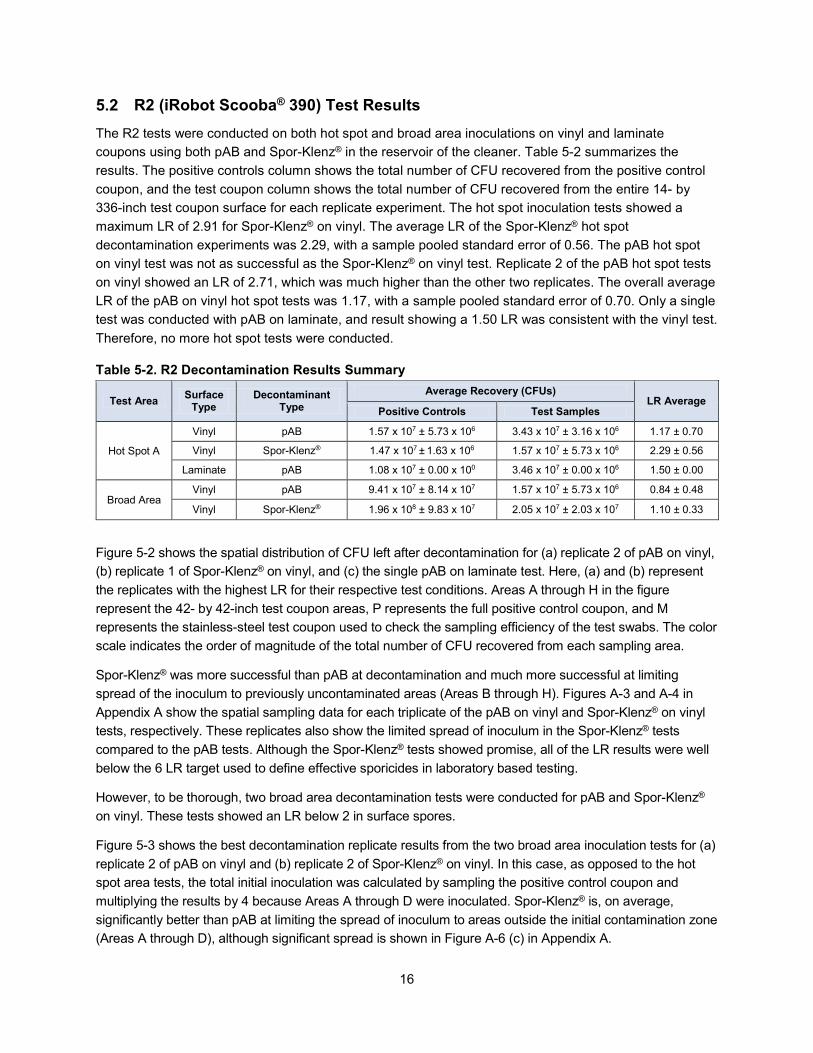
R2 (iRobot Scooba® 390) Test Results The R2 tests were conducted on both hot spot and broad area inoculations on vinyl and laminate coupons using both pAB and Spor-Klenz® in the reservoir of the cleaner. Table 5-2 summarizes the results. The positive controls column shows the total number of CFU recovered from the positive control coupon, and the test coupon column shows the total number of CFU recovered from the entire 14- by 336-inch test coupon surface for each replicate experiment. The hot spot inoculation tests showed a maximum LR of 2.91 for Spor-Klenz® on vinyl. The average LR of the Spor-Klenz® hot spot decontamination experiments was 2.29, with a sample pooled standard error of 0.56. The pAB hot spot on vinyl test was not as successful as the Spor-Klenz® on vinyl test. Replicate 2 of the pAB hot spot tests on vinyl showed an LR of 2.71, which was much higher than the other two replicates. The overall average LR of the pAB on vinyl hot spot tests was 1.17, with a sample pooled standard error of 0.70. Only a single test was conducted with pAB on laminate, and result showing a 1.50 LR was consistent with the vinyl test. Therefore, no more hot spot tests were conducted.
Table 5-2. R2 Decontamination Results Summary
Test Area Surface Type
Decontaminant Type
Average Recovery (CFUs) LR Average
Positive Controls Test Samples
Vinyl pAB 1.57 x 10⁷ ± 5.73 x 10⁶ 3.43 x 10⁷ ± 3.16 x 10⁶ 1.17 ± 0.70
Hot Spot A Vinyl Spor-Klenz® 1.47 x 10⁷ ± 1.63 x 10⁶ 1.57 x 10⁷ ± 5.73 x 10⁶ 2.29 ± 0.56
Laminate pAB 1.08 x 10⁷ ± 0.00 x 100 3.46 x 10⁷ ± 0.00 x 10⁶ 1.50 ± 0.00
Broad Area Vinyl pAB 9.41 x 10⁷ ± 8.14 x 10⁷ 1.57 x 10⁷ ± 5.73 x 10⁶ 0.84 ± 0.48
Vinyl Spor-Klenz® 1.96 x 10⁸ ± 9.83 x 10⁷ 2.05 x 10⁷ ± 2.03 x 10⁷ 1.10 ± 0.33
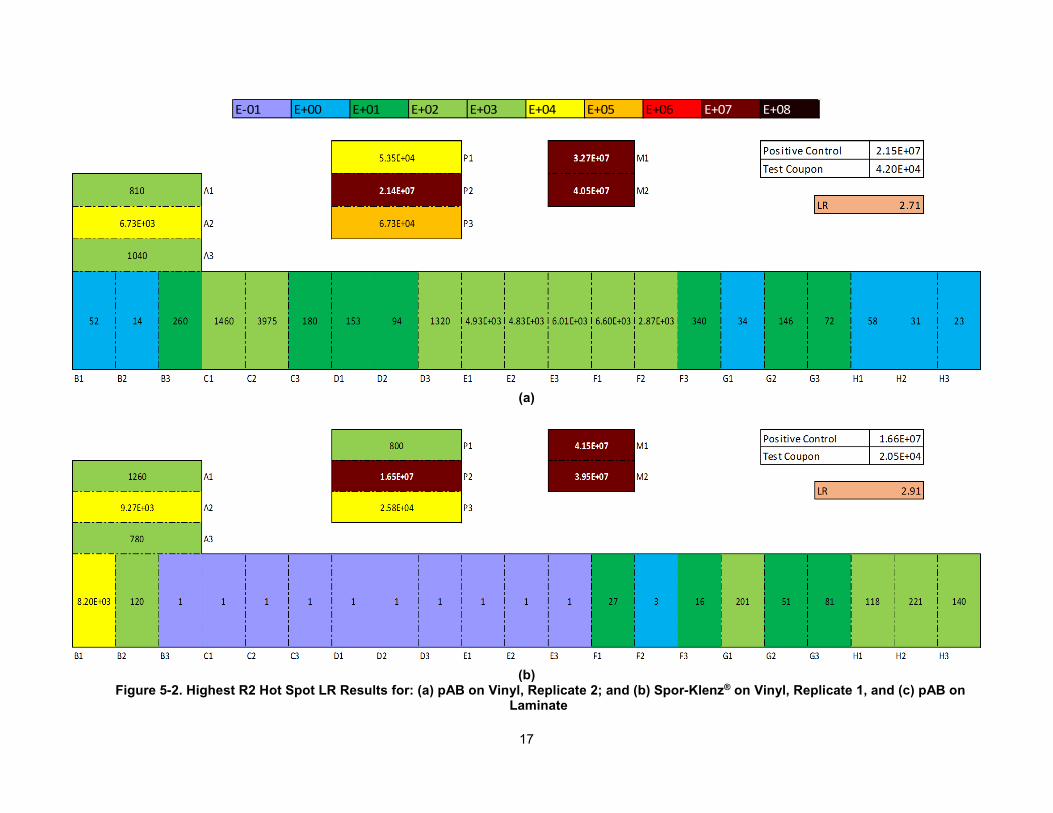
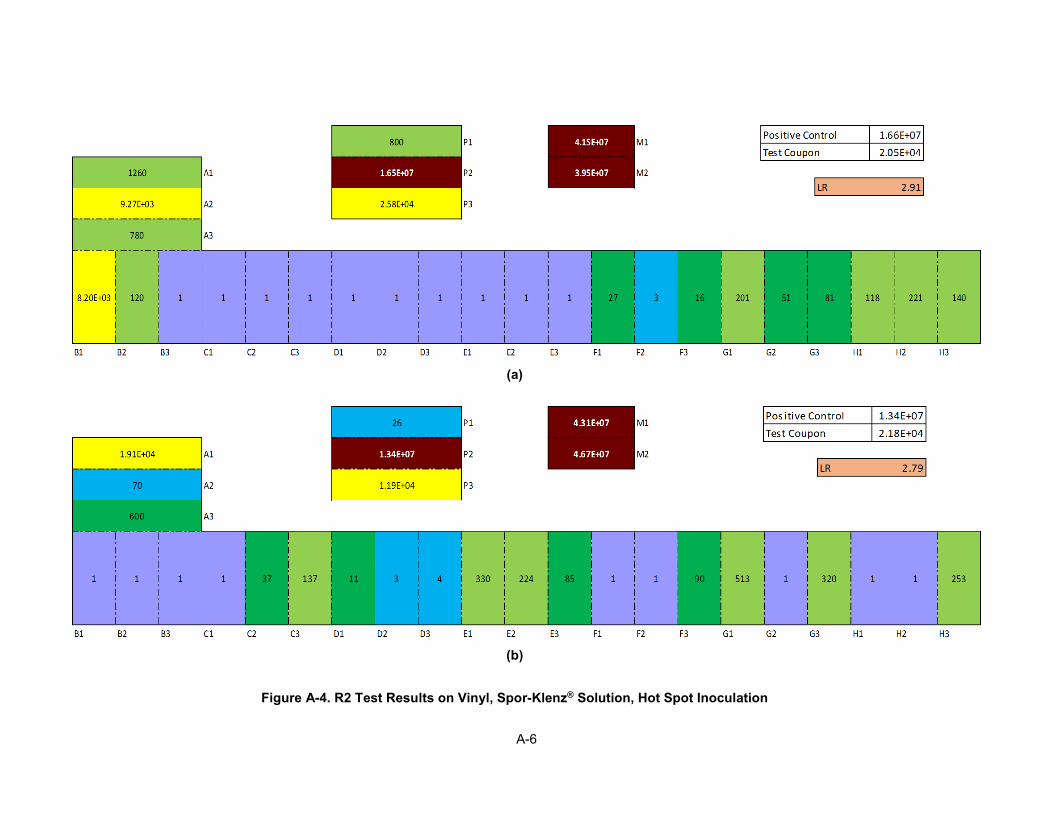
Figure 5-2 shows the spatial distribution of CFU left after decontamination for (a) replicate 2 of pAB on vinyl, (b) replicate 1 of Spor-Klenz® on vinyl, and (c) the single pAB on laminate test. Here, (a) and (b) represent the replicates with the highest LR for their respective test conditions. Areas A through H in the figure represent the 42- by 42-inch test coupon areas, P represents the full positive control coupon, and M represents the stainless-steel test coupon used to check the sampling efficiency of the test swabs. The color scale indicates the order of magnitude of the total number of CFU recovered from each sampling area.
Spor-Klenz® was more successful than pAB at decontamination and much more successful at limiting spread of the inoculum to previously uncontaminated areas (Areas B through H). Figures A-3 and A-4 in Appendix A show the spatial sampling data for each triplicate of the pAB on vinyl and Spor-Klenz® on vinyl tests, respectively. These replicates also show the limited spread of inoculum in the Spor-Klenz® tests compared to the pAB tests. Although the Spor-Klenz® tests showed promise, all of the LR results were well below the 6 LR target used to define effective sporicides in laboratory based testing.
However, to be thorough, two broad area decontamination tests were conducted for pAB and Spor-Klenz®
on vinyl. These tests showed an LR below 2 in surface spores.
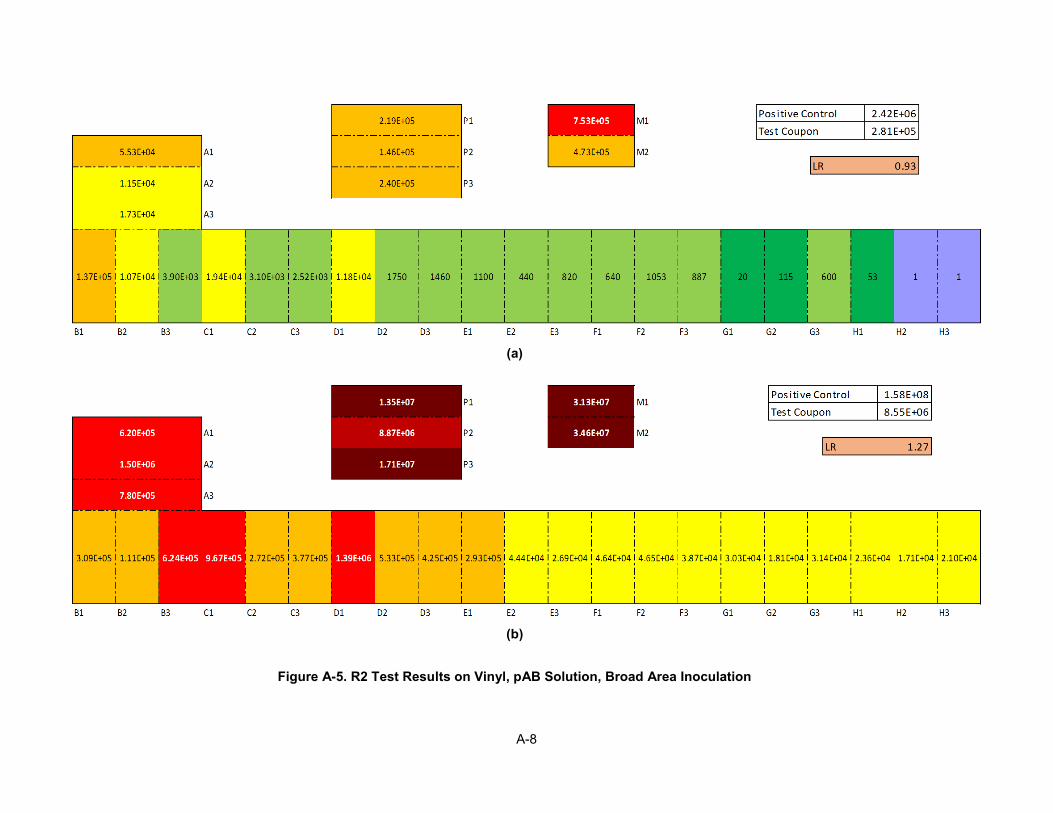
Figure 5-3 shows the best decontamination replicate results from the two broad area inoculation tests for (a) replicate 2 of pAB on vinyl and (b) replicate 2 of Spor-Klenz® on vinyl. In this case, as opposed to the hot spot area tests, the total initial inoculation was calculated by sampling the positive control coupon and multiplying the results by 4 because Areas A through D were inoculated. Spor-Klenz® is, on average, significantly better than pAB at limiting the spread of inoculum to areas outside the initial contamination zone (Areas A through D), although significant spread is shown in Figure A-6 (c) in Appendix A.
16
E-01 E+00 E+01 E+02 E+03 E+04 E+05 E+06 E+07 E+08
(a)
(b) Figure 5-2. Highest R2 Hot Spot LR Results for: (a) pAB on Vinyl, Replicate 2; and (b) Spor-Klenz® on Vinyl, Replicate 1, and (c) pAB on
Laminate
17

(c)
Figure 5-2. [Continued]
18

(a)
(b)
Figure 5-3. Highest R2 LR Results, Broad Area Inoculation
19

6 Quality Assurance and Quality Control
This project was performed under the approved Category III quality assurance project plan (QAPP), “Evaluation of Sporicidal Wipes and Liquid Agents for Decontamination of Anthrax-Contaminated Surfaces by Hand and Robotic Cleaners,” November 2014.
All test activities were documented via narratives in laboratory notebooks and the use of digital photography. The documentation included, but was not limited to, a record for each decontamination procedure, any deviations from the QAPP, and physical impacts on materials. All tests were conducted in accordance with established Decontamination Technologies Research Laboratory (DTRL) and NHSRC Biocontaminant Laboratory procedures to ensure repeatability and adherence to the data quality validation criteria set for this project.
Criteria for Critical Measurements/Parameters The data quality objectives (DQOs) are used to determine the critical measurements needed to address the stated objectives and specify tolerable levels of potential errors associated with simulating the prescribed decontamination environments. The following measurements were deemed critical to accomplish part or all of the project objectives:
• Weight of the wipes;
• Sample volume collected;
• Plated volume; and
• Counts of CFU.
The data quality indicators (DQIs) for the critical measurements listed in Table 6-1 were used to determine if the collected data met the quality assurance objectives. If a measurement method or device resulted in data that did not meet these goals, the data derived from the critical measurement were rejected. For instance, if the plated volume of a sample was not known (i.e., was not 100% complete), then that sample was declared invalid. If a collected sample was lost or did not meet the criteria for other reasons, then another sample was collected to take its place.
Table 6-1. Critical Measurement Criteria Critical Measurement Measurement Device Accuracy Precision Detection Limit
Sample volume Serological pipette Subdivision 0.5 mL + 0.2 mL + 0.1 mL
Plated volume Pipette ± 2% ± 1% NA
CFU/plate Counting ± 10% (between 2 counters) ± 5 1 CFU
Weight Scale 0.004 g 0.0001 g NA NA = not applicable
20
Quality Control Checks Many QA/QC checks were used in this project to ensure that the data collected met all the critical measurements listed in Table 6-1. The measurement/parameter criteria were set at the most stringent level that can routinely be achieved. The integrity of the sample during collection and analysis was evaluated. Control samples and procedural blanks were included along with the test samples so that well-controlled quantitative values were obtained. Background checks for the presence of bacterial spores were included as part of the standard protocol. Replicate coupons were included for each set of test conditions. Specific quality control checks that were performed in this project are described in the following sections.
6.2.1 Integrity of Samples and Supplies Samples were carefully maintained and preserved to ensure their integrity. Samples were stored away from standards or other samples which could possibly cross-contaminate them.
Project personnel carefully checked supplies and consumables prior to use to verify that they met specified project quality objectives. All pipettes were calibrated yearly by an outside contractor (Calibrate, Inc.), incubation temperature was monitored using NIST-traceable thermometers, and balances were calibrated yearly by the EPA Metrology Laboratory.
6.2.2 NHRSC Biolab Control Checks Quantitative standards do not exist for biological agents. Quantitative determinations of organisms in this investigation did not involve the use of analytical measurement devices. Rather, the CFU were enumerated manually and recorded. If the CFU count for bacterial growth did not fall within the target range, the sample was either filtered or re-plated. For each set of results (per test), a second c ount was performed on 25 percent of the plates within the quantification range (plates with 30 - 300 CFU). All second c ounts were found to be within 10 percent of the original count.
QA/QC Sample Acceptance Criteria The acceptance criteria for the critical CFU measurements were set at the most stringent level that could be achieved routinely. Positive controls and procedural blanks were included along with the test samples in the experiments so that well-controlled quantitative values were obtained. Background checks were also included as part of the standard protocol. Replicate coupons were included for each set of test conditions. Further QC samples were collected and analyzed to check the ability of the NHSRC Biolab to culture the test organism, as well as to demonstrate that materials used in this effort did not themselves contain spores. The checks included the following:
• Negative control coupons: sterile coupons that underwent the same sampling process without spore deposition.
• Field blank coupons: sterile coupons carried to the decontamination location but not decontaminated.
• Laboratory blank coupons: sterile coupons not removed from NHSRC Biolab. • Laboratory material coupons: includes all materials, individually, used by the NHSRC Biolab in
sample analysis. • Stainless steel positive control coupons: coupons inoculated but not decontaminated.
21

QA/QC acceptance criteria are shown in Table 6-2. These provide assurances against cross-contamination and other biases of microbiological samples.
Table 6-2. QA/QC Sample Acceptance Criteria Sample Type Purpose Acceptance Criteria Corrective Actions Frequency
Negative control coupons
Determine extent of cross-contamination in test area.
No detectable spores.
No corrective actions were taken. Values on coupons were considered to have resulted from cross-contamination.
One per test
Field blank coupons
Verify the presence of coupons does not introduce contamina-tion into samples.
No detectable spores.
Determine source of contamination and remove.
One per sample type per test
Laboratory blank coupons
Verify the sterility of coupons using swabs
No detectable spores.
Determine source of contamination and remove.
One per test per coupon type
Laboratory material coupons
Verify the sterility of materials used to analyze viable spore count.
No detectable spores.
Determine source of contamination and remove.
Three per material per test
Blank TSA sterility control (plate incubated, but not inoculated)
Controls for sterility of plates.
No observed growth following incubation.
All plates are incubated prior to use, so any contaminated ones were discarded.
Each plate
Positive control coupons
Used to determine the extent of inoculation on the coupons.
5 x 10⁶ CFU, ± 0.5 log or 5 x 10⁴ CFU, ± 0.5 log.
Outside target range: discuss potential impact on results with EPA WACOR; correct loading procedure for next test and repeat depending on decided impact.
One per test
Inoculation control coupons
Used to determine drift in the MDI.
CFU recovered from the first coupon must be ±0.5 log of the last coupon.
Reject results and repeat test.
Two per inoculation
Replicate plating of diluted microbiological samples
Used to determine variability in CFU counts.
Reportable CFU of triplicate plates must be within 100%. Reportable CFU are between 30 and 300 CFU per plate.
Re-plate sample. Each sample
22

6.3.1 QA/QC Test Results Validation
The QA/QC test results for the whole sampling campaign are shown in Table 6-3. All field blanks and inoculum blanks were found to be non-detects. However, some of the negative control blanks (2 out of 17) were found to have been on the order of 1 x 10³ CFU per coupon. Although some of the negative controls were detects, they do not have a significant bearing on the overall results since decontamination results of no more than 3 LR were found.
Table 6-3. QA/QC Test Results
Sample Robot Material Inoculation Type
Decontamination Type
Average Recovery (CFU per coupon)
Negative Control Field Blank
Inoculum Control Blank
Replicate 1
Mint
Vinyl
Hot-Spot A Hype-Wipe™
9 ND 1 Replicate 2 83 ND ND Replicate 3 671 ND ND Replicate 1 pAB 375 ND ND Replicate 1
Scooba
Broad Area
pAB 2 ND ND
Replicate 2 ND ND ND Replicate 3 7 ND ND Replicate 1
Spor-Klenz®
49 ND ND Replicate 2 6 ND ND Replicate 3 26 ND ND Replicate 1
Hot-Spot A
pAB 33 ND ND
Replicate 2 956 4 ND Replicate 3 22 ND 2 Replicate 1
Spor-Klenz®
ND ND ND Replicate 2 4 ND ND Replicate 3 32 ND ND Replicate 1 Laminate pAB 4 ND ND
6.3.2 Sample Holding Time After sample collection for a single test was completed, all biological samples collected for that test were immediately transported to the NHSRC biolab along with the appropriate chain of custody form(s). The QAPP for this project stated that samples were to be stored no longer than five days before beginning primary analysis. However, given the volume of samples generated over a short period of time, the samples had to be stored in the refrigerator for longer than five days before primary analysis began. Therefore, tests were conducted to evaluate the potential reduction of bacterial spores in the wipe sample containers as a function of time. The results from the sample holding tests showed no reduction of bacterial spores. Details of this testing and the results are provided in Appendix B.
23

7 Summary
The R1 tests using either Hype-WipeTM or pAB treated wipe mounted to the robot demonstrated an overall log reduction of less than 1. The results of a set of experiments conducted to determine the extent of potential spreading of the contamination, using the R1 with either Hype-WipeTM or a regular mopping cloth impregnated with 60 mL of pAB, show that the R1 was not effective (less than 1 log reduction) enough to decontaminate a hot spot area and R1 operation increases the total area contaminated by spreading. This may be due to the insufficient liquid decontamination agent available for the entire test surfaces. The robot is programmed to cover the entire test area (100 ft2) which is within the manufacture estimated coverage area (150ft2), so it is highly possible that the decontamination agent from the robot might have run out before completion.
The R2 tests resulted in a better decontamination efficacy, with Spor-Klenz faring better than pAB in limiting the spread of the contamination and less spreading of the contamination outside the inoculation zone. However, a sub 3 log reduction overall decontamination efficacy was found for this robot, independent of the type of liquid decontaminant used. For laboratory based testing, demonstration of a 6 LR is the target for an effective sporicide under the Federal Insecticide, Fungicide, and Rodenticide Act (FIFRA). The low efficacy may be due to the lack of contact time between decontamination agent and surface since the R2 is designed to apply the liquid and retrieve it in a relatively short period of time (less than 5 seconds). The previous field study used the 10 min contact time of pH-amended bleach on all surfaces as application procedure and this application method was highly efficacious.4
In summary neither robot successfully performed a 6 Log reduction in total spore count nor significantly reduced the spores loading on the material surfaces. Spor-Klenz appears to be more successful than pAB and increasing the reservoir for the Scooba robot may increase the log reduction. Spor-Klenz did help limit the spread of the contaminant to new areas though some spread of viable spores was still seen.
24

8 References
1. Lee, S.D., Calfee, M.W., Mickelsen, L., Clayton, M., and Touati, A. Scenario-based evaluation of commercially available cleaning robots for collection of Bacillus spores from environmental surfaces. Remediation, 2014, 24(2):123–133.
2. Brown, G.S., Betty, R.G., Brockmann, J.E., Lucero, D.A., Souza, C.A., Walsh, K.S., Boucher, R.M., Tezak, M.S., Wilson, M.C., Rudolph, T., Lindquist, H.D., and Martinez, K.F. Evaluation of rayon swab surface sample collection method for Bacillus spores from nonporous surfaces. Journal of Applied Microbiology, 2007, 103(4):1074–1080.
3. Lee, S.D., Ryan, S.P., and Snyder, E.G. Development of an aerosol surface inoculation method for Bacillus spores. Applied and Environmental Microbiology, 2011, 77(5):1638–1645.
4. U.S. EPA. Bio-Response Operational Testing and Evaluation (BOTE) Project - Phase 1: Decontamination Assessment. U.S. Environmental Protection Agency, Washington, DC, EPA/600/R-13/168, 2013.
25
Appendix A: Spatial Sampling Data
E-01 E+00 E+01 E+02 E+03 E+04 E+05 E+06 E+07 E+08
(a)
(b) Figure A-1. R1 Test Results on Vinyl, Hype-WipeTM Cloth, Hot Spot Inoculation
A-1

(c)
Figure A-1 [continued]. R1 Test Results on Vinyl, Hype-WipeTM Cloth, Hot Spot Inoculation
A-2
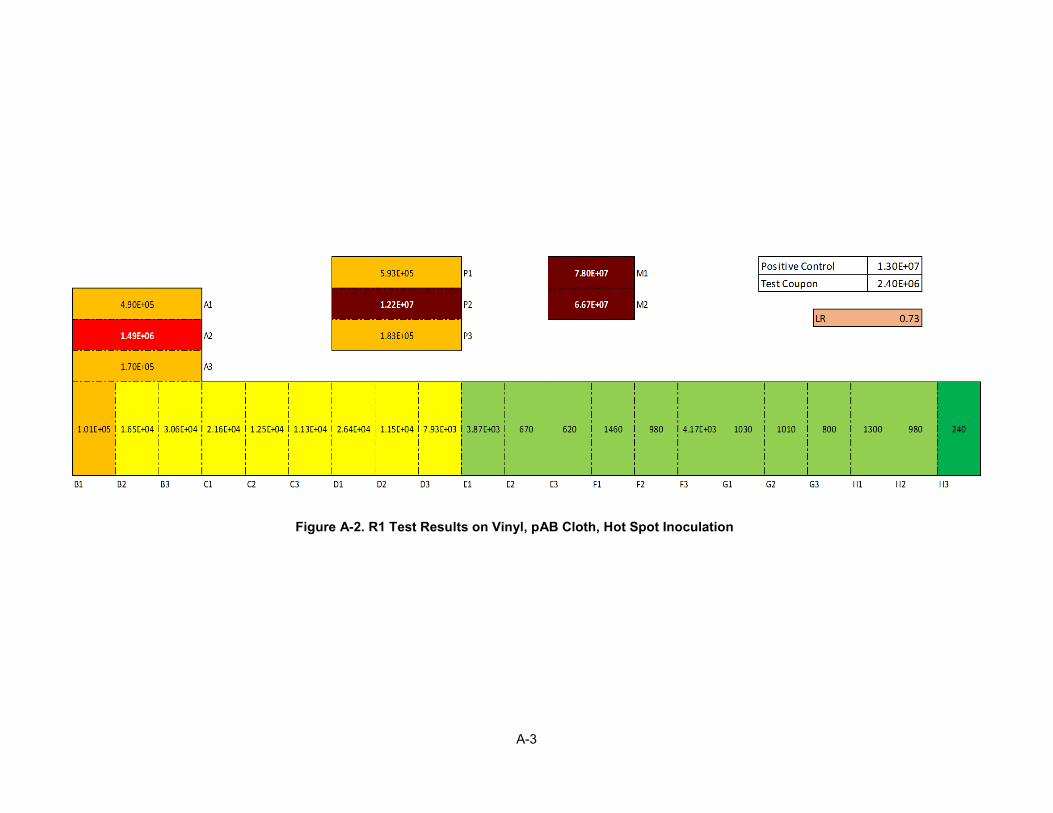
Figure A-2. R1 Test Results on Vinyl, pAB Cloth, Hot Spot Inoculation
A-3

(a)
(b)
Figure A-3. R2 Test Results on Vinyl, pAB Solution, Hot Spot Inoculation
A-4

(c)
Figure A-3 [continued]. R2 Test Results on Vinyl, pAB Solution, Hot Spot Inoculation
A-5
(a)
(b)
Figure A-4. R2 Test Results on Vinyl, Spor-Klenz® Solution, Hot Spot Inoculation
A-6

(c)
Figure A-4. [continued] R2 Test Results on Vinyl, Spor-Klenz® Solution, Hot Spot Inoculation
A-7
(a)
(b)
Figure A-5. R2 Test Results on Vinyl, pAB Solution, Broad Area Inoculation
A-8
(c)
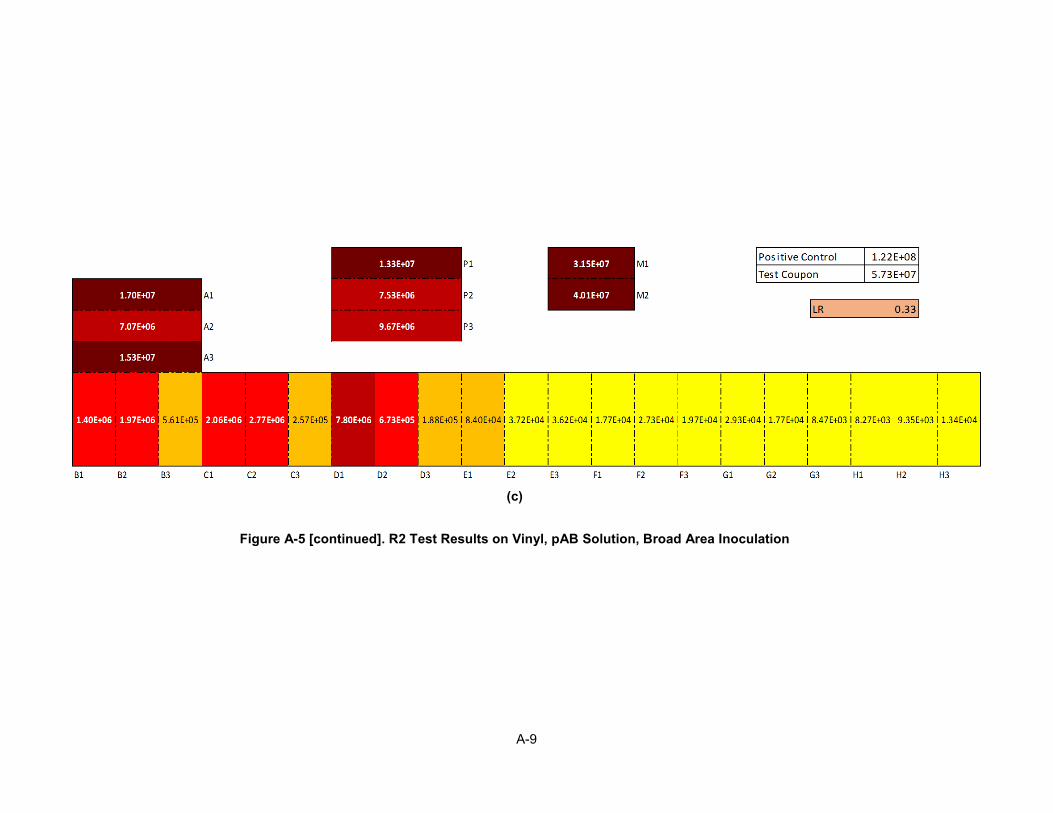
Figure A-5 [continued]. R2 Test Results on Vinyl, pAB Solution, Broad Area Inoculation
A-9

(a)
(b)
Figure A-6. R2 Test Results on Vinyl, Spor-Klenz® Solution, Broad Area Inoculation
A-10

(c)
Figure A-6 [continued]. R2 Test Results on Vinyl, Spor-Klenz® Solution, Broad Area Inoculation
A-11
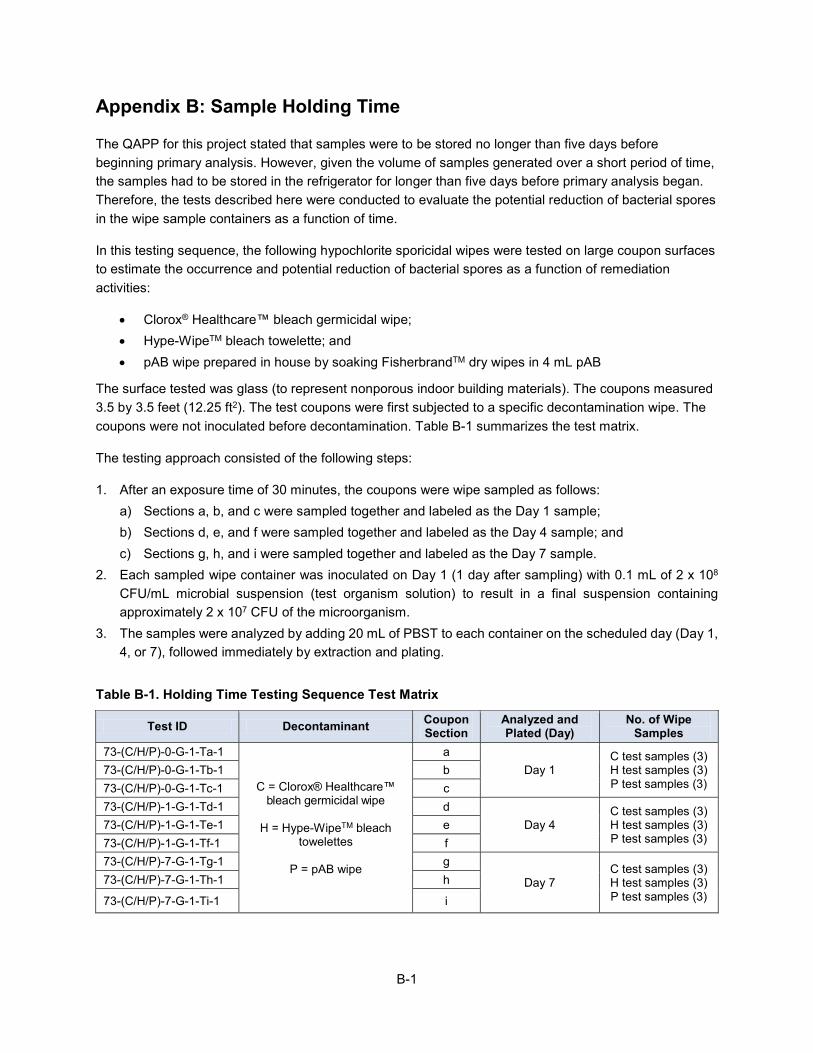
Appendix B: Sample Holding Time
The QAPP for this project stated that samples were to be stored no longer than five days before beginning primary analysis. However, given the volume of samples generated over a short period of time, the samples had to be stored in the refrigerator for longer than five days before primary analysis began. Therefore, the tests described here were conducted to evaluate the potential reduction of bacterial spores in the wipe sample containers as a function of time.
In this testing sequence, the following hypochlorite sporicidal wipes were tested on large coupon surfaces to estimate the occurrence and potential reduction of bacterial spores as a function of remediation activities:
• Clorox® Healthcare™ bleach germicidal wipe; • Hype-WipeTM bleach towelette; and • pAB wipe prepared in house by soaking FisherbrandTM dry wipes in 4 mL pAB
The surface tested was glass (to represent nonporous indoor building materials). The coupons measured 3.5 by 3.5 feet (12.25 ft2). The test coupons were first subjected to a specific decontamination wipe. The coupons were not inoculated before decontamination. Table B-1 summarizes the test matrix.
The testing approach consisted of the following steps:
1. After an exposure time of 30 minutes, the coupons were wipe sampled as follows: a) Sections a, b, and c were sampled together and labeled as the Day 1 sample; b) Sections d, e, and f were sampled together and labeled as the Day 4 sample; and c) Sections g, h, and i were sampled together and labeled as the Day 7 sample.
2. Each sampled wipe container was inoculated on Day 1 (1 day after sampling) with 0.1 mL of 2 x 10⁸
CFU/mL microbial suspension (test organism solution) to result in a final suspension containing approximately 2 x 10⁷ CFU of the microorganism.
3. The samples were analyzed by adding 20 mL of PBST to each container on the scheduled day (Day 1, 4, or 7), followed immediately by extraction and plating.
Table B-1. Holding Time Testing Sequence Test Matrix
Test ID Decontaminant Coupon Section
Analyzed and Plated (Day)
No. of Wipe Samples
73-(C/H/P)-0-G-1-Ta-1 a Day 1
C test samples (3) H test samples (3) P test samples (3)
73-(C/H/P)-0-G-1-Tb-1 b 73-(C/H/P)-0-G-1-Tc-1 C = Clorox® Healthcare™ c 73-(C/H/P)-1-G-1-Td-1 bleach germicidal wipe d
Day 4 C test samples (3) H test samples (3) P test samples (3)
73-(C/H/P)-1-G-1-Te-1 H = Hype-WipeTM bleach e 73-(C/H/P)-1-G-1-Tf-1 towelettes f 73-(C/H/P)-7-G-1-Tg-1 P = pAB wipe g
Day 7 C test samples (3) H test samples (3) P test samples (3)
73-(C/H/P)-7-G-1-Th-1 h
73-(C/H/P)-7-G-1-Ti-1 i
B-1

The positive control and negative control coupons were not subjected to the decontamination wipe. The negative control coupon and each of the positive control coupon sections were directly wipe-sampled with a PRB wipe. While the positive coupons were inoculated with spores, the negative control coupons were not. The procedural blank coupon was decontaminated with the hypochlorite wipe and then sampled but not inoculated. Table B-2 shows the control sample test matrix for this sample holding time study.
Table B-2. Holding Time Testing Sequence Control Sample Test Matrix
Test ID Type Decontaminant Coupon Section
Analyzed and Plated
(Day) No. of Wipe
Samples
73-(C/H/P)-0-G-1-Pa-1
Positive control
C = Clorox®
Healthcare™ bleach
germicidal wipe
H = Hype-WipeTM bleach
towelette
P = pAB
a Day 1
C test samples (3) H test samples (3) P test samples (3)
73-(C/H/P)-0-G-1-Pb-1 b 73-(C/H/P)-0-G-1-Pc-1 c 73-(C/H/P)-1-G-1-Pd-1 d
Day 4 C test samples (3) H test samples (3) P test samples (3)
73-(C/H/P)-1-G-1-Pe-1 e 73-(C/H/P)-1-G-1-Pf-1 f 73-(C/H/P)-7-G-1-Pg-1 g
Day 7 C test samples (3) H test samples (3) P test samples (3)
73-(C/H/P)-7-G-1-Ph-1 h 73-(C/H/P)-7-G-1-Pi-1 i
73-(C/H/P)-(0/1/7)-G-1-XT-1 Procedural blank NA
0 = Day 1 1 = Day 4 7 = Day 7
1 per decontamination wipe per day (9)
73-(C/H/P)-(0/1/7)-G-1-NT-1 Negative control NA
1 per decontamination wipe per day (9)
The results from the hold tests are summarized in Table B-3 and indicate that the samples were not affected by the longer holding time before analysis. There was no reduction of bacterial spores in the sample containers as a function of time.
Table B-3. Sample Holding Test Results for Decontamination Efficacy Tests
Wipe Cloth Day
Positive Control Average Recovery
(CFU)
Test Sample Average Recovery
(CFU) LR
Average STD Average STD Average STD Clorox®
Healthcare™ bleach germicidal
wipe
1 1.42 x 10⁷ 9.33 x 10⁵ 1.34 x 10⁷ 9.34 x 10⁵ 0.02 0.03 4 1.40 x 10⁷ 1.04 x 10⁶ 1.35 x 10⁷ 1.83 x 10⁶ 0.08 0.06
7 1.26 x 10⁷ 4.82 x 10⁵ 1.55 x 10⁷ 1.08 x 10⁶ -0.04 0.03
Hype-WipeTM
bleach towelette
1 1.37 x 10⁷ 1.48 x 10⁶ 1.46 x 10⁷ 7.57 x 10⁵ -0.03 0.02 4 1.44 x 10⁷ 5.18 x 10⁵ 1.40 x 10⁷ 4.54 x 10⁵ -0.01 0.01 7 1.21 x 10⁷ 4.73 x 10⁵ 1.36 x 10⁷ 3.85 x 10⁵ 0.00 0.01
pAB wipe 1 1.42 x 10⁷ 1.34 x 10⁶ 1.47 x 10⁷ 1.77 x 10⁶ -0.01 0.05 4 1.35 x 10⁷ 1.03 x 10⁶ 1.38 x 10⁷ 7.49 x 10⁵ 0.01 0.02 7 1.29 x 10⁷ 9.05 x 10⁵ 1.27 x 10⁷ 4.23 x 10⁵ 0.05 0.01
B-2

PRESORTED STANDARD POSTAGE & FEES PAID
EPA PERMIT NO. G-35
Office of Research and Development (8101R) Washington, DC 20460
Official Business Penalty for Private Use $300