evaluation of slope irradiance and illuminance models against measured hong kong data
TRANSCRIPT

Evaluation of slope irradiance and illuminance models againstmeasured Hong Kong data
Danny H.W. Li, Joseph C. Lam*
Building Energy Research Group, Department of Building and Construction, City University of Hong Kong, Kowloon, Hong Kong
Received 14 September 1998; received in revised form 17 May 1999; accepted 5 July 1999
Abstract
This paper presents the evaluation of three inclined irradiance and illuminance anisotropic models (Klucher, Hay and Perez)
for Hong Kong using two-year (1996±1997) measured data. A statistical analysis of the three models has shown that predictionsfor solar irradiance tend to be more accurate than daylight illuminance. All three models produce large errors for north-facingsurfaces. Predictions for south-facing surfaces show reasonably good agreement with measured data, indicating good estimationsof anisotropic di�use component at sunlit surfaces. In general, Perez's model shows the best predictions for vertical solar
irradiance and daylight illuminance followed by, Hay's, then Klucher's models. 7 2000 Elsevier Science Ltd. All rights reserved.
1. Introduction
Solar radiation data are essential to architects, en-gineers and scientists for both energy-e�cient buildingdesigns and the development of active energy systems.In subtropical Hong Kong, solar heat gain accountsfor nearly half of the total building envelope coolingload [1]. More solar radiation means more total solarheat gain, and hence more cooling requirements. Anunderstanding of the availability of more comprehen-sive solar radiation data would be invaluable to the re-duction of solar radiation cooling load in building.Furthermore, it is common knowledge that arti®ciallighting load can be reduced by using daylight. Day-lighting is recognised as an important and useful strat-egy in energy-e�cient building designs. It isparticularly attractive in hot climates since it reduceselectricity use, not only for arti®cial lighting but alsofor air-conditioning, due to less heat dissipation fromelectric light ®ttings [2,3]. Direct and di�use com-ponents of solar radiation and outdoor illuminancedata are essential to determine the amount of solar
heat gain and daylight entering a building. Horizontal
solar data can be used in studying horizontal fenestra-
tion such as skylight. For energy-e�cient building de-
signs, accurately knowing the amount of solar
radiation and daylight level on vertical surfaces is im-
portant, particularly for high-rise buildings. The global
radiation on a horizontal surface has been measured in
most meteorological stations around the world but
there are only a few stations which measure solar com-
ponents on inclined surfaces [4]. Therefore, di�erent
mathematical models [5±8] have been developed to
predict the solar irradiance and daylight illuminance
on tilted surfaces from the measurements on a hori-
zontal surface. The prediction models are mainly
developed in North America and some European
countries. Recently, Muneer [9] has evaluated Perez's
model [8] using Japanese data. However, very little
work has been done for the subtropical region near
Southern China. This paper describes the work on
modelling irradiances and illuminances on inclined sur-
faces based on measured horizontal data in Hong
Kong. A comparative study on several inclined models
is presented and the implications for the determination
of vertical data in Hong Kong are discussed.
Building and Environment 35 (2000) 501±509
0360-1323/00/$ - see front matter 7 2000 Elsevier Science Ltd. All rights reserved.
PII: S0360-1323(99 )00043 -8
www.elsevier.com/locate/buildenv
* Corresponding author.
E-mail address: [email protected] (J.C. Lam).
2. Local climate
Hong Kong has a total area of about 1000 km2 situ-ated along the southern coast of China within the sub-tropical region, with a latitude of 22.38N and alongitude of 114.28E. It has a variety of weather fromseason to season due to its location on the south-eastcoast of the Asiatic continent opposite a vast expanseof the ocean. Winter months are between Decemberand February. Mean temperature is around 15±188Cwith the monsoon coming from the North and North-east. Spring is from March until early May, and isusually cloudy with periods of light rain. The summerseason spans from late May until September. Themonsoon blows from the South and South-east withan average temperature of 27±298C. It is hot andhumid with occasional showers and thunderstorms. Attimes, typhoons strike Hong Kong and bring heavyrain and strong winds. Autumn is short and normallyruns from October to November. Sunny bright skiesdominate with dry conditions and a mean temperatureof 258C.
3. Measuring station and data corrections
The measuring station is located on the roof-top ofthe City University of Hong Kong. The instrumenta-tion at the station consists of six pyranometers and sixilluminance sensors for the horizontal and vertical
solar radiation and daylight illuminance data measure-ments. All sensors are installed on the roof-top in aposition relatively free from any external obstructions,and readily accessible for inspection and general clean-ing. Data collection starts before sunrise and ®nishesafter sunset. All measurements are referred to truesolar time. Two pyranometers (CM11) manufacturedby Kipp and Zonen, The Netherlands, are used tocarry out the measurement of solar radiation on ahorizontal plane. The di�use radiation pyranometer is®tted with a shadow-ring (CM121) 55 mm wide and620 mm in diameter, which shades the thermopilefrom direct radiation. The shadow-ring is paintedblack to minimise the e�ect of multiple re¯ections. Thetwo pyranometers are connected to an integrator(CC12) which calculates the radiation (integral of irra-diance) at an intervals of 10 min. The data from theintegrator are sent to a micro-computer for storagethrough a RS232C cable. The global solar radiationon vertical planes facing north, east, south and westare measured by other four pyranometers. Each pyran-ometer is connected to its own integrator (CC20)which measures the actual value (irradiance). The irra-diance data are captured simultaneously twice per sec-ond, averaged over 10-min intervals and stored intotwo computers which are connected to the four inte-grators.
The measurements of global and di�use outdoorilluminance on a horizontal plane are made by themeans of two illuminance meters. The two silicon
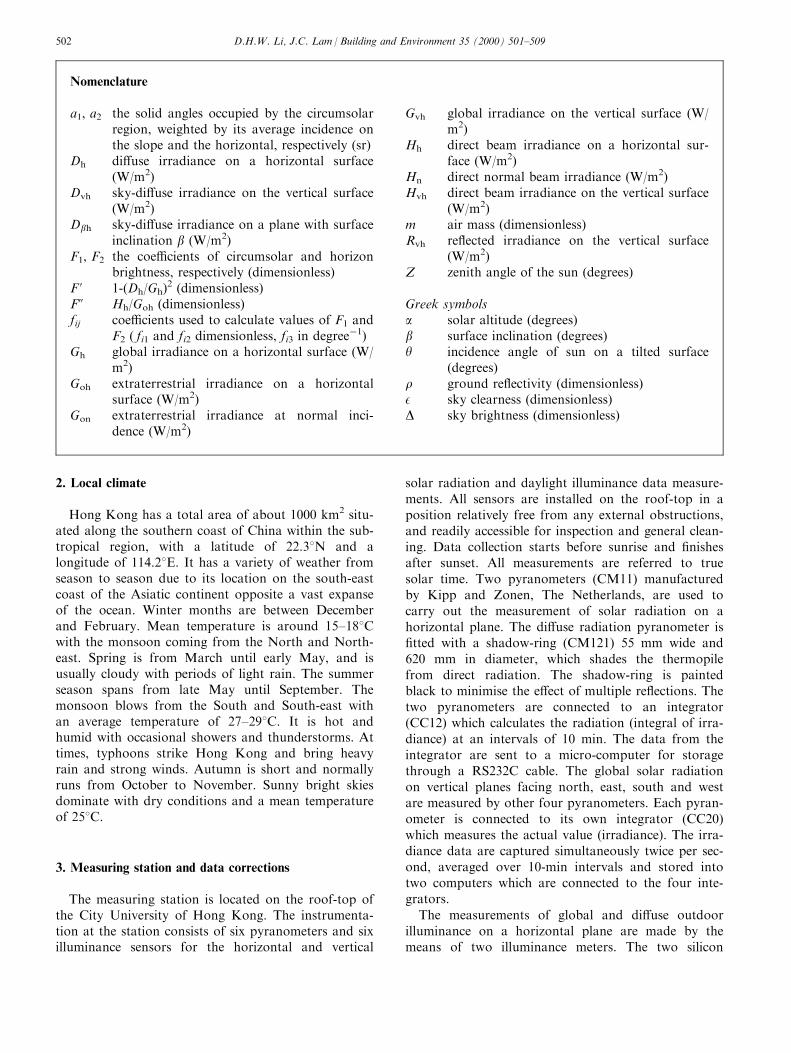
Nomenclature
a1, a2 the solid angles occupied by the circumsolarregion, weighted by its average incidence onthe slope and the horizontal, respectively (sr)
Dh di�use irradiance on a horizontal surface(W/m2)
Dvh sky-di�use irradiance on the vertical surface(W/m2)
Dbh sky-di�use irradiance on a plane with surfaceinclination b (W/m2)
F1, F2 the coe�cients of circumsolar and horizonbrightness, respectively (dimensionless)
F ' 1-(Dh/Gh)2 (dimensionless)
F0 Hh/Goh (dimensionless)fij coe�cients used to calculate values of F1 and
F2 ( fi1 and fi2 dimensionless, fi3 in degreeÿ1)Gh global irradiance on a horizontal surface (W/
m2)Goh extraterrestrial irradiance on a horizontal
surface (W/m2)Gon extraterrestrial irradiance at normal inci-
dence (W/m2)
Gvh global irradiance on the vertical surface (W/m2)
Hh direct beam irradiance on a horizontal sur-face (W/m2)
Hn direct normal beam irradiance (W/m2)Hvh direct beam irradiance on the vertical surface
(W/m2)m air mass (dimensionless)Rvh re¯ected irradiance on the vertical surface
(W/m2)Z zenith angle of the sun (degrees)
Greek symbolsa solar altitude (degrees)b surface inclination (degrees)y incidence angle of sun on a tilted surface
(degrees)r ground re¯ectivity (dimensionless)E sky clearness (dimensionless)D sky brightness (dimensionless)
D.H.W. Li, J.C. Lam / Building and Environment 35 (2000) 501±509502

photovoltaic cells contain cosine and colour correction.Again, a shadow-ring is used to block the direct com-ponent for the di�use illuminance measurement. Themeasured results are converted into digital signals byan analogue/digital converter (12 bits A/D-D/A card)before feeding into a micro-computer for storage.Data are collected every 15 s, averaged over 5-minintervals. For the measurements of the global illumi-nance at the four cardinal orientations, four illumi-nance sensors of the same model type are used. Thefour meters are connected to another analogue/digitalconverter and computer for data conversion and log-ging. The data collection method is the same as thehorizontal illuminance measurement.
Quality control tests were carried out to eliminatespurious data and inaccurate measurements resultingfrom the cosine response error of the pyranometersand illuminance sensors. These tests are as follows:
1. rejecting all di�use data which are greater than thecorresponding global values;
2. rejecting all global data that are greater than thecorresponding extraterrestrial solar component;
3. rejecting all data with a solar altitude, a, of lessthan 58;
4. rejecting all data when the direct normal values [i.e.(global±di�use)/sina ] exceed the correspondingextraterrestrial solar component;
5. rejecting all di�use data which are greater than halfof the corresponding extraterrestrial solar com-ponent (i.e. Shadow-ring is not properly adjusted);
6. applying a shade ring correction to the observed dif-fuse horizontal data according to the methoddescribed by LeBaron et al. [10].
Data that passed the quality control tests were con-verted into hourly values. Hourly direct horizontalirradiance and illuminance data were obtained by sub-tracting the corrected di�use components from the cor-responding global values.
4. Inclined models
Measured solar radiation data are more readilyavailable than measured daylight data. Inclined surfacemodel development is, therefore, mainly carried outfor solar radiation. In the following equations, the re-spective solar irradiance quantities can be transposedwith their illuminance counterparts. For solar irradi-ance on a vertical surface, it is evaluated as the sum ofdirect beam, sky-di�use and ground-re¯ected com-ponents. Mathematically, it can be expressed as:
Gvh � Hvh �Dvh � Rvh �1�where
Gvh is the global irradiance on the vertical surface(W/m2);Hvh is the direct beam irradiance on the vertical sur-face (W/m2);Dvh is the sky-di�use irradiance on the vertical sur-face (W/m2) andRvh is the re¯ected irradiance on the vertical surface(W/m2).
Di�erent models have been developed to determinethe total irradiance on an inclined surface frommeasured horizontal data. The main di�erence amongthe models is the handling of the sky-di�use com-ponent [11,12]. The direct beam and ground-re¯ectedirradiance are expressed as follows:
Hvh � �Hh= sin a� � cos y �2�
Rvh � 0:5rGh �3�where
Gh is global irradiance on a horizontal surface (W/m2);Hh is the direct beam irradiance on a horizontalsurface (W/m2);a is the solar altitude (degrees);y is the incidence angle of sun on a tilted surface(degrees); andr is the ground re¯ectivity (dimensionless).
Some researchers [5,13] assumed isotropicity of sky-di�use component while others [11,14] adopted anapproach of non-isotropicity, particularly because ofthe strong forward scattering e�ect of aerosols [15].The approaches are purely geometrical and they havealso been applied for daylight calculations [16,17]. Forthe present study, three anisotropic models (Klucher[6], Hay [7] and Perez [8]) were compared with themeasured vertical data. These models are simple touse, and are studied and assessed widely by a numberof researchers [11,18±20]. It should be emphasised thatthe simple nature of the models makes them good can-didates for general applications.
4.1. Klucher's model
Klucher's model [6] is based on the principle thatovercast skies tend to be isotropic while clear skiesshow strong horizon brightening. Mathematically, theincident di�use component, Dbh, on a plane with sur-face inclination b, is given in the following form:
Dbh � Dhf��1� cos b�=2� � �1� F 0
sin 3�b=2�� � �1� F 0�cos 2 y��sin 3 Z ��g�4�
D.H.W. Li, J.C. Lam / Building and Environment 35 (2000) 501±509 503

F 0 � 1ÿ �Dh=Gh�2 �5�where
Z is the zenith angle of the sun (degrees); andDh is the di�use irradiance on a horizontal surface(W/m2).
Under overcast skies, F ' becomes zero, thereby redu-cing the model to that of isotropic; while under clearskies, F ' approaches unity, approximating a clear skymodel [21].
4.2. Hay's model
Hay [7] established a model which assumes the sky-di�use component to be composed of a circumsolarcomponent coming from the direction of the sun and auniform di�use component from the rest of the sky.Hay assumed linearity on the isotropic and circumso-lar contributions to di�use component on a tiltedplane. The two components are mixed via a modulat-ing function F0 as follows:
Dbh � DhfF 00 � �cos y= sin a� � ��1ÿ F 00 � � �1�
cos b�=2�g�6�
F 00 � Hh=Goh �7�where Goh is the extraterrestrial irradiance on a hori-zontal surface (W/m2).
The ®rst term corresponds to the circumsolar zoneand the second is the isotropic contribution. Eq. 6reduces to the isotropic model for overcast sky whenF0=0.
4.3. Perez's model
Perez's model [8] is based on a three-zone treatmentof the sky-di�use component. It is expressed as:
Dbh � Dh�0:5�1� cos b��1ÿ F1� � F1�a1=a2�
� F2 sin b� �8�
where
a1, a2 are the solid angles occupied by the circumso-lar region, weighted by its average incidence on theslope and the horizontal, respectively (sr); andF1, F2 are the coe�cients of circumsolar and hor-izon brightness, respectively (dimensionless).
For a vertical surface (b=908), Eq. 8 becomes:
Dvh � Dh�0:5�1ÿ F1� � F1�a1=a2� � F2� �9�For the point-source simpli®ed version, the expressionsfor a1 and a2 are taken as:
a1 � max�0, cos y� �10�
a2 � max� cos 85 ^ , cos Z � �11�Coe�cients F1 and F2 are functions of three variablesdescribing the sky conditions: i.e. (a) the solar zenithangle, Z; (b) the sky's clearness, E, expressed as:
E � ��Dh �Hn�=Dh � 5:535 � 10ÿ6Z 3�=�1� 5:535
� 10ÿ6Z 3� �12�
where Hn is the direct normal beam irradiance (W/m2);and (c) the sky's brightness, D, given by:
D � mDh=Gon �13�where
m is the air mass (dimensionless); andGon is the extraterrestrial irradiance at normal inci-dence (W/m2).
The Perez model considers a set of categories orbins for E, and each of them can be expressed as linearfunctions of Z and D as follows:
F1 � maxf0, � f11 � f12D� f13Z�p=180��g �14�
F2 � � f21 � f22D� f23Z�p=180�� �15�The required coe�cients fij are obtained from Perez etal. [8].
5. Evaluation of the models
The evaluation was carried out for both the solarirradiance and the outdoor illuminance data. The glo-bal component on a vertical surface was determinedfrom the two-year (1996±1997) measured horizontaldata using the three models (Klucher, Hay and Perez)and compared with the measured vertical data of thesame period. The ground re¯ectance was estimated tobe 0.22. The comparison was conducted on an hourlybasis. The performance of each model was assessedstatistically in terms of the mean-bias-error (MBE), ameasure of the underlying trend, and the root-mean-square-error (RMSE), an indication of data scattering.In order to examine the seasonal variations, MBE andRMSE were computed for each month as well as thewhole year.
5.1. Vertical solar irradiance
Tables 1 to 4 show the MBE and RMSE results ofeach model for all 12 months and the whole year atthe four cardinal orientations. It can be observed from
D.H.W. Li, J.C. Lam / Building and Environment 35 (2000) 501±509504

the Tables that both the lowest and highest RMSE
occur in the south-facing surface for Hay's model, ran-
ging from 21.3 W/m2 in March to 52.7 W/m2 in
December; Perez's model, ranging from 17.5 W/m2 in
May to 65 W/m2 in December. Klucher's model ranges
from 25.1 W/m2 in February for the south-facing sur-
face to 74.3 W/m2 in October for the north-facing sur-
face. For each model, the RMSE values in W/m2 for
all vertical surfaces do not di�er a great deal. How-
ever, in terms of percentage, north-facing surface has
the highest RMSE values and this can be explained by
the fact that solar irradiance received by the north-
facing surface is basically di�use component of low
measured mean value.
Klucher's model performs apparently the worst
among the three models, particularly for the north-
facing surface, even though the anisotropic e�ect has
been considered. For completely overcast skies, Klu-
cher's model is reduced to isotropic and the vertical
irradiance is half of the corresponding horizontal com-
ponent. For non-overcast skies, the predicted solar
irradiance values of Klucher's model are always
greater than those of the other two models. Its predic-
tive ability is, thus, comparable to that of the other
two models with general accurate results only in winter
Table 1
Summary of MBE and RMSE for vertical global solar irradiance (north-facing surface)
Jan Feb Mar Apr May Jun Jul Aug Sep Oct Nov Dec Yr
Klucher
MBE (W/m2) 35.4 28.5 43.2 47.4 37.9 39.4 41.4 47.9 51.9 57.9 42.4 41.2 42.6
%MBE 37.0 37.2 49.8 47.4 38.7 33.6 36.2 44.8 47.4 58.8 44.8 45.4 42.8
RMSE (W/m2) 46.4 40.5 58.5 63.1 54.3 55.6 59.8 66.6 66.0 74.3 54.7 50.4 58.2
%RMSE 48.6 52.8 67.5 63.1 55.4 47.3 52.2 62.3 60.3 75.5 57.9 55.6 58.5
Hay
MBE (W/m2) 3.1 10.1 15.8 24.3 17.0 14.8 14.9 14.8 17.1 20.9 6.7 11.8 14.5
%MBE 3.3 13.2 18.2 24.3 17.4 12.6 13.0 13.9 15.6 21.3 7.1 13.0 14.6
RMSE (W/m2) 27.1 26.2 27.1 37.7 32.7 32.8 33.5 33.4 31.5 37.9 30.7 30.0 32.1
%RMSE 28.3 34.1 31.3 37.7 33.4 27.9 29.3 31.3 28.8 38.5 32.5 33.0 32.3
Perez
MBE (W/m2) 11.0 9.8 15.8 17.0 12.5 14.7 13.8 12.2 14.9 24.9 16.5 17.6 15.0
%MBE 11.5 12.7 18.3 16.9 12.8 12.5 12.1 11.4 13.6 25.3 17.4 19.4 15.0
RMSE (W/m2) 22.3 18.8 23.6 29.2 26.3 31.6 30.7 25.1 23.6 36.5 27.3 26.2 27.4
%RMSE 23.2 24.5 27.2 29.0 26.9 26.9 26.8 23.5 21.6 37.1 28.8 28.9 27.6
Table 2
Summary of MBE and RMSE for vertical global solar irradiance (east-facing surface)
Jan Feb Mar Apr May Jun Jul Aug Sep Oct Nov Dec Yr
Klucher
MBE (W/m2) 15.8 16.8 28.7 38.2 33.3 38.8 41.6 40.2 37.1 33.6 19.5 17.2 30.9
%MBE 9.1 13.8 21.8 29.0 27.3 26.8 27.7 24.3 19.6 18.1 10.2 10.2 20.1
RMSE (W/m2) 39.8 35.4 52.9 66.5 57.6 60.6 64.2 66.0 56.0 59.3 47.4 44.2 55.9
%RMSE 23.0 28.9 40.2 50.5 47.1 41.7 42.8 39.8 29.7 31.9 24.9 26.2 36.4
Hay
MBE (W/m2) ÿ7.4 3.4 5.8 19.3 14.9 17.1 18.9 14.1 11.6 5.6 ÿ5.6 ÿ4.1 8.8
%MBE ÿ4.3 2.7 4.4 14.7 12.2 11.8 12.6 8.5 6.1 3.0 ÿ3.0 ÿ2.4 5.7
RMSE (W/m2) 37.9 32.3 35.7 47.0 36.7 41.2 39.0 38.6 32.4 38.6 39.6 41.8 38.7
%RMSE 21.9 26.5 27.1 35.6 30.1 28.4 26.0 23.3 17.2 20.8 20.8 24.7 25.2
Perez
MBE (W/m2) 5.3 6.8 11.9 19.2 15.3 22.3 24.5 20.6 20.1 18.0 10.9 6.3 15.7
%MBE 3.0 5.6 9.1 14.6 12.6 15.4 16.4 12.4 10.7 9.7 5.7 3.7 10.2
RMSE (W/m2) 28.6 24.5 31.2 43.1 32.5 43.6 43.6 39.4 32.7 37.4 35.3 34.5 36.5
%RMSE 16.5 20.1 23.7 32.7 26.6 30.0 29.1 23.8 17.3 20.1 18.6 20.4 23.8
D.H.W. Li, J.C. Lam / Building and Environment 35 (2000) 501±509 505

months on the east, south and west vertical planes
when facing the direct sun at low solar altitude. It is
signi®cantly inferior for the rest of the year. For
shaded vertical surfaces, particularly during non-over-
cast conditions, the anisotropic correction factors in
Klucher's model always tend to over-estimate the solar
irradiance, causing the MBE and RMSE values to be
higher than those of the other two models.
Hay's model performs better in vertical solar irradi-
ance estimation than Klucher's model, particularly for
the south- and west-facing surfaces. Hay's model can
predict the vertical solar irradiance from less than half
of horizontal di�use irradiance for shaded surfaces to
over half of horizontal solar irradiance for sunlit sur-
faces under clear sky. The MBE values range from an
under-estimation of 4.3% in January for the east-
facing surface to an over-estimation of 24.3% in April
for the north-facing surface. For the whole year, the
RMSE ranges from 16.5% for the south-facing surface
to 32.3% for the north-facing surface.
Perez's model tends to over-estimate the solar irradi-
ance for all vertical surfaces with the annual average
MBE values not more than 15%. Overall, Perez's
model most accurately predicts the vertical irradiance,
particularly for the north-facing surface when the solar
irradiance received consists of di�use component only
Table 3
Summary of MBE and RMSE for vertical global solar irradiance (south-facing surface)
Jan Feb Mar Apr May Jun Jul Aug Sep Oct Nov Dec Yr
Klucher
MBE (W/m2) 0.9 9.6 19.0 33.1 34.4 40.1 38.6 37.5 31.8 8.7 ÿ4.0 1.2 22.7
%MBE 0.3 5.5 12.7 26.7 34.6 42.4 38.0 27.8 18.7 3.3 ÿ1.2 0.4 12.6
RMSE (W/m2) 31.8 25.1 30.8 46.6 49.3 56.4 53.2 54.3 43.0 27.5 33.3 51.0 43.8
%RMSE 10.3 14.4 20.6 37.7 49.5 59.7 52.3 40.3 25.2 10.5 9.8 16.4 24.2
Hay
MBE (W/m2) ÿ3.5 4.3 7.1 13.6 12.2 14.2 8.8 7.6 9.5 ÿ6.7 ÿ10.3 ÿ3.1 5.0
%MBE ÿ1.1 2.5 4.7 11.0 12.3 15.1 8.6 5.7 5.6 ÿ2.6 ÿ3.0 ÿ1.0 2.8
RMSE (W/m2) 33.1 23.2 21.3 27.5 27.7 29.2 25.1 28.7 25.5 26.0 34.4 52.7 29.8
%RMSE 10.7 13.3 14.3 22.3 27.8 30.9 24.7 21.3 14.9 9.9 10.1 17.0 16.5
Perez
MBE (W/m2) 19.2 11.6 13.2 10.3 7.6 9.1 6.6 8.7 14.8 10.8 15.0 15.7 11.4
%MBE 6.2 6.7 8.8 8.3 7.6 9.6 6.5 6.5 8.7 4.1 4.4 5.1 6.3
RMSE (W/m2) 47.4 30.2 28.8 21.1 17.5 19.3 18.1 22.0 26.8 33.6 44.4 65.0 32.3
%RMSE 15.3 17.4 19.2 17.0 17.6 20.4 17.8 16.3 15.7 12.9 13.1 21.0 17.9
Table 4
Summary of MBE and RMSE for vertical global solar irradiance (west-facing surface)
Jan Feb Mar Apr May Jun Jul Aug Sep Oct Nov Dec Yr
Klucher
MBE (W/m2) 25.1 20.3 26.9 33.1 27.0 32.7 26.4 34.0 36.3 31.8 25.2 26.0 29.0
%MBE 14.9 15.9 19.4 22.6 18.8 23.2 16.3 20.1 22.3 16.7 12.7 15.6 18.2
RMSE (W/m2) 36.1 32.8 45.9 52.5 54.8 54.6 52.5 59.9 59.6 58.5 42.9 41.5 51.1
%RMSE 21.4 25.7 33.1 35.9 38.0 38.8 32.3 35.4 36.6 30.8 21.7 25.0 32.0
Hay
MBE (W/m2) 4.2 8.2 11.6 16.3 10.7 13.0 4.0 7.4 10.6 5.2 1.4 5.2 8.2
%MBE 2.5 6.4 8.3 11.2 7.4 9.2 2.5 4.3 6.5 2.7 0.7 3.1 5.2
RMSE (W/m2) 32.4 28.0 28.8 31.9 38.3 31.1 30.8 32.4 35.7 38.7 33.0 34.5 33.3
%RMSE 19.2 21.8 20.7 21.8 26.6 22.0 18.9 19.1 21.9 20.4 16.7 20.8 20.9
Perez
MBE (W/m2) 15.8 11.0 13.6 13.4 9.7 11.3 6.1 9.3 10.4 13.1 17.1 14.5 11.7
%MBE 9.4 8.6 9.8 9.2 6.7 8.0 3.8 5.5 6.4 6.9 8.7 8.7 7.4
RMSE (W/m2) 43.9 35.1 37.7 32.2 39.9 33.9 32.8 34.6 37.0 46.4 45.1 44.0 38.5
%RMSE 26.0 27.4 27.1 22.0 27.7 24.1 20.2 20.4 22.7 24.4 22.9 26.4 24.1
D.H.W. Li, J.C. Lam / Building and Environment 35 (2000) 501±509506
or includes only a small portion of direct componentwhen the solar altitude is high. This indicates that Per-ez's model is good for estimating solar irradiance forshaded surfaces. For the north- and east-facing sur-faces, the performance of Perez's model is better thanKlucher's and Hay's models. For other vertical sur-faces, its predictive ability is close to Hay's model. Theannual average RMSE values for all vertical surfacesare less than 28%.
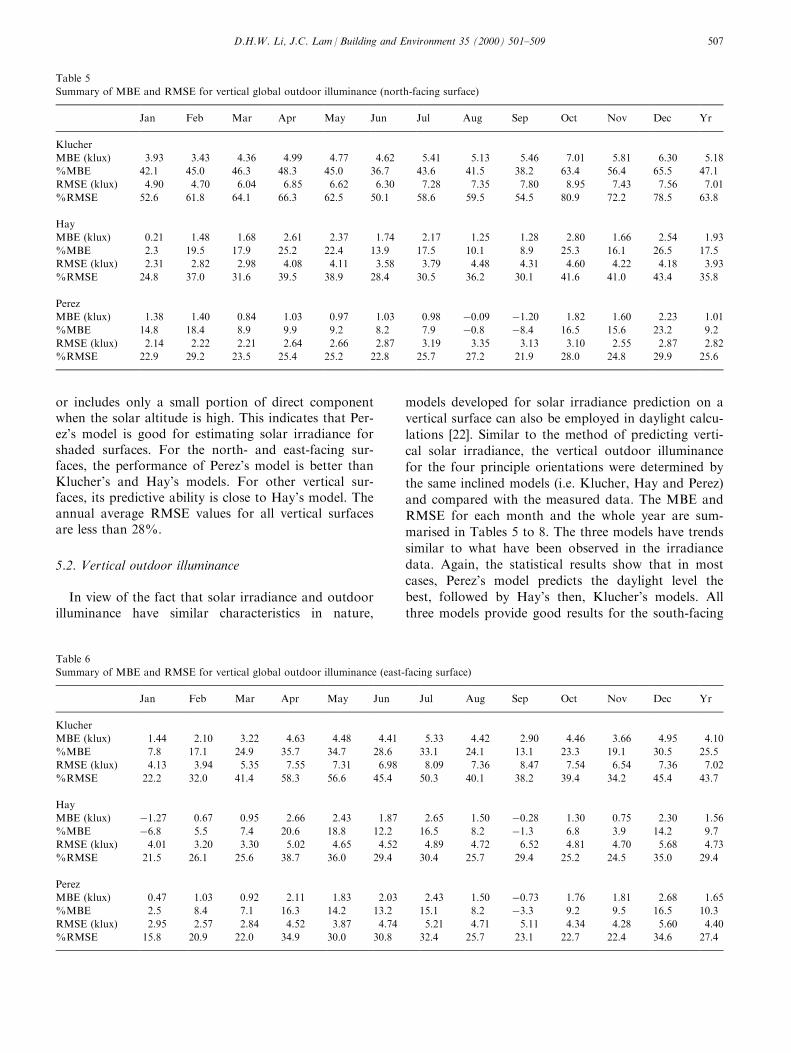
5.2. Vertical outdoor illuminance
In view of the fact that solar irradiance and outdoorilluminance have similar characteristics in nature,
models developed for solar irradiance prediction on a
vertical surface can also be employed in daylight calcu-
lations [22]. Similar to the method of predicting verti-
cal solar irradiance, the vertical outdoor illuminance
for the four principle orientations were determined by
the same inclined models (i.e. Klucher, Hay and Perez)
and compared with the measured data. The MBE and
RMSE for each month and the whole year are sum-
marised in Tables 5 to 8. The three models have trends
similar to what have been observed in the irradiance
data. Again, the statistical results show that in most
cases, Perez's model predicts the daylight level the
best, followed by Hay's then, Klucher's models. All
three models provide good results for the south-facing
Table 5
Summary of MBE and RMSE for vertical global outdoor illuminance (north-facing surface)
Jan Feb Mar Apr May Jun Jul Aug Sep Oct Nov Dec Yr
Klucher
MBE (klux) 3.93 3.43 4.36 4.99 4.77 4.62 5.41 5.13 5.46 7.01 5.81 6.30 5.18
%MBE 42.1 45.0 46.3 48.3 45.0 36.7 43.6 41.5 38.2 63.4 56.4 65.5 47.1
RMSE (klux) 4.90 4.70 6.04 6.85 6.62 6.30 7.28 7.35 7.80 8.95 7.43 7.56 7.01
%RMSE 52.6 61.8 64.1 66.3 62.5 50.1 58.6 59.5 54.5 80.9 72.2 78.5 63.8
Hay
MBE (klux) 0.21 1.48 1.68 2.61 2.37 1.74 2.17 1.25 1.28 2.80 1.66 2.54 1.93
%MBE 2.3 19.5 17.9 25.2 22.4 13.9 17.5 10.1 8.9 25.3 16.1 26.5 17.5
RMSE (klux) 2.31 2.82 2.98 4.08 4.11 3.58 3.79 4.48 4.31 4.60 4.22 4.18 3.93
%RMSE 24.8 37.0 31.6 39.5 38.9 28.4 30.5 36.2 30.1 41.6 41.0 43.4 35.8
Perez
MBE (klux) 1.38 1.40 0.84 1.03 0.97 1.03 0.98 ÿ0.09 ÿ1.20 1.82 1.60 2.23 1.01
%MBE 14.8 18.4 8.9 9.9 9.2 8.2 7.9 ÿ0.8 ÿ8.4 16.5 15.6 23.2 9.2
RMSE (klux) 2.14 2.22 2.21 2.64 2.66 2.87 3.19 3.35 3.13 3.10 2.55 2.87 2.82
%RMSE 22.9 29.2 23.5 25.4 25.2 22.8 25.7 27.2 21.9 28.0 24.8 29.9 25.6
Table 6
Summary of MBE and RMSE for vertical global outdoor illuminance (east-facing surface)
Jan Feb Mar Apr May Jun Jul Aug Sep Oct Nov Dec Yr
Klucher
MBE (klux) 1.44 2.10 3.22 4.63 4.48 4.41 5.33 4.42 2.90 4.46 3.66 4.95 4.10
%MBE 7.8 17.1 24.9 35.7 34.7 28.6 33.1 24.1 13.1 23.3 19.1 30.5 25.5
RMSE (klux) 4.13 3.94 5.35 7.55 7.31 6.98 8.09 7.36 8.47 7.54 6.54 7.36 7.02
%RMSE 22.2 32.0 41.4 58.3 56.6 45.4 50.3 40.1 38.2 39.4 34.2 45.4 43.7
Hay
MBE (klux) ÿ1.27 0.67 0.95 2.66 2.43 1.87 2.65 1.50 ÿ0.28 1.30 0.75 2.30 1.56
%MBE ÿ6.8 5.5 7.4 20.6 18.8 12.2 16.5 8.2 ÿ1.3 6.8 3.9 14.2 9.7
RMSE (klux) 4.01 3.20 3.30 5.02 4.65 4.52 4.89 4.72 6.52 4.81 4.70 5.68 4.73
%RMSE 21.5 26.1 25.6 38.7 36.0 29.4 30.4 25.7 29.4 25.2 24.5 35.0 29.4
Perez
MBE (klux) 0.47 1.03 0.92 2.11 1.83 2.03 2.43 1.50 ÿ0.73 1.76 1.81 2.68 1.65
%MBE 2.5 8.4 7.1 16.3 14.2 13.2 15.1 8.2 ÿ3.3 9.2 9.5 16.5 10.3
RMSE (klux) 2.95 2.57 2.84 4.52 3.87 4.74 5.21 4.71 5.11 4.34 4.28 5.60 4.40
%RMSE 15.8 20.9 22.0 34.9 30.0 30.8 32.4 25.7 23.1 22.7 22.4 34.6 27.4
D.H.W. Li, J.C. Lam / Building and Environment 35 (2000) 501±509 507

surface but the daylight level is not estimated accu-
rately for the north-facing surface. As expected, except
for Perez's model for the north-facing surface, the%RMSE is generally higher than that for vertical irra-
diance since the models developed are initially for
solar irradiance purpose.
The three models display a consistent over-predic-
tion for the north-facing surface for almost all months
(except in August and September for Perez's model),
indicating that shaded vertical surfaces receive less
than half of the corresponding horizontal daylight.
Many studies have also found that the ratio of vertical
to horizontal di�use illuminance for shaded surfaces is
about 0.4 [22,23]. It means that the measured horizon-
tal and vertical illuminance data in 1996 and 1997 are
in good agreement with this ®nding. For the south-
facing surface, all three models are in close agreement
throughout the year showing the importance of aniso-
tropy on sunlit surfaces. Their di�erences in RMSE
for the whole year are around 6%. The statistical
errors for the east-facing surface are much larger than
those for the west-facing surface indicating the aniso-
tropic e�ect of di�use component under clear sky may
occur more frequently in the afternoon than in the
morning. For the annual RMSE, Perez's model ranges
from 19.1% to 27.4%, Hay's model from 18.2% to
35.8%, and Klucher's model from 24.3% to 63.8%.
Table 7
Summary of MBE and RMSE for vertical global outdoor illuminance (south-facing surface)
Jan Feb Mar Apr May Jun Jul Aug Sep Oct Nov Dec Yr
Klucher
MBE (klux) 0.7 1.57 1.44 3.47 3.67 3.36 3.79 3.56 2.36 0.51 ÿ0.48 0.67 2.27
%MBE 2.1 9.3 8.3 26.7 32.1 28.5 31.1 22.8 12.0 1.8 ÿ1.4 2.0 11.7
RMSE (klux) 2.46 2.63 2.89 5.30 5.34 5.34 5.59 5.36 4.80 3.34 3.65 5.09 4.69
%RMSE 7.3 15.6 16.7 40.7 46.8 45.3 45.8 34.2 24.4 11.9 15.5 15.5 24.3
Hay
MBE (klux) 0.26 0.92 0.10 1.41 1.13 0.05 0.30 0.09 ÿ0.07 ÿ1.10 ÿ1.08 0.41 0.18
%MBE 0.8 5.4 0.6 10.9 9.9 0.4 2.4 0.6 ÿ0.4 ÿ3.9 ÿ3.0 1.2 0.9
RMSE (klux) 2.36 2.04 2.26 2.86 3.11 4.11 3.41 3.43 4.04 3.60 3.81 5.32 3.53
%RMSE 7.0 12.1 13.0 22.0 27.2 34.8 27.9 21.9 20.6 12.9 10.7 16.2 18.2
Perez
MBE (klux) 3.14 1.61 0.59 0.47 ÿ0.26 ÿ1.04 ÿ1.08 ÿ0.67 ÿ0.10 0.48 1.62 2.30 0.30
%MBE 9.3 9.6 3.4 3.6 ÿ2.3 ÿ8.8 ÿ8.8 ÿ4.3 ÿ0.5 1.7 4.6 7.0 1.5
RMSE (klux) 4.98 3.44 2.67 2.32 2.53 3.63 3.51 2.80 3.78 3.70 4.56 6.55 3.72
%RMSE 14.8 20.4 15.4 17.8 22.1 30.8 28.7 17.9 19.2 13.2 12.8 19.9 19.1
Table 8
Summary of MBE and RMSE for vertical global outdoor illuminance (west-facing surface)
Jan Feb Mar Apr May Jun Jul Aug Sep Oct Nov Dec Yr
Klucher
MBE (klux) 3.17 2.69 1.62 2.84 3.20 3.92 3.59 3.69 3.57 3.10 2.53 3.44 3.16
%MBE 17.8 20.6 9.6 18.2 20.7 23.1 21.2 19.,8 19.6 14.9 11.7 19.0 17.9
RMSE (klux) 4.06 4.02 4.60 5.20 5.84 6.29 6.38 6.82 6.23 6.77 5.03 5.02 5.79
%RMSE 22.8 30.8 27.1 33.3 37.7 37.1 37.7 36.7 34.3 32.7 23.2 27.6 32.8
Hay
MBE (klux) 0.75 1.42 ÿ0.07 1.09 1.36 1.68 1.01 0.65 0.82 0.10 ÿ0.21 0.84 0.79
%MBE 4.2 10.9 ÿ0.4 7.0 8.8 9.9 6.0 3.5 4.5 0.5 ÿ1.0 4.6 4.5
RMSE (klux) 3.34 3.02 3.93 3.38 3.70 4.18 3.59 4.22 4.18 5.14 4.35 4.23 4.04
%RMSE 18.8 23.1 23.2 21.7 23.9 24.6 21.2 22.7 23.0 24.8 20.1 23.3 22.9
Perez
MBE (klux) 2.46 1.71 ÿ0.03 0.34 0.83 1.25 0.83 0.37 0.54 0.33 0.70 1.07 0.75
%MBE 13.8 13.1 ÿ0.2 2.2 5.4 7.3 4.9 2.0 2.9 1.6 3.2 5.9 4.2
RMSE (klux) 5.08 4.27 4.37 3.40 3.92 4.60 3.98 4.13 4.53 4.66 4.34 4.28 4.27
%RMSE 28.5 32.7 25.7 21.8 25.4 27.0 23.5 22.3 24.8 22.5 20.0 23.6 24.2
D.H.W. Li, J.C. Lam / Building and Environment 35 (2000) 501±509508

6. Conclusions
An evaluation of the predicted vertical solar irradi-ance and daylight illuminance based on three inclinedsurface models (Klucher, Hay and Perez) and two-year(1996±1997) measured horizontal solar data in HongKong has been conducted. It has been observed thatrelatively high MBE and RMSE values are found forthe north-facing surface which only receives basicallydi�use components; and the vertical components pre-dicted for south-facing surface are the most accuratewhen the solar irradiance and daylight illuminancereceived have a high portion of direct components.There is a consistent trend of over-estimation by Klu-cher's model, particularly when the solar irradianceand daylight illuminance received, consists of mainlydi�use components. Hay's model performs better thanKlucher's model and gives the most accurate predic-tion for the south- and the west-facing surfaces. TheRMSE values for the whole year range from 16.5 to32.3% for solar irradiance prediction and 18.2 to35.8% for daylight illuminance estimation. Perez'smodel tends to have good prediction for shaded verti-cal surfaces and surfaces facing the sun at high solaraltitude. The annual RMSE values for solar irradianceand daylight illuminance are both less than 28%. Ingeneral, Perez's model produces the best agreementwith the measured vertical data for both solar irradi-ance and daylight illuminance.
Acknowledgements
This work was funded by an RGC Competitive Ear-marked Research Grants (Project No.9040139).
References
[1] Lam JC. Energy-e�cient measures and life cycle costing of a
residential building in Hong Kong. Architectural Science
Review 1993;36:157±62.
[2] Smart M, Ballinger JA. Tracking mirror beam sunlighting for
deep interior spaces. Solar Energy 1983;30:527±36.
[3] Huang YJ, Thom B, Ramadan B. A daylighting design tool for
Singapore based on DOE-2.1C simulations. In: Proceedings of
the ASHRAE Far East Conference on Air-conditioning in Hot
Climates. Kuala Lumpur: ASHRAE, 1989. p. 200±27.
[4] Kambezidis HD, Psiloglou BE, Gueymard C. Measurements
and models for total solar irradiance on inclined surface in
Athens, Greece. Solar Energy 1994;53:177±85.
[5] Liu BYH, Jordan RC. Daily insolation on surfaces tilted
towards the equator. ASHRAE Journal 1961;3:53±9.
[6] Klucher TM. Evaluation of models to predict insolation on
tilted surfaces. Solar Energy 1979;23:111±4.
[7] Hay JE. Study of shortwave radiation on non-horizontal sur-
faces. Report 79±12, Atmospheric Environmental Service,
Downsview, Ontario, 1979.
[8] Perez R, Ineichen P, Seals R. Modeling daylight availability and
irradiance components from direct and global irradiance. Solar
Energy 1990;44:271±89.
[9] Muneer T. Perez slope irradiance and illuminance models:
Evaluation against Japanese data. Lighting Research and
Technology 1997;29:83±7.
[10] LeBaron BA, Michalsky JJ, Perez R. A simple procedure for
correcting shadowband data for all sky conditions. Solar
Energy 1990;44:249±56.
[11] Muneer T. Solar radiation model for Europe. Building Services
Engineering Research and Technology 1990;11:153±63.
[12] Abdelrahman MA, Elhadidy MA. Comparison of calculated
and measured values of total radiation on tilted surfaces in
Dhahran, Saudi Arabia. Solar Energy 1986;37:239±43.
[13] Koronakis PS. On the choice of the angle of tilt for south
facing solar collectors in the Athens basin area. Solar Energy
1986;36:217±25.
[14] Perez R, Seals R, Ineichen P, Stewart R, Menicucci D. A new
simpli®ed version of the Perez di�use irradiance model for tilted
surfaces. Solar Energy 1987;39:221±31.
[15] Gueymard C. An anisotropic solar irradiance model for tilted
surfaces and its comparison with selected engineering algor-
ithms. Solar Energy 1987;38:367±86.
[16] Crisp VHC, Lynes JA. A model of daylight availability for day-
lighting design. In: Proceedings of the CIBSE National Lighting
Conference, Canterbury, UK, 1980. p. CF1±CF10.
[17] Muneer T. Solar irradiance and illuminance models for Japan I:
Sloped surfaces. Lighting Research and Technology
1995;27:209±22.
[18] Robledo L, Soler A. Point-source Perez illuminance model:
Dependence of coe�cients on surface orientation at Madrid.
Lighting Research and Technology 1996;28:141±8.
[19] Santamouris M, Tselepidaki I, Dris N. Evaluation of models to
predict solar radiation on tilted surfaces for the Mediterranean
region. Solar and Wind Technology 1990;7:585±9.
[20] Utrillas MP, Martinez-Lozano JA, Casanovas AJ. Evaluation
of models for estimating solar irradiation on vertical surfaces at
Valencia, Spain. Solar Energy 1991;47:223±9.
[21] Temps RC, Coulson KL. Solar radiation incident upon slopes
of di�erent orientations. Solar Energy 1977;19:179±84.
[22] Muneer T, Angus RC. Daylight illuminance models for the
United Kingdom. Lighting Research and Technology
1993;25:113±23.
[23] Littlefair PJ. Daylight availability for lighting controls. In:
Proceedings of the CIBSE National Lighting Conference,
Cambridge, UK, 1984. p. 215±33.
D.H.W. Li, J.C. Lam / Building and Environment 35 (2000) 501±509 509