evaluation of shredder residue as cement manufacturing
TRANSCRIPT
Resources, Conservation and Recycling 51 (2007) 621–642
Evaluation of shredder residue as cementmanufacturing feedstock�
Bob Boughton ∗
California Environmental Protection Agency, Department of Toxic Substances Control,Office of Pollution Prevention and Technology Development, 1001 I Street,
P.O. Box 806, Sacramento, CA 95812, United States
Received 2 June 2006; received in revised form 9 November 2006; accepted 15 November 2006Available online 19 December 2006
Abstract
Metal recycling from automobiles, appliances and scrap steel occurs at over 200 dedicated metalshredding operations in the US. Shredder residue (SR) consists of glass, rubber, plastics, fibers, dirt,and fines that remain after ferrous and non-ferrous metals have been removed. Over 3 million tonnes ofSR generated in the US each year are landfilled. The results of a previous end-of-life impact assessmentshowed that use of SR as a fuel supplement for cement manufacturing was environmentally beneficialto the current practice of landfilling and appears better in comparison to the other management methodsstudied. However, because many reuse and recycling options may not be cost effective, there is a needfor further study. Simplistic methods to separate SR into energy and mineral rich streams may facilitatethe use of a sizable fraction of SR. Due to the large scale of the cement industry in the US, a significantamount of SR is recoverable. The goal of this study was to identify the feedstock quality parametersneeded to satisfy kiln operators and then to assess the mechanical means necessary to process SR intomaterial acceptable as coal and mineral substitutes.
Field tests were conducted to separate and beneficiate the coarse SR waste stream. Density sepa-ration techniques commonly used by shredders in the past were tested to separate rubber and plasticsfrom non-combustibles and contaminants (e.g., PVC and copper wire). A fraction constituting about30 wt% of the total SR had fuel characteristics mirroring those of coal. However, remaining levels
� The mention of any products, companies, or technologies, their source or their use in connection with theinformation reported herein, is not to be construed as either an actual or implied endorsement of such products,companies or technologies.
∗ Tel.: +1 916 323 9586; fax: +1 916 327 4494.E-mail address: [email protected].
0921-3449/$ – see front matter © 2006 Elsevier B.V. All rights reserved.doi:10.1016/j.resconrec.2006.11.006
622 B. Boughton / Resources, Conservation and Recycling 51 (2007) 621–642
of potentially problematic constituents (e.g., total chlorine and heavy metals) may limit use to a lowrelative addition rate at some kilns.
An economic review of a full-scale separation system showed that processing SR appears to beeconomically marginal considering avoided landfilling costs alone. However, significant economicbenefits would result from additional non-ferrous metals recovery (namely copper). The project resultsshowed that commonly available separation systems should produce an acceptable fuel supplement;however, regulatory barriers which inhibit economically viable recycling may need to be addressed.© 2006 Elsevier B.V. All rights reserved.
Keywords: Shredder residue; Resource recovery; Cement manufacturing supplemental fuel
1. Background
1.1. Shredder residue
Shredder residue (SR) is generated by businesses that recover ferrous and non-ferrousmetals from waste automobiles, appliances and other light scrap. The metallic feedstocksare collected from automotive parts salvaging and dismantling yards, metal recyclers aswell as appliance dealers and landfills. About 12 million tonnes per year of steel and non-ferrous metals are recycled at over 200 dedicated shredding operations nationwide (Fisher,1999; ISRI, 2004; Staudinger and Keoleian, 2001; USEPA, 2004a). Roughly 20% of thefeedstock becomes shredder residue which is comprised primarily of glass, plastics, textiles,rubber, dirt and fines. The over 3 million tonnes of SR generated in the US each year arelandfilled (ISRI, 2004). From both a resource conservation and good business practiceperspective, recovery of the energy and mineral value of SR should be examined as analternative to disposal. Compared to landfilling, material recovery and energy recoveryare usually preferred because of conservation of non-renewable resources and reductionof waste disposal (Boughton and Horvath, 2006; Morioka et al., 2005). However, becausemany reuse and recycling options may not be environmentally beneficial or cost effective,there is a need for further study.
The directive for end-of-life vehicles in Europe has generated numerous efforts toincrease dismantling, and to recover plastics, other materials or energy value from SR(CARE, 2005; European Commission, 2005; Forton et al., 2006; Gerrard and Kandlikar,2007; Schut, 2004; Schut, 2001; WERG, 2002). As a result, many different recovery sys-tems have been studied (Nourreddine, 2006; Zevenhoven and Saeed, 2003). Similar effortsare also underway in the US, Japan, and Australia (APC, 2005; CWT, 2004; EnvironmentAustralia, 2002; Gallmeyer et al., 2003; Gomes, 2006; Kusaka and Iida, 2000; Nissan, 2004;Recycling Today, 2005; Toyota, 2005; USCAR, 2002). Recovery of plastics for recyclingand limited testing of SR as a pyrolysis feedstock or as a fuel for waste combustors andcement manufacture have also been performed (CARE, 2005; Day, 1993; Keller, 2003;Plastics, 2005; Redin et al., 2001; Winslow et al., 1998, 1999, 2004). Systems to processSR to meet specifications (low ash and low sulfur) for blast furnace fuel or for secondarymaterial recovery are expensive and a significant residual waste volume remains (ANL,2004; APC, 2005; Das et al., 1995; SALYP, 2004).
B. Boughton / Resources, Conservation and Recycling 51 (2007) 621–642 623
Recovery of gross fuel value from wastes can provide a significant economic benefitto large energy consuming industries. Dry SR is about 50% combustible and 50% non-combustible (metals, glass, dirt, and residual ash). Others have studied the energy value ofSR and energy recovery in various systems (Automotive Engineering, 1994; CAC, 1998;CMP, 1990; Mark, 1999; Saxena et al., 1995; USDOE, 1987; Zevenhoven and Saeed, 2003).Some separation of the SR components was required to improve the energy value, as wellas to reduce residual ash or remove problematic constituents such as PVC. As a result,co-combustion of SR with municipal solid waste for energy recovery or as a blast furnacefuel was only be viable for half the SR waste stream (plastics and rubber) with highestenergy and lowest ash content. The residual fraction of the SR would need to be landfilledor managed in another way.
The variability of shredder feed material makes it very difficult to quantify the compo-sition of shredder residue (Ambrose et al., 2000). Additionally, the physical nature of SR,cross contamination, weak markets for major recoverable materials (such as polyurethanefoam, rubber and plastics) and significant processing needed to meet market specificationshampers recovery of specific materials from SR (Reuter et al., 2005). A prior study comparedthe life cycle impacts of several resource recovery alternatives to landfilling (Boughton andHorvath, 2006). Using SR as a fuel supplement for cement manufacturing was found tobe the preferred alternative. Hence, a follow-up study was funded by the USEPA and theCalifornia Department of Toxic Substances Control (DTSC) to investigate inexpensive sep-aration systems capable of producing an acceptable supplemental fuel from SR (USEPA,2004b).
1.2. Cement manufacturing
Cement kilns can use a wide variety of different fuels without compromising cementproduct quality, plant operations or emissions. Kiln operator experience with substitute fuelssuch as waste plastics, tires, paint, used oil and other solid and liquid wastes is widespread.The portland cement product quality and kiln air emissions are not impacted by contaminantsin the commonly used alternative fuels even at up to 30% fuel supplement (Choate, 2003;Gabel and Tillman, 2005; USEPA, 1995). Waste tires, a significant component of SR, arethe most commonly used supplemental fuel (USEPA, 1991).
Numerous studies discuss the very successful use of alternative fuels (includinghazardous wastes) and mineral feedstocks in cement manufacturing, the resulting ben-efits of energy and raw materials savings, the incorporation of residual ash into thecement product, and the destruction of organic constituents in the fuel (Cembureau,2004; Denis et al., 2000; Dyckerhoff, 2005; Herat, 1996; Holcim, 2005; Lanoir, 1997;PCA, 2004; Prisciandaro et al., 2003; RRF, 1992; Taiheiyo Cement, 2004; USEPA,2004c; WBCSD, 2005). Most of the low and medium volatility heavy metal contentsin mineral and fuel feedstocks are incorporated into the cement product. In contrast, airpollution control systems capture only about 50% of the highly volatile metals such asmercury (PCA, 2005; Seyler et al., 2005). Additionally, the large amount of limestonein the feed minerals effectively controls acid gas emissions. Cement producers are alsosuccessfully using many different materials for mineral feed substitutes (CIF, 2003;Holcim, 2005; Taiheiyo Cement, 2004; van Oss, 2002; van Oss, 2003). These include
624 B. Boughton / Resources, Conservation and Recycling 51 (2007) 621–642
spent catalysts, aluminum production wastes, glass, industrial ashes, filter cake and millscale.
Considering the alternative feedstocks that kiln operators currently use and the volume ofSR generated each year, SR should be reviewed for its potential as both a fuel and mineralsupplement. Plastics and rubber make up the majority of SR combustible content. Butcompared to the alternative fuels used at cement kilns today, SR is a heterogeneous mixtureof many different materials yielding a net low BTU value and high ash content. Others haveshown that SR has about 5000 BTU per pound (40% that of coal) and may consist of up to40% of mineral equivalent to that used in cement production (silicates, calcium, aluminumand iron). Separating SR into high BTU and high mineral content fractions for recoveryin cement kilns could result in considerable coal and minerals conservation. The avoidedlandfill fees for shredder operators, as well as fuel cost savings at kilns would need to offsetthe SR processing costs.
Use of SR in kilns would also lead to reduced environmental impacts from less mining,transporting and preparation of coal and mineral ores. The potential impacts of landfillleachate contaminated with SR constituents would be avoided and landfill space wouldalso be conserved. As a secondary benefit, some emissions reductions may occur withsubstitute fuels such as waste tires, plastics and used oil (e.g., a lower carbon, nitrogenand sulfur content per unit of energy than coal yields lower carbon dioxide, nitrogen oxideand sulfur dioxide emissions (USEPA, 1995; Gabel and Tillman, 2005)). All these issuesshould be considered when evaluating resource recovery options (Boughton and Horvath,2006).
1.3. Project goal and description
Discussions with cement manufacturing industry representatives indicated that the mainbarriers to the use of SR as fuel is the perception that it is too contaminated, too hetero-geneous and of insufficient energy value (Bennett, 2005; Hawkins, 2005; Meinen, 2005;Mayes, 2005; Shumway, 2005). These became the key considerations to address in thisstudy. The plastic, rubber and textile components of SR exceed the BTU value of coal. Theinert content (namely glass, iron, calcium and aluminum) in SR can substitute for mineralfeed-stock. The goal of this study was to assess the mechanical means necessary to separateand process SR into material acceptable for substitution for coal fuel. The USEPA andDTSC funded this study to determine if an economical separation system appears capableof producing material acceptable for kiln use.
The project was developed in phases. The first phase was to characterize the SRas generated. Samples of SR were taken at the Hugo Neu-Proler shredder facility inLos Angeles, California. Laboratory tests were conducted to assess SR characteristicsincluding physical parameters, fuel characteristics (proximate and ultimate analyses),as well as beneficial elements and contaminant concentrations. Two contract labora-tories were chosen, Hazen Research of Colorado to do the sample preparation andproximate/ultimate analyses, and American Scientific Laboratories of California to dothe elemental analyses. We discussed the results with kiln operators to determine theconsiderations for supplemental fuels. In the second phase, we demonstrated separa-tion techniques to recover valued streams. The final phase included the estimation of

B. Boughton / Resources, Conservation and Recycling 51 (2007) 621–642 625
operating costs for a full-scale separation system and comparison to the costs of SRlandfilling.
2. Initial sampling results
2.1. Waste sampling
SR sampling was conducted at Hugo Neu-Proler over 2 days (February 10–11, 2005).The non-ferrous metals recovery system produces <0.5 in., 0.5–1.5 in., and 1.5–4 in. sizesub-streams of SR material in a trommel. (A small volume stream of >4 in. oversizedmaterial passed through the trommel and was noted to contain significant amounts ofrubber and metallic material. This material was not sampled because it is returned tothe shredder for size reduction, but it could be separately sorted to obtain the energyrich materials.) The trommel and non-ferrous metal recovery systems act to homoge-nize each sub-stream and to separate fines from the larger materials (helping to reducetwo of the identified barriers to SR use). These processes result in relatively clean anduniform sub-streams; hence small sample sizes should be adequate to characterize thewaste.
After sufficient time for the non-ferrous recovery system operation to stabilize, samplingwas conducted after shutting down the entire system three times on 10 February 2005. Twoseparate non-ferrous metals recovery systems operate in series for the fines and midsizestreams, and one system for the coarse material. Samples were taken from each of the fivenon-ferrous recovery system discharge conveyance belts. Cross sections were taken fromthe loaded belts to fill a 1-gallon plastic bag. For the >1.5–4 in. coarse material, two or threebags were filled to adequately characterize the waste.
In addition to three samples from each of the sampling points described above, threesamples were also taken from the recombined <1.5 in. materials (the <0.5 in. and >0.5 in.to <1.5 in. sub-streams) on 11 February 2005. Sampling both the <1.5 in. recombined sub-streams and the >1.5 in. sub-stream will help to characterize the total SR waste since theweight proportions of the individual sub-streams are not well known. A total of 33 sampleswere collected over the 2 days. All sample bags were sealed to retain moisture and sent forprocessing and analysis.
Field observations showed that the fines appeared very uniform, consisting mostly offiber and dirt, free of material larger than 0.5 in. A portion of the fines material was sievedwith several trays to examine the ability to further size separate the material (screen sizesincluded 19 mm, 4.75 mm, 2 mm, and 0.85 mm openings). In general the fines contain asignificant amount of fibers that obstructed the 4.75 mm screen. Very small amounts ofglass were seen in the fines samples, meaning glass recovery would likely not be feasible.All samples of SR larger than 0.5 in. size were relatively free of fines, and appeared wellmixed and fairly uniform in composition despite the diversity of materials within. Ferrousand non-ferrous metal recovery seems to be complete with the exception of small amountsof metals attached to plastic or rubber pieces (such as a hose clamp on a rubber hose ora small screw within a plastic piece), short lengths of copper wire entangled with othermaterials, as well as steel cord wire imbedded in tire shreds.

626 B. Boughton / Resources, Conservation and Recycling 51 (2007) 621–642
3. Laboratory results
Materials were dried and cryogenically milled to pass a 2 mm screen (which preserved thevolatile components such as mercury). The laboratory processed the total 1-gallon volumeof each sample, with the exception of some metal fragments and rocks that were removedduring milling. After through mixing, proximate and ultimate tests as well as elementalmercury and total chlorine determinations were completed. Elemental analyses were thendone on the ash resulting from the proximate analyses. Duplicate analyses for 16 of the 33samples provided information on the homogeneity of the processed sample material as wellas the reproducibility of the laboratory analyses. Standard laboratory QA/QC procedureswere also performed.
The laboratories reported the proximate, ultimate and elemental test results for all sam-ples as well as duplicates. The nature of rubber and plastics makes it very difficult to analyzefor elemental concentrations because of the resistance to digestion. Tests on the recoveredashes should reflect the raw material elemental concentrations except for volatile metalssuch as mercury, lead and cadmium. With the exception of mercury, analyses for total metalsfrom other samples of SR material were gathered to fill this gap.
The moisture content of the samples varied due to dust control sprays in the shredder andthe non-ferrous separation system and may also be significantly different depending on theseason. Hence, all results are presented on a dry-weight basis to provide consistency andfor comparison to other fuels. The results are presented as an average of the six samplesfor each sampling point (note that only three samples of the <0.5–1.5 in. combined materialwere taken). In general the variation in results between the six samples in each size fractionwas small. Duplicates showed only slight variation in results. Statistical confidence intervalswere not determined, but the samples appear representative of each size fraction.
Table 1 shows that the larger the material size, the lower the residual ash content andthe higher the BTU value (as expected, BTU values inversely correlate with the residualash content). The fines, which constitute about 30% of the total SR wastestream, had thehighest ash content of 50–60% and the lowest BTU content of about 5000 BTU/lb. The0.5–1.5 in. mid-size fraction, also about 30% of the total SR wastestream, has marginalenergy content. The coarse material, which constitutes about 40% of the total SR stream,had a BTU value comparable to coal. However, none of the size fractions yielded a chlorinecontent low enough to be valued. Chlorine levels were found to trend higher with largermaterial size. The net chlorine levels correlate with the PVC content in automobiles and
Table 1Averaged proximate/ultimate results for SR by size fraction sampled (dry weight basis, n = 6)
Material fraction (in.) BTU (lb) Ash (wt%) Chlorine (wt%) Sulfur (wt%)
Fines <0.5 5,880 54.4 1.0 0.24Fines <0.5 4,650 61.4 0.6 0.300.5–1.5 8,670 40.8 1.8 0.310.5–1.5 9,420 33.4 2.3 0.31<0.5–1.5a (n = 3) 7,170 46.3 1.1 0.25Coarse 1.5–4 12,900 20.5 3.2 0.49
a Samples of facility recombined stream.
B. Boughton / Resources, Conservation and Recycling 51 (2007) 621–642 627
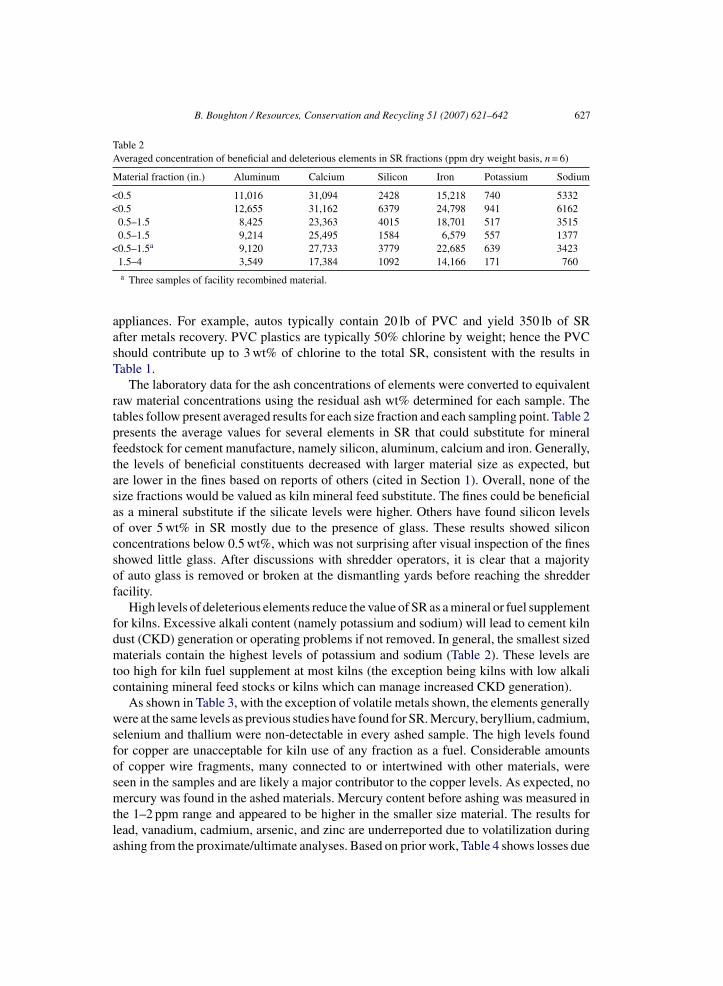
Table 2Averaged concentration of beneficial and deleterious elements in SR fractions (ppm dry weight basis, n = 6)
Material fraction (in.) Aluminum Calcium Silicon Iron Potassium Sodium
<0.5 11,016 31,094 2428 15,218 740 5332<0.5 12,655 31,162 6379 24,798 941 6162
0.5–1.5 8,425 23,363 4015 18,701 517 35150.5–1.5 9,214 25,495 1584 6,579 557 1377
<0.5–1.5a 9,120 27,733 3779 22,685 639 34231.5–4 3,549 17,384 1092 14,166 171 760a Three samples of facility recombined material.
appliances. For example, autos typically contain 20 lb of PVC and yield 350 lb of SRafter metals recovery. PVC plastics are typically 50% chlorine by weight; hence the PVCshould contribute up to 3 wt% of chlorine to the total SR, consistent with the results inTable 1.
The laboratory data for the ash concentrations of elements were converted to equivalentraw material concentrations using the residual ash wt% determined for each sample. Thetables follow present averaged results for each size fraction and each sampling point. Table 2presents the average values for several elements in SR that could substitute for mineralfeedstock for cement manufacture, namely silicon, aluminum, calcium and iron. Generally,the levels of beneficial constituents decreased with larger material size as expected, butare lower in the fines based on reports of others (cited in Section 1). Overall, none of thesize fractions would be valued as kiln mineral feed substitute. The fines could be beneficialas a mineral substitute if the silicate levels were higher. Others have found silicon levelsof over 5 wt% in SR mostly due to the presence of glass. These results showed siliconconcentrations below 0.5 wt%, which was not surprising after visual inspection of the finesshowed little glass. After discussions with shredder operators, it is clear that a majorityof auto glass is removed or broken at the dismantling yards before reaching the shredderfacility.
High levels of deleterious elements reduce the value of SR as a mineral or fuel supplementfor kilns. Excessive alkali content (namely potassium and sodium) will lead to cement kilndust (CKD) generation or operating problems if not removed. In general, the smallest sizedmaterials contain the highest levels of potassium and sodium (Table 2). These levels aretoo high for kiln fuel supplement at most kilns (the exception being kilns with low alkalicontaining mineral feed stocks or kilns which can manage increased CKD generation).
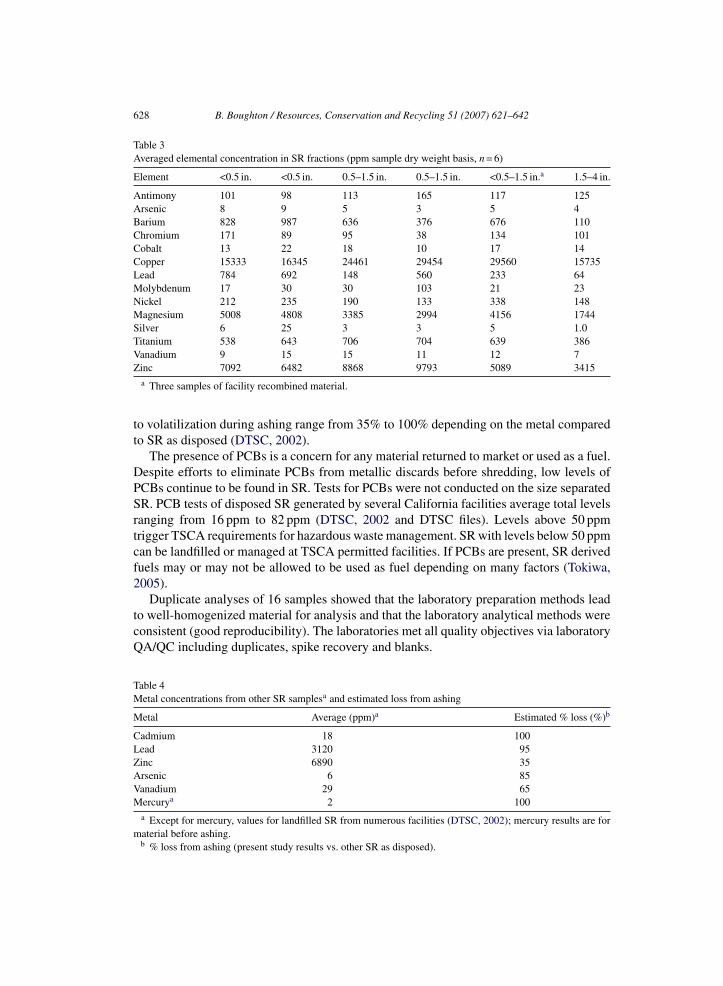
As shown in Table 3, with the exception of volatile metals shown, the elements generallywere at the same levels as previous studies have found for SR. Mercury, beryllium, cadmium,selenium and thallium were non-detectable in every ashed sample. The high levels foundfor copper are unacceptable for kiln use of any fraction as a fuel. Considerable amountsof copper wire fragments, many connected to or intertwined with other materials, wereseen in the samples and are likely a major contributor to the copper levels. As expected, nomercury was found in the ashed materials. Mercury content before ashing was measured inthe 1–2 ppm range and appeared to be higher in the smaller size material. The results forlead, vanadium, cadmium, arsenic, and zinc are underreported due to volatilization duringashing from the proximate/ultimate analyses. Based on prior work, Table 4 shows losses due
628 B. Boughton / Resources, Conservation and Recycling 51 (2007) 621–642
Table 3Averaged elemental concentration in SR fractions (ppm sample dry weight basis, n = 6)
Element <0.5 in. <0.5 in. 0.5–1.5 in. 0.5–1.5 in. <0.5–1.5 in.a 1.5–4 in.
Antimony 101 98 113 165 117 125Arsenic 8 9 5 3 5 4Barium 828 987 636 376 676 110Chromium 171 89 95 38 134 101Cobalt 13 22 18 10 17 14Copper 15333 16345 24461 29454 29560 15735Lead 784 692 148 560 233 64Molybdenum 17 30 30 103 21 23Nickel 212 235 190 133 338 148Magnesium 5008 4808 3385 2994 4156 1744Silver 6 25 3 3 5 1.0Titanium 538 643 706 704 639 386Vanadium 9 15 15 11 12 7Zinc 7092 6482 8868 9793 5089 3415
a Three samples of facility recombined material.
to volatilization during ashing range from 35% to 100% depending on the metal comparedto SR as disposed (DTSC, 2002).
The presence of PCBs is a concern for any material returned to market or used as a fuel.Despite efforts to eliminate PCBs from metallic discards before shredding, low levels ofPCBs continue to be found in SR. Tests for PCBs were not conducted on the size separatedSR. PCB tests of disposed SR generated by several California facilities average total levelsranging from 16 ppm to 82 ppm (DTSC, 2002 and DTSC files). Levels above 50 ppmtrigger TSCA requirements for hazardous waste management. SR with levels below 50 ppmcan be landfilled or managed at TSCA permitted facilities. If PCBs are present, SR derivedfuels may or may not be allowed to be used as fuel depending on many factors (Tokiwa,2005).
Duplicate analyses of 16 samples showed that the laboratory preparation methods leadto well-homogenized material for analysis and that the laboratory analytical methods wereconsistent (good reproducibility). The laboratories met all quality objectives via laboratoryQA/QC including duplicates, spike recovery and blanks.
Table 4Metal concentrations from other SR samplesa and estimated loss from ashing
Metal Average (ppm)a Estimated % loss (%)b
Cadmium 18 100Lead 3120 95Zinc 6890 35Arsenic 6 85Vanadium 29 65Mercurya 2 100
a Except for mercury, values for landfilled SR from numerous facilities (DTSC, 2002); mercury results are formaterial before ashing.
b % loss from ashing (present study results vs. other SR as disposed).

B. Boughton / Resources, Conservation and Recycling 51 (2007) 621–642 629
4. SR separation and analysis results
4.1. SR materials separation
Based on the results for the size-segregated SR materials, further separation is neededto yield material with acceptable energy, metals and chloride content. A literature reviewand discussions with shredder operators offered great insight into the equipment needed toreduce the contaminant levels. Technologies that have been used or could be used to recovervalued sub-streams from SR include heavy media separation, froth flotation, vibratingtables, optical sorting and air classification. In the past, shredders used density separationsystems with heavy media baths to recover and separate non-ferrous metals from otherSR constituents. The density of metals, glass, and dirt are two to three times that of mostplastics and rubber materials. This technique can also be used to recover a high-energycontent plastics and rubber fraction from SR. Additionally, density separation of PVC fromless dense plastics and rubber has been demonstrated (Galloo, 2005; MBA, 2005; SALYP,2004; Schut, 2004; TXI, 2005). This technique looks to be the least expensive and most welldeveloped to affect a separation of SR to yield a low ash, low chlorine, and high BTU contentmaterial.
Samples of the <1.5 in. (the combined <0.5 in. and >0.5–<1.5 in. material) and of the>1.5–<4 in. sub-streams were separately collected on August 2, 2005. The net 26.5 lb of<1.5 in. material was found to be highly fibrous with some plastic, rubber and copperwire pieces interspersed. Hand sorting showed that only 3.5 lb of small plastic and rub-ber pieces were in the total sample. The material was sampled for lab analyses, but therewas not enough plastic and rubber content to test density separation. The net 14 poundsof >1.5 in. coarse material was separated by hand to remove materials from the plasticsand rubber materials of interest. Seven different recovered fractions resulted; copper wire,polyurethanes, polystyrenes, carpet/textiles, mixed plastic/rubber, tire rubber, and a resid-ual fibrous mix. The plastic/rubber fraction weighed about 8 pounds and was retained fordensity separation. The fibrous material weighed about 4 pounds, and the remaining mate-rials collectively weighted about 2 pounds. The other materials were separately bagged forlaboratory analysis.
Small-scale tests with saltwater baths are commonly used to test density separations. Alaboratory scale experiment for the plastic/rubber material separation was designed usingEpson salts (MgSO4) in hot water. The materials were first placed into a hot water bath toseparate floaters. A significant amount of material floated including plastics, wood, textiles,and paper as well as polyurethane and styrofoam. The floaters were collected, bagged forlaboratory analysis and labeled as <1.0 specific gravity (sg). A series of salt water baths werethen used to sink/float the remaining >1.0 sg plastics and rubber materials. Bath densitieswere chosen based on those successfully used by others to separate mixed plastic wastes. Thepremise was that PVC should be separated at densities near 1.3 sg (depending on specificplastic product formulation) while the bulk of the less dense plastics and rubber will float.Mixed plastics and fillers used in specific plastics formulations may lead to different specificmaterial densities however. Hence, a range of bath density levels was used to separate theplastics/rubber sample into fractions with the purpose of removing a majority of the overallchlorine content.
630 B. Boughton / Resources, Conservation and Recycling 51 (2007) 621–642
Actual bath densities achieved were >1.3, >1.275, <1.225, and <1.125 specific gravity.The material that sank in the initial water bath was transferred to the highest density bath(>1.3 sg). Sinkers, the material with a density above 1.3 sg (observed to be small amountsof vinyl backing for floor mats), were collected and washed in hot water to remove residualsalts and then bagged for analysis. The materials that floated at 1.3 sg were transferred to thenext lower density bath. This sequential procedure was followed until the final 1.125 sg bathwhere both the sinking and the floating materials were collected and washed. Relativelysmall amounts of materials were recovered at the mid range density splits and a majority ofthe rubber separated at 1.1 sg, while plastics appeared to be more distributed. The separationby density experiment lead to seven separated components which in addition to the six handseparated materials gave a total of thirteen separate components for lab analyses.
4.2. Laboratory results
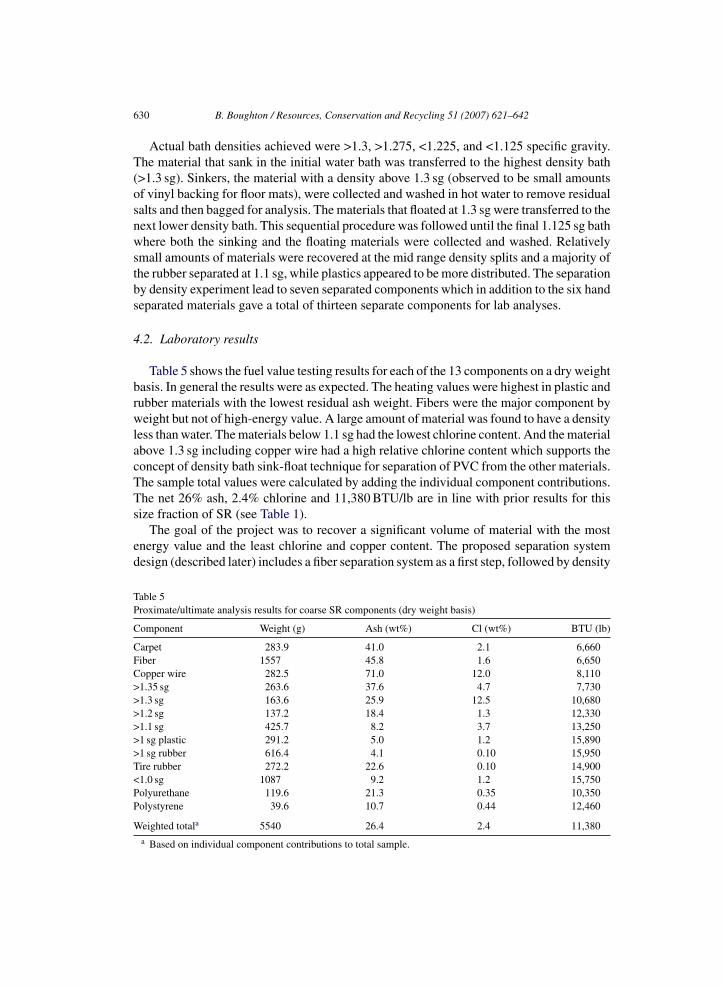
Table 5 shows the fuel value testing results for each of the 13 components on a dry weightbasis. In general the results were as expected. The heating values were highest in plastic andrubber materials with the lowest residual ash weight. Fibers were the major component byweight but not of high-energy value. A large amount of material was found to have a densityless than water. The materials below 1.1 sg had the lowest chlorine content. And the materialabove 1.3 sg including copper wire had a high relative chlorine content which supports theconcept of density bath sink-float technique for separation of PVC from the other materials.The sample total values were calculated by adding the individual component contributions.The net 26% ash, 2.4% chlorine and 11,380 BTU/lb are in line with prior results for thissize fraction of SR (see Table 1).
The goal of the project was to recover a significant volume of material with the mostenergy value and the least chlorine and copper content. The proposed separation systemdesign (described later) includes a fiber separation system as a first step, followed by density
Table 5Proximate/ultimate analysis results for coarse SR components (dry weight basis)
Component Weight (g) Ash (wt%) Cl (wt%) BTU (lb)
Carpet 283.9 41.0 2.1 6,660Fiber 1557 45.8 1.6 6,650Copper wire 282.5 71.0 12.0 8,110>1.35 sg 263.6 37.6 4.7 7,730>1.3 sg 163.6 25.9 12.5 10,680>1.2 sg 137.2 18.4 1.3 12,330>1.1 sg 425.7 8.2 3.7 13,250>1 sg plastic 291.2 5.0 1.2 15,890>1 sg rubber 616.4 4.1 0.10 15,950Tire rubber 272.2 22.6 0.10 14,900<1.0 sg 1087 9.2 1.2 15,750Polyurethane 119.6 21.3 0.35 10,350Polystyrene 39.6 10.7 0.44 12,460
Weighted totala 5540 26.4 2.4 11,380a Based on individual component contributions to total sample.

B. Boughton / Resources, Conservation and Recycling 51 (2007) 621–642 631
Table 6Fuel value contributions by component groups of coarse SR material
Component group Percent cumulative contribution to the sample total
Weight Chlorine Ash BTU
<1 sg 22.5 10.3 8.8 29.9>1 sg 43.8 13.1 15.8 59.3>1.1 sg 51.5 25.0 18.1 68.2>1.2 sg 54.0 26.4 19.9 70.9>1.3 sg 61.7 51.0 29.5 76.9Copper wire 66.8 76.6 43.3 80.6Fiber/carpet 100.0 100.0 100.0 100.0
separation of the remaining materials. The ordering of the sub-fractions in Table 5 mirrorsthe proposed sequence of separation steps. For simplicity, the component values shownin Table 5 were consolidated by grouping as follows: fibers and carpet, >1.3 sg includesthe >1.3 sg and the >1.35 sg components, >1.0 sg includes the tire rubber as well as theseparated plastics and rubber, and <1.0 sg includes the polyurethane and polystyrene. Thevalues presented in Table 6 are the cumulative contributions to the total sample for each ofthose groups. For example, the combined <1 sg components contributed 22% of the totalsample weight (of 5540 g), 10% of the total chlorine, 9% of total ash, and 30% of the BTUvalue, etc.
Choosing the media bath density for a full scale system leads to a trade-off betweenrecovering the most heating value while retaining the least chlorine content. As shown inbold in Table 6, a 1.2 sg density bath would result in recovery of two thirds of the initialheating value while only retaining 25% of the total chlorine and 20% of the ash content. Thecomponent contributions shown in Table 6 were further consolidated into two sub-streamsat the 1.2 sg density cut-off. Two fractions result as shown in Table 7, half the mass asan energy rich material and half as a residual. The fuel rich sub-stream comprised of allmaterials under 1.2 sg, labeled fuel, has characteristics comparable to coal. The remainingmaterial, labeled residual, would be burdened with a majority of the ash and chlorine content.
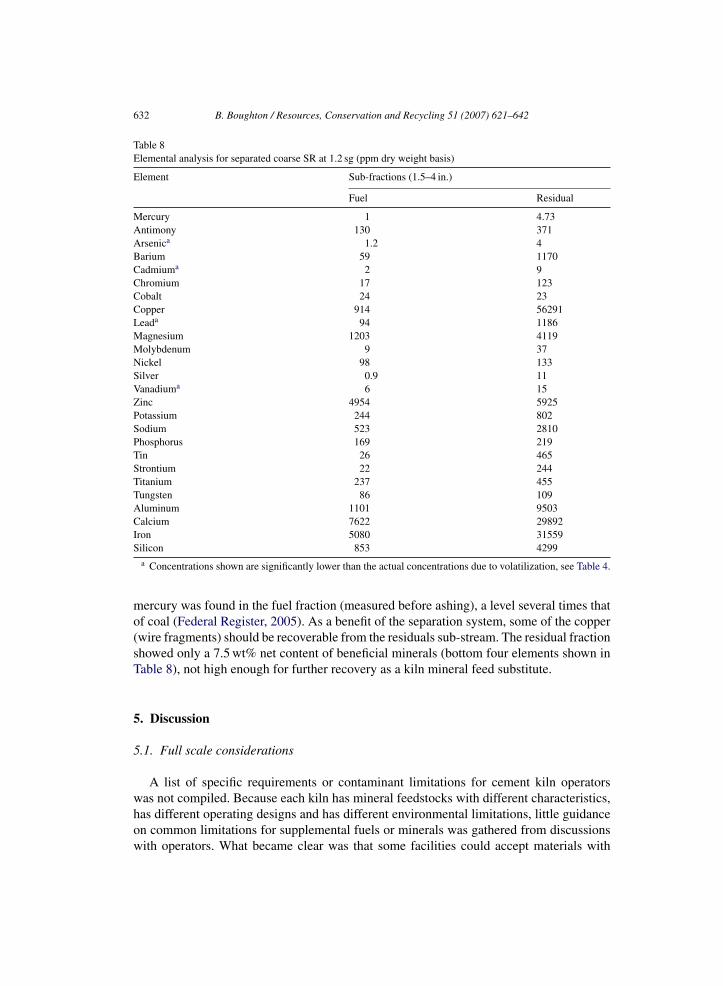
Other elements in SR are of concern including heavy metals as well as the beneficialelements such as silicon, aluminum, iron and calcium. The elemental analyses results werecompiled and shown in Table 8 for the same 1.2 sg separation cut-off described above. Lowlevels for nearly every element are found in the in the consolidated fuel fraction. Mostof these levels fall into acceptable levels for supplemental fuel. However, about 1 ppm of
Table 7Key fuel characteristics for separated coarse SR at 1.2 sg
Characteristic Sub-fractions (1.5–4 in.)
Fuel Residual
BTU (lb) 13240 6560Chlorine (wt%) 1.2 3.7Ash (wt%) 9.3 44Sulfur (wt%) 0.59 0.44
632 B. Boughton / Resources, Conservation and Recycling 51 (2007) 621–642
Table 8Elemental analysis for separated coarse SR at 1.2 sg (ppm dry weight basis)
Element Sub-fractions (1.5–4 in.)
Fuel Residual
Mercury 1 4.73Antimony 130 371Arsenica 1.2 4Barium 59 1170Cadmiuma 2 9Chromium 17 123Cobalt 24 23Copper 914 56291Leada 94 1186Magnesium 1203 4119Molybdenum 9 37Nickel 98 133Silver 0.9 11Vanadiuma 6 15Zinc 4954 5925Potassium 244 802Sodium 523 2810Phosphorus 169 219Tin 26 465Strontium 22 244Titanium 237 455Tungsten 86 109Aluminum 1101 9503Calcium 7622 29892Iron 5080 31559Silicon 853 4299
a Concentrations shown are significantly lower than the actual concentrations due to volatilization, see Table 4.
mercury was found in the fuel fraction (measured before ashing), a level several times thatof coal (Federal Register, 2005). As a benefit of the separation system, some of the copper(wire fragments) should be recoverable from the residuals sub-stream. The residual fractionshowed only a 7.5 wt% net content of beneficial minerals (bottom four elements shown inTable 8), not high enough for further recovery as a kiln mineral feed substitute.
5. Discussion
5.1. Full scale considerations
A list of specific requirements or contaminant limitations for cement kiln operatorswas not compiled. Because each kiln has mineral feedstocks with different characteristics,has different operating designs and has different environmental limitations, little guidanceon common limitations for supplemental fuels or minerals was gathered from discussionswith operators. What became clear was that some facilities could accept materials with
B. Boughton / Resources, Conservation and Recycling 51 (2007) 621–642 633
certain characteristics while others could not. There also is considerable flexibility at somefacilities depending on many factors. Some cement manufacturers will accept poor qualityfuels based on the amount of payment offered for disposal, others have strict limits onspecific constituents such as total alkali because of CKD generation.
Discussions with shredder operators lead to a conceptual system design to recover a fuelrich fraction from SR (Andrusyshyn, 2005; Neu, 2005). A full-scale system would likelyneed to first break up and separate entangled fiber material from the valued rubber and plas-tic pieces. Air classification could remove the very low-density materials such as expandedpolystyrene and polyurethane (although, much of this material may already be recover-able at the shredder). Following some cutting of fibers to disentangle the SR and furtherseparation, density sink/float techniques will effectively recover a valued plastics/rubberstream.
Density separation at 1.2 sg appears to remove the majority of the chlorinated plasticsand high ash bearing materials. However, resulting net chlorine levels of 1 wt% may meanthat the final recovered fuel fraction (see Table 7) would be marginally valued and perhapsonly useable at a few facilities or at low substitution rates. Reducing the media bath densitycut-off to closer to 1.1 sg should result in a chlorine content of 0.7 wt%, while still leadingto significant recovery of BTU content (60% from Table 6). Alternatively, additional sep-arations to further reduce the chlorine levels may be needed. Such separations have beendemonstrated with mixtures of plastics and with SR (Galloo, 2005; MBA, 2005; SALYP,2004; WERG, 2002). Texas Industries (TXI) apparently demonstrated such a system withSR but no information is available (Schut, 2004; TXI, 2005). However, it is notable thatthe reconstituted fuel material results from this study (shown in Table 7) are lower thanthe supplemental fuel requirements of less than 4% total chlorides stated by TXI for theircement facilities.
The presence of PCBs may impede the use of SR supplemental fuel in kilns. Creatinga system oriented towards efficient use of resources could require fundamental changes inthe waste versus non-waste regulatory construct embedded in RCRA (USEPA, 2003). Onesuch change may be needed in the federal scrap metal exemption rules so that non-metallicmaterials recovery at shredders is allowed. Alternatively, SR could be considered a mixedwaste under RCRA to allow the SR derived fuel to be used despite traces of PCBs belowTSCA limits (50 ppm).
5.2. Conceptual full-scale design
Some of the technologies that have been used or can be potentially used to recover valuedsub-streams from SR include heavy media separation, froth flotation, cryogenic grinding,vibrating tables, air classification, and optic sensors (Buchan and Yarar, 1995; Day et al.,1999; de Jong and Dalmijn, 1997; Fraunholcz et al., 2000; Jody et al., 1994; Kita et al.,2005; MBA, 2005; SALYP, 2004; Scheirs, 1998; Shen et al., 2002; Singh et al., 2001;Trouve et al., 1998). With these technologies in mind, discussions with shredder and withkiln operators lead to a system concept to recover a valued fuel fraction as described below(Andrusyshyn, 2005; Neu, 2005; Osucha, 2006).
A full-scale separation plant design assumes that a shredder operates a non-ferrous recov-ery system that produces several size separated streams. Excluding the fines (<1/2 in. SR
634 B. Boughton / Resources, Conservation and Recycling 51 (2007) 621–642
material) leaves about 66% of the total SR waste stream to be initially processed by cutting,vibrating tables and air classification to disentangle materials and separate polyurethane.The resulting plastics and rubber rich stream (with copper wire and other dense materials)would then be placed in a water bath to separate the lowest density materials. The remain-ing material would be sent to a heavy media bath system with a density controlled between1.1 sg and 1.2 sg This would lead to removal of the residual metal and PVC, with sometolerable loss of valued materials. An economic review of the entire process requires sizingeach processing unit. A mass flow assessment includes the following assumptions based onthe results in Table 6 and conversations with shredder operators:
• 66% of the total SR residue is over 1/2 in,• 64% of that is recoverable plastics and rubber,• 70% of that is less than 1.2 sg and recoverable,• ferrous and non-ferrous metals are recovered from the sink fraction.
The process steps outlined in Fig. 1 would initially involve processing 33 t/h of fines freematerial to remove fibers and disentangle materials (based on 50 t/h SR generation rate).Separation by several air classification steps leads to recovery of 21 t/h of relatively fiberfree plastics and rubber pieces (with copper wire and PVC). An initial water bath would
Fig. 1. Processing steps and material partitioning for a conceptual separation system.
B. Boughton / Resources, Conservation and Recycling 51 (2007) 621–642 635
recover about 6 t/h of <1 sg materials from the mixed stream. A media bath processing theremaining 15 t/h of >1 sg residual from the water bath would result in flotation of 9 t/h ofmaterials and reject about 6 t/h of >1.2 sg materials (including copper and PVC with somecarryover loss of desired materials). Further recovery of 0.2 t/h of copper from the rejectedfraction (conservatively assumed to be only one third of the total copper content) would bethe final step. From the assumptions above, a net 15 t/h is recoverable and a total 35 t/h ofwaste for disposal would result.
All the systems proposed are low technology processes that are familiar to shredderoperators. Simple design and low labor operations are desired even at the expense of someloss of valued material. As the key piece of equipment, several media separation systemswere investigated. One design is a cone shaped settling tank with a rotating skimmingdevice at the surface and a screw conveyor system to remove rejected material from thebottom. This will work well for the initial water bath separation system, but there areimportant considerations for the 1.2 sg media system. A rotating drum design would providethe best throughput, recovery and separation quality. Density separation systems are mosteffective if the materials introduced are of the same size and shape. Chopping and shreddingthe recovered SR materials to pass a 1/2 in. screen would help the separation efficiency,but would add significant processing costs. However this may be the chosen method ifthe cement kiln operator requires the supplemental fuel materials to be small enough forpneumatic transfer into the kiln.
For efficiency and cost considerations the media material chosen should be a ferro-silicatelike magnetite. This natural ore is easy to magnetically recover from spent bath liquids andrinse waters, and inexpensive enough that drag-out losses in the separated materials aretolerable. A washing step will maximize the recovery of the media and the recovered watershould make up for losses to the SR materials and evaporation, etc. Periodic bleeding ofthe bath water will be required to remove suspended solids that may build up and cause ashift in bath density. Any wastewater can likely be discharged directly to the storm watercollection and treatment system at a shredder facility.
The media bath was sized to process 15 t/h of feed. The 1.2 sg separation cut-off valueis flexible. The results in Table 6 show that there is minimal mass fraction in the 1.1–1.2density range; hence a system can be optimized to maximize recovery and reduce chlorinecontent, without substantial loss of mass. Both streams recovered from the density bathshould be washed to recover magnetite. Some retention of magnetite will not reduce thevalue of the final product to kiln operators because the iron content is beneficial. Recoveryof the low-density fluff (predominately polyurethane and polystyrene) at the shredder orwith an air classifier will also reduce media losses. However, certain shapes of material willretain water. A shaker table or rotating screens will help remove retained water. Magneticseparation would then recover magnetite from wash waters. If needed, the recovered SRproduct can be cut and shredded for efficient transportation and to facilitate the use of thematerial as fuel at a kiln.
5.3. Economic assessment
A low technology processing system using commercially available equipment andminimal labor was envisioned. Air separation and shaker table systems are commonly
636 B. Boughton / Resources, Conservation and Recycling 51 (2007) 621–642
Table 9Estimated economic cost/benefits for recovering 15 t/h SR derived fuel (thousands of dollars)
Annual costs Annual benefits
Capital investment costs (20-year-term)Pretreatment (33 t/h), $350k $18Initial water separation, $200k $10Media bath (15 t/h), $750k $37Non-ferrous recovery, $100k $5Interest (10%) $85
Operating costsPersonnel (4000 h, 45% benefits) $100Electricity (300 hp total, $0.08/kWh) $35Media (loss of 20 lb/t SR processed) $120Other (general maintenance materials) $50Transportation (30,000 t/year, 100 mile) $240
BenefitsLandfill offset (30,000 t/year at $17 per ton) $510Transportation offset (30,000 t/year, 40 mile) $100Copper recovery (400 t/year at $1.85 lb−1) $680
Total $700 $1300
used equipment by shredders. Many shredder operators have experience with den-sity baths to recover and separate non-ferrous metals from SR. Table 9 summarizesthe capital and operating costs and resource recovery economic benefits as describedbelow.
Air classifiers and cutting systems and all conveyor systems are estimated to cost$350,000 (Andrusyshyn, 2005; Perry and Green, 1997). An initial water bath of simpledesign is estimated to cost $200,000 (Andrusyshyn, 2005; Osucha, 2006; Perry and Green,1997). The heavy media separation process is based on the design presented by the Bureauof International Recycling (BIR, 2005) using a Protec drum separator (Protec, 2005). Cap-ital costs for a 15 t/h media bath unit are $750,000 including all ancillary equipment (BIR,2005; Osucha, 2006; Protec, 2005). Assuming a 20-year operating term for all equipment(with a 10% interest rate) leads to total capital costs (principal and interest) of $150,000per year (assuming complete depreciation over a 20-year period, taxes not included). Per-mitting fees, site acquisition and site preparation costs were not included. It is assumedthat the operation would take place at a shredder facility and that those costs would beminimal.
Operations and maintenance costs include electricity to power a total of 300 hp for electricmotors, two full time operator and maintenance personnel, and materials (including 300 lb/hmedia loss, and $50,000/year in general maintenance materials). Trucking costs are basedon a 50 mile round trip to a landfill, or a 100 mile round trip to a cement manufacturingfacility and $2 per mile averaged cost (noting that significant savings could be found withrail transportation for long distances compared to trucks). Operating costs total $550,000per year. The total cost of $700,000 per year will lead to recovery of 15 t/h of material(30,000 t/year, based on 2000 h/year) or $23 per ton recovered material. This is lower than
B. Boughton / Resources, Conservation and Recycling 51 (2007) 621–642 637
the current national landfill tipping fees range of $24–$70 per ton (depending on region)and average of $34 in 2004 (Wastec, 2005). The current cost to dispose SR by landfillingmay be lower if a discount is given for SR used as alternative daily cover. For the analysisto be conservative, $17 per ton was chosen. The avoided cost of trucking the recovered SRto landfills is $100,000 per year.
Assuming that a kiln operator will take the supplemental material for free leads to anear economic balance at his point. Revenues from additional recovered copper shouldbe included as well. The >1/2 in. SR sub-stream contains about 2 wt% total copper (seeTables 3 and 5) mostly as insulated copper wire. Conservatively assuming that only onethird of the copper content (in the residual fraction shown in Table 8) is recovered gives0.2 t/h or 400 t/year. The value of recovered copper wiring is lower than the copper scrapprice of over $2/lb. Assuming $0.85/lb scrap value yields $680,000/year revenue. Obviously,by generating revenues equal to total costs, the recovery of copper alone could become thesole focus of a shredder residue processing system. The greatest uncertainties are for thecapital cost estimates and the landfill savings. Table 9 shows that a doubling the capitalinvestment would still give an ultimate benefit of $400,000 per year (or over $13 per tonrecovered material). Higher landfilling costs lead to favorable economics.
It is useful to provide context for resource recovery savings potential for the US consid-ering that the total generation of SR is over 3 million tonnes per year. Projecting the resultsof this study to the US would give about 1 million tonnes of shredder residue recovered forfuel. This amount would comprise about 6% of the US cement manufacturing industry’senergy consumption (Choate, 2003) and save $50 million annually (assuming $50 per toncoal). The 1 million tonnes of avoided landfilling would amount to over $20 million sav-ings annually. Further non-ferrous metal recovery could yield revenues of over $20 million(based on 13,000 t of copper alone). The costs to process the SR would be about $20 millionannually. Considering the many conservative assumptions made for the economic analysis,the recovery of some portion of SR looks to be economically viable even if the shredderoperator needs to pay transportation to far away kilns and pay a fee at the kiln.
6. Conclusions
The main barrier to recovery of energy value from SR has been the perception that it istoo contaminated, has a low heating value and is too heterogeneous. Recovery of materialsand energy from SR has been studied, however past efforts to upgrade and purify SR to asuitable quality have proven uneconomic or impractical. A consumer of SR derived fuelneeds to have a robust process and operational flexibility as well as the capability to uselarge quantities of materials. For these reasons, cement kilns are the most likely user ofSR as a supplemental fuel or for mineral recovery. Simplistic methods to separate SR intoenergy and mineral rich streams may facilitate the use of a sizable fraction of SR by thisindustry.
The study showed that size separation alone is likely not enough to provide usable SRfractions; however, commonly available separation systems should produce an acceptablefuel supplement. Information on the equipment needed and the costs to process SR fractionsto meet kiln operator specifications is critical to the acceptance, adoption, and implemen-
638 B. Boughton / Resources, Conservation and Recycling 51 (2007) 621–642
tation of this resource recovery option. Kiln operators will embrace lower cost clean fuels,and shredder operators will favor avoiding the costs of landfilling while recovering moresalable metals. An economic review of a full-scale separation system shows that process-ing SR appears to be economically marginal considering avoided landfilling costs alone.However, significant economic benefits would result from additional non-ferrous metalsrecovery (principally copper). Remaining barriers to acceptance includes demonstrationthat a full-scale system will consistently produce high valued fuel with low concentrationsof deleterious materials.
Recovery of a mineral rich fraction of SR was not completed. There is less economicincentive for kiln mineral substitute compared to landfilling because of the transportationcosts for dense materials like glass. For many shredders, it is possible that collection ofa glass rich stream from dismantling yards located close to cement kilns could be costeffective. Some shredders may produce SR with significant glass content to be attractive.A potential alternative for the inorganic rich fraction of the residue is for more direct use inbuilding materials (Nourreddine, 2006; Pera et al., 2004; Rossetti et al., 2006).
Shredder residue was found to have substantial recoverable energy value. Followingindustrial ecology and sustainability themes, materials now considered wastes should beviewed as commodities. The environmental life-cycle benefits of SR recovery as fuel incement kilns look very favourable compared to other management options (Boughton andHorvath, 2006). Policy makers could use the results herein to support the recovery of SR aswell as the facilities interested in using these materials. Financial and environmental benefitswould be realized by providing incentives for SR recovery, and by supporting markets forSR derived products.
Barriers inhibiting viable recycling alternatives may need to be addressed. If PCB andother contaminant concerns cannot be overcome for use of SR, few if any other optionsexist other than landfilling. Residual PCBs present a barrier for any recovery alternative butactually promote landfilling over resource recovery, contrary to the principles of RCRA.Other contaminants such as mercury may be of concern as well. Reducing the contaminationof SR from components in the shredder feedstocks (e.g., PCB laden capacitors, lead wheelweights, and mercury switches) may be the most significant barrier to overcome. Full-scaledemonstration of separation and use is the next step. Some development of techniques toreduce the contaminant levels may be needed, followed by testing to show that no significantincreases in emissions at kilns would occur.
Acknowledgements
This report was prepared for a project co-funded by the USEPA under grant #X1-83200201-0 (project term 9 September 2004–31 December 2005). A project descriptioncan be found at (http://www.epa.gov/oswer/docs/iwg/fs auto shredder residue final.pdf).DTSC appreciates the generous time and cooperation provided by the individuals repre-senting the companies participating in this assessment, especially Hugo Neu-SIMS Metalsfor providing SR material. The author also appreciates the input, review and direction pro-vided by Prof. Arpad Horvath from the Department of Civil and Environmental Engineeringat the University of California, Berkeley.
B. Boughton / Resources, Conservation and Recycling 51 (2007) 621–642 639
References
Ambrose C, Singh M, Harder M. The material composition of shredder waste in the UK. IWM Scientific TechRev 2000:27–35.
Andrusyshyn, N. Schnitzer steel. Personal communications, http://www.schnitzersteel.com; 2005.Argonne National Laboratory. http://www.transportation.anl.gov/recycling/plastics.html, http://pe.es.anl.gov/
What%27s%20New/FOAM.pdf, http://pe.es.anl.gov/What’s%20New/FROTH.pdf, and http://www.techtransfer.anl.gov/techtour/autoshredder.html; 2004 [accessed January 2004].
American Plastics Council. http://www.americanplasticscouncil.org; 2005 [accessed June 2005].Automotive Engineering. Automotive shredder residue: three recovery choices. Autom Eng 1994;102(8):29–31.Bennett J. Cal Portland Cement, Personal communication, http://www.calportland.com; 2005.Bureau of International Recycling. Shredding and Media Separation, http://www.bir.org/aboutrecycling/
EOLV/shred8.htm, 2005 [accessed December 2005].Boughton B, Horvath A. Environmental assessment of shredder residue management. Resour Conserv Recycling
2006;47(1):3–25.Buchan R, Yarar B. Recovering of plastics for recycling by mineral processing techniques. J Met 1995;47(2):52–5.Competitive Analysis Center Inc. Automotive shredder residue; its application in steel mill blast furnaces. Study
for the American Plastics Council, http://www.americanplasticscouncil.org; 1998.Consortium for Automotive Recycling. http://www.caregroup.org.uk; 2005 [accessed December 2005].Cembureau, European Cement Industry Association. Environmental benefits of using alternative fuels in cement
production; alternative fuels in cement manufacture, http://www.cembureau.be; 2004 [accessed October 4,2004].
Choate, W. Energy and Emission Reduction Opportunities for the Cement Industry, USDOE, http://www.eere.energy.gov/industry/imf/pdfs/eeroci dec03a.pdf; 2003 [accessed June 2005].
Cement Industry Federation. Cement industry environmental report, http://www.cement.org.au; 2003 [accessedOctober 2005].
Center for Materials Production. Automobile shredder residue—the problem and potential solutions, CMP report#90-1; 1990.
Changing World Technologies. Small scale processing of shredder residue using the thermal conversion process,http://www.changingworldtech.com; 2004 [accessed January 2005].
Das S, Curlee TR, Rizy CG, Schexnayder SM. Automobile recycling in the United States: energy impacts andwaste generation. Resour Conserv Recycling 1995;14:265–84.
Day M. Auto shredder residues—a waste or a valuable resource? SAE 1993;930562:73.Day M, et al. Pyrolysis of auto shredder residues. J Anal Appl Pyrol 1999;51(1–2):181–200.de Jong T, Dalmijn W. Improving jigging results on non-ferrous car scrap by application of an intermediate layer.
Int J Miner Process 1997;49:59–72.Denis S, et al. Experimental evaluation of emission factors of cement kilns burning hazardous wastes. Toxicol
Environ Chem 2000;74:155–63.DTSC. California’s Automobile Shredder Waste Initiative, http://www.dtsc.ca.gov/HazardousWaste/upload/
HWMP REP ASW draft.pdf; 2002 [accessed January 2006].Dyckerhoff. Dyckerhoff Company – Environmental Protection – Secondary Fuels, http://www.dyckerhoff.
com/ english/ firma/firma04.htm; 2005 [accessed December 2005].Environment Australia. Environmental impact of end-of-life vehicles: an information paper, http://www.deh.gov.
au/industry/waste/elv/chapter11.html; 2002 [accessed April 2004].European Commission. Management of end-of-life vehicles, http://europa.eu.int/scadplus/leg/en/lvb/l21225.htm
and end-of-life vehicles, http://europa.eu.int/comm/environment/waste/elv index.htm; 2005 [accessed June2005].
Federal Register. National Emission Standards for Hazardous Air Pollutants from the Portland Cement Manufac-turing industry, http://www.gpoaccess.gov/fr/retrieve.html; 2005 [accessed March 2006, vol. 70, No. 231, p.72333].
Fisher M. The role of plastics in automotive shredder residue, SAE Technical Study Series 1999-01-0664. Detroit,MI: Society of Automotive Engineers; 1999.
Forton O, Harder M, Moles N. Value from shredder waste: ongoing limitations in the UK. Resour ConservRecycling 2006;46.
640 B. Boughton / Resources, Conservation and Recycling 51 (2007) 621–642
Fraunholcz N, et al. A novel approach to the mechanical processing of ASR. Proceedings of the 4th internationalsymposium on recycling of metals and engineering materials. The Minerals, Metals & Materials Society2000:1303–14.
Gabel K, Tillman A. Simulating operational alternatives for future cement production. J Cleaner Prod2005;13(13–14):1246–57.
Gallmeyer W, et al. USCAR US Field Trial for Automotive Polymers Recycling, SAE 2003-01-0645; 2003.Galloo. http://www.galloo.com/html/engels/groupgalloo en.htm; 2005 [accessed December 2005].Gerrard J, Kandlikar M. Is European end-of-life vehicle legislation living up to expectations? Assessing the
impact of the ELV Directive on “green” innovation and vehicle recovery. J Cleaner Prod 2007;15(1):17–27.
Gomes V. Material transformation and recycling of automotive shredder residues. Dev Chem Eng Mineral Process2006;14(1/2):183–92.
Hawkins, G. Personal contact April 2005, Portland Cement Association, http://www.cement.org; 2005.Herat S. Energy recovery from solid and hazardous wastes using cement kilns. J Waste Manage Resour Rec
1996;3(3):111–5.Holcim Ltd. Alternative fuels and raw materials, http://www.holcim.com/CORP/EN/oid/46240/module/gnm50/
jsp/templates/editorial/editorial.html; 2005 [accessed June 2005].Institute of Scrap Recycling Industries. End-of-life vehicles: a proven path to recycling, www.isri.org/
industryinfo/Elv.pdf; 2004 [accessed March 2004].Jody B, et al. Recovering recyclable materials from shredder residue. J Met 1994;46(2):40–3.Kita M, Oohashi A, Okamura Y. Development of a pre-disposal separating system for automobile shredder residue.
Rev Autom Eng 2005;26(2):147–50.Keller C. Optimized disposal of automotive shredder residue. In: Ludwig C, Hellweg S, Stucki S, editors. Munic-
ipal solid waste management—strategies and technologies for sustainable solutions. Heidelberg, Germany:Springer-Verlag; 2003. p. 294–307.
Kusaka K, Iida S. Sorting, compaction and solidification technologies for automobile shredder residue. JSAE Rev2000;21(2000):549–54.
Lanoir D. Physical and chemical characterization of automotive shredder residues. Waste Manage Res1997;15:267–76.
Mark F. Environmentally sound energy recovery from automotive shredder residue, SAE Technical Study Series,1999-01-0990. Detroit, MI: Society of Automotive Engineers; 1999.
Mayes, G. Personal contact May 2005, TXI, http://www.txi.com; 2005.MBA Polymers. http://www.mbapolymers.com/whatwedo.htm; 2005 [accessed December 2005].Meinen, M. Lehigh Cement, http://www.Lehighcement.com/, personal contact; 2005.Morioka T, et al. Eco-efficiency of advanced loop-closing systems for vehicles and household appliances in hyogo
eco-town. J Indus Ecol 2005;9(4):205–21.Neu, J. Sims-Hugo Neu, Personal contacts, http://www.hugoneu.com/; 2005.Nissan. Eight carmakers form new alliance for shredder residue recycling, http://www.nissan-global.com/EN/
NEWS/2004/ STORY/040109-01.html; 2004 [accessed March 2004].Nourreddine M. Recycling of auto shredder residue. J Hazard Mater 2007;139:481–90.Portland Cement Association. Manufacturing fact sheet, http://www.cement.org/concretethinking/manu facts.asp;
2004 [accessed January 2005].Portland Cement Association, Behaviour and Measurement of Mercury in Cement Kilns, http://www.cement.
org/manufacture/mtc milldb detail.asp?id=941; 2005 [accessed December 2005].Pera J, Ambroise J, Chabannet M. Valorization of automotive shredder residue in building materials. Cement
Concrete Res 2004;34(4):557–62.Perry R, Green D. Perry’s chemical engineers handbook. 7th ed. McGraw Hill; 1997.Plastics. Plastics in end-of-life vehicles, http://www.plastics-in-elv.org; 2005 [accessed January 2005].Prisciandaro M, Mazziotti G, Veglio F. Effect of burning supplementary waste fuels on the pollutant emissions by
cement plants. Resour Conserv Recycling 2003;39(2):161–84.Protec. Heavy media separation plants, http://www.protec-srl.com/PDF/2029%20e.pdf and http://www.protec-
srl.com/ING/FRAMES/homeING.html; 2005 [accessed December 2005].Recycling Today. Recycling opportunities in auto shredder residue and newer and better, http://www.
recyclingtoday.com; 2005 [accessed October 2005].
B. Boughton / Resources, Conservation and Recycling 51 (2007) 621–642 641
Redin L, et al. Co-combustion of shredder residues and municipal solid waste in a Swedish municipal solid wasteincinerator. Waste Manage Res 2001;19:518–25.
Reuter MA, et al. Fundamental limits for the recycling of end -of-life vehicles. J Minerals Eng 2005;19(5):433,http://dx.doi.org/10.1016/j.mineng.2005.08.014.
Rossetti V, Palma L, Medici F. Production of aggregate from non-metallic automotive shredder residues. J HazardMater 2006;137(2):1089.
RRF. Shredder residue: environmental information and characterization under RCRA. Washington, DC: RecyclingResearch Foundation; 1992.
SALYP. http://www.salypnet.com and http://www.salypnet.com/environmentalimpact.htm; 2004 [accessed Octo-ber 2004].
Saxena S, Rao N, Rehmat A, Mensinger M. Combustion and co-combustion of auto fluff. Energy1995;20(9):877–87.
Scheirs J. Polymer recycling: science, technology and applications. Chichester, UK: John Wiley & Sons; 1998.Schut, J. Commingled plastic waste: new gold mine for automotive processors. Plast Technol 2001,
http://www.plasticstechnology.com/articles/article print1.cfm [accessed February 2006].Schut, J. Close-up on recycling: how to turn auto shredder waste into 60 million lb of plastic pellets,
http://www.plasticstechnology.com/articles/200410cu3.html; 2004 [accessed December 2005].Seyler C, et al. Life cycle inventory for use of waste solvent as fuel substitute in the cement industry. Int J LCA
2005;10(2):120–30.Shen H, et al. Selective flotation of plastics by chemical conditioning with methyl cellulose. Resour Conserv
Recycling 2002;35(4):229–41.Shumway. Personal communications. Douglas Shumway, Mitsubishi Cement; 2005.Singh M, et al. Proving the principle-recovery of plastics form shredder ELV’s. In: Institute of mechanical engineers
6th international conference on engineering for profit from waste; 2001. p. 181–9.Staudinger, J, Keoleian, GA. Management of end-of-life vehicles (ELVs) in the US, Center for Sustainable Systems,
University of Michigan, Report # CSS01-01; 2001.Taiheiyo Cement. Environmental report 2004, http://www.taiheiyo-cement.co.jp/english/envrpt2004/pdf/
allenv2004.pdf; 2004 [accessed December 2005].Ted Osucha, TOS Engineering, Personal communications, [email protected]; 2006.Tokiwa, Y. Toxics Program Officer, EPA Region IX Toxics Office, personal communication; 2005.Toyota. Toyota and Volkswagen cooperate in recycling and other areas, http://www.toyota.com/about/
environment/partnerships/volkswagon cooperate.html; 2005 [accessed January 2005].Trouve G, et al. Comparative thermodynamic and experimental study of some heavy metal behavior during
automotive shredder residues incineration. Waste Manage 1998;8(5):301–7.TXI. Company Profile, http://www.txi.com/company overview/environment.html and Waste Management Meth-
ods, http://www.facilityreview.com/Site%20Profiles%20m-z/TXI.htm; 2005 [accessed December 2005].United States Council for Automotive Research. USCAR celebrates a decade of automotive progress,
http://www.uscar.org/Media/2002issue1/p1 celebrates.htm; 2002 [accessed January 2005].US Department of Energy. Power generation from automobile shredder waste fuel, report DE-Pro7-871012704;
1987.US Environmental Protection Agency. PCB, lead, cadmium levels in shredder waste materials, report EPA 560/5-
90-008A; 1991.US Environmental Protection Agency. Air pollution emission factors—Portland cement manufacturing
http://www.epa.gov/ttn/chief/ap42/ch11/final/c11s06.pdf; 1995 [accessed January 2004].US Environmental Protection Agency. Beyond RCRA-waste and material management in the year 2020, EPA530-
R-02-009; 2003.US Environmental Protection Agency. Municipal solid waste, automotive parts, http://www.epa.gov/garbage/
auto.htm; 2004a [accessed March 2004].US Environmental Protection Agency. OSWER Innovations Pilot, http://www.epa.gov/oswer/docs/iwg/
fs auto shredder residue final.pdf; 2004b [accessed January 2004].US Environmental Protection Agency. Hazardous waste combustors—maximum achievable control technology
standards, http://www.epa.gov/epaoswer/hazwaste/combust/; 2004c [accessed January 2004].van Oss H. Cement manufacture and the environment. Part I. Chemistry and technology. J Indus Ecol
2002;6(1).
642 B. Boughton / Resources, Conservation and Recycling 51 (2007) 621–642
van Oss H. Cement manufacture and the environment, Part II: environmental challenges and opportunities. J IndusEcol 2003;7(1).
Wastec. NSWMA’s 2005 Tip Fee Survey, http://wastec.isproductions.net/webmodules/webarticles/articlefiles/478-Tipping%20Fee%20Bulletin%202005.pdf; 2005 [accessed February 2006].
World Business Council for Sustainable Development. Cement sustainability initiative, http://www.wbcsdcement.org, and fuels and raw materials report http://www.wbcsdcement.org/pdf/tf2/tf2 guidelines.pdf; 2005 [accessedJanuary 2006].
Waste and Energy Research Group. Towards processing polymers from ASR, http://www.bton.ac.uk/environment/research/sustainability/werg/reports.htm; 2002 [accessed December 2005].
Winslow G, et al. Study of plastic material recovery form automotive shredder residue, SAE 980093; 1998.Winslow G, et al. Recovery of selected engineering plastics from automotive shredder residue using skin flotation
technology, SAE 1999-01-0663; 1999.Winslow G, et al. Advanced separation of plastics from shredder residue, SAE 2004-01-0469; 2004.Zevenhoven, R, Saeed, L. Automotive shredder residue (ASR) and compact disk (CD) waste: options for recovery of
materials and energy, Report TKK-ENY-14, Helsinki University of Technology. Energy Engineering and Envi-ronmental Protection: Finland, http://eny.hut.fi/library/publications/tkk-eny/tkk-eny-14.pdf; 2003 [accessedJanuary 2005].