evaluation of shear strength of concrete flat plates...
TRANSCRIPT
Research ArticleEvaluation of Shear Strength of Concrete FlatPlates Reinforced with GFRP Plates
Min Sook Kim and Young Hak Lee
Department of Architectural Engineering Kyung Hee University 1732 Deogyeong-daero Yongin Republic of Korea
Correspondence should be addressed to Young Hak Lee leeyhkhuackr
Received 19 January 2017 Accepted 20 March 2017 Published 18 May 2017
Academic Editor Sumin Kim
Copyright copy 2017 Min Sook Kim and Young Hak Lee This is an open access article distributed under the Creative CommonsAttribution License which permits unrestricted use distribution and reproduction in any medium provided the original work isproperly cited
The shear performance of concrete flat plates with glass fiber-reinforced polymer (GFRP) plate shear reinforcement was investigatedthrough punching shear tests Each GFRP plate was embedded in the concrete and included openings to permit the flow of concreteduring fabrication Punching shear tests were conducted on a total of 8 specimens and the resulting crack and fracture formationsstrains and load-displacement curves were analyzed and comparedThe experimental variables considered were the types of shearreinforcement including steel stirrups or GFRP plates and the shear reinforcement spacing The experimental results show thatthe GFRP shear reinforcement effectively increased the shear strengths of flat plates Furthermore the applicability of two formulaswas investigated a modified version of a shear strength formula from ACI 318-14 and the ACI 318-14 fracture prediction formula
1 Introduction
The flat plate structure is composed of only slabs andcolumns with no beams Thus brittle punching shear failurecan occur owing to stress concentration near the column-slabjoint To prevent brittle failure arising from punching shearthe method of using fiber-reinforced polymer (FRP) materialrather than a steel stirrup or stud rail as the reinforcementhas been studied and applied Esfahani et al [1] attacheda CFRP sheet to the slab exterior and conducted punchingshear tests to evaluate the resulting shear performance Fariaet al [2] applied FRP laminates to the flat slabs and proposedCritical Shear CrackTheory to estimate the shear strength offlat slabs reinforced with FRP laminates Erdogan et al [3]proposed CFRP dowel system CFRP dowels are installed inthe predrilled hole of the slabs to act as shear reinforcementSissakis and Sheikh [4] manufactured an annular CFRP andreinforced it by punching a hole in a slab to experimentallyassess its performance and to evaluate the applicability ofthe CSA and ACI equations There has been steady researchbased onmethods of strengthening the slabwith FRP sheet orFRP straps whereas research into the use of substitute shear
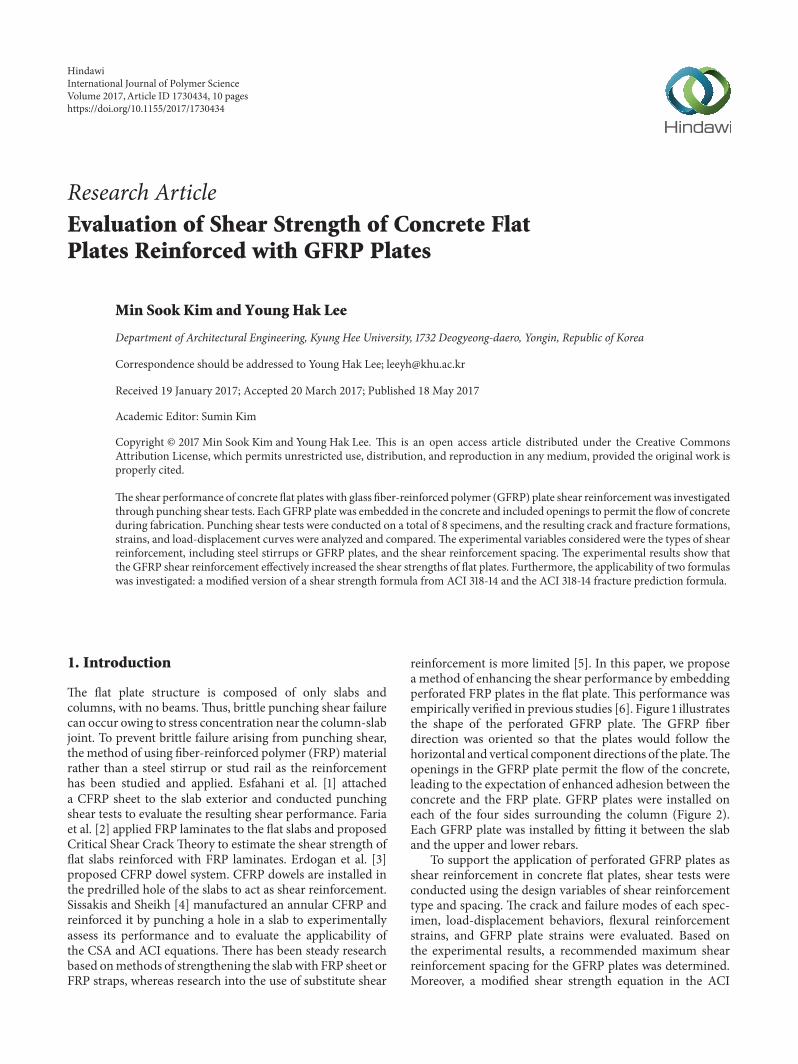
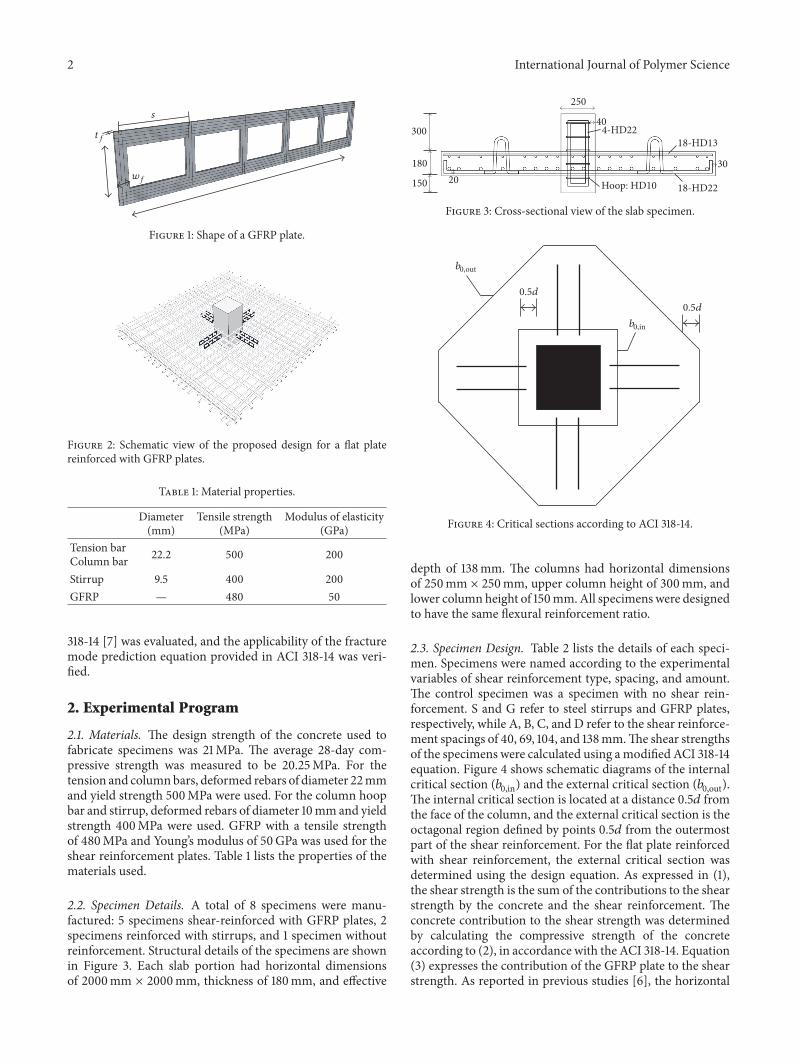
reinforcement is more limited [5] In this paper we proposea method of enhancing the shear performance by embeddingperforated FRP plates in the flat plate This performance wasempirically verified in previous studies [6] Figure 1 illustratesthe shape of the perforated GFRP plate The GFRP fiberdirection was oriented so that the plates would follow thehorizontal and vertical component directions of the plateTheopenings in the GFRP plate permit the flow of the concreteleading to the expectation of enhanced adhesion between theconcrete and the FRP plate GFRP plates were installed oneach of the four sides surrounding the column (Figure 2)Each GFRP plate was installed by fitting it between the slaband the upper and lower rebars
To support the application of perforated GFRP plates asshear reinforcement in concrete flat plates shear tests wereconducted using the design variables of shear reinforcementtype and spacing The crack and failure modes of each spec-imen load-displacement behaviors flexural reinforcementstrains and GFRP plate strains were evaluated Based onthe experimental results a recommended maximum shearreinforcement spacing for the GFRP plates was determinedMoreover a modified shear strength equation in the ACI
HindawiInternational Journal of Polymer ScienceVolume 2017 Article ID 1730434 10 pageshttpsdoiorg10115520171730434
2 International Journal of Polymer Science
s
tf
wf
Figure 1 Shape of a GFRP plate
Figure 2 Schematic view of the proposed design for a flat platereinforced with GFRP plates
Table 1 Material properties
Diameter(mm)
Tensile strength(MPa)
Modulus of elasticity(GPa)
Tension barColumn bar 222 500 200
Stirrup 95 400 200GFRP mdash 480 50
318-14 [7] was evaluated and the applicability of the fracturemode prediction equation provided in ACI 318-14 was veri-fied
2 Experimental Program
21 Materials The design strength of the concrete used tofabricate specimens was 21MPa The average 28-day com-pressive strength was measured to be 2025MPa For thetension and columnbars deformed rebars of diameter 22mmand yield strength 500MPa were used For the column hoopbar and stirrup deformed rebars of diameter 10mm and yieldstrength 400MPa were used GFRP with a tensile strengthof 480MPa and Youngrsquos modulus of 50GPa was used for theshear reinforcement plates Table 1 lists the properties of thematerials used
22 Specimen Details A total of 8 specimens were manu-factured 5 specimens shear-reinforced with GFRP plates 2specimens reinforced with stirrups and 1 specimen withoutreinforcement Structural details of the specimens are shownin Figure 3 Each slab portion had horizontal dimensionsof 2000mm times 2000mm thickness of 180mm and effective
250
300
180
150 2030
40
Hoop HD10
4-HD2218-HD13
18-HD22
Figure 3 Cross-sectional view of the slab specimen
05d
05d
0out
in0
b
b
Figure 4 Critical sections according to ACI 318-14
depth of 138mm The columns had horizontal dimensionsof 250mm times 250mm upper column height of 300mm andlower column height of 150mmAll specimenswere designedto have the same flexural reinforcement ratio
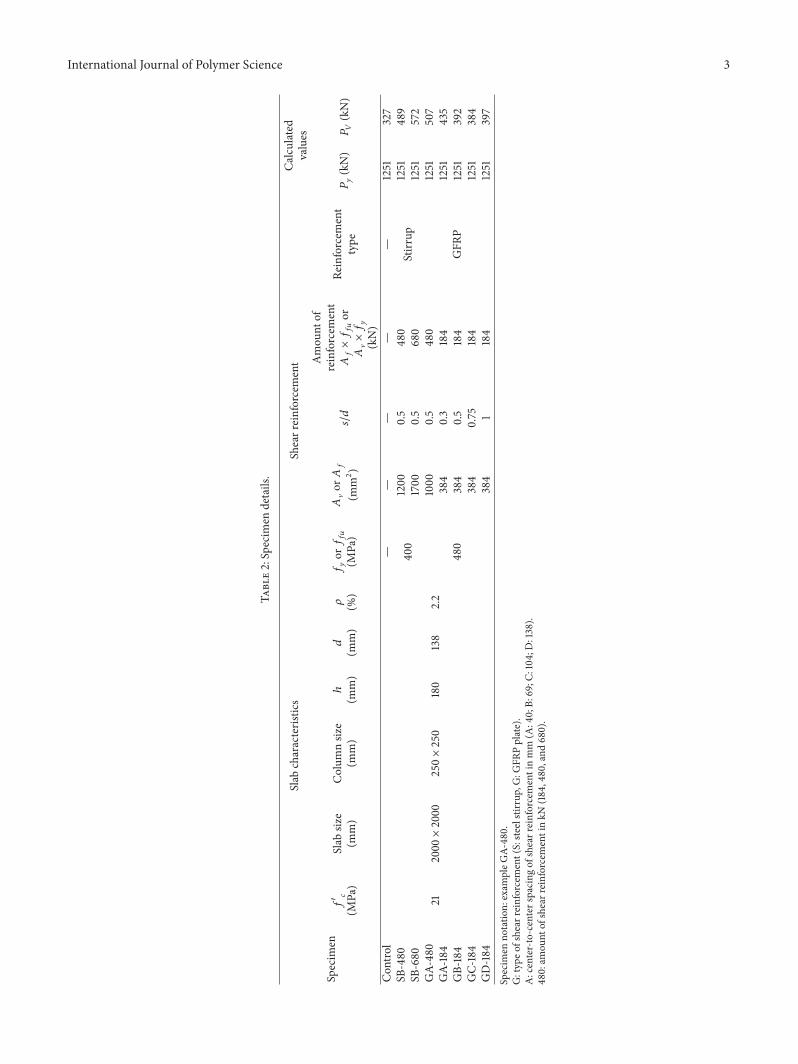
23 Specimen Design Table 2 lists the details of each speci-men Specimens were named according to the experimentalvariables of shear reinforcement type spacing and amountThe control specimen was a specimen with no shear rein-forcement S and G refer to steel stirrups and GFRP platesrespectively while A B C and D refer to the shear reinforce-ment spacings of 40 69 104 and 138mmThe shear strengthsof the specimens were calculated using amodified ACI 318-14equation Figure 4 shows schematic diagrams of the internalcritical section (1198870in) and the external critical section (1198870out)The internal critical section is located at a distance 05119889 fromthe face of the column and the external critical section is theoctagonal region defined by points 05119889 from the outermostpart of the shear reinforcement For the flat plate reinforcedwith shear reinforcement the external critical section wasdetermined using the design equation As expressed in (1)the shear strength is the sum of the contributions to the shearstrength by the concrete and the shear reinforcement Theconcrete contribution to the shear strength was determinedby calculating the compressive strength of the concreteaccording to (2) in accordance with the ACI 318-14 Equation(3) expresses the contribution of the GFRP plate to the shearstrength As reported in previous studies [6] the horizontal
International Journal of Polymer Science 3
Table2Specim
endetails
Specim
en
Slab
characteris
tics
Shearreinforcement
Calculated
values
1198911015840 119888 (MPa)
Slab
size
(mm)
Colum
nsiz
e(m
m)
ℎ(m
m)119889
(mm)120588 ()119891 119910o
r119891 119891119906
(MPa)119860 V
or119860 119891
(mm2)
119904119889Amou
ntof
reinforcem
ent
119860 119891times119891119891119906or
119860 Vtimes119891119910
(kN)
Reinforcem
ent
type
119875 119910(kN
)119875 119881
(kN)
Con
trol
212000times2000250times250
180
138
22
mdashmdash
mdashmdash
mdash1251
327
SB-480
400
1200
05
480
Stirr
up1251
489
SB-680
1700
05
680
1251
572
GA-
480
480
1000
05
480
GFR
P
1251
507
GA-
184
384
03
184
1251
435
GB-184
384
05
184
1251
392
GC-
184
384
075
184
1251
384
GD-184
384
1184
1251
397
Specim
enno
tatio
nexam
pleG
A-480
Gtypeo
fshear
reinforcem
ent(Sste
elstirrup
GG
FRPplate)
Acenter-to-centerspacing
ofshearreinforcementinmm
(A40B
69C
104
D138)
480am
ount
ofshearreinforcementinkN
(184480and
680)
4 International Journal of Polymer Science
component of the GFRP plate does not significantly impactthe shear force bearing performance Thus only the cross-sectional area of the vertical component was considered inthis calculation Unlike the vertical components of the steelstirrups those of the GFRP plate were of strip form to takethis shape into account the shear reinforcement area of theplate was calculated using (4) The contribution of the GFRPplate to the shear strength was calculated as the numberof GFRP plate vertical components according to (5) and bysubstituting this into (3) Hence
119881119899 = 119881119888 + 119881119891 (1)
119881119888 = 16radic11989110158401198881198870out119889 (2)
119881119891 = 119899119860119891119891119891119906 (3)
119860119891 = 8119905119891119908119891 (4)
119899 = 119889119904 (5)
To assess shear performance experiments were designedto induce a punching shear failure before bending failureHere the bending performance of the specimen was deter-mined using the yield line theory of Johansen [8] Johansenproposed that the magnitude of the maximum bendingstrength 119875119910 arising from the plastic flexural moment strengthof a 4-side simply supported slab can be calculated using (6)Hence
119875119910 = 8119898119903 ( 11 minus 119888119897) (6)
119898119903 = 1205881198911199101198892 (1 minus 0591205881198911199101198911015840119888 ) (7)
To calculate the shear strength the shear reinforcementamount (119860119891 times 119891119891119906 or 119860V times 119891119910) is represented by the productof the tensile strength and the shear reinforcement cross-sectional area existing within the critical sectionThe SB-480and GA-480 specimens had the same shear reinforcementamount whereas the SB-680 specimen had a greater shearreinforcement amount than either of these The shear rein-forcement amounts of the GA-184 GB-184 GC-184 andGD-184 specimens reinforced with GFRP plates were designed tobe the same 184 kNThe effect of shear reinforcement spacingon the shear strength was analyzed by varying the shearreinforcement spacing The shear reinforcement installationlocations within each specimen are shown in Figure 5
24 Test Setup To conduct testing of the specimen on areaction frame the 4 sides were simply supported usinghinges specially fabricated for the experiment Load wasapplied to each specimen using an actuator with maximumcapacity of 1000 kN In real structures loading is applied tothe slab causing deflection and punching shears However inthis experiment the testing method was adopted of installingthe flexural reinforcement on the lower part and applyingthe load to the upper column On the lower side of the
specimen 5 displacement sensors (LVDTs) were installedto measure the vertical displacement To determine thebehavior of the flexural reinforcement strain gauges wereattached at constant intervals in the vertical and horizontaldirections each from the column Figure 6 shows the straingauge installation points on the GFRP plate of the GC-184specimen The experimental setup is shown in Figure 7
3 Test Results
31 Cracking and FailureMode Figure 8 shows crack patternsof the specimensrsquo lower parts whereas Figure 9 shows across section of 100mm from the specimen column faceprepared using a concrete cutter In the control specimen(ie the nonreinforced specimen) cracking began at thejoint section between the column face and the slab showinga typical punching shear failure in which the cracking ledto a cone breakout up to the critical section However inthe GFRP-reinforced specimens after initial flexural crackformation cracking continued to propagate diagonally fromthe column cornerThen the shear crack gradually expandedin a radial form increasing the crack width of the criticalsection After themaximum loadwas reached shear crackingwas created in the direction toward the supporting pointThefinal crack formed in the lower part of the shear reinforcedspecimen was found to represent a wider failure area thanthat of the control specimenThese results show that the shearreinforcement provided a reinforcement effect increasing theflat plate critical section (1198870) so thatmore concrete resisted thepunching shear In the cross-sectional photographs shown inFigure 9 the failure surfaces of the upper and lower partsof each slab specimen are connected with dashed lines Inthe control specimen fracture began at the column face andformed a cone with a steep slope Among all specimensstudied the GA-480 specimen showed a punching shearfailure mode having the shallowest slope of cone failureThis reveals that the GA-480 specimen showed a greaterreinforcement effect compared to that of the specimen withsteel stirrup reinforcement
32 Strain Distribution Strain was measured for each speci-men on the flexural reinforcement at points 150 250 350 550700 and 900mm from the column face in the vertical andhorizontal directions The flexural reinforcement strains foreach specimen at maximum loading are shown in Figure 10the upper left corner of this figure includes a schematicillustration of the strain gauge installation locations Toallow comparison of the flexural reinforcement strains in thevertical and horizontal directions strains measured from thehorizontal flexural reinforcement are shown on the left sideof the figure while strainsmeasured from the vertical flexuralreinforcement are shown on the right As can be seen in thefigure under maximum loading all flexural reinforcementstrains were below the yield strain value Thus it can beconcluded that all specimens experienced punching shearfailure before flexural beam yielding and flexural failureAdditionally the control specimen showed the lowest strainamong all specimens owing to the brittle punching shear
International Journal of Polymer Science 5
55 69
124
(a) SB-480
55 69
193
(b) SB-680
55 286
341
28669
15
10 70
(c) GA-480
55
147
4192
10
15
70
92
30
(d) GA-184
55
217
148
30
15
701069148
(e) GB-184
55
273
21810 70
15
104218
(f) GC-184
55
341
286286138
15
10 70
(g) GD-184
Figure 5 Arrangement of shear reinforcement in the specimen (dimensions in mm)
L4
L5
L3L2L1
Figure 6 Strain gauge locations on the GFRP plate in the GC-184specimen
failure and all specimens showed their greatest strains nearthe column
Figure 11 shows load-strain curves of the GFRP platein specimen GC-184 The L1 gauge strain of specimen GC-184 recorded a small strain of 250 120583120576 before the initialcrack formation at approximately 260 kN However thestrain significantly increased during the beginning of shearcrack eventually leading to specimen failure at strains above9000120583120576 Large strains were measured for the vertical com-ponents L1 L2 and L3 showing that these effectively borethe punching shear and contributed to the observed shearperformance However the horizontal component gauges L4and L5 showed no significant changes in strain even whenthe cracks propagated under the increasing applied loads
Reaction frame
Actuator
Steel rollers
LVDT
kN)(1000
Figure 7 Experimental setup
Therefore it was concluded that the horizontal componentsof the GFRP did not substantially contribute to the punchingshear performance of the flat plate
6 International Journal of Polymer Science
(a) Control (b) SB-480 (c) SB-680 (d) GA-480
(e) GA-184 (f) GB-184 (g) GC-184 (h) GD-184
Figure 8 Crack patterns on the slab tension side of each specimen
33 Type of Shear Reinforcement The effect of the type ofshear reinforcement was analyzed based upon the specimenload-displacement results The maximum defection of thespecimen was the displacement measured at the center ofthe columnrsquos lower part in the direction of gravity Figure 12shows load-displacement curves for specimens with variousshear reinforcement types The maximum loads for thecontrol specimen SB-480 SB-680 and GA-480 were 406637 780 and 879 kN respectively the SB-480 SB-680 andGA-480 specimens showed shear performances 57 92and 116 greater than that of the control specimen Alsoalthough the SB-480 specimenwas designed to have the sameamount of shear reinforcement as the GA-480 specimenGA-480 showed a 38 greater maximum load than thatof SB-480 The SB-680 specimen was designed to have ashear reinforcement amount 40 greater than that of theGA-480 specimen but GA-480 showed a maximum load13 greater than that of SB-680 All steel stirrup-reinforcedspecimens showed maximum loads lower than that of theGA-480 specimen The reason for this is that steel stirrupscannot effectively contribute to shear resistance owing to thedifficulty in ensuring sufficient concrete cover thickness andeffective depth However in the case of the GFRP platesbecause each plate is installed between the upper and lowerbeams of the slab this problem can be resolved Thus theGFRP plate shear reinforcement was determined to be moreeffective than the steel stirrups in resisting punching shear
34 Spacing of GFRP Vertical Strips TheACI 318-14 standardspecifies the spacing limits of stirrup shear reinforcement ofhalf the effective depth (05119889) Whether the GFRP plate stud-ied herein satisfies the ACI 318-14 standard as a steel stirrupreplacement material was investigated through comparison
testing To carry this out the shear reinforcement amountsof the GA-184 GB-184 GC-184 and GD-184 specimenswere designed to be the same at 184 kN and their verticalcomponent shear reinforcement spacings were designed tobe 03119889 05119889 075119889 and 119889 respectively Comparison ofthe maximum shear strengths among the specimens withdifferent shear reinforcement spacings showed that becausethe amounts of shear reinforcement resisting the actualpunching shear were the same the shear strengths weresimilar at around 620 kN for all specimens except GD-184 (Figure 13) The shear strength of GD-184 was foundto be 383 kN 94 of the 406 kN shear strength of thecontrol specimen Because the GD-184 specimen had verticalcomponent shear reinforcement spacing equal to the effectivedepth (119889) value of 138mm it was determined that the shearreinforcement material in this specimen did not fully playits role Contrastingly the other specimens including GFRPplates as the shear reinforcementmaterial exhibited sufficientresistance to the punching shear of the slab Hence applyingthe steel stirrup shear reinforcement spacing limit of the ACI318-14 to GFRP plate material is not appropriate insteadfor GFRP plates we recommend increasing the verticalcomponent reinforcement spacing limit to 0751198894 Comparison between ExperimentalResults and ACI 318-14
41 Shear Strength Equation for GFRP Reinforcement Weanalyzed the applicability of the modified shear strengthequation for the steel stirrup-reinforced flat plate presentedin the ACI 318-14 standard for calculating the shear strengthin the alternate case of a flat plate reinforced with embeddedperforated GFRP plates Table 3 and Figure 14 compare the
International Journal of Polymer Science 7
(a) Control
(b) SB-480
(c) SB-680
(d) GA-480
(e) GA-184
(f) GB-184
(g) GC-184
(h) GD-184
Figure 9 Cracking patterns in the saw-cut slab cross sections of each specimen
8 International Journal of Polymer Science
Table 3 Test results
Specimen Displacement (mm) 119881cal (kN) 119881exp (kN) 119881exp119881calControl 8 327 406 124SB-480 1223 489 637 130SB-680 1548 572 780 136
Average 13Standard deviation 004
GA-480 1666 507 879 173GA-184 11 435 657 151GB-184 1189 392 621 158GC-184 1035 384 612 159GD-184 68 397 383 096
Average 147Standard deviation 026
0
200
400
600
800
1000
1200
1400
ControlSB-480SB-680GA-480
GA-184GB-184GC-184GD-184
Stra
in (120583
120576)
6004002000 800 1000minus400minus600minus800 minus200minus1000Distance from the center of the column (mm)
Figure 10 Strains in bottom reinforcing bars at peak load
shear strength calculated using themodifiedACI 318-14 shearstrength equation and that measured experimentally Theratios of calculated to measured shear strengths were foundto be on average 13 with a standard deviation of 004 forthe steel stirrup-reinforced specimens and the nonreinforcedspecimen representing reasonable accuracy of the ACI 318-14 equation for predicting the experimental shear strengthHowever for the GFRP-reinforced specimens the ratios ofcalculated to measured shear strengths were found to be onaverage 147 with a standard deviation of 026 Thus themodified ACI 318-14 equation more highly underestimatedthe shear performance of the GFRP plate than that of thenonreinforced or steel stirrup-reinforced specimen
The failure modes of a shear reinforced flat plate can belargely categorized into failures beginning from the insideof the shear reinforcement and those beginning from theoutside Analysis was conducted to verify whether the failuremode prediction equation which is amodification of the steelstirrup equation for the GFRP plate was suitable Equations(8) and (9) are used to calculate shear strength for failurestarting inside the GFRP plate Here the contribution of
0
100
200
300
400
500
600
700
minus2000 0 2000 4000 6000 8000 10000
Load
(kN
)
Strain (120583120576)
L4
L5
L3L2L1
L4L5
L3L2L1
Figure 11 Load versus GFRP strain for the GC-184 specimen
the critical section of concrete is set using the internalcritical section (1198870in) that is the portions up to 05119889 verticaland horizontal distances from the column (recall Figure 4)Hence
119881119899in = 119881119888in + 119881119891 (8)
119881119888in = 16radic11989110158401198881198870in119889 (9)
The shear strength equation for failure beginning outsidethe GFRP plate is shown in (10) The external criticalsection (1198870out) 05119889 from the shear reinforcement domainwasconsidered to be the critical section and the shear strengthcontribution of the shear reinforcement was not includedTherefore
119881119899out = 16radic11989110158401198881198870out119889 (10)
The flat plate failure mode can be predicted by comparingthe values of 119881119899in in (8) and 119881119899out in (10) Table 4 lists
International Journal of Polymer Science 9
Table 4 Failure modes
Specimen 119881119899in (kN) 119881119899out (kN) Failure mode Crack patternsPredicted Actual
GA-480 286 386 Within Within
GA-184 370 228 Outside Outside
GB-184 286 270 Outside Outside
GC-184 245 303 Within Within
GD-184 225 336 Within Within
ControlSB-480
SB-680GA-480
0100200300400500600700800900
1000
Load
(kN
)
10 20 30 40 50 60 70 800Displacement (mm)
Figure 12 Load-displacement curves
the predicted and actual failure modes the predicted failuremodes were correct for all specimens Therefore it wasconcluded that the failure mode prediction equation wasaccurate for a flat plate reinforced with GFRP plates
5 Conclusions
In this paper the shear performance of a flat plate includingGFRP plates was evaluated as a shear reinforcement materialPunching shear tests were conducted in which the fractureand failure modes strains and load-displacement curvesof 8 flat plate specimens were compared The conclusionsobtained from this study are as follows
(1) Among the failed specimens those including GFRPplates experienced cone failures with more gradualslopes and greater critical sectional areas comparedto those of the steel stirrup-reinforced and nonrein-forced specimens Therefore the GFRP plates wereeffective as reinforcement against the punching shear
(2) Comparison of load-displacement curves of the spec-imens including GFRP plate reinforcement showed
Center-to-center spacing of GFRP vertical strips
GA-184 GC-184GB-1840
100
200
300
400
500
600
700
Load
(kN
)
GD-184(05d) (d)(075d)(03d)
Figure 13 Shear strength depending on the spacing of GFRPvertical strips
that with increasing applied loads the strains ofthe vertical components increased greatly causingfailure of the GFRP plate at strains greater than9000120583120576 whereas the horizontal components did notexperience significant changes in strain over therange of loads applied Thus the GFRP plate verticalcomponent contributes substantially to the punchingshear performance of the slab Considering only thevertical component of the GFRP plate as the shearreinforcement when calculating the shear strength ofthe shear reinforcement sectional area was found tobe effective
(3) The specimen including GFRP plates with the verti-cal component reinforcement spacing of 1119889 did notfully exhibit its shear performance but specimens ofreinforcement spacing 075119889 showed sufficient shearperformance Therefore it is recommended that themaximum limit of shear reinforcement spacing beincreased to 075119889 for GFRP plates
(4) A GFRP plate shear strength equation modified fromthe ACI 318-14-11 standard equation was validated bycomparing its results to experimental shear strengthresults For GFRP-reinforced specimens the ratios of
10 International Journal of Polymer Science
SB-4
80
GA-
184
GC-
184
GA-
480
GD
-184
Con
trol
SB-6
80
minus05
0
05
1
15
2
25
Specimens
Vex
pV
cal
VexpVcal
GB-
184
Figure 14 Comparison of experimental and calculated shearstrengths
experimental to calculated shear strengths (119881exp119881cal)were found to be on average 147 with a standarddeviation of 026 Thus the equation was determinedto be applicable as a shear strength equation in thecase of a flat plate reinforced with GFRP platesFurthermore the failure mode prediction equationprovided in ACI 318-14-11 was found to accuratelypredict the failure modes of all GFRP-reinforcedspecimens
Conflicts of Interest
The authors declare that they have no conflicts of interest
Acknowledgments
This work was supported by the National Research Founda-tion of Korea (NRF) grant funded by the KoreanGovernment(MSIP) (NRF-2017R1A2B2005581)
References
[1] M R Esfahani M R Kianoush and A R Moradi ldquoPunchingshear strength of interior slab-column connections strength-ened with carbon fiber reinforced polymer sheetsrdquo EngineeringStructures vol 31 no 7 pp 1535ndash1542 2009
[2] D M V Faria J Einpaul A M P Ramos M F Ruiz and AMuttoni ldquoOn the efficiency of flat slabs strengthening againstpunching using externally bonded fibre reinforced polymersrdquoConstruction and Building Materials vol 73 pp 366ndash377 2014
[3] H Erdogan B Binici and G Ozcebe ldquoEffect of columnrectangularity on CFRP-strengthened RC flat platesrdquoMagazineof Concrete Research vol 63 no 7 pp 511ndash525 2011
[4] K Sissakis and S A Sheikh ldquoStrengthening concrete slabs forpunching shear with carbon fiber-reinforced polymer lami-natesrdquo ACI Structural Journal vol 104 no 1 pp 49ndash59 2007
[5] M Hassan E A Ahmed and B Benmokrane ldquoPunchingshear behavior of two-way slabs reinforced with FRP shear
reinforcementrdquo Journal of Composites for Construction vol 19no 1 Article ID 04014030 2015
[6] D-J Kim M S Kim J Choi H Kim A Scanlon and YH Lee ldquoConcrete beams with fiber-reinforced polymer shearreinforcementrdquo ACI Structural Journal vol 111 no 4 pp 903ndash912 2014
[7] ACI Committee 318 Building Code Requirements for ReinforcedConcrete and Commentary (ACI318-14) American ConcreteInstitute Farmington Hills Mich USA 2014
[8] K W Johansen Yield-Line Formulae for Slabs Cement andConcrete Association London UK 1998
Submit your manuscripts athttpswwwhindawicom
ScientificaHindawi Publishing Corporationhttpwwwhindawicom Volume 2014
CorrosionInternational Journal of
Hindawi Publishing Corporationhttpwwwhindawicom Volume 2014
Polymer ScienceInternational Journal of
Hindawi Publishing Corporationhttpwwwhindawicom Volume 2014
Hindawi Publishing Corporationhttpwwwhindawicom Volume 2014
CeramicsJournal of
Hindawi Publishing Corporationhttpwwwhindawicom Volume 2014
CompositesJournal of
NanoparticlesJournal of
Hindawi Publishing Corporationhttpwwwhindawicom Volume 2014
Hindawi Publishing Corporationhttpwwwhindawicom Volume 2014
International Journal of
Biomaterials
Hindawi Publishing Corporationhttpwwwhindawicom Volume 2014
NanoscienceJournal of
TextilesHindawi Publishing Corporation httpwwwhindawicom Volume 2014
Journal of
NanotechnologyHindawi Publishing Corporationhttpwwwhindawicom Volume 2014
Journal of
CrystallographyJournal of
Hindawi Publishing Corporationhttpwwwhindawicom Volume 2014
The Scientific World JournalHindawi Publishing Corporation httpwwwhindawicom Volume 2014
Hindawi Publishing Corporationhttpwwwhindawicom Volume 2014
CoatingsJournal of
Advances in
Materials Science and EngineeringHindawi Publishing Corporationhttpwwwhindawicom Volume 2014
Smart Materials Research
Hindawi Publishing Corporationhttpwwwhindawicom Volume 2014
Hindawi Publishing Corporationhttpwwwhindawicom Volume 2014
MetallurgyJournal of
Hindawi Publishing Corporationhttpwwwhindawicom Volume 2014
BioMed Research International
MaterialsJournal of
Hindawi Publishing Corporationhttpwwwhindawicom Volume 2014
2 International Journal of Polymer Science
s
tf
wf
Figure 1 Shape of a GFRP plate
Figure 2 Schematic view of the proposed design for a flat platereinforced with GFRP plates
Table 1 Material properties
Diameter(mm)
Tensile strength(MPa)
Modulus of elasticity(GPa)
Tension barColumn bar 222 500 200
Stirrup 95 400 200GFRP mdash 480 50
318-14 [7] was evaluated and the applicability of the fracturemode prediction equation provided in ACI 318-14 was veri-fied
2 Experimental Program
21 Materials The design strength of the concrete used tofabricate specimens was 21MPa The average 28-day com-pressive strength was measured to be 2025MPa For thetension and columnbars deformed rebars of diameter 22mmand yield strength 500MPa were used For the column hoopbar and stirrup deformed rebars of diameter 10mm and yieldstrength 400MPa were used GFRP with a tensile strengthof 480MPa and Youngrsquos modulus of 50GPa was used for theshear reinforcement plates Table 1 lists the properties of thematerials used
22 Specimen Details A total of 8 specimens were manu-factured 5 specimens shear-reinforced with GFRP plates 2specimens reinforced with stirrups and 1 specimen withoutreinforcement Structural details of the specimens are shownin Figure 3 Each slab portion had horizontal dimensionsof 2000mm times 2000mm thickness of 180mm and effective
250
300
180
150 2030
40
Hoop HD10
4-HD2218-HD13
18-HD22
Figure 3 Cross-sectional view of the slab specimen
05d
05d
0out
in0
b
b
Figure 4 Critical sections according to ACI 318-14
depth of 138mm The columns had horizontal dimensionsof 250mm times 250mm upper column height of 300mm andlower column height of 150mmAll specimenswere designedto have the same flexural reinforcement ratio
23 Specimen Design Table 2 lists the details of each speci-men Specimens were named according to the experimentalvariables of shear reinforcement type spacing and amountThe control specimen was a specimen with no shear rein-forcement S and G refer to steel stirrups and GFRP platesrespectively while A B C and D refer to the shear reinforce-ment spacings of 40 69 104 and 138mmThe shear strengthsof the specimens were calculated using amodified ACI 318-14equation Figure 4 shows schematic diagrams of the internalcritical section (1198870in) and the external critical section (1198870out)The internal critical section is located at a distance 05119889 fromthe face of the column and the external critical section is theoctagonal region defined by points 05119889 from the outermostpart of the shear reinforcement For the flat plate reinforcedwith shear reinforcement the external critical section wasdetermined using the design equation As expressed in (1)the shear strength is the sum of the contributions to the shearstrength by the concrete and the shear reinforcement Theconcrete contribution to the shear strength was determinedby calculating the compressive strength of the concreteaccording to (2) in accordance with the ACI 318-14 Equation(3) expresses the contribution of the GFRP plate to the shearstrength As reported in previous studies [6] the horizontal
International Journal of Polymer Science 3
Table2Specim
endetails
Specim
en
Slab
characteris
tics
Shearreinforcement
Calculated
values
1198911015840 119888 (MPa)
Slab
size
(mm)
Colum
nsiz
e(m
m)
ℎ(m
m)119889
(mm)120588 ()119891 119910o
r119891 119891119906
(MPa)119860 V
or119860 119891
(mm2)
119904119889Amou
ntof
reinforcem
ent
119860 119891times119891119891119906or
119860 Vtimes119891119910
(kN)
Reinforcem
ent
type
119875 119910(kN
)119875 119881
(kN)
Con
trol
212000times2000250times250
180
138
22
mdashmdash
mdashmdash
mdash1251
327
SB-480
400
1200
05
480
Stirr
up1251
489
SB-680
1700
05
680
1251
572
GA-
480
480
1000
05
480
GFR
P
1251
507
GA-
184
384
03
184
1251
435
GB-184
384
05
184
1251
392
GC-
184
384
075
184
1251
384
GD-184
384
1184
1251
397
Specim
enno
tatio
nexam
pleG
A-480
Gtypeo
fshear
reinforcem
ent(Sste
elstirrup
GG
FRPplate)
Acenter-to-centerspacing
ofshearreinforcementinmm
(A40B
69C
104
D138)
480am
ount
ofshearreinforcementinkN
(184480and
680)
4 International Journal of Polymer Science
component of the GFRP plate does not significantly impactthe shear force bearing performance Thus only the cross-sectional area of the vertical component was considered inthis calculation Unlike the vertical components of the steelstirrups those of the GFRP plate were of strip form to takethis shape into account the shear reinforcement area of theplate was calculated using (4) The contribution of the GFRPplate to the shear strength was calculated as the numberof GFRP plate vertical components according to (5) and bysubstituting this into (3) Hence
119881119899 = 119881119888 + 119881119891 (1)
119881119888 = 16radic11989110158401198881198870out119889 (2)
119881119891 = 119899119860119891119891119891119906 (3)
119860119891 = 8119905119891119908119891 (4)
119899 = 119889119904 (5)
To assess shear performance experiments were designedto induce a punching shear failure before bending failureHere the bending performance of the specimen was deter-mined using the yield line theory of Johansen [8] Johansenproposed that the magnitude of the maximum bendingstrength 119875119910 arising from the plastic flexural moment strengthof a 4-side simply supported slab can be calculated using (6)Hence
119875119910 = 8119898119903 ( 11 minus 119888119897) (6)
119898119903 = 1205881198911199101198892 (1 minus 0591205881198911199101198911015840119888 ) (7)
To calculate the shear strength the shear reinforcementamount (119860119891 times 119891119891119906 or 119860V times 119891119910) is represented by the productof the tensile strength and the shear reinforcement cross-sectional area existing within the critical sectionThe SB-480and GA-480 specimens had the same shear reinforcementamount whereas the SB-680 specimen had a greater shearreinforcement amount than either of these The shear rein-forcement amounts of the GA-184 GB-184 GC-184 andGD-184 specimens reinforced with GFRP plates were designed tobe the same 184 kNThe effect of shear reinforcement spacingon the shear strength was analyzed by varying the shearreinforcement spacing The shear reinforcement installationlocations within each specimen are shown in Figure 5
24 Test Setup To conduct testing of the specimen on areaction frame the 4 sides were simply supported usinghinges specially fabricated for the experiment Load wasapplied to each specimen using an actuator with maximumcapacity of 1000 kN In real structures loading is applied tothe slab causing deflection and punching shears However inthis experiment the testing method was adopted of installingthe flexural reinforcement on the lower part and applyingthe load to the upper column On the lower side of the
specimen 5 displacement sensors (LVDTs) were installedto measure the vertical displacement To determine thebehavior of the flexural reinforcement strain gauges wereattached at constant intervals in the vertical and horizontaldirections each from the column Figure 6 shows the straingauge installation points on the GFRP plate of the GC-184specimen The experimental setup is shown in Figure 7
3 Test Results
31 Cracking and FailureMode Figure 8 shows crack patternsof the specimensrsquo lower parts whereas Figure 9 shows across section of 100mm from the specimen column faceprepared using a concrete cutter In the control specimen(ie the nonreinforced specimen) cracking began at thejoint section between the column face and the slab showinga typical punching shear failure in which the cracking ledto a cone breakout up to the critical section However inthe GFRP-reinforced specimens after initial flexural crackformation cracking continued to propagate diagonally fromthe column cornerThen the shear crack gradually expandedin a radial form increasing the crack width of the criticalsection After themaximum loadwas reached shear crackingwas created in the direction toward the supporting pointThefinal crack formed in the lower part of the shear reinforcedspecimen was found to represent a wider failure area thanthat of the control specimenThese results show that the shearreinforcement provided a reinforcement effect increasing theflat plate critical section (1198870) so thatmore concrete resisted thepunching shear In the cross-sectional photographs shown inFigure 9 the failure surfaces of the upper and lower partsof each slab specimen are connected with dashed lines Inthe control specimen fracture began at the column face andformed a cone with a steep slope Among all specimensstudied the GA-480 specimen showed a punching shearfailure mode having the shallowest slope of cone failureThis reveals that the GA-480 specimen showed a greaterreinforcement effect compared to that of the specimen withsteel stirrup reinforcement
32 Strain Distribution Strain was measured for each speci-men on the flexural reinforcement at points 150 250 350 550700 and 900mm from the column face in the vertical andhorizontal directions The flexural reinforcement strains foreach specimen at maximum loading are shown in Figure 10the upper left corner of this figure includes a schematicillustration of the strain gauge installation locations Toallow comparison of the flexural reinforcement strains in thevertical and horizontal directions strains measured from thehorizontal flexural reinforcement are shown on the left sideof the figure while strainsmeasured from the vertical flexuralreinforcement are shown on the right As can be seen in thefigure under maximum loading all flexural reinforcementstrains were below the yield strain value Thus it can beconcluded that all specimens experienced punching shearfailure before flexural beam yielding and flexural failureAdditionally the control specimen showed the lowest strainamong all specimens owing to the brittle punching shear
International Journal of Polymer Science 5
55 69
124
(a) SB-480
55 69
193
(b) SB-680
55 286
341
28669
15
10 70
(c) GA-480
55
147
4192
10
15
70
92
30
(d) GA-184
55
217
148
30
15
701069148
(e) GB-184
55
273
21810 70
15
104218
(f) GC-184
55
341
286286138
15
10 70
(g) GD-184
Figure 5 Arrangement of shear reinforcement in the specimen (dimensions in mm)
L4
L5
L3L2L1
Figure 6 Strain gauge locations on the GFRP plate in the GC-184specimen
failure and all specimens showed their greatest strains nearthe column
Figure 11 shows load-strain curves of the GFRP platein specimen GC-184 The L1 gauge strain of specimen GC-184 recorded a small strain of 250 120583120576 before the initialcrack formation at approximately 260 kN However thestrain significantly increased during the beginning of shearcrack eventually leading to specimen failure at strains above9000120583120576 Large strains were measured for the vertical com-ponents L1 L2 and L3 showing that these effectively borethe punching shear and contributed to the observed shearperformance However the horizontal component gauges L4and L5 showed no significant changes in strain even whenthe cracks propagated under the increasing applied loads
Reaction frame
Actuator
Steel rollers
LVDT
kN)(1000
Figure 7 Experimental setup
Therefore it was concluded that the horizontal componentsof the GFRP did not substantially contribute to the punchingshear performance of the flat plate
6 International Journal of Polymer Science
(a) Control (b) SB-480 (c) SB-680 (d) GA-480
(e) GA-184 (f) GB-184 (g) GC-184 (h) GD-184
Figure 8 Crack patterns on the slab tension side of each specimen
33 Type of Shear Reinforcement The effect of the type ofshear reinforcement was analyzed based upon the specimenload-displacement results The maximum defection of thespecimen was the displacement measured at the center ofthe columnrsquos lower part in the direction of gravity Figure 12shows load-displacement curves for specimens with variousshear reinforcement types The maximum loads for thecontrol specimen SB-480 SB-680 and GA-480 were 406637 780 and 879 kN respectively the SB-480 SB-680 andGA-480 specimens showed shear performances 57 92and 116 greater than that of the control specimen Alsoalthough the SB-480 specimenwas designed to have the sameamount of shear reinforcement as the GA-480 specimenGA-480 showed a 38 greater maximum load than thatof SB-480 The SB-680 specimen was designed to have ashear reinforcement amount 40 greater than that of theGA-480 specimen but GA-480 showed a maximum load13 greater than that of SB-680 All steel stirrup-reinforcedspecimens showed maximum loads lower than that of theGA-480 specimen The reason for this is that steel stirrupscannot effectively contribute to shear resistance owing to thedifficulty in ensuring sufficient concrete cover thickness andeffective depth However in the case of the GFRP platesbecause each plate is installed between the upper and lowerbeams of the slab this problem can be resolved Thus theGFRP plate shear reinforcement was determined to be moreeffective than the steel stirrups in resisting punching shear
34 Spacing of GFRP Vertical Strips TheACI 318-14 standardspecifies the spacing limits of stirrup shear reinforcement ofhalf the effective depth (05119889) Whether the GFRP plate stud-ied herein satisfies the ACI 318-14 standard as a steel stirrupreplacement material was investigated through comparison
testing To carry this out the shear reinforcement amountsof the GA-184 GB-184 GC-184 and GD-184 specimenswere designed to be the same at 184 kN and their verticalcomponent shear reinforcement spacings were designed tobe 03119889 05119889 075119889 and 119889 respectively Comparison ofthe maximum shear strengths among the specimens withdifferent shear reinforcement spacings showed that becausethe amounts of shear reinforcement resisting the actualpunching shear were the same the shear strengths weresimilar at around 620 kN for all specimens except GD-184 (Figure 13) The shear strength of GD-184 was foundto be 383 kN 94 of the 406 kN shear strength of thecontrol specimen Because the GD-184 specimen had verticalcomponent shear reinforcement spacing equal to the effectivedepth (119889) value of 138mm it was determined that the shearreinforcement material in this specimen did not fully playits role Contrastingly the other specimens including GFRPplates as the shear reinforcementmaterial exhibited sufficientresistance to the punching shear of the slab Hence applyingthe steel stirrup shear reinforcement spacing limit of the ACI318-14 to GFRP plate material is not appropriate insteadfor GFRP plates we recommend increasing the verticalcomponent reinforcement spacing limit to 0751198894 Comparison between ExperimentalResults and ACI 318-14
41 Shear Strength Equation for GFRP Reinforcement Weanalyzed the applicability of the modified shear strengthequation for the steel stirrup-reinforced flat plate presentedin the ACI 318-14 standard for calculating the shear strengthin the alternate case of a flat plate reinforced with embeddedperforated GFRP plates Table 3 and Figure 14 compare the
International Journal of Polymer Science 7
(a) Control
(b) SB-480
(c) SB-680
(d) GA-480
(e) GA-184
(f) GB-184
(g) GC-184
(h) GD-184
Figure 9 Cracking patterns in the saw-cut slab cross sections of each specimen
8 International Journal of Polymer Science
Table 3 Test results
Specimen Displacement (mm) 119881cal (kN) 119881exp (kN) 119881exp119881calControl 8 327 406 124SB-480 1223 489 637 130SB-680 1548 572 780 136
Average 13Standard deviation 004
GA-480 1666 507 879 173GA-184 11 435 657 151GB-184 1189 392 621 158GC-184 1035 384 612 159GD-184 68 397 383 096
Average 147Standard deviation 026
0
200
400
600
800
1000
1200
1400
ControlSB-480SB-680GA-480
GA-184GB-184GC-184GD-184
Stra
in (120583
120576)
6004002000 800 1000minus400minus600minus800 minus200minus1000Distance from the center of the column (mm)
Figure 10 Strains in bottom reinforcing bars at peak load
shear strength calculated using themodifiedACI 318-14 shearstrength equation and that measured experimentally Theratios of calculated to measured shear strengths were foundto be on average 13 with a standard deviation of 004 forthe steel stirrup-reinforced specimens and the nonreinforcedspecimen representing reasonable accuracy of the ACI 318-14 equation for predicting the experimental shear strengthHowever for the GFRP-reinforced specimens the ratios ofcalculated to measured shear strengths were found to be onaverage 147 with a standard deviation of 026 Thus themodified ACI 318-14 equation more highly underestimatedthe shear performance of the GFRP plate than that of thenonreinforced or steel stirrup-reinforced specimen
The failure modes of a shear reinforced flat plate can belargely categorized into failures beginning from the insideof the shear reinforcement and those beginning from theoutside Analysis was conducted to verify whether the failuremode prediction equation which is amodification of the steelstirrup equation for the GFRP plate was suitable Equations(8) and (9) are used to calculate shear strength for failurestarting inside the GFRP plate Here the contribution of
0
100
200
300
400
500
600
700
minus2000 0 2000 4000 6000 8000 10000
Load
(kN
)
Strain (120583120576)
L4
L5
L3L2L1
L4L5
L3L2L1
Figure 11 Load versus GFRP strain for the GC-184 specimen
the critical section of concrete is set using the internalcritical section (1198870in) that is the portions up to 05119889 verticaland horizontal distances from the column (recall Figure 4)Hence
119881119899in = 119881119888in + 119881119891 (8)
119881119888in = 16radic11989110158401198881198870in119889 (9)
The shear strength equation for failure beginning outsidethe GFRP plate is shown in (10) The external criticalsection (1198870out) 05119889 from the shear reinforcement domainwasconsidered to be the critical section and the shear strengthcontribution of the shear reinforcement was not includedTherefore
119881119899out = 16radic11989110158401198881198870out119889 (10)
The flat plate failure mode can be predicted by comparingthe values of 119881119899in in (8) and 119881119899out in (10) Table 4 lists
International Journal of Polymer Science 9
Table 4 Failure modes
Specimen 119881119899in (kN) 119881119899out (kN) Failure mode Crack patternsPredicted Actual
GA-480 286 386 Within Within
GA-184 370 228 Outside Outside
GB-184 286 270 Outside Outside
GC-184 245 303 Within Within
GD-184 225 336 Within Within
ControlSB-480
SB-680GA-480
0100200300400500600700800900
1000
Load
(kN
)
10 20 30 40 50 60 70 800Displacement (mm)
Figure 12 Load-displacement curves
the predicted and actual failure modes the predicted failuremodes were correct for all specimens Therefore it wasconcluded that the failure mode prediction equation wasaccurate for a flat plate reinforced with GFRP plates
5 Conclusions
In this paper the shear performance of a flat plate includingGFRP plates was evaluated as a shear reinforcement materialPunching shear tests were conducted in which the fractureand failure modes strains and load-displacement curvesof 8 flat plate specimens were compared The conclusionsobtained from this study are as follows
(1) Among the failed specimens those including GFRPplates experienced cone failures with more gradualslopes and greater critical sectional areas comparedto those of the steel stirrup-reinforced and nonrein-forced specimens Therefore the GFRP plates wereeffective as reinforcement against the punching shear
(2) Comparison of load-displacement curves of the spec-imens including GFRP plate reinforcement showed
Center-to-center spacing of GFRP vertical strips
GA-184 GC-184GB-1840
100
200
300
400
500
600
700
Load
(kN
)
GD-184(05d) (d)(075d)(03d)
Figure 13 Shear strength depending on the spacing of GFRPvertical strips
that with increasing applied loads the strains ofthe vertical components increased greatly causingfailure of the GFRP plate at strains greater than9000120583120576 whereas the horizontal components did notexperience significant changes in strain over therange of loads applied Thus the GFRP plate verticalcomponent contributes substantially to the punchingshear performance of the slab Considering only thevertical component of the GFRP plate as the shearreinforcement when calculating the shear strength ofthe shear reinforcement sectional area was found tobe effective
(3) The specimen including GFRP plates with the verti-cal component reinforcement spacing of 1119889 did notfully exhibit its shear performance but specimens ofreinforcement spacing 075119889 showed sufficient shearperformance Therefore it is recommended that themaximum limit of shear reinforcement spacing beincreased to 075119889 for GFRP plates
(4) A GFRP plate shear strength equation modified fromthe ACI 318-14-11 standard equation was validated bycomparing its results to experimental shear strengthresults For GFRP-reinforced specimens the ratios of
10 International Journal of Polymer Science
SB-4
80
GA-
184
GC-
184
GA-
480
GD
-184
Con
trol
SB-6
80
minus05
0
05
1
15
2
25
Specimens
Vex
pV
cal
VexpVcal
GB-
184
Figure 14 Comparison of experimental and calculated shearstrengths
experimental to calculated shear strengths (119881exp119881cal)were found to be on average 147 with a standarddeviation of 026 Thus the equation was determinedto be applicable as a shear strength equation in thecase of a flat plate reinforced with GFRP platesFurthermore the failure mode prediction equationprovided in ACI 318-14-11 was found to accuratelypredict the failure modes of all GFRP-reinforcedspecimens
Conflicts of Interest
The authors declare that they have no conflicts of interest
Acknowledgments
This work was supported by the National Research Founda-tion of Korea (NRF) grant funded by the KoreanGovernment(MSIP) (NRF-2017R1A2B2005581)
References
[1] M R Esfahani M R Kianoush and A R Moradi ldquoPunchingshear strength of interior slab-column connections strength-ened with carbon fiber reinforced polymer sheetsrdquo EngineeringStructures vol 31 no 7 pp 1535ndash1542 2009
[2] D M V Faria J Einpaul A M P Ramos M F Ruiz and AMuttoni ldquoOn the efficiency of flat slabs strengthening againstpunching using externally bonded fibre reinforced polymersrdquoConstruction and Building Materials vol 73 pp 366ndash377 2014
[3] H Erdogan B Binici and G Ozcebe ldquoEffect of columnrectangularity on CFRP-strengthened RC flat platesrdquoMagazineof Concrete Research vol 63 no 7 pp 511ndash525 2011
[4] K Sissakis and S A Sheikh ldquoStrengthening concrete slabs forpunching shear with carbon fiber-reinforced polymer lami-natesrdquo ACI Structural Journal vol 104 no 1 pp 49ndash59 2007
[5] M Hassan E A Ahmed and B Benmokrane ldquoPunchingshear behavior of two-way slabs reinforced with FRP shear
reinforcementrdquo Journal of Composites for Construction vol 19no 1 Article ID 04014030 2015
[6] D-J Kim M S Kim J Choi H Kim A Scanlon and YH Lee ldquoConcrete beams with fiber-reinforced polymer shearreinforcementrdquo ACI Structural Journal vol 111 no 4 pp 903ndash912 2014
[7] ACI Committee 318 Building Code Requirements for ReinforcedConcrete and Commentary (ACI318-14) American ConcreteInstitute Farmington Hills Mich USA 2014
[8] K W Johansen Yield-Line Formulae for Slabs Cement andConcrete Association London UK 1998
Submit your manuscripts athttpswwwhindawicom
ScientificaHindawi Publishing Corporationhttpwwwhindawicom Volume 2014
CorrosionInternational Journal of
Hindawi Publishing Corporationhttpwwwhindawicom Volume 2014
Polymer ScienceInternational Journal of
Hindawi Publishing Corporationhttpwwwhindawicom Volume 2014
Hindawi Publishing Corporationhttpwwwhindawicom Volume 2014
CeramicsJournal of
Hindawi Publishing Corporationhttpwwwhindawicom Volume 2014
CompositesJournal of
NanoparticlesJournal of
Hindawi Publishing Corporationhttpwwwhindawicom Volume 2014
Hindawi Publishing Corporationhttpwwwhindawicom Volume 2014
International Journal of
Biomaterials
Hindawi Publishing Corporationhttpwwwhindawicom Volume 2014
NanoscienceJournal of
TextilesHindawi Publishing Corporation httpwwwhindawicom Volume 2014
Journal of
NanotechnologyHindawi Publishing Corporationhttpwwwhindawicom Volume 2014
Journal of
CrystallographyJournal of
Hindawi Publishing Corporationhttpwwwhindawicom Volume 2014
The Scientific World JournalHindawi Publishing Corporation httpwwwhindawicom Volume 2014
Hindawi Publishing Corporationhttpwwwhindawicom Volume 2014
CoatingsJournal of
Advances in
Materials Science and EngineeringHindawi Publishing Corporationhttpwwwhindawicom Volume 2014
Smart Materials Research
Hindawi Publishing Corporationhttpwwwhindawicom Volume 2014
Hindawi Publishing Corporationhttpwwwhindawicom Volume 2014
MetallurgyJournal of
Hindawi Publishing Corporationhttpwwwhindawicom Volume 2014
BioMed Research International
MaterialsJournal of
Hindawi Publishing Corporationhttpwwwhindawicom Volume 2014
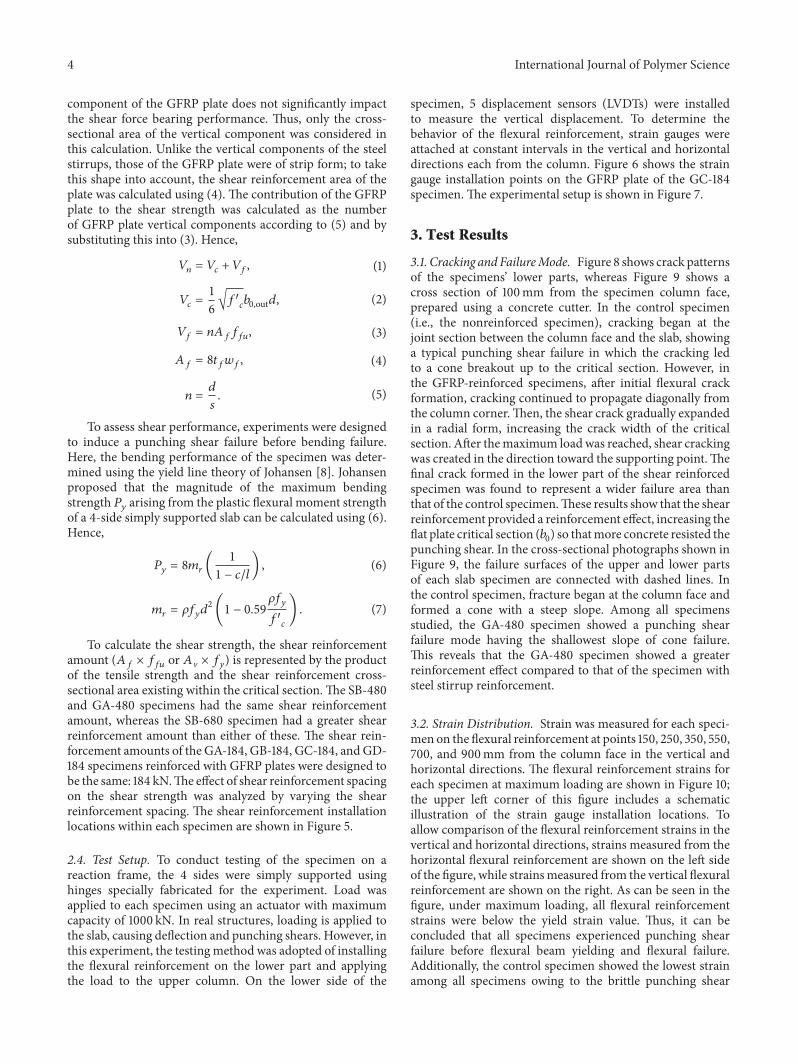
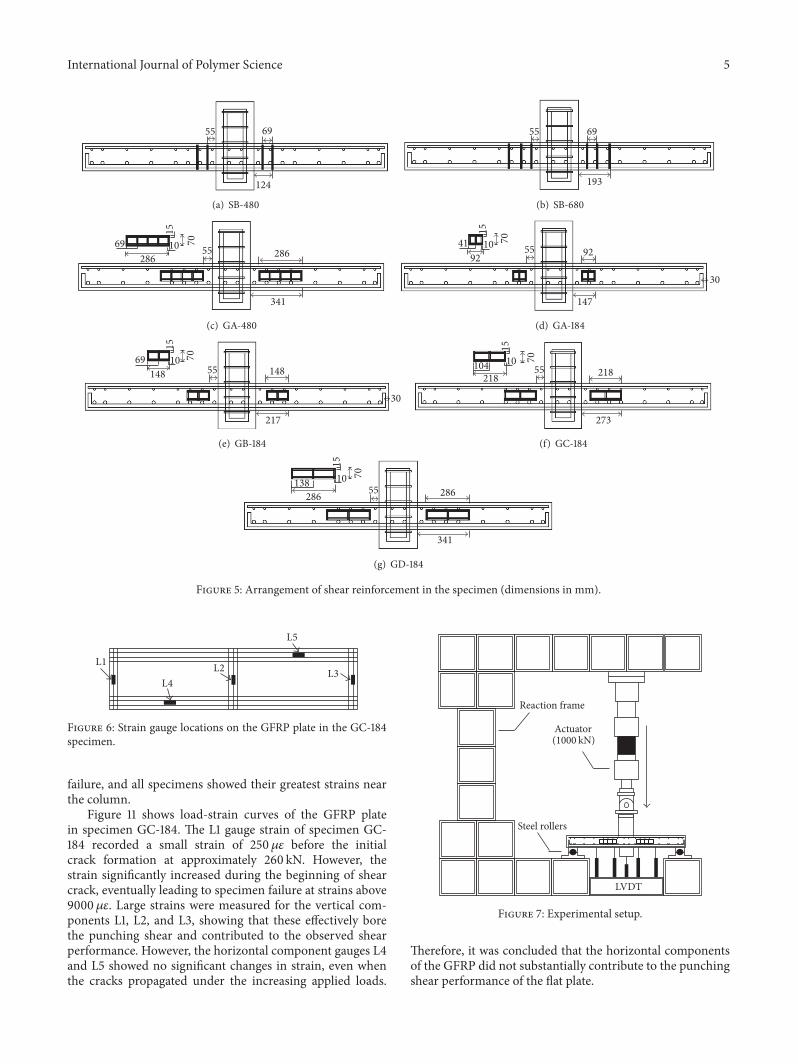
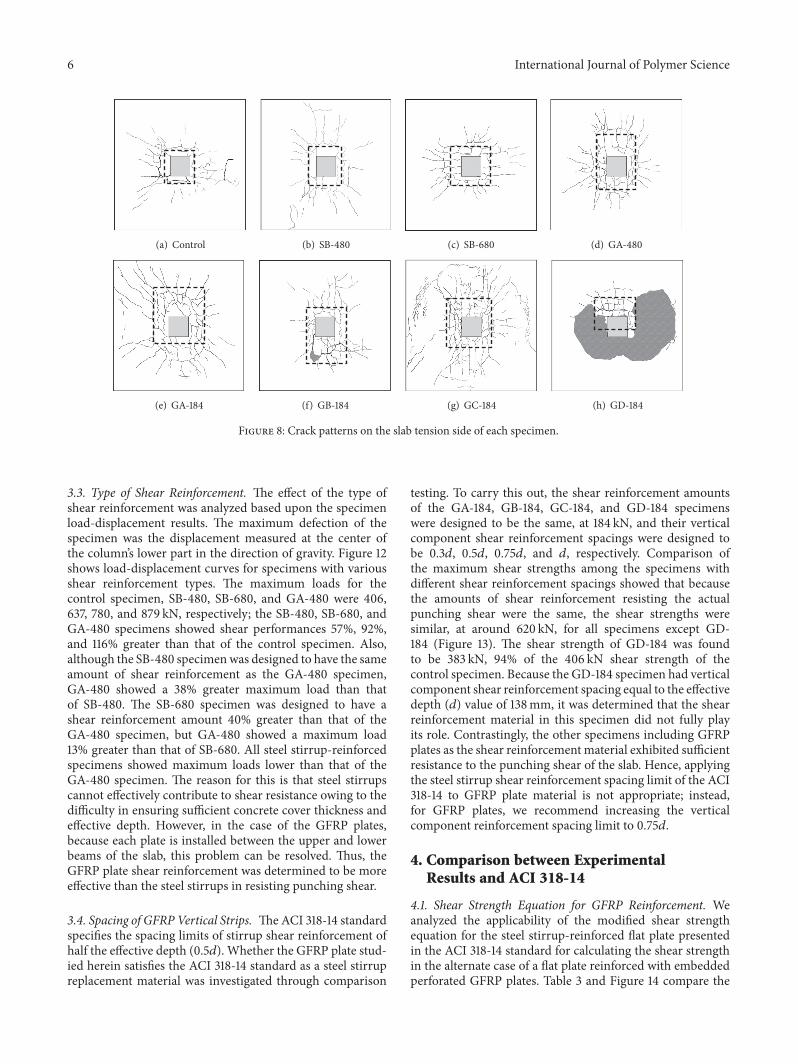
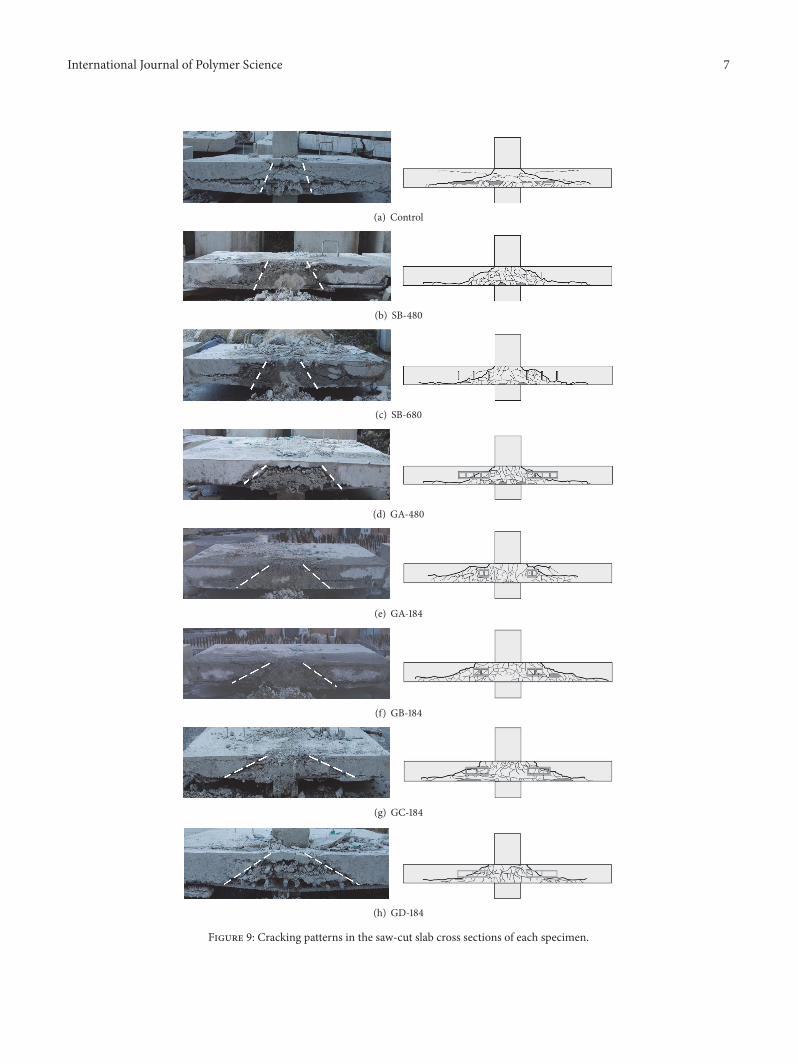
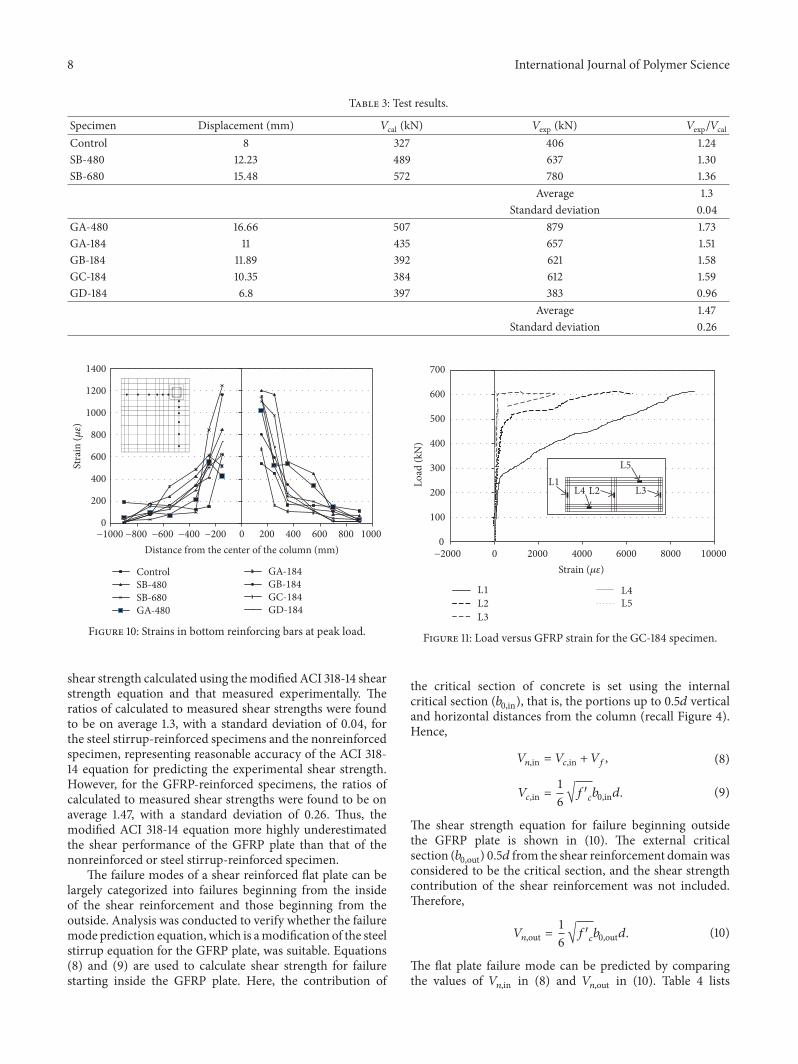
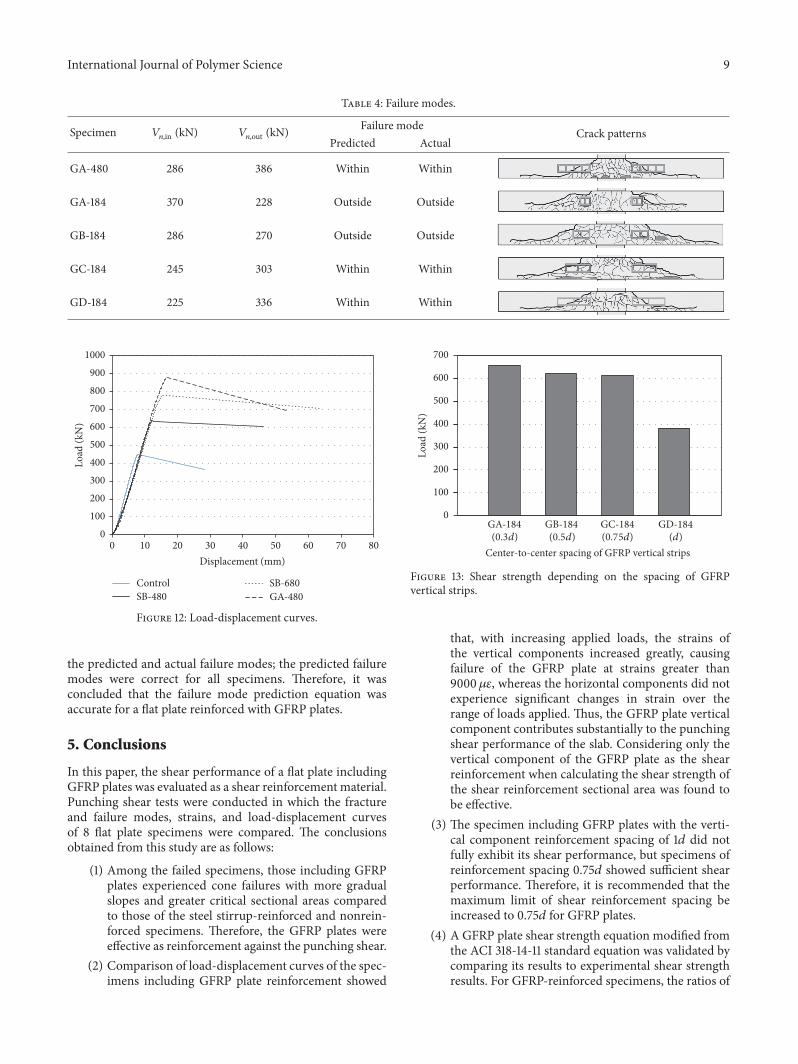