evaluation of potential effects of plastin 3
TRANSCRIPT

RESEARCH ARTICLE
Evaluation of potential effects of Plastin 3
overexpression and low-dose SMN-antisense
oligonucleotides on putative biomarkers in
spinal muscular atrophy mice
Eike A. Strathmann1,2, Miriam Peters1,2,3, Seyyedmohsen Hosseinibarkooie1,2, Frank
W. Rigo4, C. Frank Bennett4, Phillip G. Zaworski5, Karen S. Chen6, Michael Nothnagel7,
Brunhilde Wirth1,2,8,9*
1 Institute of Human Genetics, University of Cologne, Cologne, Germany, 2 Center for Molecular Medicine
Cologne, University of Cologne, Cologne, Germany, 3 Endocrine Research Unit, Medical clinic and
Outpatient clinic IV, University of Munich, Munich, Germany, 4 IONIS Pharmaceuticals, Carlsbad, California,
United States of America, 5 PharmOptima, Portage, Michigan, United States of America, 6 SMA Foundation,
New York, New York, United States of America, 7 Department of Statistical Genetics and Bioinformatics,
Cologne Centre for Genomics, University of Cologne, Cologne, Germany, 8 Institute for Genetics, University
of Cologne, Cologne, Germany, 9 Center for Rare Diseases, University Hospital of Cologne, Cologne,
Germany
Abstract
Objectives
Spinal muscular atrophy (SMA) is a devastating motor neuron disorder caused by homozy-
gous loss of the survival motor neuron 1 (SMN1) gene and insufficient functional SMN pro-
tein produced by the SMN2 copy gene. Additional genetic protective modifiers such as
Plastin 3 (PLS3) can counteract SMA pathology despite insufficient SMN protein. Recently,
Spinraza, an SMN antisense oligonucleotide (ASO) that restores full-length SMN2 tran-
scripts, has been FDA- and EMA-approved for SMA therapy. Hence, the availability of bio-
markers allowing a reliable monitoring of disease and therapy progression would be of great
importance. Our objectives were (i) to analyse the feasibility of SMN and of six SMA bio-
markers identified by the BforSMA study in the Taiwanese SMA mouse model, (ii) to analyse
the effect of PLS3 overexpression on these biomarkers, and (iii) to assess the impact of low-
dose SMN-ASO therapy on the level of SMN and the six biomarkers.
Methods
At P10 and P21, the level of SMN and six putative biomarkers were compared among SMA,
heterozygous and wild type mice, with or without PLS3 overexpression, and with or without
presymptomatic low-dose SMN-ASO subcutaneous injection. SMN levels were measured
in whole blood by ECL immunoassay and of six SMA putative biomarkers, namely Cartilage
Oligomeric Matrix Protein (COMP), Dipeptidyl Peptidase 4 (DPP4), Tetranectin (C-type Lec-
tin Family 3 Member B, CLEC3B), Osteopontin (Secreted Phosphoprotein 1, SPP1), Vitro-
nectin (VTN) and Fetuin A (Alpha 2-HS Glycoprotein, AHSG) in plasma.
PLOS ONE | https://doi.org/10.1371/journal.pone.0203398 September 6, 2018 1 / 28
a1111111111
a1111111111
a1111111111
a1111111111
a1111111111
OPENACCESS
Citation: Strathmann EA, Peters M,
Hosseinibarkooie S, Rigo FW, Bennett CF, Zaworski
PG, et al. (2018) Evaluation of potential effects of
Plastin 3 overexpression and low-dose SMN-
antisense oligonucleotides on putative biomarkers
in spinal muscular atrophy mice. PLoS ONE 13(9):
e0203398. https://doi.org/10.1371/journal.
pone.0203398
Editor: Ravindra N. Singh, Iowa State University,
UNITED STATES
Received: May 8, 2018
Accepted: August 20, 2018
Published: September 6, 2018
Copyright: © 2018 Strathmann et al. This is an
open access article distributed under the terms of
the Creative Commons Attribution License, which
permits unrestricted use, distribution, and
reproduction in any medium, provided the original
author and source are credited.
Data Availability Statement: All raw data are
included in the Supporting Information files.
Funding: This work was supported by the
European Community’s Seventh Framework
Programme (FP7/2007-2013) under grant
agreement n˚ 2012-305121 “Integrated European –
omics research project for diagnosis and therapy in
rare neuromuscular and neurodegenerative
diseases (NEUROMICS)”, Deutsche

Results
SMN levels were significantly discernible between SMA, heterozygous and wild type mice.
However, no significant differences were measured upon low-dose SMN-ASO treatment
compared to untreated animals. Of the six biomarkers, only COMP and DPP4 showed high
and SPP1 moderate correlation with the SMA phenotype. PLS3 overexpression neither
influenced the SMN level nor the six biomarkers, supporting the hypothesis that PLS3 acts
as an independent protective modifier.
Introduction
Spinal muscular atrophy (SMA) is the most common genetic cause of early infant death. SMA
is characterised by progressive muscle weakness and atrophy of proximal voluntary muscles
due to loss of α-motor neurons in the anterior horns of the spinal cord [1, 2]. Impaired matu-
ration, maintenance and function of neuromuscular junctions (NMJ) are hallmarks of SMA
[3, 4]. SMA is caused by functional loss of the survival motor neuron 1 (SMN1 [MIM:
600354]) gene. Importantly, all patients carry a copy gene, SMN2 [MIM: 601627], which differs
from SMN1 in a translationally silent nucleotide exchange that disrupts an exonic splicing
enhancer and creates a new splicing silencer. This causes the skipping of exon 7 in about 90%
of SMN2 transcripts [5–7]. The SMNΔ7 protein is unstable and rapidly degraded [8]. Only
about 10% of SMN2 transcripts are correctly spliced [9]. Consequently, the severity of SMA,
which varies from severe type I to adult type IV, inversely correlates with the copy number of
SMN2 [10, 11]. Approximately 60% of individuals with SMA develop the severe type I form
(SMA1 [MIM: 253300]); patients usually carry two SMN2 copies. These patients are never able
to sit or walk, their life expectancy is below two years, while nutritional and respiratory support
is necessary. Individuals with the intermediate type II SMA (SMA2 [MIM: 253550]) usually
carry three SMN2 copies, the disease starts after 6 months of age; patients are able to sit, but
not to walk. Individuals with mild type III SMA (SMA3 [MIM: 253400]) usually carry three to
four SMN2 copies, disease starts after 18 months of life and patients are able to sit and walk,
but often became wheelchair bound with disease progression. Individuals with adult type IV
SMA (SMA4 [MIM: 271150]) usually carry four to six SMN2 copies, onset starts after 30 years
of life and affected individuals show only very mild motoric dysfunction [10–12].
In addition to the SMN2 copy number, there are genetic modifiers found in asymptomatic
SMN1-deleted individuals in SMA discordant families, such as Plastin 3 (PLS3, [MIM: 300131])
and Neurocalcin delta (NCALD, [MIM: 606722]) that influence the severity of SMA [13, 14].
PLS3 levels have been found to be upregulated in blood and motor neurons differentiated from
induced pluripotent stem cells originated from fibroblasts derived from asymptomatic individu-
als in comparison to their affected siblings [13, 15]. PLS3 is a Ca2+-dependent F-actin-binding
and -bundling protein restoring F-actin levels in SMA condition [13, 16]. PLS3 overexpression
is able to rescue axonal growth defects and motor neuron function in a broad range of SMA
models including mouse, zebrafish, fly and worm [13, 17–21]. SMN is involved in the process
of endocytosis in different SMA models [14, 19, 22, 23]. Overexpression of PLS3 in an SMA
mouse model improves endocytosis at the NMJ site, which is the most affected part in SMA
condition [19]. Furthermore, PLS3 improves the NMJ structure and function, connectivity and
survival in an intermediate SMA mouse model [19].
Recently, encouraging progress has been made with SMA therapy using either antisense oligo-
nucleotides (ASOs), AAV-based gene therapy or small molecules [24]. Most advanced is the ther-
apy with Spinraza (nusinersen), an ASO that blocks an intronic silencer in SMN2 transcripts and
Effect of PLS3 and SMN-ASO on plasma biomarker in SMA mice
PLOS ONE | https://doi.org/10.1371/journal.pone.0203398 September 6, 2018 2 / 28
Forschungsgemeinschaft Wi-945/14-1, Wi-945/16-
1, Wi-945/17-1 and CMMC (C16) to (BW). FWR
and CFB are employee of IONIS Pharmaceuticals,
Carlsbad (USA) and PGZ of PharmOptima, Portage
(USA); PharmOptima (PGZ) and SMA Foundation
(KSC) funded the biomarker analysis; IONIS
Pharmaceuticals (FWR and CFB) funded the
production of the SMN-ASOs. Further specific roles
of these authors (FWR, CFB, PGZ and KSC) are
articulated in the "author contributors" section.
Competing interests: FWR and CFB are employee
of IONIS Pharmaceuticals, Carlsbad (USA) and
PGZ of PharmOptima, Portage (USA); This does
not alter the authors’ adherence to PLOS ONE
policies on sharing data and materials. Hereby the
authors declare no competing interests.

promotes exon 7 inclusion [25]. This has recently been approved by FDA and EMA for SMA
therapy [24]. Recently, two clinical studies, one with Spinraza and another one with AAV9-SMN-
cDNA have shown significant improvements in motoric abilities and survival of individuals with
SMA1 [26, 27]. Despite this progress in SMA therapy, the studies on reliable biomarkers that
would allow an easy monitoring of disease and therapy progression are still scarce.
The phenotypic variability and unsteady disease progression of SMA makes it difficult to
estimate treatment outcome and to measure patient improvement. Biomarkers that reliably
correlate with the severity of SMA can be beneficial to overcome problems associated with
motoric tests and cooperativeness, particularly of small children, to participate in these tests.
Thereby, SMA biomarkers are useful to achieve information about disease progression and
pharmacodynamics in ongoing pharmacological studies. Several work groups tried to identify
biomarkers that correlate with disease severity of SMA [28–37]. The BforSMA project was a
pilot study to identify candidate protein, transcript and metabolite biomarkers using an unbi-
ased approach [29, 30]. 27 proteins have subsequently been validated and included into a com-
mercial SMA panel (SMA-MAP) [38]. Of these, 10 have been recently analysed in the severe
Δ7-SMA mouse model [32].
Previous studies have shown that overexpression of PLS3 in the severe Taiwanese SMA
mouse model restores the functions of the motor neurons and the NMJ, however, did not
show improvement in the rate of survival, due to multi-organ dysfunctions caused by low
amount of endogenous SMN protein [18]. Also, in the severe Δ7-SMA mouse model, no
improvement in survival or motoric abilities has been found [39]. We recently developed an
intermediate Taiwanese SMA mouse model by injecting presymptomatically a suboptimal
low-dose SMN-ASO (30 μg), which resembled the phenotype of a type II SMA in patients.
This treatment prolonged the survival from 16 days to four weeks (26 ± 9.48 days). Additional
PLS3 overexpression from a transgenic allele prolonged the survival from 26 to more than 250
days in more than 60% of mice [19].
Here we analysed the protein levels of SMN and six biomarkers from the BforSMA bio-
marker panel (COMP [MIM: 600310], DPP4 [MIM: 102720], SPP1 [MIM: 166490], CLEC3B
[MIM: 187520], VTN [MIM: 193190], and AHSG [MIM: 138680]) in plasma of severe and
intermediate SMA mice. In addition, we aimed to assess whether PLS3 overexpression or the
low-dose systemically administered SMN-ASO-therapy have any impact on these biomarkers.
Materials and methods
Mouse breeding
The Taiwanese SMA mouse model FVB.Cg-Tg (SMN2)2Hung Smn1tm1Hung/J (stock number
005058) was obtained from Jackson Laboratory [40]. Both alleles of the murine Smn have been
knocked out in this severely affected mouse model, while it contains two copies per allele of a
human SMN2 transgene (SmnKO/KO; SMN2tg/tg). Crossing SmnKO/KO; SMN2tg/tg mice with
SmnKO/WT in each F1 generation 50% SMA (SmnKO/KO; SMN2tg/0) and 50% HET (SmnKO/WT;
SMN2tg/0) mice were obtained [41]. We further backcrossed these mice for more than seven
generations to produce mice with congenic C57BL/6N background [18]. PLS3 overexpressing
transgenic animals were used to generate SMA-PLS3het (SmnKO/KO; SMN2tg/0; PLS3tg/0) and
SMA-PLS3hom (SmnKO/KO; SMN2tg/0; PLS3tg/tg) mice as well as HET-PLS3het (SmnKO/WT;
SMN2tg/0; PLS3tg/0) and HET-PLS3hom (SmnKO/WT; SMN2tg/0; PLS3tg/tg) mice, all on C57BL/
6N background. Neonatal mice were ear tagged, tail cut, and genotyped as previously
described [18, 41]. In addition, WT C57BL/6N mice were used as controls.
Mice were maintained at the SPF animal facility of the Institute for Genetics at the Univer-
sity of Cologne, kept under a 12 h light cycle, and given a 2918 and 2919 breeding diet
Effect of PLS3 and SMN-ASO on plasma biomarker in SMA mice
PLOS ONE | https://doi.org/10.1371/journal.pone.0203398 September 6, 2018 3 / 28

(Harlan). Not more than four mice were kept in a micro isolation chamber (Sentinel-cage-sys-
tem; each air ventilation system was independent of the laboratory air ventilation) with con-
stant access to water and food. The litter consisted of FS 14 (Sniff) and was replaced once per
week. All personnel in the animal facility were professional animal caretakers. A scoring sys-
tem was used to evaluate the burden of each animal according to specific criteria as listed in S1
Table. Each animal was controlled and evaluated daily. If an animal reached more than 10
points (medium burden), it was controlled two times daily. Animals that reached a score of 20
or more (strong burden) were sacrificed immediately by cervical dislocation (P10) or CO2 gas-
sing (P21) followed by immediate cervical dislocation and extraction of whole blood into
K2EDTA-coated tubes to avoid coagulation. To increase the amount of blood, a cervical mas-
sage was performed. All animal procedures were conducted in accordance with European,
national and institutional guidelines and protocols and were approved by the responsible gov-
ernment authority: Landesamt fur Natur, Umwelt und Verbraucherschutz NRW. (Animal
Licence: LANUV NRW under the reference numbers 84–02.05.20.12.120, 84–02.04.2014.A006
and 84–02.04.2015.A378).
ASO injection
On P2 and P3 six animals of each genotype were injected subcutaneously with 30 μg SMN-ASO,
as previously described [19]. SMN-ASO (IONIS Pharmaceuticals [42] was diluted in sterile PBS
and the concentration was calculated using photometric density (AD260) (10 mg/mL working
solution). The subcutaneous injections with a microliter syringe (Hamilton) were administered
as reported [42]. This study included two cohorts of mice to allow endpoint whole blood and
plasma at P10 in one cohort and longitudinal assessment out to 21 days in another cohort.
Untreated SMA mice were only available for comparison at P10 due to a median survival of
about 14 days.
SMN ECL immunoassay and plasma biomarker protein analysis
100–200 μL whole blood from terminally bled mice at P10 or P21 were collected directly into
K2EDTA-coated tubes to avoid coagulation. The tubes were mixed gently by inversion. Ali-
quots of 20–50 μL were collected and stored at -80˚C and used for SMN protein analysis as
previously described [38].
The SMN ECL immunoassay was carried out by PharmOptima as previously described
[43]. Prior to the assay, the samples were vortexed and a 5 μL sample was diluted into 795 μL
of dilution buffer (1:160 final dilution). Assay plates were read using an MSD 6000 Imager
(Meso Scale Discovery). Data reduction from the SMN ECL Immunoassay was performed
using software provided with the MSD 6000 Imager. Whole blood SMN values were reported
as pg SMN/mL.
The remaining whole blood fraction was transferred into 1.5 mL micro-centrifuge tubes for
plasma processing by centrifugation (800 x g, 10 min. at 4˚C). The supernatant (clear layer)
was carefully removed, transferred into new 1.5 mL micro-centrifuge tubes and aliquots of
25–50 μL were stored for further analysis at -80˚C. The protein measurements of the six
plasma biomarkers (COMP, DPP4, SPP1, CLEC3B, VTN, and AHSG, which represent a sub-
set of biomarkers of the SMA-MAP panel available for analysis in mice), were carried out by
PharmOptima using commercially available antibodies and calibration reagents and multiplex
assay plates manufactured by Meso Scale Discovery as previously described [32, 38]. A total of
126 blood samples were collected and 882 measurements were performed in duplicates. The
mean value for each analyte was used. Raw data of the plasma concentrations of SMN and the
six plasma proteins at both time points are given in the supplemental data (S2 Table).
Effect of PLS3 and SMN-ASO on plasma biomarker in SMA mice
PLOS ONE | https://doi.org/10.1371/journal.pone.0203398 September 6, 2018 4 / 28

Quantitative real time PCR
Approximately 50–100 μL of blood, brain and muscle was collected from four WT mice and
three female and three male heterozygous PLS3 transgenic mice at P21. Isolation of total RNA
from mouse tissues was performed using the Purelink RNA Mini Kit (Thermo Fisher Scien-
tific) and the QIAshredder (Qiagen) kit according to the manufacturer‘s instructions. 400ng of
RNA was reversely transcribed into cDNA (QuantiTect Reverse Transctiption Kit) according
to the manufacturer‘s instructions. The quantitative real time PCR was performed using
PowerSybrGreen Master Mix (Thermo Fisher Scientific) on a StepOnePlus PCR System
(Applied Biosystems). Specific primers for the PLS3 transgene and endogenous Pls3 were used
as previously described [18]. Hprt was used as a housekeeper gene. The 2-ΔΔCT method was
used to calculate relative changes in gene expression [44].
Statistics
All statistical assessments were performed using R version 2.3.2 and RStudio version 0.99.49.1.
We applied Tukey’s method to exclude outliers of each genotype and biomarker from our raw
data sets [45] (see S2 Table). For each genotype at each time point and without or with
SMN-ASO treatment, a separate cohort of animals was used, therefore an unpaired experi-
mental design was used. In order to account for potentially non-normally distributed data, we
applied nonparametric Kruskal-Wallis (KW) tests as a priori tests. Since the concentration of
each of the seven proteins was measured in every single animal, the KW-tests were corrected
for multiple comparisons using the Bonferroni correction [46]. In cases of significant differ-
ences, we subsequently applied post-hoc Dunn tests to identify the groups that differ signifi-
cantly from each other [47]. Dunn tests were corrected for multiple comparisons by use of the
Holm correction [48].
For correlation analysis of SMN concentrations with the six putative biomarkers, linear
models were applied and the Pearson’s Correlation Coefficient r as well as Spearman’s Correla-
tion Coefficient ρ were calculated.
Results
Study design and sample collection
We aimed to address two main questions: First, to assess the impact of PLS3 overexpression, an
SMA protective modifier [13], on SMN protein concentration and on six plasma biomarker
analytes (COMP, DPP4, SPP1, CLEC3B, VTN and AHSG). These biomarkers have been identi-
fied earlier in SMA-affected individuals by the BforSMA study [30, 38], and verified in the
severely affected Δ7SMA mouse model [32]. We investigated the concentration of these analytes
in seven different mouse groups: SMA, SMA-PLS3het, SMA-PLS3hom, HET, HET-PLS3het,
HET-PLS3hom, and WT. Each group consists of three males and three females. Since the mean
age of survival of untreated Taiwanese SMA mice is ~16 days and first symptoms occur at P5
[18, 19], the blood samples for all untreated groups have been collected at P10 (7 groups, Fig 1).
Second, modifiers act protectively only in the presence of a certain SMN level, which lies
above the SMN amount present in severely affected SMA mice or SMA1-affected individuals
[13, 14, 19]. We therefore injected subcutaneously low-dose SMN-ASOs (30 μg at P2 and P3)
in the same seven groups (named SMA+ASO, SMA-PLS3het+ASO, SMA-PLS3hom+ASO,
HET+ASO, HET-PLS3het+ASO, HET-PLS3hom+ASO, and WT+ASO). Since low-dose
SMN-ASO-treated SMA mice survive ~26 days [19], we collected blood samples at P10 and
P21, which further allowed a longitudinal analysis. Thus, we investigated SMN and the six ana-
lytes in all seven ASO-treated groups at two different time points (14 groups; Fig 1).
Effect of PLS3 and SMN-ASO on plasma biomarker in SMA mice
PLOS ONE | https://doi.org/10.1371/journal.pone.0203398 September 6, 2018 5 / 28

SMN blood protein concentration in SMA mice is massively reduced
We first verified whether there are significant differences in the concentration of SMN between
any two genotypes using the KW-test. Therefore, we compared all genotypes of untreated and
ASO-treated samples at P10 as well as ASO-treated samples at P21 (Table 1A). Since significant
differences were found between at least two different groups, we next calculated which genotypes
differed significantly from each other using post-hoc Dunn tests. Based on these results we evalu-
ated the SMN concentration at P10 in each of the three untreated SMA groups (SMA, SMA-PL-S3het and SMA-PLS3hom) and the three untreated HET groups (HET, HET-PLS3het and HET-
PLS3hom) and compared them to untreated WT group. Similarly, the three ASO-treated SMA
groups (SMA+ASO, SMA-PLS3het+ASO and SMA-PLS3hom+ASO) and the three ASO-treated
HET groups (HET+ASO, HET-PLS3het+ASO and HET-PLS3hom+ASO) were compared to
WT+ASO animals at P10 and P21. SMN concentrations in all SMA groups, irrespective of PLS3overexpression or ASO treatment at both, P10 and P21 but not in HET groups differed signifi-
cantly from the WT or WT+ASO groups (Table 1B and Fig 2A).
Next, we analysed the influence of PLS3 overexpression on SMN levels by comparing animals
with and without PLS3 overexpression of the same group (S3 Table). We found no significant
differences between animals of the same group and age irrespective of their PLS3 expression,
confirming our former results [18] that PLS3 has no direct influence on the SMN levels.
Similarly, we analysed the influence of low-dose systemically administered SMN-ASO treat-
ment on SMN levels comparing untreated versus ASO-treated animals of the same group and
age. In a first step the KW-test showed significant differences between at least two groups (S4A
Table). Next, explorative data analysis using post-hoc Dunn tests showed no significant differ-
ences between untreated and treated animals at P10 (S4B Table), concluding that low-dose
SMN-ASO treatment has no measurable influence on SMN levels in blood within any group.
Since PLS3 had no influence on SMN levels and to increase the power of our sample analy-
sis, we pooled untreated SMA, SMA-PLS3het and SMA-PLS3hom groups (pooled SMA) and
SMA+ASO, SMA-PLS3het+ASO and SMA-PLS3hom+ASO groups (pooled SMA+ASO); sim-
ilarly, for untreated HET groups (pooled HET) and SMN-ASO-treated HET groups (pooled
HET+ASO). Highly significant differences were obtained between pooled SMA or pooled
HET and WT at P10 and P21 but also between pooled SMA and pooled HET, clearly allowing
discrimination of all three groups (Fig 2B and S5 Table). Thus, pooled SMA+ASO cohort at
P10 showed a 5.1-fold and the pooled HET+ASO cohort a 1.7-fold reduction of SMN levels
compared to WT+ASO cohort at P10. This difference became even more evident at P21,
where pooled SMA+ASO cohort showed a 9.4-fold and pooled HET+ASO a 2.6-fold reduction
compared to WT+ASO group (Fig 2B and S6 Table). The differences primarily derive from
Fig 1. Schematic overview about the mouse genotypes and time points of protein level measurement.
https://doi.org/10.1371/journal.pone.0203398.g001
Effect of PLS3 and SMN-ASO on plasma biomarker in SMA mice
PLOS ONE | https://doi.org/10.1371/journal.pone.0203398 September 6, 2018 6 / 28

Ta
ble
1.
Co
mp
ari
son
of
the
pro
tein
lev
els
of
each
gen
oty
pe
toth
ew
ild
typ
e(W
T).
A.
Tre
at.g
rou
pC
om
par
iso
ns
SM
NC
OM
PD
PP
4S
PP
1C
LE
C3
BV
TN
AH
SG
P1
0u
ntr
eate
dA
llag
ain
stal
lg
eno
typ
es1
.33
E-0
3��
1.1
0E
-04
���
1.4
5E
-04
���
9.5
1E
-02
n.s
.2
.05
E-0
1n
.s.
2.6
4E
-04
���
3.8
3E
-03
��
P1
0A
SO
trea
ted
All
agai
nst
all
gen
oty
pes
9.9
0E
-03
��
1.3
3E
-04
���
3.7
8E
-03
��
3.6
2E
-03
��
2.4
4E
-04
���
3.3
2E
-03
��
7.6
8E
-05
���
P2
1A
SO
trea
ted
All
agai
nst
all
gen
oty
pes
9.7
2E
-04
���
5.1
7E
-03
��
8.3
3E
-04
���
9.4
7E
-03
��
4.5
2E
-01
n.s
.1
.00
E+
00
n.s
.9
.15
E-0
2n
.s.
B.
Tre
at.g
rou
pC
om
par
edg
eno
typ
esS
MN
CO
MP
DP
P4
SP
P1
CL
EC
3B
VT
NA
HS
G
P1
0u
ntr
eate
dS
MA
-W
T2
.58
E-0
3��
3.7
7E
-01
n.s
.3
.37
E-0
2�
3.9
5E
-01
n.s
.6
.59
E-0
1n
.s.
SM
A-P
LS3h
et-
WT
1.3
7E
-02
�1
.74
E-0
1n
.s.
8.5
7E
-04
���
7.6
6E
-01
n.s
.8
.43
E-0
1n
.s.
SM
A-P
LS3h
om
-W
T2
.02
E-0
3��
5.5
1E
-02
n.s
.3
.47
E-0
5���
5.1
8E
-01
n.s
.1
.00
E+
00
n.s
.
HE
T-
WT
4.6
6E
-01
n.s
.9
.06
E-0
1n
.s.
3.1
3E
-01
n.s
.4
.82
E-0
1n
.s.
1.8
6E
-01
n.s
.
HE
T-P
LS3h
et-
WT
3.9
3E
-01
n.s
.1
.00
E+
00
n.s
.9
.69
E-0
1n
.s.
1.5
5E
-02
�8
.32
E-0
1n
.s.
HE
T-P
LS3h
om
-W
T9
.67
E-0
1n
.s.
6.1
0E
-01
n.s
.1
.45
E-0
1n
.s.
1.5
5E
-01
n.s
.1
.15
E-0
1n
.s.
P1
0A
SO
trea
ted
SM
A+
AS
O-
WT
+A
SO
2.6
2E
-03
��
7.3
5E
-04
���
3.7
7E
-02
�2
.08
E-0
3��
6.7
4E
-03
��
4.5
5E
-01
n.s
.3
.28
E-0
2�
SM
A-P
LS3h
et+
AS
O-
WT
+A
SO
3.9
3E
-02
�7
.75
E-0
4���
1.0
6E
-04
���
2.4
1E
-03
��
9.4
6E
-04
���
3.9
7E
-02
�2
.06
E-0
1n
.s.
SM
A-P
LS3h
om
+A
SO
-W
T+
AS
O8
.09
E-0
3��
2.3
7E
-03
��
1.0
0E
+0
0n
.s.
1.0
0E
+0
0n
.s.
8.6
7E
-05
���
2.3
1E
-03
��
7.1
2E
-01
n.s
.
HE
T+
AS
O-
WT
+A
SO
1.0
0E
+0
0n
.s.
7.9
9E
-01
n.s
.4
.74
E-0
1n
.s.
1.4
7E
-02
�4
.79
E-0
1n
.s.
5.2
1E
-01
n.s
.4
.02
E-0
1n
.s.
HE
T-P
LS3h
et+
AS
O-
WT
+A
SO
4.0
0E
-01
n.s
.7
.97
E-0
1n
.s.
1.5
5E
-01
n.s
.2
.65
E-0
1n
.s.
3.9
0E
-01
n.s
.1
.00
E+
00
n.s
.4
.46
E-0
1n
.s.
HE
T-P
LS3h
om
+A
SO
-W
T+
AS
O9
.86
E-0
1n
.s.
7.7
3E
-01
n.s
.6
.71
E-0
2n
.s.
1.0
0E
+0
0n
.s.
6.0
7E
-01
n.s
.4
.44
E-0
1n
.s.
7.9
2E
-01
n.s
.
P2
1A
SO
trea
ted
SM
A+
AS
O-
WT
+A
SO
8.2
0E
-03
��
2.5
3E
-02
�5
.85
E-0
3��
1.0
0E
+0
0n
.s.
SM
A-P
LS3h
et+
AS
O-
WT
+A
SO
3.6
1E
-04
���
1.1
5E
-02
�1
.64
E-0
4���
9.5
4E
-01
n.s
.
SM
A-P
LS3h
om
+A
SO
-W
T+
AS
O2
.81
E-0
3��
3.4
6E
-01
n.s
.8
.40
E-0
3��
7.6
6E
-02
n.s
.
HE
T+
AS
O-
WT
+A
SO
4.8
8E
-01
n.s
.1
.00
E+
00
n.s
.5
.58
E-0
1n
.s.
1.0
0E
+0
0n
.s.
HE
T-P
LS3h
et+
AS
O-
WT
+A
SO
5.2
4E
-01
n.s
.1
.00
E+
00
n.s
.5
.02
E-0
1n
.s.
1.0
0E
+0
0n
.s.
HE
T-P
LS3h
om
+A
SO
-W
T+
AS
O5
.34
E-0
1n
.s.
9.4
4E
-01
n.s
.5
.36
E-0
1n
.s.
5.0
8E
-01
n.s
.
(A)P
-val
ues
of
apr
iori
Kru
skal
-Wal
lis
test
s(B
on
ferr
on
ico
rrec
ted
for
mu
ltip
leco
mp
aris
on
s)an
d(B
)co
rres
po
nd
ing
post-
hocD
un
nte
sts
(Ho
lmco
rrec
ted
for
mu
ltip
leco
mp
aris
on
s)sh
ow
ing
that
ther
ew
ere
sig
nif
ican
td
iffe
ren
ces
bet
wee
nu
ntr
eate
dan
dA
SO
-tre
ated
gro
up
sfo
rS
MN
and
all
bio
mar
ker
sex
cep
tfo
rfi
ve
gro
up
s(A
)an
dth
eref
ore
excl
ud
edfr
om
furt
her
anal
ysi
s(B
).A
ster
isk
sm
ark
sig
nif
ican
td
iffe
ren
ces
(�P�
0.0
5;
��P�
0.0
1;
���P�
0.0
01
);n
.s.=
no
tsi
gn
ific
ant.
htt
ps:
//doi.o
rg/1
0.1
371/jo
urn
al.p
one.
0203398.t001
Effect of PLS3 and SMN-ASO on plasma biomarker in SMA mice
PLOS ONE | https://doi.org/10.1371/journal.pone.0203398 September 6, 2018 7 / 28

murine Smn copies (2 in WT, 1 in HET and 0 in SMA mice) and to a minor extend from the
human SMN2 transgenes (0 in WT, 2 in HET and SMN mice).
We finally compared the pooled ASO-treated animals at P10 with P21 for longitudinal vari-
ation of SMN concentrations (Fig 2C and S10 Table). There were no differences in the SMN
concentration between P10 and P21 observed, neither within the pooled SMA+ASO, nor in
the pooled HET+ASO or WT+ASO cohort.
Together, these results demonstrate that i) SMN levels in blood are highly significant
reduced in pooled SMA mice and still significantly reduced in pooled HET Taiwanese mice
compared to WT mice, ii) the fold change reduction of SMN concentrations at P21 is higher
than at P10 for pooled SMA and pooled HET groups compared to WT group, iii) low-dose
SMN-ASO treatment does not give a measurable elevated SMN level in blood, despite dou-
bling survival of SMA mice, and iv) PLS3 overexpression has no influence on SMN levels.
Fig 2. SMN protein concentrations in blood. (A) Multiple comparisons of SMN concentrations in untreated or ASO-treated groups with and without PLS3overexpression at P10 and P21 in comparison to WT and WT+ASO, respectively (see also Table 1). (B) Multiple comparisons of pooled groups at P10 and P21
showing SMN concentrations in comparison to WT and WT+ASO, respectively (see also S5 Table). (C) Longitudinal comparisons of pooled ASO-treated
groups at P10 and P21 showed no significant differences in the SMN concentration between the two time points (see also S10 Table). (Dunn tests, multiple
comparisons, Holm corrected). Only comparisons leading to a significant difference are shown (�P�0.05; ��P�0.01, ���P�0.001).
https://doi.org/10.1371/journal.pone.0203398.g002
Effect of PLS3 and SMN-ASO on plasma biomarker in SMA mice
PLOS ONE | https://doi.org/10.1371/journal.pone.0203398 September 6, 2018 8 / 28

PLS3 and low dose SMN-ASO treatment have no effect on the
concentration of the six biomarkers
Next, we determined the plasma concentration of six putative SMA biomarkers (COMP;
DPP4, SPP1, CLEC3B, VTN, and AHSG), which have been identified earlier by the BforSMA
study [30, 38]. We followed the same test setup of Bonferroni-corrected KW-tests followed by
Holm-corrected Dunn tests as described before. In general, overexpression of PLS3 had no
effect on the concentration of the biomarkers at P10 and P21, except for DPP4 (SMA-PLS3het
vs. SMA-PLS3hom) at P10 (S3 Table). In addition to that, the ASO treatment had also no influ-
ence on the concentration of the six putative biomarkers at P10 except for CLEC3B (WT vs.
WT+ASO) mice (S4B Table). Similar to SMN, during further analysis we pooled the various
groups as indicated in Fig 1.
COMP, DPP4 and SPP1 are reliable biomarkers for SMA
COMP showed a significant difference in untreated pooled SMA group but not in single SMA
groups as compared to the WT group. Moreover, COMP was significantly downregulated in
all ASO-treated SMA groups except the SMA-Pls3hom+ASO group as compared to WT or
WT+ASO mice at both time points, P10 and P21 (Figs 3A and 4A and Tables 1B and S5B).
COMP was significantly downregulated in pooled SMA+ASO group compared to both, pooled
HET+ASO and WT+ASO (Fig 4A and S5B Table). In contrast, pooled HET or pooled HET
+ASO mice showed similar concentrations of COMP as WT or WT+ASO groups. Pooled
SMA+ASO versus WT+ASO cohort showed a significant decrease of COMP in SMA animals
(2.7-fold at P10 and 1.6-fold at P21), while pooled HET or pooled HET+ASO versus WT or
WT+ASO showed similar levels (Fig 4A and S5B and S6 Tables). Hence, these data show i) a
strong correlation of pooled SMA with reduced COMP levels, ii) a correlation between COMP
and very low SMN concentrations as in SMA mice, iii) no influence upon low-dose SMN-ASO
treatment, and iv) no influence of PLS3 overexpression on COMP levels. Moreover, COMP
concentration decreased by 2.16-fold from P10 to P21 in WT, which indicates that this marker
can be reliably used only in cohorts of the same age.
DPP4 was significantly downregulated in all single SMA groups except SMA-PLS3hom+ASO
as compared to WT or WT+ASO groups at P10 and P21 (Fig 3B and Table 1B). Upon pooling
the untreated or ASO-treated SMA or HET mice at either P10 or P21, a significant downregula-
tion of DPP4 as compared to WT or WT+ASO was observed (Fig 4B and S5B Table). DPP4
showed very similar reduction of 2.1-fold in pooled SMA at P10 and P21, and 1.9-fold and
1.5-fold in pooled HET mice at P10 and P21, respectively, compared to WT groups (Fig 4B and
S6 Table). These data suggest i) a strong correlation of SMA with reduced DPP4 levels, and ii) an
association with SMN levels since also HET mice present significantly reduced DPP4 levels.
SPP1 showed no significant differences between untreated genotypes at P10 (Table 1A),
excluding them from further analysis. Of the ASO-treated groups, no differences were found at
P21 (Table 1B). Instead, SPP1 was significantly reduced in two of the three SMA groups and in
ASO-treated HET mice compared to WT or WT+ASO groups at P10 (Fig 3C and Table 1B).
Instead, in untreated or treated pooled SMA or pooled HET groups, SPP1 was significantly
downregulated compared to WT or WT+ASO groups (Fig 4C and S5 Table). In WT+ASO
mice SPP1 was severely reduced by 2.11-fold from P10 to P21, while the difference between
pooled SMA and pooled HET groups even reversed (S5B and S6 Tables). Our data show i) a
correlation between SMA and SPP1 ii) a correlation between SMN concentrations and SPP1
especially at P10, and ii) a downregulation of SPP1 between P10 and P21 in WT and pooled
HET but not pooled SMA animals.
Effect of PLS3 and SMN-ASO on plasma biomarker in SMA mice
PLOS ONE | https://doi.org/10.1371/journal.pone.0203398 September 6, 2018 9 / 28
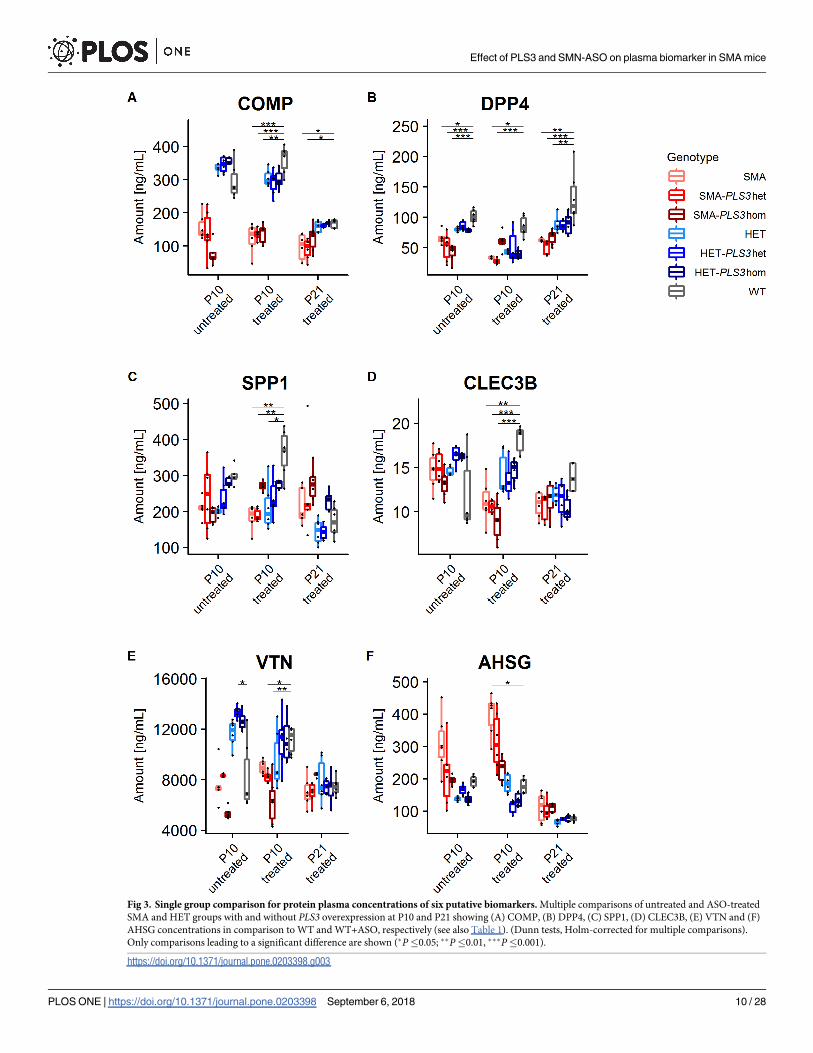
Fig 3. Single group comparison for protein plasma concentrations of six putative biomarkers. Multiple comparisons of untreated and ASO-treated
SMA and HET groups with and without PLS3 overexpression at P10 and P21 showing (A) COMP, (B) DPP4, (C) SPP1, (D) CLEC3B, (E) VTN and (F)
AHSG concentrations in comparison to WT and WT+ASO, respectively (see also Table 1). (Dunn tests, Holm-corrected for multiple comparisons).
Only comparisons leading to a significant difference are shown (�P�0.05; ��P�0.01, ���P�0.001).
https://doi.org/10.1371/journal.pone.0203398.g003
Effect of PLS3 and SMN-ASO on plasma biomarker in SMA mice
PLOS ONE | https://doi.org/10.1371/journal.pone.0203398 September 6, 2018 10 / 28

CLEC3B showed high level of variation in WT animals and did not pass the KW-test in
untreated mice at P10 and ASO-treated mice at P21 (Table 1A). Further analysis of ASO-treated
P10 groups showed that only SMA+ASO but not the HET+ASO groups were significantly dif-
ferent compared to WT+ASO (Fig 3D and Table 1B). Moreover, in pooled cohorts at P10, all
groups except SMA vs. WT were significantly different (Fig 4D and S5B Table). We therefore
conclude from our data, that CLEC3B is rather not a good and reliable biomarker for SMA.
VTN concentration similar to CLEC3B showed high level of variation and did not pass the
KW- test at P21 (Table 1A). In SMN-ASO treated groups, only SMA-PLS3het+ASO and SMA-
PLS3hom+ASO at P10 were significantly different compared to WT+ASO (Fig 3E and
Table 1B). Overall our data showed quite variable and inconsistent VTN levels and the signifi-
cant differences were not consistent even among the more powerful pooled groups (Fig 4E
and S5 and S6 Tables). Our data does not support that VTN is a reliable and good SMA bio-
marker in this mouse model.
AHSG concentrations, as CLEC3B and VTN, did not show a consistent trend and signifi-
cance, neither for SMA nor HET groups compared to WT groups (Table 1B). Pooled SMA
+ASO groups at both P10 and P21 showed significant differences compared to respective WT
+ASO group (Fig 4F and S5 Table). AHSG was the only analyte that showed a higher level in
pooled SMA in comparison to WT group at both time points (Fig 4F and S6 Table). As the
protein is involved in bone development, the upregulation might be due to delayed develop-
ment in severely affected SMA mice [49]. Our data suggest that AHSG is a moderately useful
SMA biomarker.
In summary, pooled SMA groups showed highly significant decreased levels for three bio-
markers, COMP, DPP4 and SPP1, at both time points. In contrast, CLEC3B, VTN and AHSG
do not appear as reliable biomarkers in this mouse model based on our data. Low-dose system-
ically administered SMN-ASO treatment as well as PLS3 overexpression had in general no
influence on these biomarkers.
Correlations of SMN levels with the concentration of the six biomarkers
since the SMN levels were massively downregulated in pooled SMA animals at P10, which fur-
ther increased at P21, and also pooled HET groups showed statistically significant decreased lev-
els compared to WT animals (S5B Table), we correlated the six biomarkers with the SMN
concentration and fitted a linear model into the correlation plots (Figs 5 and 6). In addition to
that, the P-values of the linear models, Pearson’s Correlation Coefficient r as well as Spearman’s
Correlation Coefficient ρ were calculated (S8 Table). Our data showed that all linear relations
were significant at P10. We found a good correlation (ρ> = 0.5) for COMP and a moderate
correlation (ρ> = 0.3) for DPP4, SPP1, CLEC3B and VTN. AHSG was recognized as the only
protein with an anti-correlated behaviour with SMN at both P10 and P21. At P21 we found sig-
nificant linear relations for all plasma proteins except for VTN. COMP and DPP4 were highly
correlated to SMN level (ρ> = 0.5) and CLEC3B moderately correlated with SMN (ρ> = 0.3).
Correlations of protein levels between the six biomarkers
To determine if the biomarkers belong to discrete mechanistic pathways or if they work inde-
pendently of each other, we used the previously introduced setup to correlate all six putative
biomarkers with each other. Spearman correlation coefficients ρ and P-values for all compari-
sons are given in S9 Table. At P10, the strongest correlation is found between COMP, VTN and
CLEC3B. Furthermore, good correlations (ρ> = 0.5) were found between COMP and DPP4 as
well as between SPP1 and DPP4. AHSG shows at P10 negative Spearman correlation coeffi-
cients. It shows weak negative correlations with COMP, VTN and CLEC3B. Interestingly, it
Effect of PLS3 and SMN-ASO on plasma biomarker in SMA mice
PLOS ONE | https://doi.org/10.1371/journal.pone.0203398 September 6, 2018 11 / 28

Fig 4. Protein plasma concentrations of six putative biomarkers in pooled groups. Multiple comparisons of unteated and ASO-treated pooled
SMA and HET groups at P10 and P21 showing (A) COMP, (B) DPP4, (C) SPP1, (D) CLEC3B, (E) VTN and (F) AHSG concentrations in
comparison to WT and WT+ASO, respectively (see also S5 and S6 Tables). (Dunn tests, Holm-corrected for multiple comparisons). Only
comparisons leading to a significant difference are shown (�P�0.05; ��P�0.01, ���P�0.001).
https://doi.org/10.1371/journal.pone.0203398.g004
Effect of PLS3 and SMN-ASO on plasma biomarker in SMA mice
PLOS ONE | https://doi.org/10.1371/journal.pone.0203398 September 6, 2018 12 / 28

shows the strongest positive correlation with SPP1 at P21. Also, a good correlation (ρ> = 0.5)
was found between COMP and DPP4 at P21. These data suggest i) that COMP, CLEC3B and
VTN may share similar mechanistic pathways, ii) DPP4, SPP1 are only weakly correlated with
Fig 5. Correlations of SMN plasma protein with the concentration of biomarkers at P10. (A) COMP, (B) DPP4, (C) SPP1, (D) CLEC3B, (E) VTN and (F) AHSG.
A linear model is fitted into the plots and the Spearman’s Correlation Coefficient ρ for each linear model is given in S8 Table.
https://doi.org/10.1371/journal.pone.0203398.g005
Effect of PLS3 and SMN-ASO on plasma biomarker in SMA mice
PLOS ONE | https://doi.org/10.1371/journal.pone.0203398 September 6, 2018 13 / 28

the other biomarkers and may work independently of each other and iii) AHSG is very weakly
anti-correlated with COMP, CLEC3B and VTN and completely independent of DPP4 and
SPP1 at P10.
Fig 6. Correlations of SMN plasma protein with the concentration biomarkers at P21. (A) COMP, (B) DPP4, (C) SPP1, (D) CLEC3B, (E) VTN and (F) AHSG. A
linear model is fitted into the plots and the Spearman’s Correlation Coefficient ρ for each linear model is given in S8 Table.
https://doi.org/10.1371/journal.pone.0203398.g006
Effect of PLS3 and SMN-ASO on plasma biomarker in SMA mice
PLOS ONE | https://doi.org/10.1371/journal.pone.0203398 September 6, 2018 14 / 28

Comparison of different pooled treatment groups and longitudinal
measures
Finally, since PLS3 overexpression or low-dose SMN-ASO treatment had no effect on SMN or
biomarker concentration, we pooled all animals for each of the three genotypes SMA, HET
and WT at P10 and those at P21 and compared the concentration of the biomarkers longitudi-
nally (Figs 2C and 7 and S10 Table). The group of all SMA animals showed no significant dif-
ference in SMN, COMP, DPP4, SPP1, CLEC3B and VTN but a significant decrease in AHSG
between P10 and P21. The group of all HET animals showed no significant difference in SMN,
but a significant decrease in COMP, SPP1, CLEC3B, VTN and AHSG and a significant inc-
rease in DPP4. The group of all WT animals showed no difference in SMN, COMP, DPP4 and
CLEC3B but a significant decrease in SPP1, VTN and AHSG. Thus, only SMN remained con-
stant in all three genotypes between P10 and P21. SPP1, VTN and AHSG showed a natural
decrease in HET and WT between P10 and P21, but no change in SMA. DPP4 showed a con-
stant expression in SMA and WT but an increase in HET. CLEC3B showed no difference in
WT and SMA but a decrease in HET.
No sex-specific differences in the concentration of putative biomarkers
No sex-specific differences in the expression of the proteins have been reported in the litera-
ture. In order to verify if the sex of the animals may have an effect on the concentration of
SMN and the six biomarkers, we again performed Bonferroni-corrected KW-tests followed by
Holm-corrected Dunn tests (S11 Table) but did not observe any significant differences in the
protein levels of all six biomarkers as well as SMN between female and male mice.
Discussion
Usefulness of biomarkers
Current SMA biomarkers will probably not replace the genetic diagnosis by established
methods. However, the SMN protein level in most severely affected tissues is not easily mea-
surable. Additionally, motor score tests, such as the modified Hammersmith functional
motor scale (MHFMS) can be inappropriate for children under 30 months [50] and may
not be comparable to motor score test that are specifically designed for young infants. For
these reasons, secure progression and treatment monitoring using blood biomarkers will be
of large benefit for SMA patients that are often fragile and immobile. Over the years, several
criteria for the evaluation of the predictive value of biomarkers were proposed. Biomarkers
should be easily and safely accessible, cost-effective, and significantly associated with the
measured value or outcome. According to Wang, biomarkers must show the ability to dis-
criminate affected individuals from those that are not or will not be affected by the disease
and must strengthen the correlation agreement between predicted and observed frequency
of the outcome according to a risk prediction model [51]. With reference to SMA, biomark-
ers should be able to discriminate the distinct types of disease severity (SMA type I to IV)
and reliably monitor the disease state. Since SMA is a slowly progressing disease, it is impor-
tant that biomarkers reliably mirror the progression or treatment success at each time point
in different unrelated cohorts. Another important aspect is the specificity of biomarkers. An
increasing amount of biomarker studies has been published in recent years. Several putative
biomarkers were linked to multiple diseases including various cancers and neurodegenera-
tive disorders [52, 53]. Therefore, comorbidity should be taken into account and the usabil-
ity of a putative biomarker should be critically evaluated with respect to a complex amount
Effect of PLS3 and SMN-ASO on plasma biomarker in SMA mice
PLOS ONE | https://doi.org/10.1371/journal.pone.0203398 September 6, 2018 15 / 28

Fig 7. Longitudinal comparisons of P10 with P21 of pooled protein plasma concentrations of six putative biomarkers. Pooled untreated and
SMN-ASO treated groups at P10 were longitudinally compared with pooled P21-treated groups for each genotype. Diagrams show (A) COMP,
(B) DPP4, (C) SPP1, (D) CLEC3B, (E) VTN and (F) AHSG (see also S10 Table). (Dunn tests, Holm-corrected for multiple comparisons). Only
comparisons leading to a significant difference are shown (�P�0.05; ��P�0.01, ���P�0.001).
https://doi.org/10.1371/journal.pone.0203398.g007
Effect of PLS3 and SMN-ASO on plasma biomarker in SMA mice
PLOS ONE | https://doi.org/10.1371/journal.pone.0203398 September 6, 2018 16 / 28

of different factors. Hereby, we will discuss our data in scope of this framework and com-
pare it to recently published SMA biomarker studies.
Effects of sex, PLS3 overexpression and SMN-ASO treatment on putative
SMA biomarkers
A schematic summary of the main findings of our study can be found in Fig 8. In line with
other biomarker studies, we did not find significant sex-specific differences in the blood con-
centrations of SMN [29] or the other six putative plasma biomarkers.
Equally, whether PLS3 overexpression has been achieved genetically from a transgene or
from AAV9-expressing PLS3 cDNA, it led to improved motor neuron axon outgrowth and
NMJ functionality, extension of survival and motoric ability especially in low-dose SMN-ASO
treated severe SMA mouse models [18, 19, 21, 54]. Nonetheless, PLS3 overexpression did not
influence blood SMN concentration or the six plasma biomarkers tested in this study. This
goes well in line with the fact that PLS3 is normally not expressed in the haematopoietic system
but in all solid tissues [55]. PLS3 expression in blood can be found in only 5% of the control
population and in a subset of asymptomatic SMN1-deleted individuals, where it acts as a pro-
tective modifier [13, 56].
Endogenous PLS3/ Pls3 is an X-linked gene, while the human PLS3 transgene in our mouse
model is inserted in the Rosa26 locus on chromosome 6 [18]. Endogenous murine Pls3 is not
or at very low levels expressed in blood while no difference in human PLS3 transgene expres-
sion was found among sexes (S1 Fig). Based on our data, PLS3 might work in other indepen-
dent pathways, which might not be related to the regulation and release of these six putative
biomarkers.
The SMN protein is an obvious choice for the use as a biomarker, as the copy number of
SMN2 is inversely correlated with the disease severity [56]. However, the concentration of
SMN in the hematopoietic system may not reflect the abundance in other tissues [57, 58]. The
plasma protein concentration, number of transcripts and SMN2 copy number was analysed as
part of the BforSMA study. A correlation between SMN protein levels and disease severity was
found. However, SMN and MHFMS were weakly correlated [29].
In former studies we have shown that low-dose SMN-ASO treatment doubles the mean sur-
vival in Taiwanese SMA mouse models [19]. Nonetheless, the low-dose subcutaneous
Fig 8. Schematic overview of results for SMN and the six biomarkers.
https://doi.org/10.1371/journal.pone.0203398.g008
Effect of PLS3 and SMN-ASO on plasma biomarker in SMA mice
PLOS ONE | https://doi.org/10.1371/journal.pone.0203398 September 6, 2018 17 / 28

SMN-ASO treatment did not affect the concentration of SMN or the other six proteins in the
plasma. One explanation might be that the ASOs do not distribute equally in vivo. After injec-
tion in the blood flow, they accumulate in the liver, kidney, adipocytes, bone marrow and
spleen, while haematopoietic cells show a low response to ASOs [59, 60]. Thus, the low-SMN-
dose may counteract some of the failures in the development of the liver in severe SMA mouse
models and explain the doubling in survival [61]. Additionally, SMN is an intracellular protein
and it is highly likely that the origin of the SMN in blood is from erythrocytes, lymphocytes or
platelet cells that were lysed during the collection of plasma. Therefore, the amount of SMN in
the plasma might not reflect the amount of SMN in the liver or in the motor neurons explain-
ing the increase in survival. Taken together, the treatment with low-dose SMN-ASOs and the
PLS3 overexpression does not modulate the concentration of the analysed plasma proteins.
Abundancy of the SMA biomarkers over time and comparison to other
studies
There are three studies, which have analysed putative SMA plasma biomarkers. In the first
study, plasma protein concentrations in 108 children with genetically confirmed SMA have
been analysed and the results were correlated with MHFMS scores [30]. In the second study
plasma concentrations in a cohort of very young infants (age < six months) have been ana-
lysed. They used two different motor function tests for young infants, the Test for Infant
Motor Performance Items (TIMPSI) and Children’s Hospital of Philadelphia Infant Test of
Neuromuscular Disorders (CHOP-INTEND) [31]. In the most recent study, the levels of ten
putative biomarkers have been measured at three different time points between SMN-ASO-
treated SMAΔ7 and HET mice [32] (summarised in S12, S13 and S14 Tables). There are strong
disagreements about the abundancy of putative SMA biomarkers over time between the vari-
ous studies. A complete overview of the different findings is given in S14 Table. COMP showed
a positive correlation with SMN at both time points in our study (S8 Table), while it has been
stated as non-responsive to SMN in the SMNΔ7 mouse model [32]. However, COMP has been
positively correlated to all three motor scores [30, 31]. DPP4 had a positive correlation with
SMN at both time points (Figs 5 and 6 and S8 Table). It has been found to be correlated with
MHFMS and TIMPSI [30, 31]. It is not correlated with the age of infants and was very stable
over time in the current study [31]. However, in SMNΔ7 mice DPP4 was anti-correlated with
SMN at P12, while at later time points there have been no significant correlations with SMN
[32]. For SPP1, there are contrary data. It is negatively correlated with the age of infants and
with the MHFMS [30, 31]. In the current study, there is a positive correlation with SMN at P10
and a negative correlation at P21. In the SMNΔ7 mice it is the opposite [32]. A correlation of
VTN with SMN was found only at P10. In SMNΔ7 mice the results have been also inconsistent
with a negative correlation at P30 and positive correlations at P12 and P30 [32]. VTN has been
positively correlated with MHFMS [30]. AHSG is the only biomarker in our study with inc-
reased concentration in severely affected mice. The concentration was anti-correlated to SMN
at both time points. In the SMNΔ7 model, AHSG did not correlate with SMN at any time
point [32]. AHSG has been positively correlated with MHFMS and no correlation with age
and motor scores in young infants has been found [30, 31]. Interestingly, AHSG is an impor-
tant non-collagenous protein in bones involves in endochondral ossification [49]. It regulates
bone remodelling and calcium metabolism and AHSG-deficient mice showed a shortened
femoral bone phenotype [49]. The involvement of AHSG in bone development may explain
the increased protein concentration in severely affected SMA animals. For CLEC3B we found
a moderate correlation with SMN at both time points. Additionally, it is correlated with
TIMPSI [31]. In SMAΔ7 mice CLEC3B has been significantly correlated with SMN only at the
Effect of PLS3 and SMN-ASO on plasma biomarker in SMA mice
PLOS ONE | https://doi.org/10.1371/journal.pone.0203398 September 6, 2018 18 / 28

earliest time point [32]. One explanation for the strong disagreements between the studies
might be that several different model systems and measure values were used. In addition to
that, the time points and number of measurement were different between the studies. Taken
together, SMN, COMP and DPP4 showed the best performance as SMA biomarkers over
time.
Specificity versus comorbidity
COMP, SPP1 and CLEC3B are associated with human disorders that affect bone and connec-
tive tissue. COMP belongs to the Thrombospondin protein family [62] and is mainly located
in cartilage, bone tissue and other connective tissues [63–65]. COMP mutations are associated
with pseudoachondroplasia [66, 67]. High serum levels are associated with lower risk of myo-
cardial infarction [68]. COMP was suggested as biomarker for disease progression of rheuma-
toid arthritis, osteoarthritis [69, 70] and liver fibrosis [71], and early cartilage lesions in the
knee [72]. Increased serum concentrations were found in patients with rapid hip joint destruc-
tion [73]. The serum level of COMP was lower in children with idiopathic scoliosis and high
COMP was modestly correlated with high growth velocity [74]. The correlation of COMP
with disease severity might be explained by the immobility of severely affected animals. In a
recent study, COMP was used as a biomarker for knee osteoarthritis. In that study, 42 women
with osteoarthritis in different stages were treated with a well-rounded exercise program over
a period of 12 weeks leading to a significant increase of plasma COMP [75]. Paediatric SMA
patients are reported to have a low bone mineral density (BMD) and femur fractures are highly
prevalent in all SMA subtypes [76, 77]. SPP1 is a non-collagenous matrix protein that helps
osteoclasts to migrate and attach to the mineral matrix of bone surfaces [78]. SPP1 mRNA was
downregulated in bone marrow-derived stromal/pre-osteoblast cells of a Taiwanese SMA
mouse model compared to the controls [79]. In line with that, we have found that plasma levels
of SPP1 were decreased in SMA mice and HET mice at P10. SPP1 is produced by a variety of
cell types and is associated not only with bone remodelling but also with immune regulation,
inflammation and vascularisation. Thus, expression of SPP1 is correlated with tumorigenesis,
progression and metastasis of several malignancies [80]. Amongst others, misregulation in the
level of SPP1 has been reported as possible biomarker for Duchenne Muscular Dystrophy and
cardiovascular events [81, 82].
CLEC3B is induced during the mineralisation phase of osteogenesis [83]. It was suggested
as a prognostic biomarker for different types of cancer [52, 53].
At P10, COMP, VTN and CLEC3B showed the highest correlation to each other (see S9
Table). According to the Reactome data base (https://reactome.org/), all three proteins are
localised in the extracellular region [84]. COMP and VTN interact with several Collagen types
and are involved in the extracellular matrix organisation. This may indicate that they are
affected by the same mechanistic pathways.
DPP4 and AHSG were both suggested as biomarkers for non-alcoholic fatty liver disease
[85, 86]. AHSG is mainly secreted from the liver and inhibits insulin receptor tyrosine kinase
[87]. The gene was also suggested as a biomarker for Alzheimer’s disease [88], sepsis [89], car-
diovascular mortality and stroke [90, 91].
Taken together, all the putative SMA biomarkers, except for SMN, are linked to several
other types of diseases. Additionally, there are differences in the abundancy of plasma concen-
trations over time. This suggests that a reliable measurement can only be achieved by using a
panel of multiple plasma proteins as biomarkers at the same time. This raises the question how
many biomarkers are necessary to ensure an accurate measurement. According to a review by
Wang the number of necessary biomarkers depends on the degree of correlation between
Effect of PLS3 and SMN-ASO on plasma biomarker in SMA mice
PLOS ONE | https://doi.org/10.1371/journal.pone.0203398 September 6, 2018 19 / 28

them [51]. If two biomarkers are part of the same pathway, the informative value is very low.
Adding more biomarkers from that pathway will not increase the predictive power substan-
tially [51]. However, a combination of several uncorrelated proteins could be used as useful
biomarkers for SMA. This suggests that a deeper analysis of the pathways that are related to
the putative SMA biomarkers would be beneficial for further biomarker studies. Also, it would
be beneficial to analyse more putative biomarkers from the BforSMA pilot study, which identi-
fied 97 plasma proteins, 59 plasma metabolites and 44 urine metabolites that correlated with
MHFMS scores [29, 30].
Overall study limitations
The most affected cell type in the SMA condition are motor neurons, which are not accessible
for protein measurement in patients. Easy accessible tissues for multiple testing in a patient are
blood, saliva or urine. Other accessible tissues but ethically unjustifiable for multiple testing
are spinal-cord fluid, muscle or skin biopsy. Measurement of protein concentrations in blood
is cost-effectively, safe and easily performable, which is important for treatment monitoring in
a clinical setup as well as in biomedical research studies. However, the SMN protein concentra-
tion in blood does not necessarily reflect the level of SMN protein in motor neurons. In our
study, there were significant differences in the amount of SMN protein between the severely
affected SMA mouse groups and the WT, however, the protein levels between HET mice and
the WT were largely overlapping. This result is in line with multiple studies, which have shown
that SMN mRNA and protein concentrations in blood cannot be used to measure the severity
of SMA [29, 34, 92, 93].
One reason for overlap between sample cohorts may be a relatively high degree of mean
variance, which we tried to minimise by excluding outliers using Tukey’s method. However,
exclusion of data points reduces the power of the statistical analysis. Instead pooling of data
can bypass the loss of statistical power. However, this procedure offers some disadvantages:
Pooling artificially reduces the observed P-values. Additionally, information about individual
biological variation can get lost. We performed statistical tests to show that the influence of the
PLS3 transgene on the protein levels in the intermediate mouse model had no effect on the
concentrations of the biomarkers, before we pooled the data. Pooling of the samples allowed
us to clearly discriminate SMA, HET and WT groups at both P10 and P21.
According to our data, upregulation of PLS3 had no influence on the levels of SMN or the
six biomarkers in blood of untreated or SMN-ASO treated animals. While endogenous Pls3/PLS3 is not expressed in blood of mice and 95% of humans, we tested here the potential impact
of the PLS3 transgene, ubiquitously expressed under the chicken beta promotor [18] and
which would resemble the situation in asymptomatic SMN1-deleted individuals [13].
One remaining question is about the discordant longitudinal behaviour of the biomarkers
in our model system as well as in other systems. This is especially important as we found that
the protein level of SMN was stable over time. The intermediate SMN mouse model is an
excellent model to study the rescuing effect of PLS3 overexpression. However, in a clinical sce-
nario, patients are treated with a higher dosage of SMN-ASOs, which could have a stronger
impact in the protein levels of biomarkers. Further studies in human study cohorts are needed
to evaluate the optimal time windows for biomarker analyses to optimise treatment control.
Conclusions
In summary, beside SMN, COMP, DPP4 and to some extend SPP1 were identified as the most
useful and significantly changed biomarkers in our systemically injected low-dose SMA mouse
model. We found significant differences in SMA mice compared to the controls at both time
Effect of PLS3 and SMN-ASO on plasma biomarker in SMA mice
PLOS ONE | https://doi.org/10.1371/journal.pone.0203398 September 6, 2018 20 / 28

points, P10 and P21. However, all tested plasma proteins were non-responsive to the low-dose
SMN-ASO treatment or overexpression of PLS3 transgene, latter supporting the conclusion
that PLS3 acts independent of SMN. There are disagreements about the correlation between
the biomarkers and SMN between several studies, which might be explained by the use of dif-
ferent model organisms and the time points used in the various studies. Further studies are
needed to evaluate these biomarkers in large cohorts of patients for final clinical application.
Supporting information
S1 Table. Scoring system for the evaluation of animal burden.
(DOCX)
S2 Table. Raw data of the plasma concentrations of SMN and the six plasma proteins at
both time points. Values that were identifies as outliers using the method by Tukey are
marked by red shading.
(DOCX)
S3 Table. Influence of PLS3 on the levels of SMA putative biomarkers. Holm corrected
Dunn tests identified no significant differences except for DPP4 (SMA-PLS3het–SMA-
PLS3hom). The results of the corresponding KW-tests are shown in Table 1A. Asterisks mark
significant differences (�P�0.05).
(DOCX)
S4 Table. Influence of the SMN-ASO on the levels of SMN and the putative biomarkers.
(A) P-values of a priori Kruskal-Wallis tests (Bonferroni corrected for multiple comparisons)
and (B) corresponding post-hoc Dunn tests (Holm corrected for multiple comparisons) com-
paring untreated and ASO-treated animals of all seven genotypes at P10 showing that the
SMN-ASO treatment has in general no effect on concentrations of SMN and the six biomark-
ers. Asterisks mark significant differences (�P�0.05; ��P�0.01; ���P�0.001).
(DOCX)
S5 Table. Comparison of protein levels of pooled genotypes. (A) P-values of a priori Krus-
kal-Wallis tests (Bonferroni corrected for multiple comparisons) and (B) corresponding post-hoc Dunn tests (Holm corrected for multiple comparisons) comparing untreated and
SMN-ASO treated pooled groups at P10 and P21. Asterisks mark significant differences (�P�0.05; ��P�0.01; ���P�0.001). Fold changes are given in S6 Table.
(DOCX)
S6 Table. Fold change between pooled SMA and pooled HET groups as compared to WT
(set to 1) at P10 and P21.
(DOCX)
S7 Table. Longitudinal comparison of protein levels of SMN-ASO treated genotypes. (A)
P-values of a priori Kruskal-Wallis tests (Bonferroni corrected for multiple comparisons) and
(B) corresponding post-hoc Dunn tests (Holm corrected for multiple comparisons) for longitu-
dinal comparisons of ASO treated pooled groups. Asterisks mark significant differences (�P�0.05; ��P�0.01; ���P�0.001).
(DOCX)
S8 Table. Regression and correlation analysis. Correlation of whole blood SMN and plasma
analyte levels. P-values from a linear model, Pearson’s Correlation Coefficient r and Spear-
man’s Correlation Coefficient ρ.
(DOCX)
Effect of PLS3 and SMN-ASO on plasma biomarker in SMA mice
PLOS ONE | https://doi.org/10.1371/journal.pone.0203398 September 6, 2018 21 / 28

S9 Table. Regression and correlation analysis between each of the six biomarkers. Correla-
tion between each biomarker with all other biomarkers. P-values from a linear model and
Spearman’s Correlation Coefficient ρ.
(DOCX)
S10 Table. Longitudinal comparison of protein levels of genotypes. (A) P-values of a prioriKruskal-Wallis tests (Bonferroni corrected for multiple comparisons) and (B) corresponding
post-hoc Dunn tests (Holm corrected for multiple comparisons) for longitudinal comparisons
of pooled groups. Untreated and SMN-ASO treated genotypes were pooled at P10. Asterisks
mark significant differences (�P�0.05; ��P�0.01; ���P�0.001).
(DOCX)
S11 Table. Comparison of the protein levels between female and male mice of the same
genotype. (A) P-values of a priori Kruskal-Wallis tests (Bonferroni corrected for multiple com-
parisons) and (B) corresponding post-hoc Dunn tests (Holm corrected for multiple compari-
sons) comparing the concentration of SMN and the six putative biomarkers between male and
female animals of each genotype and treatment group showing that there were no sex-specific
differences at all. Asterisks mark significant differences (�P�0.05; ��P�0.01; ���P�0.001).
(DOCX)
S12 Table. Comparison of results from Arnold et al., 2016 and Finkel et al., 2012.
(DOCX)
S13 Table. Results from Kolb et al., 2016.
(DOCX)
S14 Table. Comparison of results from Kolb et al., 2016, Arnold et al., 2016, Finkel et al.,
2012 and Strathmann et al., 2018.
(DOCX)
S1 Fig. Expression of Pls3/PLS3 in different tissues. (A) Endogenous Pls3 is not expressed in
blood but present in brain and muscle tissues. (B) The PLS3 transgene is expressed in blood of
transgenic mice in a low amount. There is no sex-specific difference in the expression between
male and female mice (N = 3 for each sex).
(TIF)
Acknowledgments
We are grateful to Andrea Hoffmann for technical assistant in preparing biological samples.
Author Contributions
Conceptualization: Eike A. Strathmann, Miriam Peters, Brunhilde Wirth.
Data curation: Brunhilde Wirth.
Formal analysis: Eike A. Strathmann, Phillip G. Zaworski.
Funding acquisition: Brunhilde Wirth.
Methodology: Miriam Peters, Seyyedmohsen Hosseinibarkooie, Phillip G. Zaworski, Michael
Nothnagel.
Project administration: Karen S. Chen, Brunhilde Wirth.
Resources: Frank W. Rigo, C. Frank Bennett, Phillip G. Zaworski, Karen S. Chen.
Effect of PLS3 and SMN-ASO on plasma biomarker in SMA mice
PLOS ONE | https://doi.org/10.1371/journal.pone.0203398 September 6, 2018 22 / 28

Supervision: Michael Nothnagel, Brunhilde Wirth.
Writing – original draft: Eike A. Strathmann, Brunhilde Wirth.
Writing – review & editing: Miriam Peters, Seyyedmohsen Hosseinibarkooie, Frank W. Rigo,
C. Frank Bennett, Phillip G. Zaworski, Karen S. Chen, Michael Nothnagel.
References1. Finkel RS, Mercuri E, Meyer OH, Simonds AK, Schroth MK, Graham RJ, et al. Diagnosis and manage-
ment of spinal muscular atrophy: Part 2: Pulmonary and acute care; medications, supplements and
immunizations; other organ systems; and ethics. Neuromuscul Disord. 2018; 28(3):197–207. https://
doi.org/10.1016/j.nmd.2017.11.004 PMID: 29305137.
2. Mercuri E, Finkel RS, Muntoni F, Wirth B, Montes J, Main M, et al. Diagnosis and management of spinal
muscular atrophy: Part 1: Recommendations for diagnosis, rehabilitation, orthopedic and nutritional
care. Neuromuscul Disord. 2018; 28(2):103–15. https://doi.org/10.1016/j.nmd.2017.11.005 PMID:
29290580.
3. Crawford TO, Pardo CA. The neurobiology of childhood spinal muscular atrophy. Neurobiol Dis. 1996; 3
(2):97–110. https://doi.org/10.1006/nbdi.1996.0010 PMID: 9173917.
4. Sleigh JN, Gillingwater TH, Talbot K. The contribution of mouse models to understanding the pathogen-
esis of spinal muscular atrophy. Dis Model Mech. 2011; 4(4):457–67. https://doi.org/10.1242/dmm.
007245 PMID: 21708901.
5. Kashima T, Manley JL. A negative element in SMN2 exon 7 inhibits splicing in spinal muscular atrophy.
Nat Genet. 2003; 34(4):460–3. https://doi.org/10.1038/ng1207 PMID: 12833158.
6. Lorson CL, Hahnen E, Androphy EJ, Wirth B. A single nucleotide in the SMN gene regulates splicing
and is responsible for spinal muscular atrophy. Proc Natl Acad Sci U S A. 1999; 96(11):6307–11. PMID:
10339583.
7. Cartegni L, Krainer AR. Disruption of an SF2/ASF-dependent exonic splicing enhancer in SMN2 causes
spinal muscular atrophy in the absence of SMN1. Nat Genet. 2002; 30(4):377–84. https://doi.org/10.
1038/ng854 PMID: 11925564.
8. Lorson CL, Strasswimmer J, Yao JM, Baleja JD, Hahnen E, Wirth B, et al. SMN oligomerization defect
correlates with spinal muscular atrophy severity. Nat Genet. 1998; 19(1):63–6. https://doi.org/10.1038/
ng0598-63 PMID: 9590291.
9. Helmken C, Hofmann Y, Schoenen F, Oprea G, Raschke H, Rudnik-Schoneborn S, et al. Evidence for
a modifying pathway in SMA discordant families: reduced SMN level decreases the amount of its inter-
acting partners and Htra2-beta1. Hum Genet. 2003; 114(1):11–21. https://doi.org/10.1007/s00439-003-
1025-2 PMID: 14520560.
10. Feldkotter M, Schwarzer V, Wirth R, Wienker TF, Wirth B. Quantitative analyses of SMN1 and SMN2
based on real-time lightCycler PCR: fast and highly reliable carrier testing and prediction of severity of
spinal muscular atrophy. Am J Hum Genet. 2002; 70(2):358–68. https://doi.org/10.1086/338627 PMID:
11791208.
11. Wirth B, Brichta L, Schrank B, Lochmuller H, Blick S, Baasner A, et al. Mildly affected patients with spi-
nal muscular atrophy are partially protected by an increased SMN2 copy number. Hum Genet. 2006;
119(4):422–8. https://doi.org/10.1007/s00439-006-0156-7 PMID: 16508748.
12. Lunn MR, Wang CH. Spinal muscular atrophy. Lancet. 2008; 371(9630):2120–33. https://doi.org/10.
1016/S0140-6736(08)60921-6 PMID: 18572081.
13. Oprea GE, Krober S, McWhorter ML, Rossoll W, Muller S, Krawczak M, et al. Plastin 3 is a protective
modifier of autosomal recessive spinal muscular atrophy. Science. 2008; 320(5875):524–7. https://doi.
org/10.1126/science.1155085 PMID: 18440926; PubMed Central PMCID: PMC4908855.
14. Riessland M, Kaczmarek A, Schneider S, Swoboda KJ, Lohr H, Bradler C, et al. Neurocalcin Delta Sup-
pression Protects against Spinal Muscular Atrophy in Humans and across Species by Restoring
Impaired Endocytosis. Am J Hum Genet. 2017; 100(2):297–315. https://doi.org/10.1016/j.ajhg.2017.
01.005 PMID: 28132687; PubMed Central PMCID: PMC5294679.
15. Heesen L, Peitz M, Torres-Benito L, Holker I, Hupperich K, Dobrindt K, et al. Plastin 3 is upregulated in
iPSC-derived motoneurons from asymptomatic SMN1-deleted individuals. Cellular and molecular life
sciences: CMLS. 2016; 73(10):2089–104. https://doi.org/10.1007/s00018-015-2084-y PMID:
26573968.
16. Delanote V, Van Impe K, De Corte V, Bruyneel E, Vetter G, Boucherie C, et al. Molecular basis for dis-
similar nuclear trafficking of the actin-bundling protein isoforms T- and L-plastin. Traffic. 2005; 6
(4):335–45. https://doi.org/10.1111/j.1600-0854.2005.00276.x PMID: 15752138.
Effect of PLS3 and SMN-ASO on plasma biomarker in SMA mice
PLOS ONE | https://doi.org/10.1371/journal.pone.0203398 September 6, 2018 23 / 28

17. Dimitriadi M, Sleigh JN, Walker A, Chang HC, Sen A, Kalloo G, et al. Conserved genes act as modifiers
of invertebrate SMN loss of function defects. PLoS Genet. 2010; 6(10):e1001172. https://doi.org/10.
1371/journal.pgen.1001172 PMID: 21124729.
18. Ackermann B, Krober S, Torres-Benito L, Borgmann A, Peters M, Hosseini Barkooie SM, et al. Plastin 3
ameliorates spinal muscular atrophy via delayed axon pruning and improves neuromuscular junction
functionality. Hum Mol Genet. 2013; 22(7):1328–47. https://doi.org/10.1093/hmg/dds540 PMID:
23263861.
19. Hosseinibarkooie S, Peters M, Torres-Benito L, Rastetter RH, Hupperich K, Hoffmann A, et al. The
Power of Human Protective Modifiers: PLS3 and CORO1C Unravel Impaired Endocytosis in Spinal
Muscular Atrophy and Rescue SMA Phenotype. Am J Hum Genet. 2016; 99(3):647–65. https://doi.org/
10.1016/j.ajhg.2016.07.014 PMID: 27499521; PubMed Central PMCID: PMC5011078.
20. Hao le T, Wolman M, Granato M, Beattie CE. Survival motor neuron affects plastin 3 protein levels lead-
ing to motor defects. J Neurosci. 2012; 32(15):5074–84. https://doi.org/10.1523/JNEUROSCI.5808-11.
2012 PMID: 22496553; PubMed Central PMCID: PMCPMC3355766.
21. Kaifer KA, Villalon E, Osman EY, Glascock JJ, Arnold LL, Cornelison DD, et al. Plastin-3 extends sur-
vival and reduces severity in mouse models of spinal muscular atrophy. JCI Insight. 2017; 2(5):e89970.
https://doi.org/10.1172/jci.insight.89970 PMID: 28289706; PubMed Central PMCID: PMCPMC5333955
exists.
22. Dimitriadi M, Derdowski A, Kalloo G, Maginnis MS, O’Hern P, Bliska B, et al. Decreased function of sur-
vival motor neuron protein impairs endocytic pathways. Proc Natl Acad Sci U S A. 2016; 113(30):
E4377–86. https://doi.org/10.1073/pnas.1600015113 PMID: 27402754; PubMed Central PMCID:
PMCPMC4968725.
23. Janzen E, Mendoza-Ferreira N, Hosseinibarkooie S, Schneider S, Hupperich K, Tschanz T, et al. CHP1
reduction ameliorates spinal muscular atrophy pathology by restoring calcineurin activity and endocyto-
sis. Brain. 2018. https://doi.org/10.1093/brain/awy167 PMID: 29961886
24. Scoto M, Finkel RS, Mercuri E, Muntoni F. Therapeutic approaches for spinal muscular atrophy (SMA).
Gene Ther. 2017; 24(9):514–9. https://doi.org/10.1038/gt.2017.45 PMID: 28561813.
25. Rigo F, Chun SJ, Norris DA, Hung G, Lee S, Matson J, et al. Pharmacology of a central nervous system
delivered 2’-O-methoxyethyl-modified survival of motor neuron splicing oligonucleotide in mice and
non-human primates. J Pharmacol Exp Ther. 2014. https://doi.org/10.1124/jpet.113.212407 PMID:
24784568.
26. Finkel RS, Mercuri E, Darras BT, Connolly AM, Kuntz NL, Kirschner J, et al. Nusinersen versus Sham
Control in Infantile-Onset Spinal Muscular Atrophy. N Engl J Med. 2017; 377(18):1723–32. https://doi.
org/10.1056/NEJMoa1702752 PMID: 29091570.
27. Mendell JR, Al-Zaidy S, Shell R, Arnold WD, Rodino-Klapac LR, Prior TW, et al. Single-Dose Gene-
Replacement Therapy for Spinal Muscular Atrophy. N Engl J Med. 2017; 377(18):1713–22. https://doi.
org/10.1056/NEJMoa1706198 PMID: 29091557.
28. Arnold WD, Porensky PN, McGovern VL, Iyer CC, Duque S, Li X, et al. Electrophysiological Biomarkers
in Spinal Muscular Atrophy: Preclinical Proof of Concept. Ann Clin Transl Neurol. 2014; 1(1):34–44.
https://doi.org/10.1002/acn3.23 PMID: 24511555.
29. Crawford TO, Paushkin SV, Kobayashi DT, Forrest SJ, Joyce CL, Finkel RS, et al. Evaluation of SMN
protein, transcript, and copy number in the biomarkers for spinal muscular atrophy (BforSMA) clinical
study. PLoS One. 2012; 7(4):e33572. https://doi.org/10.1371/journal.pone.0033572 PMID: 22558076.
30. Finkel RS, Crawford TO, Swoboda KJ, Kaufmann P, Juhasz P, Li X, et al. Candidate proteins, metabo-
lites and transcripts in the Biomarkers for Spinal Muscular Atrophy (BforSMA) clinical study. PLoS One.
2012; 7(4):e35462. https://doi.org/10.1371/journal.pone.0035462 PMID: 22558154.
31. Kolb SJ, Coffey CS, Yankey JW, Krosschell K, Arnold WD, Rutkove SB, et al. Baseline results of the
NeuroNEXT spinal muscular atrophy infant biomarker study. Ann Clin Transl Neurol. 2016; 3(2):132–
45. https://doi.org/10.1002/acn3.283 PMID: 26900585; PubMed Central PMCID: PMCPMC4748311.
32. Arnold WD, Duque S, Iyer CC, Zaworski P, McGovern VL, Taylor SJ, et al. Normalization of Patient-
Identified Plasma Biomarkers in SMNDelta7 Mice following Postnatal SMN Restoration. PLoS One.
2016; 11(12):e0167077. https://doi.org/10.1371/journal.pone.0167077 PMID: 27907033; PubMed Cen-
tral PMCID: PMCPMC5132001 Spinal Muscular Atrophy Foundation. KVH and DK were employees of
the Spinal Muscular Atrophy Foundation at the time of this research. This does not alter the authors’
adherence to PLOS ONE policies on sharing data and materials.
33. Bonati U, Holiga S, Hellbach N, Risterucci C, Bergauer T, Tang W, et al. Longitudinal characterization
of biomarkers for spinal muscular atrophy. Ann Clin Transl Neurol. 2017; 4(5):292–304. https://doi.org/
10.1002/acn3.406 PMID: 28491897; PubMed Central PMCID: PMCPMC5420809.
34. Czech C, Tang W, Bugawan T, Mano C, Horn C, Iglesias VA, et al. Biomarker for Spinal Muscular Atro-
phy: Expression of SMN in Peripheral Blood of SMA Patients and Healthy Controls. PLoS One. 2015;
Effect of PLS3 and SMN-ASO on plasma biomarker in SMA mice
PLOS ONE | https://doi.org/10.1371/journal.pone.0203398 September 6, 2018 24 / 28

10(10):e0139950. https://doi.org/10.1371/journal.pone.0139950 PMID: 26468953; PubMed Central
PMCID: PMCPMC4607439.
35. Wadman RI, Stam M, Jansen MD, van der Weegen Y, Wijngaarde CA, Harschnitz O, et al. A Compara-
tive Study of SMN Protein and mRNA in Blood and Fibroblasts in Patients with Spinal Muscular Atrophy
and Healthy Controls. PLoS One. 2016; 11(11):e0167087. https://doi.org/10.1371/journal.pone.
0167087 PMID: 27893852; PubMed Central PMCID: PMCPMC5125671 the Prinses Beatrix Spier-
fonds, Thierry Latran Foundation, Biogen Idec and Cytokinetics; received an educational grant from
Baxter International Inc.; serves on the editorial board of Amyotrophic Lateral Sclerosis and the Journal
of Neurology, Neurosurgery and Psychiatry; and receives research support from the Prinses Beatrix
Fonds, Netherlands ALS Foundation, The European Community’s Health Seventh Framework Pro-
gramme (grant agreement n degrees 259867), The Netherlands Organization for Health Research and
Development (Vici Scheme, JPND (SOPHIA, STRENGTH)). W. L. van der Pol receives research sup-
port from the Prinses Beatrix Spierfonds, Netherlands ALS Foundation and Stichting Spieren voor Spie-
ren. This does not alter our adherence to PLOS ONE policies on sharing data and materials. All other
authors have declared that no competing interests exist.
36. Viswambharan V, Thanseem I, Vasu MM, Poovathinal SA, Anitha A. miRNAs as biomarkers of neuro-
degenerative disorders. Biomark Med. 2017; 11(2):151–67. https://doi.org/10.2217/bmm-2016-0242
PMID: 28125293.
37. Iyer CC, Wang X, Renusch SR, Duque SI, Wehr AM, Mo XM, et al. SMN Blood Levels in a Porcine
Model of Spinal Muscular Atrophy. J Neuromuscul Dis. 2017; 4(1):59–66. https://doi.org/10.3233/JND-
170209 PMID: 28269795; PubMed Central PMCID: PMCPMC5531281.
38. Kobayashi DT, Shi J, Stephen L, Ballard KL, Dewey R, Mapes J, et al. SMA-MAP: a plasma protein
panel for spinal muscular atrophy. PLoS One. 2013; 8(4):e60113. https://doi.org/10.1371/journal.pone.
0060113 PMID: 23565191; PubMed Central PMCID: PMCPMC3615018.
39. McGovern VL, Massoni-Laporte A, Wang XY, Le TT, Le HT, Beattie CE, et al. Plastin 3 Expression
Does Not Modify Spinal Muscular Atrophy Severity in the Delta 7 SMA Mouse. PLoS One. 2015; 10(7).
doi: ARTN e0132364 https://doi.org/10.1371/journal.pone.0132364 PubMed PMID:
WOS:000358154400113. PMID: 26134627
40. Hsieh-Li HM, Chang JG, Jong YJ, Wu MH, Wang NM, Tsai CH, et al. A mouse model for spinal muscu-
lar atrophy. Nat Genet. 2000; 24(1):66–70. https://doi.org/10.1038/71709 PMID: 10615130.
41. Riessland M, Ackermann B, Forster A, Jakubik M, Hauke J, Garbes L, et al. SAHA ameliorates the
SMA phenotype in two mouse models for spinal muscular atrophy. Hum Mol Genet. 2010; 19(8):1492–
506. https://doi.org/10.1093/hmg/ddq023 PMID: 20097677.
42. Hua Y, Sahashi K, Rigo F, Hung G, Horev G, Bennett CF, et al. Peripheral SMN restoration is essential
for long-term rescue of a severe spinal muscular atrophy mouse model. Nature. 2011; 478(7367):123–
6. https://doi.org/10.1038/nature10485 PMID: 21979052.
43. Zaworski P, von Herrmann KM, Taylor S, Sunshine SS, McCarthy K, Risher N, et al. SMN Protein Can
Be Reliably Measured in Whole Blood with an Electrochemiluminescence (ECL) Immunoassay: Impli-
cations for Clinical Trials. PLoS One. 2016; 11(3):e0150640. https://doi.org/10.1371/journal.pone.
0150640 PMID: 26953792; PubMed Central PMCID: PMCPMC4783032.
44. Livak KJ, Schmittgen TD. Analysis of relative gene expression data using real-time quantitative PCR
and the 2(-Delta Delta C(T)) Method. Methods. 2001; 25(4):402–8. https://doi.org/10.1006/meth.2001.
1262 PMID: 11846609.
45. Tukey JW. Exploratory Data Analysis: Addison-Wesley; 1977.
46. Dunn OJ. Estimation of the Means of Dependent-Variables. Annals of Mathematical Statistics. 1958; 29
(4):1095–111. PubMed PMID: WOS:A1958WW79900009.
47. Dunn OJ. Multiple Comparisons among Means. Journal of the American Statistical Association. 1961;
56(293):52-&. https://doi.org/10.2307/2282330 PubMed PMID: WOS:A19611734300002.
48. Holm S. A Simple Sequentially Rejective Multiple Test Procedure. Scandinavian Journal of Statistics.
1979; 6(2):65–70. PubMed PMID: WOS:A1979JY78700003.
49. Brylka LJ, Koppert S, Babler A, Kratz B, Denecke B, Yorgan TA, et al. Post-weaning epiphysiolysis
causes distal femur dysplasia and foreshortened hindlimbs in fetuin-A-deficient mice. PLoS One. 2017;
12(10):e0187030. https://doi.org/10.1371/journal.pone.0187030 PMID: 29088242.
50. Main M, Kairon H, Mercuri E, Muntoni F. The Hammersmith functional motor scale for children with spi-
nal muscular atrophy: a scale to test ability and monitor progress in children with limited ambulation. Eur
J Paediatr Neurol. 2003; 7(4):155–9. PMID: 12865054.
51. Wang TJ. Assessing the role of circulating, genetic, and imaging biomarkers in cardiovascular risk pre-
diction. Circulation. 2011; 123(5):551–65. https://doi.org/10.1161/CIRCULATIONAHA.109.912568
PMID: 21300963; PubMed Central PMCID: PMCPMC3059807.
Effect of PLS3 and SMN-ASO on plasma biomarker in SMA mice
PLOS ONE | https://doi.org/10.1371/journal.pone.0203398 September 6, 2018 25 / 28

52. Chen H, Li H, Zhao J, Peng P, Shao M, Wu H, et al. High Intratumoral Expression of Tetranectin Associ-
ates with Poor Prognosis of Patients with Gastric Cancer after Gastrectomy. J Cancer. 2017; 8
(17):3623–30. https://doi.org/10.7150/jca.19438 PMID: 29151948.
53. Arellano-Garcia ME, Li R, Liu X, Xie Y, Yan X, Loo JA, et al. Identification of tetranectin as a potential
biomarker for metastatic oral cancer. Int J Mol Sci. 2010; 11(9):3106–21. https://doi.org/10.3390/
ijms11093106 PMID: 20957082; PubMed Central PMCID: PMCPMC2956083.
54. Alrafiah A, Karyka E, Coldicott I, Iremonger K, Lewis KE, Ning K, et al. Plastin 3 Promotes Motor Neuron
Axonal Growth and Extends Survival in a Mouse Model of Spinal Muscular Atrophy. Mol Ther Methods
Clin Dev. 2018; 9:81–9. https://doi.org/10.1016/j.omtm.2018.01.007 PMID: 29552580; PubMed Central
PMCID: PMCPMC5852384.
55. Lin CS, Park T, Chen ZP, Leavitt J. Human plastin genes. Comparative gene structure, chromosome
location, and differential expression in normal and neoplastic cells. The Journal of biological chemistry.
1993; 268(4):2781–92. PMID: 8428952.
56. Wirth B, Garbes L, Riessland M. How genetic modifiers influence the phenotype of spinal muscular atro-
phy and suggest future therapeutic approaches. Curr Opin Genet Dev. 2013; 23(3):330–8. https://doi.
org/10.1016/j.gde.2013.03.003 PMID: 23602330.
57. Coovert DD, Le TT, McAndrew PE, Strasswimmer J, Crawford TO, Mendell JR, et al. The survival
motor neuron protein in spinal muscular atrophy. Hum Mol Genet. 1997; 6(8):1205–14. PMID:
9259265.
58. Lefebvre S, Burlet P, Liu Q, Bertrandy S, Clermont O, Munnich A, et al. Correlation between severity
and SMN protein level in spinal muscular atrophy. Nat Genet. 1997; 16(3):265–9. https://doi.org/10.
1038/ng0797-265 PMID: 9207792.
59. Geary RS, Leeds JM, Henry SP, Monteith DK, Levin AA. Antisense oligonucleotide inhibitors for the
treatment of cancer: 1. Pharmacokinetic properties of phosphorothioate oligodeoxynucleotides. Anti-
cancer Drug Des. 1997; 12(5):383–93. PMID: 9236854.
60. Geary RS, Yu RZ, Watanabe T, Henry SP, Hardee GE, Chappell A, et al. Pharmacokinetics of a tumor
necrosis factor-alpha phosphorothioate 2’-O-(2-methoxyethyl) modified antisense oligonucleotide: com-
parison across species. Drug Metab Dispos. 2003; 31(11):1419–28. https://doi.org/10.1124/dmd.31.11.
1419 PMID: 14570775.
61. Szunyogova E, Zhou H, Maxwell GK, Powis RA, Francesco M, Gillingwater TH, et al. Survival Motor
Neuron (SMN) protein is required for normal mouse liver development. Sci Rep. 2016; 6:34635. https://
doi.org/10.1038/srep34635 PMID: 27698380.
62. Newton G, Weremowicz S, Morton CC, Copeland NG, Gilbert DJ, Jenkins NA, et al. Characterization of
human and mouse cartilage oligomeric matrix protein. Genomics. 1994; 24(3):435–9. https://doi.org/10.
1006/geno.1994.1649 PMID: 7713493.
63. Muller G, Michel A, Altenburg E. COMP (cartilage oligomeric matrix protein) is synthesized in ligament,
tendon, meniscus, and articular cartilage. Connect Tissue Res. 1998; 39(4):233–44. PMID: 11063004.
64. Wang L, Zheng J, Du Y, Huang Y, Li J, Liu B, et al. Cartilage oligomeric matrix protein maintains the
contractile phenotype of vascular smooth muscle cells by interacting with alpha(7)beta(1) integrin. Circ
Res. 2010; 106(3):514–25. https://doi.org/10.1161/CIRCRESAHA.109.202762 PMID: 20019333.
65. Agarwal P, Zwolanek D, Keene DR, Schulz JN, Blumbach K, Heinegard D, et al. Collagen XII and XIV,
new partners of cartilage oligomeric matrix protein in the skin extracellular matrix suprastructure. J Biol
Chem. 2012; 287(27):22549–59. https://doi.org/10.1074/jbc.M111.335935 PMID: 22573329; PubMed
Central PMCID: PMCPMC3391150.
66. Hecht JT, Nelson LD, Crowder E, Wang Y, Elder FF, Harrison WR, et al. Mutations in exon 17B of carti-
lage oligomeric matrix protein (COMP) cause pseudoachondroplasia. Nat Genet. 1995; 10(3):325–9.
https://doi.org/10.1038/ng0795-325 PMID: 7670471.
67. Briggs MD, Hoffman SM, King LM, Olsen AS, Mohrenweiser H, Leroy JG, et al. Pseudoachondroplasia
and multiple epiphyseal dysplasia due to mutations in the cartilage oligomeric matrix protein gene. Nat
Genet. 1995; 10(3):330–6. https://doi.org/10.1038/ng0795-330 PMID: 7670472.
68. Ueland T, Laugsand LE, Vatten LJ, Janszky I, Platou C, Michelsen AE, et al. Extracellular matrix mark-
ers and risk of myocardial infarction: The HUNT Study in Norway. Eur J Prev Cardiol. 2017; 24
(11):1161–7. https://doi.org/10.1177/2047487317703826 PMID: 28429960.
69. Kluzek S, Bay-Jensen AC, Judge A, Karsdal MA, Shorthose M, Spector T, et al. Serum cartilage oligo-
meric matrix protein and development of radiographic and painful knee osteoarthritis. A community-
based cohort of middle-aged women. Biomarkers. 2015; 20(8):557–64. https://doi.org/10.3109/
1354750X.2015.1105498 PMID: 26848781; PubMed Central PMCID: PMCPMC4819573.
70. El Defrawy AO, Gheita TA, Raslan HM, El Ansary MM, El Awar AH. Serum and synovial cartilage oligo-
meric matrix protein levels in early and established rheumatoid arthritis. Z Rheumatol. 2016; 75(9):917–
23. https://doi.org/10.1007/s00393-015-1647-5 PMID: 26683321.
Effect of PLS3 and SMN-ASO on plasma biomarker in SMA mice
PLOS ONE | https://doi.org/10.1371/journal.pone.0203398 September 6, 2018 26 / 28

71. Zachou K, Gabeta S, Gatselis NK, Norman GL, Dalekos GN. Cartilage oligomeric matrix protein on the
spot for liver fibrosis evaluation: Too early or too late? Eur J Intern Med. 2017; 43:e48–e9. https://doi.
org/10.1016/j.ejim.2017.05.003 PMID: 28502865.
72. Jiao Q, Wei L, Chen C, Li P, Wang X, Li Y, et al. Cartilage oligomeric matrix protein and hyaluronic acid
are sensitive serum biomarkers for early cartilage lesions in the knee joint. Biomarkers. 2016; 21
(2):146–51. https://doi.org/10.3109/1354750X.2015.1118547 PMID: 26634947.
73. Mansson B, Carey D, Alini M, Ionescu M, Rosenberg LC, Poole AR, et al. Cartilage and bone metabo-
lism in rheumatoid arthritis. Differences between rapid and slow progression of disease identified by
serum markers of cartilage metabolism. J Clin Invest. 1995; 95(3):1071–7. https://doi.org/10.1172/
JCI117753 PMID: 7533784; PubMed Central PMCID: PMCPMC441442.
74. Gerdhem P, Topalis C, Grauers A, Stubendorff J, Ohlin A, Karlsson KM. Serum level of cartilage oligo-
meric matrix protein is lower in children with idiopathic scoliosis than in non-scoliotic controls. Eur Spine
J. 2015; 24(2):256–61. https://doi.org/10.1007/s00586-014-3691-2 PMID: 25427671.
75. Azukizawa M, Ito H, Hamamoto Y, Fujii T, Morita Y, Okahata A, et al. The Effects of Well-Rounded
Exercise Program on Systemic Biomarkers Related to Cartilage Metabolism. Cartilage.
2018:1947603518767998. https://doi.org/10.1177/1947603518767998 PMID: 29644876.
76. Khatri IA, Chaudhry US, Seikaly MG, Browne RH, Iannaccone ST. Low bone mineral density in spinal
muscular atrophy. J Clin Neuromuscul Dis. 2008; 10(1):11–7. https://doi.org/10.1097/CND.
0b013e318183e0fa PMID: 18772695.
77. Wasserman HM, Hornung LN, Stenger PJ, Rutter MM, Wong BL, Rybalsky I, et al. Low bone mineral
density and fractures are highly prevalent in pediatric patients with spinal muscular atrophy regardless
of disease severity. Neuromuscul Disord. 2017; 27(4):331–7. https://doi.org/10.1016/j.nmd.2017.01.
019 PMID: 28258940.
78. Haylock DN, Nilsson SK. Osteopontin: a bridge between bone and blood. Br J Haematol. 2006; 134
(5):467–74. https://doi.org/10.1111/j.1365-2141.2006.06218.x PMID: 16848793.
79. Shanmugarajan S, Tsuruga E, Swoboda KJ, Maria BL, Ries WL, Reddy SV. Bone loss in survival motor
neuron (Smn(-/-) SMN2) genetic mouse model of spinal muscular atrophy. J Pathol. 2009; 219(1):52–
60. https://doi.org/10.1002/path.2566 PMID: 19434631.
80. Hao C, Cui Y, Owen S, Li W, Cheng S, Jiang WG. Human osteopontin: Potential clinical applications in
cancer (Review). Int J Mol Med. 2017; 39(6):1327–37. https://doi.org/10.3892/ijmm.2017.2964 PMID:
28440483; PubMed Central PMCID: PMCPMC5428945.
81. van der Leeuw J, Beulens JW, van Dieren S, Schalkwijk CG, Glatz JF, Hofker MH, et al. Novel Biomark-
ers to Improve the Prediction of Cardiovascular Event Risk in Type 2 Diabetes Mellitus. J Am Heart
Assoc. 2016; 5(6). https://doi.org/10.1161/JAHA.115.003048 PMID: 27247335; PubMed Central
PMCID: PMCPMC4937255.
82. Kuraoka M, Kimura E, Nagata T, Okada T, Aoki Y, Tachimori H, et al. Serum Osteopontin as a Novel
Biomarker for Muscle Regeneration in Duchenne Muscular Dystrophy. Am J Pathol. 2016; 186
(5):1302–12. https://doi.org/10.1016/j.ajpath.2016.01.002 PMID: 26963343.
83. Wewer UM, Ibaraki K, Schjorring P, Durkin ME, Young MF, Albrechtsen R. A potential role for tetranec-
tin in mineralization during osteogenesis. J Cell Biol. 1994; 127(6 Pt 1):1767–75. PMID: 7798325;
PubMed Central PMCID: PMCPMC2120295.
84. Fabregat A, Jupe S, Matthews L, Sidiropoulos K, Gillespie M, Garapati P, et al. The Reactome Pathway
Knowledgebase. Nucleic Acids Res. 2018; 46(D1):D649–D55. https://doi.org/10.1093/nar/gkx1132
PMID: 29145629; PubMed Central PMCID: PMCPMC5753187.
85. Zheng T, Chen B, Yang L, Hu X, Zhang X, Liu H, et al. Association of plasma dipeptidyl peptidase-4
activity with non-alcoholic fatty liver disease in nondiabetic Chinese population. Metabolism. 2017;
73:125–34. https://doi.org/10.1016/j.metabol.2017.04.012 PMID: 28637594.
86. Lebensztejn DM, Bialokoz-Kalinowska I, Klusek-Oksiuta M, Tarasow E, Wojtkowska M, Kaczmarski M.
Serum fetuin A concentration is elevated in children with non-alcoholic fatty liver disease. Adv Med Sci.
2014; 59(1):81–4. https://doi.org/10.1016/j.advms.2013.08.003 PMID: 24797980.
87. Srinivas PR, Wagner AS, Reddy LV, Deutsch DD, Leon MA, Goustin AS, et al. Serum alpha 2-HS-gly-
coprotein is an inhibitor of the human insulin receptor at the tyrosine kinase level. Mol Endocrinol. 1993;
7(11):1445–55. https://doi.org/10.1210/mend.7.11.7906861 PMID: 7906861.
88. Kitamura Y, Usami R, Ichihara S, Kida H, Satoh M, Tomimoto H, et al. Plasma protein profiling for
potential biomarkers in the early diagnosis of Alzheimer’s disease. Neurol Res. 2017; 39(3):231–8.
https://doi.org/10.1080/01616412.2017.1281195 PMID: 28107809.
89. Karampela I, Kandri E, Antonakos G, Vogiatzakis E, Christodoulatos GS, Nikolaidou A, et al. Kinetics of
circulating fetuin-A may predict mortality independently from adiponectin, high molecular weight adipo-
nectin and prognostic factors in critically ill patients with sepsis: A prospective study. J Crit Care. 2017;
41:78–85. https://doi.org/10.1016/j.jcrc.2017.05.004 PMID: 28500919.
Effect of PLS3 and SMN-ASO on plasma biomarker in SMA mice
PLOS ONE | https://doi.org/10.1371/journal.pone.0203398 September 6, 2018 27 / 28

90. Stenvinkel P, Wang K, Qureshi AR, Axelsson J, Pecoits-Filho R, Gao P, et al. Low fetuin-A levels are
associated with cardiovascular death: Impact of variations in the gene encoding fetuin. Kidney Int.
2005; 67(6):2383–92. https://doi.org/10.1111/j.1523-1755.2005.00345.x PMID: 15882283.
91. Chen HY, Chiu YL, Hsu SP, Pai MF, Yang JY, Peng YS. Low serum fetuin A levels and incident stroke
in patients with maintenance haemodialysis. Eur J Clin Invest. 2013; 43(4):387–96. https://doi.org/10.
1111/eci.12057 PMID: 23419133.
92. Tiziano FD, Pinto AM, Fiori S, Lomastro R, Messina S, Bruno C, et al. SMN transcript levels in leuko-
cytes of SMA patients determined by absolute real-time PCR. Eur J Hum Genet. 2010; 18(1):52–8.
https://doi.org/10.1038/ejhg.2009.116 PMID: 19603064.
93. Sumner CJ, Kolb SJ, Harmison GG, Jeffries NO, Schadt K, Finkel RS, et al. SMN mRNA and protein
levels in peripheral blood. Biomarkers for SMA clinical trials. Neurology. 2006. https://doi.org/10.1212/
01.wnl.0000201929.56928.13 PMID: 16481599.
Effect of PLS3 and SMN-ASO on plasma biomarker in SMA mice
PLOS ONE | https://doi.org/10.1371/journal.pone.0203398 September 6, 2018 28 / 28