evaluation of performance for school teacher recruitment
TRANSCRIPT

380
Evaluation of performance for School Teacher Recruitment using MCDM
techniques with Interval Data
Neha Ghorui, Arijit Ghosh, Sankar Prasad Mondal, Suchitra Kumari, Subrata Jana, Aditya Das
1. Introduction
Teachers play an important role in nation building. It is the teachers who are pivotal in nurturing the children
and youth of the country through education. To maintain academic standard, it is necessary to recruit teachers
through an unbiased, efficient process. For the recruitment of teachers in an educational institute, a
comprehensive and scientific Multi Criteria Decision Making (MCDM) approach is required, as it involves
several conflicting criteria and sub-criteria. Many a times the information required for solving the MCDM
problems is often incomplete, vague, and imprecise. In teacher recruitment, many attributes have subjective
evaluation where assigning a particular numeric crisp value may not be appropriate thus interval number has
been used for better representation and handling of the impreciseness. Thus improved methodology capable of
handling impreciseness is required and assigning weights to the criteria is of utmost priority in selecting the best
alternative. It will empower various service-based institutions be it educational institutions, hospitality industry,
healthcare industry and tourism industry to recruit under imprecise situations. This measure by which the
service sector time and again outperforms itself is not measurable in quantifiable terms unlike the industries
which deal in products. This makes it even more alluring as well as challenging to study. For instance,
measuring a teacher’s efficiency depends on her pedagogy of teaching, the way she interacts with students, the
strategy she adopts, her knowledge base and many more variables which are unique to the teacher herself. A
Article Info Abstract
Article History Teachers play an important role in nation building. It is the teachers who
are pivotal in nurturing the children and youth of the country through
education. To maintain academic standard, it is necessary to recruit
teachers through an unbiased, efficient process. It is also required to
evaluate teachers on a regular basis. For the recruitment of teacher in an
educational institute, in this paper Parametric Form of Interval Number
(PIVN) has been applied. In this paper, the recruitment of an efficient
teacher involves measurement of7 criteria and 20 sub-criteria involving
imprecise, qualitative information. This paper applied PIVN with Analytic
Hierarchy Process (AHP) and Technique for Order Preference by Similarity
to Ideal Solution (TOPSIS) methodology. The PIVN is introduced and
implemented in AHP to obtain the criteria and sub-criteria weights. The
different properties and arithmetic operation of PIVN are also discussed.
Finally, a hybrid PIVN-TOPSIS algorithm is applied for selection of the best
teacher. Comparative analysis was conducted using different MCDM
techniques such as simple additive weighting (SAW), Weighted Aggregated
Sum Product Assessment (WASPAS), Weighted Sum Method (WSM) to check
the ranking of the teachers. Sensitivity analysis has been conducted by
interchanging important criteria weights.
Received:
March 28, 2021
Accepted:
May 28, 2021
Keywords :
Decision Makers (DMs);
Parametric form of Interval
Number (PIVN); Teaching
performance;
Multi Criteria Decision
Making (MCDM)
DOI:
10.5281/zenodo.4837226
Multicultural Education
Volume 7, Issue 5, 2021

381
point estimate of subjective evaluation of performance may not be the right approach to evaluate a teacher’s
performance during interview. Keeping this in mind we have applied Parametric form of Interval
Numbers(PIVN) in multi-criteria decision-making(MCDM) methodologies and allotted weights to the criteria’s
we have identified based on our data.
There are several MCDM techniques to determine the weights. For determination of criteria and sub- criteria
weights of teachers attributes, multiple DMs opinion has been incorporated in this research and their respective
scaling has been aggregated by arithmetic mean method. The MCDM Analytic Hierarchy Process (AHP) has
been used to obtain the weights. In many recruitment processes, more than one experts, more than one
management representative are there who may have different priority for different attributes while recruiting
teacher which leads to difference in the weightages assigned. A scientific logical approach is required to address
the issue of unequal weightages assigned by different DMs. In this paper, we have used an approach which takes
into consideration different weightage assigned by different DMs and ultimately gives a common weightage for
final recruitment process. Proper evaluation of performance during interview is required for a better
professionalism and academic growth. Evaluation and ranking helps the recruiters to identify applicants
strengths and weaknesses. Practically, it is easily understood that many attributes of a teacher are qualitative in
nature and evaluation of teacher or ranking of teacher implies the conversion of qualitative attributes to
quantitative by assigning proper scaling.
1.1 MCDM, fuzzy based MCDM and Interval Numbers in uncertain environment.
Analytic Hierarchy Process (AHP) was developed by Wind and Satty, (1980) which is a constructive technique
to deal with complex decision making. As AHP works in crisp data, it fails to include the uncertainty or
vagueness of the decision maker’s. Thus in order to overcome this, fuzzy AHP was used where fuzzy numbers
were used in comparison matrices. Fuzzy set theory was introduced by Zadeh (1965). Fuzzy sets theory deals
only with the degree of acceptance but in no ways incorporate the decision maker’s lack of hesitancy and
insight. Intuitionistic fuzzy sets(IFS), is an extension of Zadeh’s (1965) pioneering work. IFS was developed by
the author Atanassov (1994), is a strong tool to deal with uncertainty and vagueness. The distinct characteristic
of IFS is that it ascertains each element membership degree, non- membership degree and indeterminacy degree.
Peng and Wang (2011) applied GRA form TOPSIS decision making method to find the best in supplier
selection problem with interval numbers. Hladik (2012) utilized interval numbers in Linear programming
problem. Liao and Xu (2014) published a paper on Intuitionistic Fuzzy Analytic Hierarchy Process is the
extended version of classical AHP and fuzzy AHP to IF values for comparison matrices. Triangular
intuitionistic fuzzy numbers was used for vendor selection using AHP (Kaur, 2014). The authors (Pal and
Mahapatra, 2017) introduced parametric representation of Interval numbers in functional form with arithmetic
operations in symmetric, asymmetric and convex combination form. The authors (Wang et al., 2015) used
TOPSIS and Response Surface Method in MCDM problems with interval numbers. MCDM technique AHP
with TIFN was applied to supplier selection problem (Nirmala and Uthra, 2019).Many researchers in the recent
years have worked in evaluating teaching performance in the higher institutes. Fuzzy set theory with the AHP
and TOPSIS method was applied to assess the performance of administration sciences Instructors (Nikoomaram
et al., 2009). The authors (Huang and Feng, 2015) proposed the extended approach of AHP and TOPSIS to
RAHPTOPSIS to evaluate the accurate teaching quality in physical education in college. Grey Relational
Analysis (GRA) and COPRAS- method was explored to estimate the performance level of individual teacher
(Mazumdar et al., 2010). The authors (Wu et al., 2012) applied AHP and VIKOR MCDM tools to rank the 12
private universities which the ministry of education listed as a case study. The authors (Mondal and Pramanik,
2014)used MCDM techniques for recruitment of teacher by applying neutrosophic approach. A developed
structured framework used MCDM techniques in AHP and fuzzy AHP environments in the renowned
engineering university of Bangladesh to evaluate the best teacher and finally TOPSIS method to rank them
(Karmaker and Saha, 2015). Estimation of factors and sub factor’s weight by Chang’s (extent analysis fuzzy
AHP) and proposed fuzzy comprehensive evaluation method for teaching performance (Chen et al., 2015). The
author (Daniawan, 2018) used the combinations of AHP and SAW method to obtain the criteria weights and
rank the alternative for the evaluation of lecturer performance. Fuzzy Delphi methodology was proposed and
multi criteria study to judge and rank the English skills of pre-service teachers (Alaa et al., 2019). The authors
(Hussain et al., 2019) applied MCDM techniques to evaluate the service quality in telecommunication industry.

382
The identification of suitable factors affecting the service quality was done using statistical tools. The weights
were finally determined by fuzzy RASCH methodology. Further the selection of the service provider was
evaluated using fuzzy MCDM method, identification of the best minimum quantity lubrication (MQL) using
TOPSIS approach. At first response surface methodology (RSM) was used to make a correlation between
machine responses and input, the non-dominated sorting genetic algorithm-II (NSGA-II) was used to explore for
the candidate solution (Sen et al., 2019a). The authors (Sen et al., 2019b) used MCDM technique NTOPSIS and
merged with the theory of gene expression programming (GEP), non-dominated sorting genetic algorithm-II
(NSGA-II) to optimize MQL- vegetable oil synergy. Parametric interval valued intuitionistic fuzzy number
(PIVIFN) was used for the rating of the alternatives with respect to the criteria in choosing the optimal site
selection (Hussain et al., 2018). The authors (Ghorui et al., 2020) used MCDM tools fuzzy AHP to calculate the
factors and sub-factors weight responsible in choosing the best site for shopping mall construction. Finally fuzzy
TOPSIS method was used in ranking the best alternative. The authors (Garg, 2016; Kumar and Garg,
2018)improvised new generalized score function of interval-valued intuitionistic fuzzy sets. Further, the revised
score function was discussed considering 4 counter cases. The authors (Sarkar, 2012; Sarkar et al., 2011) deals
with an economic manufacturing quantity (EMQ), used Euler Lagrange theory to identify the supreme product
reliability and production rate in an imperfect production process. Application of Bivariate and multivariate
analysis with graphical illustrations to observe the qualitative impact of primary and secondary level of
education in higher education (Michaelowa, 2007).To upgrade learning satisfaction in students, the author
(Chien, 2007)applied the concept of Kano’s model in decision making. The principles and decision making
diagram put forward, help the students, instructors and administrators to improve quality in teaching. The
authors of (Melon et al., 2008) applied AHP methodology to select the best educational project, where the
different criteria are assigned weightage by a group of DMs.
1.2 Motivation for the proposed study
There are various MCDM techniques as discussed earlier which helps in evaluating the best alternatives. As
seen in the previous researches, (Nikoomaram et al., 2009; Huang and Feng, 2015; Mazumdar et al., 2010; Wu
et al., 2012; Mondal and Pramanik, 2014; Karmaker and Saha, 2015; Chen et al, 2015; Daniawan, 2018; Alaa et
al., 2019) authors have applied different MCDM tools for evaluation of teaching performance and selecting the
best. This article used Interval numbers based AHP and TOPSIS method to select the optimal alternative.
Interval numbers is a conventional approach for representing the imprecise parameters. Interval numbers can be
considered as an extension of triangular fuzzy number (TFN).On certain attributes, evaluation is subjective
hence, instead of specific numerical value it will be more appropriate to assign an interval for awarding marks.
In PIVN based approach, an interval is used instead of a single point and the evaluators will not have
inconvenience about the fixed point where the degree of membership will be maximum. The TFN takes the
lowest, medium and maximum values, Interval numbers unlike fuzzy numbers can be categorize into two
intervals i.e., [low, medium] or [medium, high]. There are real life situation where PIVN represents the situation
better than FN. For instance, Triangular Fuzzy Numbers (TFN) (a,b,c) where at “a” the membership starts,
reaches maximum membership ‘1’at the point “b” then declines till ‘c’ where the membership becomes’0’. In
real life problem of teacher recruitment, an expert may not be able to ascertain the value ‘b’ where the maximum
membership exists for an attribute. To eliminate this hesitancy, concept of interval numbers provide a better
approach to the expert. Considering an Interval Number [a,c], one can understand that throughout the interval
there exists homogeneity of the information.
The aim of this research is to recruit the teachers based on an exhaustive set of attributes. The criteria’s and sub-
criteria’s weight are calculated using PIVN- AHP methodology. Then the TOPSIS approach had been applied
with PIVN to rank the Teachers.
So the concept of parametric form of interval numbers (PIVN) gives a lot of scope to decision maker in reducing
the uncertainty and indeterminacy. Hardly, any research is done on PIVN- AHP and PIVN-TOPSIS, we propose
this new concept so that it can help the DM’s to get the appropriate alternatives in less time and easy
calculations.
1.3 Novelties of the proposed study
Various research has been done for evaluating teaching performance using different MCDM techniques all over
the globe. In this article, theory related to Interval numbers in parametric form has been discussed and PIVN
concepts are applied for selecting the best alternative by using AHP coupled TOPSIS with interval uncertainty.

383
(1) Concept of interval numbers and parametric representation of interval numbers are applied to deal the
uncertainties of real life MCDM problem in a better way.
(2) Construction of teacher’s recruitment strategy is a scientific approach. Extending the criteria and sub-
criteria available in the literature, we have included all possible attributes of a teacher. Hence, criteria and sub-
criteria of this research, is an extensive and exhaustive collection of attributes.
(3) AHP and TOPSIS method both applied in the study with interval uncertainty.
1.4 Structure of the paper
The rest of this article is organized as follows: section 2 consists of some definition of MCDM, concepts and
arithmetic operations parametric form of interval numbers. Section 3 describes the methodology of PIVN-AHP
and PIVN-TOPSIS. Section 4 illustrates the application of PIVN-AHP, PIVN-TOPSIS in recruitment of
teachers in schools. Finally section 5 discusses the comparative ranking obtained using different MCDM tools.
Section 6 includes the sensitivity analysis, thus the tables and graphs illustrate the different ranking. Section 7
depicts the findings and discussions of this research. Section 8 includes the managerial insights and future scope
of this study. Finally, section 9 covers the limitations and conclusion.
1.5 The design of the proposed research
We worked under a demo/mock set up. Under this set up, a mock interview was conducted involving seven
teachers. Five DMs involving experts, teachers and management were present during the interview. Based on
the performance by the applicants during mock interview the following decision matrix has been obtained.
Figure 1.Flowchart for the present study
Step 1
•The criteria and sub-criteria weights are obtained by AHP method. PIVN are used instead of crisp or fuzzy numbers.
Step 2
•Decision matrix is structured to give ratings to the 𝑝𝑡h alternative correspondence to sub-criteria‟s separately.
Step 3•TOPSIS method is applied to rank the alternatives.

384
2. Preliminaries
2.1 MCDM methodology for teacher’s recruitment
Definition 2.1: Multi criteria decision making refers to the usage of multiple criteria’s with respect to the
problem, prioritizing the criteria’s by assigning weights to them and finally ranking the alternatives. Criteria’s
can be defined as the attributes of the alternatives, the importance or preference of which is determined by the
decision makers. Decision makers play an important part in MCDM, be it individual DM or a group of DMs.
2.2 Importance of the proposed research
Recruitment of efficient teacher is vital in order to meet the goals and objectives of the educational institution.
The proposed research can be beneficial for the institutes and government in the following ways:
(a) It enhances the existing recruitment technique of teachers to a more quantitative method based on an
exhaustive list of criteria, sub-criteria and multiple DMs.
(b) This method can be applied for the recruitment of staff and promotional ranking in different private as well
as government organizations.
2.3 Concept of Interval number
Definition 1.(Pal and Mahapatra, 2017) An interval number is a subset of the set of real numbers containing a
closed interval of real numbers. It is represented as:
𝐴 = [𝑖𝐿 , 𝑖𝑅] = {𝑥: 𝑖𝐿 ≤ 𝑥 ≤ 𝑖𝑅 , 𝑥𝜖ℜ} (1)
Where 𝑖𝐿and 𝑖𝑅 denotes the lower most and upper most value of the interval respectively and ℜ is a set of real
numbers.
2.4 Parametric Representation of Interval Number
Parametric product form considering the lower and upper values of the interval:
Definition 2. (Pal and Mahapatra, 2017) Parametric Interval- valued function: let us assume an interval[𝑖𝐿 , 𝑖𝑅],
where𝑖𝐿 , 𝑖𝑅 > 0 . The parametric interval valued function for the interval [𝑖𝐿 , 𝑖𝑅] is defined as
𝑎(𝛿) = 𝑖𝐿1−𝛿𝑖𝑅
𝛿 , where 𝛿 ∈ (0,1) (2)
Some Results:
(a) If 𝛿 = 0, the lower value of the interval is obtained
(b) If 𝛿 = 1, the upper value of the interval is obtained
(c) For 0 < 𝛿 < 1, different number in between the interval is obtained.
Definition 3. (Pal and Mahapatra, 2017) Let 𝐴 = [𝑖𝐿 , 𝑖𝑅]and 𝐵 = [𝑗𝐿 , 𝑗𝑅], be two interval numbers with 𝑖𝐿 , 𝑗𝐿 >
0.The interval-valued function for the interval 𝑆 = 𝐴 + 𝐵 in parametric form is given by
𝑠(𝛿) = 𝑖𝐿1−𝛿𝑖𝑅
𝛿 + 𝑗𝐿1−𝛿𝑗𝑅
𝛿 (3)
Definition 4.(Pal and Mahapatra, 2017) Let 𝐴 = [𝑖𝐿 , 𝑖𝑅]and 𝐵 = [𝑗𝐿 , 𝑗𝑅], be two interval numbers, the interval-
valued function for the interval 𝐷 = 𝐴 − 𝐵 provided 𝑖𝐿 − 𝑗𝑅 > 0 in parametric form is given by
𝑑(𝛿) = 𝑖𝐿1−𝛿𝑖𝑅
𝛿 − 𝑗𝑅1−𝛿𝑗𝐿
𝛿 (4)
Definition 5. (Pal and Mahapatra, 2017) Let 𝐴 = [𝑖𝐿 , 𝑖𝑅] and 𝐵 = [𝑗𝐿 , 𝑗𝑅],be two interval numbers, the interval-
valued function for the interval 𝑀 = 𝐴 × 𝐵 in parametric form is given by
𝑚(𝛿) = 𝑖𝐿1−𝛿𝑖𝑅
𝛿𝑗𝐿1−𝛿𝑗𝑅
𝛿 = (𝑖𝐿𝑗𝐿)1−𝛿(𝑖𝑅𝑗𝑅)
𝛿 (5)
Definition 6.(Pal and Mahapatra, 2017) Division of two Interval number: let 𝐴 = [𝑖𝐿 , 𝑖𝑅] and 𝐵 = [𝑗𝐿 , 𝑗𝑅], be
two interval numbers, the interval-valued function for the interval 𝑉 =𝐴
𝐵, 𝐵 ≠ 0 in parametric form is given by
𝑣(𝛿) = (𝑖𝐿)1−𝛿𝑖𝑅
𝛿 (1
𝑗𝑅)(1−𝛿)
(1
𝑗𝐿)𝛿
= (𝑖𝐿/𝑗𝑅)(1−𝛿) (
𝑖𝑅
𝑗𝐿)(𝛿)
(6)
Definition 7.(Pal and Mahapatra, 2017)Parametric Interval Numbers Weighted Aggregated Operator
(PIVNWAO): let �̃� = (𝑖𝐿1−𝛿𝑖𝑅
𝛿 ) and �̃� = (𝑗𝐿1−𝛿𝑗𝑅
𝛿), be two PIVN, having weight factors ŵ1and ŵ2 respectively
such that ŵ1 +ŵ2 = 1, then PIVNWAO is:
PIVNWAO (�̃�, �̃�) = ŵ1(𝑖𝐿1−𝛿𝑖𝑅
𝛿 ) + ŵ2(𝑗𝐿1−𝛿𝑗𝑅
𝛿), 𝛿 ∈ (0,1) (7)

385
3. Methodology of Interval based AHP and Interval based TOPSIS
3.1 Classical AHP method
Analytic Hierarchy Process (AHP) is the mostly used MCDM tool for the evaluation of criterion weights. This
method was developed by the authors (Wind and Satty, 1980). It is applicable to both kind of data, be it
qualitative or quantitative. AHP performs pair wise comparisons and then the priority weights are derived to
specify the criteria’s weight. The obtained weights lead the decision maker in choosing the best alternative. The
classical AHP uses crisp values for the preference of criteria and provides crisp weights which may not reflect
the impreciseness that exists. As qualitative assessment can be imprecise, in this article, the concept of interval
numbers and its application to the problem of recruitment of teachers have been developed. Interval number
depicts a particular range which signifies the spread of one’s decision within that range.
3.2 TOPSIS method
TOPSIS method is extensively used MCDM approach in ranking the alternatives. TOPSIS was developed by the
authors (Hwang and Yoon, 1981). TOPSIS work on the principle that the best alternative should always be
closest to the Positive Ideal Solution (PIS) and farthest from the Negative Ideal Solution (NIS). The word
‘TOPSIS’ stands for Technique for Order Preference by Similarity to the Ideal Solution. The authors(Kelemenis
and Askounis, 2010)developed a new TOPSIS-based multi criteria approach to help decision makers in selecting
the optimal alternative. The authors (Chen et al., 2009) described the advantage of TOPSIS as follows:
It is simple and rationale
Good computational efficiency
Simple mathematical tools to measure the relative performance of each alternatives
3.3 PIVN based AHP
Step 1.Construction of the comparison matrix
Generalized representation of comparison matrix in terms of Parametric form of interval number by a decision
expert. As interval numbers contains infinite values rather than a crisp or exact value, they cannot be evaluated
by general methods. The interval numbers are preferred here as the number which lies within the two values are
also included which actually gives a lot of scope to the decision maker. Let the DMs express their judgment in
the form 𝐴𝑛×𝑛 where 𝐶𝑘𝑡 = [𝑖𝐿𝑘𝑡1−𝛿𝑖𝑅𝑘𝑡
𝛿 ] where 𝑘 = 1,2,… ,𝑚; 𝑡 = 1,2, … , 𝑛 𝛿 ∈ (0,1)denotes the comparative
preference of criteria. In the matrix 𝐶𝑖𝑖 = 1when 𝑘 = 𝑡.
Comparison matrix of criteria in terms of PIVN for different values of 𝛿 by a single DM or a group of DMs
𝐶1 𝐶2 . . . 𝐶𝑛𝐶1 [𝑖𝐿11
1−𝛿𝑖𝑅11𝛿 ] [𝑖𝐿12
1−𝛿𝑖𝑅12𝛿 ] . . . [𝑖𝐿1𝑛
1−𝛿𝑖𝑅1𝑛𝛿 ]
𝐶2 [𝑖𝐿211−𝛿𝑖𝑅21
𝛿 ] [𝑖𝐿221−𝛿𝑖𝑅22
𝛿 ] . . . [𝑖𝐿2𝑛1−𝛿𝑖𝑅2𝑛
𝛿 ]. . . . . . .. . . . . . .. . . . . . .𝐶𝑛 [𝑖𝐿𝑛1
1−𝛿𝑖𝑅𝑛1𝛿 ] [𝑖𝐿𝑛2
1−𝛿𝑖𝑅𝑛2𝛿 ] . . . [𝑖𝐿𝑛𝑛
1−𝛿𝑖𝑅𝑛𝑛𝛿 ]
Step 2. Crispification of PIVN ∀ 𝛿 ∈ (0,1)
Step 3. Normalize each element of the Crispified matrix
𝑁𝑘𝑡 =ℎ𝑘𝑡
∑ ℎ𝑘𝑡𝑛𝑘=1
, where𝑘 = 1,2,… . , 𝑛; 𝑡 = 1,2,… . , 𝑛; (8)
Step 4. Estimation of criteria and sub-criteria weights
𝐸 =𝑁𝑡ℎ𝑟𝑜𝑜𝑡 𝑣𝑎𝑙𝑢𝑒
∑𝑁𝑡ℎ𝑟𝑜𝑜𝑡 (9)
Step 5.Checking the Consistency Index(𝐶. 𝐼) of the matrix
(𝐶. 𝐼) =µ𝑚𝑎𝑥− 𝑛
𝑛−1 , (10)
Where 𝑛 is the size of the matrix.
Step 6. The same procedure follows for the sub-criteria’s and finally the global weights are obtained by
multiplying the criteria’s weight with the respective sub-criteria’s weight.
3.4 PIVN based TOPSIS
386
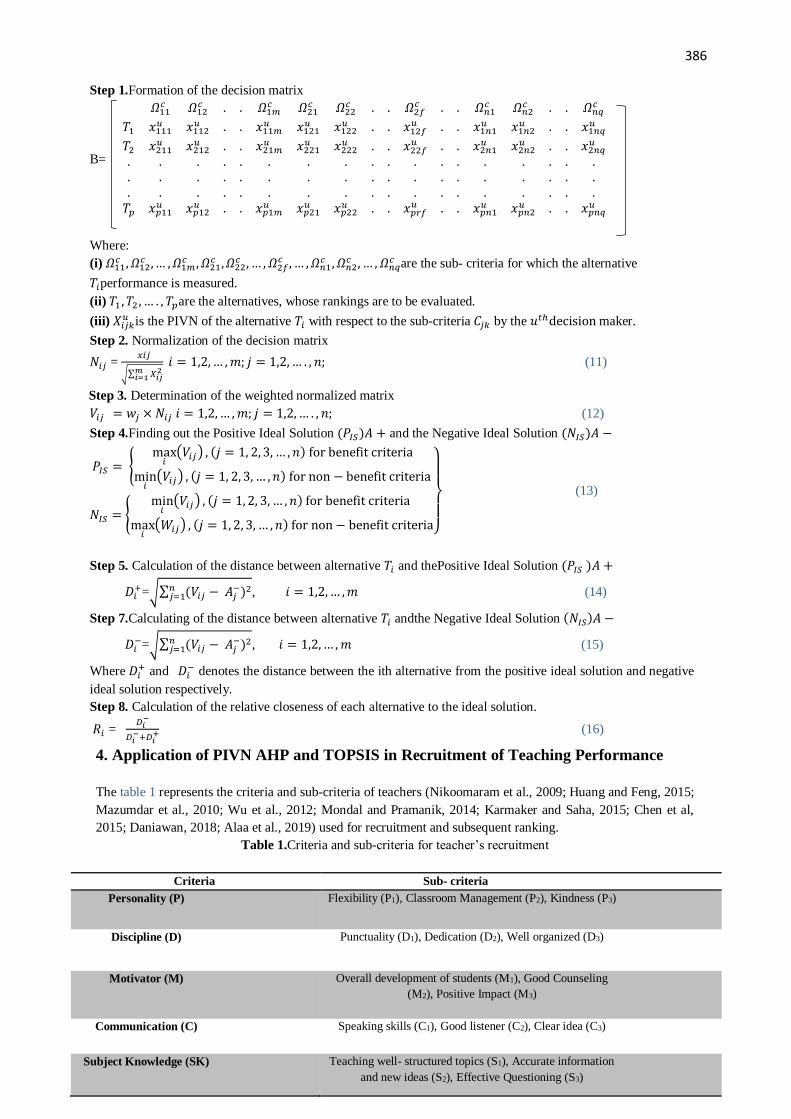
Step 1.Formation of the decision matrix
B=
𝛺11𝑐 𝛺12
𝑐 . . 𝛺1𝑚𝑐 𝛺21
𝑐 𝛺22𝑐 . . 𝛺2𝑓
𝑐 . . 𝛺𝑛1𝑐 𝛺𝑛2
𝑐 . . 𝛺𝑛𝑞𝑐
𝑇1 𝑥111𝑢 𝑥112
𝑢 . . 𝑥11𝑚𝑢 𝑥121
𝑢 𝑥122𝑢 . . 𝑥12𝑓
𝑢 . . 𝑥1𝑛1𝑢 𝑥1𝑛2
𝑢 . . 𝑥1𝑛𝑞𝑢
𝑇2 𝑥211𝑢 𝑥212
𝑢 . . 𝑥21𝑚𝑢 𝑥221
𝑢 𝑥222𝑢 . . 𝑥22𝑓
𝑢 . . 𝑥2𝑛1𝑢 𝑥2𝑛2
𝑢 . . 𝑥2𝑛𝑞𝑢
. . . . . . . . . . . . . . . . . .
. . . . . . . . . . . . . . . . . .
. . . . . . . . . . . . . . . . . .𝑇𝑝 𝑥𝑝11
𝑢 𝑥𝑝12𝑢 . . 𝑥𝑝1𝑚
𝑢 𝑥𝑝21𝑢 𝑥𝑝22
𝑢 . . 𝑥𝑝𝑟𝑓𝑢 . . 𝑥𝑝𝑛1
𝑢 𝑥𝑝𝑛2𝑢 . . 𝑥𝑝𝑛𝑞
𝑢
Where:
(i) 𝛺11𝑐 , 𝛺12
𝑐 ,… ,𝛺1𝑚𝑐 , 𝛺21
𝑐 ,𝛺22𝑐 , … , 𝛺2𝑓
𝑐 , … ,𝛺𝑛1𝑐 , 𝛺𝑛2
𝑐 , … , 𝛺𝑛𝑞𝑐 are the sub- criteria for which the alternative
𝑇𝑖performance is measured.
(ii) 𝑇1 , 𝑇2 , … . , 𝑇𝑝are the alternatives, whose rankings are to be evaluated.
(iii) 𝑋𝑖𝑗𝑘𝑢 is the PIVN of the alternative 𝑇𝑖 with respect to the sub-criteria 𝐶𝑗𝑘 by the 𝑢𝑡ℎdecision maker.
Step 2. Normalization of the decision matrix
𝑁𝑖𝑗 = 𝑥𝑖𝑗
√∑ 𝑋𝑖𝑗2𝑚
𝑖=1
𝑖 = 1,2,… ,𝑚; 𝑗 = 1,2,… . , 𝑛; (11)
Step 3. Determination of the weighted normalized matrix
𝑉𝑖𝑗 = 𝑤𝑗 ×𝑁𝑖𝑗 𝑖 = 1,2,… ,𝑚; 𝑗 = 1,2,… . , 𝑛; (12)
Step 4.Finding out the Positive Ideal Solution (𝑃𝐼𝑆)𝐴 + and the Negative Ideal Solution (𝑁𝐼𝑆)𝐴 −
𝑃𝐼𝑆 = {max𝑖(𝑉𝑖𝑗) , (𝑗 = 1, 2, 3, … , 𝑛) for benefit criteria
min𝑖(𝑉𝑖𝑗) , (𝑗 = 1, 2, 3, … , 𝑛) for non − benefit criteria
𝑁𝐼𝑆 = {min𝑖(𝑉𝑖𝑗) , (𝑗 = 1, 2, 3, … , 𝑛) for benefit criteria
max𝑖(𝑊𝑖𝑗) , (𝑗 = 1, 2, 3, … , 𝑛) for non − benefit criteria}
(13)
Step 5. Calculation of the distance between alternative 𝑇𝑖 and thePositive Ideal Solution (𝑃𝐼𝑆 )𝐴 +
𝐷𝑖+=√∑ (𝑉𝑖𝑗
𝑛𝑗=1 − 𝐴𝑗
−)2, 𝑖 = 1,2,… ,𝑚 (14)
Step 7.Calculating of the distance between alternative 𝑇𝑖 andthe Negative Ideal Solution (𝑁𝐼𝑆)𝐴 −
𝐷𝑖−=√∑ (𝑉𝑖𝑗
𝑛𝑗=1 − 𝐴𝑗
−)2, 𝑖 = 1,2,… ,𝑚 (15)
Where 𝐷𝑖+ and 𝐷𝑖
− denotes the distance between the ith alternative from the positive ideal solution and negative
ideal solution respectively.
Step 8. Calculation of the relative closeness of each alternative to the ideal solution.
𝑅𝑖 = 𝐷𝑖−
𝐷𝑖−+𝐷𝑖
+ (16)
4. Application of PIVN AHP and TOPSIS in Recruitment of Teaching Performance
The table 1 represents the criteria and sub-criteria of teachers (Nikoomaram et al., 2009; Huang and Feng, 2015;
Mazumdar et al., 2010; Wu et al., 2012; Mondal and Pramanik, 2014; Karmaker and Saha, 2015; Chen et al,
2015; Daniawan, 2018; Alaa et al., 2019) used for recruitment and subsequent ranking.
Table 1.Criteria and sub-criteria for teacher’s recruitment
Criteria Sub- criteria
Personality (P) Flexibility (P1), Classroom Management (P2), Kindness (P3)
Discipline (D)
Punctuality (D1), Dedication (D2), Well organized (D3)
Motivator (M)
Overall development of students (M1), Good Counseling
(M2), Positive Impact (M3)
Communication (C)
Speaking skills (C1), Good listener (C2), Clear idea (C3)
Subject Knowledge (SK)
Teaching well- structured topics (S1), Accurate information
and new ideas (S2), Effective Questioning (S3)

387
Professionalism (Pr)
Work Ethics (Pr1), Concept of confidentiality (Pr2)
Utilization of Technology
(UT)
PPT presentation (UT1), Knowledge of online teaching
Using ICT (UT2)
The following figure 2 represents the hierarchical structure of the study.
Figure 2. Hierarchical Structure representing the application
The table 2 represents the linguistic terms in PIVN for comparing criteria and sub-criteria.
Table 2. Linguistic term in PIVN for obtaining criteria and sub-criteria weights.
Linguistic Variable PIVN
Tremendously Important (T) (41−𝛿5𝛿)
VeryStrongly Important (V) (31−𝛿4𝛿)
Strongly Important (S) (21−𝛿3𝛿)
Fairly Important (F) (11−𝛿2𝛿)
Equally Important (E) 1
Step 1. Obtaining PIVN values for different ′𝛿′.
The table 3 mentioned below represents different values of ′𝛿′
Table 3. PIVN values for different′𝛿′
Linguistic
Variable 0 0.1 0.2 0.3 0.4 0.5 0.6 0.7 0.8 0.9 1
Equally
Important(E) 1 1 1 1 1 1 1 1 1 1 1
Fairly
Important(F) 1 1.07 1.14 1.23 1.31 1.41 1.51 1.62 1.74 1.86 2
Strongly
Important(S) 2 2.08 2.16 2.25 2.35 2.44 2.55 2.65 2.76 2.88 3
Very Strongly
Important(V) 3 3.08 3.17 3.27 3.36 3.46 3.56 3.66 3.77 3.88 4
Tremendously
Important (T) 4 4.09 4.18 4.27 4.37 4.47 4.57 4.67 4.78 4.88 5
1/F 0.5 0.53 0.57 0.61 0.65 0.70 0.75 0.81 0.87 0.93 1
1/S 0.33 0.34 0.35 0.37 0.38 0.40 0.42 0.44 0.46 0.47 0.5
1/V 0.25 0.25 0.26 0.27 0.27 0.28 0.29 0.30 0.31 0.32 0.33
1/T 0.2 0.20 0.20 0.21 0.21 0.22 0.22 0.23 0.23 0.24 0.25
Step 2. Formation of comparison matrix by the linguistic term used by DM for different criteria and sub-criteria.
The following table 4 denotes the comparison of different criteria in linguistic terms obtained by DM.
Teacher sselection
Personality
Disclipline
Motivaror
Communication
Subject knoweledge
Professionalism
Utilization of Technology
388
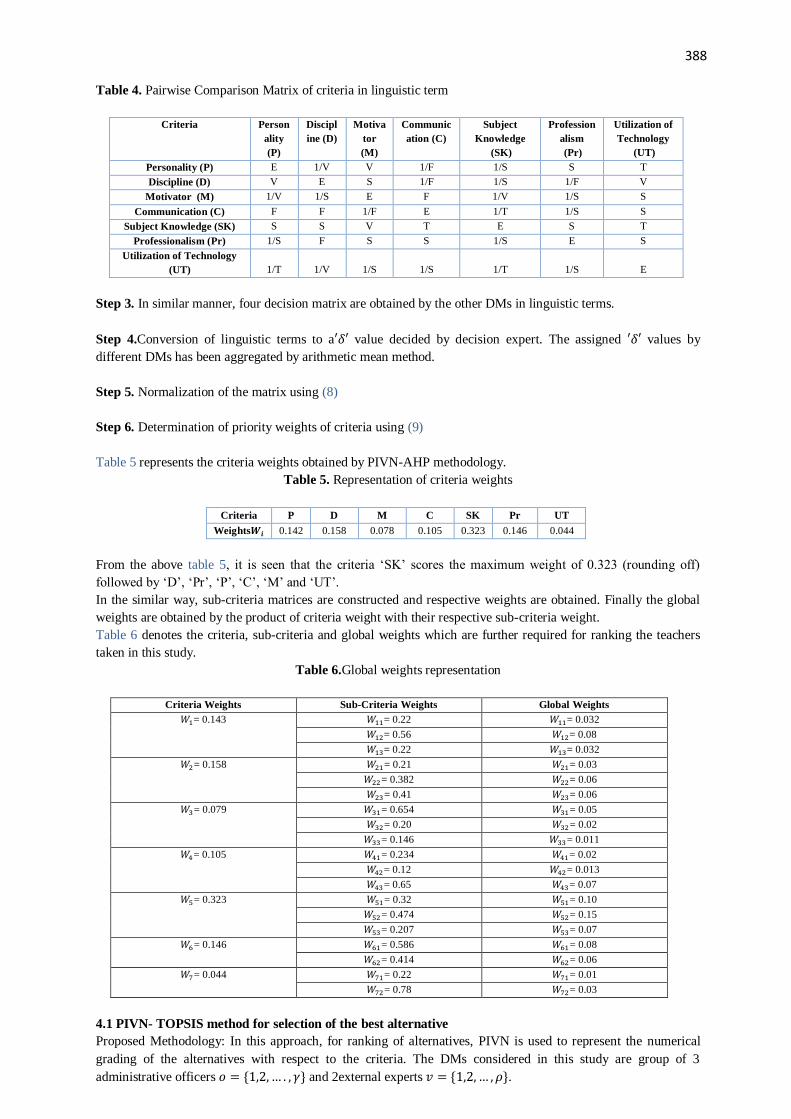
Table 4. Pairwise Comparison Matrix of criteria in linguistic term
Criteria Person
ality
(P)
Discipl
ine (D)
Motiva
tor
(M)
Communic
ation (C)
Subject
Knowledge
(SK)
Profession
alism
(Pr)
Utilization of
Technology
(UT)
Personality (P) E 1/V V 1/F 1/S S T
Discipline (D) V E S 1/F 1/S 1/F V
Motivator (M) 1/V 1/S E F 1/V 1/S S
Communication (C) F F 1/F E 1/T 1/S S
Subject Knowledge (SK) S S V T E S T
Professionalism (Pr) 1/S F S S 1/S E S
Utilization of Technology
(UT) 1/T 1/V 1/S 1/S 1/T 1/S E
Step 3. In similar manner, four decision matrix are obtained by the other DMs in linguistic terms.
Step 4.Conversion of linguistic terms to a′𝛿′ value decided by decision expert. The assigned ′𝛿′ values by
different DMs has been aggregated by arithmetic mean method.
Step 5. Normalization of the matrix using (8)
Step 6. Determination of priority weights of criteria using (9)
Table 5 represents the criteria weights obtained by PIVN-AHP methodology.
Table 5. Representation of criteria weights
Criteria P D M C SK Pr UT
Weights𝑾𝒊 0.142 0.158 0.078 0.105 0.323 0.146 0.044
From the above table 5, it is seen that the criteria ‘SK’ scores the maximum weight of 0.323 (rounding off)
followed by ‘D’, ‘Pr’, ‘P’, ‘C’, ‘M’ and ‘UT’.
In the similar way, sub-criteria matrices are constructed and respective weights are obtained. Finally the global
weights are obtained by the product of criteria weight with their respective sub-criteria weight.
Table 6 denotes the criteria, sub-criteria and global weights which are further required for ranking the teachers
taken in this study.
Table 6.Global weights representation
Criteria Weights Sub-Criteria Weights Global Weights
𝑊1= 0.143 𝑊11= 0.22 𝑊11= 0.032
𝑊12= 0.56 𝑊12= 0.08
𝑊13= 0.22 𝑊13= 0.032
𝑊2= 0.158 𝑊21= 0.21 𝑊21= 0.03
𝑊22= 0.382 𝑊22= 0.06
𝑊23= 0.41 𝑊23= 0.06
𝑊3= 0.079 𝑊31= 0.654 𝑊31= 0.05
𝑊32= 0.20 𝑊32= 0.02
𝑊33= 0.146 𝑊33= 0.011
𝑊4= 0.105 𝑊41= 0.234 𝑊41= 0.02
𝑊42= 0.12 𝑊42= 0.013
𝑊43= 0.65 𝑊43= 0.07
𝑊5= 0.323 𝑊51= 0.32 𝑊51= 0.10
𝑊52= 0.474 𝑊52= 0.15
𝑊53= 0.207 𝑊53= 0.07
𝑊6= 0.146 𝑊61= 0.586 𝑊61= 0.08
𝑊62= 0.414 𝑊62= 0.06
𝑊7= 0.044 𝑊71= 0.22 𝑊71= 0.01
𝑊72= 0.78 𝑊72= 0.03
4.1 PIVN- TOPSIS method for selection of the best alternative
Proposed Methodology: In this approach, for ranking of alternatives, PIVN is used to represent the numerical
grading of the alternatives with respect to the criteria. The DMs considered in this study are group of 3
administrative officers 𝑜 = {1,2,… . , 𝛾} and 2external experts 𝑣 = {1,2,… , 𝜌}.

389
The individual DM gives the preference grades and then aggregation of individual groups are done by Arithmetic
Mean Method. This method is more appropriate as it enables the DMs to grade the alternatives corresponding to
the criteria flexibly. The ranking of alternatives is done using the sub-criteria weight.
4.2 Numerical Study
The following table 7 represents the linguistic preference of DMs in terms of PIVN.
Table 7. Linguistic variables in terms of PIVN for preferential rating of the teachers
Note 1. The different PIVN values for the TOPSIS methodology are obtained for different ′𝛿′ in the similar
procedure as in table 2. DMs are there to rate the alternatives with respect to the sub-criteria. Their aggregation is
used to determine the final decision matrix in table 8. The ′𝛿′ chosen by the DMs are completely based on their
expertise.
Step 1. Formation of decision matrix using table 8.
Table 8 denotes a part of the decision matrix obtained by different DMs
Table 8. Decision matrix obtained by DMs using PIVN. The linguistic terms for different PIVN are decided by
DMs from table 7.
Aggregation
by DMs (P) (D) (M)
Teachers (P1) (P2) (P3) (D1) (D2) (D3) (M1) (M2) (M3)
𝑇1 4.457 4.457 4.054 2.43 2.838 2.229 3.851 4.056 3.854
𝑇2 4.457 4.256 4.056 2.843 3.448 2.636 4.056 4.054 3.854
𝑇3 3.854 3.248 3.45 2.637 2.637 2.229 3.45 3.854 3.248
𝑇4 2.844 3.046 3.248 3.248 3.047 2.229 2.639 2.224 2.023
𝑇5 3.854 3.653 2.844 4.659 3.653 2.844 2.844 3.248 2.229
𝑇6 2.838 3.246 3.451 4.055 3.45 2.844 2.432 2.837 2.229
𝑇7 3.046 3.249 3.248 3.046 3.046 2.025 2.43 1.82 1.82
Step 2. Calculation of normalized matrix using (11)
Table 9 denotes a part of the normalized decision matrix.
Table 9.Computation of normalized decision matrix using (11)
Table 10 denotes a part of the global weight of the sub-criteria used in this study.
Linguistic
Variable
PIVN
Excellent (71−𝛿8𝛿)
Good (61−𝛿7𝛿)
Fair (51−𝛿6𝛿)
Poor (41−𝛿5𝛿)
Very Poor (31−𝛿4𝛿)
(P) (D) (M)
Teachers (P1) (P2) (P3) (D1) (D2) (D3) (M1) (M2) (M3)
𝑇1 0.458 0.464 0.437 0.274 0.338 0.343 0.46 0.47 0.508
𝑇2 0.458 0.443 0.438 0.32 0.41 0.406 0.485 0.469 0.508
𝑇3 0.396 0.338 0.372 0.297 0.314 0.343 0.412 0.446 0.428
𝑇4 0.292 0.317 0.35 0.366 0.362 0.343 0.315 0.257 0.267
𝑇5 0.396 0.38 0.307 0.524 0.434 0.438 0.34 0.376 0.294
𝑇6 0.291 0.338 0.372 0.456 0.41 0.438 0.291 0.328 0.294
𝑇7 0.313 0.338 0.35 0.343 0.362 0.312 0.29 0.211 0.24

390
Table 10. Representation of global weights of sub-criteria used for calculating weighted normalized matrix.
(P1) (P2) (P3) (D1) (D2) (D3) (M1) (M2) (M3)
GW 0.032 0.08 0.032 0.033 0.061 0.065 0.052 0.016 0.011
Step 3. Estimation of weighted normalized matrix using (12)
A part of the weighted normalized matrix of different alternatives with respect to the sub-criteria are shown in
table 11.
Table 11. Weighted Normalized matrix
Step 4.To find out the(𝑃𝐼𝑆)𝐴 + and (𝑁𝐼𝑆)𝐴 − using (13)
The PIS and NIS are depicted in table 12.
Table 12. Finding out the Positive Ideal Solution (𝑃𝐼𝑆)𝐴 + and the Negative Ideal Solution (𝑁𝐼𝑆)𝐴 − using
equation (13)
Step 5. Finding out the distance measure from the Positive ideal solution and negative ideal solution using (14)
and (15) finally calculation of Relative closeness (𝑅𝑖) which determines the best alternatives using (16).The
maximum value of (𝑅𝑖) determines the best teacher.Table 13 denotes the distance measure of each alternative
from PIS and NIS. It finally shows the ranking of the teachers.
Table 13.Representation of final ranking of teachers using PIVN-TOPSIS approach
The relative closeness value of teacher 𝑇2 is maximum with a value of 0.832. Thus, ′𝑇2′ scores the first rank
followed by the teachers ′𝑇1′ scoring the second rank, ′𝑇3′ third rank and so on.
𝑇2 ≻ 𝑇1 ≻ 𝑇3 ≻ 𝑇5 ≻ 𝑇6 ≻ 𝑇4 ≻ 𝑇7
Figure 3 represents the distance measure and ranking of individual teachers.
02468
T1 T2 T3 T4 T5 T6 T7
D+ D- Ri RANKING
(P) (D) (M)
Teachers (P1) (P2) (P3) (D1) (D2) (D3) (M1) (M2) (M3)
𝑇1 0.014 0.037 0.014 0.009 0.02 0.022 0.024 0.007 0.006
𝑇2 0.014 0.035 0.014 0.011 0.025 0.026 0.025 0.007 0.006
𝑇3 0.013 0.027 0.012 0.01 0.019 0.022 0.021 0.007 0.005
𝑇4 0.009 0.025 0.011 0.012 0.022 0.022 0.016 0.004 0.003
𝑇5 0.013 0.03 0.01 0.017 0.026 0.028 0.018 0.006 0.003
𝑇6 0.009 0.027 0.012 0.015 0.025 0.028 0.015 0.005 0.003
𝑇7 0.01 0.027 0.011 0.011 0.022 0.02 0.015 0.003 0.003
(𝑃𝐼𝑆)𝑇 + 0.014 0.037 0.014 0.017 0.026 0.028 0.025 0.007 0.006
(𝑁𝐼𝑆)𝑇 − 0.009 0.025 0.01 0.009 0.019 0.02 0.015 0.003 0.003
(𝑃𝐼𝑆)𝑇 + 0.011 0.006 0.032 0.044 0.066 0.032 0.035 0.027 0.005
(𝑁𝐼𝑆)𝑇 − 0.007 0.004 0.019 0.033 0.043 0.016 0.027 0.02 0.003
Teachers 𝑫𝒊+
𝑫𝒊−
(𝑹𝒊) Ranking
𝑻𝟏 0.015 0.034 0.697 2
𝑻𝟐 0.008 0.039 0.832 1
𝑻𝟑 0.018 0.036 0.661 3
𝑻𝟒 0.036 0.009 0.194 6
𝑻𝟓 0.017 0.031 0.644 4
𝑻𝟔 0.03 0.017 0.371 5
𝑻𝟕 0.039 0.005 0.12 7

391
Figure 3.Line chart representing Distance measure i.e. (𝑃𝐼𝑆)𝐴 +, (𝑁𝐼𝑆)𝐴 − and ranking i.e. (𝑅𝑖) of each
alternatives.
5. Comparative Analysis
Different MCDM methods such as Simple additive weighting (SAW), Weighted Aggregated Sum Product
Assessment (WASPAS), Weighted Sum Method (WSM) has been applied to conduct comparative analysis.
There exists high correlation between different ranking techniques. Some of them are perfectly correlated, so it
shows reliability of PIVN based MCDM method which is capable of capturing minute detail regarding different
attributes. SAW model was first developed by the author (Harsanyi, 1955). SAW method is popular due to its
simple and easy process. SAW method is based on providing scores and mostly used in multi attribute decision
making (MADM). This methodology is also known as weighted linear combination and works on weighted
average. WSM is a simple and easy approach developed by the author (Zadeh, 1963), when we deal with
multiple criteria problems. WSM allows the comparison of the alternatives by giving the scores, and then these
score are used to obtain the values of the alternatives which are taken for the study. WASPAS method was
developed by the author (Zavadskas et al., 2012). The WASPAS method is a combination of two MCDM
methods WSM and weighted product model (WPM). Table 14 depicts ranking of different teachers using
MCDM methods.
Table 14. Ranking of teachers by different MCDM methods
Teachers SAW WSM WASPAS(0.5)
𝑻𝟏 2 2 2
𝑻𝟐 1 1 1
𝑻𝟑 4 4 4
𝑻𝟒 6 6 6
𝑻𝟓 3 3 3
𝑻𝟔 5 5 5
𝑻𝟕 7 7 7
Figure 4 shows the clustered chart ranking of WASPAS, WSM and SAW methods.
Figure 4. Clustered chart representing ranking of different MCDM methods
6. Sensitivity Analysis
In sensitivity analysis depicted in table 15 and figure 5, we obtained two more different rankings. We analyzed
the most sensitive criteria and interchanged the weights. In our methodology, it was seen that the criteria
‘subject knowledge’ obtained the maximum weight and so its sub-criteria’s. The sub-criteria ‘subject
knowledge’ global weights were interchanged with ‘personality’ sub-criteria weight, thus we obtained different
ranking. During COVID-19 pandemic, it is seen that online teaching skills has high importance for a teacher.
During the current pandemic, it is easy to understand that how the criteria ‘utilization of technology’ is highly
significant for learning and education at home. Thus in the second analysis, we interchanged the sub-criteria
weight ‘knowledge of online teaching with ICT’ with sub-criteria ‘accurate information and new ideas’ as the
later possessed maximum weight. Simultaneously the sub-criteria ‘PPT presentation’ weight was interchanged
with the sub-criteria ‘classroom management’.
0 2 4 6 8
T1
T2
T3
T4
T5
T6
T7
WASPAS(0.5)
WSM
SAW

392
Table 15. Representation of sensitivity analysis
Teachers Ranking
(Proposed
Methodology (P1))
Ranking
(Interchanging Weight
(P2))
Ranking
(Interchanging
Weight (P3))
𝑻𝟏 2 2 2
𝑻𝟐 1 1 1
𝑻𝟑 3 4 4
𝑻𝟒 6 6 7
𝑻𝟓 4 3 3
𝑻𝟔 5 5 5
𝑻𝟕 7 7 6
Figure 5. Representation of different ranking obtained under sensitivity analysis
Table 16. Correlations between ranks obtained through different MCDM techniques
** Correlation is significant at the 0.01 level (2-tailed).
*. Correlation is significant at the 0.05 level (2-tailed).
7. Findings and Discussions
It is easy to understand that factors and sub-factors are the core important for teacher’s evaluation. The weights
are determined by the PIVN-AHP method. It reflects that the criteria ‘Subject- Knowledge’(𝑊5) play an
important role in choosing the optimal teacher. While considering the Sub-criteria, i.e., ‘overall development of
students’ (𝑊31) possess maximum weights.
In the proposed methodology, sub-criteria were used to perform the ranking of the alternatives. Through this
approach, minute specifications can be made regarding different attributes of teaching. The teacher ′𝑇2′
adjudged the most efficient one with a score of 0.832 whereas the teachers ′𝑇7′ scored the least value of 0.12.
As the parameters in sub-criteria are more, this article lays more emphasis on detailed minute attributes of a
teacher. Exhaustive list of sub-criteria involved in the paper ensures a holistic approach and the result is
authentic, reliable. The comparative analysis showed that all the alternative ranked same using SAW, WSM,
WASPAS methodology. The same ranking indicates that though the techniques are different but the preference
given by the DMs for a particular alternative in different methods is consistent which helped in attaining the
same ranking. The sensitivity analysis conducted in this research, showed that when the sensitive sub-criterions
weights were interchanged, we obtained different ranking. The teachers 1 and 2 rankings were consistent even
in interchange of weights. This proves that they excel the qualitative attributes and thus no change in their
0
2
4
6
8
T1 T2 T3 T4 T5 T6 T7
Ranking (proposed methodology) Ranking (Interchanging weight)
Ranking (Interchanging weight)
SAW WSM WASPAS(0.5) P2 P3 P1
SAW 1.000 1.000** 1.000** 1.000** 0.905** 0.905**
WSM 1.000** 1.000 1.000** 1.000** 0.905** 0.905**
WASPAS(0.5) 1.000** 1.000** 1.000 1.000** 0.905** 0.905**
P2 1.000** 1.000** 1.000** 1.000 0.905** 0.905**
P3 0.905** 0.905** 0.905** 0.905** 1.000 0.810*
P1 0.905** 0.905** 0.905** 0.905** 0.810* 1.000

393
ranking.
8. Managerial Insights and future scope
It is a known fact that recruiting efficient teachers and periodic evaluation of teaching is significant in higher
educational institutes (HEI). Quality teaching is expected at all the HEI. The educational administration always
strives for a teacher or teachers who can upgrade the student’s academic level. Thus proper teacher selection
and evaluation is a continuous procedure which every colleges or Universities must conduct. This paper
provides scientific approach which can be applied comprehensively to evaluate teaching performance. A
scientific evaluation system is been designed to obtain the reasonable criteria and sub-criteria weights. The
process can also be applied during the evaluation of teachers too. The similar methodology can be applied can
be applied for best family car selection, E vehicle charging site section, construction site selection where
imprecise information is prevalent (Ghorui et al., 2021; Ghosh et al., 2021a; Sarkar et al., 2020; Ghosh et al.,
2021b; Ghosh et al., 2021c; Jana et al., 2021; Ghosh et al, 2021d).
In future, schools can use this methodology for evaluation of teachers. In schools, teacher evaluation depends
on the feedback of students. Thus a group of students can been taken additionally with the management
members and experts. Weightage can be provided to individual groups depending on the importance. The
weights should be assigned in such a way that∑ŵ𝑖 = 1.
The exact value for the decision matrix is obtained using following formula, where 𝑠, 𝑜, 𝑣 represents the group
of students, administrative officers and colleagues. 𝜏used in equation 20 represents the aggregate weight.
𝑠 =∑ (𝑠𝑙𝑒
1−𝛿𝑠𝑟𝑒𝛿 )
𝛽𝑒=1
𝛽, (17)
𝑂 =∑ (𝑜𝑙𝑔
1−𝛿𝑜𝑟𝑔𝛿 )
𝛾𝑔=1
𝛾, (18)
𝑣 =∑ (𝑣𝑙𝜌
1−𝛿𝑣𝑟𝜌𝛿 )
𝜌𝑠=1
𝜌, (19)
𝜏 =ŵ1∗𝑠+ŵ2∗𝑜+ŵ3∗𝑣
ŵ1+ŵ2+ŵ3, (20)
where 𝛿 ∈ [0,1]
9. Limitation and Conclusion
This paper develops AHP- TOPSIS method with the concept of parametric form of Interval Numbers (PIVN) to
evaluate the teaching performance in higher institutions. Parametric form of interval numbers helped in
capturing the impreciseness which arises while evaluating teaching attributes. The recruitment of teachers
involves various criteria and sub criteria, so in this article the criteria and its sub-criteria weights are computed
using PIVN-AHP method and finally the ranking of the teachers are conducted using PIVN-TOPSIS approach.
The method can be applied to multiple organizations where several factors are responsible in choosing the right
employees. For recruitment of the teachers in schools or colleges students could be incorporated in future
research. Different MCDM techniques like Preference Ranking Organization Method for Enrichment
Evaluations (PROMETHEE), Vlse Kriterijumska Optimizacija Kompromisno Resenje(VIKOR) can be used to
rank the teachers. Different methodology such as, hesitant fuzzy numbers, generalized hesitant fuzzy numbers
with MCDM tools can be used to recruit the teachers, students or employees, depending on the sector, one
wants to evaluate. Since this is a behavioral science, more efficient tools may be developed in the future to
capture the impreciseness in much better way. The attributes taken in this paper for recruitment of teacher may
be expanded further based on recruitment criteria of the organization e.g., ‘Research and Publications’ should
be included while recruiting professors in higher educational institutes.
References
Wind, Y., &Saaty, T. L. (1980). Marketing applications of the analytic hierarchy process. Management science,
26(7), 641-658.
Zadeh, L. A. (1965). Fuzzy sets. Information and control, 8(3), 338-353.
Atanassov, K. T. (1994). New operations defined over the intuitionistic fuzzy sets. Fuzzy sets and Systems, 61(2),
137-142.
Peng, A., & Wang, Z. (2011, May). GRA-based TOPSIS decision-making approach to supplier selection with
interval number. In 2011 Chinese Control and Decision Conference (CCDC) (pp. 1742-17).
Hladík, M. (2012). Complexity of necessary efficiency in interval linear programming and multiobjective linear
programming. Optimization Letters, 6(5), 893-899.

394
Liao, H., &Xu, Z. (2014). Intuitionistic fuzzy hybrid weighted aggregation operators. International Journal of
Intelligent Systems, 29(11), 971-993.
Kaur, P. (2014). Selection of vendor based on intuitionistic fuzzy analytical hierarchy process. Advances in
Operations Research, 2014.
Pal, D., &Mahapatra, G. S. (2017). Parametric functional representation of interval number with arithmetic
operations. International Journal of Applied and Computational Mathematics, 3(2), 459-469.
Wang, P., Li, Y., Wang, Y. H., & Zhu, Z. Q. (2015). A new method based on TOPSIS and response surface method
for MCDM problems with interval numbers. Mathematical Problems in Engineering, 2015.
Nirmala, G., &Uthra, G. (2019). AHP based on Triangular Intuitionistic Fuzzy Number and its Application to
Supplier Selection Problem. Materials Today: Proceedings, 16, 987-993.
Nikoomaram, H., Mohammadi, M., Taghipourian, M. J., &Taghipourian, Y. (2009). Training performance
evaluation of administration sciences instructors by fuzzy MCDM approach. Contemporary Engineering
Sciences, 2(12), 559-575.
Huang, X.Y., & Feng, S.Q. (2015). Research on the Teaching Quality Evaluation for the Physical Education in
Colleges Based on the Ahptopsis. Chemical engineering transactions, 46, 487-492.
Mazumdar, A., Datta, S., &Mahapatra, S. S. (2010). Multicriteria decision-making models for the evaluation and
appraisal of teachers' performance. International Journal of Productivity and Quality Management, 6(2), 213-
230.
Wu, H. Y., Chen, J. K., Chen, I. S., &Zhuo, H. H. (2012). Ranking universities based on performance evaluation by
a hybrid MCDM model. Measurement, 45(5), 856-880.
Mondal, K., &Pramanik, S. (2014). Multi-criteria group decision making approach for teacher recruitment in higher
education under simplified neutrosophic environment. Neutrosophic Sets and Systems, 6, 28-34.
Karmaker, C., &Saha, M. (2015). Teachers’ recruitment process via MCDM methods: A case study in Bangladesh.
Management Science Letters, 5(8), 749-766.
Chen, J. F., Hsieh, H. N., & Do, Q. H. (2015). Evaluating teaching performance based on fuzzy AHP and
comprehensive evaluation approach. Applied Soft Computing, 28, 100-108.
Daniawan, B. (2018). Evaluation of Lecturer Teaching Performance Using AHP and SAW Methods. bit-Tech, 1(2),
30-39.
Alaa, M., Albakri, I. S. M. A., Singh, C. K. S., Hammed, H., Zaidan, A. A., Zaidan, B. B., ... &Baqer, M. J. (2019).
Assessment and ranking framework for the English skills of pre-service teachers based on fuzzy Delphi and
TOPSIS methods. IEEE Access, 7, 126201-126223.
Hussain, S. A. I., Baruah, D., Dutta, B., Mandal, U. K., Mondal, S. P., &Nath, T. (2019). Evaluating the impact of
service quality on the dynamics of customer satisfaction in the telecommunication industry of Jorhat, Assam.
Telecommunication Systems, 71(1), 31-53.
Sen, B., Hussain, S. A. I., Mia, M., Mandal, U. K., &Mondal, S. P. (2019a). Selection of an ideal MQL-assisted
milling condition: an NSGA-II-coupled TOPSIS approach for improving machinability of Inconel 690. The
International Journal of Advanced Manufacturing Technology, 103(5-8), 1811-1829.
Sen, B., Mia, M., Mandal, U. K., Dutta, B., &Mondal, S. P. (2019b). Multi-objective optimization for MQL-assisted
end milling operation: an intelligent hybrid strategy combining GEP and NTOPSIS. Neural Computing and
Applications, 31(12), 8693-8717.
Hussain, S. A. I., Mandal, U. K., &Mondal, S. P. (2018). Decision maker priority index and degree of vagueness
coupled decision making method: a synergistic approach. International Journal of Fuzzy Systems, 20(5),
1551-1566.
Ghorui, N., Ghosh, A., Algehyne, E. A., Mondal, S. P., &Saha, A. K. (2020). AHP-TOPSIS Inspired Shopping Mall
Site Selection Problem with Fuzzy Data. Mathematics, 8(8), 1380.
Garg, H. (2016). A new generalized improved score function of interval-valued intuitionistic fuzzy sets and
applications in expert systems. Applied Soft Computing, 38, 988-999.
Kumar, K., &Garg, H. (2018). TOPSIS method based on the connection number of set pair analysis under interval-
valued intuitionistic fuzzy set environment. Computational and Applied Mathematics, 37(2), 1319-1329.
Sarkar, B. (2012). An inventory model with reliability in an imperfect production process. Applied Mathematics and
Computation, 218(9), 4881-4891.
Sarkar, B., Sana, S. S., &Chaudhuri, K. (2011). An imperfect production process for time varying demand with
inflation and time value of money–an EMQ model. Expert Systems with Applications, 38(11), 13543-13548.
Katharina Michaelowa, (2007), “The impact of primary and secondary education on higher education quality”,
Quality Assurance in Education, Volume 15, Issue 2, pp. 215-236. 20.
Te-King Chien, (2007), “Using the learning satisfaction improving model to enhance the teaching quality”, Quality
Assurance in Education, Volume 15, Issue 2, pp. 192-214

395
Mónica García Melón, Pablo Aragonés Beltran and M. Carmen González Cruz, (2008), “An AHP-Based Evaluation
Procedure for Innovative Educational Projects: A Face-to-Face vs. Computer-Mediated Case Study”, Omega,
The International Journal of Management Science, Volume 36, pp. 754-765.
Hwang, C. L., & Yoon, K. (1981). Methods for multiple attribute decision making. In Multiple attribute decision
making (pp. 58-191). Springer, Berlin, Heidelberg.
Kelemenis, A., &Askounis, D. (2010). A new TOPSIS-based multi-criteria approach to personnel selection. Expert
systems with applications, 37(7), 4999-5008.
Chen, C. T., Hung, W. Z., Lin, K. H., & Cheng, H. L. (2009, July). An evaluation model of service quality by
applying linguistic TOPSIS method. In 2009 IEEE/INFORMS International Conference on Service
Operations, Logistics and Informatics (pp. 335-340). IEEE.
Harsanyi, J. C. (1955). Cardinal welfare, individualistic ethics, and interpersonal comparisons of utility. Journal of
political economy, 63(4), 309-321.
Zadeh LA (1963) Optimality and non-scalar-valued performance criteria. IEEE Trans Automat Contr AC-8:59–60
Zavadskas, E. K., Turskis, Z., Antucheviciene, J., &Zakarevicius, A. (2012). Optimization of weighted aggregated
sum product assessment. Elektronikairelektrotechnika, 122(6), 3-6.
Ghorui, N., Ghosh, A., Mondal, S. P., Bajuri, M. Y., Ahmadian, A., Salahshour, S., & Ferrara, M. (2021).
Identification of dominant risk factor involved in spread of COVID-19 using hesitant fuzzy MCDM
methodology. Results in physics, 21, 103811.
Ghosh, A., Ghorui, N., Mondal, S. P., Kumari, S., Mondal, B. K., Das, A., & Gupta, M. S. (2021a). Application of
Hexagonal Fuzzy MCDM Methodology for Site Selection of Electric Vehicle Charging Station. Mathematics,
9(4), 393.
Sarkar, A., Ghosh, A., Karmakar, B., Shaikh, A., &Mondal, S. P. (2020, November). Application of Fuzzy TOPSIS
Algorithm for Selecting Best Family Car. In 2020 International Conference on Decision Aid Sciences and
Application (DASA) (pp. 59-63). IEEE.
Ghosh, A., Dey, M., Mondal, S. P., Shaikh, A., Sarkar, A., & Chatterjee, (2021b). Selection of Best E-Rickshaw-A
Green Energy Game Changer: An Application of AHP and TOPSIS Method. Journal of Intelligent & Fuzzy
Systems, (Preprint), 1-14.
Ghosh, A., Sarkar, A., & Guha, B. Comprehensive efficiency measurement of five major Indian steel companies
using data envelopment analysis and factor analysis. Malaya Journal of Matematik ,Vol. S, No. 1, 31-36,
(2021c). https://doi.org/10.26637/MJMS2101/0006.
Jana, S., Ghosh, A., & Guha, B. IPL 2019: Evaluating the performance of teams by DEA & SEM., Malaya Journal
of Matematik Vol. S, No. 1, 41-45, (2021). https://doi.org/10.26637/MJMS2101/0008.
Ghosh, A., Dey, M., Guha, B., Jana, S., & Sarkar, A. Performance evaluation & rankings of players in IPL 2019 by
DEA & SEM. Malaya Journal of Matematik, Vol. S, No. 1, 46-56,
(2021d).https://doi.org/10.26637/MJMS2101/0009.
Author Information
Neha Ghorui
Department of Mathematics, Prasanta Chandra
Mahalanobis Mahavidyalaya, Kolkata, India.
Dr. Sankar Prasad Mondal
Department of Applied Science
Maulana Abul Kalam Azad University of
Technology, West Bengal, India.
Subrata Jana
Department of Basic Science, Seacom Engineering
College, Howrah, India.
Dr. Arijit Ghosh
Department of Mathematics, St. Xavier‟s College
(Autonomous), Kolkata, India.
Suchitra Kumari
Department of Commerce, St. Xavier‟s
College (Autonomous), Kolkata, India.
Aditya Das
Department of Commerce, Raghunathpur College,
Purulia, India.