evaluation of pedestrian data collection methods...
TRANSCRIPT
Evaluation of pedestrian data collection methods
within a simulation framework
Mamy Fetiarison
Gunnar Flötteröd
Michel Bierlaire
STRC 2010 September 2010

Evaluation of pedestrian data collection methods within a simulation framework September 2010
STRC 2010
Evaluation of pedestrian data collection methods within a sim-ulation frameworkMamy FetiarisonTRANSP-OREPFLLausannephone: +41 21 693 81 00fax: +41 21 693 80 [email protected]
Gunnar FlötterödTRANSP-OREPFLLausannephone: +41 21 693 24 29fax: +41 21 693 80 [email protected]
Michel BierlaireTRANSP-OREPFLLausannephone: +41 21 693 25 37fax: +41 21 693 80 [email protected]
September 2010
Abstract
The estimation and validation of pedestrian behavioral models requires large amounts of de-tailed and appropriate data, the collection of which is a costly and time-consuming undertaking.The identification and design of an appropriate data collection method therefore is of great im-portance, which, however, is an arduous and itself time-consuming task. This article describesa software laboratory that facilitates the design of pedestrian data collection campaigns.
Keywordspedestrian data, sensors, pedestrian model, simulation
1
Evaluation of pedestrian data collection methods within a simulation framework September 2010
1 Introduction
The design and development of pedestrian models is an arduous task that requires detailed and
appropriate data for model estimation and validation. The methodology presented in this paper
helps to analyze the walking behavior of pedestrians with substantially lower data requirements.
To that aim, a simulator serves as a pedestrian data generator. This has two advantages. First,
established models of walking behavior can be used as a synthetic reality from which new ex-
perimental models can be estimated prior to a real-world data collection campaign. Second,
the design of pedestrian experiments can be evaluated a priori. Of course, the need for real
data cannot be circumvented by the proposed system. However, it will help to minimize the
data collection efforts. The simulation system is designedin a generic way that allows to in-
vestigate pedestrian behavior at the strategic, tactical and operational level (Hoogendoornet al.
(2002)), which requires the design of a generic pedestrian model interface. To test the system,
a pedestrian model from the literature is used to generate data in the synthetic reality.
The laboratory is built around a generic pedestrian simulator, which provides two major inter-
faces: The first interface links a pedestrian simulation model to the simulator that is used to
generate a synthetic reality. The second interface extracts data from the synthetic reality using
(equally simulated) sensors. This data is what would be costly to collect in a real experiment,
but in a synthetic environment it is available in abundant amounts and at arbitrary quality.
The model interface is designed to allow for various model implementations, for example of
the following types:
• Utility maximization: Hoogendoorn and Bovy (2004) proposes an utility maximization
model where destination and routes are strongly linked to the activities the pedestrians
want to perform. This model predicts the continuous trajectory of a pedestrian. Random
utility models have been used to predict behavior of pedestrians in a configuration where
the pedestrian selects her next action from a discrete set ofalternatives (Antoniniet al.
(2006)).
• Physical and social force: Helbing and Molnar (1995) present the social force model
derived from physical interactions. Yuet al. (2005) and Chraibiet al. (2009) present
force models for pedestrian dynamics based on centrifugal forces in mechanics.
• Cellular automata: Multi-dimensional cellular automata allow to model the flow of
pedestrians with simple rules (Bursteddeet al. (2002), Schadschneider (2002)). The set
of behavioral alternatives is discrete.
• Queuing models are mainly developed for building evacuations (Lovas (1994)).
• Models designed with equations derived from gas-kinetic orfluid-dynamic theory
(Henderson (1971); Hughes (2002)): Although crowd dynamics can be efficiently cap-
tured, the resulting differential equations are not straightforward to solve (Helbinget al.
2
Evaluation of pedestrian data collection methods within a simulation framework September 2010
(2002)).
Data diversity is necessary to deal with a variety of situations. In spite of numerous pedestrian
data collection methods, setting up pedestrian experiments remain arduous, and collected data
may be appropriate for only a specific study. The literature,particularly Bierlaire and Robin
(2009), describes various methods for the collection of empirical and experimental data:
• controlled walking experiments (Daamen and Hoogendoorn (2003))
• data collection with integrated pedestrian navigation systems such as GPS, Mobile
phones, PNM ("Pedestrian Navigation Modules") (Sohnet al. (2006), Liaoet al.(2007),
Spassovet al. (2007))
• "manual" data collection: questionnaires, "following people" (Hill (1982), Verlander
(1997), Sisiopiku and Akin (2003))
Since most of these methods need time-consuming data post-processing, Kerridgeet al.(2007)
develop a technique for tracking pedestrians with a specialdevice (low cost infrared sensor)
in real-time. Spassovet al. (2007) describe the Pedestrian Navigation Module (PNM), which
provides accurate measures of pedestrian movement but needs to be associated with a map of
the movement area.
In this article, we propose a simulation laboratory that allows to assess the efficiency of a data
collection campaign within a synthetic reality prior to itsactual implementation.
3
Evaluation of pedestrian data collection methods within a simulation framework September 2010
2 Methodology description
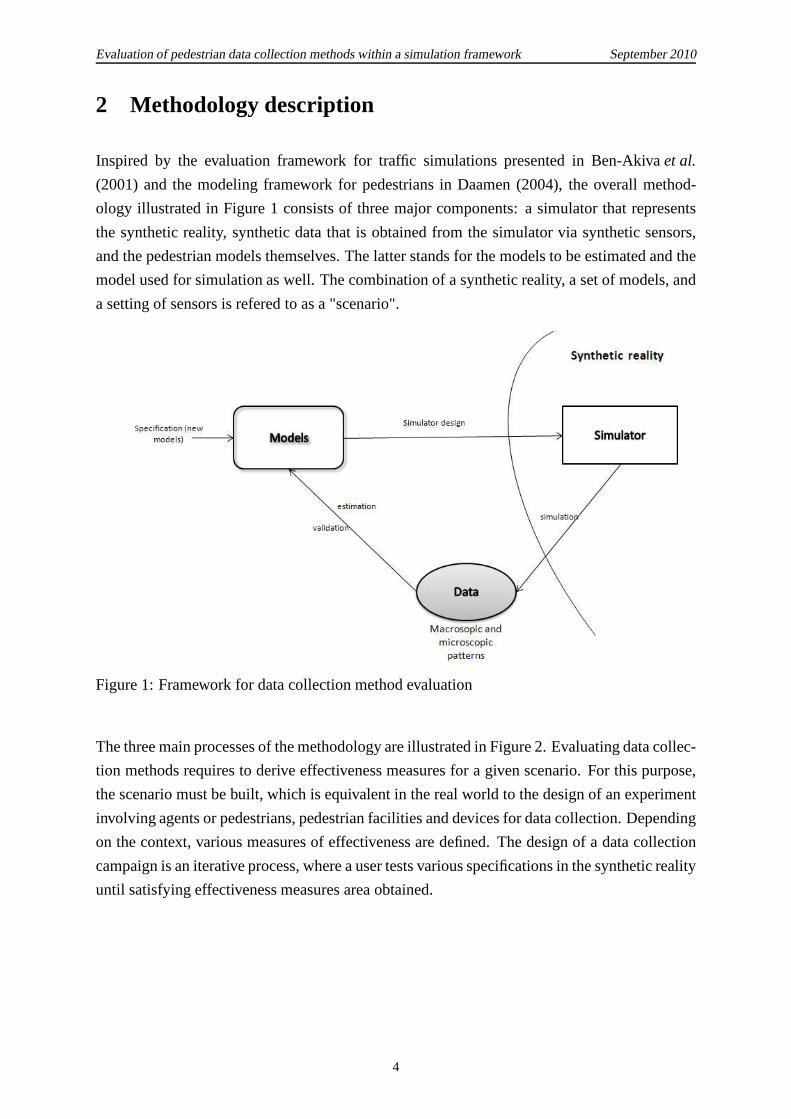
Inspired by the evaluation framework for traffic simulations presented in Ben-Akivaet al.
(2001) and the modeling framework for pedestrians in Daamen(2004), the overall method-
ology illustrated in Figure 1 consists of three major components: a simulator that represents
the synthetic reality, synthetic data that is obtained fromthe simulator via synthetic sensors,
and the pedestrian models themselves. The latter stands forthe models to be estimated and the
model used for simulation as well. The combination of a synthetic reality, a set of models, and
a setting of sensors is refered to as a "scenario".
Figure 1: Framework for data collection method evaluation
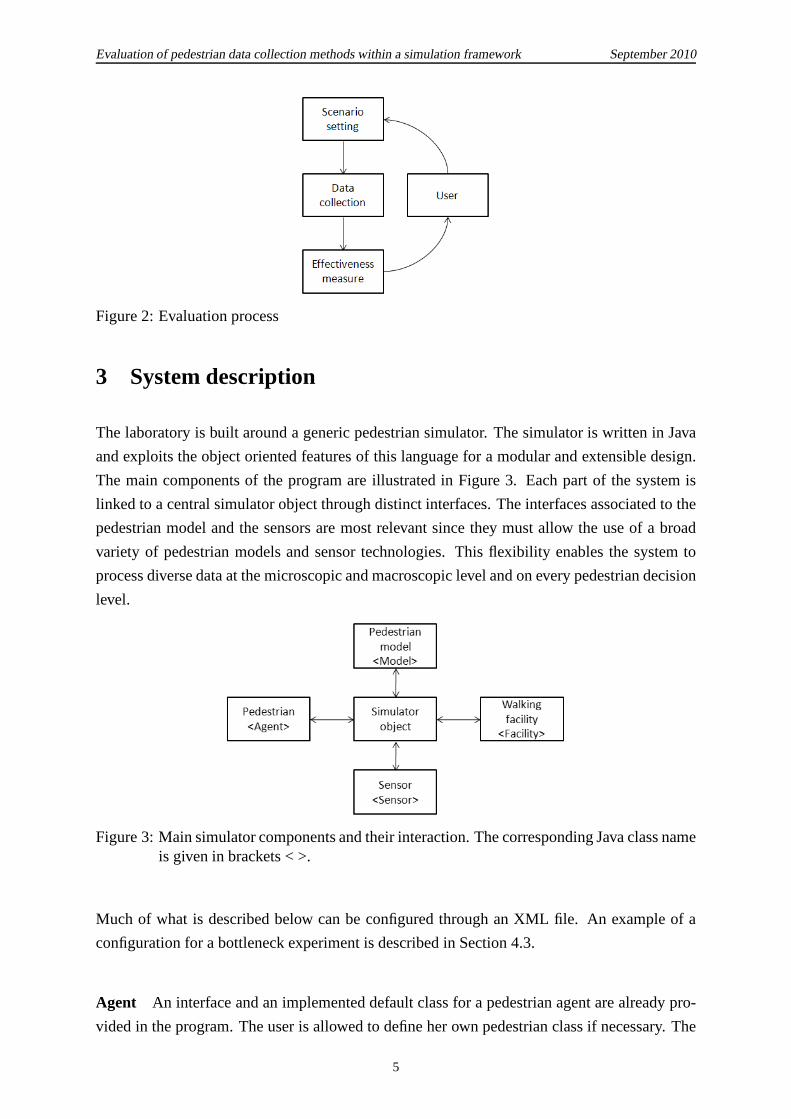
The three main processes of the methodology are illustratedin Figure 2. Evaluating data collec-
tion methods requires to derive effectiveness measures fora given scenario. For this purpose,
the scenario must be built, which is equivalent in the real world to the design of an experiment
involving agents or pedestrians, pedestrian facilities and devices for data collection. Depending
on the context, various measures of effectiveness are defined. The design of a data collection
campaign is an iterative process, where a user tests variousspecifications in the synthetic reality
until satisfying effectiveness measures area obtained.
4
Evaluation of pedestrian data collection methods within a simulation framework September 2010
Figure 2: Evaluation process
3 System description
The laboratory is built around a generic pedestrian simulator. The simulator is written in Java
and exploits the object oriented features of this language for a modular and extensible design.
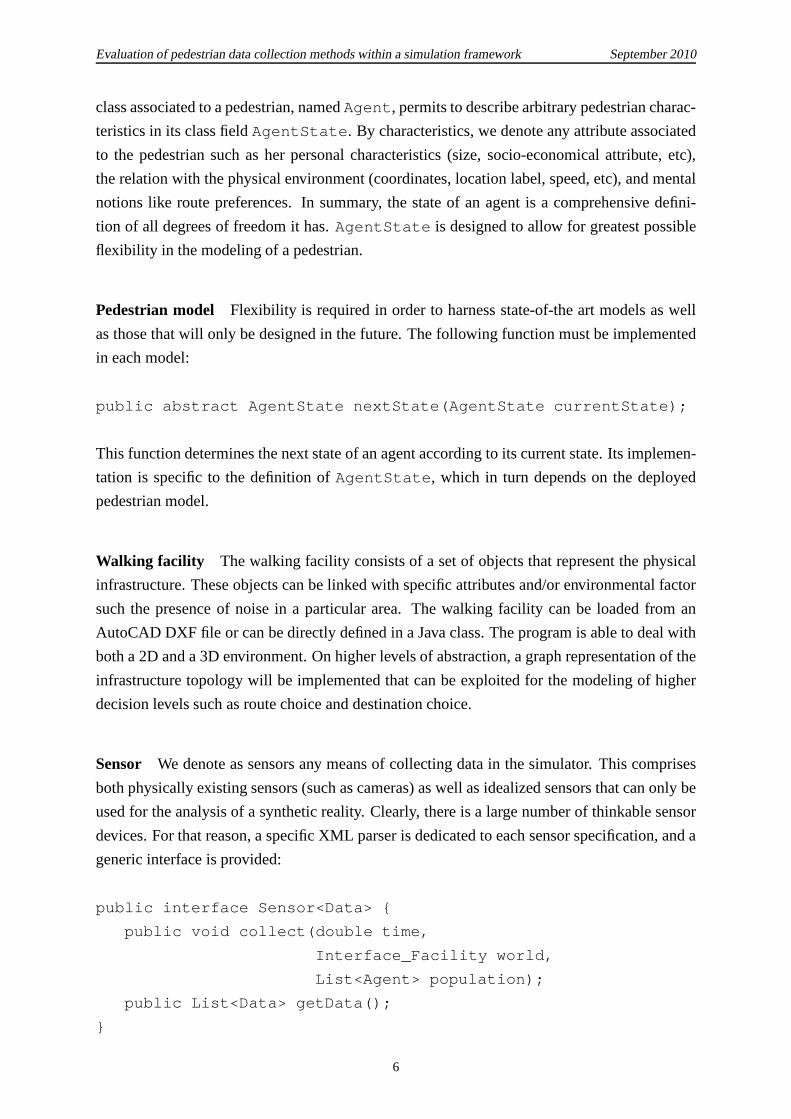
The main components of the program are illustrated in Figure3. Each part of the system is
linked to a central simulator object through distinct interfaces. The interfaces associated to the
pedestrian model and the sensors are most relevant since they must allow the use of a broad
variety of pedestrian models and sensor technologies. Thisflexibility enables the system to
process diverse data at the microscopic and macroscopic level and on every pedestrian decision
level.
Figure 3: Main simulator components and their interaction.The corresponding Java class nameis given in brackets < >.
Much of what is described below can be configured through an XML file. An example of a
configuration for a bottleneck experiment is described in Section 4.3.
Agent An interface and an implemented default class for a pedestrian agent are already pro-
vided in the program. The user is allowed to define her own pedestrian class if necessary. The
5
Evaluation of pedestrian data collection methods within a simulation framework September 2010
class associated to a pedestrian, namedAgent, permits to describe arbitrary pedestrian charac-
teristics in its class fieldAgentState. By characteristics, we denote any attribute associated
to the pedestrian such as her personal characteristics (size, socio-economical attribute, etc),
the relation with the physical environment (coordinates, location label, speed, etc), and mental
notions like route preferences. In summary, the state of an agent is a comprehensive defini-
tion of all degrees of freedom it has.AgentState is designed to allow for greatest possible
flexibility in the modeling of a pedestrian.
Pedestrian model Flexibility is required in order to harness state-of-the art models as well
as those that will only be designed in the future. The following function must be implemented
in each model:
public abstract AgentState nextState(AgentState currentState);
This function determines the next state of an agent according to its current state. Its implemen-
tation is specific to the definition ofAgentState, which in turn depends on the deployed
pedestrian model.
Walking facility The walking facility consists of a set of objects that represent the physical
infrastructure. These objects can be linked with specific attributes and/or environmental factor
such the presence of noise in a particular area. The walking facility can be loaded from an
AutoCAD DXF file or can be directly defined in a Java class. The program is able to deal with
both a 2D and a 3D environment. On higher levels of abstraction, a graph representation of the
infrastructure topology will be implemented that can be exploited for the modeling of higher
decision levels such as route choice and destination choice.
Sensor We denote as sensors any means of collecting data in the simulator. This comprises
both physically existing sensors (such as cameras) as well as idealized sensors that can only be
used for the analysis of a synthetic reality. Clearly, thereis a large number of thinkable sensor
devices. For that reason, a specific XML parser is dedicated to each sensor specification, and a
generic interface is provided:
public interface Sensor<Data> {
public void collect(double time,
Interface_Facility world,
List<Agent> population);
public List<Data> getData();
}
6
Evaluation of pedestrian data collection methods within a simulation framework September 2010
A simple implementation of thecollect() function for a camera would be the following:
public void collect(double time,
Interface_Facility world,
List<Agent> population) {
if ( isRenderingTime(time) ) {
Frame frame = new Frame();
frame.time = time;
frame.population = population;
frame.world = world;
render(camera, frame);
renderingTime = nextRenderingTime();
}
}
This function is called at each simulation loop iteration and then allows the sensor class imple-
mentation to capture relevant system information. In fact,the system is fully described with the
walking infrastructureworld and the populationpopulation specifying its entire state at
timetime. The implementation of thecollect() function for a camera will render a frame
(an image) of the scene (walking infrastructure and agents)at each rendering time according to
the camera object specification.
7
Evaluation of pedestrian data collection methods within a simulation framework September 2010
4 Example: data collection in a bottleneck
The purpose of this test case is to demonstrate the system’s capability to provide useful and
proper data for the analysis of a given scenario. For the sakeof illustration, the generation of
speed and density measurements at a bottleneck (see Figure 4) is explained. This study can be
extended to obtain a pedestrian fundamental diagram. A normal situation is considered, i.e.,
pedestrians are not in a rush and no herding behavior is modeled.
Various pedestrian studies in bottleneck scenarios have been conducted in the past
(Seyfriedet al. (2009a), Hoogendoorn and Daamen (2005)). They mainly aim atrevealing the
pedestrian behavior in such a situation and/or to evaluate the capacity of the facility. Typically,
a camera is used to capture the density in front of and the flow through the bottleneck. Of-
ten, an investigation of structural patterns (lane formation, zipper effect) is combined with a
quantitative analysis of pedestrian velocities, densities and flow.
The relation between velocities and densities, commonly called the fundamental diagram, is
a recurringly visited topic. Indeed, there is no agreement on a common fundamental diagram
and several parameters have been cited to explain the disagreement, including cultural differ-
ences or psychological factors (Seyfriedet al. (2009a)). For these reasons, the understanding
of pedestrian fundamental diagrams is still limited (Seyfried et al. (2009b)).
In this section, the use of two kinds of sensors, namely videocameras and GPS devices, is
illustrated. For the first sensor type, one or two cameras recording the scene are specified.
Since video processing is not part of this study, this data collection is performed before frames
rendering, i.e., all facilities (walls, obstacles) and pedestrian coordinates are directly extracted
from the simulation. It also would be possible to record the scene from the (moving) perspective
of a particular pedestrian. For the second sensor type, a fraction of the pedestrians is assumed
to be carrying a GPS device. These devices record positions and velocities with a certain
inaccuracy due to the presence of noise and/or low signal transmissions.
The pedestrian model is a relevant part of the framework. Thesimulated model (the model
generating the synthetic reality) should be carefully selected since different pedestrian models
apply to different scenarios, for example for routing in complex environments, to reproduce
pedestrian behavior in congestion, at bottlenecks, etc. Asstated in Section 3, the system is
able to consider different pedestrian models. A modified Centrifugal Force Model (CFM) for
pedestrian dynamics (Chraibiet al. (2009)) is employed for the data generation in this study.
The flexibility of the simulator has been tested by also usingthe discrete choice models of
pedestrian walking behavior presented by Antoniniet al. (2006) and Robin (2009).
8

Evaluation of pedestrian data collection methods within a simulation framework September 2010
4.1 Experimental setup
We reconstruct the experiment conducted in Seyfriedet al.(2009a) and Seyfriedet al.(2009b).
Figure 4 shows the bottleneck facility with its corresponding dimensions. The width of the bot-
tleneckb is one of the controlled parameter handled in the referencedwork, but for simplicity
we always useb = 1.2m in the current study. The length of the corridor right behindthe bottle-
neck entrance is2.8m. The walls composing the facility are high enough (2m) to be an opaque
obstacle that a pedestrian is unable to look through.N = 60 pedestrians are asked to start
from 3m in front of the entrance of the bottleneck at the beginning ofthe experiment. They
are arranged to occupy uniformly the holding area with widthw = 4m, resulting in an initial
density ofρ = 3.3m−2 in this area. The pedestrians are required to walk through the bottleneck
in a normal way, with no rush but with resoluteness.
Figure 4: The bottleneck facility. Top view cameras are placed above the black dots.
In the original experiment, two top view cameras film in frontof the bottleneck and in the
corridor. Their locations are represented by the black dotsin figure 4.
4.2 The modified Centrifugal Force Model
The modified Centrifugal Force Model used for the simulationis a microscopic model that
is working at the operational level that is it deals with short term actions such as collision
avoidance and change in direction or speed. Further detailsabout the specification can be
found in Chraibiet al.(2009). The model is derived from the original Centrifugal Force Model
9
Evaluation of pedestrian data collection methods within a simulation framework September 2010
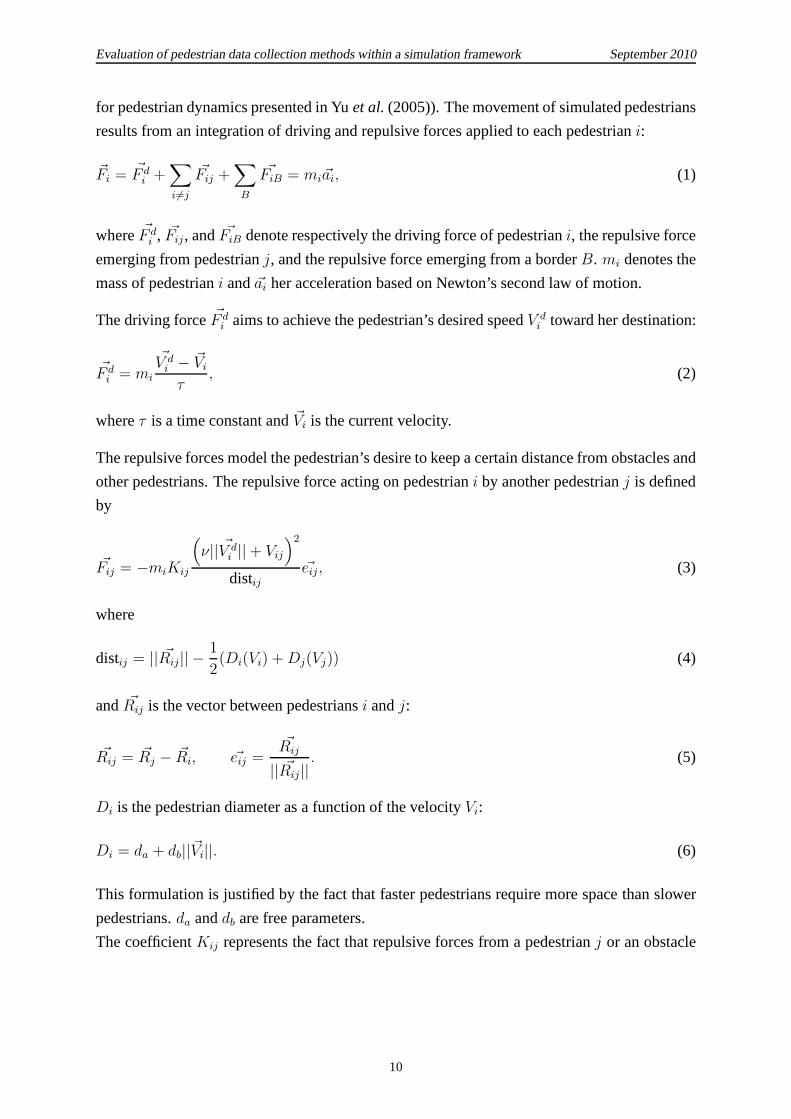
for pedestrian dynamics presented in Yuet al.(2005)). The movement of simulated pedestrians
results from an integration of driving and repulsive forcesapplied to each pedestriani:
~Fi =~F di +
∑
i 6=j
~Fij +∑
B
~FiB = mi~ai, (1)
where ~F di , ~Fij , and ~FiB denote respectively the driving force of pedestriani, the repulsive force
emerging from pedestrianj, and the repulsive force emerging from a borderB. mi denotes the
mass of pedestriani and~ai her acceleration based on Newton’s second law of motion.
The driving force~F di aims to achieve the pedestrian’s desired speedV d
i toward her destination:
~F di = mi
~V di − ~Vi
τ, (2)
whereτ is a time constant and~Vi is the current velocity.
The repulsive forces model the pedestrian’s desire to keep acertain distance from obstacles and
other pedestrians. The repulsive force acting on pedestrian i by another pedestrianj is defined
by
~Fij = −miKij
(
ν|| ~V di ||+ Vij
)
2
distij~eij, (3)
where
distij = || ~Rij|| −1
2(Di(Vi) +Dj(Vj)) (4)
and ~Rij is the vector between pedestriansi andj:
~Rij = ~Rj − ~Ri, ~eij =~Rij
|| ~Rij||. (5)
Di is the pedestrian diameter as a function of the velocityVi:
Di = da + db||~Vi||. (6)
This formulation is justified by the fact that faster pedestrians require more space than slower
pedestrians.da anddb are free parameters.
The coefficientKij represents the fact that repulsive forces from a pedestrianj or an obstacle
10
Evaluation of pedestrian data collection methods within a simulation framework September 2010
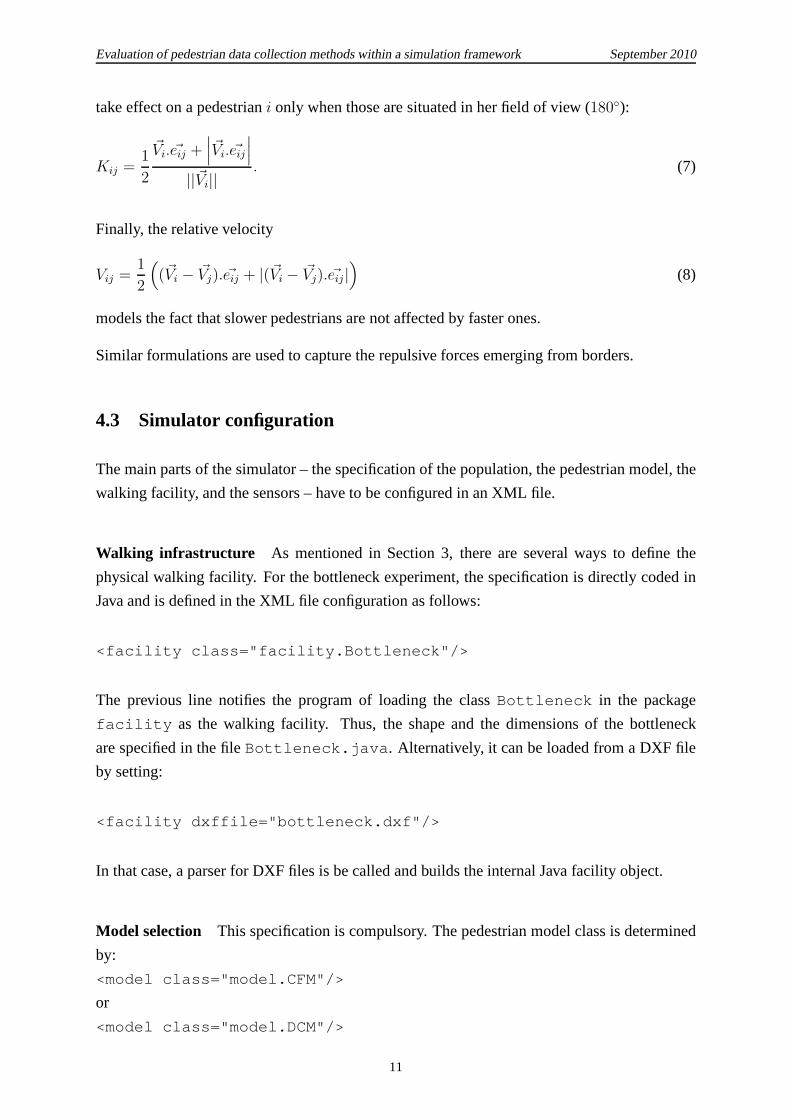
take effect on a pedestriani only when those are situated in her field of view (180◦):
Kij =1
2
~Vi. ~eij +∣
∣
∣
~Vi. ~eij
∣
∣
∣
||~Vi||. (7)
Finally, the relative velocity
Vij =1
2
(
(~Vi − ~Vj). ~eij + |(~Vi − ~Vj). ~eij |)
(8)
models the fact that slower pedestrians are not affected by faster ones.
Similar formulations are used to capture the repulsive forces emerging from borders.
4.3 Simulator configuration
The main parts of the simulator – the specification of the population, the pedestrian model, the
walking facility, and the sensors – have to be configured in anXML file.
Walking infrastructure As mentioned in Section 3, there are several ways to define the
physical walking facility. For the bottleneck experiment,the specification is directly coded in
Java and is defined in the XML file configuration as follows:
<facility class="facility.Bottleneck"/>
The previous line notifies the program of loading the classBottleneck in the package
facility as the walking facility. Thus, the shape and the dimensions of the bottleneck
are specified in the fileBottleneck.java. Alternatively, it can be loaded from a DXF file
by setting:
<facility dxffile="bottleneck.dxf"/>
In that case, a parser for DXF files is be called and builds the internal Java facility object.
Model selection This specification is compulsory. The pedestrian model class is determined
by:
<model class="model.CFM"/>
or
<model class="model.DCM"/>
11
Evaluation of pedestrian data collection methods within a simulation framework September 2010
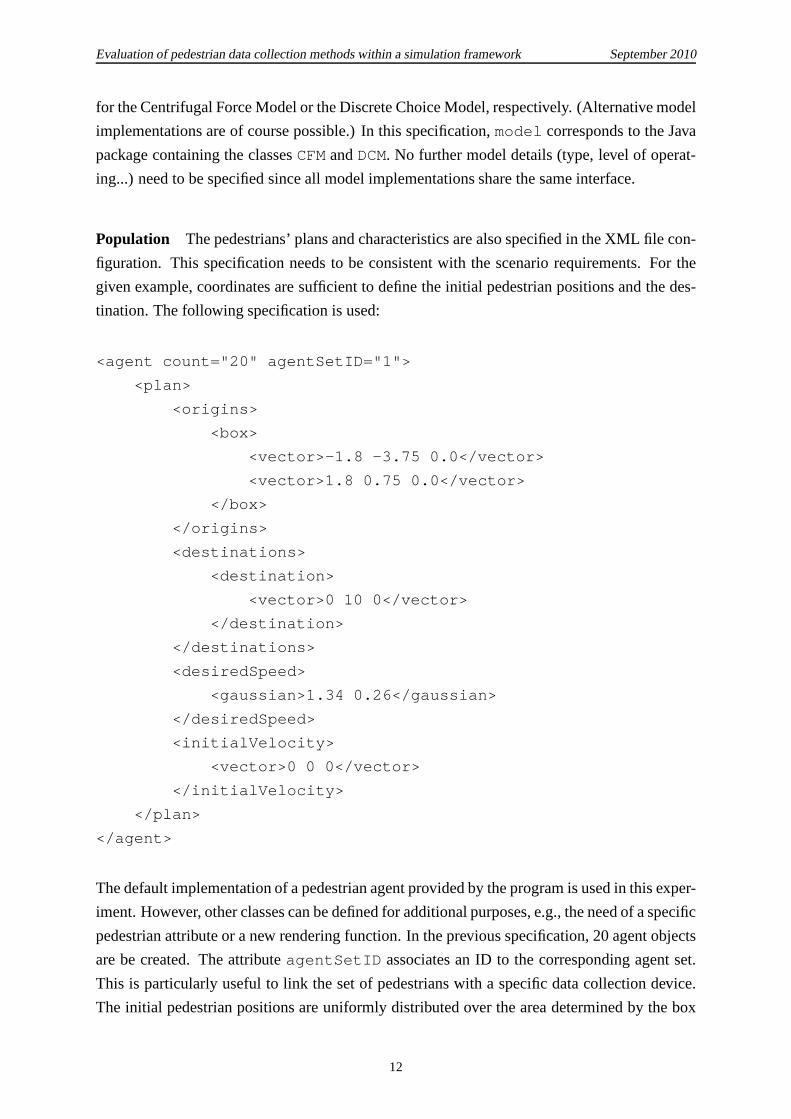
for the Centrifugal Force Model or the Discrete Choice Model, respectively. (Alternative model
implementations are of course possible.) In this specification, model corresponds to the Java
package containing the classesCFM andDCM. No further model details (type, level of operat-
ing...) need to be specified since all model implementationsshare the same interface.
Population The pedestrians’ plans and characteristics are also specified in the XML file con-
figuration. This specification needs to be consistent with the scenario requirements. For the
given example, coordinates are sufficient to define the initial pedestrian positions and the des-
tination. The following specification is used:
<agent count="20" agentSetID="1">
<plan>
<origins>
<box>
<vector>-1.8 -3.75 0.0</vector>
<vector>1.8 0.75 0.0</vector>
</box>
</origins>
<destinations>
<destination>
<vector>0 10 0</vector>
</destination>
</destinations>
<desiredSpeed>
<gaussian>1.34 0.26</gaussian>
</desiredSpeed>
<initialVelocity>
<vector>0 0 0</vector>
</initialVelocity>
</plan>
</agent>
The default implementation of a pedestrian agent provided by the program is used in this exper-
iment. However, other classes can be defined for additional purposes, e.g., the need of a specific
pedestrian attribute or a new rendering function. In the previous specification, 20 agent objects
are be created. The attributeagentSetID associates an ID to the corresponding agent set.
This is particularly useful to link the set of pedestrians with a specific data collection device.
The initial pedestrian positions are uniformly distributed over the area determined by the box
12
Evaluation of pedestrian data collection methods within a simulation framework September 2010
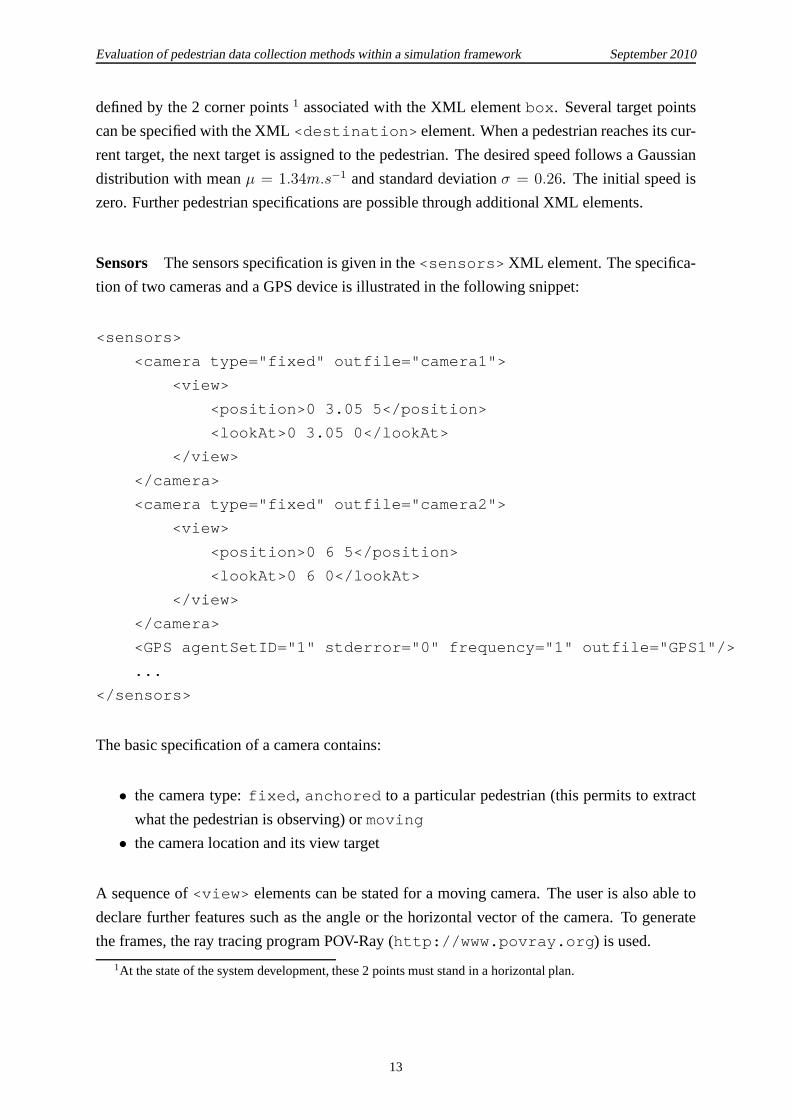
defined by the 2 corner points1 associated with the XML elementbox. Several target points
can be specified with the XML<destination> element. When a pedestrian reaches its cur-
rent target, the next target is assigned to the pedestrian. The desired speed follows a Gaussian
distribution with meanµ = 1.34m.s−1 and standard deviationσ = 0.26. The initial speed is
zero. Further pedestrian specifications are possible through additional XML elements.
Sensors The sensors specification is given in the<sensors> XML element. The specifica-
tion of two cameras and a GPS device is illustrated in the following snippet:
<sensors>
<camera type="fixed" outfile="camera1">
<view>
<position>0 3.05 5</position>
<lookAt>0 3.05 0</lookAt>
</view>
</camera>
<camera type="fixed" outfile="camera2">
<view>
<position>0 6 5</position>
<lookAt>0 6 0</lookAt>
</view>
</camera>
<GPS agentSetID="1" stderror="0" frequency="1" outfile="GPS1"/>
...
</sensors>
The basic specification of a camera contains:
• the camera type:fixed, anchored to a particular pedestrian (this permits to extract
what the pedestrian is observing) ormoving
• the camera location and its view target
A sequence of<view> elements can be stated for a moving camera. The user is also able to
declare further features such as the angle or the horizontalvector of the camera. To generate
the frames, the ray tracing program POV-Ray (http://www.povray.org) is used.
1At the state of the system development, these 2 points must stand in a horizontal plan.
13
Evaluation of pedestrian data collection methods within a simulation framework September 2010
4.4 Data generation
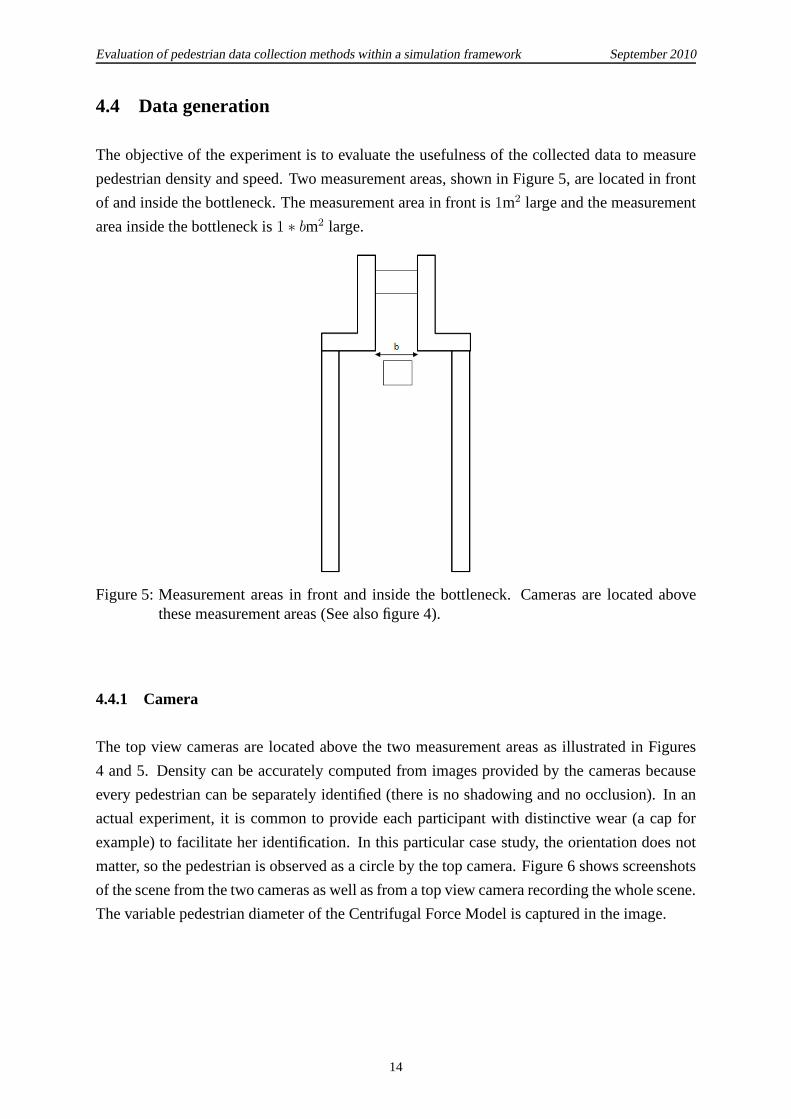
The objective of the experiment is to evaluate the usefulness of the collected data to measure
pedestrian density and speed. Two measurement areas, shownin Figure 5, are located in front
of and inside the bottleneck. The measurement area in front is1m2 large and the measurement
area inside the bottleneck is1 ∗ bm2 large.
Figure 5: Measurement areas in front and inside the bottleneck. Cameras are located abovethese measurement areas (See also figure 4).
4.4.1 Camera
The top view cameras are located above the two measurement areas as illustrated in Figures
4 and 5. Density can be accurately computed from images provided by the cameras because
every pedestrian can be separately identified (there is no shadowing and no occlusion). In an
actual experiment, it is common to provide each participantwith distinctive wear (a cap for
example) to facilitate her identification. In this particular case study, the orientation does not
matter, so the pedestrian is observed as a circle by the top camera. Figure 6 shows screenshots
of the scene from the two cameras as well as from a top view camera recording the whole scene.
The variable pedestrian diameter of the Centrifugal Force Model is captured in the image.
14

Evaluation of pedestrian data collection methods within a simulation framework September 2010
Figure 6: View from three top cameras: in front of the bottleneck, inside the bottleneck, andview of the whole.
4.4.2 GPS
For this case study, the use of GPS data for density estimation is difficult for several reasons.
First, the data provided by GPS devices is not accurate due toinherent noise. The intensity
of this noise can be specified in the simulation. Second, not all participant are furnished with
such a device; hence, the measured density must be accordingly scaled up. The density es-
timation error is expected to increase when the equipment proportion decreases. Finally, the
measurement area is small (≈ 1m2) with respect to the GPS data accuracy.
Noise threshold GPS noise is represented by an additive disturbance of the pedestrian coor-
dinates in the sensor, following a Gaussian distribution. It turns out that inaccurate GPS devices
are not appropriate for the density estimation; this is mainly due to the small measurement area.
Indeed, when the standard deviation of the noise exceeds0.3m, the measured density is essen-
tially random. Notice that error of GPS sensors embedded in standard smartphones can easily
have a standard deviation of100m.
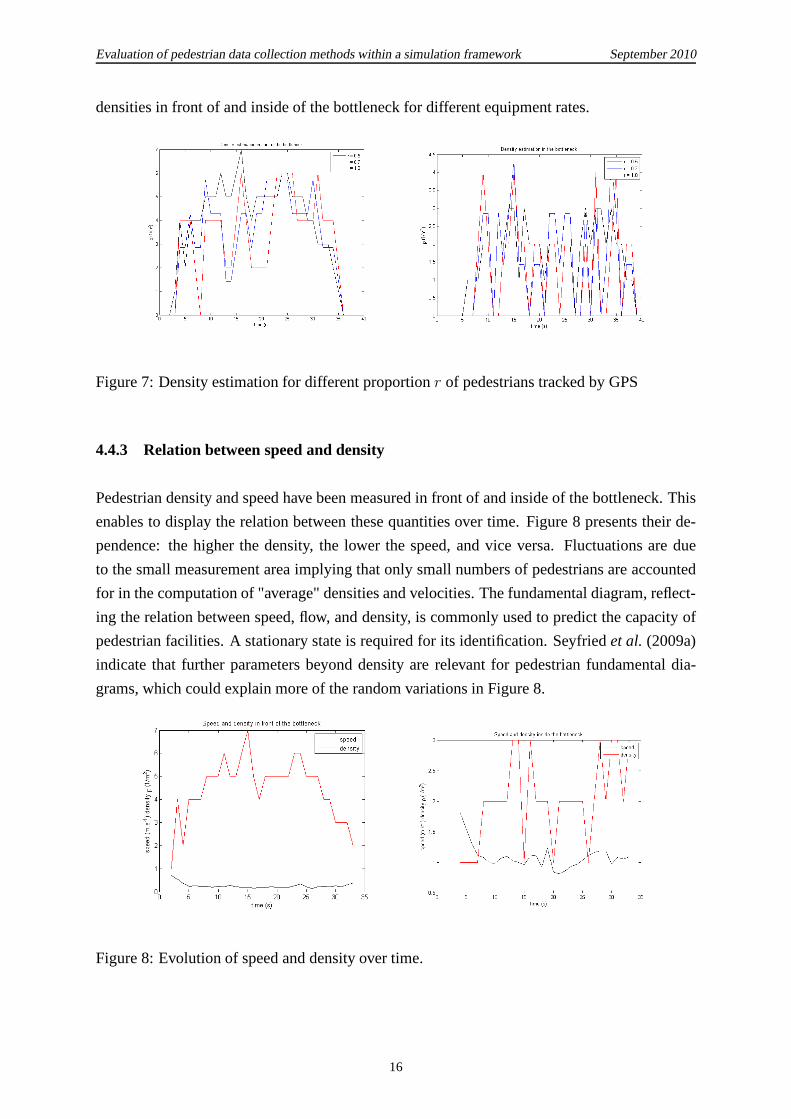
Equipment rate It is also interesting to determine if satisfactory data canbe obtained from
GPS devices if only a subset of all pedestrians carries a device. OnlyaccurateGPS measure-
ments are considered for illustration. Assume thatr is the fraction of equipped pedestrians.
Therefore, the number of pedestrian with a device isn = Nr, with N being the total number of
pedestrians. The estimated density isd̄ = n̄/s wheres is the measurement area andn̄ = n/r is
the estimated number of pedestrians in the measurement area. Figure 7 illustrates the estimated
15
Evaluation of pedestrian data collection methods within a simulation framework September 2010
densities in front of and inside of the bottleneck for different equipment rates.
Figure 7: Density estimation for different proportionr of pedestrians tracked by GPS
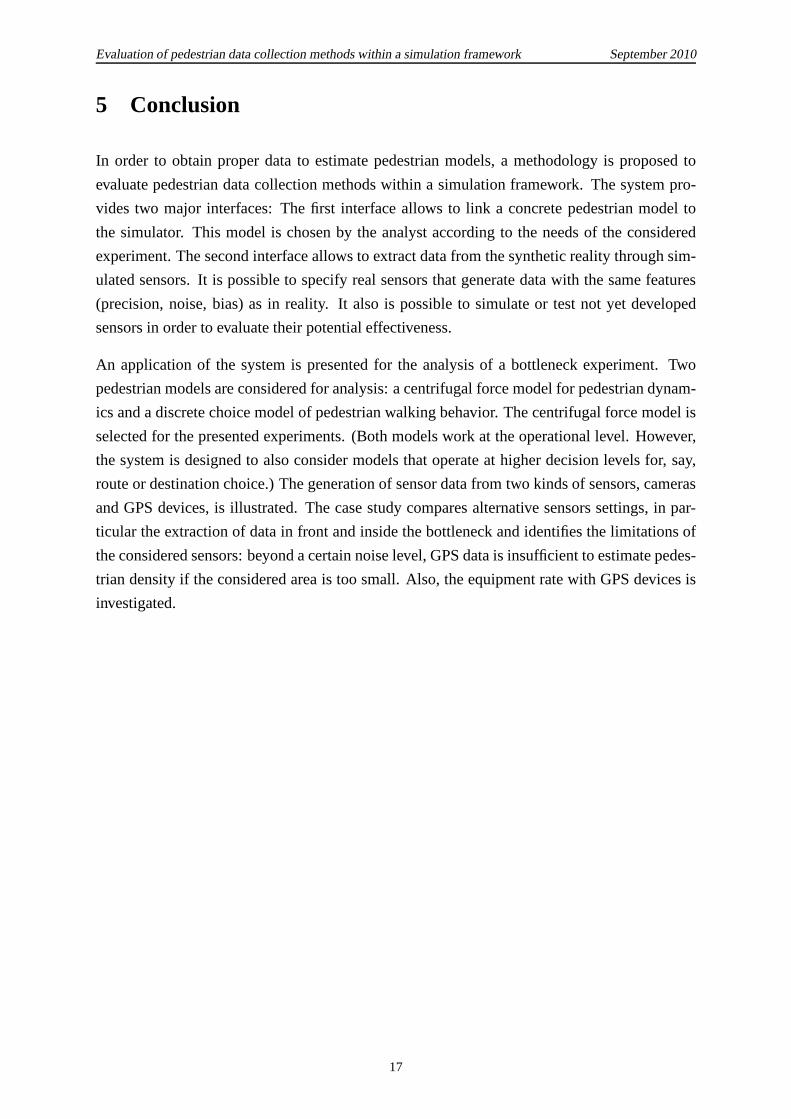
4.4.3 Relation between speed and density
Pedestrian density and speed have been measured in front of and inside of the bottleneck. This
enables to display the relation between these quantities over time. Figure 8 presents their de-
pendence: the higher the density, the lower the speed, and vice versa. Fluctuations are due
to the small measurement area implying that only small numbers of pedestrians are accounted
for in the computation of "average" densities and velocities. The fundamental diagram, reflect-
ing the relation between speed, flow, and density, is commonly used to predict the capacity of
pedestrian facilities. A stationary state is required for its identification. Seyfriedet al. (2009a)
indicate that further parameters beyond density are relevant for pedestrian fundamental dia-
grams, which could explain more of the random variations in Figure 8.
Figure 8: Evolution of speed and density over time.
16
Evaluation of pedestrian data collection methods within a simulation framework September 2010
5 Conclusion
In order to obtain proper data to estimate pedestrian models, a methodology is proposed to
evaluate pedestrian data collection methods within a simulation framework. The system pro-
vides two major interfaces: The first interface allows to link a concrete pedestrian model to
the simulator. This model is chosen by the analyst accordingto the needs of the considered
experiment. The second interface allows to extract data from the synthetic reality through sim-
ulated sensors. It is possible to specify real sensors that generate data with the same features
(precision, noise, bias) as in reality. It also is possible to simulate or test not yet developed
sensors in order to evaluate their potential effectiveness.
An application of the system is presented for the analysis ofa bottleneck experiment. Two
pedestrian models are considered for analysis: a centrifugal force model for pedestrian dynam-
ics and a discrete choice model of pedestrian walking behavior. The centrifugal force model is
selected for the presented experiments. (Both models work at the operational level. However,
the system is designed to also consider models that operate at higher decision levels for, say,
route or destination choice.) The generation of sensor datafrom two kinds of sensors, cameras
and GPS devices, is illustrated. The case study compares alternative sensors settings, in par-
ticular the extraction of data in front and inside the bottleneck and identifies the limitations of
the considered sensors: beyond a certain noise level, GPS data is insufficient to estimate pedes-
trian density if the considered area is too small. Also, the equipment rate with GPS devices is
investigated.
17

Evaluation of pedestrian data collection methods within a simulation framework September 2010
References
Antonini, G., M. Bierlaire and M. Weber (2006) Discrete choice models of pedestrian walking
behavior,Transportation Research Part B-Methodological, 40 (8) 667–687.
Ben-Akiva, M., M. Bierlaire, D. Burton, H. N. Koutsopoulos and R. Mishalani (2001) Network
state estimation and prediction for real-time transportation management applications,Net-
works and Spatial Economics, 1 (3-4) 293–318. Cited By (since 1996): 19 Export Date: 21
November 2009 Source: Scopus.
Bierlaire, M. and T. Robin (2009) Pedestrians choices, in H.Timmermans (ed.)Pedestrian Be-
havior. Models, Data Collection and Applications, 1–26, Emerald Group Publishing Limited.
ISBN:978-1-84855-750-5.
Burstedde, C., A. Kirchner, K. Klauck, A. Schadschneider and J. Zittartz (2002) Cellular au-
tomaton approach to pedestrian dynamics - applications,Pedestrian and Evacuation Dynam-
ics, 87–97. Bv52v Times Cited:6 Cited References Count:5.
Chraibi, M., A. Seyfried, A. Schadschneider and W. Mackens (2009) Quantitative description
of pedestrian dynamics with a force-based model. 1632261 583-586.
Daamen, W. (2004) Modelling passenger flows in public transport facilities, Ph.D. Thesis.
Daamen, W. and S. P. Hoogendoorn (2003) Experimental research of pedestrian walking be-
havior,Pedestrians and Bicycles 2003, (1828) 20–30. Times Cited: 4 82nd Annual Meeting
of the Transportation-Research-Board Jan 12-16, 2003 Washington, d.c.
Helbing, D., I. J. Farkas, P. Molnar and T. Vicsek (2002) Simulation of pedestrian crowds
in normal and evacuation situations,Pedestrian and Evacuation Dynamics, 21–58. Bv52v
Times Cited:23 Cited References Count:153.
Helbing, D. and P. Molnar (1995) Social force model for pedestrian dynamics,Physical Review
E, 51 (5) 4282–4286. Part A Qz153 Times Cited:264 Cited References Count:33.
Henderson, L. F. (1971) The statistics of crowd fluids,Nature, 229 (5284) 381–383. Cited By
(since 1996): 50 Export Date: 21 November 2009 Source: Scopus.
Hill, M. R. (1982) "spatial structure and decision-making of pedestrian route selection through
an urban environment",Spatial Structure and Decision-making of Pedestrian RouteSelection
Through an Urban Environment. Cited By (since 1996): 6 Export Date: 21 November 2009
Source: Scopus.
Hoogendoorn, S. P. and P. H. L. Bovy (2004) Pedestrian route-choice and activity scheduling
theory and models,Transportation Research Part B-Methodological, 38 (2) 169–190. 765TT
Times Cited:33 Cited References Count:19.
18
Evaluation of pedestrian data collection methods within a simulation framework September 2010
Hoogendoorn, S. P., P. H. L. Bovy and W. Daamen (2002) Microscopic pedestrian wayfinding
and dynamics modelling,Pedestrian and Evacuation Dynamics, 123–154.
Hoogendoorn, S. P. and W. Daamen (2005) Pedestrian behaviorat bottlenecks,Transportation
Science, 39 (2) 147–159. Cited By (since 1996): 30 Export Date: 5 August 2010 Source:
Scopus.
Hughes, R. L. (2002) A continuum theory for the flow of pedestrians,Transportation Research
Part B: Methodological, 36 (6) 507–535. Cited By (since 1996): 48 Export Date: 21 Novem-
ber 2009 Source: Scopus.
Kerridge, J., S. Keller, T. Chamberlain and N. Sumpter (2007) Collecting pedestrian trajectory
data in real time,Pedestrian and Evacuation Dynamics 2005, 27–39. Cited By (since 1996):
3 Export Date: 21 November 2009 Source: Scopus.
Liao, L., D. J. Patterson, D. Fox and H. Kautz (2007) Learningand inferring transportation
routines,Artificial Intelligence, 171(5-6) 311–331. Cited By (since 1996): 28 Export Date:
21 November 2009 Source: Scopus.
Lovas, G. G. (1994) Modeling and simulation of pedestrian traffic flow, Transportation Re-
search Part B-Methodological, 28 (6) 429–443. Qb756 Times Cited:42 Cited References
Count:44.
Robin, T. (2009) Specification, estimation and validation of a pedestrian walking behavior
model,Transportation research. Part B, Methodological, 43 (1) 36–56.
Schadschneider, A. (2002) Cellular automaton approach to pedestrian dynamics - theory,
Pedestrian and Evacuation Dynamics, 75–85. Bv52v Times Cited:15 Cited References
Count:27.
Seyfried, A., O. Passon, B. Steffen, M. Boltes, T. Rupprechtand W. Klingsch (2009a) New
insights into pedestrian flow through bottlenecks,Transportation Science, 43 (3) 395–406.
Cited By (since 1996): 1 Export Date: 18 May 2010 Source: Scopus.
Seyfried, A., B. Steffen, A. Winkens, T. Rupprecht, M. Boltes and W. Klingsch (2009b) Empir-
ical data for pedestrian flow through bottlenecks,Traffic and Granular Flow ’07, 189–199.
Times Cited: 1 AppertRolland, C Chevoir, F Gondret, P Lassarre, S Lebacque, JP Schreck-
enberg, M Conference on Traffic and Granular Flow JUN 20-22, 2007 Paris-Sub Univ, Orsay,
FRANCE.
Sisiopiku, V. P. and D. Akin (2003) Pedestrian behaviors at and perceptions towards various
pedestrian facilities: An examination based on observation and survey data,Transportation
Research Part F: Traffic Psychology and Behaviour, 6 (4) 249–274. Cited By (since 1996):
10 Export Date: 21 November 2009 Source: Scopus.
19
Evaluation of pedestrian data collection methods within a simulation framework September 2010
Sohn, T., A. Varshavsky, A. LaMarca, M. Y. Chen, T. Choudhury, I. Smith, S. Consolvo,
J. Hightower, W. G. Griswold and E. de Lara (2006) Mobility detection using everyday gsm
traces,Ubicomp 2006: Ubiquitous Computing, Proceedings, 4206, 212–224. Times Cited:
9 Dourish, P Friday, A 8th International Conference on Ubiquitous Computing Sep 17-21,
2006 Orange Cty, CA.
Spassov, I., B. Merminod and M. Bierlaire (2007) Algorithmsfor map-aided autonomous in-
door pedestrian positioning and navigation, Ph.D. Thesis.
Verlander, N. Q. (1997) Pedestrian route choice: An empirical study,Proceedings of Seminar
F of the PTRC European Transport Forum, P415, 39–49. Cited By (since 1996): 4 Export
Date: 6 August 2009 Source: Scopus.
Yu, W. J., R. Chen, L. Y. Dong and S. Q. Dai (2005) Centrifugal force model for pedestrian
dynamics,Physical Review E - Statistical, Nonlinear, and Soft MatterPhysics, 72 (2) 1–7.
Cited By (since 1996): 11 Export Date: 20 May 2010 Source: Scopus Art. No.: 026112.
20