evaluation of optimal chemical aids and process parameters
TRANSCRIPT

Evaluation of Optimal Chemical Aids and
Process Parameters in Oil Refinery
Wastewater Flocculation and Flotation
Thesis for M.Sc. in Chemical and Process Engineering
by
Ralf Sirén
Faculty of Science and Engineering
Johan Gadolin Process Chemistry Centre
Laboratory of Industrial Chemistry and Reaction Engineering
Supervised by M.Sc. (Tech.) Maarit Arpalo (Neste Oyj)
Prof. Dmitry Murzin (ÅA)
Turku, Finland, 2019

Acknowledgements
i
Ralf Sirén
Acknowledgements
I want to express my sincere gratitude to Prof. Dmitry Murzin for his support I am
greatly indebted to him for his valuable comments on this thesis, and his fascinating
lectures throughout my studies at ÅAU.
I would also like to acknowledge my colleagues at Neste Corporation, especially the lab
personnel and plant operators, without whom I could not have completed this work. I
express my special gratitude to Kimmo Korsimo, who helped me immensely and taught
me much about wastewater treatment and working in the industry. I also want to thank
Maarit Arpalo for the opportunity to do this work and showing me what refinery
leadership is about, and all the lovely people at the office for all the laughs we had.
Last but not least, I thank my beloved girlfriend Elisa for always standing by me and
sharing my life.

Abstract
ii
Ralf Sirén
Abstract
Wastewater treatment of oil refinery effluents is a prerequisite for refinery operations
in a continuously stricter environmental regulatory framework. One effective method
of treating typical refinery wastewaters with oil-in-water emulsion is chemical
destabilisation by metal salts, followed by separation of oil by flotation. The aim of this
work was to improve the performance of the Naantali Oil Refinery Wastewater
Treatment Plant with respect to oil, chemical oxygen demand, suspended solids,
phosphorus, and turbidity removal. This was done experimentally, by assessment of
chemicals, pH, and dissolved air flotation (DAF) process parameters. The performance
of aluminium sulphate, polyaluminium chloride, ferric sulphate and ferric chloride and
six different polyacrylamide flocculants were evaluated by jar testing. Ferric sulphate
and low charge density cationic and anionic polyacrylamides were then evaluated in
industrial scale experiments. The novel chemicals and DAF parameters recommended
were found on average to reduce all the flotation overflow impurities by more than 50%
compared to the conventional process. The optimal operating parameters in the
industrial scale were found to be 1-2 mg/l of flocculant, an average dose of 35 mg/l ferric
sulphate and pH 7-8. Various process disturbances can require up to 180 mg/l of ferric
sulphate, which increases purification in a dose-dependent manner. The DAF system
airflow was raised from 20 Nm3/h to 30 Nm3/h, which reduced suspended solids by
34% compared to the reference. For future research it is recommended to assess the
performance of combinations of Al and Fe-based coagulants for disturbances caused by
high levels of hydrogen sulphide.

Table of Contents
iii
Ralf Sirén
Table of Contents
Acknowledgements ............................................................................................................ i
Abstract ............................................................................................................................. ii
Table of Contents ............................................................................................................. iii
List of abbreviations ...........................................................................................................v
1 Introduction ............................................................................................................... 1
1.1 Background ............................................................................................................. 1
1.2 Objectives ........................................................................................................... 1
1.3 Research methods .............................................................................................. 2
1.4 Overview .............................................................................................................3
2 Literature review ....................................................................................................... 4
2.1 Introduction ....................................................................................................... 4
2.2 Colloids .............................................................................................................. 4
2.3 Coagulation ........................................................................................................ 7
2.4 Flocculation ....................................................................................................... 9
2.5 Flotation ............................................................................................................ 12
2.6 Industrial coagulation, flocculation and flotation .......................................... 18
3 Naantali Oil-Refinery WWTP .................................................................................. 21
3.1 Introduction ...................................................................................................... 21
3.2 API oil-water separators ................................................................................... 21
3.3 Chemical treatment ......................................................................................... 22
3.4 Biological treatment ........................................................................................ 25
4 Methods ................................................................................................................... 27
4.1 Chemicals aids ................................................................................................. 27
4.2 Bench-scale jar tests ........................................................................................ 28
4.3 Full-scale experiments ...................................................................................... 31
4.4 Analytical methods ........................................................................................... 37

Table of Contents
iv
Ralf Sirén
4.5 Calculations ..................................................................................................... 38
5 Results ....................................................................................................................... 41
5.1 Jar test results ................................................................................................... 41
5.2 Full-scale experimental results ........................................................................ 51
5.3 Performance of ferric sulphate versus ferrous sulphate ................................. 58
5.4 Other observations ........................................................................................... 61
5.5 Cost estimation ................................................................................................ 62
6 Discussion ................................................................................................................ 65
6.1 Selection of the coagulant and flocculant ...................................................... 65
6.2 Full-scale parameters ....................................................................................... 68
6.3 A consideration of the findings in light of existing research ......................... 72
6.4 Practical considerations for implementation ................................................. 74
7 Conclusions ..............................................................................................................77
8 Svensk sammanfattning .......................................................................................... 79
9 References ................................................................................................................ 82
10 Appendices .............................................................................................................. 85

List of abbreviations
v
Ralf Sirén
List of abbreviations
LDL Lower detection limit
COD Chemical oxygen demand
BOD Biological oxygen demand
TSS Total suspended solids
SS Suspended solids
WWTP Wastewater treatment plant
DAF Dissolved air flotation
IAF Induced air flotation
Nm3/h Normal cubic meters (of air) per hour at NTP
HMW High molecular weight
Initial pH pH measured before adding metal coagulants
ICB Intermediate bulk container (1 m3)
Me+ Metal ion, usually Fe2+, Fe3+ or Al3+

Introduction
1
Ralf Sirén
1 Introduction
1.1 Background
Untreated wastewaters are an environmental hazard. Wherever humans live and
function, they produce different kinds of wastewaters. In spite of recent advances in
technology, fossil fuels still account for the majority of energy used in the
transportation of humans and goods, also in the foreseeable future. Refinement of
crude oil to different fuels is an integral part of enabling these transport processes. As
a side product, oil refineries produce wastewater containing oil and chemicals.
Therefore, wastewater treatment is essential to reduce the load on nature, not to
mention the continually stricter legal requirements on refinery effluents.
This thesis concerns the improvement of the performance of the Naantali Oil Refinery
Wastewater Treatment Plant, operated by Neste Oyj Corporation. The work was
focused on the chemical treatment process, consisting of two parts; flocculation and
flotation. The work describes the underlying principles, the experimental activities
carried out at the bench scale, and the implementation of the gained knowledge to the
full-scale plant including test runs.
1.2 Objectives
This research aims to improve and optimise the chemical treatment of refinery
wastewater at the Naantali Oil Refinery Wastewater Treatment Plant (WWTP).
Chemical treatment has not been optimised in over a decade, moreover, the
wastewaters have changed during this time, and therefore it is reasonable to investigate
the performance and possible improvements. If feasible, these improvements will then
be applied at the industrial scale. There are several hypotheses about the performance
of the WWTP:
First, oxidation of ferrous sulphate used for coagulation is incomplete, and the process
would thus benefit from changing it to a coagulant based on trivalent metal ions.
Second, strict pH adjustment which is practised at the industrial scale is unnecessary.
The pH of the process is presently adjusted to 9-9.5 using sodium hydroxide. This
procedure is probably redundant because of more efficient coagulants available
(instead of ferrous sulphate). A pH closer to neutral is probably sufficient.

Introduction
2
Ralf Sirén
Third, the dissolved air flotation unit performance can be improved by finding optimal
parameters such as recycle flow, saturator pressure, and airflow.
Finally, the polyelectrolyte flocculant type and dosage are sub-optimal.
By confirming these hypotheses, the efficiency and performance of the plant could
possibly be increased. Moreover, a decrease or complete elimination of the use of
sodium hydroxide would improve the safety of operators. The increase in efficiency
could also lead to the reduction of operation costs.
1.3 Research methods
The approach to the research objectives was primarily experimental. Wastewaters vary
significantly depending on the wastewater plant, and underlying mechanisms are not
yet fully understood. Gathering experimental data was thus considered essential for
eventual future modelling. The hypotheses are based on the literature review and the
on-site working experience of the author. The acquired experimental data were then
used to optimise the plant and produce a new set of parameters to run the plant. The
main idea presented in this work was to start experiments on a small scale, and then
gradually scale up the results to the full-scale process. This is done not only to reduce
risks but also to gradually build a solid understanding of the behaviour of the chemicals
used.
In this work, two experimental methods were used. First, preliminary combinations
and dosages of chemicals were determined by bench-scale jar tests. Secondly, the
acquired chemical combinations were tested in the full-scale process. In addition, the
influence of the physical parameters in the full-scale process was examined.
The experimental data were collected by taking samples from the process water. In the
case of jar tests, the process water was treated in batches of six jars, simultaneously. In
the full-scale experiments, the samples were taken from the inlet and outlet of the
chemical treatment process, i.e. upstream flocculation, and downstream the dissolved
air flotation unit.
All samples were analysed by several analytical methods to quantify the contaminants.
The main contaminants analysed were chemical oxygen demand (COD), suspended
solids (SS), oil, turbidity, phosphate content, and pH.

Introduction
3
Ralf Sirén
1.4 Overview
This thesis consists of a literature review, bringing up to light the general phenomena
and theoretical understanding of the chemistry and physics involved in the process. A
chapter describing the Naantali Oil Refinery Wastewater Treatment Plant, to give the
context in which the experiments were conducted, follows the literature review. The
rest of the thesis is experimental, beginning with descriptions of the methods used,
followed by Results and Discussion. Finally, the implications and results of the
experimental part are summarised in the Conclusions chapter. Because the
experiments were done iteratively, each experimental section is organised in a way that
laboratory-scale experiments are discussed first, followed by the full-scale experiments.

Literature review
4
Ralf Sirén
2 Literature review
2.1 Introduction
Untreated wastewaters are an environmental hazard. The type of wastewater varies
considerably depending on the source, e.g. oil refinery wastewaters contain oil and
chemicals, municipal sewerage is high on phosphorus and nitrogen, and process waters
from mining operations contain dissolved metals. Most wastewaters also contain
significant amounts of suspended solids. Standard measures of contamination include
“biological oxygen demand” (BOD5 or BOD7), “chemical oxygen demand” (COD),
phosphate or phosphorus, ammonium, turbidity, suspended solids (SS), and oil and
grease. Oil can be present in three forms:
- Free oil
- Colloidal oil
- Dissolved oil
The type of oil determines which methods for separation are the best ones in a
particular case. Usually, all three forms of oil are present in refinery wastewaters.
Regardless of the origin of the wastewater, it must be treated before being discharged
back into nature. The most common chemical methods are coagulation and
flocculation with metal salts, polymers, or both, followed by sedimentation. An
alternative to sedimentation is flotation. Coagulation and flocculation processes aim to
destabilise colloidal systems and increase the particle size, while sedimentation and
flotation are separation processes. The increase in the particle size is done to facilitate
the separation. It can be easily seen that large particles are considerably easier to
separate than the small ones, and this was also confirmed in the current work. In this
chapter, the four process steps are discussed in detail.
2.2 Colloids
Understanding colloidal systems and particles is paramount to understanding the
chemical treatment of wastewaters. Colloids are defined as “…substances consisting of
a homogeneous medium and of particles dispersed therein”, colloidal particles are
viewed as “smaller than coarse, filterable particles but larger than atoms and small
molecules”.1 The range of colloidal particles is in the micro- (10-6) to nanometre (10-9)
scale in microheterogeneous systems.2 In other words, colloidal particles are tiny

Literature review
5
Ralf Sirén
particles or drops dispersed in a medium such as water, and cannot be seen with the
naked eye. In wastewater treatment, particles (oil/solids) in water that do not rise to
the surface or settle to the bottom are usually regarded as colloids. Milk is a typical
example of a colloid, specifically of a colloidal emulsion, where liquid particles are
dispersed uniformly and do not separate by gravity. As can be seen in the case of milk,
colloidal particles can affect the scattering of light (Tyndall effect). Because of this
scattering, colloidal substances of oils and fats usually have a greyish, bluish or white
colour.2 The scattering of light can be quantified and measured with a nephelometer
(turbidimeter).
Emulsions are stable because the particles carry an electric surface charge, thus
repelling each other.3 In the case of oil in water, the charge is usually negative.2,4 There
are several reasons for this. Cations are usually more hydrated than anions, therefore
residing in the bulk phase of water, which leads to more polar anions to adsorb on
particles. Surface active molecules usually also have a negative charge, e.g. carboxylic
acids and their salts. When they dissociate, the molecules concentrate on the oil-water
interface, contributing to the negative charge.5 Moreover, solid particles tend to gather
on the oil-water interface, hindering the coalescence of oil droplets. Due to the tiny size
of the particles, the specific surface area is large. Consequently, the surface behaviour
of colloidal particles dictates much of their properties.4
Colloids can be either hydrophilic or hydrophobic. Oil molecules are non-polar and
hydrophobic, which means they do not have an affinity for water. When mixed with
water, the oil and water phases would normally separate by coalescence. Coalescence
is the process when two or more small oil droplets collide and combine into a larger
droplet and rise to the surface. However, if polar molecules with hydrophilic and
hydrophobic parts or surfactants are present, they gather at the oil-water interface
hindering the coalescence of the hydrophobic droplets. Figure 1 illustrates different
types of particles found in wastewater, and how surfactants concentrate on the
interface of particles and the bulk phase.

Literature review
6
Ralf Sirén
Figure 1: Different types of particles in refinery wastewaters. Colloidal particles are stable, free oil will rise to
the surface, and solid particles settle at the bottom. Surfactants gather at the oil-water interface.
Charged colloidal particles lead to phenomena described by the theory of the electrical
double layer. Because particles are charged, ions of the opposite charge will migrate
towards the particle surface, forming a diffuse layer around the particle.2,5 This layer is
illustrated in Figure 2.
Closest to the negatively charged particle is a layer of positively charged counter-ions,
for example, Na+ or H3O+ in water, which is known as the Stern layer. These ions are
strongly attracted by the negative particle surface and do not move with the bulk fluid.
However, the attractive electrostatic force decreases with distance. When the distance
is large enough, the counter-ions will begin moving with the bulk fluid instead of
staying adjacent to the charged particle surface.
Because the surface potential cannot be measured, the zeta-potential is measured
instead. It is defined as the potential at a certain distance from the particle (beginning
of shear plane). The shear plane is the distance from the surface where ions are not
attached to the particle anymore but, instead, move with the bulk fluid. A large zeta-
potential corresponds to a large surface charge and vice versa. In other words, zeta
potential is a good approximation for the particle charge. An illustration of the theory
of the electrical double layer and zeta-potential can be seen in Figure 2.
Oil
Dirt
Colloidal
particle of oil
and dirt
Surfactant
Free oil
droplet

Literature review
7
Ralf Sirén
Figure 2: The electrical double layer and zeta-potential
2.3 Coagulation
Coagulation refers to the destabilisation of colloids, and the subsequent agglomeration
of particles to form micro flocs.4 Agglomeration refers to the process of particles
binding to each other. For agglomeration to be possible, the particles first need to
collide and secondly, the energy of the collision needs to surpass the repulsive forces
caused by similar particle charges. If both conditions are met, small aggregates known
as micro flocs will be formed. First, attracting and repelling forces of the collisions will
be considered, followed by measures to improve aggregation.
Particles are naturally attracted by one another, mainly caused by Van der Waals
forces.2,5 However, if the repulsion between the particles surpasses the attractive forces,
agglomeration will not take place. It has been proven that higher zeta-potential values,
analogous to a higher surface charge, correspond to higher repulsion between the
particles.5 In other words, the surface charge is the primary stabilising factor in colloidal
suspensions. In the case of wastewater treatment, this electrostatic stability needs to be
destabilised to separate the particles from the water.4,6 This can be done by addition of
chemicals with opposing charges to the particles. In the majority of cases of wastewater

Literature review
8
Ralf Sirén
treatment, these agents are positively charged. The destabilisation of wastewater
colloids is usually done by addition of inorganic metal salts of iron or aluminium. These
are often called primary coagulants. Sometimes natural or synthetic organic polymers
can be used. However, these are often significantly more expensive compared to the
conventional metal salts, even if producing less sludge. Some inorganic polymers of
aluminium also exist, namely polyaluminium chloride. All these additives are
collectively called coagulants. Commonly used coagulants are listed in Table 1.
Table 1: Commonly used coagulants for wastewater treatment
Inorganic coagulants
Aluminium Sulphate (alum)
Al2(SO4)3
Aluminium Chloride
AlCl3
Polyaluminium Chloride
[Aln(OH)mCl(3n-m)]x
Ferrous Sulphate
FeSO4
Ferric Sulphate
Fe2(SO4)3
Ferric Chloride
FeCl3
Organic coagulants
PolyDADMAC
(C8H16NCl)n
Polyamines
Epichlorohydrin + dimethylamine, polymerised
Melamine Resin
Melamine + formaldehyde, polymerised
When metal salts dissociate, the metal ions will acquire a cationic charge (positive zeta-
potential). This positive charge will serve to neutralise the anionic surface charge on
the colloidal particles.4 Metal ions carry bivalent (Mg2+, Fe2+, Ca2+), or more efficiently,
trivalent charges (Fe3+, Al3+). Neutralising the surface charge leads to a compression of
the electrical double layer and overall reduction of repulsive forces, which results in a
higher chance of two colliding colloid particles attaching to one another, thus resulting
in agglomeration. According to the Schulze-Hardy rule, the most effective coagulants
are oppositely charged ions, with increasing coagulation (precipitation) power with
increasing valence.2 Typical coagulant dosages naturally depend on the properties of
water, usually varying from a few to hundreds of milligrams per litre, but can go as high
as thousands of milligrams per litre.4 According to The NALCO Water Handbook, the

Literature review
9
Ralf Sirén
coagulant dosage is directly dependent on the surface area, which means the size and
concentration of particles.4
In most wastewater treatment conditions, metal ions are not in solution in the form
Fe3+ or Al3+, but partially or fully hydrolysed, e.g. Me(OH)2+ or Me(OH)3. Fully
hydrolysed metal salts are not soluble but precipitate as hydroxides. Most coagulation
reactions are hypothesised to involve metal hydroxides and not un-hydrolysed metal
ions. However the mechanisms are not yet fully understood.7 Insoluble metal
hydroxides also take part in coagulation, by a phenomenon called sweep flocculation.
Hydroxide precipitates are amorphous and voluminous, which can be detrimental
when considering the sludge volume. The solubility of different metal hydroxide
species varies depending on the pH of water, which means that the pH considerably
affects the effectiveness of the above-mentioned coagulants.3 Pre-hydrolysed organic
and inorganic polymers can presumably carry even higher positive charges, making
them adsorb more tightly onto particles. These usually produce less sludge and are
required in smaller amounts, being more expensive.
Summarising, for coagulation to be possible two processes need to happen. The
particles must be destabilised, and they must be transported within collision range of
each other. Destabilisation can be achieved by the addition of metal salts, and the
collision frequency is facilitated by stirring.
2.4 Flocculation
Flocculation refers to the process of agglomeration, where particles form large, visible
agglomerates, known as macro flocs. Flocculation can be viewed as a physical transport
process, while coagulation is more like a chemical reaction. Flocculation is done to
increase the floc size to facilitate separation. Flocculation is accomplished through slow
agitation and the addition of polymers, known as flocculants.
For the destabilised colloids formed in the coagulation step to grow in size, they have
to be brought in contact with each other. Molecular transport phenomena are physical
processes. According to Ghernaout et al. three main driving forces for particle collision
exist:3
• Brownian diffusion
• Fluid motion

Literature review
10
Ralf Sirén
• Differential sedimentation
Brownian diffusion, or movement, is the result of thermal energy in the fluid. It only
affects tiny particles, including colloids. These particles are constantly bombarded by
surrounding molecules in motion. Because the particles are small, the kinetic energy of
molecules colliding with them will result in what appears to be movement in random
directions. This movement can lead to two particles spontaneously colliding, causing
agglomeration. Brownian motion affects the coagulation process but is negligible once
the particles grow in size.8
The most significant reason for particle collisions in wastewater treatment is fluid
motion. Fluid motion, or shear forces, is the result of mixing or flow. Stirring and
turbulence lead to different velocity gradients in the liquid, varying depending on the
position and time. This causes particles to move with differing velocities and directions,
leading to collisions.3
Finally, differential sedimentation exists, a gravity induced phenomenon. Differential
sedimentation describes the tendency of particles of different sizes to collide when
settling (or rising). Large particles settle faster and collide and agglomerate with or
enmesh smaller particles on the way down.3
The theory of sedimentation is worth consideration at this point. So far only a need to
increase the particle size, for easier separation, has been mentioned. The reason that
larger particles separate faster compared to small particles can be described by the law
of Stokes'. The law makes some assumptions such as laminar flow and involvement of
hard spherical particles. Stokes' law states that settling velocity is proportional to the
diameter squared.
𝑉 =
𝐺(𝜌1 − 𝜌2)𝐷2
18𝜂 (1)
where
𝜂 = liquid viscosity, s/cm2
V = settling velocity, cm/s G = gravitational acceleration, cm/s2
𝜌1 = particle density, g/cm3 𝜌2 = liquid density, g/cm3 D = particle diameter, cm

Literature review
11
Ralf Sirén
Because the Stokes' law describes an ideal, simplified situation, it is not directly
applicable. However, it demonstrates the influence of the particle diameter and density
difference on the settling speed. Table 2, modified from The NALCO Water Handbook
Table 6.1, illustrates different settling times of typical particles calculated using Stokes'
law.4
Table 2: Typical settling times for particles of different sizes
Typical Suspended
Solid
Diameter (mm) Settling time to fall 1 m
Coarse sand 1 10 s
Fine sand 0.1 125 s
Slit 0.01 108 min
Bacteria 0.001 180 h
Colloids 0.0001 755 d
Particles of bacterial and colloid sizes are evidently too small to sediment within a
reasonable time. Process equipment needs to be designed in such ways that the particle
speeds are accounted for. Stokes' law is not applicable under turbulent conditions,
where settling velocities are significantly slower.
Metal coagulants efficiently destabilise colloids and increase agglomeration, growing
the particle size, but the addition of a flocculating agent can rapidly increase the floc
size further. Polyelectrolyte flocculants are either cationic, anionic or non-ionic
polymers of high molecular weight. Flocculants work by interparticle binding. The
polymer chains form a net together with smaller agglomerates of colloidal particles and
metal hydroxides. When this net moves around in the fluid it will enmesh and trap
smaller particles, continually growing in size.4 Polymer flocs are visible, can be up to
several centimetres in size, and stronger than flocs formed by metal salt type coagulants
used on their own. Flocculants work mainly by interparticle binding, not by charge
neutralisation. The choice of polymer can only be determined by experiments, because
of the complexity of wastewater chemistry and process design.4
Flocculation is usually followed by a separation step of either sedimentation, filtration
or flotation. Of these three phenomena, flotation will be discussed in the next section.
Sometimes coagulation/flocculation is also preceded by separation. In the case of oily

Literature review
12
Ralf Sirén
water, coagulation/flocculation is usually preceded by gravity separation of oil. While
gravity separation of oil follows Stokes' law just like sedimentation, because oil has a
lower density than water, the goblets will rise to the surface instead. In this way, non-
colloidal particles, such as free oil, can be significantly reduced before the coagulation
step.
2.5 Flotation
2.5.1 Dissolved air flotation
Dissolved Air Flotation (DAF) is a highly effective method to remove emulsified oil and
suspended solids from water. Removal rates exceeding 99% of oil and suspended solids
have been achieved.9-11 Flotation works by attaching tiny air bubbles (20-120 µm) to
suspended solids or oily particles. The bubbles are produced by pressurising a part of
the effluent stream to 3-5 times the atmospheric pressure in the presence of air and
then recycling it back to the influent. Subsequently, as the pressure is reduced back to
atmospheric in the flotation unit, microbubbles nucleate on the particles. The attached
bubbles grow and reduce the specific gravity of the bubble-particle agglomerates and
force them to the surface. Macroflocs and metal hydroxides formed in the flocculation
step will also trap bubbles and rapidly rise to the surface, “sweep flocculating” smaller
particles.4,6 The floating particles, oil, and froth are then skimmed off and removed
from the process. Flotation being an effective process by itself is significantly enhanced
by pre-treating water with coagulants and flocculants. Flotation in combination with
chemical pre-treatment can remove most of the free and emulsified oil.12 Chemical
treatment units (flocculation/flotation) in refineries usually have gravity separation of
free oil (API-separators) upstream to reduce the load. Such gravity separation is a
natural choice when dealing with oily wastewater, because oil and oily particles usually
have a lower density than water. However, when dealing with heavier hydrocarbons
with a density close to water, e.g. heavy crude oil, flotation is the only efficient method
of removal.13
While different kinds of flotation processes exist, e.g. Induced Air Flotation (IAF) and
electroflotation, this work is limited to the most common Dissolved Air Flotation
(DAF). A DAF clarification unit consists of six main components:
- Flotation vessel
- Recycle pump

Literature review
13
Ralf Sirén
- Air saturation tank
- Source of high-pressure air
- Pressure regulation system
- Chemical addition system or separate flocculator tank
A recycle pump is needed if the system operates on a recycle basis, which means taking
a part of the effluent for pressurising. Other alternatives are full flow or partial flow
pressurisation, pressurising the influent instead. Most DAF units are of the recycle type,
proved to be the most efficient already in 1954.14
2.5.2 Theory of flotation
2.5.2.1 Rise rate
The flotation process aims to adsorb and absorb air bubbles on the particles and oil
globules, to reduce the relative density with respect to water. In other words, it is a
form of gravity separation by increasing the buoyancy of particles. Flotation follows
Stokes's law similarly to sedimentation but reversing the force field. Flotation basins
can be divided into two zones: the contact zone and the separation zone. In the contact
zone, the supersaturated influent forms bubbles and the flow regime is turbulent. Here
the Stokes's law cannot be applied. In the separation zone, further away from the inlet,
laminar flow can be assumed. The bubble-particle agglomerates surface is undisturbed,
and the Stokes's law is valid.
Air bubbles rise rate can be calculated using Stokes's law for bubbles under 130 µm.15
Larger bubbles rise significantly faster in pure water because they take an elliptical
shape. Then again, because surfactants are always present when treating oily
wastewater, the bubble shape will stay spherical for longer. Therefore, according to
Moosai and Dawe (2003), Stokes's law holds reasonably well for bubbles up to 200
µm.13 For bubble-floc aggregates more exact models exist, being more complicated.
These models take into consideration the number of attached bubbles in relation to
floc size.16 According to Edzwald (2010) flocs slightly denser than water with a diameter
of 50 µm with one attached bubble (d = 100 µm) will rise with an approximate velocity
of 20 m/h.17 When air bubbles are attached to oil droplets or particles, the density
difference to the bulk liquid increases and the diameter of the agglomerate increases.
Flotation is thus more efficient than sedimentation since sedimentation does not alter
the density difference or the particle diameter in the Stokes's equation.

Literature review
14
Ralf Sirén
When designing and operating flotation units, the rise rate of flocs is not used. Instead,
a parameter called hydraulic loading rate (HLR) is applied. Hydraulic loading rate, also
named as rise rate or surface loading rate, is defined as the volume of flow per hour
applied to the surface area available for separation. The NALCO Water Handbook
states that normal ranges vary between 3.7 to 4.9 m3/ (h · m2).4 According to Bennett
and Shammas (2010) for industrial DAF units for oil-removal, the HLR varies from 2.2
to 9 m3/ (h · m2). 10 The HLR can be calculated if the total flow (influent + recycled) and
the surface area are known: 4
𝐻𝐿𝑅 =
𝐹𝑖 + 𝐹𝑟
𝐴 (2)
where
2.5.2.2 Size and number of bubbles
The size and quantity of gas bubbles are important parameters. Too large bubbles will
not combine with small oil droplets. The size and number of bubbles are influenced by
the saturation system pressure. The amount and size of bubbles are a function of the
pressure in the saturation vessel because the pressure determines the amount of
dissolved air in the liquid.12 The dissolution of gas to liquid follows Henry’s law:
𝐶 =𝑝
𝑘 (3)
Where 𝑝 is the partial pressure of the gas over the liquid, 𝐶 is the concentration of
dissolved gas, and 𝑘 is the Henry’s law constant. Henry’s law describes the equilibrium
amount of dissolved gas. Complete saturation is seldom achieved however, because of
limited retention time in the saturation vessel.17 When the pressure is reduced almost
all of the dissolved air is flashed out of the solution. In other words, the amount of air
is a direct function of the saturation pressure. Moreover, the Henry’s law constant 𝑘 is
temperature dependent. The solubility of gases in water usually decreases with
temperature (Figure 3).
HLR = hydraulic loading rate (m3/ [h · m2]) Fi = influent flow (m3/h) Fr = recycle flow (m3/h) A = flotation area (m2)

Literature review
15
Ralf Sirén
Figure 3: Calculated solubility of oxygen in salty water at different pressures. 18
The retention time of the recycle stream in the saturation vessel is limited. Therefore
the equilibrium concentration predicted by Henry’s law is not reached. A larger surface
area of the air-liquid interface in the saturator increases the mass-transfer, leading to a
higher degree of saturation. According to Edzewald,17 packed saturators reach 80-95%
of the equilibrium, while unpacked ones reach around 50-70%. It has been stated by
Edzewald that DAF with small bubbles is more efficient than DAF with large bubbles,
and the easiest way to improve the efficiency is to increase the saturator pressure, which
decreases the bubble size and increases the number of bubbles. However, DAF units
usually operate at a constant saturation pressure, which means that the only way for
operators to adjust the amount of air is by changing the recycle flow. Increasing the
recycling rate increases the amount of air in the system. At the same time, too much of
air leads to large bubbles causing turbulence and disturbing separation.
The performance of DAF units also depends on the air-to-solids and oil ratio (A/S –
ratio).4 A sufficient amount of air bubbles needs to be released in relation to the
suspended solids and oil to increase the contact probability. When designing DAF units
the A/S ratio is often used, but when operating the unit the recycle rate is more
convenient because influent TSS and oil are usually not monitored continuously.
2.5.2.3 Bubble-particle agglomeration
In flotation, the inter-particle forces are dominated by electrostatic, van der Waals,
hydrophobic and hydrodynamic effects.17 A lot of research suggests that air bubbles
0
5
10
15
20
25
30
35
40
45
50
0 10 20 30 40 50
Dis
solv
ed O
xyge
n, m
g/L
Temperature, °C
1 bar
2 bar
4 bar

Literature review
16
Ralf Sirén
carry a negative zeta-potential unless adjusted by addition of chemicals or lowering the
pH below two.9,17,19 It is suggested that OH- ions gather at the air/water interface.19,20
This negative charge leads to electrostatic repulsion between similarly charged
colloidal particles, such as colloidal oil droplets and bubbles. Charge neutralising
coagulants are thus used, usually in a coagulation/flocculation unit preceding the
flotation unit. For optimal operating conditions, a minor charge on the particles or its
absence is achieved by the addition of charge neutralising species, such as metal salts.
Han et al.21 concluded that a slight coagulant overdose is better when dosed in relation
to the measured zeta-potential. It is considerably more difficult to change the type of
charge on the bubbles. A slightly negative charge of air bubbles is the reason for the
extensive use of cationic polymers in DAF units in refineries.4,19 Oliveira & Rubio19
examined the effect of anionic, cationic and non-polar polyacrylamide flocculants effect
on bubble zeta-potential. They noted that the anionic and non-polar polymers make
the bubble surface more negative. When a cationic polymer was used, charge reversal
was observed. Above pH 8 also the cationic-polymer coated bubbles turned negative.
However, because they used rather high doses of polymers at 10 mg/L probably a charge
reversal on bubbles should not be expected at more conventional doses. Despite a
negative bubble charge, a well-designed flotation unit can, without the use of chemical
aids, remove up to 73% of oil contaminants.12
There are several reasons for an efficient operation of the DAF units without chemical
aids. As bubbles nucleate from the supersaturated solution, they will be primarily
formed on low-energy sites on solid particles, or if such sites are not available
homogenously in the continuous phase (water). Nucleation directly on particles
implies that the electrostatic charge barrier is “bypassed”. Another major reason is the
fact that air bubbles are hydrophobic, such as oil, and therefore seek hydrophobic
particle surfaces, even when slightly charged.17 Ducker et al.22 have shown that the
hydrophobic forces are the primary reason for air bubble attachment on hydrophobic
particles.
An opposing force hindering the bubble-particle collision and subsequent attachment
is the hydrodynamic effect. This effect refers to the fluid motion caused by the
movement of a particle, e.g. the rise of a bubble, which then affects all nearby particles.
When a bubble approaches a particle, water between them must make way for a
collision to occur. This thinning of the water layer is countered by viscous forces and

Literature review
17
Ralf Sirén
the surface tension of water. Water between the particles flows to the sides, excreting
a drag force on the particles themselves.17
In the contact zone, bubble-particle aggregates are formed through various
mechanisms illustrated in Figure 4. These aggregates will then slowly rise to the surface
for skimming in the separation zone.
Figure 4: Particle bubble agglomeration. Modified from Bennett and Shammas.12
Gas bubble nuclei formation
Gas bubble growth when pressure is lowered
Hydrophobic oil spreads around the gas bubble
Solid particle or oil droplet
Gas comes out of solution by forming bubble nuclei on particles
Floc structures
Rising gas bubbles
Gas bubbles trapped in or on the surface of floc structures
Rising gas bubble
Suspended solids

Literature review
18
Ralf Sirén
2.6 Industrial coagulation, flocculation and flotation
Oil refineries are widely equipped with decanting type gravity separators (API-
separators, named after the American Petroleum Institute) for free oil, and many of
them also utilise flotation or both. A suitable solution for refinery wastewaters
containing oil is API-separation of free oil, followed by flotation for removal of colloidal
oil and finally a biological treatment for dissolved oil. Flotation is mostly combined
with the use of chemicals, with mixing either in an upstream coagulation/flocculation
tank or directly in the flotation unit influent. Typical refinery effluents (= chemical
treatment influents) after API-separators can be seen in Table 3.4 Without API-
separators, the contaminants can be more than ten times higher.
Table 3: Expected concentrations after API-separation
Contaminant Concentration,
mg/l
Oil 20 – 100
COD 260 – 700
SS 50 – 350
BOD5 250 – 350
A significant number of studies has been done on the effectiveness of flocculation and
flotation. However, because wastewater properties vary much from plant to plant, it is
difficult to obtain reliable correlations. Bennett and Shammas12 analysed the
performance of various flotation systems, especially oil refineries, and concluded that:
"Because of numerous variables associated with the data/testing, especially the type and
amount of chemical additives, it is essentially futile to try to construct correlations" 12
However, certain trends, such as those discussed in this section, seem to be valid.
Overall, the performance of the flotation systems varies greatly. Bennett and
Shammas10 extensively summarised over forty studies describing the expected DAF
performance (Table 4).10

Literature review
19
Ralf Sirén
Table 4: Expected DAF performance 10
Contaminant Expected
removal (%)
Oil 85 – 95
COD 65 – 85
SS 70 – 75
Bennett and Shammas have reported that removal percentages can be misleading,
because the effectiveness of DAF units depends on the influent oil concentration.10
Higher influent concentrations lead to improved removal percentages. The authors
state that a removal of more than 90% can be expected for influent concentrations of
150 mg/L or more, and 75% removal for influent oil concentrations of ca. 25 mg/L.
Below some of the published results regarding wastewater treatment with flotation
units and different kinds of coagulants are described. The recurring theme is that the
optimal pH and coagulant dosages vary to a large extent, from case to case.
Al-Shamrani et al.9 investigated the oil removal in a bench-scale DAF reactor. They
compared the influence of ferric and aluminium sulphates, pH, mixing time and
intensity and measured the zeta-potential. The best oil removal was found to be in the
neutral pH range, with a 10% recycle rate. The highest removal (99.94%) was achieved
with ferric sulphate (120 mg/L) at pH 7. Overdosing the coagulant after charge reversal
of the zeta-potential impaired the performance. Ferric sulphate had a broader area of
influence on the pH scale and performed better than aluminium sulphate.
Megid et al.23 compared coagulants in a pilot-scale DAF unit for oil removal. The
highest removal was 72.7% for alum, 74% for ferric chloride and 67.3% for ferrous
sulphate at pH values of 10, 8 and 10 respectively. DAF without coagulants resulted in
oil removal of 60.9%. The worst results were observed, as expected, for divalent ferrous
sulphate.
Weltz et al.24 investigating the flotation kinetics under turbulent conditions compared
aluminium sulphate and lime. The results were in agreement with the Schulze-Hardy
rule. The trivalent aluminium ion was more effective than the divalent calcium ion. The
best performance was achieved with 50 mg/L of aluminium sulphate and 0.5 mg/L of

Literature review
20
Ralf Sirén
anionic flocculant at pH of 5.5. It was concluded that the rate of oil removal increases
at higher levels of air in the flotation unit.
Tansel and Pascual25 treated brackish pond water contaminated with emulsified fuel
oils with and without coagulants in a pilot scale DAF unit. Addition of coagulants
increased the removal by 5-15%. In an early study carried out by Rohlich14, an increase
by 15-23% was achieved in the presence of coagulants. However, in that work the feed
had already passed an API-separator where all the non-emulsified oil was removed.
Because of variations in wastewaters depending on a particular refinery, it was
recommended by Rohlich to find for each specific case the optimal treatment
conditions.
Rhee et al.26 stated that pH of 8.5 afforded the best oil removal (almost 100%) with 100
mg/L of aluminium sulphate or 50 mg/L of ferric sulphate, using a DAF system. A dose
of 10 mg/L at pH 8.5 removed 85% of the oil, with the initial oil concentration of 200
mg/L. The authors concluded that pH has a larger influence on oil removal than the
dose of coagulant. Interestingly enough, ferric sulphate was twice as effective as
aluminium sulphate.
Tzoupanos and Zouboulis27 compared different novel pre-polymerised aluminium
compounds, as well as polyaluminium chloride (PAC) and aluminium sulphate for
wastewater treatment (not oily water). In almost all cases, the pre-polymerised
molecules performed better than aluminium sulphate concerning turbidity reduction.
Aghaali et al.28 investigated COD removal in refinery wastewaters. The authors
examined the optimal coagulant dose (in the range 15-25 mg/L) and saturator pressure
(range 3-5 bar) for a DAF system, using polyaluminium chloride, and concluded that 15
mg/l PAC gave the best results. It was stated that the pressure should be as high as
possible (5 bar) independent of the chemical dosage.
Sawain et al.29 treated biodiesel wastewaters with jar test apparatus, using ferric
chloride as a coagulant. The pH range of 5-7 was found to be optimal, for all doses of
coagulant, resulting in 97% removals of SS, COD, and grease and oil.
As can be seen from the literature overview, the results vary significantly depending on
the wastewater properties.

Naantali Oil-Refinery WWTP
21
Ralf Sirén
3 Naantali Oil-Refinery WWTP
3.1 Introduction
The Naantali Oil Refinery was built in 1957 and after that it has been updated and
reconfigured several times. Today it processes daily around 50 000 barrels of crude oil
to LPG, gasoline, diesel, kerosene, solvents, bitumen and other products. The
wastewater plant was built gradually over the years; each part is operating based on
different scientific principles. The first part was the API-separator completed in 1957,
with the capacity expansion later on. The chemical treatment and the biological
activated sludge processes were started in 1973, and are still in operation today. It can
thus be concluded that the facility is rather old.
The refinery wastewaters are somewhat typical for oil refineries.30 There are several
sources of water coming to the WWTP: process water, tank-drawdowns, stormwater,
sewerage, and ship ballast water from the harbour. Process water includes desalter
effluent, sour water, and occasionally spent caustic. Historical water properties for the
past year can be seen in Table 5 beneath, compiled by the author. The rest of this
chapter will clarify how the three stages API, chemical, and biological processes
operate, from up- to downstream.
Table 5: Historical WWTP feed properties after API-separation
Test Units Count Min Max Average St. deviations
Oil and Grease mg/L 130 4,9 299 37.2 34.3
COD mg/L 180 32 2100 427.4 233.6
Phosphate mg/L 64 0.035 2.7 0.59 0.69
Suspended Solids mg/L 119 5.3 233 46.9 32.9
pH
65 6.8 10.5 7.7 0.8
3.2 API oil-water separators
The first process step of the WWTP is separation of heavy suspended solids and oil
droplets, achieved using an API oil-water separator. The purpose of the API-separator
is to remove free oil, as it is not capable of removing emulsified or dissolved oil. At the
inlet of the separator, the wastewater is screened for coarse contaminants. The screen
is a large grate, with manual cleaning. The grating is followed by a grit chamber, used

Naantali Oil-Refinery WWTP
22
Ralf Sirén
for trapping sand and heavier suspended solids. The solids settle, with the difference in
specific gravity as the driving force (Stokes's law), to the bottom of the grit trap. After
the grit chamber, the oily wastewater slowly flows through the separator basin, because
of in- and outlet elevation differences. In the separator, the oil rises to the surface, while
suspended solids settle to the bottom. The oil is skimmed off the surface by skimming
plates, pushing the oil towards the skimming scoop at the outlet end of the basin. The
water in the middle layer continues downstream after surpassing under-flow baffles at
the outlet. The recovered oil is pumped to tanks, and later re-fed as feedstock to the
refinery. There are a total of four parallel separators, each one with a grit chamber, with
the overall separator volume of 1936 m3. Because there are no bottom scrapers, regular
and sequential emptying and cleaning of the basins is required to remove amassed
solids from the bottom of the separators. After the API-separators the effluent water
can go three ways: pumped to chemical treatment, pumped to a (small) equalisation
tank, or in case of capacity problems, downstream water can be led to a safety basin.
The performance of the API-separators affects the processes downstream. If the flow
rate increases significantly, e.g. during sustained rainfall, the residence time of the
water in the separator decreases. Shorter residence time means that the time for oil
droplets to surface is decreased, thus causing more oil to continue downstream.
Another problem is related to emulsifying agents (surfactants), as occasionally
surfactants used in the refinery operations can cause emulsion stabilising conditions in
the wastewater. Since API-separators only work to separate free oil, the effectiveness is
reduced, leading to increased oil loading for the chemical treatment unit.
3.3 Chemical treatment
The chemical treatment system consists of two reactors, the “Flocculation tank” and
the Dissolved Air Flotation (DAF) unit. The flocculation tank, or “Flocculator”, is the
first reactor downstream after the API-separators. It functions like a continuously
stirred tank reactor. By the addition of chemicals and air, coagulation of colloids is
achieved. Ferrous sulphate (FeSO4), caustic soda (NaOH), and air are continuously
added to the wastewater. Submerged aerators accomplish mixing of the fluid with
impellers. Compressed air is also injected from the bottom of the tank. The purpose of
the aeration is to oxidise the divalent ferrous ions to trivalent ions, leading to improved
coagulation of colloids, as discussed in Section 2.3. The destabilised colloidal particles
will begin to collide and agglomerate, forming microflocs. The average residence time

Naantali Oil-Refinery WWTP
23
Ralf Sirén
varies between 30 min and two hours, depending on the flow rate. The varying
residence time raises a question on its influence on the formation and breakdown of
flocs. The outlet, leading to the DAF unit, is a waterfall in the far corner of the
rectangular basin. Into this effluent waterfall, a stream of anionic polyelectrolyte is
added, mixing with the water in the turbulent conditions of the falls. The polymer is
added after the main part of the reactor to prevent the breakdown of larger polymer
flocs because of excessive agitation. Thereafter, the effluent flows through a large pipe
for approximately ten meters into the centre of the dissolved air flotation (DAF) unit.
The dissolved air flotation unit (Figure 5) uses tiny air bubbles to raise the floc to the
surface for skimming. The main components of the DAF unit in the refinery are the
flotation tank (300 m3), the saturation pressure vessel (4 m3), the circulation pumps,
and a source of pressurised air (8 bar refinery pressurised air network). Water saturated
with air at high pressure is mixed with the effluent water from the flocculator, just
before the flotation basin. Then the wastewater flows to the middle and bottom of the
circular flotation basin, where it is released. Because the pressure is lowered back to
Figure 5: Naantali refinery WWTP DAF unit in December (photo of author).

Naantali Oil-Refinery WWTP
24
Ralf Sirén
atmospheric, tiny air bubbles nucleate on particles in the now supersaturated water,
causing oil and solids to rise to the surface. The flotation basin has a cylindrical
structure in the middle of the tank, which together with four inlets, forces water to rise
upwards in a helical pattern. The bubble nucleation and attachment takes place in the
contact zone, while the separation occurs in the separation zone. These zones and the
flow of the water are illustrated in Figure 6. On the surface level, three fixed radially
placed scoops, together with three continually moving skimmer paddles, skim off the
surfaced floc and foam. The DAF unit operates on a recirculation basis with a 25-80%
recirculation ratio. The saturation tank operates at a pressure of 3.8 bar, with a safety
valve set at 3.9 bar. The circulated water is pumped to the saturation tank with one or
two pumps (recycle flow 65 and 75 m3/h, both pumps 130 m3/h). Pressurised air is fed
into a recycle water line upstream the saturation tank, where air and water are mixed
with an inline static mixer. The hydraulic retention time in the DAF unit is between
one to three hours, depending on the flow rate. The DAF properties are summarised in
Table 6.
Table 6: DAF unit parameters
Parameter Variable Units
Range Average
Influent 70—400 120 m3/h
Hydraulic loading rate
(including recycle) 1.4—5.6 2.1
m3/(m2 h)
Recycle flow 60—130 70 m3/h
Recycle rate 15—100 50 % of raw influent feed rate
Retention time 0.75—4 3 h
Airflow 5—30 15 Nm3/h
Pressure 3.5—3.9 3.8 bar
Pressurisation tank
retention time 2—4 min 3.4
min

Naantali Oil-Refinery WWTP
25
Ralf Sirén
3.4 Biological treatment
After the chemical treatment, the water flows by gravity to the biological treatment
unit, composed of an activated sludge (AS) process. The activated sludge process is a
wastewater treatment method utilising bacteria and protozoa. The microbes will digest
the impurities and use some of the compressed air injected into the wastewater for cell
respiration. Subsequently, the bacteria are removed from water by sedimentation,
yielding purified water. The process consists of three main parts; first the aeration tank,
followed by the sedimentation or clarification tank, and finally, the sludge recycle and
removal system.
The aeration tank (730 m3) is a bioreactor with compressed air introduced as small
bubbles from the bottom. When contaminated water enters the aeration tank, the
bacteria in the basin will begin digesting organic molecules and nutrients, ammonia,
and phosphorus in the water, and utilising oxygen for cell respiration. This mix of
bacterial sludge and wastewater is called “mixed liquor”. The feeding causes the
bacteria to grow, and after a specified residence time in the reactor, depending on the
water flow rate, the mixed liquor continues to the clarifier.
In the clarifier tank, the bacterial floc slowly settles to the bottom of the basin. On the
far end of the tank cleaned water flows to the next process step. Bottom scrapers collect
the bacterial sludge that settles at the bottom of the basin and recycles the sludge back
Figure 6: Simplified flow of water in Naantali refinery DAF unit.
Separation
zone Contact zone
Influent + pressurised recycle stream
Effluent
Naantali Oil-Refinery WWTP
26
Ralf Sirén
to the aeration tank. A bleed-off on the recycle stream removes excess sludge at
unspecified intervals. The amount of bacterial sludge should be kept constant. If the
excess sludge is not removed the biomass will accumulate, decreasing the effectiveness
significantly. Similarly, if too much sludge is removed the effectiveness also declines.
Possible reasons are either a lack of nutrients in the case of a large quantity of bacteria,
causing their death, or an abundance of nutrients surpassing the bacterial digestion
capacity, in the case of excessive removal of sludge.
After the AS process automatic water sapling takes place, and the samples are analysed
daily. This is also the sampling site for regulatory purposes. For process follow-up, the
samples are taken twice per week from each process step. Field operators can also
perform quick field analyses several times per day for phosphorus and nitrogen. As the
last process step, for further biological treatment, the water flows to a large lagoon
(approx. 35 000 m3) for prolonged aeration and sedimentation. The lagoon drains off
into the sea. The final water purity is sufficient enough to sustain fish living in the
lagoon.
The AS process and the DAF unit generate sludge, which is processed mechanically by
centrifugation to concentrate the sludge by removing water and oil. Cationic polymers
are added to facilitate the separation. Water separated by the centrifugation is recycled
back to the chemical treatment, while the oil is pumped to the API-separators. The
remaining sludge is mixed with burnt lime (CaO) to dry and solidify it further, before
being removed from the premises.

Methods
27
Ralf Sirén
4 Methods
4.1 Chemicals aids
Six types of primary coagulants were tested. Some types included different product
names and were therefore tested more than others. Coagulants studied included:
ferrous sulphate, ferric sulphate, ferric chloride, aluminium sulphate (alum), and
polyaluminium chloride. All coagulants were supplied in the liquid state, except ferrous
sulphate currently used in the WWTP. Ferrous sulphate was dissolved in water on site.
The chemicals were obtained from Kemira Oyj.
Table 7: List of coagulants used
Coagulant Product name
Metal-ion
conc.
Polyaluminum Chloride (42% basicity) PAX-XL100 9.30 ± 0.3%
Polyaluminum Chloride (26% basicity) PAX-14 7.20 ± 0.3%
Aluminium Sulphate ALS-50 4.00 ± 0.3%
Ferric Sulphate PIX-115 11.90 ± 0.3%
Ferric Chloride PIX-111 13.4 ± 0.6%
Ferrous sulphate (dissolved) Ferrous sulphate 175 ~1.75 %
In the literature coagulant dosages are commonly compared in two different ways,
either in mg/L of the active substance or mg/L of the chemical, which might cause
confusion when comparing results of different studies.31 In this work, the coagulants
were compared based on the concentration of active substance, in milligrams per litre
(mg/L) of metal ions, because the chemical specifications were supplied by the
manufacturer in this form.
Different types of organic polyelectrolyte flocculants were tested in combination with
the primary inorganic coagulants and compared based on the weight to volume ratio
(mg/L) of dry powder to water. The primary differences between the polyelectrolytes
were the charge density and the molecular weight. The majority of tested polymers
were polyacrylamides intended for flocculation processes. During preliminary jar-
testing, it was found that cationic and non-ionic polymers seemed to flocculate
considerably better. Such preliminary testing was done by visual observation of floc

Methods
28
Ralf Sirén
formation by several persons. According to the supplier of chemicals, their cationic
polymers usually work better when treating oily waste.
Table 8: List of polyelectrolyte flocculants tested
Name Charge Density Charge
SUPERFLOC C-491 /HMW Very Low Cationic
SUPERFLOC C-492 /HMW Low Cationic
SUPERFLOC C-493 /HMW Medium-low Cationic
SUPERFLOC C-494 /HMW Medium-high Cationic
SUPERFLOC C-496 /HMW High Cationic
SUPERFLOC C-498 /HMW Very High Cationic
A100-HWM Low Anionic
A series of twelve different cationic and one anionic polyacrylamide-based
polyelectrolytes were tested (Table 8). There were six levels of charge density ranging
from very low to very high. For each charge density, normal and high molecular weight
(HMW) were tested.
4.2 Bench-scale jar tests
4.2.1 Choice of the method
Bench-scale jar tests in is a standard method to investigate wastewater flocculation and
sedimentation properties. Jar tests aiming to determine the best conditions for
coagulation and flocculation include selection of the type of coagulants and flocculants,
dosage, and the most efficient pH level at which to operate. The name “jar tests” refers
to the procedure of using several 1-2 litre jars to conduct the experiments in. According
to the Nalco Water Handbook 4, “observational results in a jar test remain the best
method for coagulant selection”. Bratby 31 also claims jar testing to be an ideal tool for
coagulation optimisation, with many studies in the past 85 years supporting the validity
and applicability of the method. Further supporting the choice of method, Edzwald 32
stated that:
“The chemistry of coagulation for sedimentation and DAF plants is similar, therefore
coagulant dosages and pH conditions are identical to forming flocs“.
Methods
29
Ralf Sirén
4.2.2 Jar test experimental design
The jar test experiments were designed and executed in the following order:
1. Determination of best coagulant and pH.
2. Determination of the best polymer in combination with the coagulant from step
one.
3. Dosages optimisation
In addition to the three primary goals above, the influence of mixing time was
investigated, and one experiment regarding H2S removal was conducted.
The performance of five different coagulants (Table 7) was examined in step one. In the
first step, a coagulant dosage equal to the one used in the full-scale process (10 mg/l
calculated as metal) was used. Removal of COD, oil, phosphorus, and turbidity was
investigated as a function of pH. The pH pre-coagulant addition was varied in steps of
one, from pH 5 to 10. One sample was taken for each coagulant and pH combination.
The results were then plotted as the removal rate, remaining contaminant or both,
parameters vs pH. The best coagulant was then chosen for the next step, based on
several criteria.
In step two, the coagulant chosen in step one was combined with different
polyelectrolyte flocculants. The pH, pre-coagulant addition, was varied from 7 to 9. The
type of coagulant was the independent variable while the measured contaminants were
the dependent variables. The coagulant dose was kept constant, at 10 mg/L of Fe3+.
In the third step, the optimal chemical dosages were determined. The wastewater was
treated with coagulant dosages (mg/l calculated as metal), in several different
experiments for different feed water samples. Some experiments were done with the
coagulant only, others with both coagulant and flocculants. In these experiments, only
turbidity was analysed.
4.2.3 Jar test experimental procedure
Six one litre transparent cylindrical glass jars were used, and the experiments were run
side-by-side. The jar testing apparatus (Flocculator 2000) was supplied by Kemira Oyj.
Each jar could be separately adjusted for rapid agitation time (400 rpm), slow agitation
time (40 rpm), and settling time (no mixing). A program of 30-sec rapid mixing
followed by 4 min 30 sec min slow mixing and then 5 min settling was used. The

Methods
30
Ralf Sirén
agitator was of the paddle type, and the axis was kept in place by a frame also working
as a baffle (Figure 7).
Water samples were taken from a side stream of the flocculation tank inlet pipeline,
after the API oil-water decanting treatment. Ten-litre plastic buckets were used. Before
transferring the sample to the one-litre jars, the initial pH was adjusted with NaOH and
H2SO4, the temperature was measured, and water was thoroughly mixed. Thereafter
the six jars were filled with one litre each. All experiments were carried out at
approximately room temperature (25°C).
Before starting an experiment, the jars were mixed for 5 seconds using the rapid setting
(400 rpm). At t=0 s the experiment and rapid mixing were commenced, and the
coagulant was added. If a flocculant was used in addition to the coagulant, it was added
at t=20 s. At t=30 s mixing was slowed down to the slow setting (40 rpm). At t=4 min
30 sec mixing was discontinued. Experiments were concluded at t=9 min 30 sec, and
the samples were taken from the jars for analysis from the middle part of the jar,
halfway to the bottom from the surface. Floc formation was observed during the whole
Figure 7: Jar test in progress. Coagulant doses from the left: 5, 10, 20 mg/L Fe from ferric sulphate.

Methods
31
Ralf Sirén
experiment. The final pH was measured, and samples for analysis Floc strength was also
visually observed by mixing the fluid rapidly for a couple of seconds after sampling.
Coagulants were added directly from the concentrated stock solution using a
micropipette. Flocculation polymer solutions had to be prepared on site. The polymer
solutions were prepared from dry powder and tap water (as in the full-scale process).
The dry polymer powder was weighed and slowly dosed into the water vortex created
in the magnet stirred beaker. Stirring was sustained for 30 min, thereafter the
homogeneity of the solution was inspected. After discontinuing the mixing, the
solution was let to settle for 30 minutes or more. The polymer solutions were added to
the jars with microliter pipettes. The solutions were stored at room temperature,
covered with aluminium foil to prevent evaporation, for a maximal time of a week. New
polymer solutions were made weekly, all on the same day.
4.3 Full-scale experiments
4.3.1 Materials used
Full-scale experiments were conducted because jar tests cannot completely simulate
the real process, especially the real degree of ferrous sulphate oxidation in full-scale
processes. In the full-scale experiment, 100% of the refinery wastewater stream was
treated for several months. The properties of the feed water varied to a high degree
during the experiment, e.g. the oil index (section 4.4.4) varied from 15 mg/l to > 100
mg/l. Ferric sulphate was used as a coagulant with either anionic or cationic
polyacrylamides. In order to feed the coagulation chemical to the flocculation-reactor
during the experiment, a pump station was built. The reason for this was twofold. First,
the existing pumps used for the dilute ferrous solution were too large for the novel
highly concentrated coagulant, and with unknown corrosion durability. Second, the
existing infrastructure and chemicals were used for control experiments. The
coagulation chemicals were fed to the process with two piston pumps and pipes, from
one cubic meter intermediate bulk containers (IBC). The coagulant pump station is
pictured in Figure 8 and Figure 9.

Methods
32
Ralf Sirén
The new polymer solutions were prepared with an identical polymer solution
preparation system (Figure 10), as used in the process normally consisting of a mixing
eductor, a polymer granule silo, a mixing tank and a storage tank. The solution was fed
to the process with the fixed pumps on site. Before changing from one polymer to
another one all vessels and pipes were thoroughly washed.
The feed rates of coagulants and flocculants were adjusted by manually changing the
pump settings. The chemical feed flow rate adjustments were also regularly controlled
by recording time to fill a one (or ten) litre bottle/bucket. The pH was adjusted with
caustic soda using the existing pH-regulation system and was measured with an on-line
industrial pH meter with automatic washing. The pH meter was calibrated every week.
The influent wastewater flow rate was adjusted by choking the feed, at the main feed
valve.
Figure 9: Picture of the full-scale experimental equipment and ferric sulphate solution "feed tank".
Figure 8: Picture of the full-scale experimental equipment feed pumps and piping

Methods
33
Ralf Sirén
4.3.2 Parameters
Different system parameters were investigated. To understand how varying the
parameters affected the process, the interdependence of variables was determined first.
In Table 9 process variables, the possibilities of their adjustment, and which other
process variables are presumably affecting a particular variable are presented.
Table 9: Chemical treatment variables
Variable Adjustability Interdependence
Temperature not possible to affect Independent
Influent composition not possible to affect Independent
Flow rate Maximal flow can be set;
minimum cannot be set
Independent
Coagulant Type and dosage Concentration dependent
on flow
Flocculant Type and dosage Concentration dependent
on flow
Figure 10: Polymer solution preparation system. The storage silo is on top of the vortex mixer with an eductor below it. The solution is pumped to the storage vessel seen to the top right.
Methods
34
Ralf Sirén
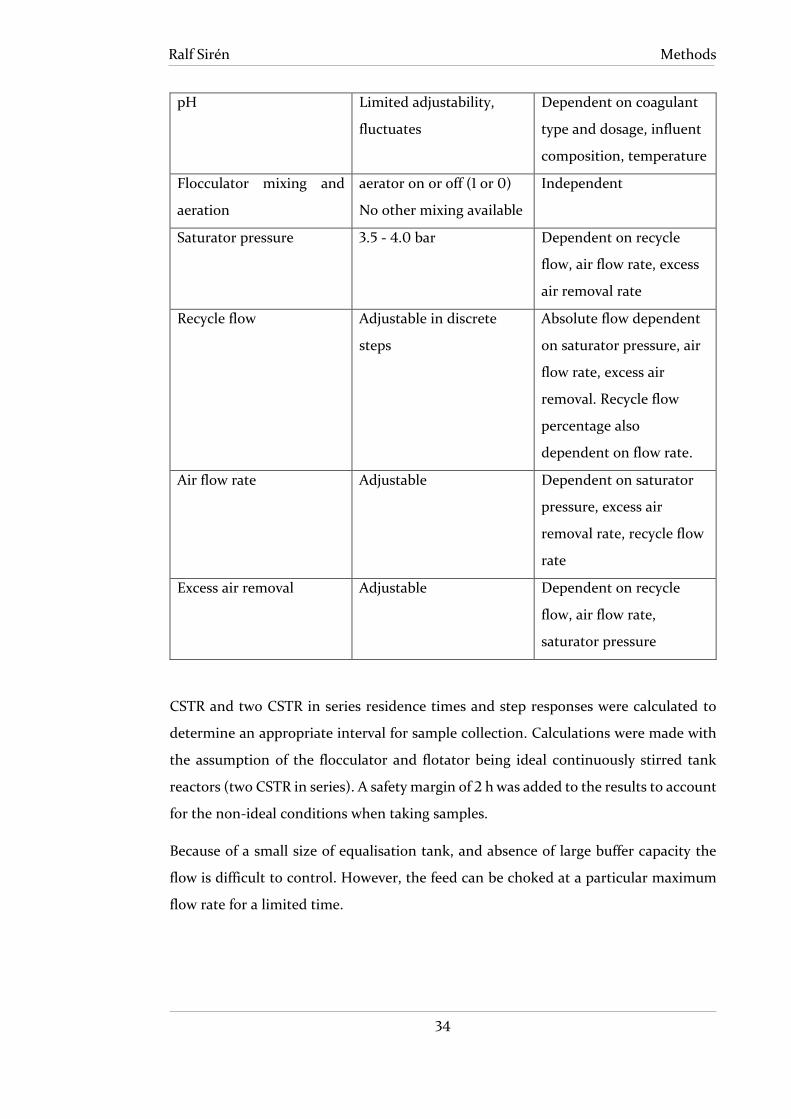
pH Limited adjustability,
fluctuates
Dependent on coagulant
type and dosage, influent
composition, temperature
Flocculator mixing and
aeration
aerator on or off (1 or 0)
No other mixing available
Independent
Saturator pressure 3.5 - 4.0 bar Dependent on recycle
flow, air flow rate, excess
air removal rate
Recycle flow Adjustable in discrete
steps
Absolute flow dependent
on saturator pressure, air
flow rate, excess air
removal. Recycle flow
percentage also
dependent on flow rate.
Air flow rate Adjustable Dependent on saturator
pressure, excess air
removal rate, recycle flow
rate
Excess air removal Adjustable Dependent on recycle
flow, air flow rate,
saturator pressure
CSTR and two CSTR in series residence times and step responses were calculated to
determine an appropriate interval for sample collection. Calculations were made with
the assumption of the flocculator and flotator being ideal continuously stirred tank
reactors (two CSTR in series). A safety margin of 2 h was added to the results to account
for the non-ideal conditions when taking samples.
Because of a small size of equalisation tank, and absence of large buffer capacity the
flow is difficult to control. However, the feed can be choked at a particular maximum
flow rate for a limited time.

Methods
35
Ralf Sirén
4.3.3 Experimental design
4.3.3.1 Determination of adjustable parameters
First, the adjustable parameters and their interdependence were examined, based on
the operators and the author's experience with the process. The full-scale experiments
were designed so that other variables than the independent variable were kept as
constant as possible.
4.3.3.2 Suspended solids as a function of pressure:
The efficiency of the DAF unit was investigated by adjusting the dispersion tank
pressure between 3.5 to 4.0 bars, in two discrete levels, high and low. The dispersion
tank pressure was the independent variable, while the amount of suspended solids in
the DAF effluent was the dependent variable, and all other parameters were kept
constant as much as possible. The pressure was alternated between low and high values,
changing every 24 h. The samples were taken every 20-24 h after changing the pressure
from the DAF overflow. The hypothesis was that there is a statistically significant
difference in flotator efficiency as a function of pressure. The process was run with
standard parameters and chemical aids, approx. 10 mg/l Fe as ferrous sulphate, 4 mg/L
of anionic polyacrylamide, and pH 9.0 - 9.5.
4.3.3.3 Suspended solids as a function of airflow
The pressure was adjusted to 3.9 bars, and the air volume flow was varied as an
independent variable. The pressure was adjusted with the excess air removal valve, and
keeping the recycle flow constant. A set of experiments were done using only one
recycle pump, with a recycle-flow of 65 m3/h. Airflow was varied in steps of 5, 10, 20,
30, 40 Nm3/h. The flotator surface was observed visually to determine bubble quantity
and flotation behaviour. Experiments, where the quantity of SS was analysed, were
done with 20 and 30 Nm3/h of air.
4.3.3.4 Turbidity, SS, Oil, COD, phosphorus content as a function of pH
An experiment determining the effects of pH as an independent variable was carried
out. The pH in the flocculator was adjusted between 7—9.5 and the ferric sulphate and
anionic polyelectrolyte A100-HMW doses were kept constant at approximately 10 mg/l
Fe and 4 mg/L polymer respectively.

Methods
36
Ralf Sirén
4.3.3.5 Turbidity, SS, Oil, COD, phosphorus content as a function of anionic
polymer dose
The coagulant was changed to ferric sulphate, and run at an equivalent dose of iron in
comparison to the current process with ferrous sulphate, in the range of 7-10 mg/L. The
polymer used was the same as in the current process (A100-HMW), and the dose
(independent variable) was varied in the range 0.35 - 4.6 mg/L.
4.3.3.6 Turbidity, SS, Oil, COD, phosphorus as a function of cationic polymer
dose
Ferric sulphate was used as a coagulant, and run at an equivalent dose of iron in
comparison to the current process with ferrous sulphate, in the range of 7-10 mg/L. The
polymer was changed to cationic (C491-HMW), and the dose (independent variable)
was varied in the range 0 - 4.6 mg/L.
4.3.3.7 Coagulant dosage
When ferric sulphate was used instead of the conventional ferrous sulphate, it was
dosed in an equal molar ratio of Fe3+ to Fe2+. Not too much weight was put on
investigating the optimal coagulant dosage because it changes daily depending on the
wastewater properties. As commonly known, increasing the coagulant dosage yields
better purification results up to a certain point. Therefore based on the known facts,
confirmed by the jar test results, adjusting the coagulant dose based on the flotator
overflow turbidity was done instead, for all experiments after 1.3.2018. The method is
used industrially. In the case of rising turbidity, the iron dose was increased, and the
opposite was done when turbidity went down. The setpoint turbidity was chosen based
on an educated guess due to the limited available turbidity data, and the turbidity of 8
NTU was chosen to be the point where the coagulant dose was increased. When more
process data are available, these levels should be revised, to better represent the
correlation of turbidity to other impurities.

Methods
37
Ralf Sirén
4.4 Analytical methods
4.4.1 Introduction to analytical methods
Samples were analysed for several different types of impurities. Some analysis was done
by the Naantali Refinery quality control laboratory; others were conducted in the field
laboratory where the jar tests were done. All applied analytical methods are standard
ones in the wastewater industry. This section lists the analytical methods used in this
work.
4.4.2 COD
Chemical Oxygen Demand (COD) was determined according to the ISO 15705:2002
standard by the Naantali Refinery QC-laboratory. A sealed tube method (ST-COD) was
used, and the absorbance at 440 nm was measured with a HACH LANGE DR3900
spectrophotometer. The reagent tubes/cuvettes used were HACH LCI 500. The
samples were oxidised with sulphuric acid and potassium dichromate in the presence
of silver sulphate and mercury(II)sulphate for two hours at 150°C. Absorbance was
automatically calculated to chemical oxygen demand (mg O2/l) by the
spectrophotometer.
4.4.3 Phosphate
Phosphorus (𝑃𝑂4−3 − 𝑃), as mg/L of elemental phosphorus, was determined by using
HACH Lange LCK 349 cuvettes and a HACH LANGE DR3900 spectrophotometer
(standard ISO 6878).
4.4.4 Oil, gas chromatography
Hydrocarbons were quantitatively determined (hydrocarbon oil index, mg/l) by solvent
extraction and gas chromatography (ISO 9377-2:2000) by the Naantali refinery QC-
laboratory. Extraction was done using n-pentane. Extracts were filtered using Florisil-
filtration, particle size 150-250 µm (60-100 mesh). A Perkin Elmer Clarus 680 gas
chromatograph was used, the column was fused silica (5 m, 0.1 mm, 0.1 µm) with 5%
phenyl methylpolysiloxane while as the pre-column Retention GAP 4m, id 0.5 mm
methyl deactivated was applied. Hydrogen served as a carrier gas, and detection was
done by a flame ionisation detector (FID). Results were calculated by the peak
integration. The lower detection limit for the method is 0.1 mg/l. Calibration was done
according to the ISO standard.

Methods
38
Ralf Sirén
4.4.5 Suspended solids
Suspended solids (SS) were determined gravimetrically by vacuum filtering a fixed
volume, drying the filter and then measuring the weight gain. The procedure was done
by the Naantali Refinery QC-laboratory.
4.4.6 Turbidity
Turbidity was measured using a HACH LANGE 2100Q portable turbidimeter. The
meter measures transmitted and scattered (90°) light. The measurement mode used
was signal averaging of 12 measurements. Results were given in nephelometric turbidity
units (NTU) and were automatically calculated. Turbidity measurements were done
within one minute of taking the sample. The meter was calibrated once, and the
calibration was verified several times during the experiments with standards.
4.4.7 Measurement of pH
In the jar tests, the pH was measured using semi-automatic pH-meter. The pH of the
full-scale experiments was measured with an on-line pH meter (AI-3404) and
confirmed with the pH meter in the laboratory. Both meters were calibrated once per
week.
4.4.8 Hydrogen sulphide
Hydrogen sulphide was determined by potentiometric titration in water solution with
AgNO3. 20 ml of ammonium-NaOH buffer solution was added to the 100 ml sample
before titration. Autotittrator Mettler Toledo T90 and combination electrode Metrohm
Ag Titrode 6.0430.100 was used.
4.5 Calculations
4.5.1 Efficiency calculations
The relative removal of a substance (contaminant) was calculated as follows:
𝑟𝑒𝑚𝑜𝑣𝑎𝑙 % =
𝐶𝑖𝑛 − 𝐶𝑜𝑢𝑡
𝐶𝑖𝑛· 100% (4)

Methods
39
Ralf Sirén
where 𝐶𝑖𝑛 is concentration of substance in untreated water and 𝐶𝑜𝑢𝑡 is the
concentration of substance in treated water.
4.5.2 Residence time and step change calculations
The residence time is given by equation (5)
𝜏 =
𝑉
𝑄
[𝑚3]
[𝑚3/ℎ]= [ℎ] (5)
where τ [h] is the residence time (or time constant), V [m3] is the reactor volume, and
Q [m3/h] the flow rate. To determine the step response for the flocculator and the
flotator, e.g. the time required for the reactors to reach a sufficient steady state after a
parameter change for sampling purposes, the following equation (6) was used:
𝑐𝑜𝑢𝑡(𝑡) = 𝑐𝑜 + (1 − 𝑒−
𝑡𝜏) ∆𝑐𝑖𝑛 (6)
where cin(t) is the overflow concentration, co the initial concentration, t [h] the time
from the step change creating the imbalance, and Δcin the magnitude of the step
change. Equation (6) assumes perfect backmixing. Most samples were collected from
the flotator, but the coagulants were added to the flocculator. Therefore, to calculate
the step response for two CSTRs in series, equation (7) was used:
𝑐𝑜𝑢𝑡(𝑡) = 𝑐𝑜 + ∆𝑐𝑖𝑛 [1 −𝜏1
𝜏1 − 𝜏2𝑒
−𝑡𝜏1⁄ +
𝜏2
𝜏1 − 𝜏2𝑒
−𝑡𝜏2⁄ ] (7)
where τ1 and τ2 are the time constants for the flocculator and flotator, respectively.
4.5.3 Cost calculations
The cost of chemicals were calculated with fixed prices retrieved from the procurement
department or indicative prices received from the chemical supplier. The annual costs
of chemicals were calculated using the following formula:

Methods
40
Ralf Sirén
𝑎𝑛𝑛𝑢𝑎𝑙 𝑐𝑜𝑠𝑡 𝑖𝑛 € =
𝑐 ∙ �̇� ∙ 𝑃
𝑥 ∙ 106 (8)
where c [mg/L] is the desired average concentration of the active component of the
chemical in the wastewater, x is the fraction (wt/wt) of the active component in the
chemical, �̇� [m3/year] is the annual flow of wastewater, and P the price of a chemical in
€/ton.
4.5.4 Statistical methods
In all the experiments where t-tests were used to analyse results, except for the
regression line p-values, a more robust t-test with two tails and unequal variance
(Welch's t-test) was used. In the regression line fitting, the Excel Analysis ToolPak's
regression analysis was used (Student's t-test).

Results
41
Ralf Sirén
70%
75%
80%
85%
90%
95%
100%
5 6 7 8 9 10
% T
urb
idit
y R
emo
val,
NTU
Initial pH
ALS-50
PAX-14
PAX-XL100
PIX-111
PIX-115
5 Results
5.1 Jar test results
5.1.1 Coagulant selection
A coagulant for the full-scale experiment was selected by jar testing, which is a standard
method for determining the optimal coagulation and flocculation conditions in
wastewater treatment. The pH dependence of the contaminant reduction was
investigated for five coagulants. The coagulants were dosed and compared by equal
weights of metal, in mg/L. The initial pH refers to the level of pH at which the samples
were adjusted, before the addition of coagulants. The post-treatment pH was usually
between 0.5 to 1 pH levels lower. The post-treatment pH corresponds to the full-scale
process.
5.1.1.1 Turbidity as a function of pH (unfiltered)
Figure 11: Turbidity removal as a function of initial pH for unfiltered jar test supernatant.
Changes in turbidity were investigated at different initial pH levels. The pH was
adjusted before adding the coagulant and starting the mixing program. As shown in
Figure 11, all coagulants except PIX-111 (ferric chloride) have their highest observed
removal of turbidity at an initial pH of 10. PIX-111 has a maximum removal of 98.5% at
initial pH 8. Turbidity removal is > 98% for both ferric coagulants when the initial pH
is 8 or higher.

Results
42
Ralf Sirén
5.1.1.2 Turbidity as a function of pH (filtered)
Figure 12: Turbidity removal as a function of initial pH for filtered jar test supernatant.
A part of the supernatant was filtered to remove non-settled floc and micro floc. As
Figure 12 indicates, the highest removal of turbidity was achieved by PIX-111 (ferric
chloride) at 99.4% and PIX-115 (ferric sulphate) at 99.3% at an initial pH of 8. The iron-
based coagulants made larger flocs, as observed visually and indicated by the results of
the filtered turbidity experiments (Figure 12). A larger part of the iron-floc remained in
the filter, while some of the smaller aluminium-floc went through, as shown when
comparing Figure 11 and Figure 12.
90%
91%
92%
93%
94%
95%
96%
97%
98%
99%
100%
5 6 7 8 9 10
% T
urb
idit
y R
emo
val,
NTU
Initial pH
ALS-50
PAX-14
PAX-XL100
PIX-111
PIX-115

Results
43
Ralf Sirén
5.1.1.3 Oil removal as a function of pH
Figure 13: Oil removal as a function of initial pH
The effect of initial pH and type of coagulant on oil removal is presented in Figure 13.
Depending on the initial pH, different coagulants performed better. The highest degree
of oil removal was achieved by the two polyaluminium chlorides: PAX-XL100 at the
initial pH 9 and PAX-14 at the initial pH 10, both resulting in an oil removal of 95.6%
in relation to the zero sample. At pH 8 PIX-115 (ferric sulphate) displayed the best
performance, removing 94.5% of the oil. Post-treatment pH was 0.5-1 pH units lower
than the initial pH, therefore applying it to the full-scale process, the results suggest
that the best coagulant at pH 5-6 is aluminium sulphate, for pH 6-7 PAX-XL100, pH 7-
8 ferric sulphate or either PAC, and above pH 8 either PAC or ferric chloride. Overall,
the oil removal performance of the coagulants as a function of pH is somewhat
irregular.
85%
87%
89%
91%
93%
95%
97%
5 6 7 8 9 10
% O
il R
emo
val
Initial pH
ALS-50
PAX-14
PAX-XL100
PIX-111
PIX-115

Results
44
Ralf Sirén
5.1.1.4 Phosphorus removal as a function of pH
Figure 14: Phosphorus removal as a function of initial pH
The highest possible degree of phosphorus removal was 98.5%, with the results being
limited by the relationships of the lower detection limit of the analytical method used
to the initial phosphate concentration (LDL = 0.005 mg/l, zero sample phosphate
concentration = 0.34 mg/l). In reality, the percentage of phosphate removal might have
been anything between 98.5% and 100%. All coagulants had a phosphate removal of
≥98.5% when samples with an initial pH of 7 were treated (Figure 14). The post-
treatment pH varied between 6-6.7 for all samples with an initial pH = 7. PIX-115 (ferric
sulphate) also achieved a removal rate of ≥98.5% at an initial pH of 6. The pre-
hydrolysed polyaluminium chloride coagulant PAX-XL100 removed ≥98.5% in all
samples with initial pH of 7-9. PAX-14 also removed ≥98.5% at initial pH 9. The final
pH for the treated samples was usually slightly lower than the initial pH, with a
maximum of 1.0 pH units lower than the initial pH. The results also suggest that ferric
coagulants remove phosphate better below neutral pH, while PAC-coagulants perform
better in more alkaline environments. Aluminium sulphate and ferric sulphate have
interesting trend-breaking dips in the curve at initial pH 8 (post-treatment pH 7-8).
When applying the findings to industrial scale, the best phosphate removal was found
at around pH 6-6.5. These results are well in line with the research of 33, who found the
optimum for both aluminium- and iron-based coagulants to be at pH 5-7.
80%
82%
84%
86%
88%
90%
92%
94%
96%
98%
100%
5 6 7 8 9 10
% P
ho
sph
oru
s R
emo
val
Initial pH
ALS-50
PAX-14
PAX-XL100
PIX-111
PIX-115

Results
45
Ralf Sirén
5.1.1.5 COD removal as a function of pH
Figure 15: Removal of Chemical Oxygen Demand (COD) as a function of initial pH
The jar tests examining COD removal as a function of pH suggested that COD removal
is more effective in more alkaline conditions. Figure 15 illustrates how the initial pH
influenced the reduction of COD. All coagulants had their maximum removal of COD
at an initial pH 9. The highest degree of COD removal (61.0%) was in the sample treated
with PAX-14, followed by PAX-XL100 (60.8%), both polyaluminium chlorides. The
removal% trends upwards with increasing pH. The maxima for all coagulants were
observed at initial pH 9, or post-treatment pH 8-9. For ferric sulphate and aluminium
sulphate the COD removal trend-braking behaviour was again observed at the initial
pH 8. All coagulants performed similarly below neutral pH, while PAC performed
better under alkaline conditions. Aluminium sulphate performed worst compared to
other coagulants at initial pH >7.
5.1.1.6 Removal of hydrogen sulphide
An experiment for H2S removal with trivalent iron (PIX-115) and aluminium (PAX-
XL100) based salts was conducted. The coagulant dose was 20 mg/L of the metal ion
(a molar ratio of 0.6:1 of Fe3+ to H2S and 1.2:1 of Al3+ to H2S). The data (Figure 16) suggest
that trivalent iron removed 95% and aluminium 29% of H2S, respectively. The
experiments were carried out simultaneously but the analysis was started with the zero
sample.
45%
50%
55%
60%
5 6 7 8 9 10
% R
emo
val o
f C
OD
Initial pH
ALS-50
PAX-14
PAX-XL100
PIX-111
PIX-115

Results
46
Ralf Sirén
Figure 16: H2S removal. A comparison of trivalent iron and aluminium for the removal of H2S from the WWTP
feed.
5.1.2 Polymer selection
5.1.2.1 Turbidity as a function of pH
The turbidity as a function of the initial pH was compared for six cationic polymers
(Figure 17). All polymers had a minimum of remaining turbidity in the samples with an
initial pH 8.4, which was the sample with non-adjusted pH. The initial pH was
measured before the addition of 10 mg/L of Fe from ferric sulphate. The polyelectrolyte
C491-HMW resulted in the lowest turbidity of 3.4 NTU at the initial pH 8.4. The overall
21
1
15
0
5
10
15
20
25
30
35
40
No coagulant PIX-115 PAX-XL100
H2
S, p
pm
Type of Treatment
3
4
5
6
7
8
7 8 9
Turb
idit
y, N
TU
Initial pH
Turbidity vs pH for normal molecular weight flocculants
C491 C494 C498
3
4
5
6
7
8
7 8 9
Turb
idit
y, N
TU
Initial pH
Turbidity vs pH for high molecular weight flocculants
C491-HMW C494-HMW C498-HMW
Figure 17: Comparison of polymers with different charge densities and molecular weights. Turbidity as a function of initial pH. Polymers with standard molecular weight on the left side, and high molecular weight on the right.

Results
47
Ralf Sirén
difference between the polymers is small in comparison with the non-treated water
with a turbidity of 123 NTU. The more neutral polyelectrolytes performed better than
polymers with a higher cationic charge density.
5.1.2.2 Turbidity as a function of polymer dosage and type
The influence of the polymer dosage on the turbidity was examined (Figure 18). The
experiments were done with a feed water sample different from the ones in Figure 17.
The results suggest that a lower polymer dose is better for the removal of turbidity.
Polyelectrolyte C494 had the lowest remaining turbidity at 5.5 NTU for 1.25 mg/L, but
also the highest at 24.6 NTU and 5 mg/L. Polymer C491 showed the lowest variance.
Overall, more neutrally charged polymers performed better than strongly charged ones,
and the results were more stable. Results in the literature vary greatly depending on
the wastewater properties and the specific combination with metal coagulants.
Figure 18: Turbidity vs polyelectrolyte dose for different polyelectrolytes. A dose of 10 mg/L Fe3+ of ferric
sulphate was used at pH 8. Initial turbidity was 101 NTU.
5.1.3 Optimal dosages during process disturbances
When process disturbances and anomalies appeared, the feed was analysed, and the
following jar tests were conducted. This was done to learn if the chemicals screened
can be used in more demanding situations, thus increasing the practical usefulness of
this work.
During process disturbance A, the flotator (AD-3403) effluent was a slightly white-
coloured, unspecified emulsion. The DAF effluent was also grey with turbidity of 203
NTU, caused by the emulsion flowing through the unit. A sample was taken and treated
0
5
10
15
20
25
30
C491 C491HMW C494 C494HMW C498 C498HMW
Rem
ain
ing
Turb
idit
y, N
TU
Polyelectrolyte dosage, mg/L
1,25 mg/L
2,5 mg/L
5 mg/L
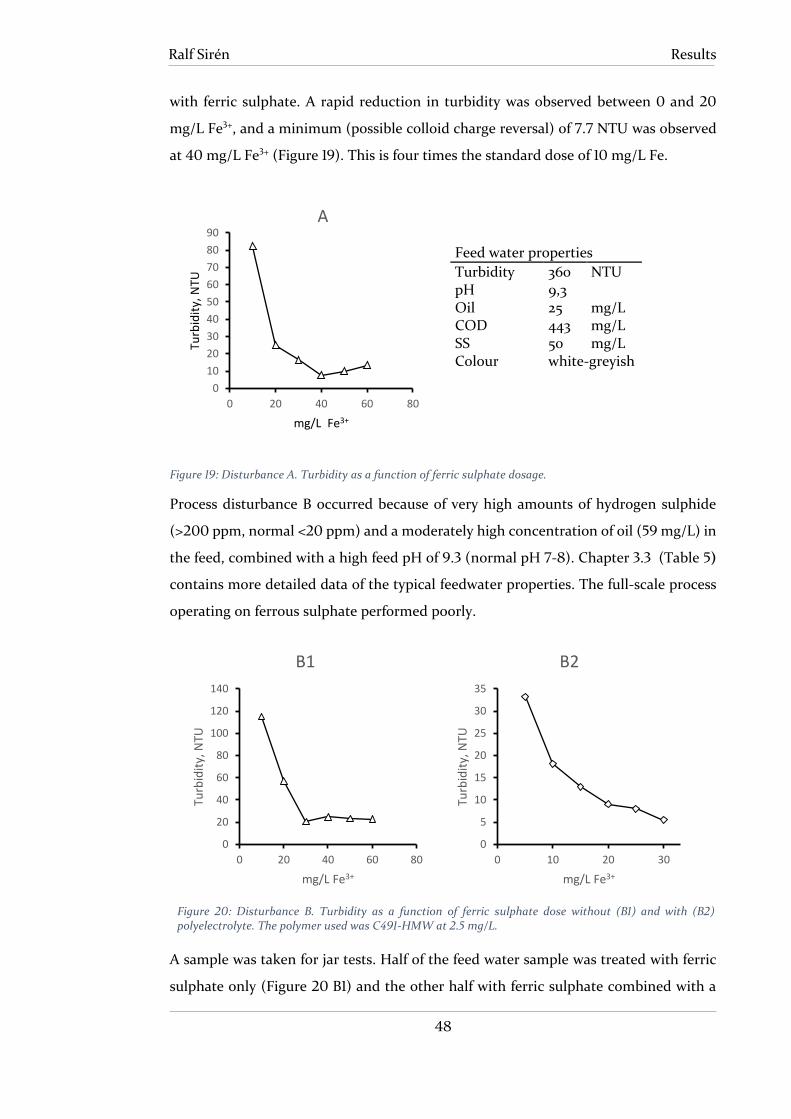
Results
48
Ralf Sirén
with ferric sulphate. A rapid reduction in turbidity was observed between 0 and 20
mg/L Fe3+, and a minimum (possible colloid charge reversal) of 7.7 NTU was observed
at 40 mg/L Fe3+ (Figure 19). This is four times the standard dose of 10 mg/L Fe.
Figure 19: Disturbance A. Turbidity as a function of ferric sulphate dosage.
Process disturbance B occurred because of very high amounts of hydrogen sulphide
(>200 ppm, normal <20 ppm) and a moderately high concentration of oil (59 mg/L) in
the feed, combined with a high feed pH of 9.3 (normal pH 7-8). Chapter 3.3 (Table 5)
contains more detailed data of the typical feedwater properties. The full-scale process
operating on ferrous sulphate performed poorly.
A sample was taken for jar tests. Half of the feed water sample was treated with ferric
sulphate only (Figure 20 B1) and the other half with ferric sulphate combined with a
0
10
20
30
40
50
60
70
80
90
0 20 40 60 80
Turb
idit
y, N
TU
mg/L Fe3+
A
0
20
40
60
80
100
120
140
0 20 40 60 80
Turb
idit
y, N
TU
mg/L Fe3+
B1
0
5
10
15
20
25
30
35
0 10 20 30
Turb
idit
y, N
TU
mg/L Fe3+
B2
Feed water properties
Turbidity 360 NTU pH 9,3 Oil 25 mg/L COD 443 mg/L SS 50 mg/L Colour white-greyish
Figure 20: Disturbance B. Turbidity as a function of ferric sulphate dose without (B1) and with (B2) polyelectrolyte. The polymer used was C491-HMW at 2.5 mg/L.

Results
49
Ralf Sirén
constant dose of polyelectrolyte C491HMW (Figure 20 B2). For ferric sulphate only, the
highest removal of turbidity was observed at 30 mg/L Fe. For ferric sulphate and
polyelectrolyte, the turbidity decreased with the iron dosage, however no maximum of
removal was found within the studied concentration range. The combined application
of polymer and ferric sulphate lowered the turbidity to less than a quarter of the level
achieved by ferric sulphate alone.
Disturbance C (Figure 21) is a more common situation, with high levels of hydrogen
sulphide (60 ppm) in the feed. The feed turbidity was only 120 NTU, which is in the
normal range of 100-200 NTU. A water sample was taken and treated with various
doses of ferric sulphate and polyelectrolyte C491-HMW at 2.5 mg/L. When treated with
a low dose (5 mg/L Fe) of ferric sulphate, the turbidity increased to 133 NTU, and
thereafter decreased. Interestingly, the lowest measured turbidity of all experiments in
this thesis (1.44 NTU) was observed at the iron dose of 25 mg/L.
Figure 21: Disturbance C. Turbidity as a function of ferric sulphate dosage, with 2.5 mg/l of polyelectrolyte C491-HMW.
0
20
40
60
80
100
120
140
0 10 20 30 40
Turb
idit
y, N
TU
mg/L Fe3+
Disturbance C

Results
50
Ralf Sirén
5.1.4 Turbidity as a function of mixing time
The influence of the stirring speed and mixing time on the turbidity was investigated
by jar testing. Figure 22 shows that the turbidity correlates inversely with the mixing
time when the stirring speed was 40 rpm. More efficient mixing at 400 rpm (Figure 23)
decreased the turbidity faster, reaching a minimum of 14.4 NTU after one minute,
followed thereafter by increasing turbidity. Slow mixing (40 rpm) allowed to reach
similar turbidity (14.2 NTU) after 10 minutes. The rpm-levels were chosen based on the
two discrete levels for rapid and slow mixing available in the jar test equipment.
0102030405060708090
100
0 10 20 30 40 50
Turb
idit
y, N
TU
Time, min
Residual turbidity vs mixing time (40 RPM)
0
5
10
15
20
25
30
35
0 100 200 300
Turb
idit
y, N
TU
Time, s
Residual turbidity vs mixing time (400 RPM)
Figure 22: Residual turbidity as a function of mixing time using the slow setting (40 rpm) and 5 minutes of settling. Ferric sulphate was used with a 5 mg/L dosing (calculated as Fe).
Figure 23: Residual turbidity as a function of fast mixing time (400 rpm), followed by 2 min slow mixing (40 rpm) and 5 minutes of settling. Ferric sulphate with a 5 mg/L dosing (calculated as Fe).

Results
51
Ralf Sirén
5.2 Full-scale experimental results
5.2.1 Determining sampling intervals
A step change response and residence time calculations were undertaken to determine
appropriate sampling intervals. The time to reach the steady state was calculated. The
change in the reactor coagulant concentration when changing the dose from 10 to 20
mg/L, for a flow of 100 and 200 m3/h, can be seen in Figure 24 and Figure 25. The
calculations are based on the ideal cases (assuming complete backmixing, a CSTR), a
safety margin of 2 h should be added to yield more reliable results.
5.2.2 Saturator pressure
The saturator tank pressure as an independent variable was varied, in two levels: low
(3.5 bar) and high (4.0 bar) (Figure 26). The amount of total suspended solids (TSS)
was the dependent variable. Because no pressure-dependent differences could be seen
in the results, a two-sample t-test assuming unequal variances was conducted to test
the null hypothesis; that pressure does not influence the TSS concentrations. The
results were not significant (p = 0.76 > α = 0.05). Thus, the results suggest that the
saturator pressure did not influence the flotator performance regarding TSS in a
significant way.
8
10
12
14
16
18
20
22
-2 0 2 4 6 8 10 12 14 16
Co
agu
lan
t C
on
cen
trat
ion
, mg/
L
Time, h
c(t) flocculator
c(t) flotator
Figure 24: The step response c(t) for the flocculator and flotator at 100 m3/h flow, when increasing the coagulant dose from 10 to 20 mg/L.
8
10
12
14
16
18
20
22
-2 0 2 4 6 8 10 12 14 16
Co
agu
lan
t C
on
cen
trat
ion
, mg/
L
Time, h
c(t) flocculator
c(t) flotator
Figure 25: The step response c(t) for the flocculator and flotator at 200 m3/h flow, when increasing the coagulant dose from 10 to 20 mg/L.

Results
52
Ralf Sirén
Figure 26: Total suspended solids response for two levels of saturator pressure (3.5 and 4 bar).
Because this experimental result conflicted with previous findings in the literature,
where higher pressure improves the performance, the reason was investigated.17,28 It
was found that the air flow meter FC-3407 was not malfunctioning, as was the
consensus on site, but the FC-3407-CON flow controller was stuck, or the pressurised
air pipe was clogged at the mixing point with the recycled water. Nevertheless, the
problem was fixed by opening the controller fully and then adjusting it to the desired
level. Another finding was that either the saturator pressure meter K_PG3410 showed
the wrong pressure or the safety valve SV-3406 did not open at 3.9 bars.
5.2.3 Air volume to saturator
After the saturator pressure experiments, the effect of the air volume flow was
investigated. Visually the flotator performance increased up to an air flow of 20 Nm3/h,
thereafter looking the same until 40 Nm3/h of air. Slightly before 40 Nm3/h the
saturator vessel stopped working properly, because air started replacing water in the
saturator vessel, and instead of forming micro-bubbles, 1-10 cm sized bubbles rose to
the flotator surface. Because no apparent differences in the performance of 20 and 30
Nm3/h could be observed visually, these two levels were compared by analysis of TSS
from the overflow.
A two-sample t-test with assumed unequal variances (Welch's t-test) was thus
conducted to compare total suspended solids in the flotator effluent for 20 and 30
Nm3/h of air. There was a significant difference in the SS concentration (mg/L) for 20
Nm3/h (M=19.8, SD=6.1, N=10) and 30 Nm3/h (M=13.1, SD=4.4, N=10); t(16)=2.83, two
tail p = 0.012. The results suggest 30 Nm3/h air flow caused an average reduction of 6.7
0
5
10
15
20
25
30
35
40
0 2 4 6 8
Res
idu
al S
S, m
g/L
Experiment nr
3.5 bar
4.0 bar
3.5 bar mean
4.0 bar mean

Results
53
Ralf Sirén
mg/L TSS which equals 34% less suspended solids in the flotator overflow, compared
to the 20 Nm3/h air flow. These results can be compared with the air flow from the
previous years. In most of 2017, the process was run on 3-5 Nm3/h air. In 2016, the air
flow averaged slightly below 20 Nm3/h, with occasional drops below 10 Nm3/h.
5.2.4 Influence of pH
Residual turbidity, oil, SS, COD, and the phosphate content were measured as a
function of the flotator feed pH (Figure 27). No correlation of turbidity with pH could
be observed. The linear regression shows no correlation (R2 = 0.03) and is not
statistically significant (α = 0.05). Removing the outlier at pH 8 does not change the
result in any meaningful way.
Figure 27: Contaminants as a function of pH. Chemical doses were ferric sulphate 8-10 mg/L Fe and 4 mg/L anionic polymer.
R² = 0.0318
0
2
4
6
8
10
12
14
16
18
20
7,0 8,0 9,0 10,0
Turb
idit
y, N
TU
pH
Turbidity
R² = 0,0121
0,0
1,0
2,0
3,0
4,0
5,0
6,0
7,0 8,0 9,0 10,0
Res
idu
al O
il, m
g/L
pH
Oil
R² = 0.6328
0
2
4
6
8
10
12
14
16
7,0 8,0 9,0 10,0
Res
idu
al S
S, m
g/L
pH
SS
R² = 0.1292
0
20
40
60
80
100
120
140
7,0 8,0 9,0 10,0
Res
idu
al C
OD
, mg/
L
pH
COD

Results
54
Ralf Sirén
No clear dependence on the oil content and pH was found for the flotator effluent. As
shown in Figure 27, the linear regression line fits the data poorly (R2 = 0.012) and is not
significant (α=0.05). Thus, the data suggest that the variance of the amount of residual
oil in the flotator effluent is caused by something else than the pH level.
A statistically significant (p<0.05) downward like curve relationship was found for
suspended solids to pH (R2 = 0.63). Multiple linear regression of the residual SS in the
flotator effluent resulted in a 2nd-degree polynomial (Figure 27). The data suggests, that
there is a maximum of SS in the flotator effluent at pH 8-8.5 while decreasing or
increasing the pH outside this interval will lower the residual SS in the effluent.
The removal of COD (Figure 27) seems to increase with an increase of pH (R2 = 0.13),
but additional data are needed to verify this hypothesis. This result, in combination
with the results from the jar tests, suggests that there is indeed a positive correlation
between pH and COD removal. However, the results were not statistically significant
(α = 0.05 < p = 0.16).
Figure 28: Removal of phosphate as a function of pH.
In the area of interest, removal of phosphate did not show statistical significance. Figure
28 illustrates the relationship of residual phosphate with pH. Similarly to the jar tests,
the phosphate removal seems to be better closer to pH 7, as expected from the jar-tests
and literature 33. The results also show a low residual phosphorus content at pH > 9.
However, because of the large variance in the sample, no conclusion can be drawn with
any statistical certainty. One apparent reason for this high variance is that sanitary
R² = 0.4329
0,00
0,02
0,04
0,06
0,08
0,10
0,12
7,0 8,0 9,0 10,0
Res
idu
al P
ho
sph
oru
s, m
g/L
pH
Phosphorus

Results
55
Ralf Sirén
water is pumped to the feed intermittently (pump GA-3410). The best fitting equation
was a polynomial of second order (R2 = 0.43).
5.2.5 Anionic polymer dosage (A100-HMW)
Residual contaminants in the DAF overflow were examined as a function of anionic
polymer dosage (A100-HMW) in the pH range of 7.2-7.6 and using ferric sulphate for
15 days. The results are illustrated in Figure 29. The turbidity increased with the
polymer dose but had a minimum in the vicinity of 1 mg/L. The residual turbidity
showed a high positive correlation to the polymer dose and was statistically significant
(R2 = 0.69, p<0.05). With respect to the oil content, there was no correlation with pH.
Suspended solids showed a minor correlation and borderline significance (R2 = 0.23,
p=0.08). Remaining COD also increased with the polymer concentration (R2 = 0.29,
p=0.06), also bordering on significance when α=0.05. The overall trend suggests that
increasing the polymer concentration above 1 mg/L leads to less satisfactory results.

Results
56
Ralf Sirén
Figure 29: Contaminants as a function of anionic polymer dosage. Coagulant 7-10 mg/L ferric sulphate and pH 7.2-7.6
5.2.6 Cationic polymer dosage (C491-HMW)
Residual contaminants in the DAF overflow were examined as a function of cationic
polymer dosage (C491-HMW) in the pH range of 7.1-7.6 and using ferric sulphate for 8
days (Figure 30). It should be noted that the sample count was lower in this experiment
than in the experiments with the anionic polymers, therefore the feed water properties
had a larger significance on the results, and the variance was smaller. Samples were
taken twice per day, instead of once, as in the case with the anionic polymer (Section
4.3.3.5).
R² = 0.6881
0
2
4
6
8
10
12
0,0 2,0 4,0 6,0
Turb
idit
y, m
g/L
Polymer, mg/L
Turbidity
R² = 0.0144
0
0,5
1
1,5
2
2,5
3
3,5
4
0,0 1,0 2,0 3,0 4,0 5,0
Oil,
mg/
L
Polymer, mg/L
Oil
R² = 0.2301
0
1
2
3
4
5
6
7
8
9
0,0 2,0 4,0 6,0
SS, m
g/L
Polymer, mg/L
SS
R² = 0.2894
0
20
40
60
80
100
120
0,0 2,0 4,0 6,0
CO
D, m
g/L
Polymer, mg/L
COD

Results
57
Ralf Sirén
Figure 30: Contaminants as a function of cationic polymer dosage. Coagulant 7-10 mg/L ferric sulphate and pH 7.1-7.6
No correlation with the cationic polymer dose was observed for the turbidity. Oil and
SS showed clear correlations, R2 = 0.39 and R2 = 0.69 respectively. The SS result was
statistically significant (p<0.05). The removal of COD showed a very high statistically
significant (R2 = 0.94, p<0.05) correlation, which raises several questions regarding
validity of the results. An observation was that the turbidity showed no correlation with
the polymer dose, despite the large changes in oil, SS, and COD.
R² = 0,0953
0
2
4
6
8
10
12
0,0 1,0 2,0 3,0 4,0 5,0
Turb
idit
y, m
g/L
Polymer, mg/L
Turbidity
R² = 0,3905
0
0,5
1
1,5
2
2,5
3
3,5
4
0,0 1,0 2,0 3,0 4,0 5,0
Res
idu
al O
il, m
g/L
Polymer, mg/L
Oil
R² = 0,6945
0
2
4
6
8
10
12
0,0 2,0 4,0 6,0
Turb
idit
y, m
g/L
Polymer, mg/L
SS
R² = 0,9421
0
20
40
60
80
100
120
140
160
0,0 1,0 2,0 3,0 4,0 5,0
Res
idu
al C
OD
, mg/
L
Polymer, mg/L
COD

Results
58
Ralf Sirén
5.3 Performance of ferric sulphate versus ferrous sulphate
5.3.1 Turbidity
The purpose of Figure 31 is to demonstrate how ferric and ferrous sulphates behave in
comparison to each other and the flow rate. The results suggest that the variance is
much higher when using ferrous sulphate, and that ferrous is more sensitive to
fluctuations in the flow rate. Each time ferrous sulphate was changed to ferric sulphate,
the turbidity decreased, and vice versa. The ferrous sulphate curve (circles) represents
the behaviour of the current industrial-scale chemical treatment, while the triangles
represent different experiments with ferric sulphate, with the dose averaging an
equivalent amount of iron (10 mg/L Fe) and various doses of polymers (mostly lower
than with ferrous sulphate). These samples were taken once per day, between 7-9 am.
The average costs for running the process with ferric sulphate (triangles) is 30% lower,
being more efficient than the conventional process. Cost calculations are presented in
section 5.5.
Figure 31: Time dependence of wastewater flow rate (left axis) and flotator overflow turbidity (right axis), for ferric (triangles) and ferrous (circles) sulphate.
0
50
100
150
200
250
300
350
400
450
25.11. 5.12. 15.12. 25.12. 4.1. 14.1. 24.1. 3.2. 13.2.
0
20
40
60
80
100
120
140
160
180
200
Was
tew
ater
flo
w, m
3 /h
Date
Turb
idit
y, N
TU
Ferroussulphate
Ferricsulphate
water flow

Results
59
Ralf Sirén
5.3.2 Oil
As can be seen in Figure 32, the overflow oil content was lower when ferric sulphate
was used. Noteworthy is the lower volatility with this additive, similarly to the turbidity.
Again, changing from ferrous sulphate to ferric sulphate yielded, in most cases, better
results. The difference is not as pronounced for oil as for turbidity. Overall, for the
illustrated set of data, the residual oil was 53% lower when using ferric sulphate
compared to ferrous sulphate (average values 5.8 mg/l and 2.7 mg/l for ferrous and
ferric sulphate respectively).
Figure 32: Time dependence of oil content in flotator overflow. The solid line represents the test-runs with ferric sulphate. The process was run in the modified way (ferric dosing based on turbidity measurements) from 1.3.2018 onwards.
5.3.3 COD
Removal of COD is improved when using ferric sulphate, and the variance was lower
(Figure 33). For this set of data, the average remaining COD for ferric sulphate is 87
mg/l, while the average for ferrous sulphate is 202 mg/l. Thus, for the duration of the
experiments, the observed COD is 57% lower when using ferric sulphate compared to
the conventional process.
0
2
4
6
8
10
12
14
16
18
20
4.2017 5.2017 7.2017 8.2017 10.2017 12.2017 1.2018 3.2018 5.2018
Oil-
ind
ex m
g/L
Date
Ferrous
Ferric

Results
60
Ralf Sirén
Figure 33: Time dependence of COD content in flotator overflow. The solid line represents the test-runs with ferric sulphate. The process was run in the modified way (ferric dosing based on turbidity measurements) from 1.3.2018 onwards.
5.3.4 Suspended solids
Suspended solids (SS) show an evident reduction in the variance values when using
ferric sulphate (Figure 34). The average SS for ferrous- and ferric sulphates are 17.3
mg/l and 6.7 mg/l respectively, which corresponds to a total decrease of 61% with the
novel procedure.
Figure 34: Time dependence of suspended solids content in flotator overflow. The solid line represents the test-runs with ferric sulphate. The process was run in the modified way (ferric dosing based on turbidity measurements) from 1.3.2018 onwards.
0
100
200
300
400
500
600
4.2017 5.2017 7.2017 8.2017 10.2017 12.2017 1.2018 3.2018 5.2018
CO
D m
g/L
Date
Ferrous
Ferric
0
10
20
30
40
50
60
70
4.2017 5.2017 7.2017 8.2017 10.2017 12.2017 1.2018 3.2018 5.2018
TSS
mg/
L
Date
Ferrous
Ferric

Results
61
Ralf Sirén
5.3.5 Phosphorus
For the accumulated set of data, residual phosphorus is 76% lower when using ferric
sulphate (ferric 0.055 mg/l, ferrous 0.233 mg/l). As noted for all other impurities, the
variance was lower when ferric sulphate was used (Figure 35).
Figure 35: Time dependence of phosphorus content in flotator overflow. The solid line represents the test-runs with ferric sulphate. The process was run in the modified way (ferric dosing based on turbidity measurements) from 1.3.2018 onwards.
5.4 Other observations
5.4.1 Sediment deposits in DAF
Before the thesis work started, the author was working as a field operator in the WWTP
and had the privilege to observe the flocculator and DAF unit empty of water. An
interesting observation was made; there was almost no settled deposits on the bottom
of the flocculator, but large deposits in the DAF unit. When observing the settled floc,
the floc in the flocculator was very small, while the floc in the flotation unit was larger
and contained polymers.
5.4.2 Effects downstream
When experimenting with the chemical treatment process, some effects on the
biological process downstream became visible. Too high phosphorus removal in the
flotation step results in a lack of phosphorus for bacterial growth in the activated sludge
0
0,2
0,4
0,6
0,8
1
1,2
4.2017 5.2017 7.2017 8.2017 10.2017 12.2017 1.2018 3.2018 5.2018
Ph
osp
ho
rus
mg/
L
Date
Ferrous
Ferric

Results
62
Ralf Sirén
process. A lack of phosphorus leads to a need to add phosphate to the biological
treatment. Removing phosphate upstream and then adding it in the next process step
is counterproductive.
Another observation was that the biological sludge seemed to settle better in the
clarifier downstream when cationic polyacrylamide was used in the DAF unit. However,
the water properties also changed at the same time, and the polymers were only
changed once. However, a single observation is not sufficient for a general conclusion.
5.4.3 Aerator deposits
Previously, deposits have been found on the two flocculator aerators. The aerators suck
air from above the flocculator surface, mix it with the wastewater sucked from the
bottom, and then ejects the dispersion to the middle of the basin. The one to two
centimetre thick and hard deposits block the aerator ejection channels. During the test
runs, the aerators were inspected at one-month intervals. No deposits were found, as
can be seen in Figure 36. Thus, application of ferric sulphate combined with a lower pH
helps to reduce the occurrence of deposits in the system.
Figure 36: Two pictures of the same aerator of the flocculation basin. On the left the aerator when inspected at the beginning of the test run, on the right the aerator after four months of test runs with ferric sulphate.
5.5 Cost estimation
5.5.1 Costs of chemicals
Costs of chemicals for the flocculation and flotation systems were calculated. The
present costs (Table 10) were calculated using two different methods. The first method
summed up the chemical procurement costs for the past three years, and an annual
average was calculated. The second method was to measure the consumption of

Results
63
Ralf Sirén
chemicals for a month, in case of incomplete purchase data, and to project the costs for
a whole year. Both methods gave a similar result, and can thus be considered reliable.
Table 10: Cost of chemicals
Chemical
Average annual
purchases, past
three years
Annual average,
based on past
30 days
Ferrous sulphate 7 245 € 7 817 €
Polyelectrolyte A100-HMW 17 579 € 15 983 €
Caustic soda 47 702 € 45 662€
Sum 72 526 € 69 462 €
The largest cost item is caustic soda, used for regulating the pH to 9-9.5, covering 60-
70% of the total costs for chemicals. In comparison to NaOH, ferrous sulphate is
inexpensive, covering approximately 10% of the expenses. Increasing the ferrous
sulphate dose would also require an increase in the caustic dosage to compensate for
the ferrous acidity and keeping the pH within the required interval.
5.5.2 Alternative cost calculations
An alternative cost structure was calculated, based on the experiment results and the
author's recommendations for novel process implementation. The main purifying
effect stems from the use of a coagulant, while the polyelectrolyte has a secondary role
to increase the separation. Because equally good or better results could be achieved at
a lower pH using ferric sulphate, the largest expenditure, caustic soda, could be
significantly reduced. Results also suggest that the polyelectrolyte was overdosed, and
reducing the dose by half would yield a better result. Two alternatives are put forward,
both with the same or better efficiency of contaminant removal than the conventional
process using ferrous sulphate (calculated as the equivalent dose of Fe3+:Fe2+).
Table 11: Alternative costs of chemicals
Chemical
Equivalent
dose of iron
Double dose
of iron
Ferric sulphate 21 000 € 42 000 €
Polyelectrolyte 7 000 € 7 000 €
NaOH 12 000 € 18 000 €
Sum 40 000 € 66 000 €

Results
64
Ralf Sirén
This proposal for a new operating cost structure for chemicals is based on the following
assumptions:
- The wastewater flow and quality do not deviate considerably from the previous
years.
- The new chemicals are ordered as liquid bulk shipments, and not in
intermediate bulk containers. One cubic meter intermediate bulk containers
are considerably more expensive than bulk shipments.
- The new cationic polyacrylamide C491-HMW is in a similar price range as
A100-HMW.
Possible capital investment expenditure (CAPEX) is not included.

Discussion
65
Ralf Sirén
6 Discussion
The purpose of this research is to improve the performance of the Naantali oil refinery
wastewater treatment plant, find the optimal process parameters and chemical dosages
while simultaneously increasing the cost-effectiveness. Because the chemical treatment
is still running according to design from 1979, only with some improvements, it was
decided that more effective solutions should be examined, especially regarding the
chemicals used. It was also hypothesised that the process parameters could be adjusted
for increased performance. Jar tests were conducted to choose the best combination of
coagulants and flocculants, which were then tested in the full-scale process.
The findings suggest that the process indeed is in need of optimisation. The DAF unit
performance can be improved by adjusting the operating parameters, especially air
flow. The results have indicated that ferric sulphate is more efficient than ferrous
sulphate in treating oil refinery wastewaters with flocculation and dissolved air
flotation, as expected considering the Schulze-Hardy rule.2 Ferric sulphate also seems
to work in a broader pH range, hence reducing the need of regulating pH, resulting
thereby in lower operating expenditure. Another possibility is that instead of
diminishing the costs, to double the average iron dose keeping the operating chemical
costs the same. Overall, the new way of operating the plant, optimised process
parameters, and new chemicals, could on average reduce all examined contaminants
remaining after the chemical treatment by more than 50% compared to the
conventional process.
6.1 Selection of the coagulant and flocculant
Based on the results from the jar tests (Section 4.2), ferric sulphate and a low charge
density cationic polyacrylamide were chosen for the full-scale testing. The pH 7-8 was
chosen (equivalent to jar test initial pH 8-9). The reasoning for the choice of ferric
sulphate is as follows:
- Best performance concerning turbidity removal
- Good performance in oil removal at post-treatment pH 7-8 (initial pH 8-9)
- A moderate removal of phosphate*
- Good COD removal at post-treatment pH 6-8 (initial 7-9)**
- Less corrosive than ferric chloride and PAC
- Effective hydrogen sulphide removal

Discussion
66
Ralf Sirén
- Relatively inexpensive and easily available
- Safe choice, because the chemistry is similar to ferrous sulphate
* A moderate removal of phosphate is preferred because the activated sludge process
requires phosphorus for the bacterial growth. If problems with phosphate arise, the
removal can be increased by lowering the pH to 6 (initial pH 7), as shown in Figure 14.
** Assuming the dip in the trend of COD-removal for ferric sulphate in the jar test
experiments was non-representative, and the trend follows the ferric chloride trend.
This was later shown to be the case in the full-scale experiments.
The jar test showed that among different alternatives to ferrous sulphate, ferric
sulphate was the most suitable for full-scale experiments, for the reasons mentioned
above. Polyaluminium chloride performed slightly better than other coagulants for oil
removal. The difference (1.2% for ferric sulphate and 1% for ferrous chloride, at initial
pH 8 and 9 respectively) is, however, almost negligible. The PAC performance was the
most consistent for oil removal, regardless of pH.
The performance differences are more apparent for the turbidity removal, as iron-based
coagulants out-performed Al-based ones by an average of 10% around neutral pH. At
higher pH, the difference was not as noticeable. For phosphate removal, iron
coagulants performed well at low to neutral pH ranges, while Al-based coagulants
performed better in neutral to alkaline conditions. Based on the jar test results there is
a clear curvilinear relationship between pH and phosphate removal. The phosphate
results suggest that the optimal conditions for phosphate removal are between pH 6
and 7 for all coagulants. Similar results were shown by Szabo et al.33, who found the
optimal pH to be within the interval 5-7 for both aluminium and iron-based coagulants.
The hydrogen sulphide experiment showed that ferric sulphate could remove H2S as
expected. However, the level of the H2S removal was higher than that predicted by Firer
et al.34, and also, interestingly, PAC removed 29% of H2S in the sample. Aluminium ions
should not be able to remove hydrogen sulphide, as aluminium sulphide dissociates in
water. Probably a part of the H2S had evaporated before commencing the titration
analysis. When observing H2S removal with ferrous iron, Nielsen et al. 35 found that at
pH > 8 all ferrous iron will react by sulphide precipitation if H2S is in abundance, while
at pH < 7 only 40% reacted this way.

Discussion
67
Ralf Sirén
When considering that Al-based coagulants do not remove hydrogen sulphide, what is
left is to choose between the two ferric compounds, ferric chloride or sulphate. Ferric
chloride corrodes metals much more aggressively due to the high chloride content.
Thus, the stainless steel type 316L piping on site would not be capable of withstanding
the chloride-induced corrosion. Otherwise, the two ferric coagulants performed more
or less equally well. Therefore, ferric sulphate was chosen.
Polyelectrolyte C491-HMW was selected, because of an overall trend in the polymer
experiments, where more neutral polymers performed better opposed to the higher-
charged polyacrylamides (Figure 17 and Figure 18). C491-HMW also showed the lowest
turbidity in the pH-dependent experiment (3.4 NTU at initial pH 8.5). However, a
noteworthy result of the jar-test was a clear negative relationship between the polymer
dose and turbidity in the tested interval. Of the three dosages tested, the lowest dose,
corresponding to a polymer dose of 1.25 mg/L, was the best for all polymers. This is
notable because the conventional full-scale process operates with an average polymer
dose of 4.5 mg/L.
Some possible limitations to the reliability of the results and explanation were
identified. Flotation was predicted by sedimentation performance in jar tests. There are
evidence that the particle agglomeration and charge neutralisation are the same
regardless of the separation method, while gas bubble attachment is less clear. A lab-
scale flotation device is probably more reliable, however, was not available. The
utilisation of a lab scale flotator, on the other hand, has its problems. There are
substantial differences depending on the flotator parameters, and full-scale flotator
performance is usually not the same as in the lab scale. Nevertheless, it has been shown
that proper sedimentation also predicts good flotation characteristics, in an
inexpensive and effective way. Thus, the method was considered to be the most
efficient in terms of complexity and costs.
Another possibly important limitation is that many of the experiments were performed
on water samples from one day only. A high variance in the incoming water properties
can be observed, which might result in an unrepresentative sample. However, the
analysed sample was, based on the daily QC-laboratory analyses, typical for the
wastewater plant. Therefore, it was considered to be representative. During process
disturbances, it is possible that some other coagulants besides ferric sulphate might
have worked better.
Discussion
68
Ralf Sirén
A variable influencing the reliability of the lab results is, of course, the natural human
induced error. This was speculated to be the reason for the deviations displayed in
Figure 15. Later when the full-scale experiments were done, this trend-changing error
was not present. The stock coagulant dosages have a ±0.3% accuracy of the metal
concentration. This margin of error can result in a slightly below 10% maximal error in
the 1:1 ratio of the metal dosing, at which the coagulants were compared. These errors,
however, do not conflict with the premises for the coagulant selection.
One aspect in the lab-scale experiments would have been using the conventional
coagulant ferrous sulphate in the coagulant comparison. However, ferrous sulphate
needs the infusion of air to work. If air had been added, this should also have been done
in the experiments with other coagulants to have similar conditions. Air infusion was
tried. However, it was not possible to replicate the flocculator environment reliably.
Adding air bubbles resulted in lifting the precipitates to the surface, not to mention the
problems with the air pipe interfering with the agitator. The reduction and oxidation
conditions in the flocculator and the jar were also different. Thus, ferrous sulphate was
excluded from the jar test experimental design. Instead, the newly selected coagulant
was compared to the conventional process performance in the full-scale experiments.
6.2 Full-scale parameters
The hypothesis was that the new combination of coagulant and flocculant selected in
the jar-tests would perform better in full-scale than the current process with ferrous
sulphate. Based on the jar tests, ferric sulphate was selected as the coagulant and C491-
HMW (cationic low-charge density polyacrylamide of high molecular weight) as the
flocculant. The purpose of the full-scale experiments was to improve the purification
and to find the optimal dosages and pH for the new chemicals in the coagulation and
flotation steps. As shown in the results, the new combination of chemicals and pH
performs better than the conventional way of running the process. The optimal levels
of flotation air flow and dispersion tank pressure were investigated, too.
The full-scale results suggest that the pH does not influence the process as much as the
ferric sulphate jar-test would indicate. Turbidity and oil in the flotator overflow showed
very low correlations (R2<0.04) with pH. The relationship for COD to pH is more
unclear. The COD correlation to pH has a quite low R2 value of 0.13 and is not
statistically significant (p=0.16), being consistent with the jar-test results. Both types of

Discussion
69
Ralf Sirén
tests show reductions in the COD levels when raising the pH. Thus, this result seems
reliable. Contrary to other impurities, suspended solids show a strong and significant
curvilinear correlation to pH (Figure 27). A maximum can be observed around pH 8-
8.5, which can be explained by the curvilinear pH dependence of the solubility for the
different iron hydroxide species (Figure 37).31,36 Phosphorus shows a similar curvilinear
relationship, with the highest removal at pH 7, which is the lowest pH tested. However,
if the jar-test results are valid, the best phosphorus removal is at a slightly lower pH,
around pH 6. Szabo et al.33 found the optimum to be between pH 5-7.
Figure 37: Solubility of various ferric hydroxide species in water. The lowest solubility is observed around pH 8. Figure from "Treatment of radioactive waste seawater by coagulation-flocculation method using ferric hydroxide and polyacrylamide (2015)".36
One important note is that flotation does not remove dissolved oil, only free and
emulsified. The flotator overflow usually contains between 1 and 5 ppm of oil, which is
a sum of emulsified and dissolved oil. Because the solubility of oil varies depending on
the oil type and water properties, it will affect the measured flotator performance,
which contributes to the variance and the error.
An interesting finding was better performance results of the cationic polymer than the
anionic one. The results showed much higher R2- values and statistical significance
when using the cationic polymer. However, these results are not as reliable as the ones
for the anionic polymer. In particular, the duration of the experiment and the sampling
interval for the cationic polymer were shorter. Thus, changes in the flocculator feed
had a more prominent effect on the experiment. Concerning the turbidity, the full-scale
cationic experiment was contradictory to the laboratory scale experiments, not showing

Discussion
70
Ralf Sirén
any correlation between the turbidity and the polymer concentration. The laboratory
scale test resulted in a clear negative correlation when increasing the dose over 1.25
mg/l. It is highly probable that changes in the wastewater properties had a skewing
impact on the results. Additional polymer dosage experiments should be conducted
with the cationic polymer to form a more reliable picture. For the anionic polymer, the
results are more robust and reliable, because of the longer time-span and a higher
number of samples. The oil content was not affected by the dose, while turbidity, COD
and SS were positively correlated with an anionic polymer dose above 1 mg/l. In other
words, the results suggest that an increase of the polymer dose above 1 mg/l impairs
the removal of impurities.
To summarise the optimal chemical parameters, when using ferric sulphate, the
following can be considered valid for the Naantali WWTP wastewaters in the pH range
7-9.5: Oil removal and turbidity are not pH dependent, and COD removal is slightly
better at a higher pH. The suspended solids removal is efficient when the pH is lower
than 8 or higher than 9, being poor in-between. Phosphorus removal is better at lower
pH, possibly having an optimum at pH 6. Anionic polyelectrolyte dosage should be kept
around 0.5-2 mg/l, as higher doses will only worsen the purification results. The
cationic polyelectrolyte dosage is unclear, but it is possible that a higher dose is
justified. The most economical pH is between pH 7 and 8, which is recommended for
industrial implementation.
In addition to the pH and chemical variations, the influence of two physical parameters;
the airflow and the saturator pressure were examined. The results revealed that
increasing airflow to 30 Nm3/h improved the separation of suspended solids by 34%,
compared to an air flow of 20 Nm3/h. When considering that the saturator had been
running with an actual air flow of 3 Nm3/h for several months with bad removal results,
and that the normal flow is between 10-20 Nm3/h, the performance of the system was
restored to its usual performance and also improved significantly (p <0.05) by
increasing the air flow from 20 to 30 Nm3/h. Running the process in the new way
reduced the SS content in the flotation overflow by 34%, even when using conventional
chemicals.
The saturator pressure experiments were inconclusive. During the experiment, the
system was not working correctly, and there was not enough time to repeat the
experiment. However, because of the experiment, the problem causing the malfunction

Discussion
71
Ralf Sirén
was resolved (see Section 5.2.2). The pressure is not very adjustable if system stability
is desired. Therefore, based on the flotation theory (Section 2.5) and the plant operator
experience, the air pressure was kept as high as possible, close to 3.9 bars. It was also
noted that the dispersion air system was more stable when the bigger one of the two
recycle pumps were used.
The benefits achieved by implementing the changes discussed above are clear. As
showed in section 5.3, all contaminants remaining after the chemical treatment could
be reduced by more than 50%. Overall, for the whole test-run period, remaining
contaminants were reduced by 53% for oil, 57% for COD, 61% for suspended solids, and
76% for phosphorus. Historical turbidity data were not available, but also turbidity
shows the benefits of using ferric sulphate (Figure 31). In Figure 38, showing combined
data from the results chapter, the remaining contaminants are plotted as a function of
time. The solid lines represent the time of the full-scale test runs with ferric sulphate.
The average dose of the trivalent iron (ferric) was slightly lower than the average dose
of the divalent iron (10.5 mg/L Fe2+ vs 9.7 mg/L Fe3+).

Discussion
72
Ralf Sirén
Figure 38: Combined figures from the results chapter. Remaining COD, phosphorus content, oil, and suspended solids are illustrated as a function of time. The solid line represents various test runs with ferric sulphate, while the dashed line represents the conventional way of operation.
As can be observed, the data are presented as "remaining contaminants in mg/L",
instead of "percentage removal". This is because of economic reasons, as taking input
and output samples would have doubled the necessary samples, not to mention that
the wastewater feed quality fluctuations are much larger than for the purified water.
The feed sample analyses showed the water was on average typical for the plant.
6.3 A consideration of the findings in light of existing research
Overall, the full-scale results are well in line with the previous research on wastewater
treatment. Naturally, the optimal conditions vary depending on the wastewater
properties and types of chemicals, and no wastewaters are the same. As written above,
there are numerous variables present in wastewater treatment. When looking at the
0
100
200
300
400
500
600
4.2017 10.2017 5.2018
CO
D m
g/L
Date
COD
0
0,2
0,4
0,6
0,8
1
1,2
4.2017 10.2017 5.2018
Ph
osp
ho
rus
mg/
L
Date
Phosphorus
0
2
4
6
8
10
12
14
16
18
20
4.2017 10.2017 5.2018
Oil-
ind
ex m
g/L
Date
Oil
0
10
20
30
40
50
60
70
4.2017 10.2017 5.2018
SS m
g/L
Date
Suspended Solids

Discussion
73
Ralf Sirén
research of oil refinery WWTP performance, many articles and reports were missing
several critical variables, e.g. the recycle rate or the residence time.
One interesting observation was that when comparing coagulants on an mg/L Me3+
basis, the most commonly used coagulant, aluminium sulphate, exhibited the weakest
performance in the jar tests. In addition, the findings suggest that ferric ions are more
efficient coagulants than aluminium-based ones, also on a molar basis, as the ferric ion
has a considerably heavier atomic weight.
In contrast to Rhee et al.26 who found that the pH had a more prominent influence on
oil removal than coagulant dosage with DAF, the opposite was found in the full-scale
experiments in this work. However, higher efficiency of ferric sulphate than of
aluminium sulphate is similar to this work. In particular, ferric sulphate was twofold
more effective for oil removal compared to aluminium sulphate at pH 8.5.
The benefits of using polyelectrolyte flocculants are undeniable. Every time a flocculant
was added during the jar tests, the turbidity was lowered by a factor of up to five. More
neutral flocculants performed better than charged ones, supporting the theory that
flocculants work mainly by bridging, not by charge neutralisation.4 The results about
polyelectrolyte charge vary considerably depending on the wastewater properties. The
turnaround showed expected evidences of the benefits of using polyelectrolyte
flocculants in addition to metal coagulants, in line with Bratby.31 When the flotator
and flocculator were emptied, there were no deposits of settled matter at the bottom
of the flocculator, where only coagulant was used, only minor particles were observed.
In stark contrast, in the flotator, where polymers are present, there was a several
decimetres thick layer of settled matter, consisting of large flocs.
The stirring speed was found to have a significant effect on the turbidity removal. As
illustrated in section 5.1.4, slow stirring (40 rpm) for a longer period of time
continuously improved the performance. Rapid stirring (400rpm) initially improved
the turbidity removal, but after two minutes of agitation, additional stirring was not
beneficial. Continuing the rapid stirring for a long time is therefore counterproductive.
Ghernaout et al.3 report similar results, and that the most effective method is short and
rapid stirring followed by a period of longer and slower mixing. Al-Shamrani et al.9
concluded in their study that 120 s of rapid mixing (200 rpm) followed by 15-20 min
slow mixing (20-80 rpm) was the optimal.

Discussion
74
Ralf Sirén
6.4 Practical considerations for implementation
If ferric sulphate is to be applied in full scale, some practical considerations must be
taken into account. Chemical properties of ferric sulphate place stricter requirements
on the process equipment, such as the pumps and piping. For example, during the full-
scale test run some connector parts which were not made of acid-proof stainless steel
and were in contact with ferric sulphate corroded to failure in approximately two
weeks.
The existing ferrous sulphate pumps GA-3412 and GA-3412S have larger outputs than
needed. Pump GA-3412S with the max flow 220 l/h according to specifications,
exhibited a max flow of 190 l/h with 10% ferrous sulphate solution, while the pump GA-
3412 has a theoretical maximum of 980 l/h. The new pumps for ferric sulphate should
produce a similar output as the experimental ones, in the range of 0-50 l/h, with an
average of around 5-15 l/h. One suggestion is changing the larger pump GA-3412, which
is very rarely used, to a smaller one capable of moving the denser and more viscous
ferric solution with a suction head of up to 5 meters and a discharge head of minimum
5 m. The pump should also be strong enough to work even if there are air pockets in
the suction line.
Ferric sulphate is acidic displaying pH < 1, is recommended to be stored between 0 and
30 °C, and has a freezing point of -20 °C. Because the storage basins FA-3411 (10 m3)
and FA-3412 (25 m3) are in contact with the outside air, there should be a way of
warming them, without diluting the ferric sulphate (as dilution might cause
precipitation), e.g. a steam heating coil. Still, the freezing temperature of ferric sulphate
is lower than for the ferrous sulphate solution in use, because it is a more concentrated
one. Then again, overheating the solution will increase the corrosivity significantly,
therefore, controlling heating is essential. The concrete basins are lined with stainless
steel. Acid proof steel, rubber lined steel or fibreglass reinforced polyester should be
used. Therefore, if the existing basin steel lining is not sufficient, the walls could be
lined with fibreglass on top of the metal layer. Another alternative is to build a new
vessel designed for storing ferric sulphate. Cheremisinoff 6 recommends stainless steel
of type 316 for storage vessels and piping.
The storage time must also be considered, because the solution will begin to precipitate
if it stands for too long. The recommended maximum storage time is six months.

Discussion
75
Ralf Sirén
According to the product specifications of ferric sulphate (PIX-115), less than 0.2
weight-% of the solution is insoluble particles, which will precipitate with time. This
happens also with ferrous sulphate, probably even to a higher degree because of
precipitation by oxidation with air. Therefore, no special precautions when changing
from ferrous to ferric sulphate are required with respect to sedimentation.
The piping is made of stainless steel. The newer parts indoors are made of stainless steel
type SS316L, while the material of the older parts could not be confirmed from the
available documentation (probably SS304 or SS316). During winter times, the outside
temperature sometimes falls below -20 °C, therefore the pipes outside should be traced
with heating cables, at a minimum in the flocculator AD-3403 basin end. Because the
total flow of the ferric sulphate in the feed pipes can be quite low, it is at a higher risk
of being frozen.
Some changes are suggested to the chemical feed points in the flocculator AD-3403.
Caustic soda and the coagulant should be fed to different points, as not to shift the
hydrolysis reactions. The coagulant should also be fed further away from the basin
overflow to avoid short-circuiting and increase the residence time of ferric sulphate.
These changes were done during the thesis work, because the ferrous sulphate feed
piping had to be renewed due to severely clogged lines. If the piping has to be renewed
when implementing the full-scale use of ferric sulphate, the new as-is feed points
should be used. The old and new dosing points are marked in Figure 39.

Discussion
76
Ralf Sirén
Figure 39: The new coagulant dosing point in the flocculator. The top view of the flocculator on the right.
The polymer feed point at the flocculator basin (AD-3403) overflow falls should be
widened, to spread the polymer into different streams, or in other ways increase the
mixing. It should also be ensured that the polymer is sufficiently diluted. A
concentrated polymer solution tends to clump more and diffuse more slowly than a
diluted one. Another alternative is more efficient mixing. However, the agitation
should not produce high shear rates, as the polymers and already formed floc might
break. This was also confirmed by the jar test experiments.

Conclusions
77
Ralf Sirén
7 Conclusions
In this thesis different coagulants, flocculants and process parameters were evaluated
to improve the performance of the Naantali Refinery Wastewater Treatment Plant.
Experiments were first done in lab-scale, whereafter the most promising chemicals and
process parameters were used in full-scale test runs.
By applying the suggested changes, significant process improvement can be gained.
During the full-scale experiment, all remaining flotation overflow contaminants were
reduced on average by more than 50%, compared to the conventional way of operation.
Hence, the aim of this work to improve the performance of the chemical treatment was
successfully accomplished. All the improvements can be achieved while simultaneously
reducing the operating costs.
The main reasons for the improvement are considered to be:
- A stronger fully oxidised trivalent coagulant.
- Overdosing of polyelectrolyte was reduced.
- Dosing based on objective on-demand measurements of purification.
- The flotation recycle-stream level of air-saturation was increased.
The tested coagulants were ferric chloride, ferric sulphate, aluminium sulphate and two
polyaluminium chlorides with different basicity. Of all the coagulants tested at the
laboratory scale, ferric sulphate was chosen for the full-scale experiments. The test runs
revealed that ferric sulphate consistently performed better than the current coagulant
ferrous sulphate. When ferric sulphate was used, the remaining impurities also showed
reduced fluctuations. This is very important for the downstream biological treatment,
which is destabilised by shocks. The optimal ferric sulphate dosage varied depending
on the influent composition, however 10 mg/L of Fe3+ (or 36 mg/L as Fe2(SO4)3) in
combination with DAF is sufficient for most situations. During disturbances, doses of
up to 50 mg/L of Fe3+ (or 180 mg/L as Fe2(SO4)3) can be required for optimal results. A
pH of 7-8 was found to be optimal for ferric sulphate, based on several criteria. In
addition to the five coagulants, six polyacrylamide flocculants were investigated. The
jar test results suggest that neutral, e.g. cationic polymers with low charge densities,
displayed the best performance. The optimal dosage of the flocculant was between 1-2
mg/L, regardless of the charge density.

Conclusions
78
Ralf Sirén
In this thesis, turbidity measurements were introduced to the operators as a daily
method to monitor the DAF performance. Because the turbidity analysis is fast,
realiable and sensitive to changes in the water properties, the coagulant was dosed
based on the novel measurements. In essence, a faster way of recognising problems was
introduced, thus lowering the variance of impurities in the product. In addition to the
turbidity analysis, more informative, but much slower, laboratory analysis was
performed once per day.
The physical parameters of the flocculation and dissolved air flotation were
investigated, too. The most relevant result was finding the optimal setting for the air-
flow to the DAF saturation tank. By increasing the flow to the upper ends of the
operating window, the DAF performance with respect to suspended solids removal was
significantly increased.
This research is of limited direct applicability to other refinery WWTP:s because of
different water qualities depending on the specific site. However, the author suggests
that an option to use ferric sulphate instead of using a more common aluminium
sulphate should be explored in other refineries and that overdosing of polymers should
be avoided.
Combining ferric- and aluminium-based coagulants in the chemical treatment is worth
further investigations. Because aluminium-based coagulants do not remove hydrogen
sulphide, combining ferric- and aluminium based salts can be an option to improve
overall performance. In a scenario where concentration of H2S is high, the aluminium
ions could possibly still coagulate particles instead of being consumed in reactions with
sulphides.

Svensk sammanfattning
79
Ralf Sirén
8 Svensk sammanfattning
I denna avhandling för diplomingenjörsexamen evaluerades användning av olika
kemikalier och processparametrar för vattenreningsverket vid Nestes oljeraffinaderi i
Nådendal. På grund av allt strängare miljölagstiftning, ställs det ständigt hårdare krav
för industriell avfallshantering. Inom den kemiska industrin, så som oljeraffinering,
uppstår stora mängder förorenat vatten, som måste renas före det kan ledas tillbaka ut
i naturen. Målet med detta arbete var att förbättra och effektivera den kemiska
behandlingen av avloppsvattnet i raffinaderiets vattenreningsverk.
Avloppsvattnet från oljeraffinaderiet i Nådendal består bl.a. av vatten som separerats
från olja, tankfartygens tvättvatten, skrubbervatten, råoljans avsaltningsvatten samt
övrigt processvatten. Vattnet är vanligtvis kontaminerat med olja och olika kemikalier,
varav många har ytaktiva egenskaper, dvs. de är surfaktanter. Surfaktanterna möjliggör
bildning av dispersioner och emulsioner av olja i vatten, vilket försvårar behandlingen
av vattnet med enbart fysikaliska metoder. Emulsionerna är stabila, eftersom de
stabiliseras av repulsiva elektrostatiska krafter mellan partiklarna, i detta fall främst
anjoniska. De laddade kolloidala partiklarna stöter bort varandra, och förhindrar
därmed att oljedropparna växer tillräckligt stora för att kunna separeras genom att flyta
till ytan. För att bryta emulsionerna och åter möjliggöra en fasseparation, används
därför koaguleringsmedel bestående av katjoniska metaljoner, från salter av järn eller
aluminium. Då de repellerande elektrostatiska krafterna neutraliseras, börjar de
kolloidala partiklarna koagulera. Denna process kan försnabbas genom att förstora
aggregaten med hjälp av polyelektrolyter, dvs. laddade polymerer. Denna process kallas
flockning. Då partiklarna vuxit tillräckligt kan de lätt separeras, t.ex. genom
dekantering eller flotation. Flotation fungerar genom att luftbubblor skapas i vätskan,
som lyfter partiklarna till ytan, varefter skummet skalas av och samlas upp. I detta
arbete undersöktes en process bestående av uplöst luft-flotation (eng. dissolved air
flotation, DAF), där en del av det renade vattnet trycksätts och återcirkuleras varefter
trycket sänks och luftbubblor bildas.
I detta arbete evaluerades användning av olika kemikalier för koagulering och
flockulering, närmare bestämt polyaluminiumklorid, aluminium(III)sulfat,
järntriklorid och järn(III)sulfat för koagulering, samt sex olika katjoniska
polyakrylamider med olika molära massor och laddningsdensiteter för flockbildning.

Svensk sammanfattning
80
Ralf Sirén
Även det optimala pH-värdet undersöktes. Experimenten genomfördes i labbskala,
varefter de mest lovande kemikalierna provkördes under flera månaders tid på
raffinaderiets vattenreningsverk. Inverkan av processparametrar så som lufttillförsel
och tryck på uplöst luft-flotationsanläggningen funktion undersöktes också. För
koagulanttillförsel konstruerades ett tillfälligt doseringssystem, medan det befintliga
systemet användes för polymerupplösning och dosering. Prov togs nedströms från
flotationsanläggningen, och de analyserades för olja, COD, suspenderade ämnen,
fosfor, pH och turbiditet i raffinaderiets laboratorium.
På basis av de erhållna resultaten från experimenten i labbskala valdes
koaguleringsmedlet järn(III)sulfat och en svagt katjonisk polyakrylamid med hög
molekylvikt för fullskaliga experiment. Dessa kemikalier valdes, eftersom
laboratorieexperimenten visade att neutrala flockuleringsmedel fungerade bättre än
starkt laddade. Järn(III)sulfat valdes eftersom sänknignen av turbiditeten var störst
(98,5%) och olja (94,5%) samt COD (55%) renades väl vid neutralt pH, och kemikaliens
korrosiva egenskaper var mildare jämfört med polyaluminiumklorid och järntriklorid.
En fördel var även moderat rening av fosfor (95%), vilket behövs i den påföljande
biologiska processen. En stor fördel med järnbaserade koagulanter är också förmågan
att oxidera svavelväte (H2S), vilket aluminiumbaserade koagulanter inte klarar av.
Polyaluminiumklorid fungerade dock bäst för att rena COD (61%).
Järn(III)sulfat har för anläggningen bekant kemi jämfört med det tvåvärda
järn(II)sulfatet som används för tillfället. I den befintliga processen oxideras det
tvåvärda järnet till trevärt järn med luft i ett högt pH på 9,5. Järn(III)sulfat fungerade
under experimenten utmärkt i neutralt pH 7-8, vilket innebär förhållandevis stora
kemikaliebesparingar via ett minskat behov av pH justering med natriumhydroxid.
De fullskaliga experimenten visade att en medeldos på 35 mg/l av järn(III)sulfat i
kombination med de rekommenderade nya flotationsparametrarna förbättrade
reningen avsevärt. Koncentrationen av alla de undersökta föroreningarna i
flotationsanläggningens utlopp minskade med mer än 50% jämfört med den befintliga
processen, med en motsvarande dos av järn (förhållandet Fe2+:Fe3+ -joner). Vid större
processproblem uppströms och således smutsigare avloppsvatten kan doser på upp till
180 mg/l av järn(III)sulfat behövas. De optimala doserna på flocklueringsmedlet var 1-
2 mg/l då både större och mindre doser försämrade reningen av speciellt suspenderade
ämnen. Flotationsanläggningens återcirkulationsvolym användes så som förut under

Svensk sammanfattning
81
Ralf Sirén
ett maximalt lufttryck på 3,9 bar, men luftströmmen ökades från mindre än 20 Nm3/h
till 30 Nm3/h. Ökningen av luftmängden minskade på koncentrationen av
suspenderade ämnen med över 34% jämfört med det tidigare systemet.
Resultaten överensstämde överlag bra med tidigare rön, som visat att högre
oxidationstal på metalljoner innebär bättre koagulering. De fullskaliga experimenten
visade också att fosfor kan renas bäst vid ca. pH 6, vilket är i linje med tidigare
forskningsresultat. Suspenderade ämnen och olja renades bäst vid pH 7,5-8, medan
COD renades bättre vid högre pH. Optimala värden är dock mycket varierande
beroende på typen av avloppsvatten, och resultaten kan inte generaliseras till att gälla
alla vattenreningsverk i oljeraffinaderier. För vidare utveckling vid Nådendals
raffinaderi rekommenderas undersökning i hur kombinationer av järn- och
aluminiumbaserade koaguleringsmedel fungerar, speciellt vid processtörningar i
raffinaderiet.

References
82
Ralf Sirén
9 References
1. Jirgensons, B.; Straumanis, M. E. A Short Textbook of Colloid Chemistry; Pergamon: Kent, 2013.
2. Shaw, D. J. Introduction to Colloid and Surface Chemistry; Butterworth-Heinemann: England, 1992.
3. Ghernaout, D.; Al-Ghonamy, A. I.; Boucherit, A.; Ghernaout, B.; Naceur, M. W.; Messaoudene, N. A.; Aichouni, M.; Mahjoubi, A. A.; Elboughdiri, N. A. Brownian motion and coagulation process. American Journal of Environmental Protection 2015, 4, 1.
4. Flynn, D. J. The Nalco Water Handbook; McGraw-Hill's Access Engineering; McGraw-Hill: New York, 2009.
5. Hiemenz, P. C.; Rajagopalan, R. Principles of Colloid and Surface Chemistry; CRC, Taylor & Francis: Boca Raton, 1997.
6. Cheremisinoff, N. P. Handbook of Water and Wastewater Treatment Technologies; Butterworth-Heinemann: Boston, 2002.
7. Stumm, W.; Morgan, J. J.; Black, A. P. Chemical aspects of coagulation. Journal of the American Water Works Association 1962, 54, 971-994.
8. Gregory, J. Particles in Water; CRC, Taylor & Francis: Boca Raton, 2006.
9. Al-Shamrani, A. A.; James, A.; Xiao, H. Destabilisation of oil–water emulsions and separation by dissolved air flotation. Water Research 2002, 36, 1503-1512.
10. Bennett, G.; Shammas, N. K. Separation of oil from wastewater by air flotation. Flotation Technology. Humana Press: Totowa, NJ, 2010, 12, 85-119.
11. Bratby, J. Coagulation and Flocculation in Water and Wastewater Treatment. IWA publishing: London, 2016.
12. Bennett, G. F.; Shammas, N. K. Principles of air flotation technology. Flotation Technology. Humana Press: Totowa, NJ, 2010, 12, 1-47.
13. Moosai, R.; Dawe, R. Gas attachment of oil droplets for gas flotation for oily wastewater cleanup. Separation and Purification Technology 2003, 33, 303-314.
14. Rohlich, G. A. Application of air flotation to refinery waste waters. Industrial and Engineering Chemistry 1954, 46, 304-308.
15. Nemerow, N. L. Industrial Waste Treatment; Elsevier/Butterworth-Heinemann: Amsterdam, 2007.

References
83
Ralf Sirén
16. Haarhoff, J.; Edzwald, J. K. Dissolved air flotation modelling: insights and shortcomings. Joural of Water Supply 2004, 53, 127-150.
17. Edzwald, J. K. Dissolved air flotation and me. Water Research 2010, 44, 2077-2106.
18. Engineering ToolBox, 2005. Oxygen - Solubility in Fresh Water and Sea Water. [online] Available at: www.engineeringtoolbox.com [Accessed 15.9.2018].
19. Oliveira, C.; Rubio, J. Zeta potential of single and polymer-coated microbubbles using an adapted microelectrophoresis technique. International Journal of Mineral Processing 2011, 98, 118-123.
20. Al-Shamrani, A. A.; James, A.; Xiao, H. Separation of oil from water by dissolved air flotation. Colloids and Surfaces A: Physicochemical and Engineering Aspects 2002, 209, 15-26.
21. Han, M.; Kim, W.; Han, Y.; Dockko, S. Experimental verification of collision efficiency factor in DAF. KSCE Journal of Civil Engineering 2000, 4, 161-164.
22. Ducker, W. A.; Xu, Z.; Israelachvili, J. N. Measurements of hydrophobic and DLVO forces in bubble-surface interactions in aqueous solutions. Langmuir 1994, 10, 3279-3289.
23. Megid, M. H. A.; Amer, A. A. R.; Elsayed, K. H. Coagulation and dissolved air floatation for treatment of oil-water emulsion. International Journal of Engineering Sciences 2014, 3, 120-129.
24. Welz, M. L. S.; Baloyi, N.; Deglon, D. A. Oil removal from industrial wastewater using flotation in a mechanically agitated flotation cell. Water SA 2007, 33, 453-458.
25. Tansel, B.; Pascual, B. Removal of emulsified fuel oils from brackish and pond water by dissolved air flotation with and without polyelectrolyte use: Pilot-scale investigation for estuarine and near shore applications. Chemosphere 2011, 85, 1182-1186.
26. Rhee, C. H.; Martyn, P. C.; Kremer, J. G. Removal of Oil and Grease in Oil Processing Wastewaters. Sanitation District of Los Angeles County, USA 1989.
27. Tzoupanos, N.; Zouboulis, A. In Coagulation–flocculation processes in water/wastewater treatment: the application of new generation of chemical reagents; 6th IASME/WSEAS International Conference on heat transfer, thermal engineering and environment (HTE'08); Rhodes, Greece, 2008.
28. Aghaali, S.; Gholami, R.; Ahmadi, M.; Vasseghian, Y. COD removal prediction of DAF unit refinery wastewater by using neuro- fuzzy systems (ANFIS)(short communication). JCHPE 2013, 47, 61-70.
29. Sawain, A.; Taweepreda, W.; Puetpaiboon, U.; Suksaroj, C. The Effect of pH on the Stability of Grease and Oil in Wastewater; International Conference on Innovations in Agricultural, Food and Renewable Energy Productions for Mankind;

References
84
Ralf Sirén
Surasammanakhan, Suranaree University of Technology, Nakhon Ratchasima, Thailand, 2009.
30. IPIECA Petroleum refining water/wastewater use and management. International Petroleum Industry Environmental Conservation Association 2010. Available at www.ipieca.org [Accessed 29.7.2018].
31. Bratby, J. Coagulation and Flocculation; Upland Press: Croydon, 1980.
32. Edzwald, J. K. Developments of high rate dissolved air flotation for drinking water treatment. Journal of Water Supply: Research and Technology 2007, 56, 399-409.
33. Szabo, A.; Takacs, I.; Murthy, S.; Daigger, G. T.; Licsko, I.; Smith, S. Significance of design and operational variables in chemical phosphorus removal. Water Environment Research 2008, 80, 407-416.
34. Firer, D.; Friedler, E.; Lahav, O. Control of sulfide in sewer systems by dosage of iron salts: Comparison between theoretical and experimental results, and practical implications. Science of the Total Environment 2008, 392, 145-156.
35. Nielsen, A. H.; Hvitved-Jacobsen, T.; Vollertsen, J. Effects of pH and iron concentrations on sulfide precipitation in wastewater collection systems. Water Environment Research 2008; 80, 380-384.
36. Kwang-Wook, K.; Baek, Y.; Keun-Young, L.; Dong-Young, C.; Jei-Kwon, M. Treatment of radioactive waste seawater by coagulation–flocculation method using ferric hydroxide and poly acrylamide. Journal of Nuclear Science and Technology 2015, 53, 1-12.

Appendices
85
Ralf Sirén
10 Appendices
Appendix A: Naantali DAF pictures
Appendix B: Chemical dosing tables
(for operators)
PIX dosing (L/h)
Flow 5 mg/L Fe 10 mg/L Fe 20 mg/L Fe 30 mg/L Fe 40mg/L Fe
100 m3/h 2,7 5,4 10,8 16,3 21,7
200 m3/h 5,4 10,8 21,7 32,5 43,4
300 m3/h 8,1 16,3 32,5 48,8 65,1
400 m3/h 10,8 21,7 43,4 65,1 86,7
Polymer dosing (L/h) 1 mg/L 2 mg/L 3 mg/L 4 mg/L 5 mg/L
100 m3/h 48 95 143 190 238
200 m3/h 95 190 286 381 476
300 m3/h 143 286 429 571 714
400 m3/h 190 381 571 762 952
Figure 40: DAF unit working correctly. Notice the bubbles in the froth layer on the surface.
Figure 41: DAF unit working correctly. White water caused by pressure reduction lifting the floc to the surface.