evaluation of novelty metrics for sentence-level novelty mining
TRANSCRIPT

Information Sciences 180 (2010) 2359–2374
Contents lists available at ScienceDirect
Information Sciences
journal homepage: www.elsevier .com/locate / ins
Evaluation of novelty metrics for sentence-level novelty mining
Flora S. Tsai *, Wenyin Tang, Kap Luk ChanSchool of Electrical & Electronic Engineering, Nanyang Technological University, Singapore 639798, Singapore
a r t i c l e i n f o
Article history:Received 29 June 2009Received in revised form 1 February 2010Accepted 19 February 2010
Keywords:Novelty metricNovelty detectionNovelty miningPerformance evaluationInformation retrieval
0020-0255/$ - see front matter � 2010 Elsevier Incdoi:10.1016/j.ins.2010.02.020
* Corresponding author. Tel.: +65 6790 6369; faxE-mail addresses: [email protected] (F.S. Tsai),
a b s t r a c t
This work addresses the problem of detecting novel sentences from an incoming stream oftext data, by studying the performance of different novelty metrics, and proposing a mixedmetric that is able to adapt to different performance requirements. Existing novelty metricscan be divided into two types, symmetric and asymmetric, based on whether the orderingof sentences is taken into account. After a comparative study of several different noveltymetrics, we observe complementary behavior in the two types of metrics. This findingmotivates a new framework of novelty measurement, i.e. the mixture of both symmetricand asymmetric metrics. This new framework of novelty measurement performs superi-orly under different performance requirements varying from high-precision to high-recallas well as for data with different percentages of novel sentences. Because it does notrequire any prior information, the new metric is very suitable for real-time knowledge baseapplications such as novelty mining systems where no training data is availablebeforehand.
� 2010 Elsevier Inc. All rights reserved.
1. Introduction
Nowadays, a multitude of documents such as news articles, scientific papers, blogs [4], advertisements, and social net-works [19] are readily available on the Internet [5]. Because of the many irrelevant and redundant information containedin these documents, information overload has become a major problem [9], with past efforts made in text summarization[3] and dimensionality reduction [18]. To effectively deal with this problem, real-time novelty mining, or novelty detection,can be developed to retrieve novel, yet relevant, information based on specific topics defined by a user [25].
In the TREC 2003 and 2004 Novelty Track, the task of novelty mining was clearly defined as follows: given a topic and achronologically ordered set of documents segmented into sentences, return sentences that are both relevant to the topic andnovel given what has already been seen [14]. To fulfill the task, there are two steps. The first is identifying relevant sentences,which is essentially a passage retrieval task. The second step is detecting those relevant sentences containing enough novelinformation. As this paper focuses on novelty mining rather than relevant sentence retrieval, we solve task 2 defined in theTREC Novelty Track [14], i.e. Given the set of relevant sentences in all documents, identify all novel sentences.
A typical novelty mining algorithm can be described as follows. Given a specific topic, all the relevant sentences are ar-ranged in chronological order, i.e. s1,s2, . . . ,sn. For each sentence st (t = 1, . . . ,n), the degree of novelty of st is quantitativelymeasured and scored by a novelty metric, based on its history sentences, i.e. s1 to st�1. The final decision on whether a sen-tence is novel or not depends on whether the novelty score falls above or below a threshold [17]. Finally, the current sentenceis pushed into the history sentence list.
To construct an intelligent novelty mining system, there are two basic problems and several advanced problems to besolved. The basic problems include (i) how to choose a novelty metric, which is the focus of this paper, and (ii) how to
. All rights reserved.
: +65 6793 [email protected] (W. Tang), [email protected] (K.L. Chan).

2360 F.S. Tsai et al. / Information Sciences 180 (2010) 2359–2374
set a suitable threshold automatically according to different performance requirements, which was addressed in [17]. Otheradvanced problems, such as how to use contextual information and semantic information for English or other languages, aswell as optimization techniques and adaptation for blog data, have been discussed in other past studies [10,12,16,26,24,25].
In novelty mining, one of the most important issues is the selection of a suitable novelty metric. Given a specific topic, thewhole sentence set can be divided into three subsets of irrelevant, redundant and novel sentences, respectively. Irrelevantsentences contain no information related to the given topic and will be removed before novelty mining. A redundant sen-tence is informative by itself, but when it appears in a time sequence and covered by its history sentences, it becomes uselessbecause there is no gain in information. On the contrary, a novel sentence will gain information and the ‘‘novelty” in the sen-tence is directly related to ‘‘information gain” introduced by this sentence, i.e. given the information of history sentences,how much information is gained by adding the novel sentence. It is worth noting that the ‘‘novelty” here cannot be measureddirectly by the well-known information gain metric, which is used for selecting the features/attributes of a set of trainingsamples with the maximum discriminative power across different classes. This is because in novelty mining, novel sentences(examples) are selected from only one target class related to the topic. Instead, many metrics used in information retrieval(IR) have been adopted for novelty mining based on the assumption that ‘‘novelty” is the opposite of ‘‘similarity” or ‘‘redun-dancy” [23,2,13,21,20]. The cosine distance metric is a typical example. Using this measure, the novelty score is simply de-fined as 1 minus the cosine similarity score, as in Eq. (2). Since similarity-based metrics are symmetric since they do not takethe ordering of sentences into account, they may cause some problems in terms of novelty scoring. For example, supposethere are two sentences s1 and s2 as follows
s1 ¼ fA;B;C;D; Eg; s2 ¼ fA; Bg; ð1Þ
where A;B;C;D; E are five different terms, and s2 appears right after s1. Based on the similarity metrics, s2 is likely to be pre-dicted as ‘‘novel” due to the low similarity between s1 and s2, while in fact, s2 should be predicted as ‘‘non-novel”. This exam-ple also shows how important it is to consider the ordering of sentences in novelty scoring, because the so-called ‘‘novel”information totally depends on the information that has appeared in the history.
On the other hand, some asymmetric metrics have been proposed to measure the ‘‘novelty” of sentences by consideringthe ordering between sentences. The new word count metric, which counts the number of new words in the incoming sen-tence given its history sentences, is a typical example here. Zhao et al. [27] indicated that the asymmetric metrics are moresuitable to the nature of novelty mining. However, symmetric metrics were shown to be empirically better across differentcorpora [23]. One question raised here is why the asymmetric metrics do not outperform the symmetric metrics for real-world data?
One possible reason is that the previous studies evaluated the performance of different novelty metrics globally, wherethe limitations of metrics in some situations may be canceled out by their strengths in other situations. To the best of ourknowledge, this problem has not been thoroughly investigated. This paper attempts to detect the strengths and limitations ofthe different novelty metrics by a comparative study in a series of predefined situations. We find that novelty metrics mayperform differently under different users’ performance requirements as well as different distributions of novelty. We alsofind that the symmetric and asymmetric novelty metrics do not perform well simultaneously, while their strengths underdifferent situations may complement each other.
To utilize the findings from the comparative study, a new framework of novelty measurement, i.e. a mixture of both typesof novelty metrics, is then proposed. The experimental results show the superior performance of the new framework of nov-elty measurement under different performance requirements and for data with different percentages of novel sentences.Since it does not require any prior information from data, the new framework of novelty measurement is suitable forreal-time applications like novelty mining systems where no training data is available beforehand.
This paper is organized as follows. Section 2 introduces several popular novelty metrics from both symmetric and asym-metric types, and analyzes the factors that may affect the performance of these metrics. Section 3 evaluates both types ofnovelty metrics by considering these factors. Section 4 introduces a new framework of novelty measurement, i.e. mixtureof both types of metrics, for novelty mining. The performance of this new framework is tested and compared with the indi-vidual novelty metrics. Section 5 concludes the whole paper.
2. Novelty metrics
In this section, we first review the previous work of novelty metrics. Various novelty metrics can be broadly categorizedinto two types: symmetric and asymmetric. Advantages and drawbacks of each type of metrics are analyzed and some pop-ular metrics from each type, which will be used in the further comparative study, are introduced in detail. Finally, both im-plicit and explicit factors that may affect the performance of novelty metrics are analyzed.
2.1. Related work
By comparing various novelty metrics, Zhang et al. [23] proposed the pioneering work of novelty mining at the document-level. In their work, ‘‘novelty” was defined as the opposite of ‘‘redundancy”. Given a set of relevant documents, any documentwhich is very similar to any of its history documents is regarded as redundant. In practice, however, it may be less mean-

F.S. Tsai et al. / Information Sciences 180 (2010) 2359–2374 2361
ingful to merely return novel documents for the end-user because there are still lots of irrelevant and redundant informationin these documents. Hence, spotting the novel sentences can be more useful. Therefore, most of the later contributions havefocused on sentence-level novelty mining, such as those reported in the TREC 2002–2004 Novelty Tracks [6,15,14], thoseintegrating various natural language processing techniques [8,11,16,24], and those comparing various novelty metrics [2,27].
Out of the various metrics adopted from IR for novelty mining, cosine similarity is the most popular one due to its con-sistently good performance across different corpora [2,8,10,16,23,26,24,25]. However, as we have shown in Eq. (1), since co-sine similarity compares two sentences symmetrically without taking the ordering information into account, a shortsentence that is completely covered by another long sentence in history may still be regarded as ‘‘novel” because of thelow similarity between them. Actually, this could be the common problem of any symmetric novelty metric. Zhang et al.used a symmetric semantic distance computation as the novelty metric [20], which resulted in a lower performance com-pared to the best results in TREC 2003. Zhao et al. reported that similarity metrics such as cosine similarity may not bewell-suited to the nature of novelty mining because the relationship between the current sentence and its history sentencesis externally asymmetric, while asymmetric metrics such as the overlap metric should be more suitable from a theoreticalpoint of view [27]. However, the experimental results did not show an improved result by using asymmetric metrics. Thequestion here is why asymmetric metrics that seem more suitable for novelty mining do not perform better in practice?To answer this question, more evaluations on novelty metrics under various different situations are needed. In the rest ofthis paper, we will try to answer this question by analyzing both implicit and explicit factors affecting the performanceof different types novelty metrics, from which we then carry out a comparative study of various metrics.
2.2. Different types of novelty metrics
Novelty metrics can be divided into two types based on whether the ordering of sentences is taken into account, i.e. sym-metric and asymmetric [27], as summarized in Table 1. In this section, we will introduce some popular metrics for each typeseparately.
2.2.1. Symmetric metricsA symmetric metric M yields the same result regardless of the ordering of two sentences, i.e. M(si,sj) = M(sj,si). The cosine
distance metric is one of the most popular symmetric metrics in information retrieval [2]. In novelty mining, the cosine dis-tance novelty metric first calculates the similarities between the current sentence st and each of its history sentences si
(1 6 i 6 t � 1). Then, the novelty score is simply one minus the maximum of these cosine similarities, as shown in Eq. (2)
Table 1Symme
Defin
Typin
NcosðstÞ ¼ 1� max16i6t�1
cosðst; siÞ; ð2Þ
cosðst; siÞ ¼Pn
k¼1wkðstÞ �wkðsiÞkstk � ksik
;
where Ncos(s) denotes the novelty score of the sentence s based on cosine similarity and wk(s) is the weight of the kth elementin the sentence weighted vector s.
Another popular similarity-based metric in information retrieval is Jaccard similarity [7]. The Jaccard similarity metric isused to measure the similarity between two sets, which is defined as the ratio of the intersection size and the union size oftwo sample sets. Similar to the cosine similarity, the Jaccard similarity is converted to a novelty score by subtracting themaximum Jaccard similarity between st and si (1 6 i 6 t � 1) from one, as shown below
NJaccardðstÞ ¼ 1� max16i6t�1
Jaccardðst; siÞ; ð3Þ
Jaccardðst; siÞ ¼jstT
sijjstS
sij¼P
k2st\siminðwkðstÞ;wkðsiÞÞP
k2st[simaxðwkðstÞ;wkðsiÞÞ
:
2.2.2. Asymmetric metricsAn asymmetric metric M yields different results for different orderings of two sentences, i.e. M(si,sj) – M(sj,si). A typical
asymmetric metric is the overlap metric. Overlap metrics have proven to be stable among different data collections [22] andto be more suitable for the nature of novelty because they take the ordering of sentences into account [27]. The overlap nov-
tric vs. asymmetric metrics.
Symmetric metric Asymmetric metric
itions A metric M yields the same result regardless of theordering of two sentences, i.e. M(si,sj) = M(sj,si)
A metric M yields different results based on the differentordering of two sentences, i.e. M(si,sj) – M(sj,si)
cal metrics inovelty mining
Cosine similarity,Jaccard similarity
New word count,Overlap

2362 F.S. Tsai et al. / Information Sciences 180 (2010) 2359–2374
elty metric is also calculated by comparing the current sentence st with any of its history sentences, si (1 6 i 6 t � 1), as de-fined in Eq. (4)
Table 2Explicit
ExplImpl
NoverlapðstÞ ¼ 1� max16i6t�1
overlapðstjsiÞ; ð4Þ
overlapðst jsiÞ ¼jstT
sijjstj
¼P
k2st\siminðwkðstÞ;wkðsiÞÞP
k2stwkðstÞ
;
where overlap(st—si) is the overlapping part of the sentence st by a history sentence si, 1 6 i 6 t � 1. wk(si) is the weight of theword k in the sentence si, as defined in the following equation for tf.isf (term-frequency times inverse sentence frequency):
wkðsiÞ ¼ tfwk ;silog
nþ 1sfwkþ 0:5
� �; ð5Þ
where tfwk ;siis the frequency of the word wk in the sentence si; sfwk
is the number of sentences in which the word wk appearsin the collection; n is the number of sentences in the collection.
The new word count novelty metric is another popular asymmetric metric, which was proposed for sentence-level nov-elty mining [2]. The idea of the new word count novelty metric is to assign the incoming sentence the number of new wordsthat have not appeared in its history sentences, as defined in Eq. (6)
newWordðstÞ ¼ jWðstÞj � WðstÞ \ [t�1i¼1 WðsiÞ
� ��� ��; ð6Þ
where W(si) is the set of words in the sentence si. The values of the new word count novelty metric for an incoming sentenceare non-negative integers such as 0,1, and 2. To convert the values of the novelty scores into the range of 0–1, the new wordcount novelty metric can be normalized by the total number of words in the incoming sentence st as below
NnewWordðstÞ ¼ 1�WðstÞ \ [t�1
i¼1 WðsiÞ� ��� ��
WðstÞj j ; ð7Þ
where the denominator jW(st)j is the word count of st. This normalized metric, NnewWord, has the range of values from 0 (i.e. nonew word) to 1 (i.e. 100% new words).
2.3. Factors affecting novelty metric selection
For a variety of novelty metrics available, selecting a suitable metric is crucial for the final performance of novelty mining.In previous studies, many efforts have been placed on creating some new metrics or comparing different metrics across dif-ferent corpora, to find the empirically suitable metrics in a very general situation [23,2,1]. However, not much guidance hasbeen provided for the selection of a suitable novelty metric in a specific situation. For example, what kind of metrics couldperform better for a high-recall or high-precision system? Or which kind of metrics could perform better for data with asmall percentage of novel sentences? To answer these questions, we first need to explore the factors that may affect the per-formance of novelty metrics.
The differences between various novelty metrics are actually due to how they measure the ‘‘novelty” of the incoming sen-tence. Therefore, the performance of novelty metrics may be affected by the user’s requirement about his/her desired novelsentences explicitly, and the distributions of novelty based on the truth of the data implicitly, as summarized in Table 2. Wedescribe both the explicit and implicit factors in this section, in order to highlight the different situations that occur in thereal-world applications of novelty mining.
2.3.1. Explicit factor: performance requirementsIn novelty mining, performance requirements are optimized through maximizing the corresponding evaluation measures.
Two measures, recall and precision, best gauge the overall effectiveness of information retrieval systems. In the context ofsentence-level novelty mining, these measurements are used to assess the system’s likelihood of missing novel sentencesand retrieving actually non-novel sentences for the user, respectively. It has been acknowledged that there is a trade-off be-tween recall and precision, i.e. high-recall and high-precision cannot be achieved simultaneously.
Although the F-score was used as the primary performance requirement in previous studies [14], in practical applications,the user may need high-recall or high-precision systems rather than high-F systems. For example, when users do not want tomiss any novel information, a high-recall system which only filters out the most redundant sentences is desired. On the otherhand, when users want to read the sentences with the most significant novelty in a very short time, a high-precision systemwhich only retrieves highly novel sentences is preferred. In high-recall/precision cases, novelty metrics that are good at
and implicit factors of novelty metric selection.
icit factors Performance requirements, e.g. high-recall, high-precision, or high-F-scoreicit factor Distribution of novelty based on the truth of the data, e.g. high, medium or low novelty ratio in a specific topic

F.S. Tsai et al. / Information Sciences 180 (2010) 2359–2374 2363
detecting the redundancy/novelty of sentences may be a better choice. The type of novelty metrics that will favor high-recallor high-precision situations will be explored in our experimental study.
2.3.2. Implicit factor: the distributions of novelty based on the truth of the dataThe distribution of novelty based on the truth of the data can be described by the prior probability P(novel), i.e. the prob-
ability that the next incoming sentence is novel. This prior probability reflects our prior knowledge of how likely we are toget a novel sentence before it actually appears.
For the topics containing many highly similar sentences, the novelty metric is expected to be sensitive to novel informa-tion in the highly similar sentences. On the other hand, for the topics containing many dissimilar sentences, we hope thenovelty metric is good at detecting the redundant information from these dissimilar sentences. How the performance ofthe novelty metrics are influenced by the topics with different novelty ratios will also be tested in our experimental study.
3. Comparative study of novelty metrics
In this section, a comparative study of different types of novelty metrics is performed on TREC 2003 and 2004 NoveltyTrack data. The objective of this study is to reveal the diverse performance of the two types of metrics under various situ-ations. First, the datasets used for our experiments are described. Second, the performance evaluation measures, namely,precision, recall, and F-score are presented. Finally, various symmetric and asymmetric metrics are compared and analyzedunder different performance requirements and different prior probabilities.
3.1. Data
Currently, the possible public datasets for sentence-level novelty mining are from the TREC Novelty Track 2002 to 2004,including three datasets, i.e. TREC 2002 [6], 2003 [15], 2004 [14] Novelty Track data. In this experimental study, the TREC2002 Novelty Track data is excluded because it contains too few redundancies, and 23 out of the 50 topics consist of all rel-evant sentences marked as novel.
TREC 2003 and 2004 Novelty Track data are developed from the AQUAINT collection. The news providers of the documentset are Xinghua English (XIE), New York Times (NYT), and Associated Press Worldstream (APW). Both relevant and novel sen-tences are selected by TREC’s assessors and retrieved from the National Institute of Standard and Technology (NIST). The sta-tistics of these two datasets are summarized in Table 3.
3.2. Evaluation measures
For the evaluation of novelty mining systems, the novel sentences selected manually by the NIST assessor who createdthe topic were considered as the truth data. In this experiment, we follow the evaluation measures proposed for the TRECNovelty Track [14], i.e. set-based recall, precision and F-score averaged across all 100 topics or subsets of topics in the TREC2003/2004 Novelty Track data. Let X be the number of matched sentences, i.e. the number of sentences selected by both theassessor and the system, A be the number of sentences selected by the assessor, and S be the number of sentences selected bythe system. Then sentence set recall is X/A and precision is X/S. The F-score is a function of precision (P) and recall (R), definedas below
Table 3Statistic
Data
TRECTREC
F ¼ 2� P � RP þ R
: ð8Þ
3.3. Metrics comparison under various situations
In this section, various symmetric and asymmetric metrics are compared and analyzed under different conditions. As wedescribed in Section 2.3, the performance of novelty metrics will be influenced by both the explicit factor, i.e. the user’s per-formance requirements and the implicit factor, i.e. the prior probability of novel sentences in the processed data.
Seven metrics including the cosine, Jaccard, overlap metrics combined with the term-frequency (tf) and term-frequencyover inverse sentence frequency (tf.isf) weighting functions, and the new word count metrics are compared in different sit-uations. The reason to include the tf term weighting function is to ensure that the different performance in each situationmainly depends on the different types of novelty metrics rather than on the different term weighting functions. In all our
s of experimental data.
Topics # relevant sentences # novel sentences Average novelty ratio (%)
2003 N1-N50 15557 10226 65.72004 N51-N100 8343 3454 41.1
2364 F.S. Tsai et al. / Information Sciences 180 (2010) 2359–2374
experiments, the time window is set at 1000, meaning that each incoming sentence will be compared to the previous 1000sentences in history, which is consistent with the time window used in the TREC Novelty Tracks.
3.3.1. Performance of metrics under different performance requirementsA novelty mining system needs to retrieve the novel information for the user according to his/her performance require-
ments, i.e. high-recall, high-precision, or the balance of both recall and precision. There is a trade-off between precision andrecall, which can be adjusted by the novelty threshold explicitly. A high threshold will only let sentences with high noveltyscores be passed to the user, and this novelty mining system will show the high-precision property. On the other hand, a lowthreshold will only eliminate very redundant sentences, and the novelty mining system will show the high-recall property.
In this empirical study, we adjusted the novelty threshold in a range from 0.05 to 0.95 with a step length equal to 0.05,from which 19 precision-recall pairs (also the corresponding F-scores) are obtained. The increasing novelty thresholds createa series of novelty mining systems from high-recall to high-precision artificially. For each novelty threshold, the precision,recall and F-scores of 100 topics in the TREC 2003 and 2004 Novelty Track data are averaged over topics and reported ingraphs and tables.
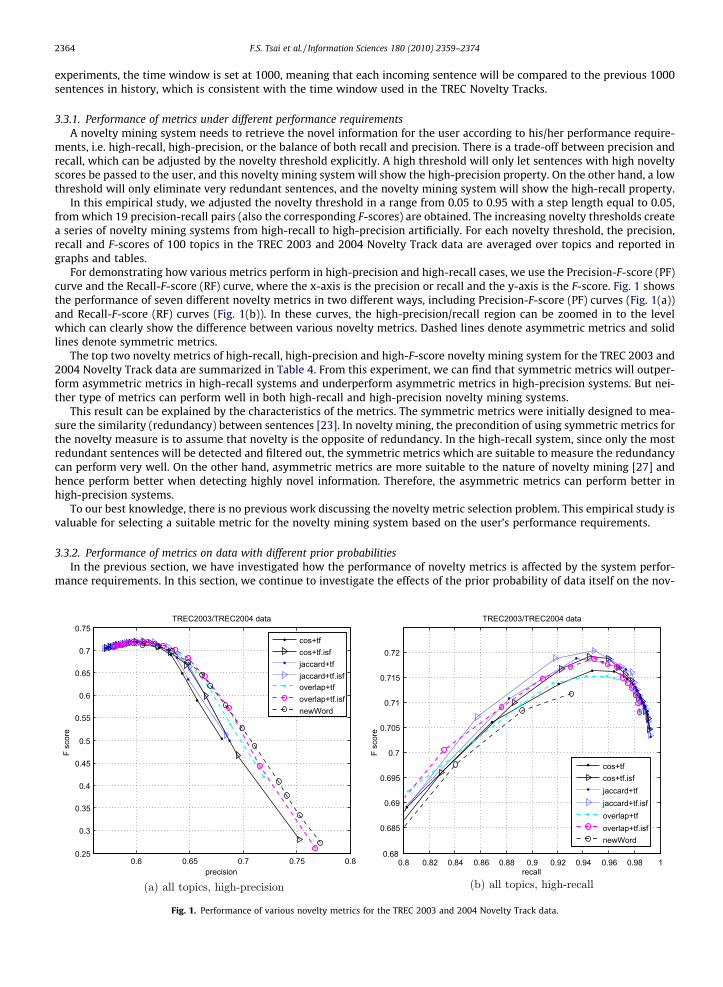
For demonstrating how various metrics perform in high-precision and high-recall cases, we use the Precision-F-score (PF)curve and the Recall-F-score (RF) curve, where the x-axis is the precision or recall and the y-axis is the F-score. Fig. 1 showsthe performance of seven different novelty metrics in two different ways, including Precision-F-score (PF) curves (Fig. 1(a))and Recall-F-score (RF) curves (Fig. 1(b)). In these curves, the high-precision/recall region can be zoomed in to the levelwhich can clearly show the difference between various novelty metrics. Dashed lines denote asymmetric metrics and solidlines denote symmetric metrics.
The top two novelty metrics of high-recall, high-precision and high-F-score novelty mining system for the TREC 2003 and2004 Novelty Track data are summarized in Table 4. From this experiment, we can find that symmetric metrics will outper-form asymmetric metrics in high-recall systems and underperform asymmetric metrics in high-precision systems. But nei-ther type of metrics can perform well in both high-recall and high-precision novelty mining systems.
This result can be explained by the characteristics of the metrics. The symmetric metrics were initially designed to mea-sure the similarity (redundancy) between sentences [23]. In novelty mining, the precondition of using symmetric metrics forthe novelty measure is to assume that novelty is the opposite of redundancy. In the high-recall system, since only the mostredundant sentences will be detected and filtered out, the symmetric metrics which are suitable to measure the redundancycan perform very well. On the other hand, asymmetric metrics are more suitable to the nature of novelty mining [27] andhence perform better when detecting highly novel information. Therefore, the asymmetric metrics can perform better inhigh-precision systems.
To our best knowledge, there is no previous work discussing the novelty metric selection problem. This empirical study isvaluable for selecting a suitable metric for the novelty mining system based on the user’s performance requirements.
3.3.2. Performance of metrics on data with different prior probabilitiesIn the previous section, we have investigated how the performance of novelty metrics is affected by the system perfor-
mance requirements. In this section, we continue to investigate the effects of the prior probability of data itself on the nov-
0.6 0.65 0.7 0.75 0.80.25
0.3
0.35
0.4
0.45
0.5
0.55
0.6
0.65
0.7
0.75
precision
F sc
ore
TREC2003/TREC2004 data
cos+tfcos+tf.isfjaccard+tfjaccard+tf.isfoverlap+tfoverlap+tf.isfnewWord
0.8 0.82 0.84 0.86 0.88 0.9 0.92 0.94 0.96 0.98 10.68
0.685
0.69
0.695
0.7
0.705
0.71
0.715
0.72
recall
F sc
ore
TREC2003/TREC2004 data
cos+tfcos+tf.isfjaccard+tfjaccard+tf.isfoverlap+tfoverlap+tf.isfnewWord
Fig. 1. Performance of various novelty metrics for the TREC 2003 and 2004 Novelty Track data.

Table 4Rank 1st and 2nd novelty metrics with top performance in high-recall, high-precision and high-F-score novelty mining system for the TREC 2003 and 2004Novelty Track data. (* denotes the asymmetric metrics.)
Rank 1st Rank 2nd
High-precision New word* Overlap*
High-recall Jaccard cosHigh-F-score Jaccard cos
F.S. Tsai et al. / Information Sciences 180 (2010) 2359–2374 2365
elty metrics. Since novelty mining is a real-time process in which no training data is available, the prior probability of theprocessed data is usually unknown beforehand. However, it is still important to understand how the different types of met-rics are affected by the prior probability of data, because the principles provide guidelines for improvement in noveltymeasurement.
Given a sentence stream s1–sn, we can define whether the sentence si (i = 1–n) is novel as a variable Y. The prior proba-bility P(Y) is a description of the probability that the next incoming sentence is novel before actually seeing it. Using the max-imum likelihood estimation, the prior probability of novelty can be estimated by the ratio of novel sentences, denoted asnovelty ratio rN
Table 5Numbe
Data
TRECTREC
Tota
rN ¼# Novel sentences
# Relevant sentences: ð9Þ
The goal of this experiment is to investigate the performance of various metrics in the data with different prior probabilities.Therefore, we calculate the prior probability of each topic and divide all the 100 topics in the TREC 2003 and 2004 NoveltyTrack data into different categories corresponding to different levels of novelty ratio rN. Then, the same seven metrics aretested and compared in each category separately. Notice that the novelty ratios which are assumed to be known are onlyused for stratifying the topics and will never be used in the novelty mining process. Therefore, the novelty mining resultscan still simulate the performance of novelty metrics in real applications.
For ease of understanding, novelty ratios ranging from 0 to 1 are divided into 3 levels, i.e. low (rN 6 0.33), medium(0.33 < rN 6 0.66) and high (rN > 0.66) levels. The number of topics with low, medium and high novelty ratio in each datais summarized in Table 5.
In each category, we repeat the experiments from the previous section. The novelty threshold is varied from 0.05 to 0.95with an equal step of 0.05. For each threshold, the precision, recall and F-scores for the topics in each category are averagedand reported in the graphs and tables.
The experimental results of various metrics for the topics with low, medium and high novelty ratios in the TREC 2003 and2004 Novelty Track data are shown in the three rows of Fig. 2, respectively. We summarize the experimental results in thisfigure as follows:
(i) The same types of novelty metrics perform similarly in each category of topics. See the comparison between asymmet-ric metrics (dashed lines) and symmetric metrics (solid lines).
(ii) Asymmetric metrics (i.e. overlap and new word count metrics) perform better for the topics with low novelty ratio, asshown in Fig. 2(a) and (b). When the precision ranges from 0.35 to 0.45, asymmetric metrics keep the corresponding F-scores above 0.5, while in the same range, the F-score of symmetric metrics ranges from 0.47 to 0.5.
(iii) Symmetric novelty metrics (i.e. cosine and Jaccard similarities) perform better for the topics with high novelty ratio, asshown in Fig. 2(e) and (f). In Fig. 2(f), we can observe that the maximum F-scores of symmetric metrics are around0.91, which is a little bit higher than that of the overlap metric and much higher than that of the new word countmetric.
(iv) Both types of metrics perform similarly for the topics with medium novelty ratio, as shown in Fig. 2(c) and (d). Forexample, in Fig. 2(c), neither group of metrics clearly performs better when the precision ranges from 0.7 to 0.85.The same can be concluded for Fig. 2(d) when the recall ranges from 0.86 to 0.99. The maximum F-scores of both sym-metric and asymmetric metrics are very close when the recall is equal to 0.94–0.96, as shown in Fig. 2(d).
r of topics with low, medium and high novelty ratio in both sentence-and document-level data.
Novelty ratio
Low rN 6 0.33 Medium 0.33 < rN 6 0.66 High rN > 0.66
2003 1 23 262004 17 32 1
l 18 55 27

0.3 0.35 0.4 0.45 0.5 0.55 0.6 0.650
0.1
0.2
0.3
0.4
0.5
0.6
0.7
0.8
0.9
1
precision
F sc
ore
TREC2003/TREC2004 data with low novelty ratio
cos+tfcos+tf.isfjaccard+tfjaccard+tf.isfoverlap+tfoverlap+tf.isfnewWord
0.8 0.82 0.84 0.86 0.88 0.9 0.92 0.94 0.96 0.98 10.44
0.45
0.46
0.47
0.48
0.49
0.5
0.51
0.52
0.53
0.54
recall
F sc
ore
TREC2003/TREC2004 data with low novelty ratio
cos+tfcos+tf.isfjaccard+tfjaccard+tf.isfoverlap+tfoverlap+tf.isfnewWord
0.5 0.55 0.6 0.65 0.7 0.75 0.80
0.1
0.2
0.3
0.4
0.5
0.6
0.7
0.8
0.9
1
precision
F sc
ore
TREC2003/TREC2004 data with medium novelty ratio
cos+tfcos+tf.isfjaccard+tf
jaccard+tf.isfoverlap+tf
overlap+tf.isfnewWord
0.8 0.82 0.84 0.86 0.88 0.9 0.92 0.94 0.96 0.98 10.63
0.64
0.65
0.66
0.67
0.68
0.69
0.7
0.71
0.72
0.73
recall
F sc
ore
TREC2003/TREC2004 data with medium novelty ratio
cos+tfcos+tf.isfjaccard+tf
jaccard+tf.isfoverlap+tf
overlap+tf.isfnewWord
0.65 0.7 0.75 0.8 0.85 0.9 0.95 10
0.1
0.2
0.3
0.4
0.5
0.6
0.7
0.8
0.9
1
precision
F sc
ore
TREC2003/TREC2004 data with high novelty ratio
cos+tfcos+tf.isfjaccard+tfjaccard+tf.isfoverlap+tfoverlap+tf.isfnewWord
0.8 0.82 0.84 0.86 0.88 0.9 0.92 0.94 0.96 0.98 10.82
0.83
0.84
0.85
0.86
0.87
0.88
0.89
0.9
0.91
0.92
recall
F sc
ore
TREC2003/TREC2004 data with high novelty ratio
cos+tfcos+tf.isfjaccard+tfjaccard+tf.isfoverlap+tfoverlap+tf.isfnewWord
Fig. 2. Performance of various novelty metrics for the TREC 2003 and 2004 Novelty Track data.
2366 F.S. Tsai et al. / Information Sciences 180 (2010) 2359–2374

F.S. Tsai et al. / Information Sciences 180 (2010) 2359–2374 2367
Moreover, to also consider the effects of different system requirements, from high-precision to high-recall, the top twonovelty metrics of various performance requirements and novelty ratios for the TREC 2003 and 2004 Novelty Track dataare summarized in Table 6, where * denotes the asymmetric metrics. The column ‘‘average” in the table refers to the averageperformance of novelty metrics for TREC 2003 and 2004, including all topics with low, medium, and high novelty ratios.From Fig. 2 and Table 6, we can conclude as follows:
(i) As observed from Fig. 2, asymmetric metrics such as new word count and overlap metrics always win in the high-pre-cision case (see Fig. 2(a), (c) and (e)). In the high-recall case, asymmetric metrics will outperform symmetric metricswhen the novelty ratio is low (see Fig. 2(b)), and underperform symmetric metrics when the novelty ratio is high(Fig. 2(f)). This experimental result shows the clear complementary behavior of different types of metrics in varioussituations.
(ii) Jaccard and cosine similarities achieve the globally highest F-score as shown in the lower-right corner of Table 6,which is consistent with the empirically best performance of similarity-based novelty metrics reported in previouspapers [23,2]. However, by testing in different situations, the cosine similarities as well as Jaccard will not consistentlyperform best for novelty mining locally, especially when the high-precision novelty mining system is desired.
(iii) The new word count metric cannot get a very high-recall. As new word count is the number of new words in theincoming sentence that does not appear in any history sentence, some novel sentences with no new words will neverbe retrieved. Therefore, the new word count metric is not recommended for high-recall novelty mining systems.
The advantage of this experiment is that it helps to understand the strengths and limitations of novelty metrics in differ-ent situations. The experimental results indicate that symmetric and asymmetric novelty metrics cannot perform well invarious situations simultaneously, while their strengths may complement each other. In the next section, we will introducea new framework of novelty measurement by utilizing the findings of this section.
4. A new framework of novelty measurement
As analyzed in the previous section, the strengths of symmetric metrics and asymmetric metrics may complement eachother. In this section, we propose a new framework for measuring the novelty by a mixture of both types of novelty metrics.The goal of the mixed metric is to integrate their merits and hence generalize better over different topics.
Two major issues for constructing a mixed metric are (i) the scaling problem that ensures that different component met-rics are comparable and consistent and (ii) the combining strategy that defines the way of fusing the outputs from differentcomponent metrics. As the novelty scores from all novelty metrics ranges from 0 (i.e. redundant) to 1 (i.e. totally novel), theyare both comparable and consistent.
For the combining strategy, we formulate a new framework of measuring through combining two types of metrics, asshown in Eq. (10)
Table 6Top twometrics
High
High
High
MðstÞ ¼ aNsymðstÞ þ ð1� aÞNasymðstÞ; ð10Þ
where a is the combining parameter ranging from 0 to 1. The bigger the a, the heavier the weight for the symmetric metrics.Without losing any generalization, we first choose equal weights of 50% (a = 0.5) for both symmetric and asymmetric metricsand compare the performance of the mixed metrics with those of the individual metrics. In the next section, we will discussthe effects of weight variation in detail.
Four different mixed metrics can be generated from this new framework using Eq. (10), i.e. M1 to M4, as follows
M1ðstÞ ¼ aNcosðstÞ þ ð1� aÞNnewWordðstÞ; ð11ÞM2ðstÞ ¼ aNcosðstÞ þ ð1� aÞNoverlapðstÞ; ð12ÞM3ðstÞ ¼ aNJaccardðstÞ þ ð1� aÞNnewWordðstÞ; ð13ÞM4ðstÞ ¼ aNJaccardðstÞ þ ð1� aÞNoverlapðstÞ: ð14Þ
novelty metrics for various performance requirements and novelty ratios for the TREC 2003 and 2004 Novelty Track data. (* denotes the asymmetric.)
Novelty ratio Average
Low Medium High
-precision New word*
Overlap*New word*
Overlap*Overlap*
New word*New word*
Overlap*
-recall New word*
JaccardOverlap*
JaccardJaccardcos
Jaccardcos
-F-score New word*
Overlap*Overlap*
JaccardJaccardcos
Jaccardcos
2368 F.S. Tsai et al. / Information Sciences 180 (2010) 2359–2374
4.1. Mixed metrics vs. individual metrics
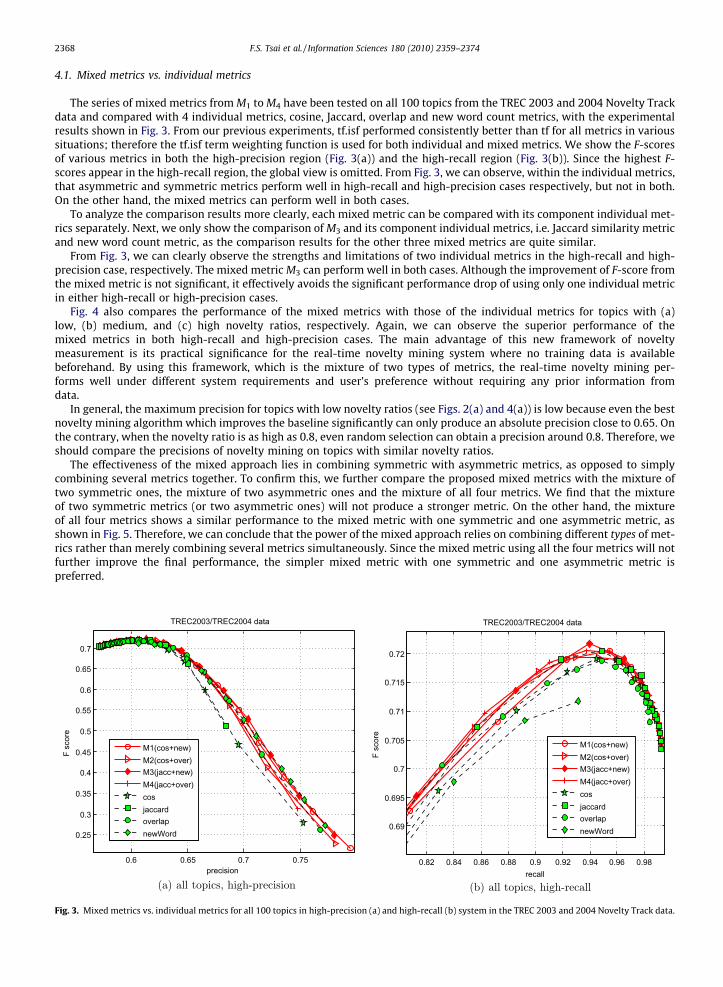
The series of mixed metrics from M1 to M4 have been tested on all 100 topics from the TREC 2003 and 2004 Novelty Trackdata and compared with 4 individual metrics, cosine, Jaccard, overlap and new word count metrics, with the experimentalresults shown in Fig. 3. From our previous experiments, tf.isf performed consistently better than tf for all metrics in varioussituations; therefore the tf.isf term weighting function is used for both individual and mixed metrics. We show the F-scoresof various metrics in both the high-precision region (Fig. 3(a)) and the high-recall region (Fig. 3(b)). Since the highest F-scores appear in the high-recall region, the global view is omitted. From Fig. 3, we can observe, within the individual metrics,that asymmetric and symmetric metrics perform well in high-recall and high-precision cases respectively, but not in both.On the other hand, the mixed metrics can perform well in both cases.
To analyze the comparison results more clearly, each mixed metric can be compared with its component individual met-rics separately. Next, we only show the comparison of M3 and its component individual metrics, i.e. Jaccard similarity metricand new word count metric, as the comparison results for the other three mixed metrics are quite similar.
From Fig. 3, we can clearly observe the strengths and limitations of two individual metrics in the high-recall and high-precision case, respectively. The mixed metric M3 can perform well in both cases. Although the improvement of F-score fromthe mixed metric is not significant, it effectively avoids the significant performance drop of using only one individual metricin either high-recall or high-precision cases.
Fig. 4 also compares the performance of the mixed metrics with those of the individual metrics for topics with (a)low, (b) medium, and (c) high novelty ratios, respectively. Again, we can observe the superior performance of themixed metrics in both high-recall and high-precision cases. The main advantage of this new framework of noveltymeasurement is its practical significance for the real-time novelty mining system where no training data is availablebeforehand. By using this framework, which is the mixture of two types of metrics, the real-time novelty mining per-forms well under different system requirements and user’s preference without requiring any prior information fromdata.
In general, the maximum precision for topics with low novelty ratios (see Figs. 2(a) and 4(a)) is low because even the bestnovelty mining algorithm which improves the baseline significantly can only produce an absolute precision close to 0.65. Onthe contrary, when the novelty ratio is as high as 0.8, even random selection can obtain a precision around 0.8. Therefore, weshould compare the precisions of novelty mining on topics with similar novelty ratios.
The effectiveness of the mixed approach lies in combining symmetric with asymmetric metrics, as opposed to simplycombining several metrics together. To confirm this, we further compare the proposed mixed metrics with the mixture oftwo symmetric ones, the mixture of two asymmetric ones and the mixture of all four metrics. We find that the mixtureof two symmetric metrics (or two asymmetric ones) will not produce a stronger metric. On the other hand, the mixtureof all four metrics shows a similar performance to the mixed metric with one symmetric and one asymmetric metric, asshown in Fig. 5. Therefore, we can conclude that the power of the mixed approach relies on combining different types of met-rics rather than merely combining several metrics simultaneously. Since the mixed metric using all the four metrics will notfurther improve the final performance, the simpler mixed metric with one symmetric and one asymmetric metric ispreferred.
0.6 0.65 0.7 0.75
0.25
0.3
0.35
0.4
0.45
0.5
0.55
0.6
0.65
0.7
precision
F sc
ore
TREC2003/TREC2004 data
M1(cos+new)M2(cos+over)M3(jacc+new)M4(jacc+over)cosjaccardoverlapnewWord
0.82 0.84 0.86 0.88 0.9 0.92 0.94 0.96 0.98
0.69
0.695
0.7
0.705
0.71
0.715
0.72
recall
F sc
ore
TREC2003/TREC2004 data
M1(cos+new)M2(cos+over)M3(jacc+new)M4(jacc+over)cosjaccardoverlapnewWord
Fig. 3. Mixed metrics vs. individual metrics for all 100 topics in high-precision (a) and high-recall (b) system in the TREC 2003 and 2004 Novelty Track data.

0.3 0.35 0.4 0.45 0.5 0.55 0.6 0.65
0.3
0.35
0.4
0.45
0.5
precision
F sc
ore
TREC2003/TREC2004 data with low novelty ratio
M3(jacc+new)jaccardnewWord
0.8 0.82 0.84 0.86 0.88 0.9 0.92 0.94 0.96 0.98 1
0.44
0.45
0.46
0.47
0.48
0.49
0.5
0.51
0.52
0.53
recall
F sc
ore
TREC2003/TREC2004 data with low novelty ratio
M3(jacc+new)jaccardnewWord
0.5 0.55 0.6 0.65 0.7 0.75 0.8 0.85 0.90
0.1
0.2
0.3
0.4
0.5
0.6
0.7
0.8
precision
F sc
ore
TREC2003/TREC2004 data with medium novelty ratio
M3(jacc+new)jaccardnewWord
0.8 0.82 0.84 0.86 0.88 0.9 0.92 0.94 0.96 0.98
0.665
0.67
0.675
0.68
0.685
0.69
0.695
0.7
0.705
0.71
recall
F sc
ore
TREC2003/TREC2004 data with medium novelty ratio
M3(jacc+new)jaccardnewWord
0.86 0.87 0.88 0.89 0.9 0.91 0.92 0.93
0.1
0.2
0.3
0.4
0.5
0.6
0.7
0.8
0.9
precision
F sc
ore
TREC2003/TREC2004 data with high novelty ratio
M3(jacc+new)jaccardnewWord
0.8 0.82 0.84 0.86 0.88 0.9 0.92 0.94 0.96 0.98 10.82
0.83
0.84
0.85
0.86
0.87
0.88
0.89
0.9
0.91
0.92
recall
F sc
ore
TREC2003/TREC2004 data with high novelty ratio
M3(jacc+new)jaccardnewWord
Fig. 4. Mixed metric M3 vs. individual metrics for the topics with low (a) and (b), medium (c) and (d) and high (e) and (f) novelty ratio in the TREC 2003 and2004 Novelty Track data.
F.S. Tsai et al. / Information Sciences 180 (2010) 2359–2374 2369

0.25 0.3 0.35 0.4 0.45 0.5 0.55 0.6 0.65 0.7 0.750
0.1
0.2
0.3
0.4
0.5
precision
F sc
ore
TREC2003/TREC2004 data with low novelty ratio
M3(jacc+new)Msym(jacc+cos)
Masy(new+overlap)
Mall
0.8 0.85 0.9 0.95 10.44
0.45
0.46
0.47
0.48
0.49
0.5
0.51
0.52
0.53
recall
F sc
ore
TREC2003/TREC2004 data with low novelty ratio
M3(jacc+new)Msym(jacc+cos)
Masy(new+overlap)
Mall
0.5 0.55 0.6 0.65 0.7 0.75 0.8 0.85 0.90
0.1
0.2
0.3
0.4
0.5
0.6
0.7
0.8
precision
F sc
ore
TREC2003/TREC2004 data with medium novelty ratio
M3(jacc+new)Msym(jacc+cos)Masy(new+overlap)Mall
0.8 0.82 0.84 0.86 0.88 0.9 0.92 0.94 0.96 0.98 10.66
0.665
0.67
0.675
0.68
0.685
0.69
0.695
0.7
0.705
0.71
recall
F sc
ore
TREC2003/TREC2004 data with medium novelty ratio
M3(jacc+new)Msym(jacc+cos)
Masy(new+overlap)
Mall
0.86 0.87 0.88 0.89 0.9 0.91 0.92 0.93 0.94 0.950
0.1
0.2
0.3
0.4
0.5
0.6
0.7
0.8
0.9
1
precision
F sc
ore
TREC2003/TREC2004 data with high novelty ratio
M3(jacc+new)Msym(jacc+cos)Masy(new+overlap)
Mall
0.8 0.82 0.84 0.86 0.88 0.9 0.92 0.94 0.96 0.98 10.82
0.83
0.84
0.85
0.86
0.87
0.88
0.89
0.9
0.91
0.92
recall
F sc
ore
TREC2003/TREC2004 data with high novelty ratio
M3(jacc+new)Msym(jacc+cos)
Masy(new+overlap)
Mall
Fig. 5. Mixed metric M3 vs. the mixture of two symmetric metrics (Msym), the mixture of two asymmetric metrics (Masy) and the mixture of all 4 metrics(Mall) in the TREC 2003 and 2004 Novelty Track data.
2370 F.S. Tsai et al. / Information Sciences 180 (2010) 2359–2374

F.S. Tsai et al. / Information Sciences 180 (2010) 2359–2374 2371
In a real-time novelty mining system, the computational complexity is an important aspect of the overall performance.Since cosine, Jaccard and overlap novelty metrics employ one-to-one sentence comparison, for each ith incoming sentence,i � 1 metrics computations are needed. The overall computational complexity for a stream of n sentences is Oðn log nÞ. Sincethe new word count novelty metric uses one-to-all sentence comparison, it only compares to its history sentences once foreach incoming sentence, and the overall computational complexity for n sentences is OðnÞ. For mixed metrics, the compu-tational complexity is Oðn log nÞ because no extra sentence comparison is introduced by combining different metrics. Table 7summarizes the computational complexity and running time of various individual and mixed metrics for novelty mining.The running times are computed for 100 topics using the TREC 2003/2004 Novelty Track data. The running environmentis MATLAB using a computer with 2.66 GHz CPU.
4.2. Effects of weight variation on mixed metrics
To test the performance of the mixed metrics in the most general case, we use equal weights of 50%, i.e. a = 0.5 for the pairof individual metrics. To better understand the effects of weight variation on mixed metrics, we tried various weights wherea is set at a range from 0.1 to 0.9 with an equal step length 0.1.
Table 7The computational complexity and running time of individual vs. mixed metrics in novelty mining system for n sentences.
Metrics Complexity Time (seconds)
Individual: cos Oðn log nÞ 646Jaccard Oðn log nÞ 843overlap Oðn log nÞ 674new word OðnÞ 3
Mixed: M1 (cos + new word) Oðn log nÞ 925M2 (cos + overlap) Oðn log nÞ 1042M3 (Jaccard + new word) Oðn log nÞ 1107M4 (Jaccard + overlap) Oðn log nÞ 1219
0 0.2 0.4 0.6 0.8 10.71
0.715
0.72
0.725
F sc
ore
M1
M1(cos+new)only cosonly newWord
0 0.2 0.4 0.6 0.8 10.71
0.715
0.72
0.725
F sc
ore
M2
M2(cos+over)only cosonly overlap
0 0.2 0.4 0.6 0.8 10.71
0.715
0.72
0.725
F sc
ore
M3
M3(jacc+new)only jaccardonly newWord
0 0.2 0.4 0.6 0.8 10.71
0.715
0.72
0.725
F sc
ore
M4
M4(jacc+over)only jaccardonly overlap
Fig. 6. Effect of weight variation (a = 0.1–0.9) on the performance of mixed metrics on 100 topics from the TREC 2003 and 2004 Novelty Track data.

2372 F.S. Tsai et al. / Information Sciences 180 (2010) 2359–2374
The upper left graph in Fig. 6 clearly showed that using the new word count metric helps to increase the average F-scoreof the cosine similarity metric when assigning similar weights for the pair of individual metrics. When a low weight smallerthan 0.3 is assigned to cosine similarity, the average F-score will decrease gradually. The lower left graph in Fig. 6 shows thatwhen an equal or higher weight is assigned to the Jaccard similarity metric, integrating the new word count metric is veryhelpful to improve the average F-score. Again, the average F-score will decrease gradually by using a weight smaller than 0.3.
By investigating the effects of weight variation on mixed metrics, two useful observations can be summarized:
(i) An equal weight assigned to cosine similarity and a higher weight assigned to Jaccard similarity can yield the largestimprovement using the mixed metrics.
(ii) Although the new word count metric obtained the lowest macro-averaged F-score, integrating the new word countmetric will be more helpful for the mixed metrics. This may be because the new word count metric employs one-to-multiple sentence comparison, while the other metrics employ one-to-one comparison. Therefore, integratingthe new word count metric will not only integrate different types of metrics but also integrate different sentence com-paring strategies which may extract different aspects of information. The other asymmetric metric, overlap metric,uses one-to-one sentence comparison, which is the same with the symmetric metrics cosine and Jaccard similarities.The more metrics used in the new framework, the better the performance.
4.3. Query examples using various metrics
To illustrate the different performance of individual and mixed metrics, we use two examples. The first toy problem hasfive sentences in the incoming order shown in Table 8. The ground truth of novelty for each sentence is given at the right-most column in Table 8. In this example, only s3 is non-novel.
Table 9Result of individual and mixed novelty metrics for the toy problem 1 in Table 8. (The minimum novelty score of each metric is written in bold.)
id Truth cos Jaccard New word Overlap M1 M2 M3 M4
s1 Novel 1.0000 1.0000 1.0000 1.0000 1.0000 1.0000 1.0000 1.0000s2 Novel 0.8624 0.9281 0.5833 0.9225 0.7229 0.8925 0.7557 0.9253s3 Non-novel 0.8394 0.8600 0.2500 0.6288 0.5447 0.7341 0.5550 0.7444s4 Novel 0.7808 0.8879 0.4000 0.8484 0.5904 0.8146 0.6439 0.8681s5 Novel 0.8429 0.8598 0.4286 0.7826 0.6357 0.8127 0.6442 0.8212
Table 8Toy problem 1.
s1 2009 H1N1 is a new influenza virus causing illness in people Novels2 This virus is spreading from people to people worldwide, not from pigs to people, probably in much the same way that regular
seasonal influenza viruses spreadNovel
s3 People are infected by other people and not by pigs Non-novels4 Pigs can be infected with both human and avian influenza viruses in addition to swine influenza viruses Novels5 Infected pigs get symptoms of seasonal flu similar to humans Novel
Table 10Toy problem 2 of novelty mining.
s1 Annie said she will join the birthday party, but she may be late because she has class today Novels2 Today is Annie’s birthday Novels3 Annie said she may be late for the birthday party Non-novel
Table 11Result of individual and mixed novelty metrics for the toy problem 2 in Table 10. (The minimum novelty score of each metric is written in bold.)
id True class cos Jaccard New word Overlap M1 M2 M3 M4
s1 Novel 1.0000 1.0000 1.0000 1.0000 1.0000 1.0000 1.0000 1.0000s2 Novel 0.3453 0.5714 0 0 0.1727 0.1727 0.2857 0.2857s3 Non-novel 0.2871 0.4725 0 0 0.1436 0.1436 0.2363 0.2363

F.S. Tsai et al. / Information Sciences 180 (2010) 2359–2374 2373
Table 9 shows the novelty scores given by various metrics. The cosine and Jaccard novelty metrics give the minimum nov-elty scores for the novel sentences s4 and s5, respectively, and a higher novelty score for the non-novel sentence s3. That isbecause the symmetric novelty metrics did not take the ordering of sentences into account. Therefore, when the sentenceonly contains partial information of its history sentence, it tends to be incorrectly predicted as ‘‘novel” by the symmetric nov-elty metrics. In this example, both asymmetric and mixed metrics give the minimum novelty scores to the true non-novelsentence.
In some other case, such as the toy problem 2 shown in Table 10, the asymmetric novelty metrics like new word countand overlap cannot detect the novelty in the sentence without a new word, such as the novel sentence s2, while symmetricnovelty metrics can work well in this case. Again, the mixed metrics can also make the right prediction (see Table 11).
From these two query examples, we can observe that the mixed metrics may not outperform the best individual metric ina specific case, but generalize better than any of the individual metrics over different situations.
5. Conclusion
In this paper, a thorough comparative study was performed on different types of novelty metrics, symmetric (i.e. cosineand Jaccard similarities) and asymmetric metrics (i.e. new word count and overlap). We found that the performance of nov-elty metrics was influenced by both explicit factors, i.e. the system performance requirements, and implicit factor, i.e. thenovelty ratios of data. Considering the effects from these two factors, we observed complementary behavior in the symmet-ric and asymmetric novelty metrics.
Then, a new framework of novelty measurement, a mixture of both types of novelty metrics, was introduced. The exper-imental results showed the superior performance of this new framework under different performance requirements and fordata with different prior probabilities. Although this method was not significantly better than the best of the individual met-rics, it effectively avoided the significant performance drop compared to using individual metrics in either high-recall orhigh-precision novelty mining systems. Furthermore, this new framework is convenient to be applied for any novelty miningalgorithm that uses individual novelty metrics. Moreover, because it does not require any prior information from data, it isvery suitable to real-time application such as novelty mining systems where no training data is available beforehand.
References
[1] N. Abdul-Jaleel, J. Allan, W. Croft, F. Diaz, L. Larkey, X. Li, M. Smucker, C. Wade, UMass at TREC 2004: Novelty and HARD, in: Proceedings of TREC 2004 –the 13th Text Retrieval Conference, 2004, pp. 1–13.
[2] J. Allan, C. Wade, A. Bolivar, Retrieval and novelty detection at the sentence-level, in: SIGIR 2003: Proceedings of the 26th Annual International ACMSIGIR Conference on Research and Development in Information Retrieval, 2003, pp. 314–321.
[3] L. Antiqueira, O.N. Oliveira Jr., L.d.F. Costa, M.d.G.V. Nunes, A complex network approach to text summarization, Information Sciences 179 (5) (2009)584–599.
[4] Y. Chen, F.S. Tsai, K.L. Chan, Machine learning techniques for business blog search and mining, Expert Systems with Applications 35 (3) (2008) 581–590.
[5] B.V. Gils, H.E. Propera, P. van Bommela, T. van der Weidea, On the quality of resources on the web: an information retrieval perspective, InformationSciences 177 (21) (2007) 4566–4597.
[6] D. Harman, Overview of the TREC 2002 novelty track, in: Proceedings of TREC 2002 – the 11th Text Retrieval Conference, 2002, pp. 46–55.[7] I.N. Kouris, C.H. Makris, A.K. Tsakalidis, Using information retrieval techniques for supporting data mining, Data and Knowledge Engineering 52 (3)
(2005) 353–383.[8] A.T. Kwee, F.S. Tsai, W. Tang, Sentence-level novelty detection in English and Malay, Lecture Notes in Computer Science (LNCS) 5476 (2009) 40–51.[9] G. Lakhani, Reducing coding redundancy in LZW, Information Sciences 176 (10) (2006) 1417–1434.
[10] H. Liang, F.S. Tsai, A.T. Kwee, Detecting novel business blogs, in: Proceedings of the Seventh IEEE International Conference on Information,Communications and Signal Processing, 2009, pp. 1–5.
[11] K.W. Ng, F.S. Tsai, K.C. Goh, L. Chen, Novelty detection for text documents using named entity recognition, in: Proceedings of the Sixth IEEEInternational Conference on Information, Communications and Signal Processing, 2007, pp. 1–5.
[12] C.L. Ong, A.T. Kwee, F.S. Tsai, Database optimization for novelty detection, in: Proceedings of the Seventh IEEE International Conference on Information,Communications and Signal Processing, 2009, pp. 1–5.
[13] L. Ru, L. Zhao, M. Zhang, S. Ma, Improved feature selection and redundancy computing – THUIR at TREC 2004 novelty track, in: Proceedings of TREC2004 – the 13th Text Retrieval Conference, 2004, pp. 1–5.
[14] I. Soboroff, Overview of the TREC 2004 novelty track, in: Proceedings of TREC 2004 – the 13th Text Retrieval Conference, 2004, pp. 1–16.[15] I. Soboroff, D. Harman, Overview of the TREC 2003 novelty track, in: Proceedings of TREC 2003 – the 12th Text Retrieval Conference, 2003, pp. 38–53.[16] W. Tang, A.T. Kwee, F.S. Tsai, Accessing contextual information for interactive novelty detection, in: European Conference on Information Retrieval
(ECIR) Workshop on Contextual Information Access, Seeking and Retrieval Evaluation, 2009, pp. 1–4.[17] W. Tang, F.S. Tsai, Threshold setting and performance monitoring for novel text mining, in: Society for Industrial and Applied Mathematics – Nineth
SIAM International Conference on Data Mining 2009, Proceedings in Applied Mathematics, vol. 3, 2009, pp. 1310–1319.[18] F.S. Tsai, K.L. Chan, Dimensionality reduction techniques for data exploration, in: IEEE Sixth International Conference on Information, Communications
and Signal Processing, 2007, pp. 1–5.[19] F.S. Tsai, W. Han, J. Xu, H.C. Chua, Design and development of a mobile peer-to-peer social networking application, Expert Systems with Applications
36 (8) (2009) 11077–11087.[20] H.-P. Zhang, J. Sun, B. Wang, S. Bai, Computation on sentence semantic distance for novelty detection, Journal of Computer Science and Technology 20
(3) (2005) 331–337.[21] H.-P. Zhang, H.-B. Xu, S. Bai, B. Wang, X.-Q. Cheng, Experiments in TREC 2004 novelty track at CAS-ICT, in: Proceedings of TREC 2004 – the 13th Text
Retrieval Conference, 2004, pp. 1–6.[22] M. Zhang, R. Song, C. Lin, S. Ma, Z. Jiang, Y. Jin, Y. Liu, L. Zhao, Expansion-based technologies in finding relevant and new information: THU TREC 2002
novelty track experiments, in: Proceedings of TREC 2002 – the 11th Text Retrieval Conference, 2002, pp. 1–5.[23] Y. Zhang, J. Callan, T. Minka, Novelty and redundancy detection in adaptive filtering, in: SIGIR 2002: Proceedings of the 25th Annual International ACM
SIGIR Conference on Research and Development in Information Retrieval, 2002, pp. 81–88.

2374 F.S. Tsai et al. / Information Sciences 180 (2010) 2359–2374
[24] Y. Zhang, F.S. Tsai, Combining named entities and tags for novel sentence detection, in: ESAIR 2009: Proceedings of the WSDM Workshop on ExploitingSemantic Annotations in Information Retrieval, 2009, pp. 30–34.
[25] Y. Zhang, F.S. Tsai, Chinese novelty mining, in: EMNLP 2009: Proceedings of the Conference on Empirical Methods in Natural Language Processing,2009, pp. 1561–1570.
[26] Y. Zhang, F.S. Tsai, A.T. Kwee, Multilingual sentence categorization and novelty mining, Information Processing and Management: An InternationalJournal (2010) 1–19.
[27] L. Zhao, M. Zheng, S. Ma, The nature of novelty detection, Information Retrieval 9 (2006) 527–541.