evaluation of normalization methods to predict cyp3a4...
TRANSCRIPT

1521-009X/44/1/50–60$25.00 http://dx.doi.org/10.1124/dmd.115.065581DRUG METABOLISM AND DISPOSITION Drug Metab Dispos 44:50–60, January 2016Copyright ª 2015 by The American Society for Pharmacology and Experimental Therapeutics
Evaluation of Normalization Methods To Predict CYP3A4 Induction inSix Fully Characterized Cryopreserved Human Hepatocyte
Preparations and HepaRG Cells s
Hélène Vermet, Nathalie Raoust, Robert Ngo, Luc Esserméant, Sylvie Klieber, Gérard Fabre,and Xavier Boulenc
Drug Disposition Domain, Disposition, Safety and Animal Research Scientific Core Platform (H.V., N.R., R.N., S.K., G.F., X.B.);Biostatistics and Programming, Clinical Sciences & Operations, Scientific Core Platform (L.E.), Sanofi Recherche & Développement,
Montpellier, France
Received May 26, 2015; accepted October 13, 2015
ABSTRACT
Prediction of drug–drug interactions due to cytochrome P450isoform 3A4 (CYP3A4) overexpression is important because thisCYP isoform is involved in the metabolism of about 30% of clinicallyused drugs from almost all therapeutic categories. Therefore, it ismandatory to attempt to predict the potential of a new compound toinduce CYP3A4. Among several in vitro–in vivo extrapolation meth-ods recently proposed in the literature, an approach using a scalingfactor, called a d factor, for a given hepatocyte batch to provideextrapolation between in vitro induction data and clinical outcomehas been adopted by leading health authorities. We challenged therelevance of the calibration factor determined using a set of 15well-known clinical CYP3A4 inducers or the potent CYP3A4 inducer
rifampicin only. These investigations were conducted using sixbatches of human hepatocytes and an established HepaRG cell line.Our findings show that use of a calibration factor is preferable forclinical predictions, as shown previously by other investigators.Moreover, the present results also suggest that the accuracy ofprediction through calculation of this factor is sufficient whenrifampicin is considered alone, and the use of a larger set of fullycharacterized CYP3A4 clinical inducers is not required. For theestablished HepaRG cell line, the findings obtained in three exper-iments using a single batch of cells showa goodprediction accuracywith or without the d factor. Additional investigations with differentbatches of HepaRG cell lines are needed to confirm these results.
Introduction
Over the last 15 years, drug–drug interactions (DDI) have becomeone of the emerging topics in clinical drug development process(Boulenc and Barberan, 2011). In the late 1990s health authoritiesissued dedicated guidelines, which have been recently updated, relatedto the detection and consequences of DDIs (CDER 2011; CHMP 2012).The cytochrome P450 3A subfamily enzymes play a major role in themetabolism of about 30% of clinically used drugs from almost alltherapeutic categories (Zanger and Schwab, 2013). Therefore, CYP3A4isoform induction has been of particular interest, with several attempts topredict clinical consequences from in vitro results (Fahmi et al., 2008a,b;Almond et al., 2009; Fahmi and Ripp, 2010; Einolf et al., 2014).In the majority of reported cases, the induction mechanism is due to
activation of key transcription factors. Kliewer et al. (1998) firstidentified an orphan nuclear receptor, pregnane X receptor (PXR), thattranscriptionally activates the CYP3A gene by interacting with the PXRresponse elements in the genes. Even if the final physiologicallyrelevant effect is the enzyme activity, the mRNA increase is the most
intrinsic metric for investigating CYP induction. Indeed, the mRNAexpression data are in general more sensitive compared with enzymaticactivity for detecting induction in human hepatocytes, and give moreinformation if the drug is also a P450 inhibitor (Fahmi et al., 2010).Predictive mathematical models incorporating either induction alone
or induction in combination with inhibition mechanisms have beenapplied by a number of authors (Fahmi et al., 2008b; Shou et al., 2008;Fahmi and Ripp, 2010; Kirby et al., 2011; Templeton et al. 2011).Dynamic models based on an inducer concentration-time profile toaccount for the change in enzyme expression have also been proposed(Almond et al., 2009; Fahmi et al., 2009).Some years ago, a calibration factor approach was proposed, which
used a set of clinically well-known CYP3A4 inducers in a mathematicalstatic model (Fahmi et al., 2008a). In this method, a d factor wasdetermined for each in vitro human hepatocyte batch used in the assay.The d parameter represented an empirical calibration factor for thepurpose of in vitro to in vivo induction scaling, and its value wasestimated through correlation and minimization of predicted andobserved area under the curve (AUC) ratios for the set of knowninducers. The method initially proposed by Fahmi et al. (2008a) hasbeen adopted by the U.S. Food and Drug Administration in its DDIguidance (CDER 2011).
dx.doi.org/10.1124/dmd.115.065581.s This article has supplemental material available at dmd.aspetjournals.org.
ABBREVIATIONS: AUC, area under the curve; DMSO, dimethylsulfoxide; DDI, drug–drug interaction; Emax, maximal fold-induction; EC50,concentration resulting in half-maximal induction; fm, fraction metabolized; Fuhep, fraction unbound in hepatocytes; Fup, fraction unbound in plasma;GMFE, geometric mean fold error; LC-MS/MS, liquid chromatography with tandem mass spectrometry; MAE, mean absolute error; NPE, negativepredictive error; PPE, positive predictive error; PXR, pregnane X receptor; RMSE, root mean squared error; RMSLE, root mean squared logarithmicerror; SAPE, streptavidin-conjugated R-phycoerythrin.
50
http://dmd.aspetjournals.org/content/suppl/2015/10/14/dmd.115.065581.DC1Supplemental material to this article can be found at:
at ASPE
T Journals on M
ay 19, 2018dm
d.aspetjournals.orgD
ownloaded from

Human hepatocyte donors used in in vitro induction models show asubstantial interbatch variability due to considerable differences in thequality and viability of the isolated hepatocytes as well as interdonorvariability in their basal cytochrome P450 levels that consequentlyleads to variation in their respective levels of induction by an inducercompound (Shou et al., 2008). Such interindividual variability is notuncommon and imposes a degree of uncertainty in predicting theclinical consequences of induction. Therefore, alternatives to theuse of primary human hepatocyte cultures as models have beeninvestigated.Among these alternatives, the human HepaRG cell line is one of the
most suitable human hepatic cell lines due to the retention of key liverfunctionality (Kanebratt and Andersson, 2008; Turpeinen et al., 2009;Templeton et al. 2011). This model is considered useful for theevaluation of DDIs as most of the common CYP isoform activitieshave been measured in this cell line and shown to be both selectivelyinhibited and induced by prototypical CYP-selective inhibitors andinducers at comparable levels to those of primary cultures of humanhepatocytes (Turpeinen et al., 2009). Recently, in vitro HepaRGCYP3A4 induction data were used to predict a large number of DDIs.The investigators demonstrated similar predictive accuracy using theHepaRG cell line compared with the primary hepatocyte culture model(Grime et al., 2010).In the current work, d factor values have been determined, for each of
the six cryopreserved human hepatocyte batches as well as for theHepaRG cell line through the comparative use of both total andunbound plasma clinical Cmax values for 15 well-known inducers.Three approaches have been evaluated to establish optimal accuracy: 1)d not calculated (i.e., d = 1); 2) d value determination based on predictedand observed effects of rifampicin only; 3) d value estimated throughminimization of the distance between predicted and observed AUC
ratios for the set of 15 known inducers. To reach our conclusion in termsof the recommended method, we also took into account time andresources needed for each of them.
Materials and Methods
Compounds. Carbamazepine, nifedipine, phenobarbital, phenytoin, piogli-tazone, pleconaril, rifampicin, rifapentine, rosiglitazone, troglitazone, andaprepitant were purchased from Sigma-Aldrich (St. Louis, MO). Four proprie-tary compounds, obtained from Sanofi Research and Development, called SARA,SARB, SARC, and SARD were also selected based on the availability of theirclinical and in vitro induction results.
Chemicals. Dimethylsulfoxide (DMSO) and the cytotoxic references diclo-fenac, 4-hydroxytamoxifen, andmenadionewere purchased from Sigma-Aldrich(St. Louis, MO). All other chemicals and reagents used were obtained from usualcommercial sources, and were of the highest commercially available grade.
Cell Media for Cryopreserved Human Hepatocytes. The plating mediumwas composed of Ham’s F-12 and Williams’ E medium (50/50, v/v), bothpurchased from GIBCO/BRL (Bethesda, MD), supplemented with 10% de-complemented fetal calf serum (GIBCO, Paisley, United Kingdom), 10 mg/linsulin, 0.8 mg/l glucagon (Sigma-Aldrich, St. Louis, MO), 100 IU penicillin G,and 100 mg/ml streptomycin (GIBCO).
Culture medium was also composed of Ham’s F-12 and Williams’ E medium(50/50, v/v) that was devoid of serum but supplemented with 3.6 g/l HEPES,4 mg/l ethanolamine, 10 mg/l transferring, 1.4 mg/l linoleic acid-albumin,252 mg/l D-glucose, 44 mg/l sodium pyruvate, 50 mg/l ascorbic acid, 104 mg/larginine, and 0.7 g/l L-glutamine (all purchased from Sigma-Aldrich).
Cell Media for HepaRG Cells. The plating medium was composed ofWilliams’ E medium with Glutamax (GIBCO/BRL) and supplemented withHepaRG Thaw, Seed, and General Purpose Supplement (BIOPREDIC Interna-tional, Rennes, France). For culture, Williams’ E medium with Glutamax wassupplemented with HepaRG Serum-free Induction Supplement (BIOPREDICInternational). Cells were seeded onto 48-well collagen I–coated plates purchasedfrom BD Biosciences (Bedford, MA).
Human Hepatocytes and HepaRG Cells. Six batches of plateablecryopreserved human hepatocytes were used. They were obtained fromGIBCO/Life Technologies (Carlsbad, CA) for CD-Hu4237 and CD-Hu8084,from BD Gentest (Woburn, MA) for BD-281 and BD-295, from Bioreclamation(Baltimore, MD) for IVT-IBG, and from In Vitro ADMET Laboratories(Columbia, MA) for HH1024. One single batch of cryopreserved HepaRG cells(1247818) was obtained from GIBCO/Life Technologies.
Thawing Procedures for Cryopreserved Human Hepatocytes andHepaRG Cells. Briefly, the vials containing the cryopreserved cells wereremoved from liquid nitrogen storage, thawed in a 37�C water bath (75–90seconds), and then quickly poured into prewarmed seeding medium followingthe vendor’s protocol. Experiments with the same batch of HepaRG cells wereperformed using three independent thawings to investigate the reproducibility ofthe effects of the panel of inducers (interstudy variability).
Human Hepatocyte Cell Culture and Treatment. Before seeding, cellviability was estimated using the Trypan blue dye exclusion test. The humanhepatocyte cell density was adjusted to 0.8� 106 viable cells per ml of medium.
TABLE 1
Cell donor information
Identification Supplier Donor Characteristics
CD-Hu4237 GIBCO/LifeTechnologies
Female, 57 year old, Caucasian, anoxia
BD-295 BD Gentest Female, 41 year old, Caucasian, anoxiaIVT-IBG Bioreclamation Female, 67 year old, Caucasian, anoxiaBD-281 BD Gentest Female, 49 year old, Caucasian, CVACD-Hu8084 GIBCO/Life
TechnologiesFemale, 59 year old, Caucasian, CVA
HH1024 In Vitro ADMETLaboratories
Male, 48 year old, Caucasian, anoxia,CVA
HepaRG GIBCO/LifeTechnologies
Female, adult, hepatocarcinoma
CVA, cerebrovascular accident.
TABLE 2
Metabolic capacity assessment of human hepatocyte preparations
Hepatocyte PreparationPhenacetin O-Deethylase
(CYP1A2)aTolbutamide-Hydroxylase
(CYP2C9)aDextromethorphan O-Demethylase
(CYP2D6)aMidazolam 1ʹ-Hydroxylase
(CYP3A)a
CD-Hu4237 0.169 0.005 0.233 0.428BD-295 0.171 0.027 0.896 0.536IVT-IBG 0.551 0.057 2.003 0.764BD-281 0.894 0.066 ND 1.002CD-Hu8084 0.182 0.088 0.286 0.167HH1024 1.175 0.090 0.840 0.640Reference historical data
n 82 83 100 85Mean 6 S.D. 0.978 6 0.782 0.055 6 0.035 0.812 6 0.787 0.746 6 0.597
ND, not determined.aExpressed in nmol/h/106 hepatocytes.
Normalization Methods To Predict CYP3A4 Induction 51
at ASPE
T Journals on M
ay 19, 2018dm
d.aspetjournals.orgD
ownloaded from

The hepatocytes were then seeded onto collagen I–coated 48-well plates at0.16 � 106 viable cells per well in 200 ml of medium. Plating efficiency wasevaluated around 4 hours after seeding for the hepatocytes and then daily over the2 additional days of culture in the presence of CYP inducers. Cells were cultured ina 37�C thermostatically controlled incubator with 5%CO2 and 95% relative humidity.
After the cell attachment period, the plating medium was removed, and thehepatocytes were treated daily for 2 consecutive days (approximately 48 hours),with 100ml per well of fresh culture medium containing either the vehicle control(DMSO) or the investigated compounds at eight preoptimized concentrations(based on compounds’ cytotoxicity, solubility, and EC50 [concentration resultingin half-maximal induction] found in literature) ranging from 0.01 to 30 mM forrifampicin, rifapentine, aprepitant, and troglitazone, from 0.01 to 60 mM forSARD, from 0.03 to 100 mM for pioglitazone, SARB, and SARA, from 0.1 to300mM for nifedipine, phenytoin, rosiglitazone, SARC, and pleconaril, from 0.3to 1000 mM for carbamazepine, and from 1 to 3000 mM for phenobarbital. Foreach batch of hepatocytes, two separate wells for each concentration of a testcompound were prepared. The final solvent (DMSO) concentration in the incuba-tion medium ranged from 0.1% to 1% (depending on compound solubility). Forincubations in the absence of compound (vehicle control), DMSO, as vehicle, wasadded, to incubation medium to provide the same final solvent concentration rangeof 0.1% to 1% as that used for the test compounds. Cell donor information issummarized in Table 1. Basal enzymatic activities for each human hepatocytebatch are summarized and compared with historical data in Table 2.
HepaRG Cell Culture and Treatment. Before seeding, cell viability wasestimated using the Trypan blue dye exclusion test. The HepaRG cell density wasadjusted to 1.2 � 106 viable cells/ml of medium. The HepaRG cells were thenseeded onto collagen I–coated 48-well plates at 0.36 � 106 viable cells per wellin 300 ml of medium. Plating efficiency was evaluated around 6 hours afterseeding and daily over the 2 additional days of culture in the presence of CYPinducers. Cells were cultured in a 37�C thermostatically controlled incubatorwith 5% CO2 and 95% relative humidity. After a cell attachment period of 3days, the plating medium was removed, and the HepaRG cells were treated dailyfor 2 consecutive days under the same conditions as described earlier for humanhepatocytes. Basal enzymatic activities are summarized in Table 3.
Assessment of Test Compounds Cytotoxicity. Microscopical examinationof hepatocyte morphology was used to evaluate cytotoxicity during incubation ofeach test compound. Moreover, to quantify the potential cytotoxic effects of thecompounds in each experiment, a cytotoxicity assessment was also performed inparallel to the induction experiments. Specifically, test compound cytotoxicitywas evaluated using an in vitro toxicity kit that measured ATP levels in the cellsafter a 48-hour exposure period to the test compound (CellTiter-Glo; Promega,Madison, WI).
Assessment of Test Compounds Stability. The concentration, in medium,of each compound was measured at three different time points (0, 2, and 24hours, in duplicate) during the last day of their respective incubation period todetermine the exposure of human hepatocytes to the incubated compounds.Liquid chromatography with tandem mass spectrometry (LC-MS/MS) analy-ses were performed using an Acquity UPLC System I-Class, equipped with aWaters Acquity UPLC BEH C18 column (2.1 mm i.d. � 100 mm length,1.7 mm particle size) coupled to a Xevo TQS mass spectrometer (all fromWaters, Milford, MA).
The percentage of remaining compound at 2 or 24 hours was calculated asfollows:
Test compound stability ¼ ½Compound�2h or 24h½Compound�0h
� 100
Induction Assay. Quantification of CYP3A4 mRNA induction wasperformed using the Quantigene Plex 2.0 technology. The reagents used in theassay, including bDNA molecules (preamplifier, amplifier, label probe, andstreptavidin-conjugated R-phycoerythrin [SAPE]), were obtained from theQuantiGene Plex 2.0 assay kit (Affymetrix, Santa Clara, CA). After a 48-hourincubation period with the test compounds, the cell culture medium wasremoved, and the cells were lysed with 100 ml of diluted lysis mixture bufferto release the RNA. Specific mRNA transcripts for CYP3A4 and b2-micro-globulin (b2M, the housekeeping gene) were captured on their respective beadsthrough a specific probe interaction during an overnight hybridization. Unboundmaterials were washed from the beads (complexed with probe set and mRNA)using a Hydroflex magnetic plate washer (Tecan, Männedorf, Switzerland). Thesignal was amplified by a sequential hybridization of DNA probes (2.0preamplifier, 2.0 amplifier and biotinylated labeled probe, respectively) for 1hour at 50�C. Three washes were performed after each hybridization step. After afinal wash, SAPE was added, and the beads were incubated for 30 minutes at roomtemperature. The beadswere thenwashed to remove unboundSAPE, and the sampleswere analyzed on a Luminex 200 system (Luminex, Austin, TX) or a Bio-Plex 200system (Bio-Rad Laboratories, Hercules, CA). The levels of SAPE fluorescence wereproportional to the amounts of mRNA transcripts captured by the beads.
TABLE 3
Metabolic capacity assessment of HepaRG cells
Cell PreparationPhenacetin
O-Deethylase(CYP1A2)a
Bupropion-Hydroxylase(CYP2B6)a
Midazolam1ʹ-Hydroxylase(CYP3A)a
HepaRG cells (1247818) 0.300 0.402 2.298
TABLE 4
Clinical trials used in the analyses
Total of 23 trials and 18 victim CYP3A4 substrate/perpetrator inducer compound pairs for the set of 15 test inducer compounds. Fup isthe fraction unbound in plasma and Fuhep is the fraction unbound in the in vitro hepatocyte model of each of the test inducer compounds.
Perpetrator Victim No. of TrialsReference
(Supplemental Data)AUC Ratio Observed Fup Fuhep
Carbamazepine Simvastatin 1 1 0.26 0.25 0.52Nifedipine Midazolam 1 2 1 0.05 0.90Phenytoin Midazolam 1 3 0.06 0.80 0.83Phenytoin Quetiapine 1 4 0.2 0.80 0.83SARA Midazolam 1 5 0.82 0.01 0.07SARB Midazolam 1 6 0.73 0.08 0.89Pioglitazone Midazolam 1 7 0.74 0.01 0.80Pioglitazone Simvastatin 1 8 0.98 0.01 0.80Rifampicin Midazolam 1 9 0.08 0.25 0.42Rifampicin Simvastatin 1 10 0.1 0.25 0.42Rifapentine (4 doses) Midazolam 4 11 0.07; 0.07; 0.07; 0.07 0.01 0.57Phenobarbital Nifedipine 1 12 0.39 0.50 1.00Troglitazone Midazolam 1 13 0.33 0.01 0.22Rosiglitazone Nifedipine 1 14 1 0.01 0.87SARC (3 doses) Midazolam 3 15 0.67; 0.57; 0.33 0.01 0.68SARD Midazolam 1 16 0.2 0.01 0.94Pleconaril Midazolam 1 17 0.65 0.01 0.13Aprepitant Midazolam 1 18 0.78 0.01 0.09
52 Vermet et al.
at ASPE
T Journals on M
ay 19, 2018dm
d.aspetjournals.orgD
ownloaded from

Two duplicate assays (n = 2) were performed for all the described ex-perimental samples. All multiplex data were derived from measuring medianreporter fluorescence from 50 beads per gene per well assayed, and werepresented as median fluorescence intensity. All data were corrected for back-ground signals determined in the absence of target mRNAs. The gene of interestand the housekeeping gene (b2-microglobulin, b2M) levels (median fluores-cence intensity) were both determined in two different tubes of the same sample,and themean of the two values was determined. Thereafter, the measured amountof the gene of interest was normalized to the levels of the housekeeping gene inthe same sample.
All results were expressed as the expression level of the investigated gene in thetreated-hepatocytes, relative to control conditions (calibrator).The calibrator usedwas “untreated hepatocytes” (i.e., hepatocytes treated over the same period of timewith DMSO alone). The fold-induction for each investigated compound relative tothe level of vehicle control mRNA expression was calculated as follows:
Fold-induction relative to vehicle control ¼ Ecompound�Evehicle control
with Evehicle control for mRNA expression equal to 1:
Fold-induction was calculated for each concentration of test compound and foreach individual hepatocyte preparation. The maximal fold-induction (Emax) andthe concentration resulting in half-maximal induction (EC50) of CYP3A4 foreach compound were determined after fitting of the fold-induction values to asigmoidal curve, using biost@t-speed (internal software).
In Vitro–In Vivo Prediction of CYP Induction: Determination of thed Value. The d parameter in eq. 1 represents an empirical calibration factor forthe purpose of in vitro–in vivo induction scaling. A unique value was determinedfor each human hepatocyte batch and for each HepaRG experiment. This valuewas determined through comparison of the predicted and observed exposureratio [AUCi/AUC, i.e., clinically observed ratio of area under the curve plasmaconcentration/time of the relevant administered CYP3A4 probe substrate, in thepresence (AUCi) and absence of the inducer compound (AUC)] for differentCYP3A4 probe substrates such as midazolam, nifedipine, or simvastatin. Thisequation only considers the potential induction effect of a compound onCYP3A4 expressed in the liver. The plasma concentration, Cmax, of theperpetrator (inducer compound) in the corresponding clinical trials was eitherexpressed as its unbound concentration, with Fup incorporated into the equationor total concentration (without Fup in the equation). When unbound Cmax wasused, the in vitro EC50 was also corrected for the unbound fraction of test
compound in the hepatocyte assay (i.e., Fuhep), which was calculated using aquantitative structure-activity relationship (QSAR) model as previously de-scribed elsewhere (Kilford et al., 2008). Fup and Fuhep values for each testcompound are reported in Table 4.
AUCi
AUC¼ 1�
1þ d�Emax�½Inducer�EC50þ½Inducer�
�� fmþ ð12 fmÞ
ð1Þ
where fm is the fraction of the substrate probe drug metabolized by CYP3A4(e.g., 0.91 for midazolam), [Inducer] is the unbound or total plasma concentra-tion of the perpetrator inducer (i.e., Cmax), and d factor, EC50, and Emax are aspreviously defined.
Data Set and Analysis. Three approaches were evaluated: 1) d not calculated(d = 1); 2) d value determination based on the predicted (with eq. 1) and observedeffects of rifampicin alone; and 3) d value estimated through minimization of thedistance between the predicted (calculated with eq. 1) and observed AUC ratiosfor the set of the 15 well-known inducers, using the Brent’s method in “optim”
function of R software version 3.0 (www.r-project.org).The retained distances were GMFE (geometric mean fold error), RMSE (root
mean squared error), RMSLE (root mean squared logarithmic error), and MAE(mean absolute error), which are defined as the following:
GMFE ¼ 10
+
���Log Predicted AUC ratioObserved AUC ratio
���n
RMSE ¼
ffiffiffiffiffiffiffiffiffiffiffiffiffiffiffiffiffiffiffiffiffiffiffiffiffiffiffiffiffiffiffiffiffiffiffiffiffiffiffiffiffiffiffiffiffiffiffiffiffiffiffiffiffiffiffiffiffiffiffiffiffiffiffiffiffiffiffiffiffiffiffiffiffiffiffiffiffiffiffiffiffiffiffiffiffiffiffiffiffiffiffiffiffi+
�Predicted AUC ratio-Observed AUC ratio
�2
n
vuut
RMSLE ¼ffiffiffiffiffiffiffiffiffiffiffiffiffiffiffiffiffiffiffiffiffiffiffiffiffiffiffiffiffiffiffiffiffiffiffiffiffiffiffiffiffiffiffiffiffiffiffiffiffiffiffiffiffiffiffiffiffiffiffiffiffiffiffiffiffiffiffiffiffiffiffiffiffiffiffiffiffiffiffiffiffiffiffiffiffiffiffiffiffiffiffiffiffiffiffiffiffiffiffiffiffiffiffiffiffiffiffiffiffiffiffiffiffiffiffiffiffiffiffi+
ðLogðPredicted AUC ratioÞ-LogðObserved AUC ratioÞÞ2n
s
MAE ¼ +jPredicted AUC ratio-Observed AUC ratioj
n
In each case, the scaling factor d was estimated per batch using allperpetrator compounds except one to simulate real conditions (wheninducer potency of a new chemical entity is investigated). The AUC ratioof the remaining perpetrator was then predicted using the optimal d. This
Fig. 1. Schematic presentation of the statis-tical investigations workflow when all inducers(23 clinical trials in total, called method 3 inMaterials and Methods) are used, with methodscomparison.
Normalization Methods To Predict CYP3A4 Induction 53
at ASPE
T Journals on M
ay 19, 2018dm
d.aspetjournals.orgD
ownloaded from

approach avoids an optimistic estimation of the error, as estimation of d andprediction of the AUC ratio were not performed on the same set of data (see Fig. 1).
The predictions were classified as true positives or true negatives withrespect to the potential induction effect of the test compound if both thepredicted and observed AUC ratios were #0.8-fold (20% decrease in AUC)or .0.8-fold, respectively. Predictions were classified as false positives or falsenegatives with respect to the potential induction effect if the observed AUC ratioswere not predicted appropriately within the 0.8-fold cutoff criteria.
To compare the relative predictability of the different methods, the positivepredictive error (PPE) and the negative predictive error (NPE) values werecalculated using the following equations:
PPE ¼ FP
FPþ TP� 100%
NPE ¼ FN
FN þ TN� 100%
The PPE is defined as the proportion of in vitro studies that predicted a risk butfor which no clinical DDI was observed. The NPE is the proportion of studiesthat were predicted as providing no risk of induction but actually demonstrated a
DDI risk. The lowest PPE, NPE, GMFE, and RMSE values obtained indicatedthe best prediction outcomes.
Methods were compared through use of the predicted to observed AUCratios for the victim substrate probe by considering the number of predictionswithin a 2-fold error (0.5 # predicted/observed AUC ratio # 2.0). Among themethods employed to investigate the four minimization processes, only the bestone, based on quality criteria described earlier, was selected for this last compar-ison. Statistical investigations and method comparison are summarized in Fig. 1.
Results
Viability and Morphology of the Cultured Hepatocytes. Hepa-tocyte cultures were evaluated daily by phase-contrast microscopy, andwere considered to exhibit normal hepatocyte morphology for initiatingexperiments when the confluence ranged between 80% and 100%.Daily morphologic observations indicated that human hepatocytes
treated with vehicle (0.1% to 1% DMSO) exhibited normal hepatocytemorphology. These observations, supported by the ATP content mea-surements performed on the last day of incubation (after 48 hours),
TABLE 5
Summary of in vitro induction parameters from test compound concentration/fold change in CYP3A4 mRNA curvesobtained with the six human cryopreserved hepatocyte batches
Test DrugCYP3A4 mRNA Expression
CD-Hu4237 BD-295 IVT-IBG BD-281 CD-Hu8084 HH1024 Mean S.D.
CarbamazepineEC50 (mM) 35 59 36 98 95 29 59 31Emax (FI) 19 15 9.3 13 19 21 16 4.4
NifedipineEC50 (mM) 12 13 13 66 23 14 23 21Emax (FI) 14 41 9.1 9.1 15 30 20 13
PhenytoinEC50 (mM) 13 12 32 38 41 10 24 14Emax (FI) 15 8.7 9.1 7.3 6.8 10 9.5 3.0
SARAEC50 (mM) 1.7 3.2 2.4 7.5 ND ND 3.7 2.6Emax (FI) 15 8.9 2.6 5.8 ND ND 8.0 5.1
SARBEC50 (mM) 4.3 3.3 4.2 7.6 11 3.1 5.6 3.1Emax (FI) 14 15 5.3 3.2 5.7 10 8.9 4.9
PioglitazoneEC50 (mM) 13 11 12 29 21 10 16 7.5Emax (FI) 4.3 7.9 4.3 12 10 4.3 7.2 3.5
RifampicinEC50 (mM) 0.32 0.94 0.62 1.1 2.8 0.40 1.0 0.91Emax (FI) 30 141 24 30 50 65 57 44
RifapentineEC50 (mM) 0.42 2.1 0.89 2.6 1.4 0.61 1.3 0.86Emax (FI) 25 122 15 23 22 55 44 41
PhenobarbitalEC50 (mM) 261 240 239 338 480 300 310 92Emax (FI) 26 89 14 19 21 36 34 28
TroglitazoneEC50 (mM) 2.9 1.6 4.1 3.9 4.4 2.4 3.2 1.1Emax (FI) 26 68 21 22 35 55 38 19
RosiglitazoneEC50 (mM) 14 11 16 16 17 13 14 2.0Emax (FI) 12 5.8 7.3 14 19 19 13 5.7
SARCEC50 (mM) 5.4 2.8 5.9 9.3 2.8 6.0 5.4 2.4Emax (FI) 25 37 14 18 31 24 25 8.6
SARDEC50 (mM) 3.8 6.7 12 5.3 ND 6.4 6.8 3.0Emax (FI) 14 13 4.7 28 ND 14 15 8.3
PleconarilEC50 (mM) 13 11 23 ND ND ND 16 6.7Emax (FI) 5.9 12 2.8 ND ND ND 7.0 4.8
AprepitantEC50 (mM) ND ND ND 3.5 2.3 3.1 3.0 0.61Emax (FI) ND ND ND 10 6.5 7.6 8.1 2.0
FI, fold induction; ND, not determined.
54 Vermet et al.
at ASPE
T Journals on M
ay 19, 2018dm
d.aspetjournals.orgD
ownloaded from
showed that most of the test compounds did not exhibit any cytotoxiceffects when used at concentrations up to 1000 mM. Cytotoxic con-centrations of test drugs for each hepatocyte preparation and HepaRGexperiment are summarized in the Supplemental Data.Stability of Compounds. The remaining concentration of each
parent test compound in culture medium was determined by LC-MS/MSat various time points (0, 2, and 24 hours, in duplicate) during the secondday of incubation to check that cells were well exposed to test compound.These analyses demonstrated that human hepatocytes and HepaRG cellswere well exposed to unchanged drug for the majority of the testedcompounds, at least at the highest noncytotoxic concentrations. For thelowest concentrations of nifedipine, pioglitazone, rosiglitazone, troglita-zone, SARA, and SARB (i.e., the worst case), hepatocytes were wellexposed after 2 hours of incubation while at least 80% of each respectiveparent compound had been metabolized at the last 24-hour sampling timepoint for at least one batch. Compounds concentrations and percentagesremaining at 24 hours are presented in the Supplemental Data.
Effect of Test Compound Treatment on the CYP3A4 mRNAExpression in Human Hepatocytes and HepaRG Cells. The clinicaltrials (n = 23) used in this analysis are referenced in Table 4. The 15compounds were each tested in three to six different batches ofcryopreserved human hepatocytes and three thawings of HepaRGcells, using CYP3A4 mRNA fold-induction as an end-point measure-ment. Dose–response data were fitted using a sigmoidal Emax model,and EC50 and Emax values were determined (Tables 5 and 6, Fig. 3).Representative dose–response curves, obtained with rifampicin in thedifferent human hepatocyte preparations and HepaRG cells, areillustrated in Fig. 2. Only dose–response curves that fitted the followingacceptance criteria were used. The dose-response curve had at least sixdata points. Though more than six concentrations were typically tested,some dose–response curves were bell-shaped due to compoundcytotoxicity, solubility limitations, or other factors, and in these cases,data points at higher concentrations were excluded for EC50 and Emax
calculations. A sigmoidal model fitted the dose-response data with less
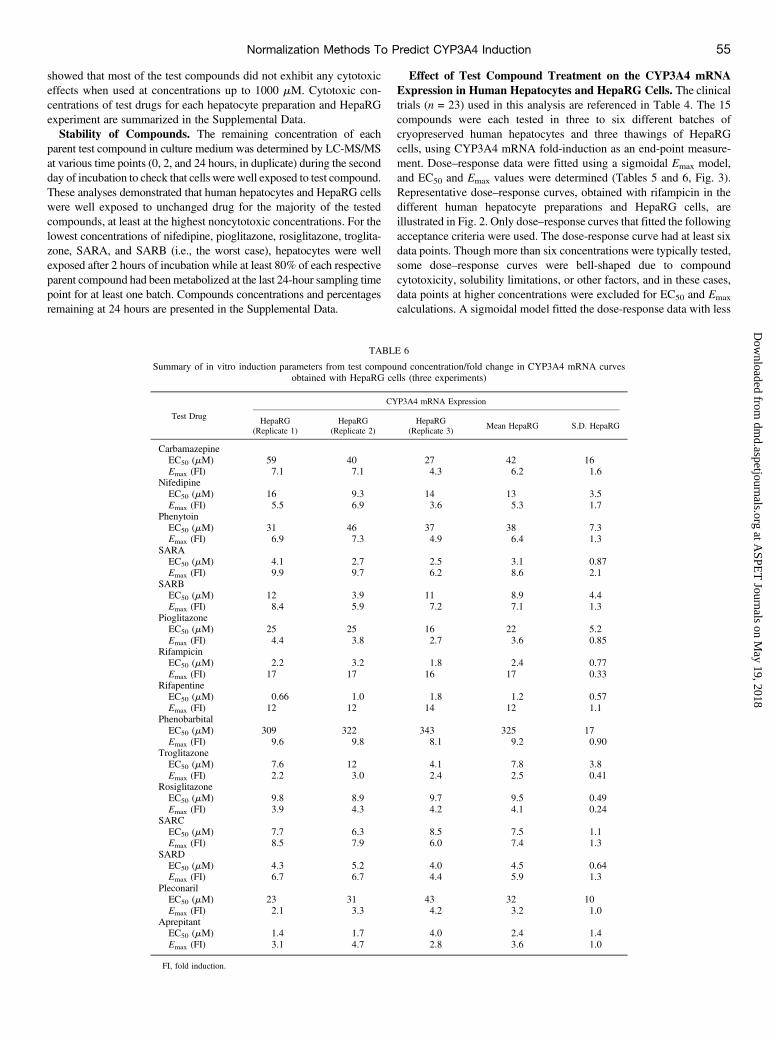
TABLE 6
Summary of in vitro induction parameters from test compound concentration/fold change in CYP3A4 mRNA curvesobtained with HepaRG cells (three experiments)
Test Drug
CYP3A4 mRNA Expression
HepaRG(Replicate 1)
HepaRG(Replicate 2)
HepaRG(Replicate 3)
Mean HepaRG S.D. HepaRG
CarbamazepineEC50 (mM) 59 40 27 42 16Emax (FI) 7.1 7.1 4.3 6.2 1.6
NifedipineEC50 (mM) 16 9.3 14 13 3.5Emax (FI) 5.5 6.9 3.6 5.3 1.7
PhenytoinEC50 (mM) 31 46 37 38 7.3Emax (FI) 6.9 7.3 4.9 6.4 1.3
SARAEC50 (mM) 4.1 2.7 2.5 3.1 0.87Emax (FI) 9.9 9.7 6.2 8.6 2.1
SARBEC50 (mM) 12 3.9 11 8.9 4.4Emax (FI) 8.4 5.9 7.2 7.1 1.3
PioglitazoneEC50 (mM) 25 25 16 22 5.2Emax (FI) 4.4 3.8 2.7 3.6 0.85
RifampicinEC50 (mM) 2.2 3.2 1.8 2.4 0.77Emax (FI) 17 17 16 17 0.33
RifapentineEC50 (mM) 0.66 1.0 1.8 1.2 0.57Emax (FI) 12 12 14 12 1.1
PhenobarbitalEC50 (mM) 309 322 343 325 17Emax (FI) 9.6 9.8 8.1 9.2 0.90
TroglitazoneEC50 (mM) 7.6 12 4.1 7.8 3.8Emax (FI) 2.2 3.0 2.4 2.5 0.41
RosiglitazoneEC50 (mM) 9.8 8.9 9.7 9.5 0.49Emax (FI) 3.9 4.3 4.2 4.1 0.24
SARCEC50 (mM) 7.7 6.3 8.5 7.5 1.1Emax (FI) 8.5 7.9 6.0 7.4 1.3
SARDEC50 (mM) 4.3 5.2 4.0 4.5 0.64Emax (FI) 6.7 6.7 4.4 5.9 1.3
PleconarilEC50 (mM) 23 31 43 32 10Emax (FI) 2.1 3.3 4.2 3.2 1.0
AprepitantEC50 (mM) 1.4 1.7 4.0 2.4 1.4Emax (FI) 3.1 4.7 2.8 3.6 1.0
FI, fold induction.
Normalization Methods To Predict CYP3A4 Induction 55
at ASPE
T Journals on M
ay 19, 2018dm
d.aspetjournals.orgD
ownloaded from

than 20% EC50 coefficient of variation. The responses of the humanhepatocytes and HepaRG cells in the presence of the positive control(i.e., rifampicin) were within the normal ranges reported in the literature:CYP3A4 gene expression was potently increased, with mean Emax at57-fold6 44 and 17-fold6 0.33, and mean EC50 at 1.06 0.91mMand2.4 6 0.77 mM, respectively.The 15 tested compounds (references and proprietary sanofi
compounds) induced CYP3A4 gene expression in all the humanhepatocyte donors, with mean EC50 values ranging from 1.0 60.91 mM for rifampicin to 310 6 92 mM for phenobarbital, and meanEmax values ranging from 7.06 4.8-fold for pleconaril to 576 44-foldfor rifampicin.The tested compounds also induced CYP3A4 gene expression in
HepaRG cells, with mean EC50 values ranging from 1.26 0.57 mM forrifapentine to 325 6 17 mM for phenobarbital, and mean Emax values
ranging from 2.5 6 0.41-fold for troglitazone to 17 6 0.33-fold forrifampicin.Determination of the d Value for the Human Hepatocyte
Batches. For each human hepatocyte batch, the scaling parameter dwasdetermined using the three approaches described in the Materials andMethods section: 1) d value = 1; 2) d value determination based onpredicted and observed effects of rifampicin alone; and 3) d valueestimated through minimization of the distance between predicted andobserved AUC ratios for the set of 15 well-known inducers with fourretained distances (GMFE, RMSE, RMSLE, and MAE). The threemethods were evaluated using different values for the hepatic inducerplasma concentration: unbound (with Fup) or total (without Fup) Cmax.To compare the relative predictability of the different methods, GMFEand RMSE were calculated as quality prediction criteria. Consideringthe overall total six batches, predicted versus observed AUC ratios, in
Fig. 2. Representative concentration–responsecurves for rifampicin obtained with biost@t-speedsoftware. Shown are (A) six cryopreserved hepa-tocyte batches and (B) results for three inde-pendent thawing periods used for single batch ofHepaRG cells.
Fig. 3. In vitro induction parameters EC50 (A, B) and Emax (C, D) obtained with six human cryopreserved hepatocyte batches (left) and HepaRG cells (three independentthawing periods) (right), derived from the test compound concentration–fold change in CYP3A4 mRNA curves.
56 Vermet et al.
at ASPE
T Journals on M
ay 19, 2018dm
d.aspetjournals.orgD
ownloaded from
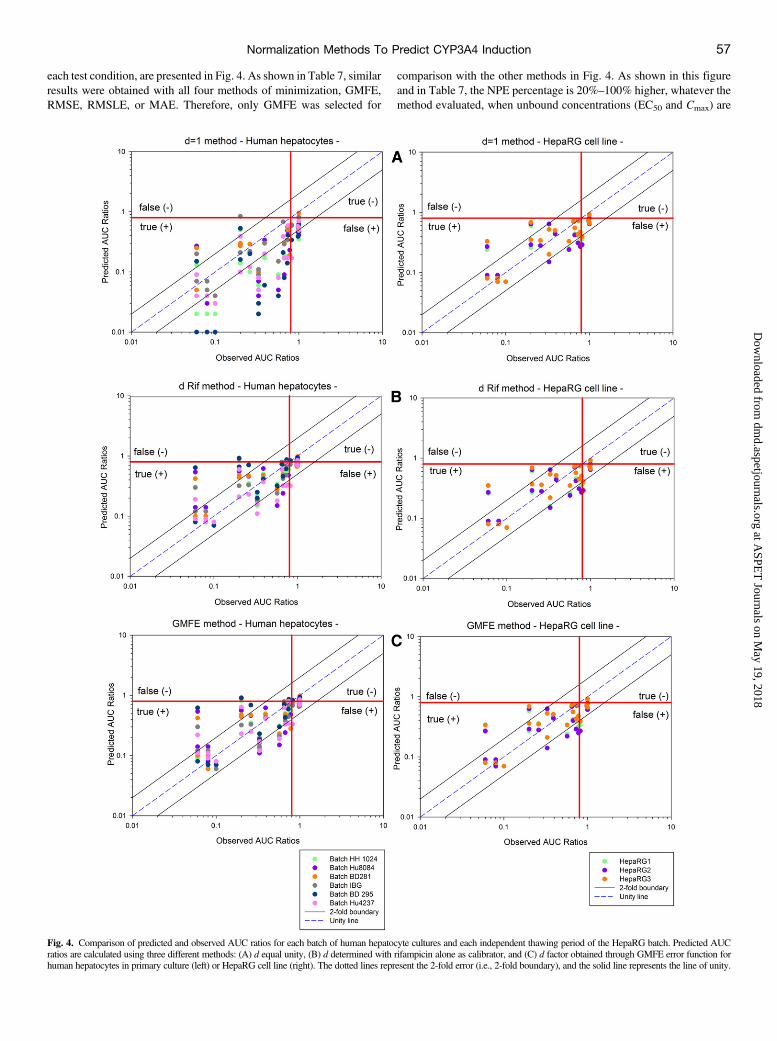
each test condition, are presented in Fig. 4. As shown in Table 7, similarresults were obtained with all four methods of minimization, GMFE,RMSE, RMSLE, or MAE. Therefore, only GMFE was selected for
comparison with the other methods in Fig. 4. As shown in this figureand in Table 7, the NPE percentage is 20%–100% higher, whatever themethod evaluated, when unbound concentrations (EC50 and Cmax) are
Fig. 4. Comparison of predicted and observed AUC ratios for each batch of human hepatocyte cultures and each independent thawing period of the HepaRG batch. Predicted AUCratios are calculated using three different methods: (A) d equal unity, (B) d determined with rifampicin alone as calibrator, and (C) d factor obtained through GMFE error function forhuman hepatocytes in primary culture (left) or HepaRG cell line (right). The dotted lines represent the 2-fold error (i.e., 2-fold boundary), and the solid line represents the line of unity.
Normalization Methods To Predict CYP3A4 Induction 57
at ASPE
T Journals on M
ay 19, 2018dm
d.aspetjournals.orgD
ownloaded from
incorporated, but it has a tendency to lead to higher values of PPE(Table 7). Allocating the scaling parameter d to a value of 1 provides thelowest accuracy in comparison with using a calculated scaling value[GMFE = 2.5, 46% within 2-fold (Table 7)]. Moreover, there was atrend for more-biased predictions toward overprediction of inductionwhen d = 1, with the higher PPE value (16%) (Table 7 and Fig. 4).Hence, the determination of a d factor calculated for each hepatocytebatch is the method of choice.
The method using the full set of 15 compounds to calculate d valuesdid not increase the quality criteria compared with the method usingrifampicin alone. As shown in Table 7, the quality criteria RMSE,GMFE,NPE and PPE were similar, with both methods reflecting no improve-ment in the prediction when the set of compounds are used, when totalCmax is considered. In addition, comparison of both methods indicatesthat the d values are equivalent for a given tested human hepatocyte batch,despite having clearly different d values (range: 0.10–0.56) in the two
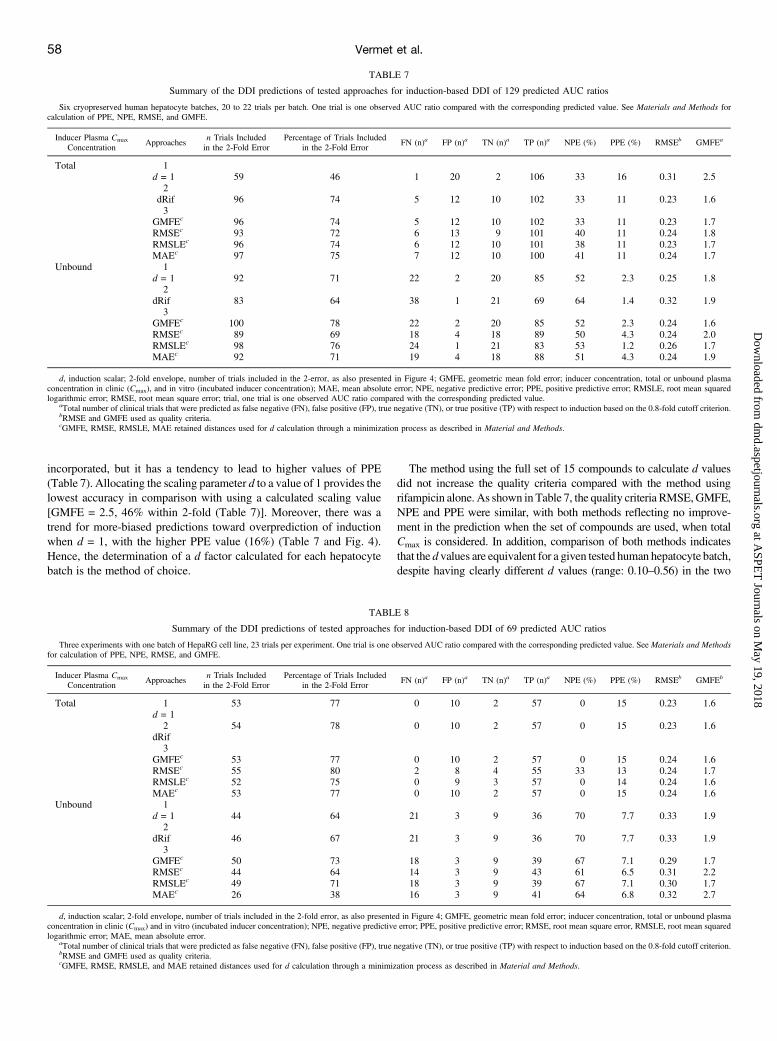
TABLE 8
Summary of the DDI predictions of tested approaches for induction-based DDI of 69 predicted AUC ratios
Three experiments with one batch of HepaRG cell line, 23 trials per experiment. One trial is one observed AUC ratio compared with the corresponding predicted value. See Materials and Methodsfor calculation of PPE, NPE, RMSE, and GMFE.
Inducer Plasma Cmax
ConcentrationApproaches
n Trials Includedin the 2-Fold Error
Percentage of Trials Includedin the 2-Fold Error
FN (n)a FP (n)a TN (n)a TP (n)a NPE (%) PPE (%) RMSEb GMFEb
Total 1 53 77 0 10 2 57 0 15 0.23 1.6d = 1
2 54 78 0 10 2 57 0 15 0.23 1.6dRif
3GMFEc 53 77 0 10 2 57 0 15 0.24 1.6RMSEc 55 80 2 8 4 55 33 13 0.24 1.7RMSLEc 52 75 0 9 3 57 0 14 0.24 1.6MAEc 53 77 0 10 2 57 0 15 0.24 1.6
Unbound 1d = 1 44 64 21 3 9 36 70 7.7 0.33 1.9
2dRif 46 67 21 3 9 36 70 7.7 0.33 1.9
3GMFEc 50 73 18 3 9 39 67 7.1 0.29 1.7RMSEc 44 64 14 3 9 43 61 6.5 0.31 2.2RMSLEc 49 71 18 3 9 39 67 7.1 0.30 1.7MAEc 26 38 16 3 9 41 64 6.8 0.32 2.7
d, induction scalar; 2-fold envelope, number of trials included in the 2-fold error, as also presented in Figure 4; GMFE, geometric mean fold error; inducer concentration, total or unbound plasmaconcentration in clinic (Cmax) and in vitro (incubated inducer concentration); NPE, negative predictive error; PPE, positive predictive error; RMSE, root mean square error, RMSLE, root mean squaredlogarithmic error; MAE, mean absolute error.
aTotal number of clinical trials that were predicted as false negative (FN), false positive (FP), true negative (TN), or true positive (TP) with respect to induction based on the 0.8-fold cutoff criterion.bRMSE and GMFE used as quality criteria.cGMFE, RMSE, RMSLE, and MAE retained distances used for d calculation through a minimization process as described in Material and Methods.
TABLE 7
Summary of the DDI predictions of tested approaches for induction-based DDI of 129 predicted AUC ratios
Six cryopreserved human hepatocyte batches, 20 to 22 trials per batch. One trial is one observed AUC ratio compared with the corresponding predicted value. See Materials and Methods forcalculation of PPE, NPE, RMSE, and GMFE.
Inducer Plasma Cmax
ConcentrationApproaches
n Trials Includedin the 2-Fold Error
Percentage of Trials Includedin the 2-Fold Error
FN (n)a FP (n)a TN (n)a TP (n)a NPE (%) PPE (%) RMSEb GMFEa
Total 1d = 1 59 46 1 20 2 106 33 16 0.31 2.5
2dRif 96 74 5 12 10 102 33 11 0.23 1.63
GMFEc 96 74 5 12 10 102 33 11 0.23 1.7RMSEc 93 72 6 13 9 101 40 11 0.24 1.8RMSLEc 96 74 6 12 10 101 38 11 0.23 1.7MAEc 97 75 7 12 10 100 41 11 0.24 1.7
Unbound 1d = 1 92 71 22 2 20 85 52 2.3 0.25 1.8
2dRif 83 64 38 1 21 69 64 1.4 0.32 1.9
3GMFEc 100 78 22 2 20 85 52 2.3 0.24 1.6RMSEc 89 69 18 4 18 89 50 4.3 0.24 2.0RMSLEc 98 76 24 1 21 83 53 1.2 0.26 1.7MAEc 92 71 19 4 18 88 51 4.3 0.24 1.9
d, induction scalar; 2-fold envelope, number of trials included in the 2-error, as also presented in Figure 4; GMFE, geometric mean fold error; inducer concentration, total or unbound plasmaconcentration in clinic (Cmax), and in vitro (incubated inducer concentration); MAE, mean absolute error; NPE, negative predictive error; PPE, positive predictive error; RMSLE, root mean squaredlogarithmic error; RMSE, root mean square error; trial, one trial is one observed AUC ratio compared with the corresponding predicted value.
aTotal number of clinical trials that were predicted as false negative (FN), false positive (FP), true negative (TN), or true positive (TP) with respect to induction based on the 0.8-fold cutoff criterion.bRMSE and GMFE used as quality criteria.cGMFE, RMSE, RMSLE, MAE retained distances used for d calculation through a minimization process as described in Material and Methods.
58 Vermet et al.
at ASPE
T Journals on M
ay 19, 2018dm
d.aspetjournals.orgD
ownloaded from

methods for each hepatocyte batch reflecting the interbatch variabilityresponse (Table 9).
Determination of the d Value for the HepaRG Cell Line. Foreach thawing of one batch of HepaRG cell line, the scaling parameter(i.e., d) was determined using the three approaches outlined earlier withthe inducer plasma Cmax concentration expressed as either unbound(with Fup) or total (without Fup). As described earlier for humanhepatocyte preparations, the relative predictability of each approachwas compared by calculating the GMFE, RMSE, NPE, and PPE asquality prediction criteria.Taking the three experiments together, the predicted versus observed
AUC ratios in each condition are presented in Fig. 4. Similarly to thehuman hepatocyte preparations, the use of the d factor calculatedwithout Fup was the best method to avoid underestimation, and similarresults were obtained with all methods of minimization, GMFE, RMSE,RMSLE, or MAE (Table 8). Therefore, only GMFE was selected forcomparison with the other methods in Fig. 4. As shown in this figureand in Table 8, the NPE percentage is 0 in most of cases, when totalCmax concentrations are incorporated, whatever the test method applied.As observed with the human hepatocyte preparations, the third
approach, which used the set of 15 compounds to calculate the d values,did not increase the quality criteria (RMSE, GMFE, PPE, and NPE)compared with the second approach that used rifampicin alone.Allocation of the scaling parameter d to a value of 1 provides the samelevel of accuracy as that observed for a calculated scaling value [GMFE =1.6, 77% within 2-fold (Table 8)]. Moreover, using the d valuedetermination based on the predicted and observed effects of rifampicinalone and incorporating its total Cmax inducer concentration, thed values were close to 1 [range: 0.92 to 0.99 (Table 10)], indicatingthat calculation of a d value is unnecessary when a test compound isincubated with HepaRG cells.To summarize the results obtained with the HepaRG cell line (Fig. 4),
the preferred approach for both optimal prediction of potential in-duction and ease of use is the first method incorporating a d factor valueequal to 1 (i.e., no d factor) and total Cmax compound concentration(without Fu).
Discussion
In the current study, six different batches of human cryopreservedhepatocytes and one batch of HepaRG cells, analyzed after three in-dependent thawing periods, were treated with 15 compounds at concen-trations ranging from 0.01 to 3000 mM. For each investigated batch, anempirical calibration factor for the purpose of in vitro–in vivo scaling,called the d factor, was determined (eq. 1). Gene expression, as a measureof the in vitro induction potential of these compounds, was evaluated atconcentrations up to their respective maximal noncytotoxic concentration.The metabolic stability of the test compounds in human hepatocytes andHepaRG cells was also investigated, as recommended by regulatoryguidelines.
Quantification of test compounds by LC-MS/MS during day 2, thefinal day of incubation, demonstrated that human hepatocytes andHepaRG cells were well exposed to unchanged compound at least forthe highest concentrations. However, 6 of 15 compounds exhibited anon-negligible metabolism after 24 hours incubation at the lowest con-centrations for at least one batch. This suggests the effective con-centration for induction process was less than those considered to deriveEC50 and Emax. There is no obvious way to address this problem be-cause induction mechanism and metabolic depletion of parent com-pound occur simultaneously. To address this potential issue, someauthors have proposed considering the time weighted average concen-tration but have showed no improvement regarding quality criteria(Zhang et al., 2014).The Emax values determined in vitro were found to be highly variable
from one batch of human hepatocytes to another, and limited interexper-imental variability was demonstrated for the HepaRG cells (n = 3) withboth rifampicin alone (Fig. 2) and for all test compounds (Fig. 3). Thisvariability in Emax values between different donors reflects the differentmagnitude of response in the donors and justifies the use of the d factor.Variability in hepatocyte plating efficiency and cell-viability during the 2-day duration of the experiment may also contribute to this observedvariability. Typically, there was relatively little interindividual variabilityin the EC50 values in our study (Fig. 3). Of note, comparison of EC50
values for human hepatocytes and HepaRG show that the EC50 is similarfor all of the test inducers (Fig. 3, Table 5, 6).For each human hepatocyte batch and HepaRG cell line, the scaling
parameter dwas determined using the three approaches described in theMaterials and Methods section using the unbound or total hepaticinducer plasma concentration.For human hepatocyte batches, the use of in vitro and in vivo unbound
concentrations tended to increase false negatives, even though in terms of2-fold error the methods considering unbound concentration were slightlymore accurate (Table 7).However, the use of the d factor calculatedwithoutFup (i.e., Cmax total used) was the best method to avoid underestimation ofclinical outcome (the lowest NPE percentage) (Table 7). This statementwas specifically true with HepaRG in vitro model, which also showed abetter accuracy in terms of 2-fold error (Table 8).Despite these findings showing that unbound input concentrations
(both in vitro and in vivo) yielded more accurate predictions of clinicalinduction magnitude, we currently recommend using the total concen-tration values when predicting positive/negative outcomes in clinicalinduction studies as this will not yield false negatives. This is consistentwith the previous claims of others (Einolf et al. 2014). However it must beacknowledged that our dataset had only four clinical noninducers; thus, tothoroughly test free versus total concentrations as the relevant inputvalues for prediction, a larger dataset that is enrichedwith drugs that showan induction response in vitro but not in vivo, as well as being highlyprotein bound (e.g., fup , 0.1), would be needed.For experiments with human hepatocyte batches, comparison of the
three methods (i.e., d equal to unity, d determined with rifampicinalone, and d determined with the set of compounds) showed that
TABLE 10
Values for d determined by two methods and total Cmax inducer concentrations: 1)d factor obtained through GMFE error function and 2) d determined with rifampicin
alone as calibrator for three experiments with the HepaRG cell line
The d factor value calculated with GMFE method is the average of the d values determined foreach experiment (see Materials and Methods and Figure 1 for details).
MethodHepaRG
Replicate 1HepaRG
Replicate 2HepaRG
Replicate 3
d GMFE 1.1 1.1 0.96d Rifampicin 0.93 0.99 0.92
TABLE 9
Values for d determined by two methods and total Cmax inducer concentrations: 1)d factor obtained through GMFE error function and 2) d determined with rifampicin
alone as calibrator for six human hepatocyte preparations in primary culture
The d factor value calculated with GMFE method is the average of the d values determined foreach batch (see Materials and Methods and Figure 1 for details).
Method HH1024 CD-Hu8084 BD-281 IVT-IBG BD-295 CD-Hu4237
d GMFE 0.23 0.32 0.46 0.56 0.11 0.40d Rifampicin 0.20 0.32 0.46 0.56 0.10 0.43
Normalization Methods To Predict CYP3A4 Induction 59
at ASPE
T Journals on M
ay 19, 2018dm
d.aspetjournals.orgD
ownloaded from

incorporation of the d factor provided the best prediction. Omitting thecalibration factor led to a clear overestimation of the clinical effects ofthe test inducer. Moreover, our data provided no strong rational tosuggest that a more accurate prediction was obtained when the set of15 known test inducers were evaluated. Indeed, the d factor determinedwith rifampicin alone appeared to be sufficiently robust because itprovided similar predictive accuracy to that obtained with the full set oftest compounds (see Table 7 and Fig. 4).In conclusion, the current investigation with the human hepatocyte in
vitro model has demonstrated that the optimal determination of thecalibration factor d, in terms of both the predictive accuracy of clinicaloutcome and level of resources required, is the method using the knownCYP3A4 inducer rifampicin alone. Because rifampicin is classicallyused as a prototypical positive control inducer in each in vitro ex-periment, this option provides a method to incorporate the d calibratorin each experiment to reduce the impact of interexperimental variabilityfor any human hepatocyte batch. In addition, rifampicin is metaboli-cally stable in vitro (Supplemental Data) and thereby provides robustEC50 and Emax determination.The HepaRG cell line has been previously proposed as an in vitro
model to investigate induction processes (Grime et al., 2010). In ourexperiments with this cell line, using the set of 15 known inducersresulted in in vitro Emax values that tended to be lower than thoseobtained when human hepatocyte batches were used as the in vitromodel (Fig. 3). Because HepaRG cell line exhibits a higher basalactivity of CYP3A4 compared with the various cryopreserved humanhepatocyte batches (Table 2, 3), the lower Emax values obtained in theHepaRG cell line may be partly explained by a lower inductionpotential. In view of the low Emax values (Fig. 3 and Table 8), thecalibration factor did not appear to improve the accuracy of theprediction obtained with HepaRG cells in contrast to the resultsobtained with the batches of human hepatocytes.As previously stated in the literature, since similar predictive
accuracy has been obtained with HepaRG cell line and humanhepatocytes, data from both in vitro models can be used inter-changeably within the same laboratory to predict in vivo clinicaloutcome for CYP3A4 induction (McGinnity et al., 2009). In terms ofthe accuracy in prediction of clinical outcome as shown by 2-folderror (%), our data also suggest comparable reliability of the twomodels (Tables 7 and 8).To sum up, our findings show that application of the calibration
factor d to in vitro values obtained from experiments to evaluatepotential inducers in human hepatocytes is preferable for prediction ofclinical outcome. However they also suggest that the calculation ofthis factor d does not require the use of a complete set of 15 knownCYP3A4 inducers. The use of rifampicin alone, which is alreadysystematically incorporated as a prototypical positive CYP3A4 con-trol in each in vitro experiment, should be sufficient to predict clinicaloutcome. When the HepaRG established cell line is used as the in vitromodel, the findings obtained in three experiments, using a single batchof cells, show a good prediction accuracy with or without d factor.However, this finding is derived from values obtained with one singlebatch of HepaRG cells (three independent thawing periods). Additionalstudies using different batches of HepaRG cells will be required toprovide definitive data that could confirm these results.
Acknowledgments
The authors thank Dr. Magalie Pardon, Sophie Vivier, Dr. François Donat,Dr. Terence Appelqvist, Dr. Roger Botham, and Dr. Jean-Marie Martinez forreviewing the manuscript and for their helpful suggestions.
Authorship ContributionsParticipated in research design: Vermet, Klieber, Fabre, Boulenc.Conducted experiments: Vermet, Raoust, Ngo.Contributed new reagents or analytic tools: Vermet, Ngo.Performed data analysis: Vermet, Esserméant, Boulenc.Wrote or contributed to the writing of the manuscript: Vermet, Esserméant,
Klieber, Fabre, Boulenc.
References
Almond LM, Yang J, Jamei M, Tucker GT, and Rostami-Hodjegan A (2009) Towards a quan-titative framework for the prediction of DDIs arising from cytochrome P450 induction. CurrDrug Metab 10:420–432.
Boulenc X and Barberan O (2011) Metabolic-based drug-drug interactions prediction, recentapproaches for risk assessment along drug development. Drug Metabol Drug Interact 26:147–168.
Center for Drug Evaluation and Research (CDER) (2012) Guidance for Industry: Drug InteractionStudies—Study Design, Data Analysis, Implications for Dosing, and Labeling Recommendations[Draft Guidance], U.S. Department of Health and Human Services, Food and Drug Administration,Rockville, MD. http://www.fda.gov/downloads/Drugs/GuidanceComplianceRegulatoryInformation/Guidances/ucm292362.pdf.
Committee for Human Medicinal Products (CHMP) (2012) Guideline on the Investigation ofDrug Interactions [Final], European Medicines Agency, London. http://www.ema.europa.eu/docs/en_GB/document_library/Scientific_guideline/2012/07/WC500129606.pdf.
Einolf HJ, Chen L, Fahmi OA, Gibson CR, Obach RS, Shebley M, Silva J, Sinz MW, UnadkatJD, and Zhang L, et al. (2014) Evaluation of various static and dynamic modeling methods topredict clinical CYP3A induction using in vitro CYP3A4 mRNA induction data. Clin Phar-macol Ther 95:179–188.
Fahmi OA, Maurer TS, Kish M, Cardenas E, Boldt S, and Nettleton D (2008a) A combinedmodel for predicting CYP3A4 clinical net drug-drug interaction based on CYP3A4 in-hibition, inactivation, and induction determined in vitro. Drug Metab Dispos 36:1698–1708.
Fahmi OA, Boldt S, Kish M, Obach RS, and Tremaine LM (2008b) Prediction of drug-druginteractions from in vitro induction data: application of the relative induction score approachusing cryopreserved human hepatocytes. Drug Metab Dispos 36:1971–1974.
Fahmi OA, Kish M, Boldt S, and Obach RS (2010) Cytochrome P450 3A4 mRNA is a morereliable marker than CYP3A4 activity for detecting pregnane X receptor-activated induction ofdrug-metabolizing enzymes. Drug Metab Dispos 38:1605–1611.
Fahmi OA and Ripp SL (2010) Evaluation of models for predicting drug-drug interactions due toinduction. Expert Opin Drug Metab Toxicol 6:1399–1416.
Fahmi OA, Hurst S, Plowchalk D, Cook J, Guo F, Youdim K, Dickins M, Phipps A, Darekar A,and Hyland R, et al. (2009) Comparison of different algorithms for predicting clinical drug-drug interactions, based on the use of CYP3A4 in vitro data: predictions of compounds asprecipitants of interaction. Drug Metab Dispos 37:1658–1666.
Grime K, Ferguson DD, and Riley RJ (2010) The use of HepaRG and human hepatocyte data inpredicting CYP induction drug-drug interactions via static equation and dynamic mechanisticmodelling approaches. Curr Drug Metab 11:870–885.
Kanebratt KP and Andersson TB (2008) HepaRG cells as an in vitro model for evaluation ofcytochrome P450 induction in humans. Drug Metab Dispos 36:137–145.
Kilford PJ, Gertz M, Houston JB, and Galetin A (2008) Hepatocellular binding of drugs: cor-rection for unbound fraction in hepatocyte incubations using microsomal binding or druglipophilicity data. Drug Metab Dispos 36:1194–1197.
Kirby BJ, Collier AC, Kharasch ED, Dixit V, Desai P, Whittington D, Thummel KE,and Unadkat JD (2011) Complex drug interactions of HIV protease inhibitors 2: in vivoinduction and in vitro to in vivo correlation of induction of cytochrome P450 1A2, 2B6, and2C9 by ritonavir or nelfinavir. Drug Metab Dispos 39:2329–2337.
Kliewer SA, Moore JT, Wade L, Staudinger JL, Watson MA, Jones SA, McKee DD, Oliver BB,Willson TM, and Zetterström RH, et al. (1998) An orphan nuclear receptor activated bypregnanes defines a novel steroid signaling pathway. Cell 92:73–82.
McGinnity DF, Zhang G, Kenny JR, Hamilton GA, Otmani S, Stams KR, Haney S, Brassil P,Stresser DM, and Riley RJ (2009) Evaluation of multiple in vitro systems for assessment ofCYP3A4 induction in drug discovery: human hepatocytes, pregnane X receptor reporter gene,and Fa2N-4 and HepaRG cells. Drug Metab Dispos 37:1259–1268.
Shou M, Hayashi M, Pan Y, Xu Y, Morrissey K, Xu L, and Skiles GL (2008) Modeling,prediction, and in vitro in vivo correlation of CYP3A4 induction. Drug Metab Dispos 36:2355–2370.
Templeton IE, Houston JB, and Galetin A (2011) Predictive utility of in vitro rifampin inductiondata generated in fresh and cryopreserved human hepatocytes, Fa2N-4, and HepaRG cells.Drug Metab Dispos 39:1921–1929.
Turpeinen M, Tolonen A, Chesne C, Guillouzo A, Uusitalo J, and Pelkonen O (2009) Functionalexpression, inhibition and induction of CYP enzymes in HepaRG cells. Toxicol In Vitro 23:748–753.
Zanger UM and Schwab M (2013) Cytochrome P450 enzymes in drug metabolism: regulation ofgene expression, enzyme activities, and impact of genetic variation. Pharmacol Ther 138:103–141.
Zhang JG, Ho T, Callendrello AL, Clark RJ, Santone EA, Kinsman S, Xiao D, Fox LG, EinolfHJ, and Stresser DM (2014) Evaluation of calibration curve-based approaches to predictclinical inducers and noninducers of CYP3A4 with plated human hepatocytes. Drug MetabDispos 42:1379–1391.
Address correspondence to: Dr. Xavier Boulenc, Sanofi R&D, 371 rue duProfesseur J. Blayac, 34184 Montpellier, France. E-mail: [email protected]
60 Vermet et al.
at ASPE
T Journals on M
ay 19, 2018dm
d.aspetjournals.orgD
ownloaded from