evaluation of methods to concentrate and purify ocean ... · ocean virus communities through...
TRANSCRIPT

Evaluation of methods to concentrate and purifyocean virus communities through comparative,replicated metagenomicsemi_2836 1428..1440
Bonnie L. Hurwitz, Li Deng,† Bonnie T. Poulos andMatthew B. Sullivan*Ecology and Evolutionary Biology, University of Arizona,Tucson, AZ 85721, USA.
Summary
Viruses have global impact through mortality, nutrientcycling and horizontal gene transfer, yet their study islimited by complex methodologies with little valida-tion. Here, we use triplicate metagenomes to comparecommon aquatic viral concentration and purificationmethods across four combinations as follows: (i) tan-gential flow filtration (TFF) and DNase + CsCl, (ii)FeCl3 precipitation and DNase, (iii) FeCl3 precipitationand DNase + CsCl and (iv) FeCl3 precipitation andDNase + sucrose. Taxonomic data (30% of reads) sug-gested that purification methods were statisticallyindistinguishable at any taxonomic level while con-centration methods were significantly differentat family and genus levels. Specifically, TFF-concentrated viral metagenomes had significantlyfewer abundant viral types (Podoviridae and Phycod-naviridae) and more variability among Myoviridaethan FeCl3-precipitated viral metagenomes. Morecomprehensive analyses using protein clusters (66%of reads) and k-mers (100% of reads) showed 50–53%of these data were common to all four methods, andrevealed trace bacterial DNA contamination in TFF-concentrated metagenomes and one of three repli-cates concentrated using FeCl3 and purified by DNasealone. Shared k-mer analyses also revealed that poly-merases used in amplification impact the resultingmetagenomes, with TaKaRa enriching for ‘rare’ readsrelative to PfuTurbo. Together these results provide
empirical data for making experimental design deci-sions in culture-independent viral ecology studies.
Introduction
Viruses are the most abundant and diverse biologicalentities on the planet (Wommack and Colwell, 2000;Rohwer, 2003). Their impact is global: affecting microbialhosts through mortality, remineralization of nutrients andhorizontal gene transfer (reviewed in Fuhrman, 1999;2000; Wommack and Colwell, 2000; Weinbauer, 2004;Suttle, 2005; 2007; Breitbart et al., 2007). They can evendrive the evolutionary trajectory of the Earth’s fundamen-tal biogeochemical processes by encoding ‘host’ genes(Mann et al., 2003; Lindell et al., 2004; Sullivan et al.,2005; 2006; Sharon et al., 2007) that are expressedduring infection (Lindell et al., 2005; Clokie et al., 2006;Dammeyer et al., 2008) and confer a direct fitness advan-tage for the phage (Bragg and Chisholm, 2008; Hell-weger, 2009). Such viral-encoded photosynthesis geneslikely also have significant ecological and evolutionaryimpact on ocean ecosystems as they dominate globalocean microbial metagenomes (Sharon et al., 2007) andalter the long-term evolutionary trajectories of both phageand host copies of the gene (Sullivan et al., 2006).
Despite the abundance of viruses in aquatic marineenvironments, studying viruses in the wild is fraught withmethodological challenges. Perhaps the most notable isthat wild viruses and their microbial hosts are rarely cul-tivable (Edwards and Rohwer, 2005) and the field isreliant upon culture-independent methods such asmetagenomics wherein the majority of reads (50–90%)show no significant similarity to a sequence within aknown organism (Breitbart et al., 2002; Angly et al., 2006;Bench et al., 2007; Dinsdale et al., 2008; Williamsonet al., 2008). Furthermore, to create metagenomes, viralparticles must be concentrated and purified from smallvolumes of filtrate while minimizing contamination andartefact (Lawrence and Steward, 2010; Wommack et al.,2010). We previously introduced a new method, FeCl3precipitation, for concentrating viruses from seawater(John et al., 2011) that was more efficient than the stan-dard method of tangential flow filtration (TFF).
Received 30 November, 2011; revised 29 June, 2012; accepted30 June, 2012. *For correspondence. E-mail [email protected]; Tel. (+1) 520 626 9100; Fax (+1) 520 621 9190. †Currentaddress: Helmholtz Zentrum München-German Research Center forEnvironmental Health, Institute of Groundwater Ecology, Neuherberg,Germany.Re-use of this article is permitted in accordance with theTerms and Conditions set out at http://wileyonlinelibrary.com/onlineopen#OnlineOpen_Terms
bs_bs_banner
Environmental Microbiology (2013) 15(5), 1428–1440 doi:10.1111/j.1462-2920.2012.02836.x
© 2012 Society for Applied Microbiology and Blackwell Publishing Ltd

While little is known about the effects of sample process-ing and library construction procedures on viral metage-nomes several studies have addressed experimentalissues in microbial metagenomics. First, variable DNAextraction efficiencies across microbes in the environmentare likely due to variation in cell wall and membranestructure (Carrigg et al., 2007). Second, amplification pro-tocols used to bolster limiting quantities of DNA, such asmultiple displacement amplification (MDA), are not quan-titative due to amplification bias (Yilmaz et al., 2010). Third,fosmid cloning can also bias the representation of species(Temperton et al., 2009). Finally, in silico processing isproblematic where organisms are more divergent thanthose in databases (McHardy and Rigoutsos, 2007). Sum-marily, even in the case of in vitro metagenomic simulationswhere both the organisms and abundances were known apriori, sequence coverage variation was observed, andascribed to differences in ‘growth conditions, organismalgrowth phase, DNA extraction efficiency, cloning bias,sequencing efficiency, or relative genome copy number’(Morgan et al., 2010). Thus rigorous, systematic, empiricalstudies are needed to take us one step closer to being ableto meaningfully cross-compare metagenomic data setsgenerated using different methods.
Here, we evaluate the effect of commonly used aquaticviral concentration and purification protocols on triplicatemetagenomes across four different method combinations.Specifically, seawater collected from the site of the first viralmetagenomes, San Diego’s Scripps Pier (Breitbart et al.,2002), was used to generate triplicate viral metagenomesto evaluate taxonomic and protein cluster variability acrosstwo concentration (TFF and FeCl3 precipitation) and threepurification methods (DNase only, DNase + CsCl andDNase + sucrose) in four method combinations as follows:(i) TFF and DNase + CsCl, (ii) FeCl3 precipitation andDNase only, (iii) FeCl3 precipitation and DNase + CsCl and(iv) FeCl3 precipitation and DNase + sucrose.
Results
Thirteen metagenomes were generated for this studyfrom Scripps Pier, San Diego, California Pacific Oceanseawater: a microbial metagenome from the 0.2–2.7 mmsize fraction, and 12 viral metagenomes derived from the< 0.2 mm size fraction. The viral metagenomes were pro-duced using four standard protocols for viral concentra-tion and purification (TFF DNase + CsCl, FeCl3 DNaseonly, FeCl3 DNase + CsCl and FeCl3 DNase + sucrose) intriplicate from the same seawater sample (Fig. 1). Tripli-cate metagenomes were used to rigorously evaluateintra- versus inter-method variability and document anytaxon-specific or protein diversity biases associated withthese methods. The replicated metagenomes are abbre-viated as TC1, TC2, TC3 (TC; TFF DNase + CsCl), FD1,
FD2, FD3 (FD; FeCl3 DNase only), FC1, FC2, FC3 (FC;FeCl3 DNase + CsCl) and FS1, FS2, FS3 (FS; FeCl3DNase + sucrose) for simplicity.
Community composition and variability across methods
A one-way analysis of variance was conducted to evaluatethe relationship between viral concentration and purifica-tion methods based on the hit count at the superkingdom,family and genus levels (see Experimental procedures,Table S1). At the broadest taxonomic level (superking-dom), we observed no significant differences across con-centration or purification methods other than slightly morevariability between replicate metagenomes for TC and FS(Fig. S1, Table S1). Overall, 66–81% of the reads in viralmetagenomes and 37% in the microbial metagenome hadno significant hit to anything in available databases (seeExperimental procedures). Of the subset of reads fromviral metagenomes with significant hits, 44–63% had nosuperkingdom designation in the database, little to noreads were classified as ‘Archaea’, 11–14% were classifiedas ‘Bacteria’, 2–3% as ‘Eukaryota’ and 22–42% as‘Viruses’. Notably, these percentages include a small cor-rection (~ 1%) to reclassify abundant ‘prophage’and ‘AMG’(auxiliary metabolic gene) sequences that get misclassi-fied as ‘bacterial’ (see Experimental procedures). Asexpected, these superkingdom-level taxonomic findingscontrasted those from the microbial metagenome wherethe bulk of the identified reads were ‘Bacteria’ (47%) andmany fewer were ‘Viruses’ (3%), suggesting that themetagenomes from viral-size-fractionated seawater wereindeed enriched for viruses regardless of concentration orpurification method.
With increasing taxonomic resolution at the family andgenus levels respectively (Fig. 2), we found relatively con-sistent rank abundance profiles across all methods for thetop 10 taxonomic designations. These top 10 taxonomicdistributions represent 76–87% of the total reads that hada taxonomic designation at the family level and 52–72% at
TFFFiltration
FeCl3Precipitation
Viral
Concentration
Viral
Purification
DNase only
DNase + sucrose
DNase + CsCl
DNase + CsCl
3 x 20 l
3 x 50 l
prefilter
Fig. 1. Workflow showing the process of creating each viralmetagenomic replicate using different concentration (TFF or FeCl3)and purification methods (DNase only, DNase + CsCl orDNase + sucrose) from a 210 l sample of seawater taken fromScripps Pier, San Diego, CA. The ‘3 ¥’ refers to that eachsubsample was processed independently from the 210 l pooledinitial sample.
Viral community concentration and purification 1429
© 2012 Society for Applied Microbiology and Blackwell Publishing Ltd, Environmental Microbiology, 15, 1428–1440
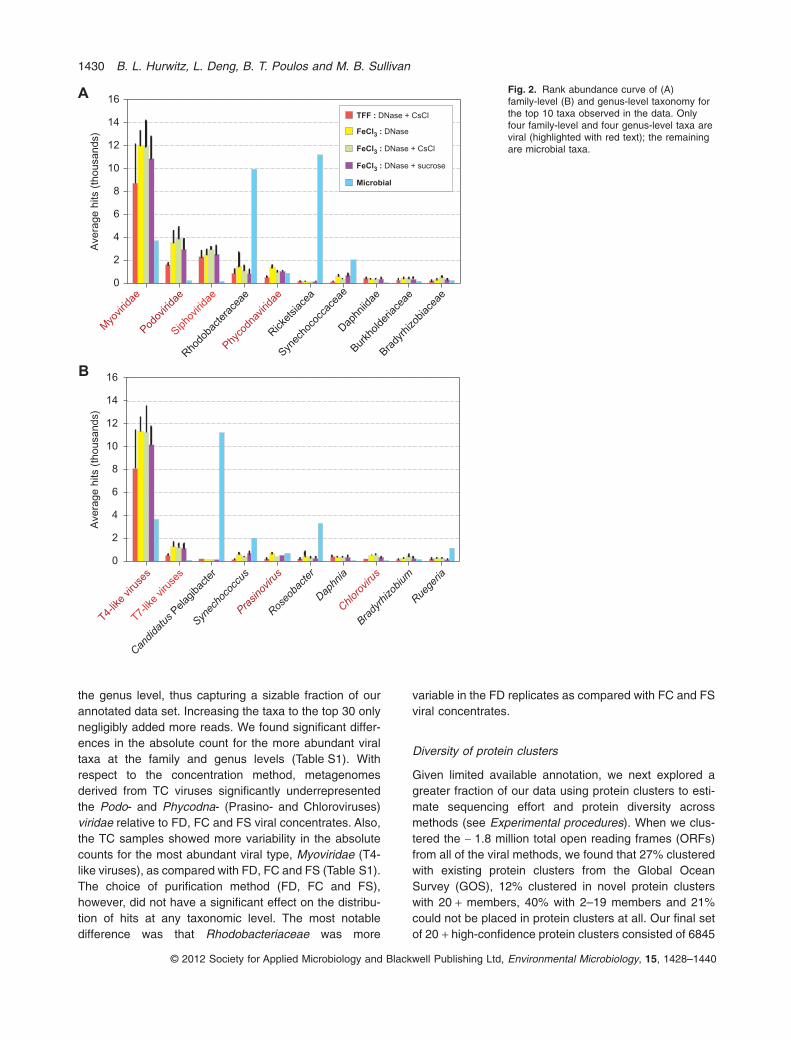
the genus level, thus capturing a sizable fraction of ourannotated data set. Increasing the taxa to the top 30 onlynegligibly added more reads. We found significant differ-ences in the absolute count for the more abundant viraltaxa at the family and genus levels (Table S1). Withrespect to the concentration method, metagenomesderived from TC viruses significantly underrepresentedthe Podo- and Phycodna- (Prasino- and Chloroviruses)viridae relative to FD, FC and FS viral concentrates. Also,the TC samples showed more variability in the absolutecounts for the most abundant viral type, Myoviridae (T4-like viruses), as compared with FD, FC and FS (Table S1).The choice of purification method (FD, FC and FS),however, did not have a significant effect on the distribu-tion of hits at any taxonomic level. The most notabledifference was that Rhodobacteriaceae was more
variable in the FD replicates as compared with FC and FSviral concentrates.
Diversity of protein clusters
Given limited available annotation, we next explored agreater fraction of our data using protein clusters to esti-mate sequencing effort and protein diversity acrossmethods (see Experimental procedures). When we clus-tered the ~ 1.8 million total open reading frames (ORFs)from all of the viral methods, we found that 27% clusteredwith existing protein clusters from the Global OceanSurvey (GOS), 12% clustered in novel protein clusterswith 20 + members, 40% with 2–19 members and 21%could not be placed in protein clusters at all. Our final setof 20 + high-confidence protein clusters consisted of 6845
Fig. 2. Rank abundance curve of (A)family-level (B) and genus-level taxonomy forthe top 10 taxa observed in the data. Onlyfour family-level and four genus-level taxa areviral (highlighted with red text); the remainingare microbial taxa.
Pod
ovirida
e
Sipho
virid
ae
Rho
doba
cter
acea
e
Phy
codn
avirida
e
Ricke
tsiace
a
Syn
echo
cocc
acea
e
Dap
hniid
ae
Bur
kholde
riace
ae
Bra
dyrh
izob
iace
ae
T4-lik
e viru
ses
T7-lik
e viru
ses
Candid
atus
Pelag
ibac
ter
Synec
hoco
ccus
Prasin
oviru
s
Roseo
bacte
r
Daphn
ia
Chloro
virus
Brady
rhizo
bium
Ruege
ria
TFF : DNase + CsCl
FeCl3 : DNase + CsCl
Microbial
FeCl3 : DNase + sucrose
FeCl3 : DNase
Myo
virid
ae
0
2
4
6
8
10
12
14
16A
vera
ge h
its (
thousands)
0
2
4
6
8
10
12
14
16
Avera
ge h
its (
thousands)
A
B
1430 B. L. Hurwitz, L. Deng, B. T. Poulos and M. B. Sullivan
© 2012 Society for Applied Microbiology and Blackwell Publishing Ltd, Environmental Microbiology, 15, 1428–1440

GOS protein clusters and 6178 novel protein clusters.When we mapped our reads back to the ORFs in high-confidence protein clusters 66% of reads matched.
To test the ‘replicability’ of each method, we examinedthe ORF membership of each of the 20 + protein clusterswith the null hypothesis that each method would be rep-resented by at least one ORF in these abundant proteinclusters. Overall, we found that 53% of clusters containedORFs from all four methods (Table 1). Of the remainingclusters, 13% were found in TFF-concentrated samples(TC) and 11% in FeCl3-precipitated samples (FD, FC andFS) only and may represent clusters specific to the con-centration methods. In total, 82% of clusters containedORFs from at least two methods indicating that mostclusters were not specific to a single method and are likelyto represent real viral proteins in the sample rather thanartefact.
We then explored the data from the high-confidenceprotein clusters (GOS clusters + novel clusters with 20 +members) using a rarefaction analysis to examine proteindiversity in each sample and replicate. These analysessuggested that our sampling was relatively deep, but thatfour samples (TC1, TC2, TC3 and FD2) had greaterprotein diversity than other methods (Fig. 3A).
Shared k-mer analysis of reads to distinguish methodsand replicates
In order to better quantify and separate out distinct reads ineach method or replicate that drive differences in therarefaction curves (above), we compared and contrastedk-mers in reads for all samples representing 100% of ourdata set (Fig. 4A; see Experimental procedures). Overall,the k-mer analysis mirrored the results from the protein
clustering analysis and showed that 50% of reads areshared between all methods and 82% are shared with atleast one other method. Also comparably, 12% were foundin just TC and 17% in FeCl3-precipitated samples (FD, FCand FS), indicating that each subset of reads may bespecific to each concentration protocol as noted previously.
To explore what drives the differences in the rarefactioncurves we examined the fraction of ‘rare’ sequences(k-mer = 1; Fig. 4B) in the metagenomes, and found con-siderable variation both within and across methods. Thisvariability appears to be driven by the enzyme used inlinker amplification, as samples using the TaKaRa poly-merase had a higher percentage of rare sequences(> 13%) than those using PfuTurbo (< 1%). This wasespecially apparent in FD2, which was prepared twice forsequencing, once with PfuTurbo and a second time withTaKaRa and then combined into one sample. Here, the
Table 1. A compositional analysis of ORFs in 20 + protein clusters byconcentration and purification method.
Methods represented # clusters % clusters
FC&FD&FS&TC 6861 52.7TC 1672 12.8FC&FD&FS 1364 10.5FD 761 5.8FD&TC 492 3.8FC&FD&TC 394 3.0FC 271 2.1FD&FS&TC 221 1.7FS 203 1.6FC&TC 187 1.4FC&FD 171 1.3FD&FS 161 1.2FS&TC 120 0.9FC&FS&TC 114 0.9FC&FS 31 0.2
The following abbreviations are used for each method: FC = FeCl3CsCl + DNase, FS = FeCl3 sucrose + DNase, FD = FeCl3 DNase,TC = TFF and CsCl + DNase and TF = TFF CsCl + DNase.
Th
ou
sa
nd
s o
f G
OS
+ v
ira
l clu
ste
rs
1
3
5
7
9
11
5 55 105 155 205
Thousands of sequences sampled
B
Th
ou
sa
nd
s o
f G
OS
+ v
ira
l clu
ste
rs
1
3
5
7
9
11
13
5 55 105 155 205
FeCl3DNase
TFFDNase
+ CsCl
FeCl3DNase
+ CsCl
FeCl3DNase
+ sucrose
A
Fig. 3. Rarefaction analysis of hits to protein clusters from eachviral metagenome using (A) all sequences and (B) abundant(k-mer > 1) sequences. To be conservative, only protein clusterswith > 20 members were used in these analyses.
Viral community concentration and purification 1431
© 2012 Society for Applied Microbiology and Blackwell Publishing Ltd, Environmental Microbiology, 15, 1428–1440

fraction of rare sequences in the metagenomes was 0.4%and 22% for PfuTurbo and TaKaRa respectively. Whenthe ‘rare’ sequences were removed from all samples inthe rarefaction analysis, the TFF replicates showed theleast diversity (Fig. 3B).
The increased percentage of rare sequences, however,does not fully explain the difference in the rarefactioncurves, as other replicates were also processed using theTaKaRa enzyme and had a similarly high fraction of raresequences. To further explain the differences, we taxo-nomically classified (by superkingdom) the metagenomereads that were unique and shared in each method(Fig. 5). We found that ‘rare’ sequences (k-mer = 1) inthese anomalously diverse samples were enriched for‘bacteria’ (15–22% in TC1, TC2, TC3, FD2 versus 5–9%for all other samples) and suppressed for ‘virus’ (5–11% inthese four samples versus 9–20% for all other samples;Fig. 5A). In contrast, the category rankings among ‘non-rare’ (k-mer > 1) sequences did not vary across methods
(Fig. 5B). We also found that the ratio of annotated viral tobacterial reads is less than one in the subset of readsspecific to each replicate suspected of bacterial contami-nation (TC1, TC2, TC3, FD2) and much greater than this(commonly > 2) for the other treatments or replicates(Table 2).
Further, when we mapped the metagenome reads tofive abundant microbial genomes, we found that the threeanomalously diverse TFF replicates (TC1, TC2 and TC3)contained more recruitment to and spread throughoutthree of the five microbial genomes (alphaproteobacte-rium BAL199, and gammaproteobacteria HTCC 2143 andHTCC 2148) (Fig. S2). This pattern contrasted thatobserved for the other methods where little to no recruit-ment was observed except in the microbial metagenomewhere the level and spread of recruitment was similar(Fig. S2). Reads that mapped to the two other abundantmicrobial genomes displayed a different pattern: (i)alphaproteobacterium HIMB114 hits clustered in ~ 50 kb
Fig. 4. K-mer-based analysis of shared readsbetween methods and replicates. (A)Percentage of total reads that are sharedbetween methods based on a k-mer-basedanalysis and (B) percentage of ‘rare’(k-mer = 1) versus abundant sequences(k-mer > 1) in each of the four viralmetagenomic methods and a non-replicatedmicrobial metagenome. The enzymes usedfor linker amplification (TaKaRa or PfuTurbo)are listed above each sample. The microbialsample includes more ‘rare’ sequencesbecause the diversity in the sample isundersampled based upon rarefactionanalysis (data not shown).
0
20
40
60
80
100
A
B
Microbial
Pe
rce
nta
ge
of
hits
FeCl3
DNase
TFFDNase
+ CsCl
FeCl3DNase
+ CsCl
FeCl3DNase
+ sucrose
TaKaR
a
TaKaR
a
TaKaR
a
Pfu
Turbo
Pfu
Turbo
+ T
aKaR
a
TaKaR
a
Pfu
Turbo
Pfu
Turbo
TaKaR
a
Pfu
Turbo
Pfu
Turbo
TaKaR
a
Noam
plifica
tion
% k-mer > 1 % k-mer = 1
FeCl3 methods only
All methods
FeCl3 DNase + CsCl only
FeCl3 DNase only
FeCl3 DNase + sucrose only
TFF DNase + CsCl only
Other combinations
1432 B. L. Hurwitz, L. Deng, B. T. Poulos and M. B. Sullivan
© 2012 Society for Applied Microbiology and Blackwell Publishing Ltd, Environmental Microbiology, 15, 1428–1440
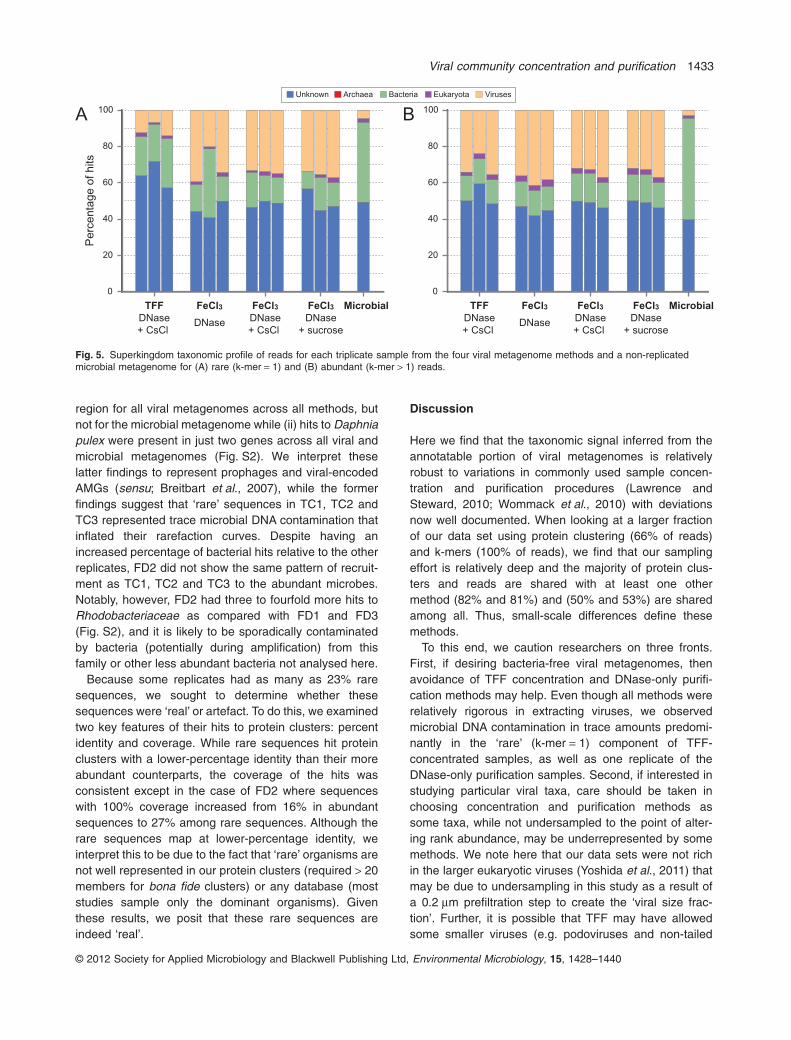
region for all viral metagenomes across all methods, butnot for the microbial metagenome while (ii) hits to Daphniapulex were present in just two genes across all viral andmicrobial metagenomes (Fig. S2). We interpret theselatter findings to represent prophages and viral-encodedAMGs (sensu; Breitbart et al., 2007), while the formerfindings suggest that ‘rare’ sequences in TC1, TC2 andTC3 represented trace microbial DNA contamination thatinflated their rarefaction curves. Despite having anincreased percentage of bacterial hits relative to the otherreplicates, FD2 did not show the same pattern of recruit-ment as TC1, TC2 and TC3 to the abundant microbes.Notably, however, FD2 had three to fourfold more hits toRhodobacteriaceae as compared with FD1 and FD3(Fig. S2), and it is likely to be sporadically contaminatedby bacteria (potentially during amplification) from thisfamily or other less abundant bacteria not analysed here.
Because some replicates had as many as 23% raresequences, we sought to determine whether thesesequences were ‘real’ or artefact. To do this, we examinedtwo key features of their hits to protein clusters: percentidentity and coverage. While rare sequences hit proteinclusters with a lower-percentage identity than their moreabundant counterparts, the coverage of the hits wasconsistent except in the case of FD2 where sequenceswith 100% coverage increased from 16% in abundantsequences to 27% among rare sequences. Although therare sequences map at lower-percentage identity, weinterpret this to be due to the fact that ‘rare’ organisms arenot well represented in our protein clusters (required > 20members for bona fide clusters) or any database (moststudies sample only the dominant organisms). Giventhese results, we posit that these rare sequences areindeed ‘real’.
Discussion
Here we find that the taxonomic signal inferred from theannotatable portion of viral metagenomes is relativelyrobust to variations in commonly used sample concen-tration and purification procedures (Lawrence andSteward, 2010; Wommack et al., 2010) with deviationsnow well documented. When looking at a larger fractionof our data set using protein clustering (66% of reads)and k-mers (100% of reads), we find that our samplingeffort is relatively deep and the majority of protein clus-ters and reads are shared with at least one othermethod (82% and 81%) and (50% and 53%) are sharedamong all. Thus, small-scale differences define thesemethods.
To this end, we caution researchers on three fronts.First, if desiring bacteria-free viral metagenomes, thenavoidance of TFF concentration and DNase-only purifi-cation methods may help. Even though all methods wererelatively rigorous in extracting viruses, we observedmicrobial DNA contamination in trace amounts predomi-nantly in the ‘rare’ (k-mer = 1) component of TFF-concentrated samples, as well as one replicate of theDNase-only purification samples. Second, if interested instudying particular viral taxa, care should be taken inchoosing concentration and purification methods assome taxa, while not undersampled to the point of alter-ing rank abundance, may be underrepresented by somemethods. We note here that our data sets were not richin the larger eukaryotic viruses (Yoshida et al., 2011) thatmay be due to undersampling in this study as a result ofa 0.2 mm prefiltration step to create the ‘viral size frac-tion’. Further, it is possible that TFF may have allowedsome smaller viruses (e.g. podoviruses and non-tailed
Bacteria Eukaryota Viruses Unknown Archaea
A
0
20
40
60
80
100
Microbial
Perc
enta
ge o
f hits
FeCl3
DNase
TFFDNase
+ CsCl
FeCl3DNase
+ CsCl
FeCl3DNase
+ sucrose
0
20
40
60
80
100
MicrobialFeCl3
DNase
TFFDNase
+ CsCl
FeCl3DNase
+ CsCl
FeCl3DNase
+ sucrose
B
Fig. 5. Superkingdom taxonomic profile of reads for each triplicate sample from the four viral metagenome methods and a non-replicatedmicrobial metagenome for (A) rare (k-mer = 1) and (B) abundant (k-mer > 1) reads.
Viral community concentration and purification 1433
© 2012 Society for Applied Microbiology and Blackwell Publishing Ltd, Environmental Microbiology, 15, 1428–1440

viruses) to pass through the 100 kDa filter. Empiricaldata from Pacific Ocean viral communities suggest that< 0.3% of the total viruses pass through these filters (J.Brum, pers. comm.). If all of viruses that passed throughfiltration were podoviruses this could explain the reduc-tion in podoviruses we found in the TFF samples as com-pared with other samples that also represented ~ 0.3% ofreads in the TFF samples. Overall, viral loss in permeateshould only minimally impact the taxonomic assess-ments described here, given that 100 kDa filter poresizes are only ~ 10 nm and the smallest known oceanviruses are 20 nm. Tangential flow filtration concentrationset-ups of 30 kDa and 50 kDa used in previous marineviral ecology studies may have further reduced loss ofsmall viruses.
Third, it is important to consider amplification optionswhen preparing environmental viral metagenomes. Themetagenomes in this study were generated from DNAthat was linker-amplified using protocols optimizedfor quantitative metagenomics from next-generationsequencing (see companion paper Duhaime et al.,2012). We document here that the choice of polymerasegreatly impacts your access to ‘rares’ in the community,but in a systematic manner. Mechanistically, we specu-late that late cycle PCR dCTP deamination to dUTPinhibits amplification of dominant templates in theTaKaRa reactions thus selecting for rare templates notyet deaminated. Such issues are not encountered in thePfuTurbo reactions because it contains an enzyme toconvert dUTP products to dUMP that allows dominanttemplates to be processed in proportions relative to theiractual occurrence in the population. Further, while linkeramplification methods have a slight systematic (%G+C)bias (Duhaime et al., 2012), they are incredibly preciseas evidenced by minimal variation between replicateswhich allows for quantitative cross-comparison betweensamples. In contrast, other published viral metagenomicdata sets suffer from methodological issues not recog-nized at the time of publication – either being small andbiased by cloning (e.g. linker-amplified and Sanger-sequenced; Breitbart et al., 2002; 2003; 2004; Benchet al., 2007) or resulting from whole genome-amplifiedDNA (Angly et al., 2006; Dinsdale et al., 2008) which isnow known to have unpredictable, stochastic biases thatlead to non-quantitative metagenomic data sets (Yilmazet al., 2010), as well as systematic biases of particularrelevance to viruses (Kim et al., 2008; Kim and Bae,2011).
Finally, the ‘bacterial’ signal in viral metagenomes pre-sents an area where informatics solutions are greatlyneeded. Specifically, viral metagenomes commonlycontain up to ~ 1/3 ‘bacterial’ sequences (e.g. Breitbartet al., 2002; 2003; Angly et al., 2006; Bench et al., 2007;Cantalupo et al., 2011) which are loosely attributed toTa
ble
2.R
eads
that
are
excl
usiv
eto
ace
rtai
nm
etho
dan
dre
plic
ate
base
don
ak-
mer
anal
ysis
and
thei
rta
xono
mic
assi
gnm
ent
toba
cter
iaan
dvi
ruse
s.
Sam
ple
Rep
licat
eE
nzym
eTo
tal
read
sE
xclu
sive
read
s
% excl
usiv
ere
ads
Exc
lusi
vere
ads
bact
eria
Exc
lusi
vere
ads
viru
ses
Rat
iovi
ruse
s/ba
cter
ia
FeC
l 3D
Nas
e+
CsC
lonl
y1
PF
U-T
urbo
141
000
100
40.
716
362.
3F
eCl 3
DN
ase
+C
sClo
nly
2P
FU
-Tur
bo17
511
986
10.
524
522.
2F
eCl 3
DN
ase
+C
sClo
nly
3Ta
KaR
a17
122
026
011
15.2
855
1987
2.3
FeC
l 3D
Nas
eon
ly1
PF
U-T
urbo
134
504
169
71.
336
952.
6F
eCl 3
DN
ase
only
2P
FU
-Tur
bo+
TaK
aRa
236
591
4507
519
.137
0725
710.
7F
eCl 3
DN
ase
only
3Ta
KaR
a27
436
849
542
18.1
1356
4063
3.0
FeC
l 3D
Nas
e+
sucr
ose
only
1P
FU
-Tur
bo12
215
143
70.
45
132.
6F
eCl 3
DN
ase
+su
cros
eon
ly2
PF
U-T
urbo
158
816
492
0.3
1318
1.4
FeC
l 3D
Nas
e+
sucr
ose
only
3Ta
KaR
a22
385
945
105
20.1
829
2020
2.4
TF
FD
Nas
e+
CsC
lonl
y1
TaK
aRa
308
510
120
430
39.0
4570
3954
0.9
TF
FD
Nas
e+
CsC
lonl
y2
TaK
aRa
193
113
7151
237
.043
6718
850.
4T
FF
DN
ase
+C
sClo
nly
3Ta
KaR
a31
978
110
202
231
.966
6957
130.
9
1434 B. L. Hurwitz, L. Deng, B. T. Poulos and M. B. Sullivan
© 2012 Society for Applied Microbiology and Blackwell Publishing Ltd, Environmental Microbiology, 15, 1428–1440

‘auxiliary metabolic genes’ or host genes legitimately inviruses (sensu; Breitbart et al., 2007), prophages inmicrobial genomes that are yet to be annotated or micro-bial DNA that is mispackaged in viral capsids in elementscalled gene transfer agents (GTAs; Lang and Beatty,2007; Stanton, 2007; Biers et al., 2008). Here we presenta new means to quantify the relative proportion of‘bacterial’ hits that are prophage through examining thedistribution of reads mapping to abundant bacterial ref-erence genomes; we find that prophages contribute arelatively small fraction (only 1%) which is in line with thefraction of microbial genomes devoted to identifiableprophages (e.g. Casjens, 2003). While columns andreagents can be contaminated with low levels of bacteriaand mouse sequences (van der Zee et al., 2002; Evanset al., 2003; Shen et al., 2006; Erlwein et al., 2011), non-uniform contamination across treatments and replicatesargues against kit-based contamination being respon-sible. Further, it is unlikely that contaminating DNA wouldhave survived myriad purification methods across tripli-cate samples, which suggests that GTAs are the prob-able largest contributor to the ‘bacterial’ signal in thesedata.
Conclusions
The data and analyses presented here establish a quan-titative framework for researchers to more rigorouslyunderstand and plan for biases in the sequence-basedmethods used to compare viral communities over spaceand time. Notably, however, our work is limited to dsDNAviruses and there likely remain many biases to be rigor-ously investigated in viral ecology. For example, newcopurification methods allow simultaneous access toRNA and DNA viruses from the same sample (Andrews-Pfannkoch et al., 2010). While this is a giant step forwardfor sampling, it remains an open question whether themethod effectively purifies RNA and DNA viruses in amanner that preserves the relative representation ofthese viruses from the wild. Further, myriad sequencingand library preparation options now exist for generatingviral metagenomes that begs the question of their inter-comparability. With advancing sequencing and informat-ics technologies, quantitative evaluation becomespossible. Ultimately, as the field develops quantitativerigour with existing population level metrics, we will alsomigrate down the ‘single-entity genomics’ route (Allenet al., 2011) in the quest to map the population structureand quantify the relative abundance of viruses in wildcommunities. Our rigorous analysis of the current meth-odologies used for producing viral metagenomes comple-ments these single-cell genomics efforts towardsobtaining a less biased view of community compositionand protein diversity.
Experimental procedures
Isolation of nucleic acid from SIO seawatermicrobial fraction
Approximately 200 l of seawater was filtered through aWhatman GF/D (2.7 mm) prefilter onto a Millipore SteripakGP20 (0.2 mm) filter unit after which 10 ml of 0.2 mm filteredsucrose lysis buffer (SLB, 50 mM TrisCl pH 8.0, 40 mMEDTA, 0.75 M sucrose) was added and the unit stored at-80°C until DNA extraction. Total nucleic acid was isolatedusing a modification of the protocol described in Frias-Lopezand colleagues (2008). Briefly, lysozyme (5 mg ml-1 in SLB)was added to the thawed unit to a final concentration of0.5 mg ml-1. After incubation at 37°C for 30 min, 5 M NaCl(0.2 mm filtered) was added to a final concentration of 0.2 M.Proteinase K (20 mg ml-1) was then added (final concentra-tion 0.5 mg ml-1) along with 10% SDS (0.2 mm filtered, finalconcentration 1%) and the unit incubated at 55°C for 20 minfollowed by 70°C for 5 min. The lysate was removed (~ 14 ml)and extracted two times with phenol/chloroform (50:50 vol)equilibrated with TE followed by one extraction with chloro-form. Phases were separated by centrifugation at 4°C for5 min at 3320 g (4 K). Nucleic acid in the aqueous phase wasconcentrated using Amicon Ultra15 100 K MWCO filters (Mil-lipore) to approximately 600 ml. Because the A260/280 ratio wasbelow 1.8 when analysed by nanodrop, the nucleic acid wasfurther purified with one phenol/chloroform (50:50 vol) extrac-tion followed by one chloroform extraction. Thereafter, 3 Msodium acetate (0.2 mm filtered) was added (0.3 M final con-centration) followed by 2.5 ¥ volumes of 100% ethanol(0.2 mm filtered) to precipitate the nucleic acid overnight at-20°C. After centrifugation at 13 K for 20 min, the pellet waswashed with 70% ethanol and air-dried. The pellet was resus-pended in a total volume of 600 ml TE (10 mM TrisCl pH 8,1 mM EDTA, 0.2 mm filtered). By nanodrop, the total microbialnucleic acid recovered was 1.6 mg with an OD260/280 of 1.99and OD260/230 of 2.36.
Collection, concentration and purification of viralcommunity DNA
Approximately 210 l of surface seawater was collected fromScripps Pier (La Jolla, CA, USA; 7 April 2009) and prefilteredusing a 150 mm GF/A filter (Whatman International, Maid-stone, UK; Cat. #1820-150) and a 0.22 mm, 142 mm ExpressPlus filter (Millipore, Bellerica, MA, USA; Cat. #GPWP14250)with 20–50 l of filtrate haphazardly pooled into a 55 gallontrashcan that held ~ 180 l at a time to minimize any potentialvariation between 20 l and 50 l carboys. The viruses in thefiltrate were concentrated using either TFF or FeCl3 precipi-tation (FeCl3), the latter as in John and colleagues (2011). Forthe TFF method, triplicate 50 l subsamples were separatelyconcentrated using a large-scale, 100 kDa TFF (AmershamBiosciences, Westborough, MA, USA; Cat. #UFP-100-C-9A)to 0.65–1 l followed by a small-scale, 100 kDa TFF (Millipore,Bellerica, MA, USA; Cat. #PXB100C50) to 12–14 ml; viruseswere collected in the retentate after a final washing step. Forthe FeCl3 method, triplicate 20 l subsamples were subjectedto a chemistry-based concentration method (John et al.,2011) where FeCl3 creates virus iron precipitates that can
Viral community concentration and purification 1435
© 2012 Society for Applied Microbiology and Blackwell Publishing Ltd, Environmental Microbiology, 15, 1428–1440

be collected on 1.0 mm polycarbonate filters (GE Waterand Process Technologies, Trevose, PA, USA; Cat.#K10CP14220) and resuspended in magnesium-EDTA-ascorbate buffer (0.1 M Mg2EDTA, 0.2 M ascorbic acid,pH 6.0) using 1 ml of buffer per 1 l of seawater. Resuspen-sion was allowed to go overnight, rotating in the dark at 4°C,and the filters were transferred to fresh tubes and centrifugedfor 5 min at low speed to collect the remaining fluid. Theefficiency of recovery of viruses ranged from 18–26% usingTFF to 92–95% using FeCl3 precipitation (John et al., 2011),as determined by SYBR Gold staining and epifluorescencemicroscopy (Noble and Fuhrman, 1998).
The resulting FeCl3 precipitation viral concentrates werepurified using one of three methods – DNase only,DNase + CsCl or DNase + sucrose – with each 20 l split intothree purification methods. In contrast, the TFF viral concen-trates were only purified using DNase + CsCl. The ‘DNase-only’ method consisted of 100 U ml-1 DNase I (Roche,Indianapolis, IN, USA; Cat. #10-104-159-001) in reactionbuffer (10 mM Tris-HCl pH 7.6, 2.5 mM MgCl2, 0.5 mM CaCl2)for 2 h at room temperature on a tube rotator; DNase I wasinactivated by 100 mM (final concentration) of each EDTAand EGTA. The ‘DNase + CsCl’ method consisted of layeringDNase I-treated viral concentrates on top of CsCl-step gra-dients [1.7, 1.56, 1.4, 1.2 g ml-1 in 100 kDa seawater perme-ate that had been autoclaved and 0.02 mm filtered, sensu(Thurber et al., 2009)], followed by centrifugation in a SW40tirotor (Beckman) at 24 000 rpm (102 000 g) for 4 h, 10°C;viruses were harvested from fractions with densities of1.4–1.52 g ml-1. Finally, the ‘DNase + sucrose’ method con-sisted of a 38% (w/v) sucrose ‘cushion’ prepared in 0.2 mmfiltered SM buffer (50 mM Tris-HCl pH 7.5, 100 mM NaCl,8 mM MgSO4) whereby DNase I-treated viral concentratewas layered on top at a ratio of one part sucrose to threeparts viral concentrate. The tubes were centrifuged in aTH641 rotor (Sorvall) at 32 000 rpm (175 000 g) for 3 h,18°C. The pellets beneath the sucrose cushion were col-lected in Tris-EDTA buffer (TE, 10 mM Tris-HCl pH 7.6, 1 mMEDTA) containing 100 mM each EDTA and EGTA (S.J. Will-iamson, pers. comm.).
Extraction and linker amplification of viralcommunity DNA
DNA was extracted from concentrated, purified viral particlesusing Wizard® PCR Preps DNA Purification Resin and Mini-columns (Promega, Madison, WI, USA; Cat. #A7181 andA7211 respectively) as previously described (Henn et al.,2010).
The DNA was prepared for sequencing using a linkeramplification (LA) protocol modified from Henn and col-leagues (2010). Briefly, DNA was sheared to a size of 400–800 bp using Covaris Adaptive Focused Acoustics (AFA) withthe following conditions: 130 ml of DNA in TE buffer with up to5 mg of total DNA, duty cycle of 5%, intensity of 3, 200 cyclesper burst, for 62 s (E210). The DNA was concentrated to35 ml using Microcon YM-100 centrifugal filter units (Millipore,Bellerica, MA, USA; Cat. #42412). The End-It DNA End-Repair kit (Epicentre Biotechnologies, Madison, WI, USA;Cat. #ER 81050) was used to end repair the sheared DNA.
After clean-up using the Min-Elute Reaction Clean-up kit(Qiagen Sciences, Germantown, MD, USA; Cat. #28204), theDNA was ligated to a hemi-phosphorylated adaptor(Linker-A) using the Fast-Link DNA Ligation kit (EpicentreBiotechnologies, Madison, WI, USA; Cat. #LK 6201H). Thedouble-stranded Linker A was prepared by annealing thesingle-stranded forward oligonucleotide (5′-phosphorylated-GTA TGC TTC GTG ATC TGT GTG GGT GT-3′) to thereverse oligonucleotide (5′-CCA CAC AGA TCA CGA AGCATA C-3′). This was performed in TE (10 mM Tris-HCl pH 7.6,1 mM EDTA) buffer supplemented with 50 mM NaCl. TheDNA solution was heated in a water bath to 100°C for 5 min.The water bath was allowed to cool to room temperature andthe annealed linker DNA was then placed on ice for 5 min.Linker A was diluted to 10 mM in nuclease-free water beforeuse. After ligation, the DNA was immediately cleaned upusing the MinElute Reaction Clean-up kit. Linker-ligated DNAwas mixed with 6 ¥ Blue/Orange Loading Dye (Promega,Madison, WI, USA; Cat. #G1881) and size-fractionated by gelelectrophoresis in 1.5% SeaKem GTG agarose (Lonza,Rockland, MD, USA; Cat. #50071) prepared in sterile TAE(40 mM Tris-acetate, 2 mM EDTA) buffer and run at 80 V for90 min. DNA markers placed in the outermost lanes wereeither Quick Load 100 bp DNA Ladder (New EnglandBiolabs, Ipswich, MA, USA; Cat. #N0467S) or 1 kB-Plus DNALadder (Invitrogen, Carlsbad, CA, USA; Cat. #10787-026).The marker lanes were stained with ethidium bromide(1 ng ml-1) for 20 min and were used to as a guide to exciseDNA in the range of 400–800 bp. DNA was extracted from theagarose slice using the Min-Elute Gel Extraction kit (QiagenSciences, Germantown, MD, USA; Cat. #28604).
The base sequence of the PCR phos-A primer used foramplification was 5′p-CCACACAGATCACGAAGCATAC-3′.Because multiple sources of DNA were to be pooled prior tolibrary preparation for 454 pyrosequencing, 5 bp barcodeswere introduced at the 5′ end of the primer so that thesequences from different sources could be identified fromthe data. The PfuTurbo Hotstart system (Stratagene, LaJolla, CA, USA; Cat. #600600) was used for amplificationreactions. Reaction conditions were: 1–2 ml of Linker-Aligated, size-fractionated DNA, 12.5 ml of PfuTurbo Hotstart2X Master Mix (0.1 U PfuTurbo per microlitre), 0.5 ml(5 pmol) of the 10 mM PCR phos-A primer, brought up to25 ml with nuclease-free water (Promega, Madison, WI,USA; Cat. #P1193). Thermocycling conditions were dena-turation at 95°C for 2 min, cycling for 25 to 30 cycles using95°C for 30 s, 60°C for 60 s and 72°C for 90 s, and a finalextension at 72°C for 10 min. Products were analysed on1.5% agarose gels containing 0.5 ng ml-1 ethidium bromide,run in TAE buffer at 90 V for 30 min, using 5 ml of DNA.Amplified DNA was recovered from the PCR reaction mixesusing the MinElute PCR Purification kit (Qiagen Sciences,Germantown, MD, USA; Cat. #28004) according to themanufacturer’s directions. DNA was eluted off the mini-columns using 25–40 ml of the provided EB buffer warmedto 80°C. DNA was quantified using the Quant-iT Pico GreendsDNA assay kit (Invitrogen, Carlsbad, CA, USA; Cat.#P7589). Prior to sequencing library preparation, sampleswere pooled in equal amounts (generally consideredmolar equivalents due to shearing and size-fractionationsteps).
1436 B. L. Hurwitz, L. Deng, B. T. Poulos and M. B. Sullivan
© 2012 Society for Applied Microbiology and Blackwell Publishing Ltd, Environmental Microbiology, 15, 1428–1440
Sequencing viral community DNA
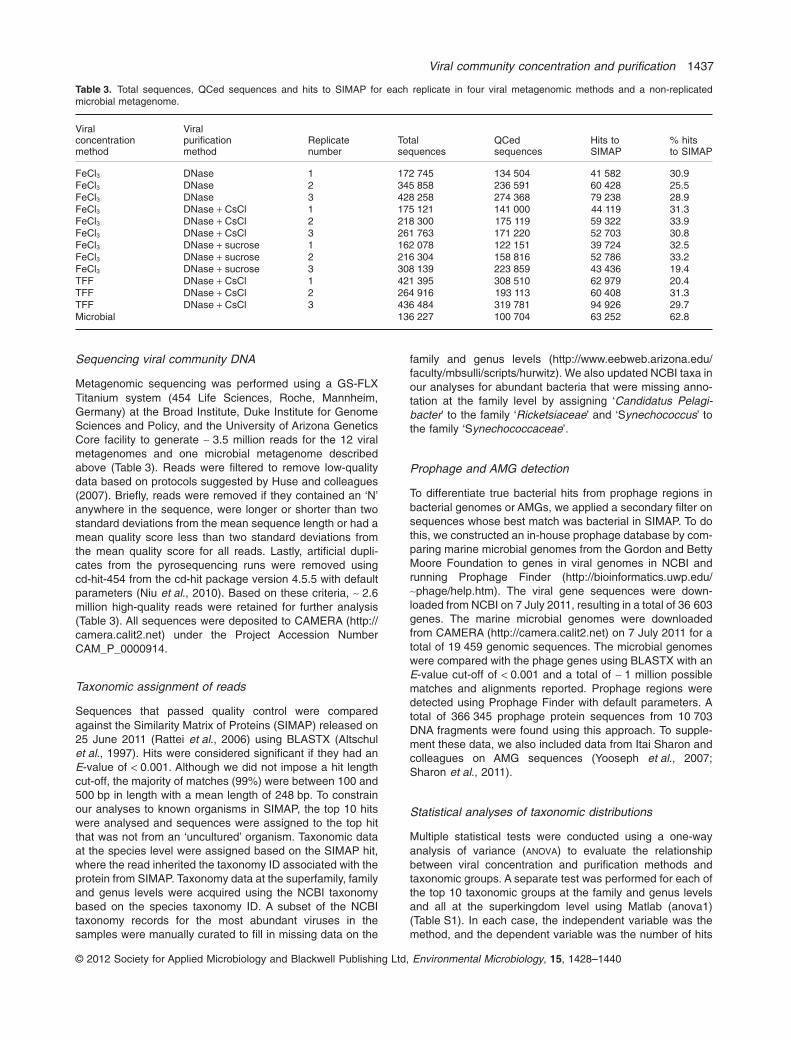
Metagenomic sequencing was performed using a GS-FLXTitanium system (454 Life Sciences, Roche, Mannheim,Germany) at the Broad Institute, Duke Institute for GenomeSciences and Policy, and the University of Arizona GeneticsCore facility to generate ~ 3.5 million reads for the 12 viralmetagenomes and one microbial metagenome describedabove (Table 3). Reads were filtered to remove low-qualitydata based on protocols suggested by Huse and colleagues(2007). Briefly, reads were removed if they contained an ‘N’anywhere in the sequence, were longer or shorter than twostandard deviations from the mean sequence length or had amean quality score less than two standard deviations fromthe mean quality score for all reads. Lastly, artificial dupli-cates from the pyrosequencing runs were removed usingcd-hit-454 from the cd-hit package version 4.5.5 with defaultparameters (Niu et al., 2010). Based on these criteria, ~ 2.6million high-quality reads were retained for further analysis(Table 3). All sequences were deposited to CAMERA (http://camera.calit2.net) under the Project Accession NumberCAM_P_0000914.
Taxonomic assignment of reads
Sequences that passed quality control were comparedagainst the Similarity Matrix of Proteins (SIMAP) released on25 June 2011 (Rattei et al., 2006) using BLASTX (Altschulet al., 1997). Hits were considered significant if they had anE-value of < 0.001. Although we did not impose a hit lengthcut-off, the majority of matches (99%) were between 100 and500 bp in length with a mean length of 248 bp. To constrainour analyses to known organisms in SIMAP, the top 10 hitswere analysed and sequences were assigned to the top hitthat was not from an ‘uncultured’ organism. Taxonomic dataat the species level were assigned based on the SIMAP hit,where the read inherited the taxonomy ID associated with theprotein from SIMAP. Taxonomy data at the superfamily, familyand genus levels were acquired using the NCBI taxonomybased on the species taxonomy ID. A subset of the NCBItaxonomy records for the most abundant viruses in thesamples were manually curated to fill in missing data on the
family and genus levels (http://www.eebweb.arizona.edu/faculty/mbsulli/scripts/hurwitz). We also updated NCBI taxa inour analyses for abundant bacteria that were missing anno-tation at the family level by assigning ‘Candidatus Pelagi-bacter’ to the family ‘Ricketsiaceae’ and ‘Synechococcus’ tothe family ‘Synechococcaceae’.
Prophage and AMG detection
To differentiate true bacterial hits from prophage regions inbacterial genomes or AMGs, we applied a secondary filter onsequences whose best match was bacterial in SIMAP. To dothis, we constructed an in-house prophage database by com-paring marine microbial genomes from the Gordon and BettyMoore Foundation to genes in viral genomes in NCBI andrunning Prophage Finder (http://bioinformatics.uwp.edu/~phage/help.htm). The viral gene sequences were down-loaded from NCBI on 7 July 2011, resulting in a total of 36 603genes. The marine microbial genomes were downloadedfrom CAMERA (http://camera.calit2.net) on 7 July 2011 for atotal of 19 459 genomic sequences. The microbial genomeswere compared with the phage genes using BLASTX with anE-value cut-off of < 0.001 and a total of ~ 1 million possiblematches and alignments reported. Prophage regions weredetected using Prophage Finder with default parameters. Atotal of 366 345 prophage protein sequences from 10 703DNA fragments were found using this approach. To supple-ment these data, we also included data from Itai Sharon andcolleagues on AMG sequences (Yooseph et al., 2007;Sharon et al., 2011).
Statistical analyses of taxonomic distributions
Multiple statistical tests were conducted using a one-wayanalysis of variance (ANOVA) to evaluate the relationshipbetween viral concentration and purification methods andtaxonomic groups. A separate test was performed for each ofthe top 10 taxonomic groups at the family and genus levelsand all at the superkingdom level using Matlab (anova1)(Table S1). In each case, the independent variable was themethod, and the dependent variable was the number of hits
Table 3. Total sequences, QCed sequences and hits to SIMAP for each replicate in four viral metagenomic methods and a non-replicatedmicrobial metagenome.
Viralconcentrationmethod
Viralpurificationmethod
Replicatenumber
Totalsequences
QCedsequences
Hits toSIMAP
% hitsto SIMAP
FeCl3 DNase 1 172 745 134 504 41 582 30.9FeCl3 DNase 2 345 858 236 591 60 428 25.5FeCl3 DNase 3 428 258 274 368 79 238 28.9FeCl3 DNase + CsCl 1 175 121 141 000 44 119 31.3FeCl3 DNase + CsCl 2 218 300 175 119 59 322 33.9FeCl3 DNase + CsCl 3 261 763 171 220 52 703 30.8FeCl3 DNase + sucrose 1 162 078 122 151 39 724 32.5FeCl3 DNase + sucrose 2 216 304 158 816 52 786 33.2FeCl3 DNase + sucrose 3 308 139 223 859 43 436 19.4TFF DNase + CsCl 1 421 395 308 510 62 979 20.4TFF DNase + CsCl 2 264 916 193 113 60 408 31.3TFF DNase + CsCl 3 436 484 319 781 94 926 29.7Microbial 136 227 100 704 63 252 62.8
Viral community concentration and purification 1437
© 2012 Society for Applied Microbiology and Blackwell Publishing Ltd, Environmental Microbiology, 15, 1428–1440
to the taxonomic group being tested. Because each of themethods and replicates had a variable number of totalsequences, we normalized the hit count prior to our analysisby dividing the hits by the total sequences in the replicate andmultiplying by 196 000 (the average number of sequencesper library in 1000s). If the ANOVA was deemed to be signifi-cant (P-value was < 0.05), we performed follow-up testsusing the Tukey HSD test in Matlab (multcompare) to evalu-ate pairwise differences and identify means that differedbetween methods.
Microbial genomic recruitment plots
To investigate whether hits to microbial genomes were fromprophage or AMGs or sporadic microbial contamination, wecreated genomic recruitment plots for five abundantmicrobes: alphaproteobacterium HIMB114, Daphnia pulex,alphaproteobacterium BAL199, and gammaproteobacteriaHTCC 2143 and HTCC 2148. To do this, we comparedsequences whose best BLAST match was to the aforemen-tioned genomes to the contig sequences from each respec-tive genome. Each hit was required to match with an E-valueof < 0.001 and only the top match was retained. We used aMatlab script provided by Maureen Coleman to plot the blastdata for the reads along a reference genome and calcu-late the coverage (http://www.eebweb.arizona.edu/faculty/mbsulli/scripts/hurwitz). Prophage regions were differentiatedfrom AMGs because read coverage in these regions spanned> 4 kb in the microbial genome and was not confined to asingle gene. Both AMG and prophage regions could be dif-ferentiated from sporadic contamination from microbialgenomes based on a lack of alignment to the rest of thegenome.
K-mer analysis for discovering ‘rare’ sequences
Rare sequences (k-mer = 1) were distinguished from moreabundant sequences (k-mer > 1) in the samples usingvmatch version 2.1.5 (http://www.vmatch.de/). Specifically,we used mkvtree to create a suffix array for each sample, andthen used vmerstat to search for the frequency of 20-mers ineach of our metagenomic sequences with a minimum occur-rence of 2 as compared with other sequences in the samesample. We parsed the vmatch data using a PERL script toassign a single frequency to each sequence based on themode k-mer frequency of all of its 20-mer subsequences. Thehigh-throughput data-processing pipeline containing thescripts for running these analyses is available here (http://www.eebweb.arizona.edu/faculty/mbsulli/scripts/hurwitz).
Protein clustering and rarefaction
In order to find proteins, reads with a k-mer frequency > 1were assembled into larger contigs using velvet version1.0.15 (hash length = 29, -long) (Zerbino and Birney, 2008).Open reading frames were determined both on the individualreads (Table 3) and in assembled contigs using the metage-nomic mode in Prodigal (Hyatt et al., 2010). Only non-redundant ORFs > 60 amino acids in length were retained.Protein sequences were clustered based on homology using
cd-hit-v4.5.5-2011-03-31 (Niu et al., 2010) in a two-stepprocess. First, we downloaded core cluster GOS (Yoosephet al., 2007) proteins from CAMERA (http://camera.calit2.net)and recruited sequences to known GOS protein clustersusing cd-hit-2d (′-g 1 -n 4 -d 0 -T 24 -M 45000′). Sequenceswere considered to have a match if they hit with > 60%identity and > 80% coverage to the smallest sequence.Sequences that did not recruit to GOS protein clusters werethen self-clustered using cd-hit with the same parameters asabove. In total, our reads mapped to 11 116 GOS clustersand 6178 novel clusters with greater than 20 members. Whenwe subtracted out data from the SIO microbial data set, ourreads mapped to 6845 GOS clusters and 6178 novel clus-ters, with 449 980 and 210 451 reads respectively. The clus-tering pipeline containing the scripts for running theseanalyses is available here (http://www.eebweb.arizona.edu/faculty/mbsulli/scripts/hurwitz).
We compared all of the high-quality metagenomic reads inour data set (Table 3) with the sequences in the 20 + proteinclusters using BLASTX (E-value < 0.001). Based on thesedata, we generated hit counts to the protein clusters and usedthe data for further rarefaction analysis using the rarefactioncalculator (http://www.biology.ualberta.ca/jbrzusto/rarefact.php).
Acknowledgements
Tucson Marine Phage Lab members for comments on themanuscript, as well as J. Brum, S. John, J.C. Ignacio-Espinoza, M. Knatz, B. Nankivell, E. Allers and E. Allen forlogistical support, sample collection and/or processing of viralconcentrates. Two anonymous reviewers for suggestions toimprove the manuscript. UITS Research Computing Groupand the Arizona Research Laboratories Biotech Computingfor high-performance computing access and support. Thiswork was supported by a Gordon and Betty Moore Founda-tion grant to M. B. S. and NSF IGERT and GraduateResearch Fellowships to B. L. H.
References
Allen, L.Z., Ishoey, T., Novotny, M.A., McLean, J.S., Lasken,R.S., and Williamson, S.J. (2011) Single virus genomics: anew tool for virus discovery. PLoS ONE 6: e17722.
Altschul, S.F., Madden, T.L., Schaffer, A.A., Zhang, J.H.,Zhang, Z., Miller, W., and Lipman, D.J. (1997) GappedBLAST and PSI-BLAST: a new generation of protein data-base search programs. Nucleic Acids Res 25: 3389–3402.
Andrews-Pfannkoch, C., Fadrosh, D.W., Thorpe, J., and Wil-liamson, S.J. (2010) Hydroxyapatite-mediated separationof double-stranded DNA, single-stranded DNA, and RNAgenomes from natural viral assemblages. Appl EnvironMicrobiol 76: 5039–5045.
Angly, F.E., Felts, B., Breitbart, M., Salamon, P., Edwards,R.A., Carlson, C., et al. (2006) The marine viromes of fouroceanic regions. PLoS Biol 4: e368.
Bench, S.R., Hanson, T.E., Williamson, K.E., Ghosh, D.,Radosovich, M., Wang, K., and Wommack, K.E. (2007)Metagenomic characterization of Chesapeake bay viri-oplankton. Appl Environ Microbiol 73: 7629–7641.
1438 B. L. Hurwitz, L. Deng, B. T. Poulos and M. B. Sullivan
© 2012 Society for Applied Microbiology and Blackwell Publishing Ltd, Environmental Microbiology, 15, 1428–1440
Biers, E.J., Wang, K., Pennington, C., Belas, R., Chen, F.,and Moran, M.A. (2008) Occurrence and expression ofgene transfer agent genes in marine bacterioplankton.Appl Environ Microbiol 74: 2933–2939.
Bragg, J.G., and Chisholm, S.W. (2008) Modelling the fitnessconsequences of a cyanophage-encoded photosynthesisgene. PLoS ONE 3: e3550.
Breitbart, M., Salamon, P., Andresen, B., Mahaffy, J.M.,Segall, A.M., Mead, D., et al. (2002) Genomic analysis ofuncultured marine viral communities. Proc Natl Acad SciUSA 99: 14250–14255.
Breitbart, M., Hewson, I., Felts, B., Mahaffy, J.M., Nulton, J.,Salamon, P., and Rohwer, F. (2003) Metagenomic analy-ses of an uncultured viral community from human feces.J Bacteriol 185: 6220–6223.
Breitbart, M., Felts, B., Kelley, S., Mahaffy, J.M., Nulton, J.,Salamon, P., and Rohwer, F. (2004) Diversity and popula-tion structure of a near-shore marine-sediment viralcommunity. Proc R Soc Lond B Biol Sci 271: 565–574.
Breitbart, M., Thompson, L.R., Suttle, C.S., and Sullivan,M.B. (2007) Exploring the vast diversity of marine viruses.Oceanography 20: 353–362.
Cantalupo, P.G., Calgua, B., Zhao, G., Hundesa, A., Wier,A.D., Katz, J.P., et al. (2011) Raw sewage harbors diverseviral populations. mBio 2: e00180-11.
Carrigg, C., Rice, O., Kavanagh, S., Collins, G., andO’Flaherty, V. (2007) DNA extraction method affects micro-bial community profiles from soils and sediment. ApplMicrobiol Biotechnol 77: 955–964.
Casjens, S. (2003) Prophages and bacterial genomics: whathave we learned so far? Mol Microbiol 49: 277–300.
Clokie, M.R.J., Shan, J., Bailey, S., Jia, Y., and Krisch, H.M.(2006) Transcription of a ‘photosynthetic’ T4-type phageduring infection of a marine cyanobacterium. EnvironMicrobiol 8: 827–835.
Dammeyer, T., Bagby, S.C., Sullivan, M.B., Chisholm, S.W.,and Frankenberg-Dinkel, N. (2008) Efficient phage-mediated pigment biosynthesis in oceanic cyanobacteria.Curr Biol 18: 442–448.
Dinsdale, E.A., Edwards, R.A., Hall, D., Angly, F., Breitbart,M., Brulc, J.M., et al. (2008) Functional metagenomic pro-filing of nine biomes. Nature 452: 629–632.
Duhaime, M., Deng, L., Poulos, B., and Sullivan, M. (2012)Towards quantitative metagenomics of wild viruses andother ultra-low concentration DNA samples: a rigorousassessment and optimization of the linker amplificationmethod. Environ Microbiol. In press.
Edwards, R.A., and Rohwer, F. (2005) Viral metagenomics.Nat Rev Microbiol 3: 504–510.
Erlwein, O., Robinson, M.J., Dustan, S., Weber, J., Kaye, S.,and McClure, M.O. (2011) DNA extraction columns con-taminated with murine sequences. PLoS ONE 6: e23484.
Evans, G.E., Murdoch, D.R., Anderson, T.P., Potter, H.C.,George, P.M., and Chambers, S.T. (2003) Contamination ofQiagen DNA extraction kits with legionella DNA. J ClinMicrobiol 41: 3452–3453.
Frias-Lopez, J., Shi, Y., Tyson, G.W., Coleman, M.L.,Schuster, S.C., Chisholm, S.W., and DeLong, E.F. (2008)Microbial community gene expression in ocean surfacewaters. Proc Natl Acad Sci USA 105: 3805–3810.
Fuhrman, J.A. (1999) Marine viruses and their biogeochemi-cal and ecological effects. Nature 399: 541–548.
Fuhrman, J.A. (2000) Impact of viruses on bacterial pro-cesses. In Microbial Ecology of the Oceans. Kirchman,D.L. (ed.). New York, NY, USA: Wiley-Liss, pp. 327–350.
Hellweger, F.L. (2009) Carrying photosynthesis genesincreases ecological fitness of cyanophage in silico.Environ Microbiol 11: 1386–1394.
Henn, M., Sullivan, M.B., Strange-Thomann, N., Osburne,M.S., Berlin, A.M., Kelly, L., et al. (2010) Analysis of high-throughput sequencing and annotation strategies forphage genomes. PLoS ONE 5: e9083.
Huse, S.M., Huber, J.A., Morrison, H.G., Sogin, M.L., andMark Welch, D. (2007) Accuracy and quality of massivelyparallel DNA pyrosequencing. Genome Biol 8: R143.
Hyatt, D., Chen, G.L., LoCascio, P.F., Land, M.L., Larimer,F.W., and Hauser, L.J. (2010) Prodigal: prokaryotic generecognition and translation initiation site identification. BMCBioinformatics 11: 119.
John, S.G., Mendez, C.B., Deng, L., Poulos, B., Kauffman,A.K.M., Kern, S., et al. (2011) A simple and efficient methodfor concentration of ocean viruses by chemical flocculation.Environ Microbiol Rep 3: 195–202.
Kim, K.H., and Bae, J.W. (2011) Amplification methods biasmetagenomic libraries of uncultured single-stranded anddouble-stranded DNA viruses. Appl Environ Microbiol 77:7663–7668.
Kim, K.H., Chang, H.W., Nam, Y.D., Roh, S.W., Kim, M.S.,Sung, Y., et al. (2008) Amplification of uncultured single-stranded DNA viruses from rice paddy soil. Appl EnvironMicrobiol 74: 5975–5985.
Lang, A.S., and Beatty, J.T. (2007) Importance of widespreadgene transfer agent genes in alpha-proteobacteria. TrendsMicrobiol 15: 54–62.
Lawrence, J.E., and Steward, G.F. (2010) Purification ofviruses by centrifugation. In Manual of Aquatic ViralEcology. Wilhelm, S.W., Weinbauer, M.G., and Suttle, C.A.(eds). Waco, TX, USA: American Society of Limnology andOceanography, pp. 166–181.
Lindell, D., Sullivan, M.B., Johnson, Z.I., Tolonen, A.C.,Rohwer, F., and Chisholm, S.W. (2004) Transfer of photo-synthesis genes to and from Prochlorococcus viruses.Proc Natl Acad Sci USA 101: 11013–11018.
Lindell, D., Jaffe, J.D., Johnson, Z.I., Church, G.M., and Chish-olm, S.W. (2005) Photosynthesis genes in marine virusesyield proteins during host infection. Nature 438: 86–89.
McHardy, A.C., and Rigoutsos, I. (2007) What’s in the mix:phylogenetic classification of metagenome sequencesamples. Curr Opin Microbiol 10: 499–503.
Mann, N.H., Cook, A., Millard, A., Bailey, S., and Clokie, M.(2003) Bacterial photosynthesis genes in a virus. Nature424: 741.
Morgan, J.L., Darling, A.E., and Eisen, J.A. (2010) Metage-nomic sequencing of an in vitro-simulated microbial com-munity. PLoS ONE 5: e10209.
Niu, B.F., Fu, L.M., Sun, S.L., and Li, W.Z. (2010) Artificialand natural duplicates in pyrosequencing reads of metage-nomic data. BMC Bioinformatics 11: 187.
Noble, R.T., and Fuhrman, J.A. (1998) Use of SYBR Green Ifor rapid epifluorescence counts of marine viruses andbacteria. Aquat Microb Ecol 14: 113–118.
Viral community concentration and purification 1439
© 2012 Society for Applied Microbiology and Blackwell Publishing Ltd, Environmental Microbiology, 15, 1428–1440
Rattei, T., Arnold, R., Tischler, P., Lindner, D., Stumpflen, V.,and Mewes, H.W. (2006) SIMAP: the similarity matrix ofproteins. Nucleic Acids Res 34: D252.
Rohwer, F. (2003) Global phage diversity. Cell 113: 141.Sharon, I., Tzahor, S., Williamson, S., Shmoish, M., Man-
Aharonovich, D., Rusch, D.B., et al. (2007) Viral photosyn-thetic reaction center genes and transcripts in the marineenvironment. ISME J 1: 492–501.
Sharon, I., Battchikova, N., Aro, E.M., Giglione, C., Meinnel,T., Glaser, F., et al. (2011) Comparative metagenomics ofmicrobial traits within oceanic viral communities. ISME J 5:1178–1190.
Shen, H., Rogelj, S., and Kieft, T.L. (2006) Sensitive, real-time PCR detects low-levels of contamination byLegionella pneumophila in commercial reagents. Mol CellProbes 20: 147–153.
Stanton, T.B. (2007) Prophage-like gene transfer agents-novel mechanisms of gene exchange for Methanococcus,Desulfovibrio, Brachyspira, and Rhodobacter species.Anaerobe 13: 43–49.
Sullivan, M.B., Coleman, M., Weigele, P., Rohwer, F., andChisholm, S.W. (2005) Three Prochlorococcus cyanoph-age genomes: signature features and ecological interpre-tations. PLoS Biol 3: e144.
Sullivan, M.B., Lindell, D., Lee, J.A., Thompson, L.R., Bielaw-ski, J.P., and Chisholm, S.W. (2006) Prevalence and evo-lution of core photosystem II genes in marinecyanobacterial viruses and their hosts. PLoS Biol 4: e234.
Suttle, C.A. (2005) Viruses in the sea. Nature 437: 356–361.Suttle, C.A. (2007) Marine viruses – major players in the
global ecosystem. Nat Rev Microbiol 5: 801–812.Temperton, B., Field, D., Oliver, A., Tiwari, B., Mühling, M.,
Joint, I., and Gilbert, J.A. (2009) Bias in assessments ofmarine microbial biodiversity in fosmid libraries as evalu-ated by pyrosequencing. ISME J 3: 792–796.
Thurber, R.V., Haynes, M., Breitbart, M., Wegley, L., andRohwer, F. (2009) Laboratory procedures to generate viralmetagenomes. Nat Protoc 4: 470–483.
Weinbauer, M.G. (2004) Ecology of prokaryotic viruses.FEMS Microbiol Rev 28: 127–181.
Williamson, S.J., Rusch, D.B., Yooseph, S., Halpern, A.L.,Heidelberg, K.B., Glass, J.I., et al. (2008) The Sorcerer IIGlobal Ocean Sampling Expedition: metagenomic charac-terization of viruses within aquatic microbial samples.PLoS ONE 3: e1456.
Wommack, K.E., and Colwell, R.R. (2000) Virioplankton:viruses in aquatic ecosystems. Microbiol Mol Biol Rev 64:69–114.
Wommack, K.E., Sime-Ngando, T., Winget, D.M., Jamindar,S., and Helton, R.R. (2010) Filtration-based methods forthe collection of viral concentrates from large watersamples. In Manual of Aquatic Viral Ecology. Wilhelm,S.W., Weinbauer, M.G., and Suttle, C.A. (eds). Waco, TX,USA: American Society of Limnology and Oceanography,pp. 110–117.
Yilmaz, S., Allgaier, M., and Hugenholtz, P. (2010) Multipledisplacement amplification compromises quantitativeanalysis of metagenomes. Nat Methods 7: 943–944.
Yooseph, S., Sutton, G., Rusch, D.B., Halpern, A.L., William-son, S.J., Remington, K., et al. (2007) The Sorcerer IIGlobal Ocean Sampling expedition: expanding the uni-verse of protein families. PLoS Biol 5: e16.
Yoshida, T., Claverie, J., and Ogata, H. (2011) Mimivirusreveals Mre11/Rad50 fusion proteins with a sporadic dis-tribution in eukaryotes, bacteria, viruses and plasmids.Virol J 8: 427–436.
van der Zee, A., Peeters, M., de Jong, C., Verbakel, H.,Crielaard, J.W., Claas, E.C., and Templeton, K.E. (2002)Qiagen DNA extraction kits for sample preparation forlegionella PCR are not suitable for diagnostic purposes.J Clin Microbiol 40: 1126.
Zerbino, D.R., and Birney, E. (2008) Velvet: algorithms for denovo short read assembly using de Bruijn graphs. GenomeRes 18: 821–829.
Supporting information
Additional Supporting Information may be found in the onlineversion of this article:
Fig. S1. Superkingdom taxonomic profile across triplicatesamples from each of the four viral metagenome methodsand a non-replicated microbial metagenome. Note that thesedata represent only those metagenomic reads that had asignificant hit to the SIMAP database.Fig. S2. Fragment recruitment plots that show the distribu-tion of metagenomic sequence reads that map to five abun-dant microbial genomes.Table S1. The results of a one-way analysis of variance forthe top taxonomic levels based on rank abundance in thesamples by superkingdom, family and genus. Significantresults are shown in bold. Abbreviations are used for eachmethod: FC = FeCl3 CsCl + DNase, FS = FeCl3 sucrose +DNase, FD = FeCl3 DNase, TC = TFF and CsCl + DNase andTF = TFF CsCl + DNase.
1440 B. L. Hurwitz, L. Deng, B. T. Poulos and M. B. Sullivan
© 2012 Society for Applied Microbiology and Blackwell Publishing Ltd, Environmental Microbiology, 15, 1428–1440