evaluation of hot in-place recycle - washington … · evaluation of hot in-place recycle. ......
TRANSCRIPT

June 2010Mark RussellJeff S. UhlmeyerJoe DeVolChris JohnsonJim Weston
WA-RD 738.1
Office of Research & Library Services
WSDOT Research Report
Evaluation of Hot In-Place Recycle

Experimental Feature Report
__________________________________________________________
Post-Construction Report
Experimental Feature 09-01
Evaluation of Hot In-Place Recycling
Contract 7648
SR-542
Britton Road to Coal Creek Bridge Vicinity
MP 3.38 to MP 19.27

Experimental Feature Report
__________________________________________________________
June 2010 ii
1. REPORT NO. 2. GOVERNMENT ACCESSION NO. 3. RECIPIENT'S CATALOG NO.
WA-RD 738.1
4. TITLE AND SUBTITLE 5. REPORT DATE
Evaluation of Hot In-Place Recycle June 2010
6. PERFORMING ORGANIZATION CODE
WA 09-01 7. AUTHOR(S) 8. PERFORMING ORGANIZATION REPORT NO.
Mark Russell, Jeff S. Uhlmeyer, Joe DeVol, Chris Johnson and Jim Weston
. PERFORMING ORGANIZATION NAME AND ADDRESS 10. WORK UNIT NO.
Washington State Department of Transportation
Materials Laboratory, MS-47365 11. CONTRACT OR GRANT NO.
Olympia, WA 98504-7365 12. SPONSORING AGENCY NAME AND ADDRESS 13. TYPE OF REPORT AND PERIOD COVERED
Washington State Department of Transportation Transportation Building, MS 47372
Post-Construction Report
Olympia, Washington 98504-7372 14. SPONSORING AGENCY CODE
Project Manager: Kim Willoughby, 360-705-7978 15. SUPPLEMENTARY NOTES
This study was conducted in cooperation with the U.S. Department of Transportation, Federal Highway Administration. 16. ABSTRACT
This report documents the construction of hot in-place recycled (HIPR) pavement on SR 542. HIPR is a process by which rehabilitation of the existing HMA pavement occurs on site in one operation. HIPR project selection, mix design, construction and testing are described. The HIPR process successfully rehabilitated the pavement on SR 542 while using less new material than a traditional HMA mill and fill. HIPR was found to reduce initial project cost and traffic disruptions were less than HMA paving. This project will be evaluated for five years at which time a final report documenting the HIPR performance will be produced. 17. KEY WORDS 18. DISTRIBUTION STATEMENT
hot in place recycling, asphalt recycling, remixing
No restrictions. This document is available to the public through the National Technical Information Service, Springfield, VA 22616
19. SECURITY CLASSIF. (of this report) 20. SECURITY CLASSIF. (of this page) 21. NO. OF PAGES 22. PRICE
None None 76

Experimental Feature Report
__________________________________________________________
June 2010 iii
DISCLAIMER
The contents of this report reflect the views of the authors, who are responsible for the
facts and the accuracy of the data presented herein. The contents do not necessarily reflect the
official views or policies of the Washington State Department of Transportation or the Federal
Highway Administration. This report does not constitute a standard, specification, or regulation.

Experimental Feature Report
__________________________________________________________
June 2010 iv
Acknowledgement
The authors would like to thank Granite Construction, GreenRoads Recycling, the Northwest
Region Materials Lab and the Mount Baker Area for their contributions to this report. The
atmosphere of teamwork and free sharing of information was a major factor in making the SR
542 hot in-place recycling project a success and provided invaluable information for this report
that could not have been obtained from other sources.

Experimental Feature Report
__________________________________________________________
June 2010 v
Table of Contents
Introduction ..................................................................................................................................... 1
Definitions....................................................................................................................................... 1
HIPR Process .................................................................................................................................. 2
HIPR Benefits ................................................................................................................................. 3
HIPR Project Selection ................................................................................................................... 3
Pavement Structure ..................................................................................................................... 3
Material Deficiencies .................................................................................................................. 4
Geometric Elements .................................................................................................................... 4
Constructability ........................................................................................................................... 5
Environmental Considerations .................................................................................................... 5
Project Background ......................................................................................................................... 6
Traffic ......................................................................................................................................... 7
Contract Information ................................................................................................................... 7
Existing HMA Pavement ............................................................................................................ 7
Milepost 3.38 to 9.43 .............................................................................................................. 7
Milepost 9.43 to 9.94 .............................................................................................................. 8
Milepost 9.94 to 19.27 ............................................................................................................ 8
HIPR Mix Design Process .............................................................................................................. 8
Evaluation of the Existing HMA ................................................................................................ 9
Determination of Rejuvenation Requirements ............................................................................ 9
Determination of Admixture Requirements................................................................................ 9
Fabrication and Testing of Trial Mixes .................................................................................... 10
Selection of Optimum Mix ....................................................................................................... 10
SR 542 Mix Design ....................................................................................................................... 10
Evaluation of the Existing HMA .............................................................................................. 11
Determination of Recycling Agent Requirements .................................................................... 12
Determination of Admixture Requirements.............................................................................. 12
Fabrication and Testing of Sample Mixes ................................................................................ 13
Selection of Optimum Mix ....................................................................................................... 14
SR 542 HIPR Construction ........................................................................................................... 15
Equipment ................................................................................................................................. 15
Preheaters .............................................................................................................................. 15
Heater Scarifier (Unit A) ...................................................................................................... 16
Heater Scarifier (Unit B) ....................................................................................................... 17
Paving Machine .................................................................................................................... 18
Rollers ................................................................................................................................... 19
Mix Temperature ...................................................................................................................... 19
Test Results ............................................................................................................................... 20
Density Test Results ............................................................................................................. 20
Mix Testing Results .............................................................................................................. 23
Project Cost ................................................................................................................................... 25

Experimental Feature Report
__________________________________________________________
June 2010 vi
Recap Meeting .............................................................................................................................. 26
Conclusions ................................................................................................................................... 28
Recommendations ......................................................................................................................... 28
Appendix A ................................................................................................................................. A-1
Appendix B ................................................................................................................................. B-1
Appendix C ................................................................................................................................. C-1
Appendix D ................................................................................................................................. D-1
Appendix E .................................................................................................................................. E-1
Appendix F................................................................................................................................... F-1
List of Figures Figure 1. Project location. .............................................................................................................. 6
Figure 2. Preheater unit consisting of a propane truck and trailer with propane fired heaters. ... 16
Figure 3. Removing rubber tires prior to paving. ........................................................................ 16
Figure 4. Front left side of Unit A. .............................................................................................. 16
Figure 5. Right rear of unit A and towed trailer with heater........................................................ 16
Figure 6. Milling head on left side of unit A removes a five-foot strip from the left side of the lane. An identical milling head removes the same amount from the right side. .......................... 17
Figure 7. Milled HMA behind unit A is windrowed into the center of the lane. ......................... 17
Figure 8. Left rear of unit B. ........................................................................................................ 18
Figure 9. Right front of unit B showing hopper for admixture. ................................................... 18
Figure 10. Truck dumping admixture into hopper of unit B......................................................... 18
Figure 11. Millings from the full width milling head on unit B (right side of photo) are windrowed with millings from conveyer (top center). ................................................................. 18
Figure 12. RoadTec RP 235 paving machine. .............................................................................. 19
Figure 13. Rear view of RoadTec paving machine....................................................................... 19
Figure 14. Thermal image showing uniform temperature across the mat. ................................... 20
Figure 15. Maximum mat temperature was approximately 240°F. .............................................. 20
Figure 16. Plot of nuclear density gauge readings vs. core density results. ................................. 22
Figure 17. Distribution of corrected nuclear density test results for milepost 14.09 to 19.27. ..... 22
Figure 18. Comparison of normal distributions of HIPR density test results to WSDOT HMA density testing between 1990 and 2005. ....................................................................................... 23
List of Tables Table 1. Gradation and asphalt content from core testing. .......................................................... 11
Table 2. Binder properties obtained from cores. .......................................................................... 11
Table 3. Gradation specifications of admixture options. ............................................................. 13
Table 4. Gradation and volumetric properties of trial blends. ..................................................... 14
Table 5. Roller descriptions. ........................................................................................................ 19

Experimental Feature Report
__________________________________________________________
June 2010 vii
Table 6. Milepost limits of HMA recycled by HIPR. .................................................................. 21
Table 7. WSDOT gradation, asphalt content and volumetric tests results. ................................. 24
Table 8. Granite admixture test results. ....................................................................................... 25
Table 9. Contract 7648 HIPR costs.............................................................................................. 25

Experimental Feature Report
__________________________________________________________
June 2010 1
Introduction
Hot in-place recycling (HIPR) is a technology that promises to reduce energy
consumption and lower the cost of hot mix asphalt (HMA) pavement rehabilitation. The
traditional method of recycling HMA pavement in Washington State is to grind the top layer of
the existing pavement, truck it back to the asphalt plant, stockpile it, and then incorporate it back
into new HMA. HIPR eliminates the trucking and handling of the recycled HMA by performing
the complete process in one pass. If successful the HIPR process will provide the Washington
State Department of Transportation (WSDOT) an additional rehabilitation technology that
potentially saves money and conserves resources. This report documents the construction of the
HIPR pavement on SR 542. A final report documenting the performance of the HIPR will be
written five years after completion of construction.
Definitions
During the HIPR process the bituminous mixture takes several different forms. These
include the HMA pavement before it is recycled, the loose mix during the recycling process and
the finished HIPR pavement. To avoid confusion it is necessary to have a clear definition of the
bituminous mixture during each stage. To that end this report uses the following definitions to
describe the forms the bituminous mixture can take during the different stages of the HIPR
process:
Existing HMA Pavement: The HMA pavement in the roadway to be rehabilitated
before milling.
Hot Millings: The existing HMA after it has been milled from the
roadway and until it has been placed by the paver.
Admixture: Additional virgin asphalt and aggregate added to the hot
millings during the HIPR process.

Experimental Feature Report
__________________________________________________________
June 2010 2
HIPR Pavement: Pavement recycled by the HIPR process after it has been
placed by the paving machine.
HIPR Process
HIPR is a process by which rehabilitation of the existing HMA pavement occurs on site
in one operation. The process begins by heating the existing HMA pavement to a temperature
high enough to allow milling or scarifying equipment to easily remove the upper layer of
existing HMA pavement from the roadway surface. After removal from the roadway, some
HIPR processes improve the properties of the HIPR pavement by adding aggregate, asphalt and
rejuvenator to the hot millings. Finally, conventional paving equipment spreads and re-compacts
the recycled pavement. The Asphalt Recycling and Reclaiming Association (ARRA) identifies
three HIPR processes; surface recycling, remixing and repaving (ARRA 2001):
Surface recycling is the oldest and simplest HIPR process. The existing HMA pavement
is softened by heating before being milled or scarified from the surface. The hot millings are
then mixed, spread and re-compacted without any further processing. Rejuvenating agent may
be added to the hot millings if needed. Surface recycling can only rehabilitate the top inch of
pavement and is often followed by an HMA or bituminous surface treatment (BST) overlay.
The remixing process is similar to surface recycling with the advantage that improvement
of the mix properties is possible by adding virgin aggregate and binder, in the form of admixture,
to the hot millings. Heating and scarifying can occur in one or multiple passes allowing
recycling depths of two inches or more. The HIPR subcontractor on the SR 542 project,
GreenRoads Recycling, used a two stage remixing process. Later sections of this report include
a more in depth description of the process and equipment used on the SR 542 project.
Repaving combines the HIPR process with a new HMA overlay. The top layer of the
existing HMA pavement is recycled and improved just as in the remixing process. A new layer
of conventional HMA is immediately placed over the HIPR pavement that was just recycled.
Both lifts are then compacted together with the same compaction equipment.

Experimental Feature Report
__________________________________________________________
June 2010 3
HIPR Benefits
HIPR has the following benefits (ARRA 2001, Button et al. 1999, Pierce 1996):
• HIPR recycles 100 percent of the existing pavement reducing the need for new aggregate
and asphalt.
• Uses less energy than other rehabilitation methods.
• Heating and softening of the existing HMA pavement before planing reduces the amount
of aggregate breakage when compared to cold planing.
• HIPR does not require transportation of large quantities of new material to the job site
resulting in less traffic disruptions from trucks entering and leaving the work area.
• HIPR lay down temperatures are lower than conventional HMA and the paving train
moves slower. Both of these factors reduce the length of lane closures as compared to
conventional HMA. The shorter lane closures mean traffic can pass through the work
area more quickly, reducing delays.
• The initial cost of HIPR pavement is less than traditional HMA.
HIPR Project Selection
Not all HMA rehabilitation projects are appropriate for HIPR. Careful evaluation of the
existing HMA pavement and site conditions is necessary before selecting HIPR as a potential
rehabilitation strategy. Pavement designers should consider the following factors when
determining whether a project is a good candidate for HIPR.
Pavement Structure
As is the case with an HMA overlay or mill and fill, HIPR cannot correct deficiencies in
the underlying pavement structure. HIPR does not add structure so roadways with insufficient
structure are not good candidates. Depth of recycling is normally limited to two inches.
Correction of cracks that extend below this depth is necessary before the HIPR or they may
reflect through the new pavement. Correction of base failures is also necessary before HIPR
paving. Verifying the depth of existing HMA is advised prior to choosing HIPR as a

Experimental Feature Report
__________________________________________________________
June 2010 4
rehabilitation strategy. ARRA recommends that the existing HMA be at least three inches in
depth to prevent pulling up the underlying HMA during HIPR paving (ARRA, 2001).
Material Deficiencies
Evaluation of the constituent materials and properties of the existing HMA pavement is
essential to ensure that construction of an acceptable HIPR pavement is possible. Currently the
remixing process only allows the addition of about 30 percent new material to the HIPR
pavement. As a result, the properties of the existing HMA pavement will have the largest impact
on the properties of the finished HIPR pavement. Investigation of problems like stripping and
raveling are important because their cause is usually due to aggregate or binder properties which
the HIPR process might not be able to correct. Mixes with too much asphalt or dry mixes are not
good candidates unless enough material can be added to completely correct the problem. Mix
consistency is also important in determining the suitability of existing HMA pavement for HIPR.
Changes in the existing HMA pavement materials, gradation or asphalt content will change the
properties of the finished HIPR pavement. If not accounted for during mix design these changes
may affect mix quality.
The presence of surface treatments such as chip seals can affect HIPR paving. Surface
treatments tend to insulate the underlying HMA making heating more difficult (Pierce, 2006).
The gradation of a chip seal may also be undesirable. Removal of surface treatments should be
considered before performing HIPR.
Geometric Elements
A HIPR paving train is not as maneuverable or flexible as conventional paving
equipment. A HIPR paving train cannot be easily backed up to pave gore areas and turn lanes
that were missed in the initial pass making projects with many such areas more costly to pave
using the HIPR process. Sharp curves can also pose a problem for HIPR. The longest piece of
equipment used on SR 542 was 60 feet. Equipment this long needs to be able to maneuver
around any sharp curves while keeping its heaters and milling heads properly oriented over the
lane being rehabilitated. The width of the heaters and milling heads restrict the width of paving.
Experimental Feature Report
__________________________________________________________
June 2010 5
Paving wide lanes or paving the lane and shoulder simultaneously is impossible. Paving narrow
areas is also not possible due to the width of the grinding heads. The relatively small amount of
additional mix (30 percent) limits the ability to correct defects in the roadway profile and cross
slope. Roadways that require cross slope correction or correction of frequent dips are not good
candidates for HIPR.
Constructability
The HIPR train moves slower than a conventional paving operation. The amount of time
needed for the HIPR paving train to pass side roads and driveways may require detours or other
accommodation to get traffic past the closure in a reasonable amount of time. HIPR can pave
over utility covers but placement will be slower (Pierce, 1996). Evaluation of the effects of
lower productivity and longer duration closures is advisable on roadways with many utility
covers. Overnight storage of HIPR equipment is also a constructability concern. HIPR
equipment requires more parking space than conventional paving equipment and takes
considerably more time to pick up and mobilize to a different location. Pullouts or parking areas
of sufficient size to accommodate the HIPR equipment spaced about one days production (about
1 to 2 miles) apart should be available along the roadway.
The heaters have the potential to ignite flammable materials. Investigation of sources of
flammable gases such as sewers and areas of increased fire danger is necessary before selecting
HIPR as a rehabilitation strategy. The heaters also vent hot gas above the unit. Anything
overhanging the roadway that may be affected by the hot gases must be addressed during HIPR
placement.
Environmental Considerations
Unlike conventional paving, emissions from HIPR mix production occur on the project
site instead of at an asphalt plant. When evaluating a project for HIPR designers must consider
the affect that these emissions may have. HIPR equipment uses incinerators to remove
pollutants but this may not be sufficient in areas that are sensitive to air quality changes.
Rubberized crack sealing materials in the roadway can cause increased emissions during HIPR

Experimental Feature Report
__________________________________________________________
June 2010 6
paving which could be a factor when evaluating the suitability of HIPR. WSDOT’s current
crack sealing procedure uses a sand slurry mixture made with emulsified asphalt. Since
WSDOT’s process only uses asphalt and no rubber materials, cracks sealed using the WSDOT
procedure should not cause increased emissions.
Project Background
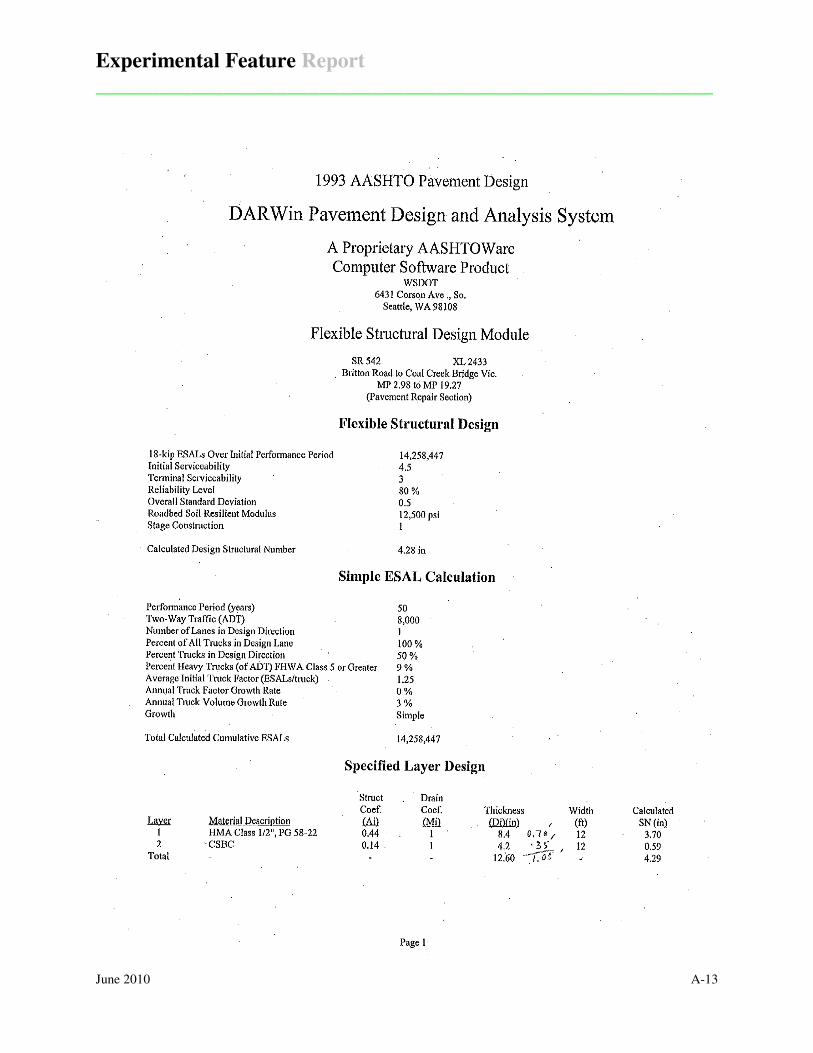
Contract 7648, SR 542 Britton Road to Coal Creek Bridge Vicinity, is located in
Whatcom County east of the city of Bellingham. The section of SR 542 rehabilitated with the
HIPR process starts 3.38 miles east of the junction with Interstate 5 (Milepost 3.38) and ends 3.5
miles west of the junction with SR 547 (Milepost 19.27). This section of SR 542 is an undivided
highway with one lane in each direction and is classified as a rural arterial. Channelization in the
form of left and/or right turn lanes is provided at major intersections and there is a two way left
turn lane through the town of Deming (MP 13.48 to 13.81). The terrain is rolling with many side
roads and driveways. Figure 1 shows the project location.
Figure 1. Project location.

Experimental Feature Report
__________________________________________________________
June 2010 7
Traffic
Traffic volumes vary considerably within the project. The west end of the project is near
the city of Bellingham resulting in AADT’s as high as 12,000. The level of development
decreases to the east and the AADT decreases correspondingly to a low of 4,900 at the eastern
end of the project. Truck percentages are fairly consistent varying between 9.23 and 11.52
percent.
Contract Information
WSDOT awarded the contract for rehabilitating SR 542 to Granite Construction Inc.
Along with managing the project, Granite Construction paved HMA in areas not designated for
HIPR, designed the HIPR mix and produced the admixture for the HIPR in their asphalt plant.
Granite selected GreenRoads Recycling out of Fernie, British Columbia to place the HIPR
pavement. GreenRoads Recycling has considerable experience with HIPR having paved over
7,000 miles of roadway using the HIPR process (GreenRoads, 2009).
Existing HMA Pavement
As with any roadway that has been in service for a long period of time there are many
variations in the roadway section. These variations are often short sections where a minor
improvement was constructed (i.e. widening, intersection improvements, culvert replacements,
local pavement failures, etc.). If the minor variations are ignored this section of SR 542 can be
divided into three distinct roadway sections. The Surfacing Report in Appendix A includes the
complete construction history for the roadway.
Milepost 3.38 to 9.43
The original pavement for this section of SR 542 was 0.50 feet of portland cement
concrete pavement (PCCP) constructed in 1919. Projects in 1942, 1976 and 1993 placed a total
depth of 0.29 feet of HMA over the PCCP. The most recent overlay was a 1/2 inch HMA placed
in 1993 at a depth of 0.12 feet. In 1997 turn lanes were added to several intersections resulting
in an additional 0.13 feet of HMA in these locations. The original PCCP driving lanes were only

Experimental Feature Report
__________________________________________________________
June 2010 8
16 feet wide. Prior to 1993 the driving lanes were widened to their present width of 22 feet using
crushed rock and/or HMA to build up the existing shoulder to match the grade of the PCCP.
This section was experiencing low severity alligator cracking and maintenance patching
mainly in the widened areas outside of the PCCP panels. Longitudinal and transverse cracking,
mostly due to PCCP joints reflecting through the HMA, was also present. Rut depths averaged
0.27 inches with a minimum recorded depth of 0.17 inches and a maximum of 0.37 inches.
Milepost 9.43 to 9.94
Most of this section was reconstructed in 2001 as part of the project that replaced the
Nooksack River Bridge. The roadway section consists of 0.40 feet of ½ inch HMA over 0.60
feet of untreated base. The only distress present on this section was some low severity
longitudinal cracking. Average rut depth was 0.26 inches and varied between 0.23 and 0.30
inches.
Milepost 9.94 to 19.27
This section consists of 0.27 to 0.35 feet of ½ inch HMA placed over a BST roadway.
Distress consisted of low to medium severity longitudinal, transverse and alligator cracking.
Rutting on this section varied between 0.08 and 0.36 inches with a 0.22 inch average depth.
HIPR Mix Design Process
Many different methods have been used to design HIPR mixes but there is no nationally
accepted method. The basic goal of any HIPR mix design method is to produce a recycled mix
with properties as close to new HMA as possible (ARRA, 2001).
ARRA lists the following steps in developing a mix design for HIPR (ARRA, 2001):
• Evaluation of the existing HMA pavement
• Determination of recycling agent requirements
• Determination of admixture requirements
• Fabrication and testing of sample mixes
• Selection of optimum mix

Experimental Feature Report
__________________________________________________________
June 2010 9
The following summary of each step in the HIPR mix design process is based on information
provided in the ARRA’s Basic Asphalt Recycling Manual (ARRA, 2001).
Evaluation of the Existing HMA
Just as the gradation of the aggregate stockpiles and the properties of the asphalt binder
need to be known to design a conventional HMA mix, the gradation and binder properties of the
existing HMA pavement need to be known to design an HIPR mix. Determination of the
gradation and binder properties of the existing HMA pavement requires testing of samples from
the roadway. Samples can be in the form of cores, grindings or other methods. Regardless of
the sampling method used, care should be exercised as to minimize cutting or breaking the
aggregate as it will affect the gradation.
Determination of Rejuvenation Requirements
The asphalt binder in the existing HMA pavement will have aged as a result of exposure
to air and water during its service life. Aging is a process by which oxygen reacts with
molecules in the binder making it stiffer and less ductile. The loss of ductility makes the
pavement more susceptible to cracking which can affect pavement life. Increased stiffness will
make the recycled HMA more difficult to spread and compact during construction.
The purpose of rejuvenation is to restore the properties of the aged asphalt to those of
new asphalt binder. Rejuvenation involves adding recycling agent or soft asphalt to the recycled
mix. Recycling agents are a mixture of hydrocarbons that are mixed with aged asphalt binder to
modify or improve its properties. Adding soft, new asphalt binder to aged asphalt binder will
produce an “average” binder. Recycling agents and soft asphalt binders can be used together.
Determination of Admixture Requirements
The remix process allows the addition of virgin aggregate and asphalt binder to produce a
final mix with the desired volumetric properties. The purpose of this step is to select the
quantity, gradation and binder content of admixture.

Experimental Feature Report
__________________________________________________________
June 2010 10
Fabrication and Testing of Trial Mixes
In a conventional HMA mix design the aggregate gradation and asphalt binder grade are
usually predetermined. The conventional HMA mix design process consists of testing several
trial mixes prepared with varying amounts of asphalt to determine the asphalt content that yields
the specified volumetric properties. Additional variables make the HIPR mix design process
more complicated. The amount of recycling agent, the percentage of admixture, the admixture
asphalt content and admixture gradation all need to be selected to produce a mix with the desired
qualities. Properties of the existing HMA pavement can also change from location to location
further complicating the process. There is no established procedure for HIPR mix design
requiring the proportioning of trial mixes to depend on the experience of the mix designer.
Selection of Optimum Mix
The trial mixes are tested to determine if they meet the project requirements. If none of
the trial mixes meets project requirements, more trial mixes with different proportions will need
to be tested. Additional testing such as moisture susceptibility should be performed after the
final mix design is selected.
SR 542 Mix Design
The contract specifications (Appendix B) required the Contractor to design the HIPR
mix. The design was to use sufficient admixture to meet an air void specification of 2.5 to 5.5
percent when compacted to 75 gyrations in a Superpave gyratory compactor. Properties of the
existing HMA pavement from roadway cores taken throughout the project were used to develop
the mix design. The existing HMA pavement was placed under five separate projects between
1989 and 2001. Each project had a different mix design but all were ½ inch nominal maximum
aggregate size dense graded mixes. The five mixes were similar enough to combine into one
HIPR mix design for the entire project. The following outlines the mix design process used on
this project based on information provided by Granite Construction during a meeting held on
July 22, 2009.
Experimental Feature Report
__________________________________________________________
June 2010 11
Evaluation of the Existing HMA
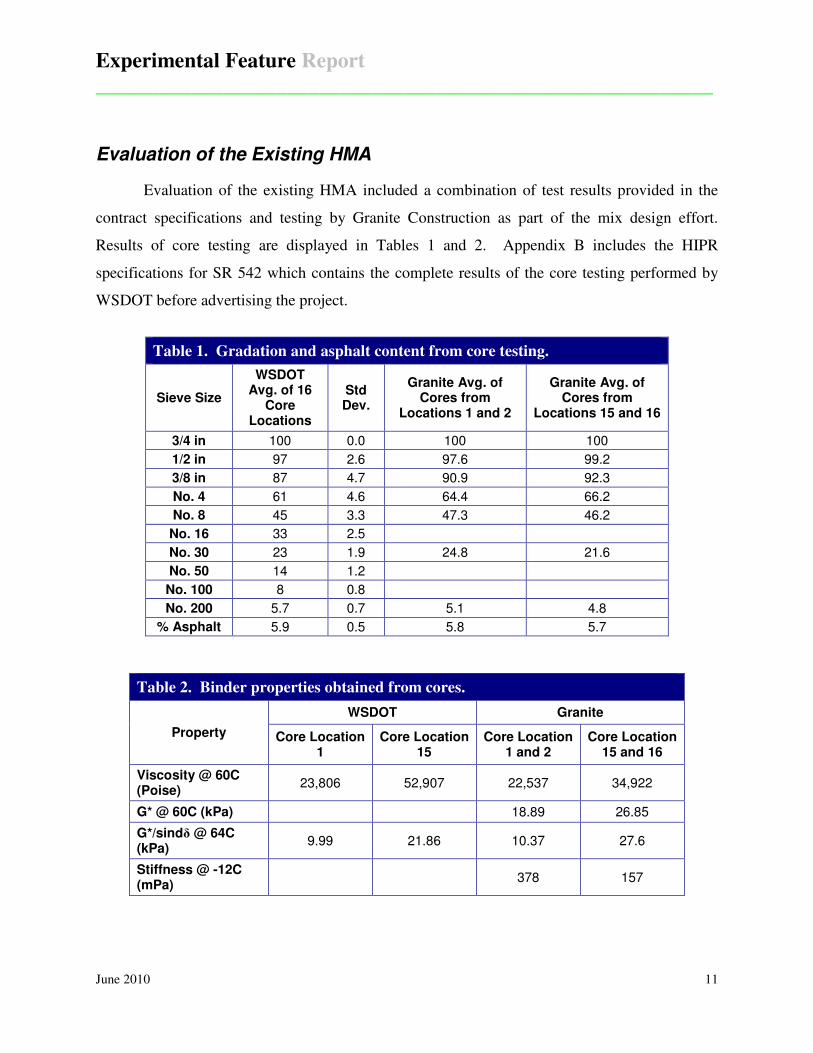
Evaluation of the existing HMA included a combination of test results provided in the
contract specifications and testing by Granite Construction as part of the mix design effort.
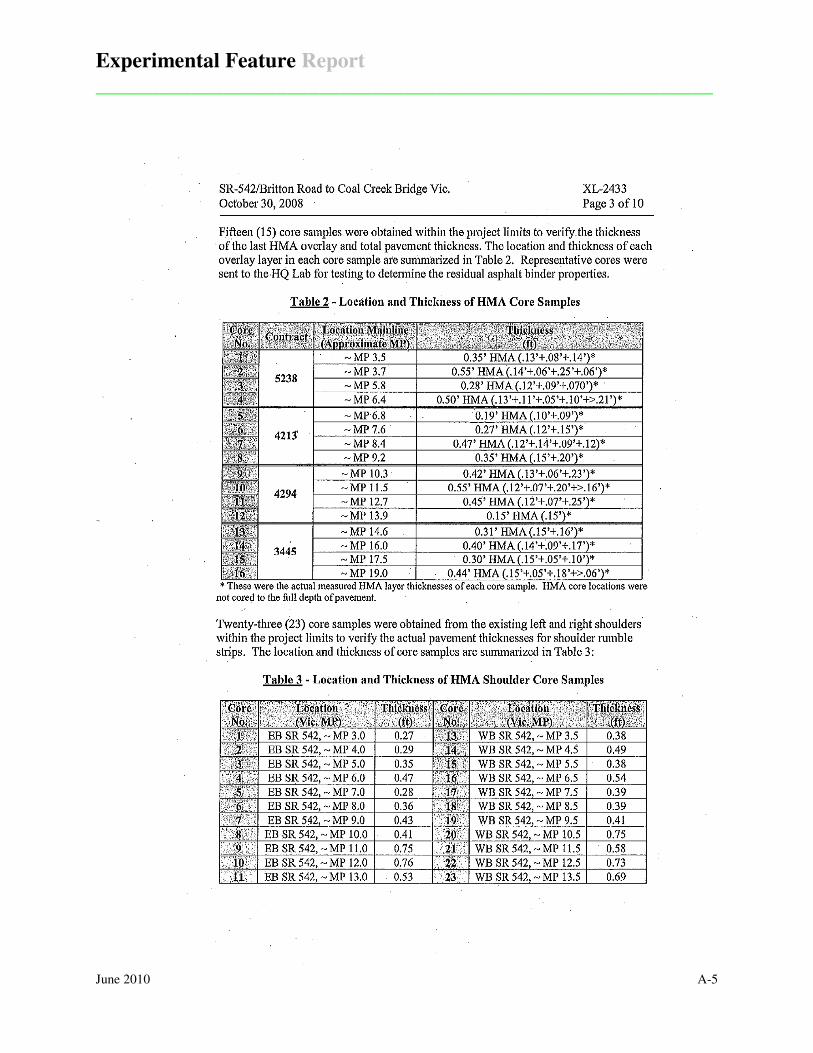
Results of core testing are displayed in Tables 1 and 2. Appendix B includes the HIPR
specifications for SR 542 which contains the complete results of the core testing performed by
WSDOT before advertising the project.
Table 1. Gradation and asphalt content from core testing.
Sieve Size
WSDOT Avg. of 16
Core Locations
Std Dev.
Granite Avg. of Cores from
Locations 1 and 2
Granite Avg. of Cores from
Locations 15 and 16
3/4 in 100 0.0 100 100
1/2 in 97 2.6 97.6 99.2
3/8 in 87 4.7 90.9 92.3
No. 4 61 4.6 64.4 66.2
No. 8 45 3.3 47.3 46.2
No. 16 33 2.5
No. 30 23 1.9 24.8 21.6
No. 50 14 1.2
No. 100 8 0.8
No. 200 5.7 0.7 5.1 4.8
% Asphalt 5.9 0.5 5.8 5.7
Table 2. Binder properties obtained from cores.
Property
WSDOT Granite
Core Location 1
Core Location 15
Core Location 1 and 2
Core Location 15 and 16
Viscosity @ 60C (Poise)
23,806 52,907 22,537 34,922
G* @ 60C (kPa) 18.89 26.85
G*/sindδ @ 64C (kPa)
9.99 21.86 10.37 27.6
Stiffness @ -12C (mPa)
378 157

Experimental Feature Report
__________________________________________________________
June 2010 12
Determination of Recycling Agent Requirements
Recycling agents improve the properties of the aged asphalt to a level adequate for use in
the new HIPR pavement. The amount of recycling agent used on the SR 542 HIPR was
determined by comparing the viscosity testing of the asphalt recovered from the existing HMA
pavement to new asphalt binder typically used on WSDOT projects. The viscosity of the asphalt
in the existing pavement was based on asphalt extracted from the cores (Table 2).
Recommendations from the recycling agent supplier were also considered determining the
amount of recycling agent needed.
Determination of Admixture Requirements
The gradation, asphalt content and amount of admixture were determined during the
fabrication and testing of sample mixes on the SR 542 project. The contract specifications called
for admixture to meet the gradation requirements for crushed screenings 5/8” - US No. 4;
however, this gradation was not used. Granite Construction tested trial mixes using gradations
for WSDOT’s Class D HMA and British Columbia’s Graded Aggregate Seal Class C. WSDOT
Class D HMA is an open graded friction course that WSDOT quit using in 2004. Graded
Aggregate Seal Class C is normally used for surface treatments but it is also the gradation most
often used as HIPR admixture in British Columbia. Based on recommendations from
GreenRoads Recycling, the admixture selected for production was Graded Aggregate Seal Class
C at 20 percent of the weight of the total mix. Table 3 displays gradation specifications for the
various admixture options.

Experimental Feature Report
__________________________________________________________
June 2010 13
Table 3. Gradation specifications of admixture
options.
Sieve Size
Percent Passing
WSDOT Crushed
Screenings 5/8” - US
No. 4
WSDOT Class D
HMA
B.C. Graded Aggregate Seal Class
C
3/4 in. 100
5/8 in. 95 - 100 100
1/2 in. 100
3/8 in. 97 - 100 30 - 70
No. 4 0 - 10 30 - 50 25 - 45
No. 8 5 - 15
No. 10 0 - 3
No. 16
No. 30 5 - 20
No. 50
No. 100
No. 200 0 – 1.5 2 - 5 0 - 3
Fabrication and Testing of Sample Mixes
Granite Construction began the mix design process by producing and testing three trial
mixes. Only a limited amount of aggregate was available from the cores so the first three mixes
were fabricated using virgin aggregate with a structure similar to that of the existing HMA
pavement. The purpose of the first three mixes was to establish trial mix proportions while
conserving the material from the cores for future testing.
Based on the results from the first three trial mixes, Granite Construction tested three
additional trial mixes using material from the cores. The first two used admixture meeting the
gradation requirements of WSDOT Class D HMA. After testing the first two mixtures, Granite
Construction used the Bailey Method (a method used to evaluate and select HMA aggregate
proportions) to predict mix properties for various admixture options. The Bailey Method results
and conversations with GreenRoads Recycling resulted in the fabrication of a third mixture using
British Columbia Graded Aggregate Seal Class C as the basis for the admixture gradation. Table
4 shows the results of gradation and volumetric testing of the three mixtures.

Experimental Feature Report
__________________________________________________________
June 2010 14
Table 4. Gradation and volumetric properties of trial blends.
Sieve Size
Trial No. and Admixture (percent of mix and type)
Trial 1
20% Class D
Trial 2
5% Class D
Trial 3
20% Graded Agg. Seal Class C
Percent Passing
3/4 in. 100 100 100
1/2 in. 97.9 97.5 96.2
3/8 in. 88.0 87.2 85.1
No. 4 53.2 59.2 57.2
No. 8 37.6 42.9 42.0
No. 16 27.5 31.6 30.9
No. 30 19.4 22.2 21.4
No. 50 11.4 13.0 12.2
No. 100 6.6 7.4 6.9
No. 200 4.9 5.5 5.1
Volumetric Properties Percent
Pb of Admixture 1.65 1.65 4.5
Pb of total mix 5.0 5.6 5.5
Recycling Agent 0.25 0.25 0.25
VMA 13.9 13.4 13.6
Va 3.7 1.2 1.4
Selection of Optimum Mix
Although the specified air void content was not achieved, the final trial mixture using 20
percent British Columbia’s Graded Aggregate Seal Class C was selected as the production mix.
The reasons for this selection were:
• Graded Aggregate Seal Class C has a history of successful use on many HIPR
projects in British Columbia.
• GreenRoads Recycling’s experience is that material meeting the 5/8” - US No. 4
gradation specified by WSDOT would excessively cool the HIPR mix.
• It was felt that the 2.5 to 5.5 percent air void specification may not be achievable with
the existing HMA pavement.

Experimental Feature Report
__________________________________________________________
June 2010 15
WSDOT had concerns about using a mix design with such low air voids due to the risk of
rutting but allowed its use based on GreenRoads Recycling’s stated success and experience. It
was agreed that the asphalt content in the admixture would start at 4.5 percent. Samples would
be taken at the start of paving to determine if any adjustments were needed.
SR 542 HIPR Construction
HIPR paving began on August 18, 2009 and ran through September 21. GreenRoads
Recycling placed nearly 31 lane miles of HIPR in 25 working days. The average production was
1.3 lane miles per day with as much as 1.7 lane miles completed in one day. Most of the HIPR
placement, a total of 16 days, occurred at night due to high daytime traffic. East of milepost 15,
where traffic volumes were lower, nine days of HIPR placement occurred during the day.
Weather was generally warm (50°F - 80°F) during daytime placement and cooler (30°F - 50°F)
at night. Rainfall occurred on several nights but paving was either halted prior to the rain or the
rain was short in duration and light enough to not affect the paving. Appendix C lists the daily
HIPR production on SR 542.
Equipment
GreenRoads Recycling used HIPR equipment manufactured by Pyrotech Holdings
Corporation consisting of two preheaters and two heater scarifiers. A third preheater was added
to the paving train later in the project. A conventional asphalt paving machine spread the
mixture and two double drum steel wheel rollers provided compaction. Solo end dumps
delivered admixture to the second heater scarifier. The following describes the equipment and
its function in the HIPR paving train based on field observations and information from the
Pyrotech website (Pyrotech, 2009).
Preheaters
The purpose of the preheaters is to remove moisture from the pavement and begin the
heating process. The preheaters consist of a five ton truck pulling a trailer equipped with
propane burners housed in an insulated steel enclosure. A 1,500 gallon tank on the truck

Experimental Feature Report
__________________________________________________________
June 2010 16
provides enough propane to operate the heater for an entire shift. Rubber tires on the rear of the
trailer are removed and steel wheels support the trailer during operation.
Figure 2. Preheater unit consisting of a propane truck and trailer with propane fired heaters.
Figure 3. Removing rubber tires prior to paving.
Heater Scarifier (Unit A)
The two heater scarifiers do not perform identical operations. To differentiate between
the two heater scarifiers, Pyrotech labels the first as Unit A and the second Unit B. Unit A uses
propane-fired infrared heaters mounted on the front of the unit to heat the pavement to a depth of
1 to 1 ¼ inches. Two five-foot-wide milling heads then mill the outside five feet on both sides of
the lane to a depth of one inch leaving a two-foot un-milled strip down the center. After milling,
Unit A places the hot millings in a windrow and adds recycling agent to the windrowed hot
millings. A trailer with propane-fired heaters pulled by Unit A provided additional heat to the
pavement.
Figure 4. Front left side of Unit A. Figure 5. Right rear of unit A and towed trailer
with heater.

Experimental Feature Report
__________________________________________________________
June 2010 17
Figure 6. Milling head on left side of unit A removes a five-foot strip from the left side of the lane. An identical milling head removes the same amount from the right side.
Figure 7. Milled HMA behind unit A is windrowed into the center of the lane.
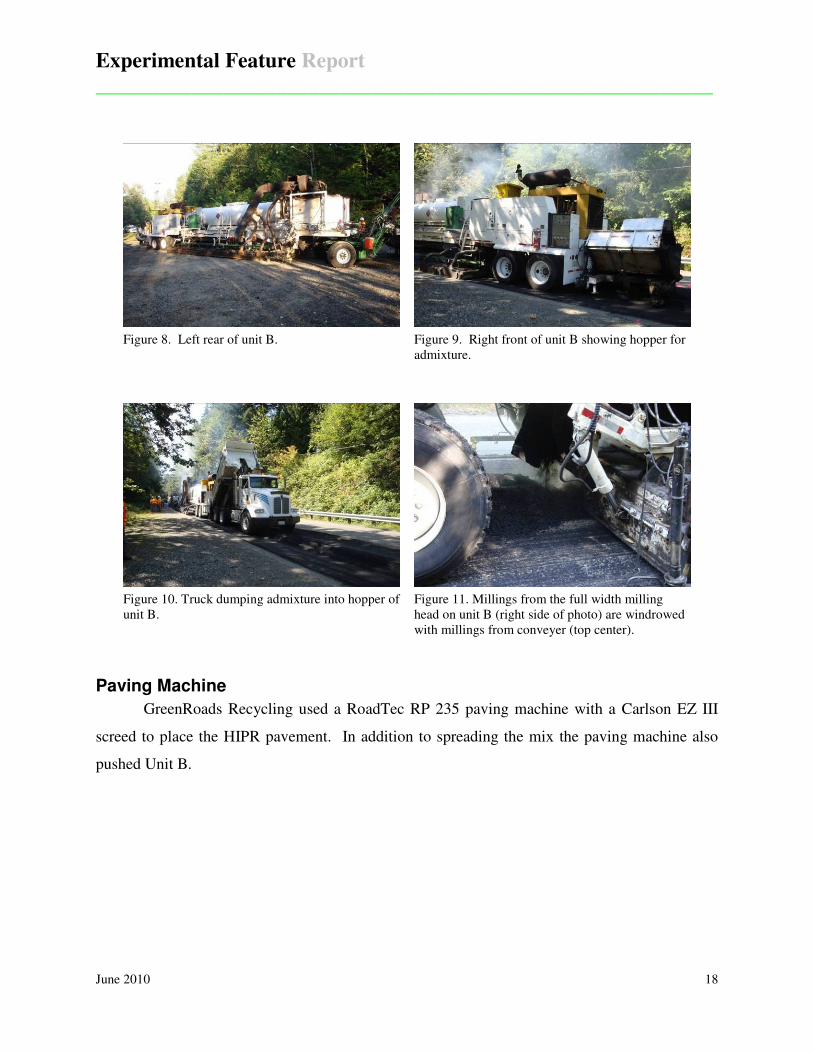
Heater Scarifier (Unit B)
The introduction of admixture occurs in Unit B. The front of this unit contains a hopper
similar to a paving machine. End dumps back into the gap between Unit A and Unit B and place
admixture into the hopper. Behind the hopper is a four-foot milling head which removes the one
inch depth of existing HMA pavement from the center of the lane not removed by Unit A. The
four foot milling head combines the new hot millings with the windrowed hot millings from Unit
A and places them on a conveyer which transports them over a bank of propane-fired infrared
heaters. Unit B combines the required amount of admixture from the hopper with the hot
millings on the conveyer. The heaters on Unit B provide additional heat to allow a full width
milling head to remove another inch of existing HMA pavement. The hot millings from the full
width milling head and the hot millings and admixture from the conveyor are then combined into
a new windrow allowing them to be picked up and placed in a pugmill. The pugmill thoroughly
mixes the hot millings, admixture and recycling agent before transferring them to the paving
machine hopper.
Experimental Feature Report
__________________________________________________________
June 2010 18
Figure 8. Left rear of unit B. Figure 9. Right front of unit B showing hopper for
admixture.
Figure 10. Truck dumping admixture into hopper of unit B.
Figure 11. Millings from the full width milling head on unit B (right side of photo) are windrowed with millings from conveyer (top center).
Paving Machine
GreenRoads Recycling used a RoadTec RP 235 paving machine with a Carlson EZ III
screed to place the HIPR pavement. In addition to spreading the mix the paving machine also
pushed Unit B.

Experimental Feature Report
__________________________________________________________
June 2010 19
Figure 12. RoadTec RP 235 paving machine. Figure 13. Rear view of RoadTec paving machine.
Rollers
Compaction equipment consisted of two double drum steel wheel rollers. The slow speed
of the HIPR train meant that the rollers worked relatively close to the paving machine. Table 5
gives the type and capacity of the rollers.
Table 5. Roller descriptions.
Manufacturer Model Type Weight (lb) Drum Width
(in)
Ingersoll-Rand DD-110HF Double Drum Vibratory 25,000 78
Bomag Hypac C 784 Double Drum Vibratory 28,000 84
Mix Temperature
Lay down temperature for the HIPR pavement was lower and more uniform than with
conventional HMA paving. Thermal images (Figure 14 and 15) showed a temperature range of
195°F to 240°F behind the screed. GreenRoads Recycling indicated that compaction
temperatures on the SR 542 project were typical for HIPR paving. The recycling agent assists in
making the mix more compactable allowing adequate compaction at temperatures lower than
conventional HMA (Stothert, 2009).

Experimental Feature Report
__________________________________________________________
June 2010 20
Figure 14. Thermal image showing uniform
temperature across the mat. Figure 15. Maximum mat temperature was approximately 240°F.
Test Results
WSDOT tested the HIPR mix for in-place density, gradation, asphalt content and
volumetric properties.
Density Test Results
WSDOT uses nuclear density gauges to accept in-place density of HMA. To use the
nuclear density gauge to accurately test HMA density, correlation of the gauge to the specific
mix is necessary. WSDOT’s procedure for correlating a nuclear gauge is to determine the
density of ten locations by using the nuclear density gauge and by testing cores using WSDOT
test method T-1661. The ratio of the core density to the nuclear gauge density is determined for
each location. The average of the ratios is the gauge correction factor used for density testing of
that specific mix. If the mix changes significantly, the procedure has to be repeated to establish a
new correction factor.
The HIPR pavement is made up of the recycled existing HMA pavement and the
admixture. The admixture did not change significantly during HIPR paving so the only
significant change to the mix requiring a new nuclear gauge correction factor were the changes
to the existing HMA pavement. There were five different paving projects, each with a unique
1 WSDOT test method T-166 is based on AASHTO T-166-07 and is available at http://www.wsdot.wa.gov/publications/manuals/fulltext/M46-01/Materials.pdf

Experimental Feature Report
__________________________________________________________
June 2010 21
mix design, which made up the recycled existing HMA pavement on SR 542 (Table 7).
WSDOT’s procedures require a different gauge correction factor for each mix design.
Table 6. Milepost limits of HMA recycled by HIPR.
Contract Year
Paved Thickness
(ft) Mix Type Binder
Milepost Limits
5238 1997 0.13* ½ inch HMA AR4000W
3.38 - 3.86
5.71 - 5.87
6.36 - 6.48
4213 1993 0.12* ½ inch HMA AR4000W
3.86 - 5.71
5.87 - 6.36
6.48 - 9.43
5410 2001 0.55 ½ inch HMA AR4000W 9.43 - 10.11
4294 1993 0.20 ½ inch HMA AR4000W 10.11 - 14.09
3455 1989 0.15* ½ inch HMA AR4000W 14.09 - 19.27
*The underlying lift also would need to be considered since these thicknesses are less than the two inch (0.17 ft) recycling depth. Fortunately the underlying layer for each of these projects did not vary within the project milepost limits allowing them to be left off for clarity. Complete details are in the surfacing report included in Appendix A.
Although WSDOT did informational density testing on the entire project, the only HIPR
pavement correlated to the nuclear density gauge was the section of existing HMA pavement
paved under contract 3455. Figure 16 shows a plot of the nuclear density gauge readings
compared to the corresponding core density used to correlate the nuclear density gauge. The plot
shows a good correlation (r = 0.76) between the two test methods indicating a linear relationship
between the nuclear density gauge and core density.
Within the limits of contract 3455, milepost 14.09 to 19.27, the average density from the
corrected nuclear density gauge was 93.5 percent of theoretical maximum with a standard
deviation of 1.37. The percentage of tests below WSDOT’s 91.0 percent minimum density
requirement was 4.7 percent. Figure 17 shows the distribution of test results. Appendix C
includes complete density testing results.

Experimental Feature Report
__________________________________________________________
June 2010 22
y = 0.9992x
R2 = 0.5726
145.0
145.5
146.0
146.5
147.0
147.5
148.0
145.0 145.5 146.0 146.5 147.0 147.5 148.0
Nuclear Density (lb/cf)
Co
re D
en
sit
y (
lb/c
f)
Figure 16. Plot of nuclear density gauge readings vs. core density results.
Density Distribution
0
2
4
6
8
10
12
14
16
18
89.5
- 9
0.0
90.0
- 9
0.5
90.5
- 9
1.0
91.0
- 9
1.5
91.5
- 9
2.0
92.0
- 9
2.5
92.5
- 9
3.0
93.0
- 9
3.5
93.5
- 9
4.0
94.0
- 9
4.5
94.5
- 9
5.0
95.0
- 9
5.5
95.5
- 9
6.0
96.5
- 9
7.0
97.0
- 9
7.5
Density (Percent of Maximum)
Nu
mb
er
of
Tests
Figure 17. Distribution of corrected nuclear density test results for milepost 14.09 to 19.27.

Experimental Feature Report
__________________________________________________________
June 2010 23
Figure 18 compares the normal distribution of HIPR density tests between milepost 14.09
and 19.27 with that of WSDOT HMA density tests taken between 1990 and 2005. The similarity
of the two distributions suggests that HIPR is capable of achieving in place densities comparable
to HMA paved on WSDOT projects.
0.00
0.05
0.10
0.15
0.20
0.25
0.30
0.35
86.0 88.0 90.0 92.0 94.0 96.0 98.0 100.0
Density (Percent of Maximum)
Fre
qu
en
cy
HIPR
HMA
Figure 18. Comparison of normal distributions of HIPR density test results to WSDOT HMA density testing between 1990 and 2005.
Mix Testing Results
WSDOT tested samples of the HIPR mix taken before they entered the paving machine
for gradation, asphalt content and volumetric properties (Table 7). The test results revealed that
the gradation of the HIPR pavement fell mostly within WSDOT’s ½-inch HMA specification
which was not surprising since the recycled existing HMA pavement was also ½-inch HMA.
Only the No. 200 sieve did not meet WSDOT’s specification for ½ inch HMA. Voids in mineral
aggregate (VMA) test results were within WSDOT’s specifications but air voids (Va) were lower
and consequently the voids filled with asphalt (VFA) were higher. Typically low Va and high
VFA would indicate too much asphalt which would make the mix more susceptible to rutting. It
is not clear how the low Va and high VFA will affect the HIPR pavement but it will be

Experimental Feature Report
__________________________________________________________
June 2010 24
monitored to determine if it is susceptible to rutting. Appendix D includes the complete
gradation, asphalt content and volumetric test results.
Table 7. WSDOT gradation, asphalt content and volumetric tests results.
Property
Existing HMA Pavement Contract WSDOT
1/2" HMA
Specs.
3445 4213 4294 5410 5438
Avg. Std. Dev.
Avg. Std. Dev.
Avg. Std. Dev.
Avg. Std. Dev.
Avg. Std. Dev.
*
3/4-in 100 0.0 100 0.0 100 0.0 100 0.0 100 na 100
1/2-in 96.6 1.5 96.3 0.5 96.6 0.5 96.0 1.4 97.0 na 90 - 100
3/8-in 87.4 2.8 87.2 2.5 88.4 1.5 88.0 2.8 90.0 na 90 max
No. 4 60.4 2.5 59.2 3.5 61.2 2.5 60.0 1.4 63.0 na
No. 8 44.9 2.0 43.5 3.0 45.2 1.9 43.5 0.7 47.0 na 28 - 58
No. 16 33.9 1.7 32.8 2.3 33.8 0.8 32.0 0.0 35.0 na
No. 30 24.3 1.4 24.0 1.7 24.0 1.0 23.0 0.0 26.0 na
No. 50 15.4 1.0 15.0 0.9 15.0 1.0 15.0 0.0 16.0 na
No. 100 9.9 0.7 9.5 0.5 9.6 0.5 9.5 0.7 10.0 na
No. 200 7.3 0.5 6.8 0.3 6.8 0.4 7.0 0.1 7.2 na 2.0 - 7.0
Pb 5.6 0.3 5.4 0.2 5.6 0.2 5.9 0.2 5.8 na
Va, % 1.4 1.0 2.3 0.4 2.0 0.6 1.9 0.5 1.1 na 2.5 - 5.5
VMA, % 14.3 0.4 14.4 0.3 14.8 0.2 14.9 0.4 14.6 na 14 min
VFA, % 90.3 6.6 84.1 2.8 86.6 4.1 87.2 3.3 92.5 0 65 - 78
Granite Construction tested the admixture for gradation and asphalt content (Table 8).
The test results revealed that on average the material passing the ⅜ inch and the number 200
sieves were finer than WSDOT’s ½ inch HMA specification. The admixture made up only 20
percent of the total mix so the finer admixture gradation only had a minor affect on the gradation
of the overall mix. Appendix E contains the complete Admixture test results.

Experimental Feature Report
__________________________________________________________
June 2010 25
Table 8. Granite admixture test results.
Property Average Std. Dev. Agg. Seal Class C Spec.
3/4-in 100.0 0.0
5/8-in 100
1/2-in 91.9 2.3
3/8-in 78.8 3.2 30 - 70
No. 4 43.1 3.1 25 - 45
No. 8 32.1 2.6
No. 16 23.5 2.1
No. 30 15.9 1.9 5 - 20
No. 50 8.8 1.6
No. 100 4.9 1.0
No. 200 3.4 0.8 0 - 3
Pb 4.0 0.5
Project Cost
The total project cost was $5,670,000 which includes design, administration, safety,
HMA paving (portions of SR 542 and adjoining sections of SR 9 were paved with HMA as well
as driveway approaches and turn lanes), pavement marking and incidental work required to
complete the project. The total cost per lane mile was $169,000 based on a total of 33.48 lane
miles rehabilitated including paving 1.7 lane miles of SR 9 and SR 542 with HMA. The cost of
the HIPR items only was $1,860,000 (Table 9). A total of 31.79 lane miles were rehabilitated by
HIPR resulting in a cost of $58,500 per lane mile.
Table 9. Contract 7648 HIPR costs.
Item Unit of
Measure Final
Quantity Unit Price Total Cost
Hot In-Place Recycled HMA S.Y. 227,863.2 $6.30 $1,435,538.16
Asphalt Binder Ton 157.99 $521.00 $82,312.79
Recycling Agent Ton 51.34 $1,800.00 $92,412.00
Aggregate For Hot In-Place Recycled HMA Ton 3,823.5 $65.00 $248,527.50
Total Cost $1,858,790.45

Experimental Feature Report
__________________________________________________________
June 2010 26
The total cost per lane mile for a conventional HMA rehabilitation on a highway in
Washington State is $200,000. Using HIPR for most of the paving on SR 542 yielded an initial
savings in total cost of 15 percent over the cost of using conventional HMA. Ultimately any life
cycle cost savings achieved by HIPR will depend on the pavement life which will be evaluated in
the final report
Recap Meeting
A meeting was held between representatives of GreenRoads Recycling, Granite
Construction and WSDOT on November 3, 2009. The purpose of the meeting was to share
experience and knowledge in order to improve future HIPR projects. The following bullet points
list some of the suggestions and observations brought up at the meeting:
Mix Design
• More cores should be provided on future HIPR projects. WSDOT provided 24 cores and
Granite obtained about that many additional cores. Cores should be taken by WSDOT
prior to awarding the project.
• More time for mix design development should be allotted between contract award and the
start of paving.
• Volumetric properties should be included in the contract documents to help the bidders
determine the mix design effort required.
• A meeting should be required early on in the project to discuss mix design sampling and
testing requirements.
• Low air voids usually do not lead to a rutting problem with HIPR pavement.
• WSDOT should consider including a pay item to cover the cost of developing the HIPR
mix design.
Specifications
• Definitions need to be clear in the specifications. Items that needed definitions include:
o Existing HMA Pavement

Experimental Feature Report
__________________________________________________________
June 2010 27
o Admixture
o Recycling Agent
o Hot millings
o Completed HIPR Pavement
Construction
• The completed HIPR pavement normally shows a slight amount of flushing and feels
tacky when walked on. The SR 542 pavement appeared dryer than HIPR placed in
British Columbia.
• The public liked the concept of HIPR. Using a “greener” process and reusing the
pavement seemed to be supported by the public.
• Comments concerning excessive glare were received from the public. This may make the
pavement markings less visible. On future projects we should try to get the pavement
markings down quicker.
• Some advantages that HIPR has over a conventional grind and inlay were discussed.
HIPR paving was quieter than cold milling and the project did not have any noise
complaints. HIPR eliminates problems of leaving an abrupt lane edge during grinding
and the hazard caused by the grinding areas filling with water. There are also no flying
rocks.
• HIPR could not pave some of the turn lanes which had crowns in the center. The milling
heads can only grind flush. To maintain the paving depth at the edge of the lane would
require deeper recycling at the center of the lane than the HIPR process is capable of.
• Small areas including turn lanes and gore areas should be paved with HMA before the
HIPR paving to avoid having joints in the lane.
• Sharp corners are difficult to pave with HIPR. The longest piece of equipment is 60 foot
and needs to stay in the lane as it goes around a corner.
• HIPR reduced traffic disruptions. The paving is completed in one operation. A grind and
inlay disrupts people twice and requires a butt joint at the end of each day’s operation.

Experimental Feature Report
__________________________________________________________
June 2010 28
Fewer trucks getting in and out of the work zone and not dumping trailers reduces traffic
disruption.
• In British Columbia, joints between paving shifts are fog sealed to help seal pavement
that tends to have an open texture at the start of each day’s paving.
• The HIPR paving left a slight lip on the edge of the travelled lane which bicyclist brought
up as a concern.
Conclusions
Preliminary indications are that the HIPR paving on SR 542 was a success. The
pavement on SR 542 was rehabilitated by reusing the existing pavement and incorporating a
minimal amount of new material. Pavement performance over time will determine if HIPR is
viable alternative to traditional HMA. A final report prepared five years after completion of the
construction will evaluate and provide conclusions based on the performance of the HIPR
pavement. Conclusions regarding the construction of the HIPR pavement are listed below.
• Initial cost of HIPR was 15 percent less than a traditional HMA mill and fill. Ultimately
the life cycle cost of the HIPR process will depend on how long the pavement lasts. An
assessment of the pavement life will be included as part of the final report.
• HIPR construction resulted in less disruption to traffic than a traditional overlay. This
coupled with the public’s preference for a more sustainable process may make it easier to
gain public support for HIPR paving than for a traditional HMA mill and fill.
• Density test results were similar to WSDOT HMA pavements. The HIPR process
appears to be capable of achieving the level of density necessary to produce a long lasting
pavement.
Recommendations
WSDOT should identify other opportunities to evaluate HIPR paving. Conservation of
resources, reduction in greenhouse gas emissions, reduced traffic impacts and potentially lower

Experimental Feature Report
__________________________________________________________
June 2010 29
life cycle costs are all advantages that make HIPR paving worth further evaluation.
Recommendations for future use of HIPR are included below.
• WSDOT should refine its HIPR specifications. Details of recommended changes to the
specification are beyond the scope of this report but the report does document some
opportunities for improvement.
• Future HIPR paving projects should use the nuclear density gauge to accept HIPR
density. Results indicate that the nuclear density gauge is capable of determining the
density if it is correlated to the existing HMA pavement being recycled.
• Although the initial cost of HIPR is less than a traditional HMA project, its service life
will determine whether its life cycle cost is lower than traditional HMA. Even if the life
cycle cost of HIPR does not prove to be lower, it still provides environmental benefits.
In addition to lowest life cycle cost, the environmental benefits should be considered
when comparing HIPR to other rehabilitation alternatives.
Experimental Feature Report
__________________________________________________________
June 2010 30
References Asphalt Recycling and Reclaiming Association (ARRA) (2001). Basic Asphalt Recycling Manual, ARRA, Annapolis, MD. Button, J.W., Estakhri, C.K., Little, D.N. (1999) Overview of Hot In-Place Recycling of Bituminous Pavements. In Transportation Research Record 1684, TRB, National Research Council, Washington D.C. GreenRoads Recycling website, www.greenroadsrecycling .com, accessed November 12, 2009. Pierce, L.M. (1996) Hot In-Place Recycling: SR 97 West Wapato Road to Lateral A Road (SB) Post Construction Report. Washington State Department of Transportation, Olympia, WA. Pyrotech (2009) Pyrotech website: www.pyropoaver.com, Accessed September 3rd, 2009. Stothert, J. (2009), Personal communication, November 3, 2009.

Experimental Feature Report
__________________________________________________________
June 2010 A-1
Appendix A
Surfacing Report
Experimental Feature Report
__________________________________________________________
June 2010 A-2

Experimental Feature Report
__________________________________________________________
June 2010 A-3

Experimental Feature Report
__________________________________________________________
June 2010 A-4
Experimental Feature Report
__________________________________________________________
June 2010 A-5

Experimental Feature Report
__________________________________________________________
June 2010 A-6

Experimental Feature Report
__________________________________________________________
June 2010 A-7

Experimental Feature Report
__________________________________________________________
June 2010 A-8
Experimental Feature Report
__________________________________________________________
June 2010 A-9

Experimental Feature Report
__________________________________________________________
June 2010 A-10

Experimental Feature Report
__________________________________________________________
June 2010 A-11

Experimental Feature Report
__________________________________________________________
June 2010 A-12
Experimental Feature Report
__________________________________________________________
June 2010 A-13

Experimental Feature Report
__________________________________________________________
June 2010 A-14

Experimental Feature Report
__________________________________________________________
June 2010 A-15

Experimental Feature Report
__________________________________________________________
June 2010 A-16

Experimental Feature Report
__________________________________________________________
June 2010 B-1
Appendix B
Contract 7648 HIPR Specifications
Experimental Feature Report
__________________________________________________________
June 2010 B-2
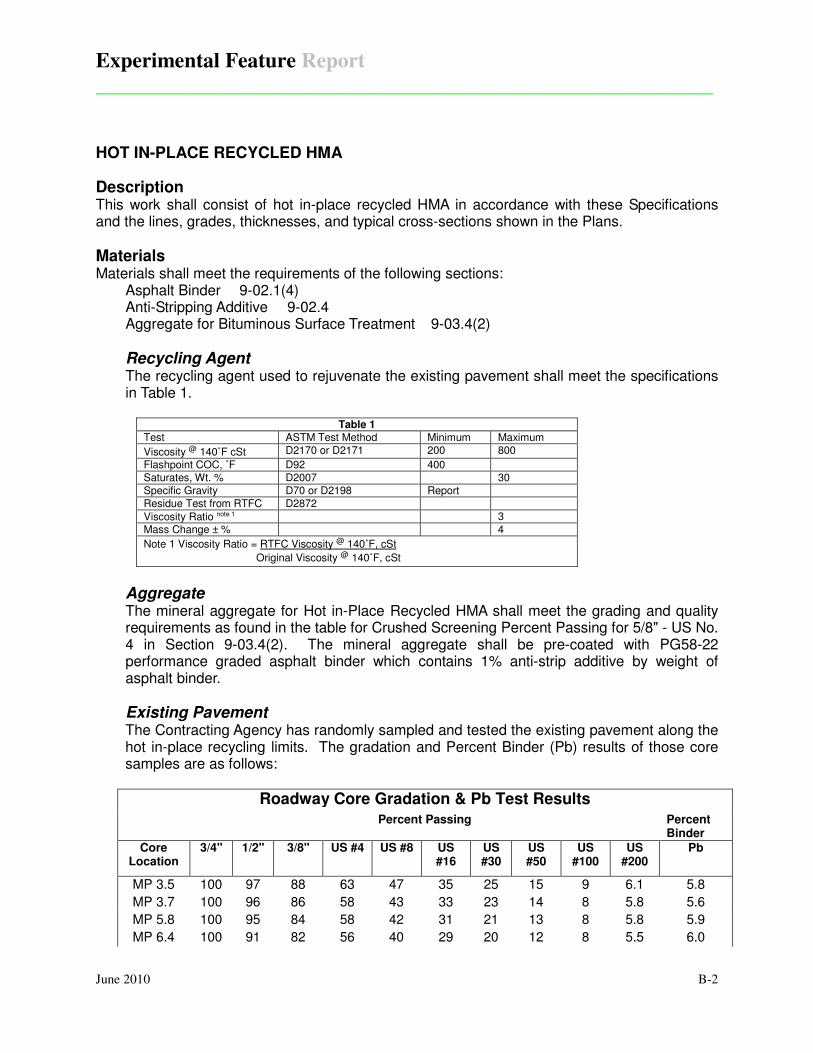
HOT IN-PLACE RECYCLED HMA
Description This work shall consist of hot in-place recycled HMA in accordance with these Specifications and the lines, grades, thicknesses, and typical cross-sections shown in the Plans. Materials Materials shall meet the requirements of the following sections:
Asphalt Binder 9-02.1(4) Anti-Stripping Additive 9-02.4 Aggregate for Bituminous Surface Treatment 9-03.4(2)
Recycling Agent The recycling agent used to rejuvenate the existing pavement shall meet the specifications in Table 1.
Table 1
Test ASTM Test Method Minimum Maximum
Viscosity @ 140˚F cSt D2170 or D2171 200 800
Flashpoint COC, ˚F D92 400 Saturates, Wt. % D2007 30 Specific Gravity D70 or D2198 Report Residue Test from RTFC D2872
Viscosity Ratio note 1 3
Mass Change ± % 4
Note 1 Viscosity Ratio = RTFC Viscosity @ 140˚F, cSt
Original Viscosity @ 140˚F, cSt
Aggregate The mineral aggregate for Hot in-Place Recycled HMA shall meet the grading and quality requirements as found in the table for Crushed Screening Percent Passing for 5/8" - US No. 4 in Section 9-03.4(2). The mineral aggregate shall be pre-coated with PG58-22 performance graded asphalt binder which contains 1% anti-strip additive by weight of asphalt binder. Existing Pavement The Contracting Agency has randomly sampled and tested the existing pavement along the hot in-place recycling limits. The gradation and Percent Binder (Pb) results of those core samples are as follows:
Roadway Core Gradation & Pb Test Results
Percent Passing
Percent Binder
Core Location
3/4" 1/2" 3/8" US #4 US #8 US #16
US #30
US #50
US #100
US #200
Pb
MP 3.5 100 97 88 63 47 35 25 15 9 6.1 5.8
MP 3.7 100 96 86 58 43 33 23 14 8 5.8 5.6
MP 5.8 100 95 84 58 42 31 21 13 8 5.8 5.9
MP 6.4 100 91 82 56 40 29 20 12 8 5.5 6.0

Experimental Feature Report
__________________________________________________________
June 2010 B-3
MP 6.8 100 99 92 64 47 36 25 15 8 6.0 6.3
MP 7.6 100 99 90 62 45 34 24 14 8 5.9 7.2
MP 8.4 100 96 87 63 47 36 26 15 9 6.8 5.7
MP 9.2 100 98 91 67 50 38 26 15 9 6.4 5.6
MP 10.3 100 98 87 59 43 32 23 13 8 5.3 5.5
MP 11.5 100 98 88 60 44 33 23 13 8 5.4 5.4
MP 12.7 100 97 86 60 45 34 23 14 8 5.1 5.7
MP 13.9 100 99 94 65 46 34 22 12 7 4.8 6.2
MP 14.6 100 95 81 56 42 30 21 12 7 4.7 6.4
MP 16.0 100 92 80 53 40 30 21 12 8 5.4 5.8
MP 17.5 100 94 83 58 43 32 23 13 7 5.1 5.4
MP 19.0 100 100 97 71 51 36 25 15 10 7.4 6.2
Average 100 97 87 61 45 33 23 14 8 5.7 5.9
Construction Requirements
Project Experience The Contractor shall demonstrate that personnel responsible for the hot in-place recycling have had experience with this method of paving for five or more similar projects totaling a minimum of 200 lane miles. Resumes with information on personnel experience and a list of referenced projects shall be provided to the Engineer for approval at least 15 working days prior to the start of work on the hot in-place recycling. The list shall include a description of the work, location, inclusive dates when the work was performed, and a contact for each project. The contact shall include an individual's name, title, and current telephone number. Project Pre-paving Meeting A meeting shall be held a minimum of 10-working days before hot in-place recycling paving to discuss construction procedures, personnel, and equipment to be used. Those attending shall include:
1. (representing the Contractor) The superintendent and all foremen in charge of the hot in-place recycling paving
2. (representing the State) The Project Engineer, key inspection assistants, and the
State Construction Office.
General Heating and milling/scarifying the existing pavement, adding recycling agent and anti-stripping additive, mixing with pre-coated mineral aggregate, spreading, leveling, and compacting of the Hot in-Place Recycled HMA shall be accomplished by a single pass equipment train. Equipment The equipment used for the hot in-place recycling HMA on this project shall meet the air quality requirements of Section 1-07.5(4).
Experimental Feature Report
__________________________________________________________
June 2010 B-4
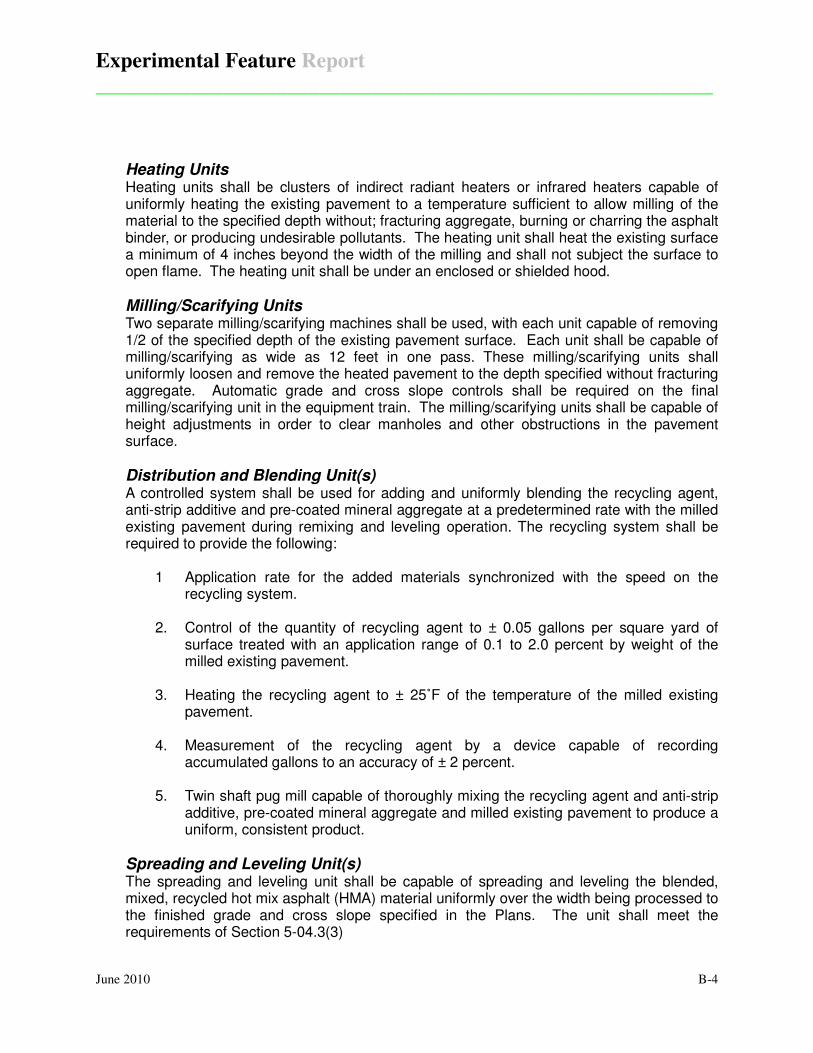
Heating Units Heating units shall be clusters of indirect radiant heaters or infrared heaters capable of uniformly heating the existing pavement to a temperature sufficient to allow milling of the material to the specified depth without; fracturing aggregate, burning or charring the asphalt binder, or producing undesirable pollutants. The heating unit shall heat the existing surface a minimum of 4 inches beyond the width of the milling and shall not subject the surface to open flame. The heating unit shall be under an enclosed or shielded hood. Milling/Scarifying Units Two separate milling/scarifying machines shall be used, with each unit capable of removing 1/2 of the specified depth of the existing pavement surface. Each unit shall be capable of milling/scarifying as wide as 12 feet in one pass. These milling/scarifying units shall uniformly loosen and remove the heated pavement to the depth specified without fracturing aggregate. Automatic grade and cross slope controls shall be required on the final milling/scarifying unit in the equipment train. The milling/scarifying units shall be capable of height adjustments in order to clear manholes and other obstructions in the pavement surface. Distribution and Blending Unit(s) A controlled system shall be used for adding and uniformly blending the recycling agent, anti-strip additive and pre-coated mineral aggregate at a predetermined rate with the milled existing pavement during remixing and leveling operation. The recycling system shall be required to provide the following:
1 Application rate for the added materials synchronized with the speed on the recycling system.
2. Control of the quantity of recycling agent to ± 0.05 gallons per square yard of
surface treated with an application range of 0.1 to 2.0 percent by weight of the milled existing pavement.
3. Heating the recycling agent to ± 25˚F of the temperature of the milled existing
pavement. 4. Measurement of the recycling agent by a device capable of recording
accumulated gallons to an accuracy of ± 2 percent. 5. Twin shaft pug mill capable of thoroughly mixing the recycling agent and anti-strip
additive, pre-coated mineral aggregate and milled existing pavement to produce a uniform, consistent product.
Spreading and Leveling Unit(s) The spreading and leveling unit shall be capable of spreading and leveling the blended, mixed, recycled hot mix asphalt (HMA) material uniformly over the width being processed to the finished grade and cross slope specified in the Plans. The unit shall meet the requirements of Section 5-04.3(3)

Experimental Feature Report
__________________________________________________________
June 2010 B-5
Compaction Compaction equipment shall meet the requirements of Section 5-04.3(4) Rollers. Preparation of Existing Surface The existing pavement surface to be recycled shall be cleaned and all dirt, thermoplastic markers, rubberized materials, oils and other objectionable materials shall be removed before beginning the hot in-place recycling. Power brooms shall be used, supplemented when necessary by hand brooming and other tools as required to bring the surface to a clean, suitable condition free of deleterious material. Heating and Milling/Scarifying The existing pavement surface shall be uniformly heated, milled/scarified and reworked to the widths and depths shown in the Plans. The existing pavement surface shall be heated with continuously moving heaters to allow the pavement to be scarified to a minimum of 1/2 the specified depth and at least 4 inches beyond the width of milling in a single pass. The temperature of the milled material shall not exceed 325˚F when measured immediately behind the milling machine. Blending, Mixing, Spreading and Leveling The recycling agent shall be applied uniformly to the milled existing pavement at a rate of 0.14 gallons per square yard prior to remixing in the pug-mill. The mineral aggregate shall be 5/8”-US No. 4 Crushed, thoroughly pre-coated with PG58-22 asphalt binder treated with 1% anti-stripping additive prior to remixing in the pug-mill. The milled existing pavement treated with recycling agent and the pre-coated mineral aggregate shall be fed into a mixing unit and thoroughly mixed to produce a consistent recycled HMA. The recycled HMA shall be distributed and leveled by an activated screed assembly. The leveling unit shall be capable of screeding the full width of the recycled HMA being placed. Joints When a pass is made adjacent to a previously placed mat, the longitudinal joint shall extend 2 inches into the previously placed mat. When a pass is adjacent to a previously placed mat, the transverse joint shall extend 4 inches into the previously placed mat. All longitudinal joints in the completed pavement shall be located at a lane line or an edge line of the traveled way. Mixture Design Prior to production of Hot In-Place Recycled HMA, the Contractor shall determine the optimum quantity of pre-coated mineral aggregate needed to meet the end product Air Void (Va) specification of 2.5% - 5.5% when compacted to 75 N design gyrations using the Superpave Gyratory Compactor (SGC). The Contracting Agency will perform specification testing in accordance with WSDOT Standard Operating Procedure SOP 731. A set of 16 core samples taken from the existing pavement surface will be provided by the Contracting Agency to the Contractor. The Contractor shall determine through testing the optimum quantity of pre-coated mineral aggregate to add to meet the end product specifications.

Experimental Feature Report
__________________________________________________________
June 2010 B-6
Testing and Acceptance The basis for acceptance for compaction of hot in-place recycled HMA will be by a satisfactory rolling pattern. A rolling pattern shall be defined as the number of passes the Contractor’s compaction equipment must make over the surface of hot in-place recycled HMA to achieve the maximum density. The number of passes shall be established by taking nuclear density tests after each roller pass to determine the number of passes needed to reach the maximum density. Nuclear density testing to establish a rolling pattern will be conducted by WSDOT. A new rolling pattern may be established any time the Engineer determines that compaction requirements have changed but not less than once per lane mile. The Contracting Agency will perform informational sampling to test for Percent Air Voids (Va). Smoothness The smoothness shall meet the requirements of Section 5-04.3(13) Surface Smoothness.
Measurement Hot In-Place Recycled HMA Hot in-place recycled HMA will be measured by the square yard of surface area of completed and accepted work for the width and depth as specified in the Plans. Recycling Agent Recycling agent will be measured by the ton incorporated in the project. Asphalt Binder Asphalt binder will be measured by the ton incorporated in the project. Anti-Stripping Additive Anti-Stripping Additive will be measured as provided in Section 5-04.4. Aggregate Mineral aggregate for Hot in-Place Recycled HMA will be measured by the ton incorporated in the project.
Payment Payment will be made in accordance with Section 1-04.1, for each of the following bid items that are included in the Proposal:
“Hot In-Place Recycled HMA”, per square yard. The unit contract price per square yard for "Hot In-Place Recycled HMA" shall be full payment for all costs of materials, labor, tools, and equipment to complete the work. “Recycling Agent”, per ton. The unit contract price per ton for "Recycling Agent" of the type and grade specified shall be full payment for furnishing, hauling, dispersing, labor, tools, equipment and incidentals necessary to complete the work.

Experimental Feature Report
__________________________________________________________
June 2010 B-7
“Asphalt Binder”, per ton. “Anti-Stripping Additive”, by calculation Payment for “Anti-Stripping Additive” will be as provided in Section 5-04.5. “Aggregate for Hot in-Place Recycled HMA”, per ton. The unit contract price per ton for "Aggregate for Hot in-Place Recycled HMA " shall be full payment for producing, heating, pre-coating, blending, mixing, hauling, placement, labor, tools, equipment and incidentals necessary to complete the work. “Asphalt Cost Price Adjustment”, by calculation. “Asphalt Cost Price Adjustment” will be calculated and paid for as described in Section 5-04.5 as supplemented in these Special Provisions. For the purpose of providing a common proposal for all bidders, the Contracting Agency has entered an amount in the proposal to become a part of the total bid by the Contractor.

Experimental Feature Report
__________________________________________________________
June 2010 C-1
Appendix C
Daily HIPR Production

Experimental Feature Report
__________________________________________________________
June 2010 C-2
Table C-1. Daily HIPR production.
Date Begin
MP End MP Direction
Distance
(lane/miles) Shift
8/18/2009 14.57 15.82 EB 1.25 day
8/19/2009 15.82 17.20 EB 1.38 day
8/20/2009 17.20 18.59 EB 1.39 day
8/21/2009 18.59 19.29 EB 0.71 day
8/24/2009 19.29 18.05 WB 1.24 day
8/25/2009 18.05 16.66 WB 1.34 day
8/26/2009 16.66 15.23 WB 1.44 day
8/27/2009 15.23 13.49 WB 1.72 day
8/28/2009 13.49 12.68 WB 0.82 day
8/30/2009 12.68 11.29 WB 1.29 night
8/31/2009 11.29 9.84 WB 1.19 night
9/1/2009 9.66 8.17 WB 1.37 night
9/2/2009 8.17 6.62 WB 1.55 night
9/3/2009 6.62 4.99 WB 1.63 night
9/8/2009 4.99 3.83 WB 1.16 night
9/9/2009 3.83 2.98 WB 0.85 night
9/9/2009 3.38 3.91 EB 0.53 night
9/10/2009 3.91 5.03 EB 1.39 night
9/11/2009 5.03 6.75 EB 1.72 night
9/13/2009 6.75 8.40 EB 1.72 night
9/14/2009 8.40 8.76 EB 0.36 night
9/15/2009 8.76 9.42 EB 1.33 night
9/16/2009 9.42 10.94 EB 1.15 night
9/17/2009 10.95 12.54 EB 1.32 night
9/21/2009 12.54 14.57 EB 0.89 night

Experimental Feature Report
__________________________________________________________
June 2010 D-1
Appendix D
Density Test Results
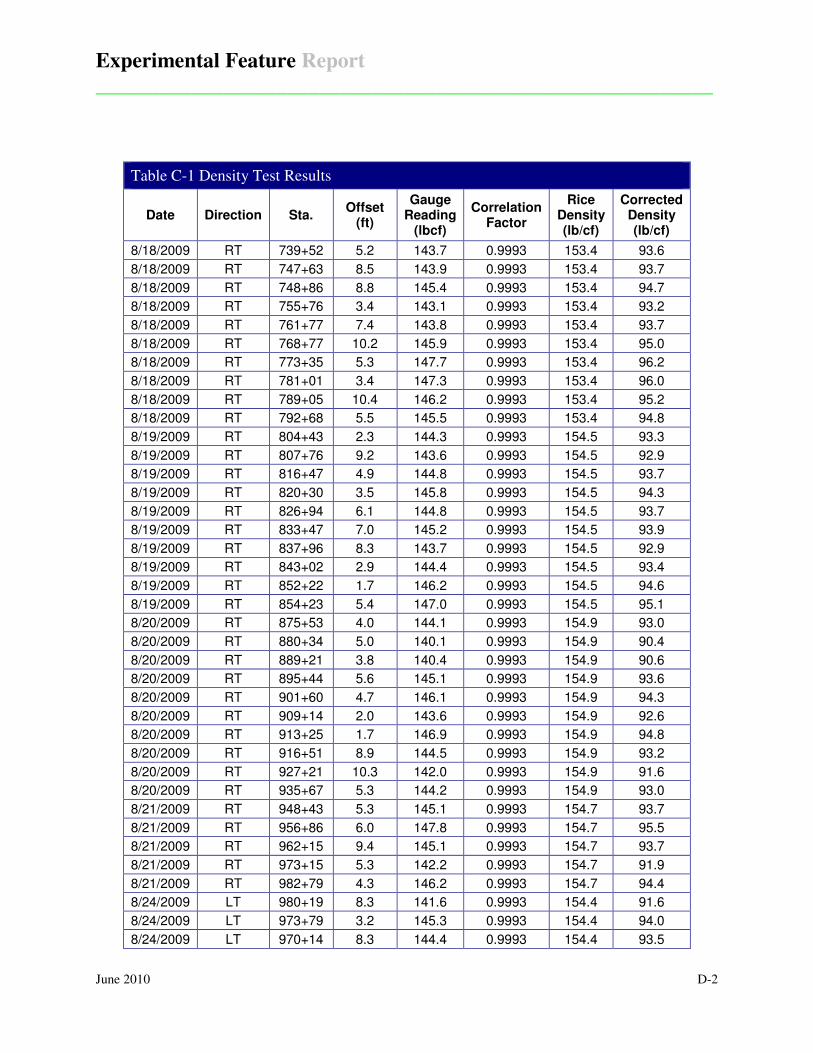
Experimental Feature Report
__________________________________________________________
June 2010 D-2
Table C-1 Density Test Results
Date Direction Sta. Offset
(ft)
Gauge Reading
(lbcf)
Correlation Factor
Rice Density (lb/cf)
Corrected Density (lb/cf)
8/18/2009 RT 739+52 5.2 143.7 0.9993 153.4 93.6
8/18/2009 RT 747+63 8.5 143.9 0.9993 153.4 93.7
8/18/2009 RT 748+86 8.8 145.4 0.9993 153.4 94.7
8/18/2009 RT 755+76 3.4 143.1 0.9993 153.4 93.2
8/18/2009 RT 761+77 7.4 143.8 0.9993 153.4 93.7
8/18/2009 RT 768+77 10.2 145.9 0.9993 153.4 95.0
8/18/2009 RT 773+35 5.3 147.7 0.9993 153.4 96.2
8/18/2009 RT 781+01 3.4 147.3 0.9993 153.4 96.0
8/18/2009 RT 789+05 10.4 146.2 0.9993 153.4 95.2
8/18/2009 RT 792+68 5.5 145.5 0.9993 153.4 94.8
8/19/2009 RT 804+43 2.3 144.3 0.9993 154.5 93.3
8/19/2009 RT 807+76 9.2 143.6 0.9993 154.5 92.9
8/19/2009 RT 816+47 4.9 144.8 0.9993 154.5 93.7
8/19/2009 RT 820+30 3.5 145.8 0.9993 154.5 94.3
8/19/2009 RT 826+94 6.1 144.8 0.9993 154.5 93.7
8/19/2009 RT 833+47 7.0 145.2 0.9993 154.5 93.9
8/19/2009 RT 837+96 8.3 143.7 0.9993 154.5 92.9
8/19/2009 RT 843+02 2.9 144.4 0.9993 154.5 93.4
8/19/2009 RT 852+22 1.7 146.2 0.9993 154.5 94.6
8/19/2009 RT 854+23 5.4 147.0 0.9993 154.5 95.1
8/20/2009 RT 875+53 4.0 144.1 0.9993 154.9 93.0
8/20/2009 RT 880+34 5.0 140.1 0.9993 154.9 90.4
8/20/2009 RT 889+21 3.8 140.4 0.9993 154.9 90.6
8/20/2009 RT 895+44 5.6 145.1 0.9993 154.9 93.6
8/20/2009 RT 901+60 4.7 146.1 0.9993 154.9 94.3
8/20/2009 RT 909+14 2.0 143.6 0.9993 154.9 92.6
8/20/2009 RT 913+25 1.7 146.9 0.9993 154.9 94.8
8/20/2009 RT 916+51 8.9 144.5 0.9993 154.9 93.2
8/20/2009 RT 927+21 10.3 142.0 0.9993 154.9 91.6
8/20/2009 RT 935+67 5.3 144.2 0.9993 154.9 93.0
8/21/2009 RT 948+43 5.3 145.1 0.9993 154.7 93.7
8/21/2009 RT 956+86 6.0 147.8 0.9993 154.7 95.5
8/21/2009 RT 962+15 9.4 145.1 0.9993 154.7 93.7
8/21/2009 RT 973+15 5.3 142.2 0.9993 154.7 91.9
8/21/2009 RT 982+79 4.3 146.2 0.9993 154.7 94.4
8/24/2009 LT 980+19 8.3 141.6 0.9993 154.4 91.6
8/24/2009 LT 973+79 3.2 145.3 0.9993 154.4 94.0
8/24/2009 LT 970+14 8.3 144.4 0.9993 154.4 93.5

Experimental Feature Report
__________________________________________________________
June 2010 D-3
Table C-1 Density Test Results (continued)
Date Direction Sta. Offset
(ft)
Gauge Reading
(lbcf)
Correlation Factor
Rice Density (lb/cf)
Corrected Density (lb/cf)
8/24/2009 LT 962+24 2.4 146.6 0.9993 154.4 94.9
8/24/2009 LT 959+69 9.2 144.8 0.9993 154.4 93.7
8/24/2009 LT 954+96 6.0 146.8 0.9993 154.4 95.0
8/24/2009 LT 946+55 2.8 142.7 0.9993 154.4 92.4
8/24/2009 LT 941+27 10.2 146.5 0.9993 154.4 94.8
8/24/2009 LT 937+45 8.8 144.0 0.9993 154.4 93.2
8/24/2009 LT 930+07 4.0 147.0 0.9993 154.4 95.1
8/25/2009 LT 917+88 9.0 148.6 0.9993 155.7 95.4
8/25/2009 LT 914+92 6.0 145.5 0.9993 155.7 93.4
8/25/2009 LT 910+34 3.0 143.6 0.9993 155.7 92.2
8/25/2009 LT 901+65 10.0 143.1 0.9993 155.7 91.8
8/25/2009 LT 893+67 9.0 146.4 0.9993 155.7 94.0
8/25/2009 LT 891+14 8.0 147.4 0.9993 155.7 94.6
8/25/2009 LT 884+78 10.0 143.8 0.9993 155.7 92.3
8/25/2009 LT 880+10 2.0 140.5 0.9993 155.7 90.2
8/25/2009 LT 875+07 3.0 143.0 0.9993 155.7 91.8
8/25/2009 LT 868+41 6.0 144.2 0.9993 155.7 92.5
8/26/2009 LT 844+35 5.0 144.8 0.9993 155.2 93.2
8/26/2009 LT 839+06 2.0 145.5 0.9993 155.2 93.7
8/26/2009 LT 830+10 8.0 140.8 0.9993 155.2 90.7
8/26/2009 LT 823+14 5.0 145.5 0.9993 155.2 93.7
8/26/2009 LT 819+72 4.0 145.8 0.9993 155.2 93.9
8/26/2009 LT 814+23 7.0 141.7 0.9993 155.2 91.2
8/26/2009 LT 809+88 5.0 146.9 0.9993 155.2 94.6
8/26/2009 LT 805+35 6.0 145.1 0.9993 155.2 93.4
8/26/2009 LT 799+59 2.0 144.4 0.9993 155.2 93.0
8/26/2009 LT 791+89 5.0 145.0 0.9993 155.2 93.4
8/27/2009 LT 787+48 2.0 144.6 0.9993 154.1 93.8
8/27/2009 LT 779+68 5.0 143.6 0.9993 154.1 93.1
8/27/2009 LT 771+57 9.0 144.0 0.9993 154.1 93.4
8/27/2009 LT 770+34 9.0 142.9 0.9993 154.1 92.7
8/27/2009 LT 763+44 3.0 142.4 0.9993 154.1 92.3
8/27/2009 LT 757+43 8.0 144.3 0.9993 154.1 93.6
8/27/2009 LT 750+43 10.0 143.7 0.9993 154.1 93.2
8/27/2009 LT 745+85 5.0 145.7 0.9993 154.1 94.5
8/27/2009 LT 736+19 3.0 144.6 0.9993 154.1 93.8
8/27/2009 LT 730+15 10.0 147.7 0.9993 154.1 95.8
8/27/2009 LT 726+52 5.5 147.0 0.9993 154.1 95.3
8/27/2009 LT 720+77 3.0 148.2 0.9993 154.1 96.1
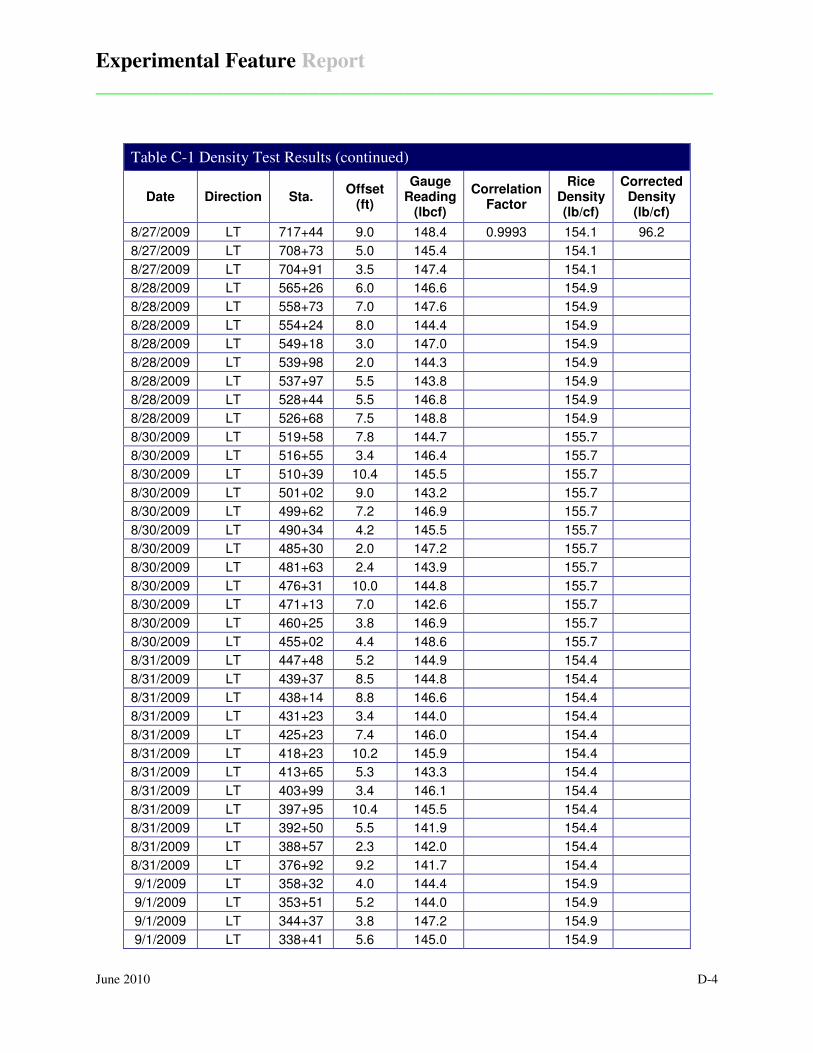
Experimental Feature Report
__________________________________________________________
June 2010 D-4
Table C-1 Density Test Results (continued)
Date Direction Sta. Offset
(ft)
Gauge Reading
(lbcf)
Correlation Factor
Rice Density (lb/cf)
Corrected Density (lb/cf)
8/27/2009 LT 717+44 9.0 148.4 0.9993 154.1 96.2
8/27/2009 LT 708+73 5.0 145.4 154.1
8/27/2009 LT 704+91 3.5 147.4 154.1
8/28/2009 LT 565+26 6.0 146.6 154.9
8/28/2009 LT 558+73 7.0 147.6 154.9
8/28/2009 LT 554+24 8.0 144.4 154.9
8/28/2009 LT 549+18 3.0 147.0 154.9
8/28/2009 LT 539+98 2.0 144.3 154.9
8/28/2009 LT 537+97 5.5 143.8 154.9
8/28/2009 LT 528+44 5.5 146.8 154.9
8/28/2009 LT 526+68 7.5 148.8 154.9
8/30/2009 LT 519+58 7.8 144.7 155.7
8/30/2009 LT 516+55 3.4 146.4 155.7
8/30/2009 LT 510+39 10.4 145.5 155.7
8/30/2009 LT 501+02 9.0 143.2 155.7
8/30/2009 LT 499+62 7.2 146.9 155.7
8/30/2009 LT 490+34 4.2 145.5 155.7
8/30/2009 LT 485+30 2.0 147.2 155.7
8/30/2009 LT 481+63 2.4 143.9 155.7
8/30/2009 LT 476+31 10.0 144.8 155.7
8/30/2009 LT 471+13 7.0 142.6 155.7
8/30/2009 LT 460+25 3.8 146.9 155.7
8/30/2009 LT 455+02 4.4 148.6 155.7
8/31/2009 LT 447+48 5.2 144.9 154.4
8/31/2009 LT 439+37 8.5 144.8 154.4
8/31/2009 LT 438+14 8.8 146.6 154.4
8/31/2009 LT 431+23 3.4 144.0 154.4
8/31/2009 LT 425+23 7.4 146.0 154.4
8/31/2009 LT 418+23 10.2 145.9 154.4
8/31/2009 LT 413+65 5.3 143.3 154.4
8/31/2009 LT 403+99 3.4 146.1 154.4
8/31/2009 LT 397+95 10.4 145.5 154.4
8/31/2009 LT 392+50 5.5 141.9 154.4
8/31/2009 LT 388+57 2.3 142.0 154.4
8/31/2009 LT 376+92 9.2 141.7 154.4
9/1/2009 LT 358+32 4.0 144.4 154.9
9/1/2009 LT 353+51 5.2 144.0 154.9
9/1/2009 LT 344+37 3.8 147.2 154.9
9/1/2009 LT 338+41 5.6 145.0 154.9

Experimental Feature Report
__________________________________________________________
June 2010 D-5
Table C-1 Density Test Results (continued)
Date Direction Sta. Offset
(ft)
Gauge Reading
(lbcf)
Correlation Factor
Rice Density (lb/cf)
Corrected Density (lb/cf)
9/1/2009 LT 332+25 4.7 144.1 154.9
9/1/2009 LT 325+47 1.8 145.3 154.9
9/1/2009 LT 321+86 1.7 146.4 154.9
9/1/2009 LT 319+00 8.9 147.3 154.9
9/1/2009 LT 309+59 10.3 145.9 154.9
9/1/2009 LT 302+16 5.3 142.3 154.9
9/1/2009 LT 300+10 6.0 141.8 154.9
9/1/2009 LT 293+49 9.4 142.2 154.9
9/1/2009 LT 289+34 5.3 141.9 154.9
9/1/2009 LT 280+72 4.3 143.2 154.9
9/1/2009 LT 273+17 8.5 144.0 154.9
9/2/2009 LT 271+05 4.4 141.4 154.9
9/2/2009 LT 265+38 9.4 142.8 154.9
9/2/2009 LT 258+45 5.3 142.4 154.9
9/2/2009 LT 253+59 2.4 143.5 154.9
9/2/2009 LT 244+71 10.2 146.2 154.9
9/2/2009 LT 239+87 2.0 143.6 154.9
9/2/2009 LT 237+08 2.0 144.0 154.9
9/2/2009 LT 226+74 8.3 142.9 154.9
9/2/2009 LT 220+82 7.6 144.4 154.9
9/2/2009 LT 215+41 5.3 140.1 154.9
9/2/2009 LT 211+19 8.3 142.5 154.9
9/2/2009 LT 204+79 3.2 143.1 154.9
9/2/2009 LT 201+09 8.3 142.7 154.9
9/2/2009 LT 193+25 2.4 144.0 154.9
9/2/2009 LT 190+69 9.2 143.4 154.9
9/3/2009 LT 185+96 6.0 142.0 155.8
9/3/2009 LT 177+56 2.8 145.2 155.8
9/3/2009 LT 172+27 10.2 143.6 155.8
9/3/2009 LT 168+45 8.8 144.3 155.8
9/3/2009 LT 161+07 4.0 143.8 155.8
9/3/2009 LT 155+87 3.0 145.5 155.8
9/3/2009 LT 145+77 4.4 142.7 155.8
9/3/2009 LT 144+06 8.5 145.8 155.8
9/3/2009 LT 139+31 8.9 144.3 155.8
9/3/2009 LT 130+41 5.2 145.5 155.8
9/3/2009 LT 127+00 10.4 145.2 155.8
9/3/2009 LT 119+71 10.4 142.3 155.8
9/3/2009 LT 112+32 2.3 143.1 155.8

Experimental Feature Report
__________________________________________________________
June 2010 D-6
Table C-1 Density Test Results (continued)
Date Direction Sta. Offset
(ft)
Gauge Reading
(lbcf)
Correlation Factor
Rice Density (lb/cf)
Corrected Density (lb/cf)
9/3/2009 LT 110+55 2.2 144.5 155.8
9/3/2009 LT 101+60 2.2 144.5 155.8
9/8/2009 LT 95+37 3.5 145.9 156.6
9/8/2009 LT 92+36 7.4 144.0 156.6
9/8/2009 LT 85+97 1.5 142.9 156.6
9/8/2009 LT 81+28 4.8 144.2 156.6
9/8/2009 LT 71+87 8.0 144.5 156.6
9/8/2009 LT 65+58 7.8 140.8 156.6
9/8/2009 LT 62+55 3.4 142.2 156.6
9/8/2009 LT 56+39 10.4 145.2 156.6
9/8/2009 LT 47+02 9.0 144.1 156.6
9/8/2009 LT 45+62 7.2 145.6 156.6
9/9/2009 LT 35+18 4.2 144.2 155.6
9/9/2009 LT 29+97 2.0 143.1 155.6
9/9/2009 LT 26+16 2.4 145.6 155.6
9/9/2009 LT 20+66 10.0 145.3 155.6
9/9/2009 LT 15+30 7.0 144.8 155.6
9/9/2009 RT 36+57 3.8 145.1 155.6
9/9/2009 RT 43+10 4.4 144.0 155.6
9/9/2009 RT 46+64 7.9 143.5 155.6
9/9/2009 RT 49+77 3.7 143.5 155.6
9/9/2009 RT 56+97 4.7 141.8 155.6
9/10/2009 RT 63+52 5.2 143.4 154.5
9/10/2009 RT 71+63 8.5 144.7 154.5
9/10/2009 RT 72+86 8.8 144.1 154.5
9/10/2009 RT 79+76 3.4 142.7 154.5
9/10/2009 RT 85+77 7.4 144.2 154.5
9/10/2009 RT 92+77 10.2 143.5 154.5
9/10/2009 RT 97+35 5.3 142.8 154.5
9/10/2009 RT 197+01 3.4 142.5 154.5
9/10/2009 RT 100+05 10.4 142.3 154.5
9/10/2009 RT 103+68 5.5 142.8 154.5
9/11/2009 RT 110+43 2.3 144.2 155.0
9/11/2009 RT 113+76 9.2 142.9 155.0
9/11/2009 RT 122+47 4.9 145.7 155.0
9/11/2009 RT 126+30 3.5 145.3 155.0
9/11/2009 RT 132+94 6.1 141.8 155.0
9/11/2009 RT 139+47 7.0 144.7 155.0
9/11/2009 RT 143+96 8.3 146.4 155.0
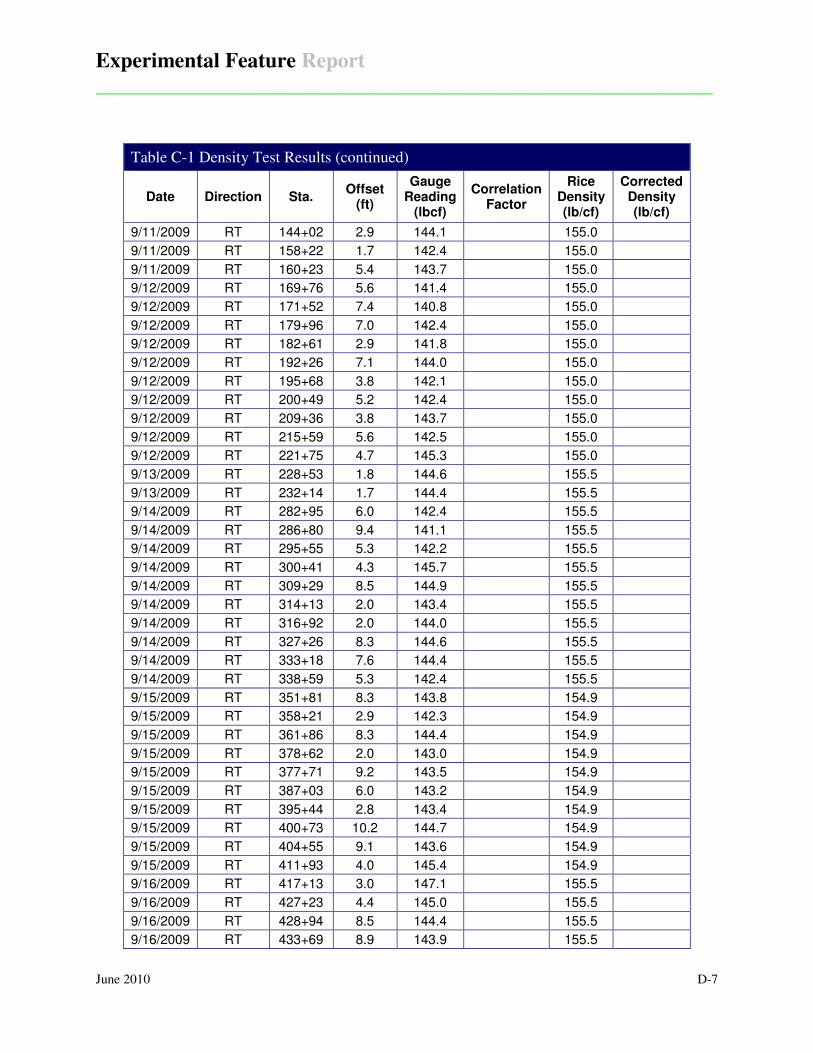
Experimental Feature Report
__________________________________________________________
June 2010 D-7
Table C-1 Density Test Results (continued)
Date Direction Sta. Offset
(ft)
Gauge Reading
(lbcf)
Correlation Factor
Rice Density (lb/cf)
Corrected Density (lb/cf)
9/11/2009 RT 144+02 2.9 144.1 155.0
9/11/2009 RT 158+22 1.7 142.4 155.0
9/11/2009 RT 160+23 5.4 143.7 155.0
9/12/2009 RT 169+76 5.6 141.4 155.0
9/12/2009 RT 171+52 7.4 140.8 155.0
9/12/2009 RT 179+96 7.0 142.4 155.0
9/12/2009 RT 182+61 2.9 141.8 155.0
9/12/2009 RT 192+26 7.1 144.0 155.0
9/12/2009 RT 195+68 3.8 142.1 155.0
9/12/2009 RT 200+49 5.2 142.4 155.0
9/12/2009 RT 209+36 3.8 143.7 155.0
9/12/2009 RT 215+59 5.6 142.5 155.0
9/12/2009 RT 221+75 4.7 145.3 155.0
9/13/2009 RT 228+53 1.8 144.6 155.5
9/13/2009 RT 232+14 1.7 144.4 155.5
9/14/2009 RT 282+95 6.0 142.4 155.5
9/14/2009 RT 286+80 9.4 141.1 155.5
9/14/2009 RT 295+55 5.3 142.2 155.5
9/14/2009 RT 300+41 4.3 145.7 155.5
9/14/2009 RT 309+29 8.5 144.9 155.5
9/14/2009 RT 314+13 2.0 143.4 155.5
9/14/2009 RT 316+92 2.0 144.0 155.5
9/14/2009 RT 327+26 8.3 144.6 155.5
9/14/2009 RT 333+18 7.6 144.4 155.5
9/14/2009 RT 338+59 5.3 142.4 155.5
9/15/2009 RT 351+81 8.3 143.8 154.9
9/15/2009 RT 358+21 2.9 142.3 154.9
9/15/2009 RT 361+86 8.3 144.4 154.9
9/15/2009 RT 378+62 2.0 143.0 154.9
9/15/2009 RT 377+71 9.2 143.5 154.9
9/15/2009 RT 387+03 6.0 143.2 154.9
9/15/2009 RT 395+44 2.8 143.4 154.9
9/15/2009 RT 400+73 10.2 144.7 154.9
9/15/2009 RT 404+55 9.1 143.6 154.9
9/15/2009 RT 411+93 4.0 145.4 154.9
9/16/2009 RT 417+13 3.0 147.1 155.5
9/16/2009 RT 427+23 4.4 145.0 155.5
9/16/2009 RT 428+94 8.5 144.4 155.5
9/16/2009 RT 433+69 8.9 143.9 155.5

Experimental Feature Report
__________________________________________________________
June 2010 D-8
Table C-1 Density Test Results (continued)
Date Direction Sta. Offset
(ft)
Gauge Reading
(lbcf)
Correlation Factor
Rice Density (lb/cf)
Corrected Density (lb/cf)
9/16/2009 RT 442+59 5.2 143.3 155.5
9/16/2009 RT 446+00 10.4 144.2 155.5
9/16/2009 RT 453+29 10.4 141.9 155.5
9/16/2009 RT 460+68 2.3 145.2 155.5
9/16/2009 RT 462+45 2.2 144.1 155.5
9/16/2009 RT 472+40 2.0 143.6 155.5
9/17/2009 RT 477+63 3.5 141.9 155.7
9/17/2009 RT 480+64 7.4 142.0 155.7
9/17/2009 RT 487+03 1.5 143.4 155.7
9/17/2009 RT 491+72 4.8 143.6 155.7
9/17/2009 RT 501+13 7.9 145.8 155.7
9/17/2009 RT 507+42 7.8 143.9 155.7
9/17/2009 RT 510+45 3.4 147.6 155.7
9/17/2009 RT 516+61 10.4 144.0 155.7
9/17/2009 RT 525+98 9.0 144.2 155.7
9/17/2009 RT 527+38 7.6 143.9 155.7
9/17/2009 RT 536+66 4.2 142.9 155.7
9/17/2009 RT 541+70 2.0 147.3 155.7
9/17/2009 RT 545+37 2.4 144.6 155.7
9/17/2009 RT 550+69 10.0 141.3 155.7
9/17/2009 RT 555+87 7.0 147.3 155.7
9/17/2009 RT 565+45 3.8 144.3 155.7
9/17/2009 RT 571+98 4.4 143.5 155.7
9/17/2009 RT 686+52 7.9 145.0 155.7
9/17/2009 RT 689+65 3.7 144.3 155.7
9/17/2009 RT 696+85 4.7 143.3 155.7
9/20/2009 RT 691+68 4.0 141.2 156.0
9/20/2009 RT 696+49 5.2 140.9 156.0
9/20/2009 RT 705+63 3.8 143.1 156.0
9/20/2009 RT 711+59 5.6 142.5 156.0
9/20/2009 RT 717+75 4.7 143.4 156.0
9/20/2009 RT 724+53 1.8 146.2 156.0
9/20/2009 RT 728+14 1.7 145.0 156.0
9/20/2009 RT 731+00 8.9 142.8 156.0
9/20/2009 RT 740+01 10.3 144.1 156.0
9/20/2009 RT 747+84 5.3 143.5 156.0
Note: Gauge number 39469 was used on all tests on or before September 13th. From September 14th onward gauge number 39471 was used. Blanks indicate locations where the mix was not correlated to the gauge. Only gauge 39469 was correlated for HIPR pavement placed at station 711+59 and higher.

Experimental Feature Report
__________________________________________________________
June 2010 E-1
Appendix E
Gradation, Asphalt Content and Volumetric Test Results

Experimental Feature Report
__________________________________________________________
June 2010 E-2
Table D-1. WSDOT gradation and asphalt content test results.
Date Station 3/4-in
1/2-in
3/8-in
No. 4
No. 8
No. 16
No. 30
No. 50
No. 100
No. 200
Pb
8/18/09 14.5 EB 100.0 98.1 86.5 59.0 43.8 33.1 23.5 14.3 9.6 7.0 5.94
8/18/09 14.5 EB 100.0 96.0 86.0 61.0 46.0 35.0 25.0 16.0 10.0 7.1 5.90
8/19/09 16 EB 100.0 99.0 92.0 66.0 49.0 37.0 27.0 17.0 11.0 8.0 6.20
8/20/09 884-885 RT 100.0 96.0 86.0 61.0 46.0 35.0 25.0 16.0 11.0 8.1 5.70
8/21/09 958 RT 100.0 95.0 84.0 57.0 43.0 32.0 23.0 15.0 9.0 6.9 5.50
8/24/09 967 LT 100.0 97.0 86.0 62.0 46.0 35.0 25.0 16.0 10.0 7.6 5.70
8/25/09 859 LT 100.0 97.0 86.0 60.0 45.0 34.0 25.0 16.0 10.0 7.3 5.40
8/26/09 821 LT 100.0 95.0 87.0 59.0 44.0 33.0 24.0 15.0 10.0 7.4 5.30
8/27/09 724 LT 100.0 95.0 87.0 58.0 42.0 32.0 23.0 14.0 9.0 7.0 5.70
8/28/09 100.0 97.0 89.0 62.0 45.0 34.0 25.0 16.0 10.0 7.2 5.80
8/30/09 521 LT 100.0 96.0 86.0 59.0 43.0 33.0 23.0 14.0 9.0 6.6 5.40
8/31/09 100.0 97.0 89.0 61.0 46.0 34.0 24.0 15.0 10.0 6.8 5.70
9/1/09 ~376 LT 100.0 95.0 86.0 59.0 43.0 32.0 23.0 15.0 10.0 7.1 6.00
9/2/09 100.0 97.0 88.0 61.0 45.0 34.0 25.0 16.0 10.0 7.2 5.50
9/3/09 196 LT 100.0 96.0 84.0 55.0 39.0 29.0 21.0 14.0 9.0 6.7 5.40
9/8/09 108 LT 100.0 96.0 88.0 59.0 44.0 33.0 24.0 15.0 9.0 6.7 5.30
9/9/09 100.0 97.0 90.0 63.0 47.0 35.0 26.0 16.0 10.0 7.2 5.80
9/10/09 83+50 RT 100.0 96.0 87.0 60.0 44.0 33.0 24.0 15.0 9.0 6.9 5.40
9/10/09 100.0 96.0 87.0 58.0 43.0 33.0 24.0 15.0 10.0 6.9 5.40
9/13/09 212 RT 100.0 96.0 85.0 57.0 42.0 32.0 24.0 14.0 9.0 6.4 5.20
9/14/09 301 RT 100.0 97.0 91.0 65.0 48.0 36.0 26.0 16.0 10.0 6.9 5.70
9/15/09 357 RT 100.0 97.0 90.0 61.0 44.0 32.0 23.0 15.0 9.0 6.9 5.70
9/16/09 433 RT 100.0 96.0 88.0 59.0 44.0 33.0 23.0 14.0 9.0 6.2 5.40
9/17/09 100.0 97.0 90.0 65.0 48.0 35.0 25.0 16.0 10.0 7.0 5.90
9/20/09 693 RT 100.0 99.0 93.0 60.0 43.0 32.0 22.0 14.0 9.0 6.7 5.30
Table D-2. Granite gradation and asphalt content test results.
Date Station 3/4-in
1/2-in
3/8-in
No. 4
No. 8
No. 16
No. 30
No. 50
No. 100
No. 200
Pb
8/18/09 MP 14.5 EB 100.0 98.1 86.5 59.0 43.8 33.1 23.5 14.3 9.6 7.0 5.94
8/18/09 MP 14.5 EB 100.0 98.6 88.4 63.7 48.0 36.0 26.1 15.5 9.6 7.0 6.03
8/19/09 MP 16 EB 100.0 97.1 88.4 63.7 48.2 36.4 26.7 15.9 9.7 7.0 5.67
8/20/09 884-885 RT 100.0 96.8 87.7 61.5 46.6 34.4 25.3 15.5 9.5 6.9 5.66
8/20/09 100.0 96.2 85.2 57.3 43.1 32.4 23.8 14.2 8.4 6.1 5.39
8/21/09 958 RT 100.0 94.9 81.5 54.9 41.4 31.1 22.8 13.6 8.2 5.9 5.23
8/24/09 967 LT 100.0 95.7 85.8 62.0 46.2 35.0 25.8 15.6 9.6 7.0 5.66
8/25/09 859 LT 100.0 95.8 85.5 58.9 44.4 33.4 24.7 14.8 8.9 6.4 5.12

Experimental Feature Report
__________________________________________________________
June 2010 E-3
Table D-2. Granite gradation and asphalt content test results (continued).
Date Station 3/4-in
1/2-in
3/8-in
No. 4
No. 8
No. 16
No. 30
No. 50
No. 100
No. 200
Pb
8/26/09 821 LT 100.0 96.3 88.3 60.3 45.2 33.7 24.7 15.0 9.3 6.9 5.36
8/27/09 724 LT 100.0 97.4 87.0 59.3 44.3 32.8 23.4 14.1 8.8 6.4 5.72
8/30/09 521 LT 100.0 96.0 86.2 57.9 43.2 32.5 23.3 13.7 8.2 5.8 5.19
8/31/09 100.0 96.0 88.2 61.8 45.0 34.4 24.0 14.9 9.2 6.7 5.52
9/1/09 ~Sta. 376 LT 100.0 93.5 85.8 59.5 43.4 32.1 23.1 14.2 9.0 6.5 5.64
9/2/09 100.0 98.0 90.4 62.5 45.9 35.3 25.3 16.0 10.1 7.5 5.53
9/3/09 196 LT 100.0 96.0 84.3 54.3 38.8 29.1 20.6 13.7 9.2 6.9 5.13
9/8/09 108 LT 100.0 97.8 89.0 58.5 43.5 32.5 23.8 14.2 8.5 6.0 5.02
9/10/09 83+50 RT 100.0 96.2 88.4 59.4 45.0 34.3 25.1 15.0 9.2 6.5 5.33
9/13/09 212 RT 100.0 96.8 89.2 60.3 44.3 33.8 23.9 14.8 9.1 6.5 5.33
9/14/09 301 RT 100.0 96.5 91.0 64.3 47.5 36.2 26.6 16.1 10.0 7.3 5.72
9/15/09 357 RT 100.0 97.3 91.8 61.7 44.6 33.1 23.0 14.6 9.4 6.9 5.54
9/16/09 433 RT 100.0 97.1 87.9 60.0 44.1 33.5 23.4 14.3 8.7 6.2 5.33
9/20/09 693 RT 100.0 98.4 91.3 61.1 42.9 31.9 22.1 13.9 9.1 6.5 5.15
9/21/09 796 RT 100.0 97.2 89.5 63.6 51.6 34.6 25.8 15.1 9.4 6.1 5.80
Table D-3. WSDOT volumetric test results.
Date Station Gsb Gmm Pb Gmb Va VMA, % VFA, %
8/18/09 14.5 EB 2.688 2.453 5.9 2.449 0.16 14.30 98.90
8/19/09 16 EB 2.688 2.459 6.2 2.438 0.85 14.90 94.30
8/20/09 884-885 RT 2.688 2.470 5.7 2.453 0.69 13.90 95.00
8/21/09 958 RT 2.688 2.484 5.5 2.445 1.57 14.00 88.80
8/24/09 967 LT 2.688 2.464 5.7 2.443 0.85 14.30 94.00
8/25/09 859 LT 2.688 2.496 5.4 2.431 2.60 14.40 81.90
8/26/09 821 LT 2.688 2.489 5.3 2.444 1.81 13.90 87.00
8/27/09 724 LT 2.688 2.469 5.7 2.452 0.69 14.00 95.10
8/28/09 2.688 2.470 5.8 2.439 1.26 14.50 91.30
8/30/09 521 LT 2.688 2.493 5.4 2.425 2.73 14.70 81.40
8/31/09 2.688 2.476 5.7 2.429 1.90 14.80 87.20
9/1/09 376 LT 2.688 2.480 6.0 2.442 1.53 14.60 89.50
9/2/09 2.688 2.488 5.5 2.436 2.09 14.40 85.50
9/3/09 196 LT 2.688 2.501 5.4 2.441 2.40 14.10 83.00
9/8/09 108 LT 2.688 2.495 5.3 2.433 2.48 14.30 82.60
9/9/09 2.688 2.465 5.8 2.438 1.10 14.60 92.50
9/10/09 83+50 RT 2.688 2.488 5.4 2.434 2.17 14.30 84.80
9/10/09 2.688 2.482 5.4 2.441 1.65 14.10 88.30
9/13/09 212 RT 2.688 2.496 5.2 2.421 3.00 14.60 79.40
9/14/09 301 RT 2.688 2.479 5.7 2.423 2.26 15.00 84.90

Experimental Feature Report
__________________________________________________________
June 2010 E-4
Table D-3. WSDOT volumetric test results (continued).
Date Station Gsb Gmm Pb Gmb Va VMA, % VFA, %
9/15/09 357 RT 2.688 2.477 5.7 2.420 2.30 15.10 84.80
9/16/09 433 RT 2.688 2.480 5.4 2.419 2.46 14.90 83.50
9/17/09 2.688 2.469 5.9 2.431 1.54 14.90 89.70
9/20/09 693 RT 2.688 2.498 5.3 2.415 3.32 14.90 77.70
Table D-4. Granite volumetric test results
Date Station Gsb Gmm Pb Gmb Va VMA, % VFA, %
8/18/09 MP 14.5 EB 2.688 2.464 6.03 2.448 0.65 14.42 95.50
8/18/09 MP 14.5 EB 2.688 2.464 6.03 2.444 0.81 14.56 94.43
8/19/09 MP 16 EB 2.688 2.482 5.67 2.440 1.69 14.37 88.22
8/20/09 884-885 RT 2.688 2.493 5.66 2.461 1.28 13.63 90.58
8/20/09 919 RT 2.688 2.483 5.39 2.449 1.37 13.80 90.08
8/21/09 958 RT 2.688 2.486 5.23 2.451 1.41 13.59 89.64
8/24/09 967 LT 2.688 2.480 5.66 2.455 1.01 13.84 92.72
8/25/09 859 LT 2.688 2.501 5.12 2.438 2.52 13.94 81.93
8/26/09 821 LT 2.688 2.494 5.36 2.449 1.80 13.77 86.90
8/27/09 724 LT 2.688 2.476 5.72 2.453 0.93 13.96 93.35
8/30/09 521 LT 2.688 2.501 5.19 2.428 2.92 14.36 79.67
8/31/09 2.688 2.481 5.52 2.435 1.85 14.41 87.13
9/1/09 ~Sta. 376 LT 2.688 2.488 5.64 2.452 1.45 13.92 89.61
9/2/09 2.688 2.488 5.53 2.442 1.85 14.18 86.96
9/3/09 196 LT 2.688 2.503 5.13 2.417 3.44 14.69 76.61
9/10/09 83+50 RT 2.688 2.483 5.33 2.433 2.01 14.31 85.93
9/13/09 212 RT 2.688 2.499 5.33 2.421 3.12 14.73 78.81
9/14/09 301 RT 2.688 2.499 5.72 2.422 3.08 15.05 79.53
9/15/09 357 RT 2.688 2.489 5.54 2.417 2.89 15.06 80.79
9/16/09 433 RT 2.688 2.499 5.33 2.410 3.56 15.12 76.45
9/20/09 693 RT 2.688 2.507 5.15 2.410 3.87 14.96 74.14
9/21/09 796 RT 2.688 2.477 5.80 2.468 0.36 13.51 97.31

Experimental Feature Report
__________________________________________________________
June 2010 F-1
Appendix F
Admixture Gradation and Asphalt Content Test Results

Experimental Feature Report
__________________________________________________________
June 2010 F-2
Table E-1. Granite admixture gradation and asphalt content test results.
Date 3/4-in 1/2-in 3/8-in No. 4 No. 8 No. 16
No. 30
No. 50
No. 100
No. 200
Pb
8/18/09 100.0 95.6 83.6 47.6 34.3 24.8 16.6 8.6 5.1 3.6 5.02
8/18/09 100.0 92.0 76.8 43.3 32.4 23.3 15.7 8.1 4.6 3.3 4.85
8/18/09 5.63
8/18/09 100.0 93.9 77.9 43.3 32.3 23.3 15.7 8.0 4.3 2.9 4.53
8/19/09 100.0 89.8 71.8 37.7 28.1 20.8 14.6 7.8 4.3 4.1 3.98
8/20/09 100.0 89.4 75.4 41.2 30.2 22.3 15.5 8.0 4.2 2.8 4.12
8/20/09 100.0 88.8 74.9 41.4 29.5 20.5 13.6 6.9 3.9 2.7 4.11
8/21/09 100.0 90.2 74.5 40.6 30.3 22.0 15.2 8.0 4.5 3.2 3.84
8/24/09 100.0 97.6 86.8 52.2 39.9 30.5 22.5 13.8 9.0 6.4 4.43
8/24/09 100.0 91.6 79.0 43.5 32.3 23.6 16.4 8.9 5.1 3.7 4.02
8/25/09 100.0 93.4 79.9 43.4 31.8 23.3 16.3 8.7 4.7 3.2 4.14
8/25/09 4.09
8/26/09 100.0 91.3 77.3 42.9 31.7 23.2 16.2 8.7 4.7 3.2 3.83
8/27/09 100.0 89.7 78.1 45.3 34.6 25.7 17.7 9.4 4.9 3.5 3.10
8/27/09 100.0 89.8 78.0 38.8 29.4 22.0 15.5 8.5 5.0 3.8 3.54
8/28/09 100.0 94.8 82.3 47.4 36.4 26.8 18.4 9.4 4.9 3.4 3.42
8/30/09 100.0 93.8 80.7 45.2 33.2 23.6 15.6 8.0 4.4 3.1 3.38
8/31/09 100.0 94.6 81.3 45.9 34.6 24.7 16.8 8.7 4.8 3.3 3.46
9/1/09 100.0 90.0 79.1 41.6 30.3 22.1 15.5 8.9 5.7 4.3 3.89
9/2/09 100.0 93.4 80.2 44.1 32.7 22.5 14.1 6.3 4.4 2.7 4.75
9/3/09 100.0 94.0 82.1 43.5 32.4 24.2 16.1 12.2 4.5 2.6 4.20
9/13/09 100.0 90.1 78.5 41.4 30.9 22.5 14.7 8.0 4.4 3.1 3.85
9/14/09 100.0 90.2 78.6 42.0 30.3 23.0 15.1 9.2 5.4 3.6 3.77
9/15/09 100.0 89.7 76.2 40.7 31.1 23.2 15.7 8.8 5.1 3.6 3.92
9/16/09 100.0 92.9 81.1 40.1 30.7 21.7 13.1 5.3 2.1 3.92
9/20/09 100.0 93.8 82.8 45.1 34.3 25.5 16.7 9.2 5.2 3.7 4.28