evaluation of heavy metals concentration in soil using gis ... · evaluation of heavy metals...
TRANSCRIPT

IOSR Journal of Environmental Science, Toxicology and Food Technology (IOSR-JESTFT)
e-ISSN: 2319-2402,p- ISSN: 2319-2399.Volume 9, Issue 12 Ver. I (Dec. 2015), PP 61-72
www.iosrjournals.org
DOI: 10.9790/2402-091216172 www.iosrjournals.org 61 | Page
Evaluation of heavy metals concentration in soil using GIS, RS
and Geostatistics
Ali Reza Soffianian*, Hawkar Bapeer Bakir**, Loghman Khodakarami** *Associate Professor at Department of Natural Resources, Isfahan University of Technology, Isfahan, 84156-
83111, Iran
**Assistant Lecturer at Faculty of Engineering, Koya University, Kurdistan Regional Government, Iraq
Abstract: The objective of this study was to assess the effect of agricultural activities on heavy metal
concentrations and spatial distribution using Geographical Information System (GIS), geostatistics and Remote
Sensing (RS) techniques. The random systematic method was used for sampling strategy by dividing the study area into a grid of 5 km× 5 km and collecting 135 composite soil samples from 0-20 cm depth. These samples
were analyzed for total concentration of heavy metals (Zn, Cd, Ni, Pb, Cu, Cr, Co, As and V), soil pH, organic
matter and soil texture. Interpolation of heavy metals concentration was done by geostatistics methods and the
appropriate method for interpolation was selected using spatial correlation analyzes and MAE and MBE
functions. The interpolation maps of Zn, V and Pb were produced by discrete kriging method and exponential
model, interpolation As map was produced using ordinary kriging and ovally model. For producing the
interpolation maps of Cd, Cu and Cr, Co, Ni we used Radial Basic Function method and ordinary kriging
method respectively and exponential model. For analyzing heavy metal distribution, we used landuse and
geology maps. Landuse map was produced using multi teporal of satellite images IRS-P6 AWIFS. We used fuzzy
method for classification of satellite images, have kappa and accuracy of 0.88 and 90% respectively. Analyzing
the interpolation maps show that As, Cd, Zn and Pb have the geological and agricultural origin and Cr, Co, Ni
and V originated from bedrocks. Agricultural activities such as over using of fertilizers can increase the amount of these elements in soil.
Key words: geostatistics, heavy metals, soil pollution, parent material, geographical Information System (GIS).
I. Introduction Because of limit sources of food, producing the safe food for increasing population of the word with
minimum adverse effect on environment is one of the very important problems of word. Increasing the industrial
and agricultural activities and producing the pollutants is one of the most important and developing problems of
human in recent years (Torabian and Mahjouri, 2002). There are much expanded uses of chemicals in
agriculture and industries. These chemicals enter the environment by agricultural and industrial activities (Amini et al, 2006). Because of wide distribution of chemicals and heavy metals in environment, which many of
them are toxic, mutagen, carcinogenic; they can enter the food chain.
Soil is one of the most important natural sources of food. Intensive agricultural and industrial activities
have the adverse effects on this important source. Therefore protection of soil quality and suppression of its
downfall is very important and vital. Usually point and non- point pollutions produced by human activities
(agriculture, industry, urban) affect the quality of soil and water drastically (Corwin and Wagenet, 1996). Such
examples of these non- point pollutants are: fertilizers, pesticides, heavy metals and salts. These pollutants have
widely distribution (Corwin et al, 1999). Non- point pollutants are the universal problems and don’t be limited
by political boundaries (Duda and Nawar, 1996). The non- point pollutants are known as the most important
sources of pollution in soil and water and agriculture have the most contribution to produce these pollutants
(Duda and Nawar, 1996 and Humenik et al , 1987).
These days, the importance of GIS, RS and geostatistics to soil pollution studies is well known. In recent years, GIS was used to managing and estimate the non- point pollution sources, by environment
researchers (Walsh, 1988). Also, Satellite Image were used in natural resource, agriculture and environment
studies. So it is necessary for accurate evaluation of non- point pollutions in wide scale to use of sum of sciences
such as classical statistics, geostatistics, remote sensing, GIS, soil science, hydrology and biosciences.
The objective of this study is evaluating the total concentration of Cu, Zn, Cd, As, Cr, Co, Ni, V, Pb
and evaluating the pollution of surface soil (0- 20 cm) in three catchment areas in Hamedan province, Iran:
Kaboudarahang, Razan- Ghahavand and Khonjin- Talkhab, using classic statistics, geostatistics, GIS and RS.
Hamedan provinve and these three catchment areas of this province are of the important centers of Iran
agriculture.

Evaluation of heavy metals concentration in soil using GIS, RS and Geostatistics
DOI: 10.9790/2402-091216172 www.iosrjournals.org 62 | Page
II. Methods And Materials - Study Site
The area of the study site is about 7262 Km2 and located between 351074 and 360778 longitudes and
3545048 and 3956656 latitudes. As mentioned above this study area located in Hamedan province of Iran and contains three catchment areas: Kaboudarahang, Razan- Ghahavand and Khonjin- Talkhab (fig. 1). The
predominant landuse of these catchment areas are: agriculture with predominant crops of wheat, barley, alfalfa
and potato, garden and orchard.the minimum and maximum height of study area from sea surface is 1679 m and
2933m respectively. According to annual census of 15 recent years minimum and maximum precipitation of this
region is 250 and 550 mm y-1 respectively. According to Domarten classification, the climate of this region is
arid and semi- arid (Classification of soils of Hamadan Province.1997). The predominant geological structure of
this area is quarteric sedimentary terraces and orbitalin lime, Shale and marls. The soils of this region are
shallow and semi- deep, with gravels and lime. The texture of these soils is light to medium (Classification of
soils of Hamadan Province.1997).
In this study we used the 1/50000 topographic maps for initial assessing of study site and recording the
satellite image, geological maps (Fig. 2).
The landuse map of this region for year 2008 was produced using multi temporal of satellite images IRS-P6 AWIFS (Table. 1). Geometric and atmospheric corrections were done and growth phenologic stages of
predominant crops (wheat, barley, alfalfa, potato, garden and orchard) were determined. Then after the
classification of images using fuzzy method, the land use map with Kappa of 0.88 and accuracy of 90% was
produced. We used this map for analyzing the heavy metals distribution in soils of study site (Fig. 2). Table 2
shows the area and area percentage of each landuse. Arc GIS software was used for interpolating the heavy
metals.
Data acquisition
In this study we used the 1/50000 topographic maps for initial assessing of study site and recording the
satellite image, geological maps that this map reflects the overall composition of the surface geology consists of
five classes, alluvium, igneous and metamorphic rocks, limestone, sandstone and shale and Marl, has been prepared by the Geological Survey (Fig. 2).
Land use map: Mapping of land use and cropping pattern are essential for the study of soil contamination.
That’s way in this study the land use map of this region in year 2008 was produced using multi temporal of
satellite images IRS-P6 AWIFS (Table. 1). After determining the growth phenologic stages of predominant
crops (wheat, barley, alfalfa, potato, garden and orchard) Images were acquired, first, satellite image geometric
correction with a mean square error of less than 0.48 pixels was applied. For image classification, the method of
fuzzy classification was used. Finally, the land use map of the study region was classified into eleven classes. To
assess the classified land use map precision it was controlled for ground truths with a GPS. Kappa coefficient
and overall classification accuracy of fuzzy classificotion were estimated 88 and 90 percent respectively. The
results confirmed that the fuzzy classifier was capable to generate land use maps and cultivation pattern with
high accuracy. We used this map for analyzing the heavy metals distribution in soils of study site (Fig. 2). Table
2 shows the area and area percentage of each land use. In this study we used Erdas Imagine software for Image processing and Arc GIS software for Geostatistics also Spsss software for statistics analysis.
Soil Sampling Analysis
135 composite soil samples were collected from 0 - 20 cm depth by dividing the affected area into a
grid of 5 km×5 km using random systematic method. The area at each sampling point was about 20 m x 20 m
grid and soil samples were taken of each corners and center of each grid. Soil samples were air dried and
sieved a mechanically vibrating 2 mm stainless steel mesh. In these samples soil texture and organic carbon
were determined using hydrometric and Walkley- Black methods respectively. EC and pH of these samples
were determined in saturated extract and paste respectively (Klute, 1986). For determination of total Hg and As,
one gram of soil sample was digested with a mixed acid (1:3:4 HNO3:HCl:H2O) (Shi et al., 2005). The total
concentrations of other metals in soil samples were determined by digestion of 1 gram of soil with mixed acid (3:1 HNO3:HCl) (Burt et al., 2003). The concentrations of the metals (except for As) in the soil extracts were
determined by inductively coupled plasma-atomic emission spectrometry (ICP-AES) (Demirak et al., 2006).
Concentrations of As in soil samples was determined by hydride generation atomic fluorescence
spectrometry (HG-AFS) (Fu et al., 2008).
Statistical analyses
Basic statistical parameters for each variable, correlation matrices, histograms and boxplots were
calculated using SPSS Statistical Software. Normality test for distribution of soil data was done at 95%
confidence limit, using Klomogorov- Smirnov. Non- normal data were converted to normal data, using

Evaluation of heavy metals concentration in soil using GIS, RS and Geostatistics
DOI: 10.9790/2402-091216172 www.iosrjournals.org 63 | Page
n
i
ii xZxZn
MBE1
1
logarithm conversion method. We used box plots for assessing and correcting the outlier. For evaluating the
effect of landuse on heavy metals concentration, the landuse map was classified in three groups of agriculture,
urban- industrial and non- agriculture, then the mean of heavy metals concentration in these groups was
compared using variance analyzing test. Correlation coefficients among heavy metals and among heavy metals
and physical and chemical parameters of soil were calculated using Pearson correlation coefficient.
Kriging Kriging is based on the idea that the value at an unknown point should be the average of the known
values at its neighbors; weighted by the neighbors' distance to the unknown point. The method is
mathematically closely related to regression analysis. The major aim of kriging is to find the statistical weights
of observations with non- skew estimations and minimum variance of estimations. So kriging is called the best
linear non- skew estimator (Webster and Oliver, 2000). In this study we used the ordinary kriging for evaluating
the distribution of Co, Cr, Ni, As concentration (Webster and Oliver, 2000) and discrete kriging for evaluating
the distribution of Pb, Zn and V concentration (Webster and Oliver, 2000). Also the distribution of Cd and Cu
concentration was evaluated using radial basic function method (Webster and Oliver, 2000).
Evaluation of accuracy and deviation of interpolation methods
To evaluate interpolation methods, statistical indices of MAE (Mean Absolute Error), MBE (Mean Bias
Error) and RMSE (Root Mean Square Error) were used. The MAE is an indicator of errors in the results and MBE indicates the bias of the results obtained through the applied method. When MAE and MBE are 0.00 or
near to naught, the applied method simulates the fact well. However er, as far as its amount is farer than 0.00, it
implies to less precise and more bias. Finally, we use the RMSE to evaluate model performances in cross-
validation mode.
The smallest RMSE indicate the most accurate predictions. How the parameters MAE and MBE and
RMSE are calculated, has been indicated as Eq 1-3.
Where: Z(xi) is observed value at point xi, Z*(xi) is predicted value at point xi, N is the number of
samples.
The validation and the sufficiency of the developed model variogram can be tested via a technique called cross validation. Cross validation estimation is obtained by leaving one sample out and using the remaining
data. This test allows to assess the goodness of fitting of the variogram model, the appropriateness of
neighborhood and type of kriging used. The interpolation values are compared to the real values and then the
least square error models are selected for regional estimation (Leuangthong et al., 2004; Uyan and Cay, 2010).
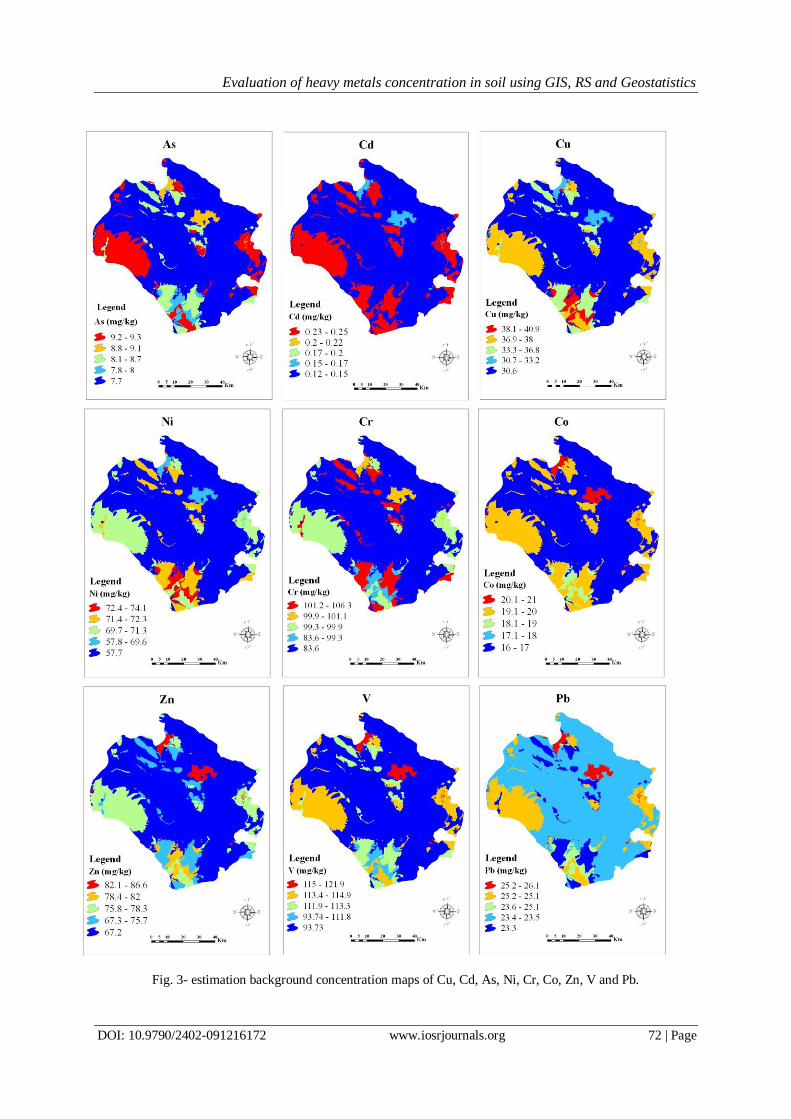
III. Results And Discusion Background concentration of heavy metals The maps of background concentration of heavy metals were produced using mean of heavy metals
concentrations in pristine areas regions such as pristine areas pastures and regions which are far from human
activities. The mean concentration of each metal for each bedrock was calculated, using overlaying this pristine
points and geological maps vector in Arc GIS that was calculated a geology map vector with mean of pristine
points in each bedrock and we were converted geological map to raster dataset for overlaying and analysis with
spatial distribution heavy metal. Then according to these maps, the background concentration maps of each
metal were produced.
Heavy metals concentration in pristine areas show that the mean concentration of V and Cr is naturally
high in all bedrocks and the lowest concentration in bedrocks of this region is related to Cd. The mean
1)
2)
3)
n
i
ii xZxZn
MAE1
*1
n
k
ii xZxZn
RMSE1
2*1

Evaluation of heavy metals concentration in soil using GIS, RS and Geostatistics
DOI: 10.9790/2402-091216172 www.iosrjournals.org 64 | Page
concentration of each metal in bedrocks and background concentration maps are shown in table 3 and Fig 3
respectively.
Statistical Description of Data
Table 4 shows the statistical description of data and some physical and chemical properties of soil.
Coefficient of variance (CV) of Cd and As concentration is higher than 50%, is showing the high variance of
these metals concentration in soils of study site. According to this table the least and the most CV is related to
Co and As respectively. The results of Klomogorov- Smirnov test show that the concentration of V, Cd and As don’t follow the
normal distribution (table 5). It is necessary for data in geostatistics to follow the normal distribution. Presence
the high skewness and kurtosis in study data may disturb the variogram structure and kriging results. We used
logarithm conversion for normalizing the concentration of Cd and As, because there is no negative data.
We replaced the data lower than ( x ±3sd) with maximum or minimum of data which are lower than
( x ±3sd). Also Pekey (2006) and Pereira et. al (2008) used this method to assess and correct the outlier in their
studies.
After normalizing data, we used Pierson correlation coefficient for evaluating the correlations among
heavy metals concentration and soil physical and chemical properties (table 6). According to Pierson correlation
coefficient heavy metals were classified to three groups. In the first group, Co and Cr, Ni, V, Zn, in the second
group, Cr, and Ni and V and in the third group Zn and Pb , V have the correlation higher than 0.6. High
correlation among elements may be a result of derivation and enter soil from the same origin such as agricultural
activities, atmosphere or parent materials. In this study and in all of these groups, according to background
concentration and landuse maps (Fig. 2 and 3) parent materials and agricultural activities are the main origins of
heavy metals in the soil. Many researchers such as Gurhan et al (2007) and Amini (2004) used Pierson
correlation coefficient and stated that metals with high correlation coefficient may originate from the same origin (Gurhan Yalcin et al., 2007 and Amini et al., 2006).
Evaluating the Heavy Metals Concentration in Agriculture, Non- agriculture and Urban- Industrial Land
Uses
For evaluating the relationships among heavy metals concentration distribution and landuse map, the
landuse map was classified to 3 major landuses: agriculture, non- agriculture and urban- industrial. Table 7
shows the area and percentage of each landuse. Then the heavy metals concentration distribution and landuse
maps were overlaid by Arc GIS software. Results indicate that the mean concentration of Cu, Cr, V, Zn and Cd
in agriculture landuse is higher than other landuses but the mean concentrations of Co and Pb in urban-
industrial and Ni in non- agriculture landuse are higher than agriculture landuse. For evaluating the significant difference among heavy metals concentration in different landuses we used one way variance analysis. The
results showed that there is a significant difference in 95% confidence limit between Co concentration in
agriculture and non- agriculture landuses, Pb concentration in agriculture and urban- industrial, agriculture and
non- agriculture landuses, Zn concentration in agriculture and non- agriculture landuses. There is no significant
difference among other heavy metals in different landuses. It seems that agricultural activities in study site affect
the concentration of Pb and Zn in soils, also seems that the effect of urban- industrial activities on Pb
concentration in soils is more than the effect of agriculture landuse.
Spatial Distribution
According to results of spatial correlation analysis for all variants the estimation error and the mean of
Root mean square standardized are very closed to 0 and 1, respectively (table 8). This means that the accuracy of estimation is high. Also, table 8 shows that there is a high spatial correlation among heavy metals
concentration (especially As, Ni, Cr, Co and V) in soil samples. This may be a result of the effect of natural
factors such as parent material, topography and soil type on heavy metals concentration. It seems that human
factors such as fertilizing may change the spatial distribution of some metals such as Cu and Cd (with weak
spatial structure) and Zn and Pb with less range effect. The experimental semivariograms for the heavy metals in
soil are compared with the fitted models in Fig. 4 and Fig.5. The results of empirical variograms and models
fitted on heavy metals data show that spherical model fitted on As data and exponential model can represent the
other metals distribution, except for Cd and Cu.
The results of evaluation of accuracy and deviation of interpolation methods using Mean Absolute
Error (MAE) and Mean Bias Error (MBE) functions were shown in table 8. MAE is the absolute mean of
difference between analyzed and estimated concentration and the closer to 0 MAE, the higher accuracy of method. MBE shows the mean difference between analyzed and estimated concentrations and the less MBE, the
Evaluation of heavy metals concentration in soil using GIS, RS and Geostatistics
DOI: 10.9790/2402-091216172 www.iosrjournals.org 65 | Page
less difference between analyzed and estimated concentrations so the less deviation of the model (Webster and
Oliver, 2000). Evaluating the strength of variants spatial structure using C/C0 (Sill/nuget)showed that the
spatial structure of Cu and Cd is weak, therefore we used Radial Basic Function (RBF) for interpolation of these
two metals. Other metals show the strong spatial structure and we used the kriging method for interpolation.
After evaluating the kriging methods we used ordinary and discrete methods as the best interpolation methods
(table 8).
Jiachun et al. (2007) used the ordinary and normal logarithm kriging methods for producing the spatial pattern of Cr, Hg, Pb, As, Cd and Cu and showed that Cd, Cr and other metals followed the linear, exponential
and spherical models, respectively. They used the C0/ C+ C0 function for evaluating the variants spatial
structures. Lado et al (2008) used the regression kriging for interpolation of heavy metals.
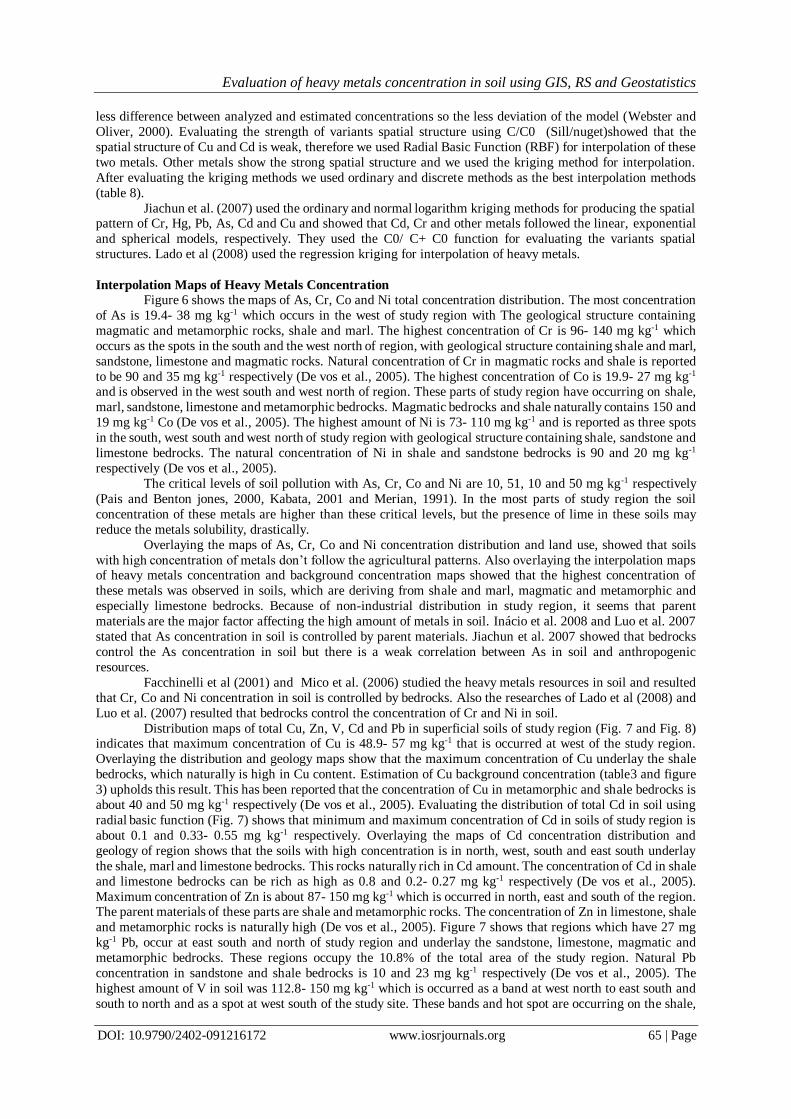
Interpolation Maps of Heavy Metals Concentration
Figure 6 shows the maps of As, Cr, Co and Ni total concentration distribution. The most concentration
of As is 19.4- 38 mg kg-1 which occurs in the west of study region with The geological structure containing
magmatic and metamorphic rocks, shale and marl. The highest concentration of Cr is 96- 140 mg kg-1 which
occurs as the spots in the south and the west north of region, with geological structure containing shale and marl,
sandstone, limestone and magmatic rocks. Natural concentration of Cr in magmatic rocks and shale is reported
to be 90 and 35 mg kg-1 respectively (De vos et al., 2005). The highest concentration of Co is 19.9- 27 mg kg-1 and is observed in the west south and west north of region. These parts of study region have occurring on shale,
marl, sandstone, limestone and metamorphic bedrocks. Magmatic bedrocks and shale naturally contains 150 and
19 mg kg-1 Co (De vos et al., 2005). The highest amount of Ni is 73- 110 mg kg-1 and is reported as three spots
in the south, west south and west north of study region with geological structure containing shale, sandstone and
limestone bedrocks. The natural concentration of Ni in shale and sandstone bedrocks is 90 and 20 mg kg-1
respectively (De vos et al., 2005).
The critical levels of soil pollution with As, Cr, Co and Ni are 10, 51, 10 and 50 mg kg-1 respectively
(Pais and Benton jones, 2000, Kabata, 2001 and Merian, 1991). In the most parts of study region the soil
concentration of these metals are higher than these critical levels, but the presence of lime in these soils may
reduce the metals solubility, drastically.
Overlaying the maps of As, Cr, Co and Ni concentration distribution and land use, showed that soils
with high concentration of metals don’t follow the agricultural patterns. Also overlaying the interpolation maps of heavy metals concentration and background concentration maps showed that the highest concentration of
these metals was observed in soils, which are deriving from shale and marl, magmatic and metamorphic and
especially limestone bedrocks. Because of non-industrial distribution in study region, it seems that parent
materials are the major factor affecting the high amount of metals in soil. Inácio et al. 2008 and Luo et al. 2007
stated that As concentration in soil is controlled by parent materials. Jiachun et al. 2007 showed that bedrocks
control the As concentration in soil but there is a weak correlation between As in soil and anthropogenic
resources.
Facchinelli et al (2001) and Mico et al. (2006) studied the heavy metals resources in soil and resulted
that Cr, Co and Ni concentration in soil is controlled by bedrocks. Also the researches of Lado et al (2008) and
Luo et al. (2007) resulted that bedrocks control the concentration of Cr and Ni in soil.
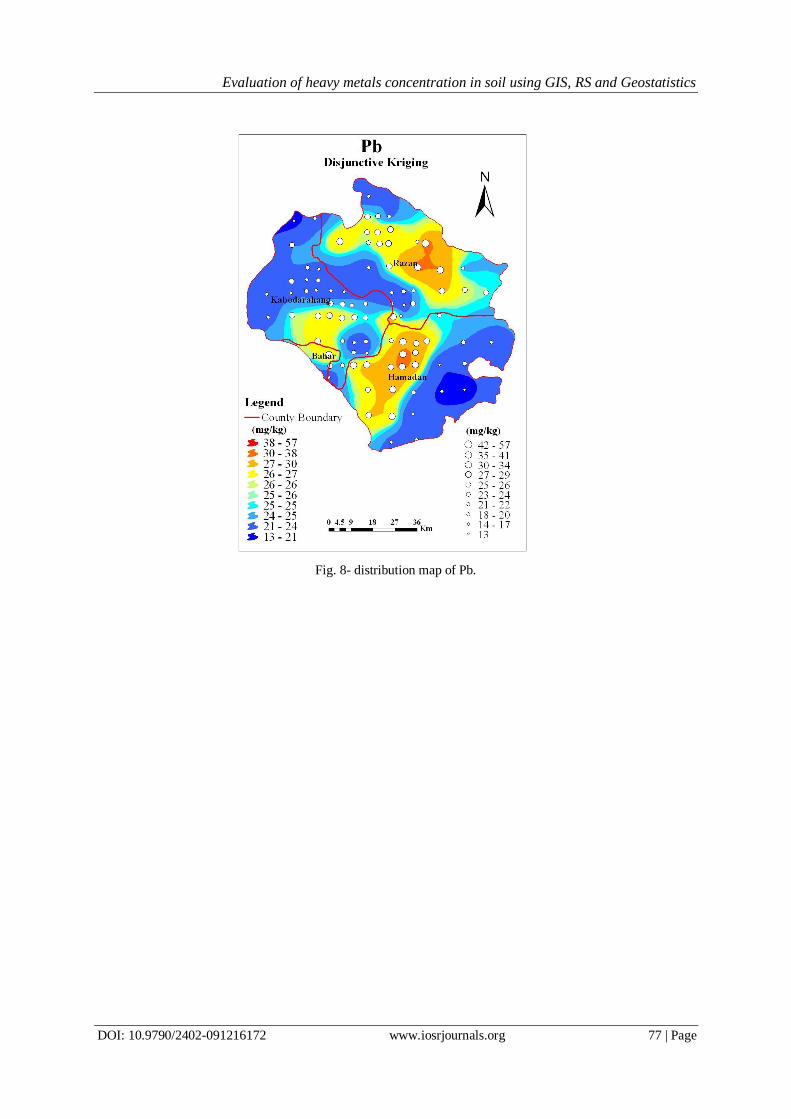
Distribution maps of total Cu, Zn, V, Cd and Pb in superficial soils of study region (Fig. 7 and Fig. 8) indicates that maximum concentration of Cu is 48.9- 57 mg kg-1 that is occurred at west of the study region.
Overlaying the distribution and geology maps show that the maximum concentration of Cu underlay the shale
bedrocks, which naturally is high in Cu content. Estimation of Cu background concentration (table3 and figure
3) upholds this result. This has been reported that the concentration of Cu in metamorphic and shale bedrocks is
about 40 and 50 mg kg-1 respectively (De vos et al., 2005). Evaluating the distribution of total Cd in soil using
radial basic function (Fig. 7) shows that minimum and maximum concentration of Cd in soils of study region is
about 0.1 and 0.33- 0.55 mg kg-1 respectively. Overlaying the maps of Cd concentration distribution and
geology of region shows that the soils with high concentration is in north, west, south and east south underlay
the shale, marl and limestone bedrocks. This rocks naturally rich in Cd amount. The concentration of Cd in shale
and limestone bedrocks can be rich as high as 0.8 and 0.2- 0.27 mg kg-1 respectively (De vos et al., 2005).
Maximum concentration of Zn is about 87- 150 mg kg-1 which is occurred in north, east and south of the region. The parent materials of these parts are shale and metamorphic rocks. The concentration of Zn in limestone, shale
and metamorphic rocks is naturally high (De vos et al., 2005). Figure 7 shows that regions which have 27 mg
kg-1 Pb, occur at east south and north of study region and underlay the sandstone, limestone, magmatic and
metamorphic bedrocks. These regions occupy the 10.8% of the total area of the study region. Natural Pb
concentration in sandstone and shale bedrocks is 10 and 23 mg kg-1 respectively (De vos et al., 2005). The
highest amount of V in soil was 112.8- 150 mg kg-1 which is occurred as a band at west north to east south and
south to north and as a spot at west south of the study site. These bands and hot spot are occurring on the shale,

Evaluation of heavy metals concentration in soil using GIS, RS and Geostatistics
DOI: 10.9790/2402-091216172 www.iosrjournals.org 66 | Page
sandstone, limestone and magmatic bedrocks. Shale and magmatic rocks naturally are rich in V amount (90- 260
and 150- 460 mg kg-1 respectively) (De vos et al., 2005).
The critical levels of total Cu, Zn, V, Cd and Pb in superficial soils are reported to be: 23, 60, 3, 0.76
and (De vos et al, 2005) mg kg-1 respectively (Angelone et al., 2002, Kabata, 2001, Kabata, 2001 and Merian,
1991). According to these levels the most areas of study site is polluted by Cu, Zn, V and Pb. Because of
calcareous nature of these soils, the probability of these metals solubility is low. Overlaying the metals
distribution and landuse maps show that there is high and unmanaged uses of fertilizers in the regions with high amounts of heavy metals (the rates of fertilizers use are: 500- 700 kg ha-1 y-1 urine, 200- 330 kg ha-1 y-1
potassium and 300- 558 kg ha-1 y-1 phosphorus fertilizers). These rates of fertilizing can cause the accumulation
of metals in soil. Overlaying the heavy metals interpolation and background concentration maps (fig. 3) shows
that highest amount of these metals is observed in soils derived from marl, shale, limestone, magmatic and
metamorphic bedrocks. In addition because of non-developed industry in study site, it seems that the main
effective factors on metals concentration in soils, are parent materials and agricultural activities. Facchinelli et
al. (2001), Mico et al. (2006), Luo et al. (2007) and Jiachun et al. (2007) resulted that the amount of Cu and Zn
in soil drastically affected by bedrock. Also Lado et al. 2008 showed that there is a high correlation between Cu,
Cd, Zn and Pb concentration in European soils and lime stone bed rock and agricultural activity.
Mico et al. (2006), Luo et al. (2007) reported that Cd concentration in soil is controlled by human
activities, such as use of phosphate fertilizers. Also Jiachun et al. (2007) studied the spatial distribution of heavy metals in soil and resulted that Cd concentration in soil is affected by natural and anthropogenic factors.
Facchinelli et al. (2001), Mico et al. (2006) and Luo et al. (2007) showed that Zn and Pb concentration
in soil is controlled by human activities.
IV. Conclusion
Heavy metals are non- point pollutants which today because of undesirable effects on human and
environment become the global problem. The most important results of this research are: there is a significant
difference in 95% confidence limit between Co concentration in agriculture and non- agriculture landuses, Pb
concentration in agriculture and urban- industrial, agriculture and non- agriculture landuses, Zn concentration in agriculture and non- agriculture landuses. There is no significant difference among other heavy metals in
different land uses. It seems that agricultural activities in study site affect the concentration of Pb and Zn in
soils, also seems that the effect of urban- industrial activities on Pb concentration in soils is more than the effect
of agriculture landuse. Analyzing the interpolation maps of heavy metals and auxiliary gis layers (geology,
landuse, background concentration of metals maps) shows that geology and agricultural activity are the origin of
Cu, Zn, V, Cd and Pb in soils and Cr, Co, As and Ni derived from bed rocks. Also according to background
concentration maps the main factors are effective on increasing the natural metals concentration in soils of study
region are shale, sandstone, limestone and metamorphic bed rocks and the least back ground concentration of
heavy metals is related to alluvium bedrock.
References [1] Amini, M., Afyuni, M., Khademi, H., 2007. Mass balance modeling of Cd and Pb, in farms of Isfahan.Journal of Science and
Technology of Agriculture and Natural Reasources.10(2),77-89.
[2] Amini, M., 2004. Modeling heavy metal accumulation and assessing its uncertainty in agro- ecosystems of Isfahan region. PhD
thesis. Isfahan University of Technology. Isfahn. Iran.
[3] Angelone, M., Bellanca, A., Sprovieria, M., Neri, R., Salvagio, A., Manta, D., 2002. Heavy metals in urban soils: a case study the
city of Palermo (Sicily), Italy. The since of the Total Environment. 300, 229-243.
[4] Cao, H. F., Chang, A. C., and Page, A. L., 1984. Heavy metal contents of sludge-treated soils as determined by three extraction
procedures. J. Environ. Qual. 13:632–634.
[5] Corwin, D.L., Wagenet, R.J. 1996. Application of GIS to the modeling of nonpoint source pollutants in the vadouse zone: A
conference overview. J .Environ. Qua. 25,403-411.
[6] Corwin, D.L., Loague, K., Ellsworth, T.R., 1999. Advanced information technologies for assessing nonpoint source pollution in the
vaduose zone. J .Environ. Qual .28,357-37.
[7] Demirak, A., Yilmaz, F., Tuna, A.L., Ozdemir, N., 2006. Heavy metals in water, sediment and tissues of Leuciscus cephalus from a
stream in southwestern Turkey. Chemosphere. 63, 1451–1458.
[8] De vos, W., Batista, M.J. Demetriades, A., Duris ,M.J., Lexa, J., Lis, J., Sina, K.,O’ connor, P.J. 2005. Metallogenic Mineral
Provinces and World Class Ore Deposits in Europe. In: Salminen, R. et al. (Eds.), Geochemical Atlas of Europe. Part 1 Background
Information, Methodology and Maps.Geological Survey of Finland.[Online] Availability
[9] Duda, A.M, and Nawar, M. 1996. Implementing the World Bank, s water resources management policy: A priority on toxic
substance from nonpoint sources. Water Sci. Technol. 33,45-51.
[10] Facchinelli, A., Sacchi, E., Mallen, L. 2001. Multivariate statistical and GIS –based approach to identify heavy metal sources in
soils. Environ. Pollut. 114, 313-324.
[11] Fu, J. J., Zhou, Q. F., Liu, J. M., Liu, W., Wang, T., Zhang, Q. H., Jiang, G. B., 2008. High levels of heavy metals in rice (Oryza
sativa L.) from a typical E-waste recycling area in southeast China and its potential risk to human health. Chemosphere. 71, 1269–
1275.
[12] Gurhan Yalcin, M., Battaloglu, R. Ilhan, S. 2007. Heavy metal sources in Sultan Marsh and its neighborhood, Kayseri, Turkey.
Environ Geol. 53, 399–415.

Evaluation of heavy metals concentration in soil using GIS, RS and Geostatistics
DOI: 10.9790/2402-091216172 www.iosrjournals.org 67 | Page
[13] Humenik, F.J., Smolen, M.D., Dressing, S.A. 1987. Pollution from nonpoint- sources: Where we are and where we should go.
Environ. Sci. Technol. 21, 737-742.
[14] Jiachun, Sh., Haizhen, W., Jianming, X., Jianjun, W., Xingmei, L., Haiping, Z., Chunlan, Y. 2007. Spatial distribution of heavy
metals in soils: a case study of Changxing, China. Environ Geol. 52,1–10.
[15] Kabata- Pendias, A., Pendias, H. 2001.Trace Elements in Soil and Plants, Boca Raton London, New York.
[16] Klute, A. 1986. Methods of soil analysis, part I, physical and mineralogical methods. Wisconsin.
[17] Lado, R.L., Tomislav, H., Hannes, I.R. 2008. Heavy metals in European soils: A geostatistical analysis of the FOREGS
Geochemical database. Geoderma. 148, 189–199.
[18] Leuangthong O, McLennan JA, Deutsch CV. 2004. Minimum acceptance criteria for geostatistical realizations. Nat Resour Res
13:131–141.
[19] Luo, W., Wang, T., Lu, Y., Giesy, J.P., Shi, Y., Zheng, Y., Xing, Y., Wu, G. Landscape ecology of the Guanting Reservoir, Beijing,
China: Multivariate and geostatistical analyses of metals in soils. Environ. Pollut. 146, 567_576.
[20] Merian, E. 1991. Metals and Their Compounds in the Environment, Occurrence, Analysis and Biological Relevance. Weinheim.
[21] Mico, C., Recatala, L., Peris, M., Sa´nchez, J. 2006. Assessing heavy metal sources in agricultural soils of an European
Mediterranean area by multivariate analysis. Chemosphere. 65, 863–872.
[22] Pais, I., Benton jones, J. 2000. The handbook of Trace Elements. New York.
[23] Pekey, H. 2006. The distribution and sources of heavy metals in IzmitBay surface sediments affected by a polluted stream. Marine
Pollut. Bulletin. 52, 1197–1208.
[24] Pereira, V., Inácio, M., Pinto, M. 2008. The Soil Geochemical Atlas of Portugal Overview and applications. J. Geochem.
Exploration. 98, 22–33.
[25] Shi, A. B., Liang, L. N., Jiang, G. B., Jin, X. L. 2005. The speciation and bioavailability of mercury in sediments of Haihe River,
China. Environ. International. 31,357–365.
[26] Soil and Water Reserch Institute. 1997. Classification of soils of Hamadan Province. Journal No. 625.
[27] Torabian, A., Mahjouri, M. 2002. Evaluating the effect of irrigation with sewage on uptake of heavy metals by leafy vegetables in
south of Tehran. Iranian J. Soil and Water Sci. 16 (2), 189- 196.
[28] Uyan M, Cay T. 2010. Geostatistical methods for mapping grounwater nitrate concentrations. Paper presented at the 3rd
international conference on cartography and GIS. Nessebar, Bulgaria. 15-20 June 2010.
[29] Walsh, S.J. 1988. Geographic Information Systems: An Instructional Tool for Earth Science Educators. J. Geography. 89, 17-25.
[30] Webster, R., Oliver, M.A. 2000. Geostatistics for environmental scientists. New York.
List of Tables
Table 1- data from satellite image
Table 2- The area of landuse classes (% and ha)
Table 3- back ground concentration of metals in bedrocks of study region (mg kg-1)
Table 4- statistical description of soil physical and chemical properties
Table 5- distribution of heavy metals concentration in soil of study region (Kolmogorov- Smirnov test)
Table 6- Pierson correlation coefficient among heavy metals and soil physical and chemical properties
Table 7- landuses and their area
Table 8- parameters of variograms fitted on study data
Table 1- data from satellite image Sensor date year
AWIFS AWIFS AWIFS
6 March 3 April 27 April
8002
8002
8002 AWIFS 18 july 8002
Table 2- The area of landuse classes (% and ha) Landuse type Area (ha) Area (%)
Potato and corn 27294 3.75 alfalfa 52810 7.3
Wheat and barley 140767 19.34 urban 3175 0.44 water 43 0.005
orchard 4586 0.6 Arid, fallow and pasture 351534 48.3
Salt land 5861 0.8 Mountain and pasture 87444 12.03
Calcareous regions 36276 4.99 plow 17480 2.4 total 727269 100

Evaluation of heavy metals concentration in soil using GIS, RS and Geostatistics
DOI: 10.9790/2402-091216172 www.iosrjournals.org 68 | Page
Table 3- back ground concentration of metals in bedrocks of study region (mg kg-1) bedrock
metal Alluvium Magmatic and
metamorphic rocks limestone sandstone Shale and marl
Co 9/51 85 59 3/52 8/59 Cr 6/23 505 3/506 3/99 9/99 Cu 6/30 8/33 2/36 9/00 9/33 Ni 3/13 6/69 3/38 30 3/35 Pb 11/83 86 3/83 81 51/81 V 3/93 2/585 3/553 3/555 9/550 Zn 8/63 6/26 6/31 28 0/32 Fe 0/3 0/0 02/0 9/3 5/0 Cd 58/0 56/0 83/0 53/0 81/0 As 1/50 6/56 1/51 0/58 0/53
Table 4- statistical description of soil physical and chemical properties Kurtosis skewness CV Std. range median mean Max. Min. *Soil parameters
85/0 052/0 51/80 10/3 9/52 52 65/53 83 5 /2 Co
36/0- 053/0 53/86 35/88 550 22 95/26 500 30 Cr
39/0- 552/0 10/86 55/9 1/03 30 33/30 13 1/53 Cu
81/0 86/0 03/82 62/53 20 63 50/63 550 86 Ni
95/9 21/5 63/85 3/1 00 80 06/80 13 53 Pb
83/0 88/0- 09/80 86/85 550 550 33/503 560 10 V
65/5 61/0 39/88 09/53 551 36 35/36 510 31 Zn
62/30 38/0 51/12 18/2 31/20 53 61/50 21 61/0 As
00/1 96/5 03/10 03/0 01/0 5/0 51/0 55/0 5/0 Cd
88/0 09/0 28/8 88/0 50/5 39/3 32/3 33/2 83/3 pH
30/3 32/5 62/39 15/0 66/8 11/0 60/0 69/8 03/0 OM
* metals concentrations and organic matter are at mg kg-1 and percentage respectively.
Table 5- distribution of heavy metals concentration in soil of study region (Kolmogorov- Smirnov test) As Cd Cr Cu Ni Pb V Zn Co
531 531 531 531 531 531 531 531 531 N
51/8 1/3 32/0 10/0 11/0 52/5 11/5 62/0 90/0 Kolmogorov-Smirnov Z
0 0 16/0 986/0 952/0 58/0 31/0 33/0 333/0 Asymp. Sig. (2-tailed)
Table 6- Pierson correlation coefficient among heavy metals and soil physical and chemical properties
Clay LogOM PH LogCd LogAs Zn LogV Pb Ni Cu Cr Co
1 Co
1 0.798** Cr
1 0.331** 0.347** Cu
1 0.413** 0.907** 0.778** Ni
1 0.318** 0.099 0.367** 0.573** Pb
1 0.590** 0.589** 0.216* 0.686** 0.869** LogV
1 0.790** 0.661** 0.431** 0.233** 0.499** 0.772** Zn
1 -0.146 0.067 -0.005 0.170* 0.106 0.147 0.108 LogAs
1 -
0.197* -
0.312** -
0.522** -
0.260** -
0.243** 0.028 -
0.377** -
0.388** LogCd
1 -0.054 0.058 0.011 0.032 0.000 -0.024 0.023 -0.060 -0.036 PH
1 0.036 -0.084 0.009 -0.033 -0.021 -0.001 0.052 -0.026 0.064 -0.025 LogOM 1 0.198* 0.188* -0.015 0.105 0.047 0.067 0.052 -0.009 -0.086 0.012 0.028 Clay
** p < 0.01 , * p < 0.05 , OM organic matter,

Evaluation of heavy metals concentration in soil using GIS, RS and Geostatistics
DOI: 10.9790/2402-091216172 www.iosrjournals.org 69 | Page
Table 7- landuses and their area
Table 8- parameters of variograms fitted on study data
element Interpolation
method Model )0(C C +C0C Mean MS RMSS MAE MBE
As Ordinary Kriging Spherical 032/0 0/0 032/0 31/0 033/0 583/5 6/0 0036/0-
Zn Disjunctive
Kriging Exponential 88/0 33/0 99/0 52/0 009/0 03/5 3/55 5230/0-
Cu Radial Basis
Function - - - - 062/0 - - 0/3 0066/0-
V Disjunctive
Kriging Exponential 8/0 21/0 39/5 5/0 006/0 96/0 3/53 0012/0-
Ni Ordinary Kriging Exponential 513 33/858 33/369 0053/0 0006/0 532/5 1/58 0051/0- Co Ordinary Kriging Exponential 96/1 31/3 35/53 0005/0 0003/0 059/5 1/8 0029/0-
Pb Disjunctive
Kriging Exponential 06/0 13/0 99/0 053/0 00003/0 599/5 0/3 0508/0-
Cd Radial Basis
Function - - - - 008/0 - - 61/0 008/0-
Cr Ordinary Kriging Exponential 886 333 119 003/0 00088/0 035/5
+C Sill variance0nugget vaiance, C structral variance , C 0C
RMSs root- mean square standardized, MS mean standardized
MAE mean absolute error, MBE mean bayas eroor
List of Figures
Fig. 1- The status of study region
Fig. 2- Geology and landuse maps of study region
Fig. 3- estimation background concentration maps of Cu, Cd, As, Ni, Cr, Co, Zn, V and Pb.
Fig.4. Experimental semivariograms for heavy metals in soil compared with fitted models: Zn,V, Ni, Pb, Cr and Co (Exponential models
Fig.5. Experimental semivariograms for heavy metals in soil compared with fitted models: (As (Spherical
models)
Fig. 6- distribution maps of Cr, Co, Ni and As.
Fig. 7- distribution maps of Cd, Cu, V and Zn.
Fig. 8- distribution map of Pb.
Area (%) Area (ha) Landuse type
0/33 028/808653 agriculture
90/0 0362/6260 Urban and industrial
3/61 5038/025513 Non- agriculture
500 0060/383869 total

Evaluation of heavy metals concentration in soil using GIS, RS and Geostatistics
DOI: 10.9790/2402-091216172 www.iosrjournals.org 70 | Page
Fig. 1- The status of study region

Evaluation of heavy metals concentration in soil using GIS, RS and Geostatistics
DOI: 10.9790/2402-091216172 www.iosrjournals.org 71 | Page
Fig. 2- Geology and land use maps of study region
Evaluation of heavy metals concentration in soil using GIS, RS and Geostatistics
DOI: 10.9790/2402-091216172 www.iosrjournals.org 72 | Page
Fig. 3- estimation background concentration maps of Cu, Cd, As, Ni, Cr, Co, Zn, V and Pb.

Evaluation of heavy metals concentration in soil using GIS, RS and Geostatistics
DOI: 10.9790/2402-091216172 www.iosrjournals.org 73 | Page
Experimental semivariograms for V
Experimental semivariograms for Zn
Experimental semivariograms for Pb
Experimental semivariograms for Ni
Experimental semivariograms for Co
Experimental semivariograms for Cr
Fig.4. Experimental semivariograms for heavy metals in soil compared with fitted models: Zn,V, Ni, Pb, Cr and Co
(Exponential models

Evaluation of heavy metals concentration in soil using GIS, RS and Geostatistics
DOI: 10.9790/2402-091216172 www.iosrjournals.org 74 | Page
Experimental semivariograms for As
Fig.5. Experimental semivariograms for heavy metals in soil compared with fitted models: (As (Spherical models)

Evaluation of heavy metals concentration in soil using GIS, RS and Geostatistics
DOI: 10.9790/2402-091216172 www.iosrjournals.org 75 | Page
Fig. 6- distribution maps of Cr, Co, Ni and As.

Evaluation of heavy metals concentration in soil using GIS, RS and Geostatistics
DOI: 10.9790/2402-091216172 www.iosrjournals.org 76 | Page
Fig. 7- distribution maps of Cd, Cu, V and Zn.
.
Evaluation of heavy metals concentration in soil using GIS, RS and Geostatistics
DOI: 10.9790/2402-091216172 www.iosrjournals.org 77 | Page
Fig. 8- distribution map of Pb.