evaluation of farming systems according to valuation indices developed within a european network on...
TRANSCRIPT

Europ. J. Agronomy 21 (2004) 53–67
Evaluation of farming systems according to valuation indicesdeveloped within a European network on integrated and
ecological arable farming systems
C.A. Helandera,b,∗, K. Delina
a The Rural Economy and Agricultural Society of Skaraborg, Box 124, SE-532 22 Skara, Swedenb Department of Ecology and Crop Production Science, SLU, Box 7043, SE-750 07 Uppsala, Sweden
Received 29 May 2002; received in revised form 11 June 2003; accepted 11 June 2003
Abstract
The aim of this farming systems’ project was to design, lay out, evaluate, improve and disseminate results from two approachesto sustainable farming systems, namely those of “ecological” and “integrated” farming. As a reference, a conventional systemwas used as well. The farming systems were set up and studied at a farm-size scale; the total area for the experiment covered 60 haof arable land, each field being between 2.5 and 4.0 ha. Our main emphasis was on development of farming systems; the designdid not give priority to direct comparisons between different systems. For the evaluation of farming systems, multi-objectiveand dynamic parameters, such as a Soil Cover Index (SCI), Nitrogen Available Reserves (NAR), a Pesticide Index (PI), EnergyEfficiency (EE), Phosphorus Available Reserves (PAR) and Net Surplus (NS) were used. The evaluation of the different farmingsystems showed that the ecological system surpassed the desired level for Net Surplus by a wide margin and also just reachedthe desired level for the Soil Cover Index, but failed to reach the desired level for Energy Efficiency and Nitrogen AvailableReserves. The integrated system reached desired levels for Nitrogen Available Reserves and Energy Efficiency in 3 out of 4years, and on average it reached the desired level for the Soil Cover Index and Net Surplus for the 4 years. The integrated systemdid not on average reach the desired level for the Pesticide Index.© 2003 Elsevier B.V. All rights reserved.
Keywords:Crop rotation; Cropping system; Nitrogen; Organic farming; Phosphorous; Sustainable farming
1. Introduction
The development of more resource efficient and lesspolluting farming systems is of great importance for
∗ Corresponding author. Tel.:+46-511-248-15;fax: +46-511-186-31.
E-mail address:[email protected](C.A. Helander).
the future. Crop production systems in the future, needto combine satisfactory productivity with long-termsustainability and be socially sound (Ohlander et al.,1999). Working with this issue requires a holistic ap-proach since a farming system consists of numerousbiotic and abiotic factors interacting in a web. Whenone factor is changed it may, for example, result inunexpected effects somewhere else in the system. Intraditional agricultural research, focus is often on one
1161-0301/$ – see front matter © 2003 Elsevier B.V. All rights reserved.doi:10.1016/S1161-0301(03)00089-3

54 C.A. Helander, K. Delin / Europ. J. Agronomy 21 (2004) 53–67
or two factors at a time. When the results from suchresearch are implemented, there may be negative con-sequences for some parts of the environment, for pro-duction or for the farmers’ economy. With the aimof developing a more holistic view of farming sys-tems, a project was started in 1992 at the researchfarm Logården in southwest Sweden where three farm-ing systems were set up and studied at a farm-sizescale.
The main objective of the Logården project has beento develop sustainable farming systems that producesatisfactory amounts of high quality food and feedwith a minimum of external inputs, such as fertilisers,pesticides and fossil fuels and at the same time areeconomically sustainable for the farmer. Complemen-tary goals are to minimise the negative effect on thesurrounding environment and to increase the qualityof the rural landscape and nature.
The aim of the farming systems’ project was todesign and lay out, to evaluate, to improve and to dis-seminate the results from two different approaches tosustainable farming systems according to the method-ology we developed within a European network ofresearchers.
Results from the initial years of this project(1993–1995) have been reported byHelander (1997).In this paper, results from 1996 to 1999 are presented.Results from 1992 to 1995 are also included for someparameters not presented previously.
The project was connected to a working groupwithin the International Organization of Biologicaland Integrated Control (IOBC) of Noxious Animalsand Plants (El Titi et al., 1993) and also to a Euro-pean research network in an EU Concerted Action(Vereijken, 1994, 1995, 1996, 1998). This Europeannetwork included the project leaders from other farm-ing system research projects in western Europe, suchas the Nagele-project in The Netherlands (Vereijken,1992), the former Lautenbach-project in Germany (ElTiti, 1990) and the LIFE-project in England (Jordanand Hutcheon, 1994).
From the start of this project, including the plan-ning phase, very close links have been establishedwith farmers, advisors and other people with an inter-est in developing more sustainable farming systems.Each year several meetings are arranged, includingboth field trips and indoor meetings. The recipro-cal discussions have been of great value for the
progress of the project, and have also provided a verycomprehensive means of disseminating the results.
The Logården project is planned to continue during2000–2007 with the second cycle of an 8-year croprotation.
2. Materials and methods
2.1. The research farm
A farming system research project, at a farm-sizescale, was started in 1991 at the Logården researchfarm in southwest Sweden (58◦20′N, 12◦38′E). Thefarm had been used for field experiments for manyyears and is thus fairly well documented (Olvång,1991; Svensson et al., 1994). The total area of the ex-periment covers 60 ha of arable land, each field beingbetween 2.5 and 4.0 ha (Fig. 1). The soil on the farmconsists of fertile, very heavy clay (40–50% clay), withorganic matter contents in the topsoil between 2 and3% of dry matter. The soil structure is rather poor, dueto a high content of silt and to compaction from theuse of heavy machinery and a spring-cereal-dominatedcrop rotation.
The weed flora is small both in terms of numbers ofspecies and overall numbers, withMatricaria inodoraL. and Stellaria mediaL. as the dominant species.The average annual precipitation is about 600 mm. Afield-placed climate station on the research farm pro-vides regular weather information.
2.2. Definitions of farming systems
The main emphasis was, and still is, on develop-ment of an Ecological Arable Farming System (EAFS)or “ecological system” for short, and an IntegratedArable Farming System (IAFS) or “integrated system”for short. In both these systems the methods describedbelow were used to develop persistent, sustainable andproductive systems. The design did not give priorityto immediate comparisons between the different sys-tems.
The ecological system used no chemical fertilis-ers or agrochemicals. The yields were expected to besmaller, 70–80% of conventional farming, and thisneeded to be compensated for through, for instance,higher prices. The ecological system was similar to

C.A. Helander, K. Delin / Europ. J. Agronomy 21 (2004) 53–67 55
Fig. 1. Map of the Logården research farm showing the designof the farming systems studied in the project. The three differentsystems are: Ecological Arable Farming System, Integrated ArableFarming System and Conventional Arable Farming System.
organic farming (Anonymous, 1996; IFOAM BasicStandards, 2000) but in the European Research Net-work we chose the concept ecological as being a widerdefinition including, for instance, nature and landscapevalues, Energy Efficiency and productivity. The tar-get for the ecological prototype is to improve farmingsystems in the long term.
The integrated system emphasised greater efficiencyin the use of inputs and thus the possibility of reduc-ing these. The yields were expected to be somewhatlower (around 5% on average) than in a conventionalsystem, but the economic result for the farmer was notexpected to decrease. The integrated system had twodifferent crop rotations, abbreviated to “integrated-a”and “integrated-b”. The target for the two integratedprototypes is to improve the farming systems in theshort term.
The Conventional Arable Farming System (CAFS)or “conventional system” for short, was used as a ref-erence and reflects a type of farming common in theregion. In the conventional system, a local agriculturaladvisor together with the farm manager did the yearlyplanning and made the decisions in field.
All three farming systems were run by the samefarm manager, who is very interested in the projectand skilled in all three systems.
2.3. Farming methods
The project at Logården follows the methodologyfor farming system research elaborated by the Eu-ropean research network on integrated and Ecologi-cal Arable Farming Systems (Vereijken, 1994, 1995,1996, 1998). The methods used follow a Europeanshortlist (Vereijken, 1994) and are presented inTable 1in the order that they are used.
The three farming systems had different crop rota-tions using the Multifunctional Crop Rotation (MCR)concept (Table 1). The crop rotations used during1996–1999 are presented inTable 2. For the inte-grated systems there are two different crop rotations:integrated-a which is more like the conventionalrotation with only annual crops, and integrated-bwith a 2-year grass and lucerne crop, defined asset-aside in the European agriculture policy, mak-ing this crop rotation more similar to the ecologicalone.
2.4. Parameters for evaluation
For the evaluation of the ecological system andthe integrated systems, we decided to use 11 and12 multi-objective parameters, respectively (Table 3)from the European shortlist (Vereijken, 1994). Allagronomic data recorded are processed by means ofa yearly analysis program to quantify the parametersused for the evaluation.
The parameters are linked to one or more of thefarming methods used for development of the ecolog-ical system and the integrated system. The theoreticalprototypes of the farming methods (Table 1) used toachieve the desired result for each parameter (Table 3)are shown inHelander (1997).
Six of the multi-objective (multi-objective: linkedto more than one of the farming methods) parameters,

56 C.A. Helander, K. Delin / Europ. J. Agronomy 21 (2004) 53–67
Table 1Farming methods used in the Integrated Arable Farming System and Ecological Arable Farming System
Farming method Abbreviation Explanation
Multifunctional Crop Rotation MCR The major method to preserve fertility in biological, physical and chemical terms andto sustain quality production with a minimum of inputs (pesticides, fertilisers, supportenergy and labour)
Integrated/Ecological NutrientManagement
INM/ENM Supports MCR by maintaining agronomically desirable and ecologically acceptablenutrient reserves in the soil and contributes, together with MSC (see below), tomaintaining an appropriate content of soil organic matter
Minimum Soil Cultivation MSC Supports MCR by incorporating crop residues, controlling weeds and restoring physicalsoil fertility, while maintaining sufficient soil cover as a basis for avoiding nutrientlosses, providing shelter for beneficial species and improving landscape/nature values
Ecological InfrastructureManagement
EIM Supports MCR by providing airborne and semi-airborne beneficial species with aplace to over-winter, recover and disperse in spring. In addition, EIM should achievevarious nature and landscape objectives
Integrated Crop Protection ICP Supports MCR and EIM by selectively controlling remaining harmful species withminimal exposure of the environment to pesticides
Farm Structure Optimisation FSO The method to make a farming system economically optimal by determining theminimum amounts of land, labour and capital needed
For a description of the standardised design of these methods, seeVereijken (1994).
indicated with an asterisk (∗) in Table 3, are presentedin the subsequent sections.
2.4.1. Nitrogen Available Reserves (NAR)This was the major parameter for evaluating the
nitrogen management methods in the systems. Thedesired level of mineral-N (ammonium and nitrate-N)in the soil (0–90 cm) is below 30 kg N ha−1 in lateautumn. This was considered to be low enough toreduce N leaching risks to acceptable levels. Lowvalues imply that measures were taken to improvenitrogen utilisation by crops and to reduce the ac-cumulation of mineralised nitrogen in soil duringautumn.
Table 2The Multifunctional Crop Rotations at Logården
Year Conventional Ecological Integrated-a Integrated-b
1 Peas Peas Peas Peas2 Winter wheat Winter wheat Winter wheat (undersown)a Winter wheat3 Oats Set-asideb Oats Set-asidec
4 Winter wheat Winter rape Winter wheat Set-asidec
5 Spring rape Field beans Spring rape Spring rape6 Winter wheat Spring wheat Winter wheat (undersown)a Winter wheat (undersown)a
7 Oats Set-asideb Oats Oats8 Winter wheat Rye Triticale Triticale
The rotation of the ecological system was changed in 1996 and the new rotation used during 1996–1999 is shown in this table.a Undersowing with white clover carried out in early spring in the winter wheat.b Mixture of white clover and ryegrass undersown in early spring in the previous crop.c Mixture of lucerne and perennial ryegrass undersown in early spring in the previous crop.
Samples for analyses of mineral-N in the soil weretaken from two layers, 0–30 and 30–90 cm, in lateNovember or early December. The soil samples werefrozen directly and then stored frozen until they wereanalysed. Before analysis, the samples were groundand homogenised while still frozen. Then 30 g of soilwas extracted with 100 ml 2 M KCl (cf.Bremner andKeeney, 1966) and analysed for ammonium and nitratenitrogen using colorimetric methods on a Techniconautoanalyser II (Bran-Lubbe).
2.4.2. Soil Cover Index (SCI)A high Soil Cover Index was considered to be very
important for reducing the risks of nutrient leach-

C.A. Helander, K. Delin / Europ. J. Agronomy 21 (2004) 53–67 57
Table 3Parameters from the European shortlist used for evaluating the farming systems (Vereijken, 1994)
Parameter and abbreviation Desired results
Organic Matter Annual Balance (OMAB) >1 (ratio between input and output)a
Nitrogen Available Reserves (NAR)∗ <30 (level of soil mineral, N ha−1)b
Phosphorus Available Reserves (PAR)∗ 4–12 (level of soil phosphorus, in P-AL)Phosphorus Annual Balance (PAB) <1 (ratio between input and output)c
Soil Cover Index (SCI)∗ >0.8 (soil cover more than 80% of the year)Soil Respiration (SR) Not defined (no defined measuring method)Soil Structure and Compaction (SSC) Not defined (no defined measuring method)Ecological Infrastructure Indices (EII) >0.05 (more than 5% of the arable area)Pesticide Index (not in EAFS) (PI)∗ <0.5 (less than 50% pesticides used)Net Surplus (NS)∗ >0 (more than 0 euro ha−1)Energy Efficiency (EE)∗ >6 (ratio between output and input)Quality Production Index (QPI) 1 (wheat) (quality and quantity at maximum)d
The calculations of the parameters marked with asterisk (∗) are described in more detail in the text.a Counting only above-ground produced or organic matter transported into the field (input) and organic matter removed from the field
or burned (output).b Nitrogen Available Reserves, i.e. level of soil mineral N in late autumn that is exposed to leaching.c The levels of P are above the desired levels; thus there is a ratio where input is less than output.d QPI = (achieved price kg−1/top-quality price kg−1) × (marketed kg ha−1/field-produced kg ha−1).
ing, erosion and soil compaction. This is essential forbuilding up the organic matter content and for highbiological activity in the topsoil. The desired level forthis parameter in this project was to have crops cov-ering the ground for more than 80% of the year.
The Soil Cover Index was calculated for each sys-tem in each year as a mean value for all crops grown.The ground-cover period was defined as the periodfrom emergence of a sown crop to harvest. If thecrop was undersown, with a catch or cover crop, theground-cover period was extended to the terminationof the undersown crop. To eliminate weather-induceddifferences for crops in different years, each crop wasgiven a fixed SCI based on the average ground-coverperiod for this crop.
2.4.3. Pesticide Index (PI)A Pesticide Index was used as a parameter to eval-
uate the need for pesticide treatments in the integratedsystem compared to the conventional system. The de-sired level for the integrated system was a PI that was50% lower than the corresponding PI for the conven-tional system. No pesticides were used in the ecolog-ical system and therefore this index was not used inthe ecological system.
The Pesticide Index was calculated annually(Törner, 1999; Törner and Drummond, 1999) as theamount used divided by the amount officially recom-
mended by the supplier for each pesticide used (forinstance, two treatments with half the recommendeddosage of pesticides in one crop, counts as PI= 1 forthis crop). All pesticide treatments were calculatedin this way and then summarised as a PI value perhectare for the whole crop rotation in each one of theconventional, integrated-a and integrated-b systems.
2.4.4. Energy Efficiency (EE)One of the main objectives of this project was to re-
duce the use of auxiliary energy from non-renewableresources in agricultural production. Calculating theEnergy Efficiency in agricultural systems correctlyis a very complex operation. In this project, a com-puter model was used to calculate Energy Efficiencywhereby the gross energy content in the harvestedproducts was divided by the total input of auxiliaryenergy (fuels and electricity) to the cropping sys-tem (Törner and Drummond, 1999; Törner, 2001).The total input includes energy used to producemachinery, diesel, electricity, fertilisers, pesticidesand seed. The calculations were based on the actualuse of inputs at Logården research farm for eachyear.
2.4.5. Net Surplus (NS)A sustainable farming system has to be economi-
cally viable. Net Surplus was the parameter used to

58 C.A. Helander, K. Delin / Europ. J. Agronomy 21 (2004) 53–67
evaluate the economic result for each farming system.The desired level was a positive result when all inputswere included in the costs.
Net Surplus was calculated on a crop basis for eachyear as the gross revenues (including current subsi-dies) minus all costs, including payments for all labourhours and for the land used. Calculations were doneas cost accounts for each year separately, with thecurrent year’s prices and other conditions, such asacreage payments. The cost for machinery was calcu-lated from fees charged by contractors for each mea-sure undertaken. The cost for the land used was set to220 euro ha−1 year−1.
2.4.6. Phosphorus Available Reserves (PAR)A sustainable farming system has to maintain ac-
ceptable nutrient reserves in the soil.Phosphorus Available Reserves were defined as
a range of soil P reserves, determined with the ALmethod (Egnér et al., 1960), which were agronomi-cally desirable and environmentally acceptable. Forthe Logården project, the desired level for PAR wasset in the P-AL range of 4.0–2.0 mg P/100 g soil.
2.5. Classifications and surveys
The surveys were carried out each year according toan extensive programme, including chemical, physicaland microbiological soil factors. During the growingseason a regular programme of weed and pest classifi-cations was followed. The aim of these investigationswas to follow changes as the farming systems devel-oped. It is important to note that the initial positionsfor the classifications and surveys were not identicalin the different systems. Due to limitations of space,only some samples of the results from these classifi-cations and surveys are presented below.
2.5.1. Reference areasA reference area was established in each part of
the three farming systems (Fig. 1). This was dividedinto sub-areas (3 m× 3 m) for annual soil sampling.In total there were sub-areas for 10 years of samplingwith two replicates in each reference area. After 10years the sampling can be continued by starting in thefirst sub-areas again, without much risk of disturbancefrom prior samplings.
2.5.2. Chemical soil analysisSoil samples were taken in the reference areas in
December each year from two soil layers: 0–30 cm and30–90 cm. The following analyses were carried outevery year: pH (H2O), P-AL, P-HCl, K-AL, K-HCl,Mg-AL, Ca-AL, Cu-HCl (for the AL and HCl extrac-tion methods, seeEgnér et al., 1960) and organic mat-ter content (loss on ignition). In this paper, results forP-AL, K-AL and Mg-AL in the topsoil are presented.
2.5.3. Weed surveyIn each field weeds were collected from an area
of 0.25 m2 at four randomly selected sites. The weedsurveys were carried out after heading of the cerealcrops in late June or early July. The collected weedswere weighed and counted, and different species iden-tified. Grass weeds were not collected, since they ap-peared very unevenly in the fields. Weeds were notcollected from the set-aside areas. The results werepresented as number of weeds per square metre, weedweight per square metre and dominating species foreach field. In this paper, the average weed weight persquare metre for each year and each farming system ispresented.
2.5.4. Plant diseases and pestsPlant disease and insect pest inventories have been
carried out since 1993. The inventories were doneonce a week during June, July and the first part ofAugust. For diseases in cereals, 50 leaves from atleast 17 plants were assessed in every field. Diseaseswere identified and the number of leaves infected byfungi were counted at the three uppermost leaf levels.The result was expressed as the percentage of leavesinfected. Insect pests were counted and classified on25 plants per field (Gröntoft, 1993). The occurrenceof eyespot (Pseudocercosporella herpotrichoides) inwinter wheat was investigated on 50 plants twice inevery season. The result was presented as an indexdescribed byGustafsson and Waern (1990): index= (percentage of serious infections)+ (percentage ofmoderate infections× 0.5) + (percentage of weakinfections× 0.25). Supplementary samples were alsotaken during the growing season depending on existingdiseases and pests in each specific year. In this paper,the annual results for leaf spot fungi (Stagonosporanodorum, Septoria tritici, Drechslera tritici-repentis)and eyespot in winter wheat are presented.

C.A. Helander, K. Delin / Europ. J. Agronomy 21 (2004) 53–67 59
Table 4Nitrogen Available Reserves as mineral N, kg N ha−1, in the 0–90 cm soil layer after the indicated crop, at start of the leaching period
Year Conventional Ecological Integrated-a Integrated-b
kg N ha−1 Crop kg N ha−1 Crop kg N ha−1 Crop kg N ha−1 Crop
1996 33 Peas 44 Peas 48 Peas 48 Peas1997 27 Winter wheat 17 Winter wheat 27 Winter wheat 27 Winter wheat1998 27 Oats 36 Set-asidea 24 Oats 26 Set-asideb
1999 36 Winter wheat 82 Winter wheat 22 Winter wheat 27 Set-asideb
Mean 31 45 30 32
Samples were taken in the reference areas. Desired level<30 kg N ha−1.a Mixture of white clover and perennial ryegrass.b Mixture of lucerne and perennial ryegrass.
3. Results
3.1. Nitrogen Available Reserves (NAR)
The results from the soil samples analysed for min-eral N content are given inTable 4. The conventionalsystem reached the desired level in 2 out of 4 years,the ecological system in 1 out of 4 and the integratedsystems in 3 out of 4 years. The mean values for the4 years were just above the desired level for the con-ventional and for the two integrated systems. In con-trast, the mean value for the ecological system was farabove the desired level, mostly because of a very highvalue in 1999.
3.2. Soil Cover Index (SCI)
The desired level for SCI was to have crops cov-ering the soil for more than 80% of the year. The
0
0,2
0,4
0,6
0,8
1
1,2
1996 1997 1998 1999
Year
Soil
Cov
er I
ndex
Conventional
Ecological
Integrated-a
Integrated-b
Farming Systems
Fig. 2. Soil Cover Index values in the different farming systems in 1996–1999.
results calculated for 1996–1999 are presented inFig. 2. The average SCI was 0.72, 0.80, 0.80 and0.85 for the conventional, ecological, integrated-a andintegrated-b systems, respectively. The desired levelwas reached for all systems except in 1999 when theconventional, the ecological and the integrated-a sys-tems failed to reach 80% soil cover. The reason fora low SCI in the conventional system was a diver-gence from the planned crop rotation (Table 2), withthree out of four crops sown in the spring of 1999.The somewhat lower SCI for the ecological and theintegrated-a was due to the fact that winter wheat didnot survive the winter and was replaced by springcereals.
3.3. Pesticide Index (PI)
The Pesticide Index reflects the need for pesticidetreatment in the conventional and the integrated sys-

60 C.A. Helander, K. Delin / Europ. J. Agronomy 21 (2004) 53–67
0
0,5
1
1,5
2
2,5
1996 1997 1998 1999
Year
Pest
icid
e In
dex
Conventional
Integrated-a
Integrated-b
Farming Systems
Fig. 3. Pesticide Index values in 1996–1999 as affected by the farming systems.
tems. The appearance of blossom beetle (MeligethesaeneusF.) in some crops, especially spring rape andthe resulting treatments can result in increased pesti-cide inputs in one system compared to another in asingle year. Therefore, PI should only be evaluatedover several years.
The PIs for 1996–1999 are given inFig. 3. ThePesticide Index was calculated annually as the totalapplication per hectare of all pesticides used, di-vided by the officially recommended application foreach pesticide used. As averages for these 4 years,the PI for the conventional, the integrated-a and theintegrated-b systems was 1.41, 1.10 and 0.74, re-spectively. The PI for integrated-a was 78% and forintegrated-b 53% of the level of the conventionalsystem.
0
1
2
3
4
5
6
7
8
1996 1997 1998 1999
Year
Ene
rgy
Eff
ecie
ncy
Conventional
Ecological
Integrated-a
Integrated-b
Farming Systems
Fig. 4. Energy Efficiency values in 1996–1999 as affected by the farming systems.
3.4. Energy Efficiency (EE)
The ecological system had the smallest auxiliaryenergy input. Since the yield level was very low, how-ever, it ended up with the poorest Energy Efficiencyof the systems (Fig. 4). In the integrated system, croprotation-a gave the best value of all systems, but thedifferences between the integrated and the conven-tional systems were rather small. As averages for these4 years, the EEs for the conventional, the ecological,the integrated-a and the integrated-b systems were 5.9,4.3, 6.5 and 5.9, respectively. The integrated systemsreached the target, EE> 6, in 3 out of 4 years, theconventional system in 2 of the years and the eco-logical system failed to reach the target in any of theyears.
C.A. Helander, K. Delin / Europ. J. Agronomy 21 (2004) 53–67 61
-150
-100
-50
0
50
100
150
200
250
1996 1997 1998 1999
Year
NS,
Eur
o/ha Conventional
Ecological
Integrated-a
Integrated-b
Farming Systems
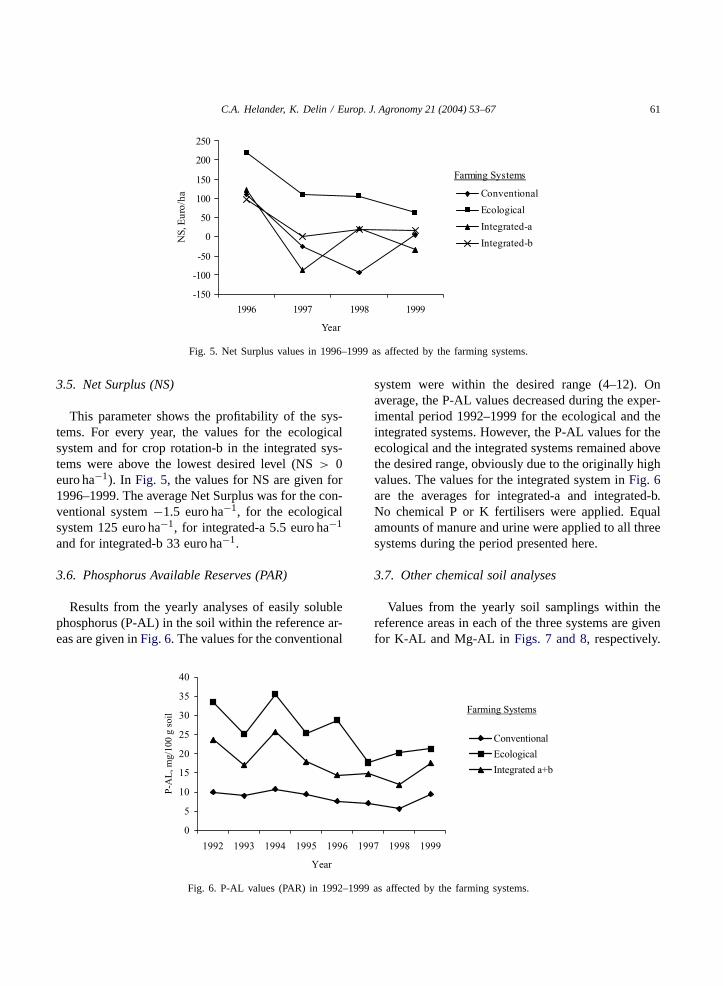
Fig. 5. Net Surplus values in 1996–1999 as affected by the farming systems.
3.5. Net Surplus (NS)
This parameter shows the profitability of the sys-tems. For every year, the values for the ecologicalsystem and for crop rotation-b in the integrated sys-tems were above the lowest desired level (NS> 0euro ha−1). In Fig. 5, the values for NS are given for1996–1999. The average Net Surplus was for the con-ventional system−1.5 euro ha−1, for the ecologicalsystem 125 euro ha−1, for integrated-a 5.5 euro ha−1
and for integrated-b 33 euro ha−1.
3.6. Phosphorus Available Reserves (PAR)
Results from the yearly analyses of easily solublephosphorus (P-AL) in the soil within the reference ar-eas are given inFig. 6. The values for the conventional
0
5
10
15
20
25
30
35
40
1992 1993 1994 1995 1996 1997 1998 1999
Year
P-A
L, m
g/10
0 g
soil
Conventional
Ecological
Integrated a+b
Farming Systems
Fig. 6. P-AL values (PAR) in 1992–1999 as affected by the farming systems.
system were within the desired range (4–12). Onaverage, the P-AL values decreased during the exper-imental period 1992–1999 for the ecological and theintegrated systems. However, the P-AL values for theecological and the integrated systems remained abovethe desired range, obviously due to the originally highvalues. The values for the integrated system inFig. 6are the averages for integrated-a and integrated-b.No chemical P or K fertilisers were applied. Equalamounts of manure and urine were applied to all threesystems during the period presented here.
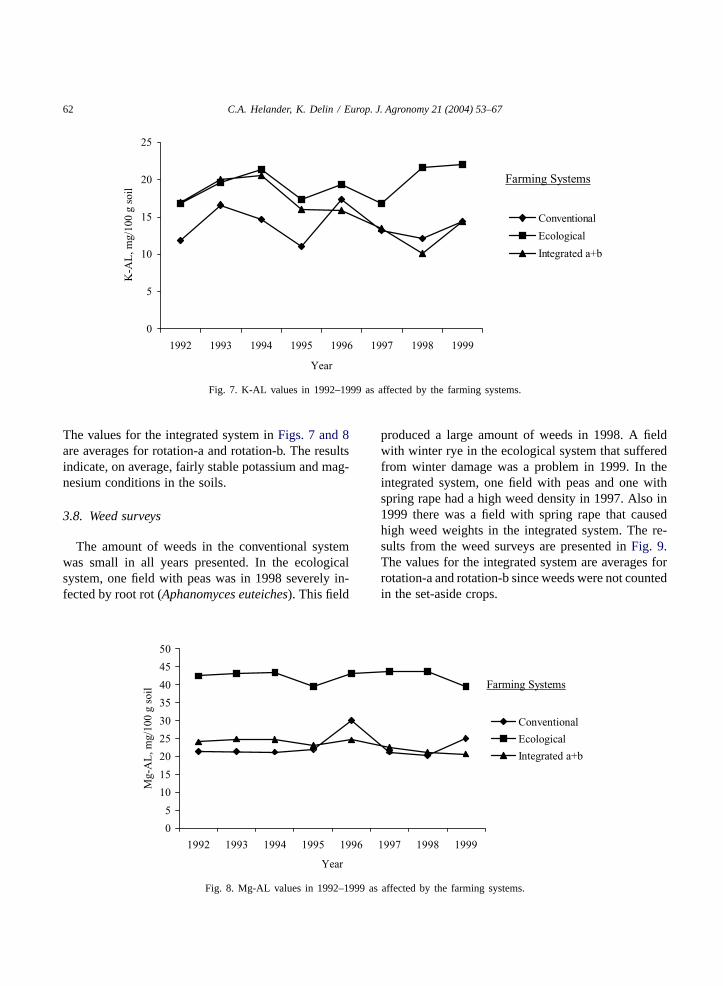
3.7. Other chemical soil analyses
Values from the yearly soil samplings within thereference areas in each of the three systems are givenfor K-AL and Mg-AL in Figs. 7 and 8, respectively.
62 C.A. Helander, K. Delin / Europ. J. Agronomy 21 (2004) 53–67
0
5
10
15
20
25
1992 1993 1994 1995 1996 1997 1998 1999
Year
K-A
L, m
g/10
0 g
soil
Conventional
Ecological
Integrated a+b
Farming Systems
Fig. 7. K-AL values in 1992–1999 as affected by the farming systems.
The values for the integrated system inFigs. 7 and 8are averages for rotation-a and rotation-b. The resultsindicate, on average, fairly stable potassium and mag-nesium conditions in the soils.
3.8. Weed surveys
The amount of weeds in the conventional systemwas small in all years presented. In the ecologicalsystem, one field with peas was in 1998 severely in-fected by root rot (Aphanomyces euteiches). This field
0
5
10
15
20
25
30
35
40
45
50
1992 1993 1994 1995 1996 1997 1998 1999
Year
Mg-
AL
, mg/
100
g so
il
Conventional
Ecological
Integrated a+b
Farming Systems
Fig. 8. Mg-AL values in 1992–1999 as affected by the farming systems.
produced a large amount of weeds in 1998. A fieldwith winter rye in the ecological system that sufferedfrom winter damage was a problem in 1999. In theintegrated system, one field with peas and one withspring rape had a high weed density in 1997. Also in1999 there was a field with spring rape that causedhigh weed weights in the integrated system. The re-sults from the weed surveys are presented inFig. 9.The values for the integrated system are averages forrotation-a and rotation-b since weeds were not countedin the set-aside crops.

C.A. Helander, K. Delin / Europ. J. Agronomy 21 (2004) 53–67 63
0
50
100
150
200
1995 1996 1997 1998 1999
Year
g/m
2 Conventional
Ecological
Integrated a+b
Farming Systems
Fig. 9. Mean weed weight per square metre in 1995–1999 as affected by the farming systems.
3.9. Diseases
The occurrence of leaf spot fungi and eyespot inwinter wheat is presented inTables 5 and 6, respec-tively, as interesting examples (fungi in winter wheatare among the most discussed diseases in this area ofSweden) from the comprehensive programme of plantdisease and pest inventories that were carried out ev-ery week during the summer months. The values forthe integrated system inTables 5 and 6are the aver-ages for integrated-a and integrated-b.
Table 5Leaf spot fungi in winter wheat
Year Conventional Ecological Integrated
DC45
DC71
DC45
DC71
DC45
DC71
1993 38 22 321994 4 24a 2 4 3 51995 13 95a 29 95 24 931996 32 86a 13 88 11 871997 17 43 2 24 14 621998 4 33a 6 71 7 48a
1999 20 60b 15 85 10 50a
Mean(1993–1999)
15 54 11 56 12 54
Percentage of the leaf area of the three uppermost leaves infectedin relation to the development stage, DC (Zadoks et al., 1974) ofthe crops and farming systems.
a Leaf spot fungi treated once with fungicide.b Leaf spot fungi treated twice with fungicides.
Table 6Eyespot in winter wheat
Year Conventional Ecological Integrated
1993 7.0 3.0 3.81994 2.0 3.5 3.01995 1.0 0.8 2.01996 3.5 9.0 2.01997 15.0 18.0 10.01998 20.0 6.0 8.01999 5.0 4.0 8.0
Mean (1993–1999) 7.6 6.3 5.2
Summer index: index= (percentage of serious infections)+ (percentage of moderate infections× 0.5) + (percentage ofweak infections× 0.25).
4. Discussion
4.1. Parameters for evaluation
One very essential function of indices for evalua-tion of farming systems is that they react quickly topossible changes in the systems. Phosphorus AvailableReserves did not fulfil this criterion since phosphorusanalysed in soil is a slow-reacting factor. This indexis more useful for long-term evaluation of the sustain-ability of farming systems. A more dynamic evalu-ation of phosphorus use within a farming system ispossible if PAR is supplemented with the other phos-phorus index (Table 3), Phosphorus Annual Balance,defined as the ratio between input and output of P.The other indices used (Nitrogen Available Reserves,

64 C.A. Helander, K. Delin / Europ. J. Agronomy 21 (2004) 53–67
Pesticide Index, Energy Efficiency and Net Surplus)fulfilled the requirement of a quickly reacting indexbetter, and proved valuable for evaluating the farm-ing systems presented here. A further development ofthese indices is definitely possible and valuable. Thesame applies to the evaluation of Energy Efficiencyindicated above. The development of indices (director indirect measuring methods) for evaluation of SoilStructure and Compaction (SSC) and for soil micro-bial activity, Soil Respiration (SR) (seeTable 3) wouldbe the most useful indices for further development ofthe farming systems on the project site, and possiblyin many other situations.
4.2. Nitrogen Available Reserves (NAR)
The mean value for the ecological system was farabove the desired level mainly due to a very highvalue in 1999. This value was derived from samplestaken after winter wheat with a very poor yield. Theplanned winter oilseed rape crop failed and a winterwheat crop was established late in September instead,but the wheat crop suffered during the winter, whichresulted in a small yield. Another reason for a highlevel of mineral N in 1999 could also have been aneffect of the manure that was applied before sowingthe winter rape in 1998 together with urine spread inJune 1999. A third reason could have been an effectof the green-manure crop (set-aside) in 1998.
It is likely that the combination of a large proportionof nitrogen-fixing crops (four out of eight crops) andthe need for tillage to control perennial weeds madeit difficult to reach the target every year in the ecolog-ical system. As an attempt to improve the situation,catch crops will be introduced in the ecological croprotation. This will also improve the Soil Cover Index(see below).
Integrated-b also had a large proportion ofnitrogen-fixing crops (three out of eight crops) butwith the difference that a reduced tillage regime (noploughing) was used. This might be at least one rea-son for the much lower levels of mineral-N and alsofor the smaller variations between years.
4.3. Soil Cover Index (SCI)
The Soil Cover Index is to a great extent governedby the crop rotation used. The crop rotation in the eco-
logical system was altered in 1996, which improvedthe SCI. Set-aside (a green-manure crop) replacedvetch and winter rape replaced spring oats.
Water logging has periodically been a seriousproblem in this project causing, for instance poorestablishment of crops, out-wintering of winter cropsand, probably, losses of nitrogen due to denitrifi-cation. Data from the field-placed climate stationshowed extraordinarily high figures for total precipi-tation in 1997–1999. The rainfall in June was above100 mm in all these 3 years, causing water to remainon the ground for quite long periods. To reduce theseproblems a complete subsoil drainage replacement isurgently needed.
4.4. Pesticide Index (PI)
The overall use of pesticides was low in all systemsduring these years with PI= 1.94 in 1998 for theconventional system as the highest index. Integrated-adid not in any of the 4 years reach the desired levelof 0.5 compared to the conventional system whileintegrated-b gave values below 0.5 for 3 out of 4 years.The main reason for lower PI values in integrated-bwas the difference in crop rotation; it had 2 years ofset-aside.
The reduced tillage regime used in the integratedsystems caused more problems with perennial grassweeds than the conventional and ecological systems,which were ploughed most years. The problems withperennial grass weeds will probably decrease withbetter drainage since poor crops compete badly withweeds. A reduced need for grass-weed herbicides willpossibly reduce the PI for integrated-a.
The Pesticide Index, in the way it was used in thisproject, does not give any indications of possible dif-ferences between pesticides used, e.g. environmentalrisks and toxicity. A more relevant use of the PI would,perhaps, be to make a comparison of each single farm-ing system with a national or European average PIvalue. We found in this project that comparing the in-tegrated systems with the conventional one meant thatthe PI depended on reductions of pesticide use in theconventional system.
4.5. Energy Efficiency (EE)
One of the main goals of this project was to reducethe inputs of non-renewable resources in agricultural

C.A. Helander, K. Delin / Europ. J. Agronomy 21 (2004) 53–67 65
production. The two dominant inputs of energy in con-ventional agricultural systems are nitrogen fertiliserand diesel fuel. In the ecological system, nitrogen fer-tiliser was not used, but a fairly large amount of fuelwas used. Since the yields were quite poor, giving alow energy output, Energy Efficiency did not reachthe desired level in any of the 4 years. The yields inthe ecological system were smaller than expected. Forinstance, the average yield of winter wheat in the eco-logical system (3550 kg ha−1) was only around 50%of the corresponding yields in the conventional systemduring the period 1996–1999. Less intensive soil cul-tivation methods in combination with improved cropyields might be the most feasible ways of improvingEE in the ecological system. For instance, ploughingcould be replaced by reduced tillage when peas arefollowed by winter wheat, which might improve thenitrogen preservation in the long term as well as re-ducing energy input.
For better Energy Efficiency in the integrated sys-tems, better yields would probably be the most feasibleimprovement. The yields in the integrated system werelower than expected. For instance, the average yield ofwinter wheat in the integrated systems (6410 kg ha−1)was only 90% of the corresponding yields in the con-ventional system during the period 1996–1999. Forlarger yields better drainage is essential, both in theintegrated and in the ecological systems. This wouldlead to a better and more even establishment of cropsas well as a more efficient use of available nitrogen. Itwould probably reduce the need for nitrogen fertiliserinput and thus improve EE in the integrated system.
Suitable methods for calculating fuel Energy Effi-ciency in agriculture are still under discussion sinceconventional energy analyses, such as this one, treatenergy as a consumable (Jansén, 2000). According tothe law of thermodynamics energy is indestructible; itcontinually loses quality through transformation andstorage to finally end up as low quality heat. To evalu-ate Energy Efficiency, as well as other parameters forsustainability of production systems, such as a greatervariation of wild life species, more accurate methodsare needed. A separate project has started, in whichwe will use the environmental systems analysis toolEmergy (spelled with an m) analysis (Odum, 1996;Brown and Ulgiati, 1997) and assess Ecosystem ser-vices (Costanza et al., 1997; Björklund et al., 1999),in order to address resource efficiency, environmen-
tal impact and ecological sustainability of farm levelsystems based on data from Logården.
4.6. Net Surplus (NS)
The desired level was a positive result when all in-puts were included in the costs. All the suggested im-provements given above should have a positive effecton the Net Surplus.
For every year the values for the ecological and theintegrated-b systems were above the lowest desiredlevel (NS > 0 euro ha−1). However, the ecologicalsystem showed the most satisfactory results for this pa-rameter. The positive results for the ecological systemat Logården have been an argument for agriculturaladvisors to recommend that farmers change over toorganic farming, and for farmers to try organic farm-ing. It is important to note that the Net Surplus for theecological system includes an EU-subsidised acreagepayment for organic farming. Moreover, higher mar-ket prices were obtained for the products.
When comparing the results for Energy Efficiency(Fig. 4) with Net Surplus (Fig. 5) the results for theecological system show an opposite pattern: the eco-logical system had the lowest Energy Efficiency inall years, but in contrast, the highest Net Surplus.The high Net Surplus was partly an effect of the EUCommon Agricultural Policy (CAP) deliberately sup-porting an increase in organic farming. Consideringthat productivity is one of the project objectives whendeveloping sustainable farming systems, yields havebeen far from satisfactory in the ecological system.
4.7. Phosphorus Available Reserves (PAR)
The initial positions of P-AL differed considerablybetween the systems at the start (1992). The initiallyhigher P-AL values for the ecological and integratedsystems have tended to decrease more rapidly overtime than those of the conventional. This does not nec-essarily indicate losses from the soil; it is more likelythe result of equilibrium reactions with a transitionfrom easily soluble reserves to more stable reserves,as observed in long-term P experiments in Sweden(Mattsson, 1998). There was no difference in inputsof P between the systems, and the outputs of P in theform of crop yields were smaller for the ecological andthe integrated systems than for the conventional one.

66 C.A. Helander, K. Delin / Europ. J. Agronomy 21 (2004) 53–67
4.8. Other chemical soil analyses
As expected, the results indicated fairly stable potas-sium and magnesium conditions in the soils. Theseanalyses can be seen as examples of indicators con-cerning the real long-term effects of different farmingsystems.
4.9. Weed surveys and diseases inventories
Weeds and diseases were generally a fairly smallproblem in all three systems. As clearly indicated inFig. 9, problems with weeds occurred when the crop,for whatever reason, failed to develop satisfactory. Theexperience gained from this project, as shown in manyother situations (cf.Håkansson, 1975, 1991), was thata good crop is the most important factor for reducingproblems with weeds. The use of mechanical weedcontrol also proved to be successful even though itdepended on good weather conditions to be efficient.
In the ecological system (and to some extent also inthe integrated systems) the low level of available soilnitrogen near the soil surface and in the upper part ofthe soil profile most likely decreased the potential ofweeds, plant diseases and pests to develop. The twoplant disease inventories in winter wheat presentedhere, leaf spot (Table 5) and eyespot (Table 6), indicatethat the variation between years far overshadows anypossible difference between the systems.
5. Conclusions
The indices/parameters presented here (Table 3) forevaluation of farming systems in progress have provedto be quite successful, but with different functionsfor the different indices. The Soil Cover Index, andthe ecological infrastructure index (EII), seeHelander(1997)andTable 3, are to a large extent governed bythe crop rotation used, and the physical layout of thearable land. Therefore, these indices are useful whenlaying out a farming system project, or as an index forevaluating practical farming situations.
The conclusion from the evaluation of the differentfarming systems is that the ecological system (EAFS)reached the desired level for Net Surplus by a widemargin and also just reached the desired level forthe Soil Cover Index. The ecological system failed
to reach the desired level for Energy Efficiency andNitrogen Available Reserves. Better values for theseparameters would improve the sustainability of theecological system and suggestions for improvementshave been given inSection 4.
For the integrated system (IAFS) the conclusion isthat it achieved desired levels for Nitrogen AvailableReserves and Energy Efficiency in 3 out of 3 years,and on average reached the desired level for the SoilCover Index and Net Surplus for these 4 years. Theintegrated system did not on average reach the desiredlevel for the Pesticide Index. Further improvementsof the integrated system according to the parameters,such as more efficient soil cultivation and weed con-trol, would be appropriate and have been discussed inthis paper.
Acknowledgements
The Swedish Board of Agriculture, the VL-foundation, and the Rural Economy and AgriculturalSociety of Skaraborg have financed this arable farm-ing system research project. Since the start, the projecthas received scientific support from a reference groupmade up of the following people from SLU: Ker-stin Berglund (soil structure and water management),Josef Dlouhy (organic farming), Håkan Fogelfors(weed research), Inge Håkansson (soil management),Anders Jonsson (microbiology), Börje Lindén (plantnutrition), Christer Nilsson (plant protection), GöranNilsson (crop rotations and composts), Lars Ohlander(cropping systems), Jan Persson (plant nutrition),Thomas Rydberg (soil management), Bo Stenberg(soil microbiology), Lennart Torstensson (soil micro-biology) and Maria Wivstad (organic farming).
References
Anonymous, 1996. Arable and Horticulture Organic Production.Skogs-och Jordbrukets Forskningsråd, Stockholm (in Swedish).
Björklund, J., Limburg, K.E., Rydberg, T., 1999. Impact ofproduction intensity on the ability of the agricultural landscapeto generate ecosystem services: an example from Sweden. Ecol.Econ. 29, 269–291.
Bremner, J.M., Keeney, D.R., 1966. Determination and isotope-ratio analysis of different forms of nitrogen in soils. Part 3.

C.A. Helander, K. Delin / Europ. J. Agronomy 21 (2004) 53–67 67
Exchangeable ammonium, nitrate, and nitrite by extraction–distillation methods. Soil Sci. Soc. Am. Proc. 30, 577–582.
Brown, H.T., Ulgiati, S., 1997. Emergy-based indices and ratios toevaluate sustainability: monitoring economies and technologytoward environmentally sound innovation. Ecol. Eng. 9, 51–69.
Costanza, R., d’Arge, R., de Groot, R., Farber, S., Grasso, M.,Hannon, B., Limburg, K., Naeem, S., O’Neill, R.V., Paruelo,J., Raskin, R.G., Sutton, P., van den Belt, M., 1997. The valueof the world’s ecosystem services and natural capital. Nature387 (15), 253–260.
Egnér, H., Riehm, H., Domingo, W.R., 1960. Investigation of thechemical soil analyses used as basic data for the estimation ofplant nutrition status in the soil. Kungl. Lantbrukshögsk. Ann.26, 199–215 (in German).
El Titi, A., 1990. Farming System Research at Lautenbach,Germany. Schweizerische Lantwirtschaftliche Forschung29 (4), 237–247 (in German).
El Titi, A., Boller, E.F., Gendrier, J.P., 1993. Integrated produc-tion, principles and technical guidelines. IOBC/WPRS Bull.OILB/SROP 16 (1), 97.
Gröntoft, M., 1993. An information-management system for pestwarning in field crops in Sweden. Bull. OEPP/EPPO 23,627–637.
Gustafsson, G., Waern, P., 1990. Eyespot (Pseudocercosporellaherpotrichoides) 1989—experience from pest-attacks indifferent areas. In: Proceedings of the 31st Swedish CropProtection Conference on Pests and Diseases. SLU, Uppsala(in Swedish).
Helander, C.A., 1997. The Logården project: development of anecological and an integrated arable farming system. In: vanIttersum, M.K., an de Geijn, S.C. (Eds.), Proceedings of the4th ESA Congress. Elsevier, Amsterdam.
Håkansson, S., 1975. The influence of seed rates and the horizontaldistribution of the seed on development and productionin short-season plant stands. Reports and Dissertations, 33.Department of Plant Husbandry, Agricultural College ofSweden, Uppsala, 192 pp. (in Swedish).
Håkansson, S., 1991. Growth and Competition in Plant Stands.Crop Production Science, 12. Department of Crop ProductionScience, Swedish University of Agricultural Science, Uppsala.
IFOAM Basic Standards, 2000. The Principle Aims of OrganicProduction and Processing. IFOAM International Federationof Organic Agriculture Movements.
Jansén, J., 2000. Agriculture, Energy and Sustainability. DoctoralThesis. Agraria 253. Acta Universitatis Agriculturae Sueciae.SLU, Uppsala.
Jordan, V.W.L., Hutcheon, J.A., 1994. Economic viability ofless-intensive farming systems designed to meet current andfuture policy requirements: 5 year summary of the LIFEproject. Asp. Appl. Biol. 40, 61–68.
Mattsson, L., 1998. P in Swedish long-term soil fertilityexperiments. Kungl. Skogs-och lantbruksakademiens tidskrift135 (7), 69–76.
Odum, H.T., 1996. Environmental Accounting. Emergy andEnvironmental Decision Making. Wiley, New York.
Ohlander, L., Lagerberg, C., Gertsson, U., 1999. Visions forecologically sound agricultural systems. J. Sustainable Agric.14 (1), 73–79.
Olvång, H., 1991. ELISA, a method to forecast eyespot in wintercereals—results from ongoing investigations. In: Proceedingsof the 32nd Swedish Crop Protection Conference on Pests andDiseases. SLU, Uppsala (in Swedish).
Svensson, H., Stadig, H., Wallgren, B., Ohlander, L., 1994.Previous Crops to Pea Crop. Växtodling, 50. Institute förVäxtodlingslära, SLU, Uppsala (in Swedish).
Törner, L., 1999. Energy-Balances in Organic and IntegratedArable Farming. Odling i Balans. Vallåkra (in Swedish).
Törner, L., 2001. Interpretation of Environmental Key Indicators.Odling i Balans. Vallåkra (in Swedish, with summary inEnglish).
Törner, L., Drummond, C., 1999. Integrated crop management:On-farm experience in Sweden and the UK. Paper presentedto the International Fertiliser Society at a Conference inCambridge. Proceedings No. 443.
Vereijken, P., 1992. A methodic way to more sustainable farmingsystems. Neth. J. Agric. Sci. 40, 209–223.
Vereijken, P., 1994. Designing Prototypes. Progress Report ofResearch Network on Integrated and Ecological ArableFarming Systems for EU and Associated Countries. AB-DLO,Wageningen, 87 pp.
Vereijken, P., 1995. Designing and Testing Prototypes. ProgressReport of Research Network on Integrated and EcologicalArable Farming Systems for EU and Associated Countries.AB-DLO, Wageningen, 90 pp.
Vereijken, P., 1996. Testing and Improving Prototypes. ProgressReport of Research Network on Integrated and EcologicalArable Farming Systems for EU and Associated Countries.AB-DLO, Wageningen, 69 pp.
Vereijken, P., 1998. Improving and Dissemination Prototypes.Progress Report of Research Network on Integrated andEcological Arable Farming Systems for EU and AssociatedCountries. AB-DLO, Wageningen, 55 pp.
Zadoks, J.C., Chang, T.T., Konzak, C.F., 1974. A decimal codefor the growth stages of cereals. Weed Res. 14, 415–421.