evaluation of different measures of functional ... · evaluation of different measures of...
TRANSCRIPT

www.elsevier.com/locate/ynimg
NeuroImage 21 (2004) 659–673
Evaluation of different measures of functional connectivity using a
neural mass model
Olivier David,a,* Diego Cosmelli,b and Karl J. Fristona
aFunctional Imaging Laboratory, Wellcome Department of Imaging Neuroscience, London WC1N 3BG, UKbCNRS UPR 640 Neurosciences Cognitives et Imagerie Cerebrale, Hopital de la Salpetriere, 75651 Paris Cedex 13, France
Received 19 June 2003; revised 2 October 2003; accepted 8 October 2003
We use a neural mass model to address some important issues in
characterising functional integration among remote cortical areas
using magnetoencephalography or electroencephalography (MEG or
EEG). In a previous paper [Neuroimage (in press)], we showed how the
coupling among cortical areas can modulate the MEG or EEG
spectrum and synchronise oscillatory dynamics. In this work, we
exploit the model further by evaluating different measures of statistical
dependencies (i.e., functional connectivity) among MEG or EEG
signals that are mediated by neuronal coupling. We have examined
linear and nonlinear methods, including phase synchronisation. Our
results show that each method can detect coupling but with different
sensitivity profiles that depended on (i) the frequency specificity of the
interaction (broad vs. narrow band) and (ii) the nature of the coupling
(linear vs. nonlinear).
Our analyses suggest that methods based on the concept of
generalised synchronisation are the most sensitive when interactions
encompass different frequencies (broadband analyses). In the context
of narrow-band analyses, mutual information was found to be the most
sensitive way to disclose frequency-specific couplings. Measures based
on generalised synchronisation and phase synchronisation are the most
sensitive to nonlinear coupling. These different sensitivity profiles mean
that the choice of coupling measures can have dramatic effects on the
cortical networks identified. We illustrate this using a single-subject
MEG study of binocular rivalry and highlight the greater recovery of
statistical dependencies among cortical areas in the beta band when
mutual information is used.
D 2003 Elsevier Inc. All rights reserved.
Keywords: Neural mass model; Synchronisation; Functional connectivity
Introduction
The complicated nature of brain connectivity, composed of
local networks interconnected by long range pathways, is well
known and is the principal determinant of its functional organisa-
1053-8119/$ - see front matter D 2003 Elsevier Inc. All rights reserved.
doi:10.1016/j.neuroimage.2003.10.006
* Corresponding author. Functional Imaging Laboratory, Wellcome
Department of Imaging Neuroscience, 12 Queen Square, London WC1N
3BG, UK. Fax: +44-207-813-1420.
E-mail address: [email protected] (O. David).
Available online on ScienceDirect (www.sciencedirect.com.)
tion (Abeles, 1991; Sporns et al., 2000). The ensuing architecture
means that the brain can be understood as a dynamical system,
comprising a huge number of state variables generating many
distinct and metastable states. This metastability endows the
brain with a characteristic lability, that is, sensitivity to change,
which arises from a capacity to self-organise through modulat-
ing its internal structure (Friston, 2000). This modulation is
context dependent, occurs over different time scales and can be
transient (e.g., changes of connectivity due to attention modu-
lation) or enduring (e.g., somatotopic reorganisation due to limb
amputation).
Integration or functional connectivity is usually inferred by
statistical dependencies among signals in coupled neuronal sys-
tems. It is possible to analyse these dependencies using noninva-
sive macroscopic measures such as magnetoencephalography
(MEG) (Hamalainen et al., 1993) and electroencephalography
(EEG) (Nunez, 1981). However, the variability of MEG or EEG
signals and our incomplete understanding of the neuronal process-
es generating them make their analysis particularly difficult. Indeed
characterising dynamic patterns is tricky due to the intrinsic
complexity and nonlinearity of the underlying neuronal processes
(Abarbanel and Rabinovich, 2001).
There is an uncertain consensus about the best method to
characterise neuronal couplings with MEG or EEG. Interactions
can be synchronous or asynchronous, linear or nonlinear and so
forth, engendering many different types of synchronisation, that is,
a common behaviour of at least one property of MEG or EEG
generators (Boccaletti et al., 2002; Pikovsky et al., 2001). This may
be why different dependency measures appear in the MEG or EEG
literature: these include linear (cross-correlation, coherence; Clif-
ford Carter, 1987) or nonlinear (mutual information; Roulston,
1999), nonlinear correlation (Pijn et al., 1992), mutual dimension
(Buzuk et al., 1994), nonlinear interdependencies or generalised
synchronisation (Arnhold et al., 1999; Schiff et al., 1996; Stam and
van Dijk, 2002; Stam et al., 2003), neural complexity (Tononi et
al., 1994)) or are based upon the quantification of phase locking of
oscillations (phase synchronisation; Lachaux et al., 1999; Tass et
al., 1998). This battery of measures has been assembled during the
last decade, making research in this area exciting but quite
confusing. Recently, an attempt has been made to evaluate the
performance of some of these measures in a case study of EEG
signals (Quian Quiroga et al., 2002). The authors conclude that,

O. David et al. / NeuroImage 21 (2004) 659–673660
with the exception of mutual information, all these measures give
qualitatively equivalent results, with nonlinear measures being
more sensitive.
The aim of this paper was to compare a set of commonly
employed measures to assess their relative efficacy for detecting
neuronal coupling. Our strategy was to use simulated neuronal
processes in which we could manipulate the coupling between two
cortical areas. Using surrogate or null data, we determined the null
distribution of each measure to enable its sensitivity to be
evaluated. This represents an assessment in terms of each meas-
ure’s ability to detect statistical dependencies among remote
neurophysiological indices. These dependencies define, operation-
ally, ‘‘functional connectivity’’. In this paper, we focus on mea-
suring functional connectivity in continuous neuronal time series.
Note that this does not constitute an analysis of ‘‘effective
connectivity’’ (the influence one neuronal system exerts over
another): We are not interested, here, in the mechanism of the
coupling or indeed how the dependencies are expressed (e.g.,
linear vs. nonlinear). We simply want to establish whether depen-
dencies exist and find their most sensitive measure. In a later
paper, we will deal with similar issues in the context of transient
responses and induced oscillations.
The measures considered in this work were linear (cross-
correlation function or first-order cumulant) and nonlinear. The
nonlinear measures represented static (mutual information) and
dynamic measures. The latter were phase synchronisation and one
based on the concept of generalised synchronisation. We antici-
pated that measures encompassing nonlinear and dynamic depen-
dencies would supervene over linear and static metrics, given the
way neuronal interactions are mediated. However, each estimator
has its own bias and variance that may be important when dealing
with finite time series.
In this paper, we use a model of MEG or EEG signals in which
we changed the coupling strength between two cortical areas. This
allowed us to assess the sensitivity of various interaction measures
using oscillatory signals that simulate normal, ongoing MEG or
EEG activity. The principal characteristics of the model have been
presented in a companion paper (David and Friston, in press) and
are described only briefly here. Our model is a generalisation, to
multiple neuronal populations, of the Jansen model (Jansen and
Rit, 1995) operating in its oscillatory regime. The Jansen model
was based on previous work in the 1970s (Freeman, 1978; Lopes
da Silva et al., 1974) modelling EEG and visual-evoked potentials.
Recently, it has been modified to generate epileptic activity
(Wendling et al., 2000). A specific characteristic of our model is
that it exhibits oscillatory behaviours that are driven by stochastic
noise. Our model generates more complicated activity than the
Jansen model because different neuronal populations are endowed
with different kinetics. Our generalised model was designed to
assess the consequences of coupling changes in the context of
oscillatory dynamics. This complements the modelling initiative in
(Wendling et al., 2001) for epileptic activity.
Modelled cortical areas are composed of interacting inhibitory
and excitatory populations with slow and fast kinetics. Two
operations are used to integrate the model: a spike density-to-
membrane potential conversion, which depends linearly upon
neuronal kinetics; and the inverse conversion, which is considered
instantaneous and nonlinear (a sigmoid function). Different areas
are coupled by excitatory connections whose strength is set by a
coupling parameter. We have shown, qualitatively, that coupling
areas results in a phase locking of their activities. The purpose of
using this model here is to demonstrate that the sensitivity profile
of each measure differs and that a complete description of
interactions calls for the use of several approaches.
In the first section, we introduce the different measures of
interdependencies among MEG or EEG signals that are considered
in subsequent sections. Then we use our neural mass model to
evaluate their sensitivity to coupling in the context of nonlinear
interactions. Finally, we show how findings obtained from simu-
lations translate using real MEG data from a binocular rivalry
study.
Dependency measures
Consider two discrete univariate time series xn and yn, n = 1,. . .,N measured simultaneously. A dependency measure quantifies
relationships between these time series, induced by interactions
at the level of the generating processes. Each dependency measure
has particular characteristics and we divide them into three groups:
linear, nonlinear and phase related. The linear measures are fast but
insensitive to nonlinear coupling in contrast to nonlinear measures.
The phase-related measures are nonlinear but consider that the state
variables of interest are the instantaneous phases Ux,y of oscilla-
tions instead of their instantaneous amplitudes x,y.
Linear measures
The most commonly used measure of first-order interactions
between two time series x and y is the linear cross-correlation
function cxy(l ) defined as
cxyðlÞ ¼xi � x
rx
� �yiþl � y
ry
� �� �i
ð1Þ
where x and rx are the mean and standard deviation of x, similarly
for y, and l is a time lag. The absolute value of cxy ranges from 0
(no interaction) to 1 (x and y are proportional).
The coherence function Cxy(x) is the normalised value of the
cross-spectrum Cxy(x) defined as the Fourier transform of the
cross-correlation function cxy(l ):
CxyðxÞ ¼ ACxyðxÞAffiffiffiffiffiffiffiffiffiffiffiffiffiffiffiffiffiffiffiffiffiffiffiffiffiffiffiffiffiffiffiffiffiffiffiffiffiffiffiACxxðxÞAACyyðxÞA
p ð2Þ
where x is the discrete frequency. Cxy(x) takes its values between
0 and 1. It has been shown that coherence is useful for quantifying
long-range interactions in the EEG (Bressler, 1995; Gross et al.,
2001; Nunez et al., 1997). However, as the information contained
in the cross-correlation function and coherence function is identi-
cal, we restrict our analyses to the cross-correlation function. We
define our linear measure of interactions as maxl(cxy) and refer to it
as the cross-correlation.
Nonlinear measures
Mutual information
The measure of mutual information (MI) between two random
variables X and Y is based upon concepts from information theory.
It indicates the amount of information in X, given that Y is known
and vice versa. If the random variable X is partitioned into I bins,

O. David et al. / NeuroImage 21 (2004) 659–673 661
then a probability piX can be assigned to each possible outcome
Xi (i = 1,. . ., I ): piX = ni
X/N where niX is the number of occurrences
of Xi after N samples. The Shannon entropy of X is defined as
HðX Þ ¼ �XIi¼1
pXi lnp
Xi : ð3Þ
The estimation of H(X) is biased when some bins contain no
points ( piX=0). This occurs with finite time series, leading to an
underestimate of the entropy. The systematic bias can be compen-
sated for by estimating the errors introduced by the partitioning
into bins. The corrected entropy Hl (Roulston, 1999) is then
defined as:
HlðX Þ ¼ HðX Þ þ bX � 1
2Nð4Þ
where bX is the number of states for which piX p 0. Similarly, the
joint entropy between X and Y is equal to
HðX ; Y Þ ¼ �Xi;j
p XYij lnp XY
ij : ð5Þ
where pijxy is the joint probability of X = Xi and Y = Yj. Finally, the
mutual information between X and Y is defined as
MIðX ; Y Þ ¼ HðX Þ þ HðY Þ � HðX ; Y Þ ð6Þ
and its bias corrected expression MIl (Roulston, 1999) is
MIlðX ; Y Þ ¼ MIðX ; Y Þ þ bX þ bY � bXY � 1
2Nð7Þ
where bX, bY and bXY are the number of bins containing points. In
the following, the mutual information is bias corrected and
normalised by dividing it by ln(I).
The mutual information quantifies the statistical dependencies
between the two variables X and Y, with no assumption about the
form of their respective densities and implicitly their generating
processes, which can be linear or nonlinear. Unless some form of
temporal embedding is used (Quian Quiroga et al., 2002), this sort
of measure is only sensitive to static nonlinear dependencies.
Generalised synchronisation
The broad concept of generalised synchronisation was intro-
duced in 1995 (Rulkov et al., 1995). By definition, generalised
synchronisation exists between two dynamical systems X and Y
when the state of the response system Y is a function of the state
of the driving system X:Y = F(X). If F is continuous, two close
points on the attractor of X should correspond to two close points
on the attractor of Y. An important feature of generalised syn-
chronisation is that synchronised time series can look very
dissimilar. This is in contradistinction to other measures (except
MI), which require some similarity between time courses to detect
interactions.
Since its proposal, several algorithms have been developed to
detect generalised synchrony in experimental time series (Arn-
hold et al., 1999; Quian Quiroga et al., 2002; Rulkov et al.,
1995; Schiff et al., 1996). They all rely upon some time-delay
embedding (Takens, 1981). This method reconstructs the state
space using m-dimensional vectors whose components are con-
secutive values of the signals!Xn = [xn, xn + s,. . ., xn + (m � 1)s],!
Yn = [ yn, yn + s,. . ., yn + (m � 1)s], n = 1,. . .,N V, where N V= N �(m � 1)s, m is the embedding dimension and s is the delay time.
A proper reconstruction of the state space depends upon the
choice of m and s. The embedding dimension m must be large
enough to encompass the attractor but as small as possible to
limit computational load. In the following, we used a geometrical
method to determine m. This procedure is based on minimising
the number of false nearest neighbours (Kennel et al., 1992). The
delay time parameter s was chosen, as is convention, to be the
first zero of the autocorrelation function of the signals. Note that
a geometric approach can also be adopted to determine the
optimal s, which is generally not independent of the optimal m
(Rosenstein et al., 1994). A crucial aspect of all measures based
upon temporal embedding is the exclusion of vectors pairs that
are proximate simply because they are close in time. Conse-
quently, pairs [!Xn1 ;
!Xn2] are excluded when An1 � n2A is lower
than some threshold, called the Theiler correction (Theiler, 1986).
We used a Theiler correction equal to s.In many systems, the function F is generally unknown. How-
ever, its form is not essential for detecting interdependencies since
the existence of F induces a particular relationship among the
neighbourhood structure of states on the attractors of coupled
systems. This structure can be measured in terms of (i) closeness
between!Xn and its corresponding actual and mutual neighbours
using the geometric definition of distance (Arnhold et al., 1999;
Quian Quiroga et al., 2002), (ii) mutual prediction (for instance,
estimation of!Ynþd knowing
!Xn and its neighbours) (Schiff et al.,
1996) and (iii) synchronisation likelihood (Stam and van Dijk,
2002), which is closely related to the concept of generalised mutual
information. We present and use only the first of these measures
(results obtained using the others were qualitatively very similar)
and, for simplicity, refer to it as the generalised synchronisation
measure or generalised synchrony. However, it should be noted
that generalised synchronisation is a concept rather than a measure.
Let nj!Xn
and nj!Yn, j = 1,. . .,k, denote the time indices of the
k nearest neighbours of!Xn and
!Yn. By definition, f!Xn
j!Xn
gj¼1;...;k
are the true neighbours of!Xn and f!Yn j
!Xn
gj¼1;...;k are the mutual
neighbours of!Yn and vice versa for n
j!Yn. For each
!Xn , the mean
squared Euclidean distance to its k nearest neighbours is defined as
DðkÞn ðX Þ ¼ !
Xn �!Xn
j!Xn
!2* +j
ð8Þ
and the Y-conditioned mean squared Euclidean distance of!Xn is
defined by replacing the true nearest neighbours of!Xn by the equal
partners of the closest neighbours of!Yn (mutual neighbours of
!Xn):
DðkÞn ðX j Y Þ ¼ !
Xn �!Xn
j!Yn
!2* +j
: ð9Þ
If the systems X and Yexhibit generalised synchrony, then nj!Yncn
j!Xn
,
and thus Dn(k)(X jY ) c Dn
(k) (X ). Conversely, if the systems are
independent then Dn(k)(X jY ) c Dn
(N V� 1)(X ) where Dn(NV� 1)(X ) is
the mean squared Euclidean distance between point!Xn and the
remaining points!X . Several normalised measures have been
defined (Arnhold et al., 1999; Quian Quiroga et al., 2002). We will
use only one of these:
DðkÞðX j Y Þ ¼ DðN V�1Þn ðX Þ � D
ðkÞn ðX j Y Þ
DðN V�1Þn ðX Þ
* +n
ð10Þ

Fig. 1. Schematic of the neural mass model (David and Friston, in press).
The intrinsic dynamics of each area i are controlled by a parameter wi that
regulates the relative contributions of subpopulations with fast and slow
kinetics. Areas are coupled with a propagation delay d and a coupling
coefficient ki (0 V ki V 1), which controls the contribution of one area to the
other, relative to extrinsic inputs. These inputs pi are stochastic innovations
and represent the influence of the rest of the brain. Simulations were
performed with the following values: w1 = w2 = 0.8, d = 10 ms, <p1> =
<p2> = 220, std( p1) = std( p2) = 22. Detailed equations of this model are
provided in Appendix A.
O. David et al. / NeuroImage 21 (2004) 659–673662
which is below but close to 1 when X and Y are synchronised and
tends towards 0 when they are independent.
D(k)(Y jX ) is obtained in a similar fashion but is not identical to
D(k)(X jY ) for asymmetrical systems. This property can be used to
estimate the driver and driven systems, although one should be
careful interpreting D(k)(Y jX ) � D(k)(X jY ) (Pereda et al., 2001;
Quian Quiroga et al., 2000).
Phase synchronisation measures
Phase synchronisation between two oscillators is a ubiquitous
phenomenon, which appears when they are coupled in a broad
range of structures, including MEG or EEG generators (Pikovsky
et al., 2001). Consequently, time frequency analysis of phase
synchronisation is popular in current research on cortical network
identification in MEG or EEG (David et al., 2003b; Engel et al.,
2001; Varela et al., 2001). Basically, phase synchronisation anal-
ysis proceeds into two steps: (i) estimation of the instantaneous
phases and (ii) quantification of the phase locking.
Estimation of the instantaneous phases
There is an uncertain consensus about how to define the phase
of a signal. In the MEG or EEG community, two equivalent
methods are used: either the instantaneous phase of the MEG or
EEG signal is taken to be the phase of its analytical signal obtained
using the Hilbert transform, or it is identified by the phase of a
complex wavelet transform using Gabor functions. It has been
shown that both methods give similar results (Le Van Quyen et al.,
2001; Quian Quiroga et al., 2002). Consequently, we will restrict
our presentation to the Hilbert transform.
The analytic signal n(t) of the univariate measure x(t) is a
complex function of continuous time t defined as (Rosenblum et
al., 1996)
nðtÞ ¼ xðtÞ þ ixhðtÞ ¼ anðtÞei/nðtÞ ð11Þ
where the function xh(t) is the Hilbert transform of x(t)
xhðtÞ ¼1
pP:V:
Z þl
�l
xðtÞt � s
ds: ð12Þ
P.V. indicates that the integral is taken in the sense of Cauchy
principal value. an(t) and /n(t) are the instantaneous amplitude and
phase of the analytic signal n(t) of x(t). The instantaneous phase
/x(t) of x(t) is taken equal to /n(t). Identically, the phase /y(t) is
estimated from y(t).
The instantaneous phase, although defined uniquely for any
kind of signal to which the Hilbert transform can be applied, is
difficult to interpret physiologically for broadband signals. More-
over, it can be inefficient when looking for oscillations charac-
terised by a weak energy in a particular narrow band. For these
reasons, a standard procedure is to consider only narrow-band
phase synchronisation by estimating an instantaneous phase for
successive frequency bands, which are defined by band-pass
filtering the time series (Le Van Quyen et al., 2001).
Phase-locking quantification
For independent time series x(t) and y(t), the distribution of the
relative phase /xy(t) = /x(t) � /y(t) is uniform within a given time
window whose width defines the time resolution of the analysis
(usually a few hundred milliseconds). The detection of phase
locking involves quantifying the divergence from uniformity of
the relative phase distribution. Several measures have been pro-
posed for this purpose (Lachaux et al., 1999; Tass et al., 1998). We
will consider the one used in (Lachaux et al., 1999):
q ¼ ei/xyðtÞD E
t
��� ��� ð13Þ
where q is the mean phase coherence of an angular distribution
(Mormann et al., 2000). By construction, it is bounded by 0 (no
synchronisation) and 1 (perfect synchronisation).
Evaluation of dependency measures with a neural mass model
In this section, we evaluate the sensitivity of the measures
described in the previous section using a neural mass model of
coupled cortical regions (David and Friston, in press). This model
is based upon several simplifying assumptions, partly limiting its
validity, but it still serves as a useful vehicle to understand some
general features of macroscopic brain signals. The major assump-
tion of that model is the so-called mean field approximation, which
considers that variables of the model represent the average behav-
iour of quantities of interest, over the neuronal populations. In other
words, there is no explicit spatial dimension since neurons belong-
ing to a same neuronal assembly all express themselves through the
population dynamics (of the mean). This entails some approxima-
tions to the underlying dynamics that can be evaluated using more
sophisticated approaches based upon population densities (Haskell
et al., 2001). Thus, neural mass models deal with massive inter-
actions at a macroscopic scale and are generally unable to model
microscopic spatiotemporal patterns at the neuronal level.
Fig. 1 provides a schematic description of the model when two
areas are coupled. This is the case considered below. The input of
each area acts upon dendrites of pyramidal cells, and not of
excitatory spiny stellate cells as falsely indicated in (David and
Friston, in press). The MEG or EEG signal is computed the level of
apical dendrites. Each area i (i = 1,2) is characterised by a parameter
wi, bounded between 0 and 1, which scales the contribution of
populations with slow and fast time constants to the area’s dynam-

O. David et al. / NeuroImage 21 (2004) 659–673 663
ics. The input of each area i is a mixture of the output of the other
area j (delayed by a propagation time d) and a stochastic innovationpi (Gaussian noise), which simulates afferents from the rest of the
brain. The contribution of inputs from the other area is specified by
the coupling coefficients kij bounded between 0 (no coupling) and 1
(stochastic inputs ignored). A detailed description of MEG or EEG
signals generated by this model can be found in (David and Friston,
in press). For completeness, the equations used for the simulations
are provided in the Appendix A.
For simplicity, we consider a symmetric configuration (k =
k12 = k21, w = w1 = w2). The parameters w and d were set to 0.8
and 10 ms, respectively. These parameters generate signals show-
ing a realistic ratio in the alpha and beta bands for a broad range
of coupling values k (Fig. 2). The coupling sensitivity of depen-
dency measures was evaluated using simulated MEG or EEG time
series obtained for different values of the coupling coefficient k.
We varied k between 0.025 and 1 using a step size of 0.025. For
each value of k, 20 realisations of time series were obtained, each
of 1-s duration. When coupled, the signals generated by that
model tend to oscillate in phase or antiphase as shown in David
and Friston (in press). Accordingly, the cross-correlation was
evaluated with a time lag s = 0. The number of bins I used to
compute the mutual information MI was set to the number just
below ln(N)/ln(2). Because of the symmetric configuration, the
generalised synchronisation measure D was taken arbitrarily to be
[D(X jY ) + D(Y jX )]/2. The embedding dimension m used to
compute D was estimated to be 3 and the size of the neighbour-
hood set to 2m, which is large enough to avoid spurious effects of
changes in signal complexity in the quantification of interactions
(Pereda et al., 2001).
We assessed overall sensitivity to coupling in terms of the
changes in each measure induced by changes in k. To establish a
Fig. 2. Some typical simulated MEG or EEG time-series are shown in the top pane
dashed line; k = 0.5: solid line; model parameters: w = 0.8, d = 10 ms). The DC of
Below is the average amplitude spectrum of 20 simulated time series without DC
the parameters w and d were chosen to generate power in the alpha (8–12 Hz) a
Strikingly, the shape of the spectra depends critically on the coupling parameter
statistical bound on the sensitivity, the null distribution of each
measure was determined using surrogate data with no coupling. To
assess the sensitivity to the nonlinear component of coupling, we
computed each measure before and after destroying high-order
dependencies using phase randomisation.
Coupling sensitivity
The model parameters were chosen to generate broadband
signals that generally expressed two well-defined frequency bands
as shown in Fig. 2. It is possible to analyse these signals as such
(broadband analysis) or using a bank of narrow band-pass filters.
This is often done when studying oscillations (narrow-band analy-
sis). Below, we report the coupling sensitivity of the dependency
measures (cross-correlation, mutual information, generalised syn-
chronisation and phase synchronisation) using both approaches. The
characteristics of interaction measures were evaluated by comparing
their distributions obtained using coupled time series (k p 0) and
100 surrogate time series generated with no coupling (k = 0).
Broadband analysis
Fig. 3a shows the dependence of interaction measures on
coupling strength. The black solid curve is the average, over
realisations, of the measures l(k) as a function of coupling strength
k. The standard deviation r(k), normalised by the mean of the
estimators, is plotted in grey. This is the coefficient of variation
C.V. The C.V. reflects the intrinsic variability of the measures in
relation to their size. A small C.V. suggests that one may be able to
correlate the connectivity indices with other measures of brain state.
An example of this is provided in the last section. A high C.V.
compromises the usefulness of the measure when detecting changes
in coupling.
l for different values of the coupling strength k (k = 0: dash dot line; k = 0.1:
fset has been modified for a better display. The sampling frequency is 1 ms.
offset, obtained with the same parameters. The neuronal time constants and
nd beta (15–30 Hz) bands to emulate the typical MEG or EEG spectrum.
k.

Fig. 3. (a) Dependency measures applied to broadband signals as an increasing function of the coupling, as shown by solid lines (average value) over 20
realisations (dots). Cross-correlation, mutual information and phase synchronisation are less sensitive to weak couplings than generalised synchronisation.
The dotted line represents the maximum value obtained from 100 realisations of uncoupled time series (k = 0) and corresponds to a nominal specificity a = 0.01.
The dotted lines are the same measures but obtained with surrogate data that retained only the linear properties of original time series. cross-correlation
and mutual information show little sensitivity to nonlinear properties of data (the solid and dotted lines are almost coincident). As expected, nonlinearity
is detected by generalised synchronisation and by phase synchronisation but only for strong coupling. (b) Left: schematic illustrating how we computed
sensitivity. This is based on simple signal detection theory using threshold to control specificity. This threshold u is based on the empirically determined
null distribution (using surrogate data). The area under the density p(xjk p 0) between u and infinity corresponds to the probability of detecting coupling
when it exists. This threshold also ensures that the false positive rate (or specificity) is maintained at 0.01. Right: sensitivity as a function of coupling
for each of the four measures. It is self-evident that generalised synchrony supervenes at low connection strengths (see encircled region).
O. David et al. / NeuroImage 21 (2004) 659–673664

O. David et al. / NeuroImage 21 (2004) 659–673 665
The dotted line indicates the maximum value obtained using
surrogate data. This is the nonparametric threshold for a false
positive rate of a = 0.01 for a single measure and will be called u
below. The reason the specificity a = 0.01 is that we used 100
realisations of the surrogate data to form an empirical null
distribution. The power or sensitivity b at this specificity (1� a)is simply the probability of any measure exceeding u under the
alternate hypothesis that k p 0. We can approximate this for each
level of k by assuming a Gaussian form for the distribution of
measures and using their sample mean and variance. Fig. 3b
provides a schematic illustration of the sensitivity analysis (left
panel). The right panel shows sensitivity b(k) as a function of
coupling for each of the measures.
At a first glance, we observe that every measure was sensitive
to changes in neuronal coupling. However, some differences are
seen. Apart from mutual information, all the measures exhibit a
similar profile, on average (quasi-linear dependence upon coupling
before saturating at large coupling values), and approximately the
same coefficient of variation. The mutual information shows a
quasi-linear dependence upon coupling but is a less reliable metric
as indicated by its larger C.V. The cross-correlation and the phase
synchronisation show very similar behaviours. In terms of weak
coupling values are concerned (0 < k = 0.125), generalised
synchronisation is the best measure for detection (i.e., making an
Fig. 4. Coupling detection power as a function of the length of the time series. To e
time window applied to signals (with k = 0.1), from 0.2 to 2 s, with a step size of 200
by computing z-scores. The slopes for mutual information and generalised synch
windows relative to short one. Moreover, the variance of the generalised synchron
inference that k p 0). This is clearly evident from the right panel of
Fig. 3b. On the other hand, mutual information may be a better
characterisation in the context of strong coupling because it has a
relatively low coefficient of variation and retains sensitivity to
changes in k, that is, the slope Bl (k) / Bk is much greater relative
to the other measures.
Another important property of the interdependency measures is
their time resolution. A characteristic feature of functional con-
nectivity in the brain is its tendency to fluctuate rapidly; synchro-
nous cells assemblies are formed and dissolved at subsecond time
scales (Friston, 2000; Varela et al., 2001). To evaluate the time
resolution of the coupling measures, we varied the length of the
time window applied to signals used in Fig. 3 from 0.2 to 2 s with
a step size of 200 ms. We used k = 0.1 (Fig. 2) to produce signals
that resemble real MEG data. We compared the coupling values to
those obtained with surrogates (k = 0) by computing z-scores (i.e.,
the mean divided by the standard deviation under the null
hypothesis). Fig. 4 shows that the statistical power of coupling
detection is an increasing monotonic function of window length.
The slopes for mutual information and generalised synchronisa-
tion are larger. This suggests that these measures are relatively
more efficient with longer time windows that are used to charac-
terise stable regimes. Moreover, the variance of the generalised
synchronisation measure is smaller, indicating a more sensitive
valuate the time resolution of coupling measures, we varied the length of the
ms.We compare the coupling values to those obtained with surrogates (k = 0)
ronisation are larger reflecting a relatively greater efficiency for long-time
isation measure is smaller indicating a more reliable estimator.

O. David et al. / NeuroImage 21 (2004) 659–673666
detection in the context of stationary coupling. In a subsequent
paper, we will revisit this issue using evoked neuronal transients
that are, by definition, nonstationary.
In summary, the generalised synchronisation measure appears
to be the most sensitive for detecting interactions between broad-
band simulated MEG or EEG signals under continuous recording
conditions. Conversely, mutual information retains the greatest
sensitivity to changes in coupling at higher levels.
Narrow-band analysis
To supplement the broadband analysis, we performed narrow-
band analyses from 2 to 50 Hz, with a step size of 2 Hz, encompass-
ing the resonant frequencies of the model. For each frequency band,
we used a band-pass filter constructed so that the central frequency/
band width ratio was 5. The coupled (k = 0.1) and uncoupled (k = 0)
time series were filtered and dependencymeasures were estimated as
above. For each frequency band, the optimal embedding dimension
m remained 3 but the delay time s varied, changing with the first zeroof the autocorrelation function. The results are summarised in Fig. 5
by plotting the z-scores of each statistic as a function of central
frequency. The shape of the sensitivity profile of each statistic is very
similar with peaks over the two frequency bands of prominent
oscillations expressed by the neuronal populations in the model.
Fig. 5. Coupling sensitivity for narrow-band analysis. The original (coupled k = 0.1
bands from 2 to 50 Hz, with a step size of 2 Hz, encompassing the resonant freque
plotted as a function of central frequency. The sensitivity profile of each statistic
expressed by the neuronal populations in the model. The mutual information z-sc
Strikingly, the mutual information z-scores were much higher than
the other measures. This suggests that mutual information may be a
more efficient (i.e., less variable) index of coupling in the context of
frequency-specific coupling.
In summary, all measures can be used to estimate interactions
that are localised in frequency space, but mutual information has a
much larger sensitivity. This allows one to identify the frequencies
within which occur strong interactions. These frequencies depend
on various network properties (neuronal time constants, propaga-
tion delays, coupling strength, neuronal architecture, etc.).
Sensitivity to nonlinearity
Nonlinearity is an important characteristic of MEG or EEG
signals, especially when considered in the context of broadband
processes. In our model, nonlinearity arises from the sigmoid
relationship that maps the membrane potential to firing rate of
neurons; this is equation S(v) in the Appendix A. However, it
should be noted that the degree of nonlinear coupling in our model
is fairly weak. Weak nonlinearities can be typical of normal EEG
time series (Breakspear and Terry, 2002; Stam et al., 1999) in
contradistinction to epileptic signals where nonlinearity supervenes
(Lopes da Silva et al., 1989). An expedient way to detect
and uncoupled k = 0) time series were filtered in different narrow frequency
ncies of the model (centre: width ratio = 5). The z-scores of each statistic are
is very similar, clearly highlighting the two frequency bands of interactions
ores are much higher than the other measures.
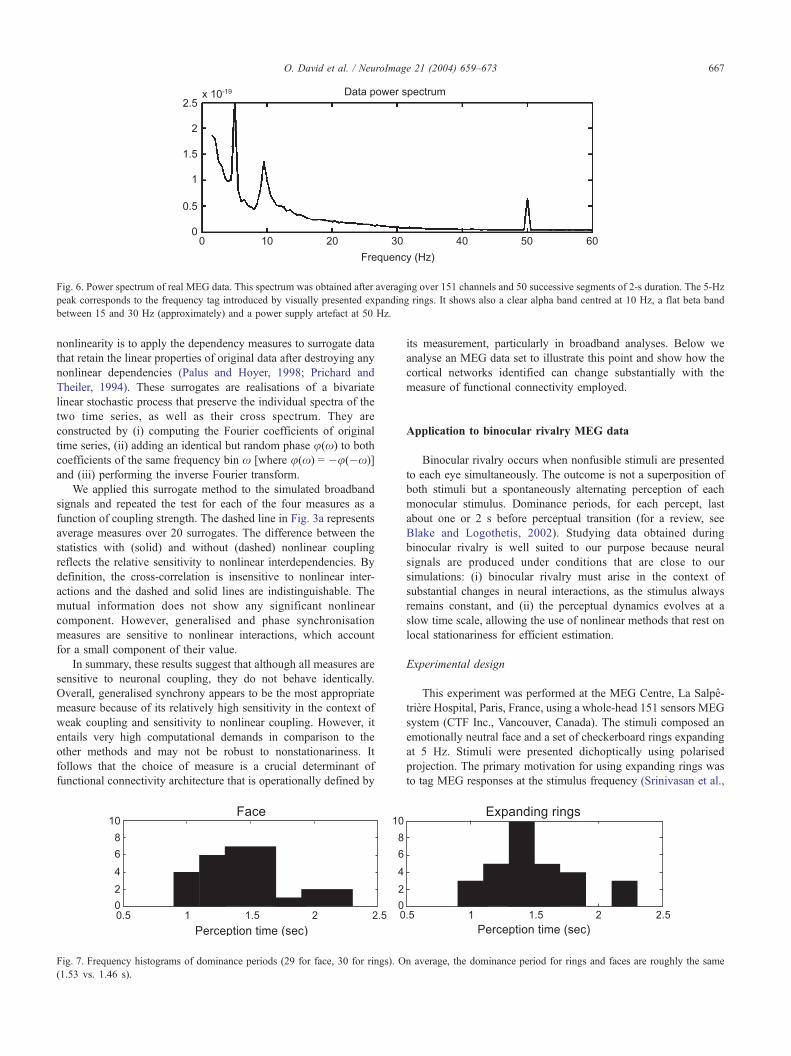
Fig. 6. Power spectrum of real MEG data. This spectrum was obtained after averaging over 151 channels and 50 successive segments of 2-s duration. The 5-Hz
peak corresponds to the frequency tag introduced by visually presented expanding rings. It shows also a clear alpha band centred at 10 Hz, a flat beta band
between 15 and 30 Hz (approximately) and a power supply artefact at 50 Hz.
O. David et al. / NeuroImage 21 (2004) 659–673 667
nonlinearity is to apply the dependency measures to surrogate data
that retain the linear properties of original data after destroying any
nonlinear dependencies (Palus and Hoyer, 1998; Prichard and
Theiler, 1994). These surrogates are realisations of a bivariate
linear stochastic process that preserve the individual spectra of the
two time series, as well as their cross spectrum. They are
constructed by (i) computing the Fourier coefficients of original
time series, (ii) adding an identical but random phase u(x) to both
coefficients of the same frequency bin x [where u(x) = �u(�x)]
and (iii) performing the inverse Fourier transform.
We applied this surrogate method to the simulated broadband
signals and repeated the test for each of the four measures as a
function of coupling strength. The dashed line in Fig. 3a represents
average measures over 20 surrogates. The difference between the
statistics with (solid) and without (dashed) nonlinear coupling
reflects the relative sensitivity to nonlinear interdependencies. By
definition, the cross-correlation is insensitive to nonlinear inter-
actions and the dashed and solid lines are indistinguishable. The
mutual information does not show any significant nonlinear
component. However, generalised and phase synchronisation
measures are sensitive to nonlinear interactions, which account
for a small component of their value.
In summary, these results suggest that although all measures are
sensitive to neuronal coupling, they do not behave identically.
Overall, generalised synchrony appears to be the most appropriate
measure because of its relatively high sensitivity in the context of
weak coupling and sensitivity to nonlinear coupling. However, it
entails very high computational demands in comparison to the
other methods and may not be robust to nonstationariness. It
follows that the choice of measure is a crucial determinant of
functional connectivity architecture that is operationally defined by
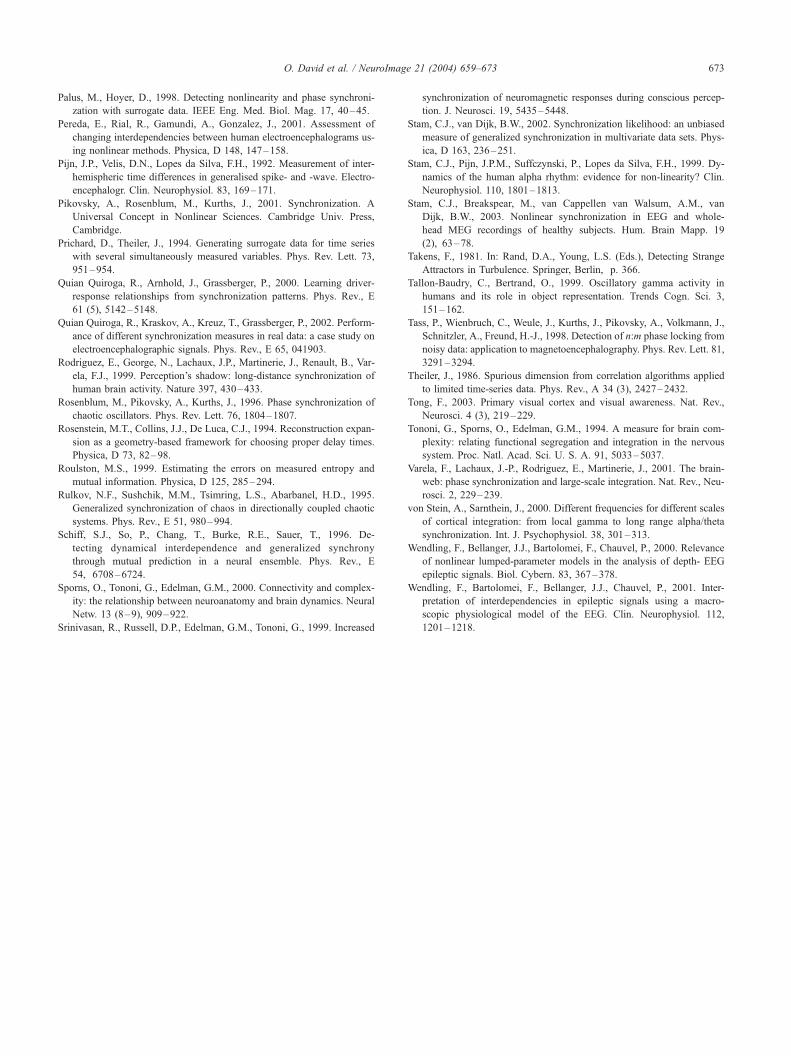
Fig. 7. Frequency histograms of dominance periods (29 for face, 30 for rings). O
(1.53 vs. 1.46 s).
its measurement, particularly in broadband analyses. Below we
analyse an MEG data set to illustrate this point and show how the
cortical networks identified can change substantially with the
measure of functional connectivity employed.
Application to binocular rivalry MEG data
Binocular rivalry occurs when nonfusible stimuli are presented
to each eye simultaneously. The outcome is not a superposition of
both stimuli but a spontaneously alternating perception of each
monocular stimulus. Dominance periods, for each percept, last
about one or 2 s before perceptual transition (for a review, see
Blake and Logothetis, 2002). Studying data obtained during
binocular rivalry is well suited to our purpose because neural
signals are produced under conditions that are close to our
simulations: (i) binocular rivalry must arise in the context of
substantial changes in neural interactions, as the stimulus always
remains constant, and (ii) the perceptual dynamics evolves at a
slow time scale, allowing the use of nonlinear methods that rest on
local stationariness for efficient estimation.
Experimental design
This experiment was performed at the MEG Centre, La Salpe-
triere Hospital, Paris, France, using a whole-head 151 sensors MEG
system (CTF Inc., Vancouver, Canada). The stimuli composed an
emotionally neutral face and a set of checkerboard rings expanding
at 5 Hz. Stimuli were presented dichoptically using polarised
projection. The primary motivation for using expanding rings was
to tag MEG responses at the stimulus frequency (Srinivasan et al.,
n average, the dominance period for rings and faces are roughly the same

Fig. 8. Cortical networks related to the face perception (a) and to ring perception (b), estimated using several dependency measures. The cortical connections
were estimated by applying a threshold ( P < 0.005 where the null distribution was determined using surrogate data) to the correlation between the dependency
measures and the face perception function (dashed lines) averaged over a 9-s time window. The solid lines on the right are the coupling time series averaged
over the selected cortical connections. Networks correlated with face perception are much more extensive than those correlated to ring perception. The time
series also show a stronger correlation between cortical interactions and perceptual state for faces. The networks based on cross-correlation and mutual
information tend to be denser.
O. David et al. / NeuroImage 21 (2004) 659–673668

O. David et al. / NeuroImage 21 (2004) 659–673 669
1999). It has been shown that the conscious percept of 5 Hz
expanding rings modulates the MEG spectrum at the same frequen-
cy (Fig. 6). This entrainment is enabled by the retinotopic organi-
sation of visual areas (David et al., 2003a). This tagging is an
interesting dynamical phenomenon during binocular rivalry (Cos-
melli et al., in preparation), but it is an artefact from our perspective.
In addition to the 5-Hz component, the data power spectrum in Fig.
6 shows a clear alpha band centred at 10 Hz, a rather flat beta band
and a power supply artefact at 50 Hz. We therefore focused,
arbitrarily, on signals in the beta band (15–30 Hz).
The MEG data were acquired for 100 s at a sampling frequency
of 1250 Hz. The subject indicated perceptual state (rings or face)
with a button press. Twenty-nine periods of face dominance were
reported, while 30 were attributed to the rings. The frequency
histograms of dominance periods are shown in Fig. 7. On average,
the dominance periods for rings and faces were about the same
(1.53 vs. 1.46 s). The subject’s report enabled us to construct a face
perception time series (equal to 1 for face dominance and 0 for ring
dominance).
Source localisation and dynamics estimation
The MEG data were band-pass filtered in the beta band
(between 15 and 30 Hz), and source localisation procedures were
applied to estimate cortical dynamics. Sparse focal, cortically
distributed solutions were reconstructed using inverse methods
described elsewhere (David and Garnero, 2002; David et al.,
2002, 2003a). The resulting 22 sources are shown in Fig. 8. Each
source corresponds to a single time series, obtained using the
classical minimum norm estimator (Dale and Sereno, 1993; David
and Garnero, 2002). Bilateral activations were found in lingual
gyrus, precuneus, cingulate gyrus, orbital cortex (posterior and
medial orbital gyrus), inferior frontal gyrus or frontal operculum,
posterior inferior temporal gyrus and intraparietal sulcus. Exclusive
right hemisphere activation was found in the anterior portion of the
superior temporal gyrus and the central sulcus. In the left hemi-
sphere, responses were detected in the cuneus, middle occipital
gyrus, middle temporal gyrus and angular gyrus.
It is important to note that the dynamics of localised sources
depend upon the source configuration since the lead fields are
not orthogonal. This means that in principle, if one source is not
detected by the localisation procedure, then its contribution to
the surface data may be reallocated in part to other sources. This
is a tricky issue that cannot be entirely avoided due to the ill-
posed nature of the MEG or EEG inverse problem (Baillet et al.,
2001).
Functional connectivity analysis
Neuronal interactions were estimated among reconstructed
sources using the measures considered above. A sliding time
window (1 s width, 100 ms between successive windows) was
used to reconstruct a time-dependent measure of functional con-
nectivity. To ensure that the results were comparable to the
simulations, the asymmetry of generalised synchronisation mea-
sure D was discounted by defining D = [D(X jY ) + D(Y jX )]/2.
Moreover, the same embedding dimension and neighbourhood size
were used.
We were particularly interested in whether time-dependent
changes in coupling were correlated to conscious perception. To
assess this, we computed the correlation between the dependency
measures and the subject’s perceptual state. The average perception
function, computed over a 9-s time window, is shown as the dashed
lines on the right side of Fig. 8 (large values correspond to face
perception).
For each perceptual state and dependency measure, the con-
nections that were significantly correlated with perception were
used to define the perceptual network (Fig. 8). This was achieved
using the cross-correlation between dependency measures and
perceptual state. The threshold was determined nonparametrically
using surrogates. Two hundred surrogate data sets were con-
structed by averaging time series using the same number of time
windows but randomly in time. Each surrogate was correlated to
the average perception function and the threshold for each source
pair was taken to be the maximum of this quantity over realisations
(i.e., P < 0.005).
Fig. 8 presents the networks identified in this fashion, for each
dependency measure. The networks are shown separately for
positive correlations with face perception (Fig. 8a) and negative
correlations (i.e., positive correlations with rings; Fig. 8b). As can
be seen in the left panels of Fig. 8a, all four measurements show a
good correlation with face perception. Likewise, the networks
show important similarities in their overall distribution. All the
networks share a common pattern of interaction among occipital,
inferior parietal, posterior inferior temporal, middle temporal and
frontal regions, in particular, inferior lateral frontal cortices and
medial frontal regions including the cingulate cortex. However, the
density of perception-related changes in coupling varies with the
different measures. While cross-correlation and mutual information
reveal a dense network of interacting regions, generalised synchro-
nisation and, in particular, phase synchronisation show a more
diffuse set of connections. In the specific case of phase synchro-
nisation, the right inferior frontal region connections are particu-
larly sparse. On the other hand, when the subject perceives the
rings, the identified networks (Fig. 8b), although present, are
consistently smaller. cross-correlation and mutual information still
reveal more percept-dependent coupling relative to synchronisation
measures.
It is obviously impossible to conclude which functional con-
nectivity measure is the best with a single subject analysis.
However, the results shown above demonstrate strong correlations
between perceptual states and coupling as inferred using distant
MEG signals. They also confirm that dependency measures can be
a critical factor when characterising functional connectivity in
MEG or EEG.
Discussion
The purpose of this study was to (i) assess the relative
sensitivity of commonly used measures of functional connectivity
and (ii) to show that there is no unique measure of neural
interactions using MEG or EEG signals. We used a neural mass
model to show that several measures detect functional connections
but with different sensitivity profiles. In the context of relatively
weak coupling, statistics based on generalised synchrony appear to
be the most sensitive. We have shown, with real MEG data, that the
choice of dependency measure can be important for the identifi-
cation of functional networks.
The neural mass model we used was developed to obtain a
qualitative characterisation of oscillatory dynamics in MEG or
EEG signals and how these change with the coupling among areas

O. David et al. / NeuroImage 21 (2004) 659–673670
(David and Friston, in press). Although its basic architecture is
neurophysiologically plausible, it does not accommodate many
details of neuronal interactions. However, it generates mildly
nonlinear signals that are very similar to empirical signals (Break-
spear and Terry, 2002; Stam et al., 1999). In this paper, we used the
model to show that linear measures are sensitive to coupling
between MEG and EEG signals but insensitive to nonlinear
components. In contradistinction, generalised synchronisation and
phase synchronisation were sensitive to both linear and nonlinear
coupling. Furthermore, generalised synchrony was substantially
more sensitive than any other measure when detecting very weak
coupling.
Our results indicate that measures based on generalised syn-
chronisation may be preferred when studying broadband signals
because they are sensitive to dynamic coupling and nonlinear
interactions expressed over many frequencies. However, they
entail some drawbacks. First, they are time consuming. Second,
they depend upon some parameters (time delay, embedding
dimension and neighbourhood size) that are not always easily
optimised. More importantly, if we consider two time series with a
coupling that is kept exactly the same, but some other property
(for instance the dimensionality) of one changes, almost all
measures will be fooled and suggest a change in the coupling
strength has occurred (Pereda et al., 2001). In view of the
nonstationary nature of brain dynamics, this is not a trivial or
hypothetical problem. For these reasons, linear measures are still
very useful because they afford a rapid and straightforward
characterisation of functional connectivity.
In general, reentrant loops that predominate widely in the
brain generate resonant frequencies that reflect network proper-
ties (synaptic time constants, propagation delay, coupling
strength, neuronal architecture, etc.). This has led to the search
for frequency-specific interactions in MEG or EEG signals using
measures such as coherence (Bressler, 1995; Gross et al., 2001),
power (Tallon-Baudry and Bertrand, 1999) and phase synchro-
nisation (Rodriguez et al., 1999). A growing number of studies
have disclosed robust frequency-specific patterns, which are still
not clearly understood. In particular, some relationship might
exist between the oscillation frequency and the size of the
networks involved (von Stein and Sarnthein, 2000). To analyse
frequency-specific interactions, we used our model to generate
complex signals whose interactions were confined largely to two
distinct frequency bands. The dependency measures showed a
corresponding and consistent frequency dependence, particularly
with mutual information. This suggests that narrow-band anal-
yses might supplement the characterisation of the underlying
neuronal processes.
We have analysed MEG data using several characterisations of
functional connectivity. We were particularly interested in neuronal
interactions in the beta band (15–30 Hz) related to face and ring
perception during binocular rivalry. We used source localisation
algorithms to estimate cortical activity and searched for interac-
tions among reconstructed cortical sources throughout the brain.
Our results suggest that interdependencies among occipital, inferior
parietal, posterior inferior and middle temporal, medial and infero-
lateral frontal cortices correlate strongly with the dominance of the
face percept. The results presented here were obtained from one
subject and little generalisation is possible. However, the patterns
of interaction disclosed involve cortical regions that have been
implicated in visual perception at several levels. Basic low-level
processing of visual stimuli is associated with primary visual
cortex activation (Tong, 2003). The perception of faces has been
shown to implicate the inferior temporal cortex, in particular the
fusiform gyrus (Halgren et al., 2000). In conjunction with parietal
cortices, the cingulate cortex is believed to play a major role in the
direction of attention to extrapersonal stimuli and conscious
perception (Dehaene and Naccache, 2001; Mesulam, 1999). We
have studied networks of interdependent cortical regions using a
multistable perception paradigm in which the perception of a face
is a spontaneous, endogenously driven phenomenon. Such pro-
cesses necessitate the active coordination of recognition and other
mechanisms required for perceptual categorisation, such as those
mediated by striate and extrastriate visual cortex. In addition, high-
level top-down influences, implicated in the selection and mainte-
nance of percepts (Blake and Logothetis, 2002), are likely to be
invoked. The distributed network obtained in this subject speaks to
a dynamic coordination among such low- and high-level areas
during the conscious perception of a face. Furthermore, it agrees
with studies that show parietofrontal regions express correlates of
perceptual transitions in a similar paradigm (Lumer and Rees,
1999; Lumer et al., 1998).
Our results also suggest that the exploration of the beta band
(15–30 Hz) could be of interest for the study of long-range
interactions in the human brain during perception. However, it is
important to note that the functional networks identified
exhibited differences from one measure to another. In particular,
cross-correlation and mutual information revealed very dense
networks, while generalised and phase synchronisation disclosed
sparser patterns, probably because these measures may be intrin-
sically more variable (phase synchronisation) or stochastic
aspects of the time series may confound the generalised syn-
chrony measure.
In this paper, we have used a neural mass model to evaluate
the relative sensitivities of various measures of coupling among
neuronal systems. Clearly, the extent to which our conclusions
can be generalised to the analysis of real data rests upon the
biological validity of the model employed. It will be noted that
although there are many similarities between the simulated and
real data, there are also differences (e.g., in terms of the spectral
density profile). Establishing the validity of models, such as the
one we have used, is an important but difficult issue. One
obvious approach is to use the model parameters that enable
simulated data to emulate key features observed in empirical
data. However, even this can be challenging at times. For
example, as seen in Fig. 2, changes in key parameters such as
the coupling strength can have quite a substantial impact on
characterisations, such as the spectral density. In this paper, the
model has been used to provide a proof of principle that
different metrics are sensitive to different aspects of coupling.
We appeal to the neuronal plausibility of the model’s architecture
in motivating this demonstration. However, the analysis of the
empirical MEG data should not be interpreted quantitatively in
relation to the simulations. This is because our model was not
constrained to reproduce the exact characteristics of the particular
MEG data set analysed. The main point that we wanted to make
was that in both simulations and analyses of real data, different
conclusions are obtained when using different measures of
coupling.
The largest difference between results obtained on simulated
and real signals is the performance of the measure based on the
concept of generalised synchronisation. This is not new as the
application of some of these methods in simple experimental

O. David et al. / NeuroImage 21 (2004) 659–673 671
models has not been straightforward. The main reason is that MEG
or EEG signals cannot be supposed as purely deterministic
processes and their stochastic component can strongly affect the
results. Another possibility is that such measures can be more
sensitive to experimental artefacts that may be important in non-
averaged MEG or EEG signals (especially muscular artefacts in the
beta band). Nevertheless, nonsymmetrical nonlinear measures are
very important, particularly for the estimation of causality or
direction of information transfer (Chavez et al., 2003; Quian
Quiroga et al., 2000; Wendling et al., 2001).
Conclusion
We have shown that neural mass models can be useful tool to
evaluate measures of neural coupling in MEG or EEG signals. We
have evaluated several commonly used dependency measures and
demonstrated that their sensitivity depends upon (i) the frequency
specificity of coupling (broad vs. narrow band) and (ii) the nature
of the functional connectivity (linear vs. nonlinear). The differ-
ences in functional connectivity analyses, using real data, confirm
differences in sensitivity profiles and speak to a substantial degree
of coupling induced by face perception. The results of this study
suggest that estimation of neuronal coupling is far from trivial and
that one should be careful when studying functional connectivity
using electrophysiological signals. As cautioned by others (Netoff
and Schiff, 2002; Quian Quiroga et al., 2002), one should not
make too many prior assumptions about the type of interactions.
Applying a battery of tests that are sensitive to different aspects of
synchronisation seems to be a more appropriate and balanced
approach.
Acknowledgments
OD and KJF are funded by the Wellcome Trust. DC is a
recipient of a Boehringer Ingelheim Fonds Fellowship. We would
also like to thank the anonymous reviewers for helpful comments
that changed, materially, the presentation of this work.
Appendix A
The model summarised in Fig. 1 composes the following
stochastic differential equations. A more intuitive explanation of
these equations will be found in David and Friston (in press).
y0 ¼ y3
y1 ¼ y4
y2 ¼ y5
s1e y3¼H1e Sðwy1þð1�wÞy10�wy2�ð1�wÞy6Þ�2y3�y0=s
1e
s1e y4 ¼ H1e ðk21* ðSðwðy13ðt � dÞ � y14ðt � dÞÞ þ ð1� wÞðy22ðt � dÞ
� y18ðt � dÞÞÞ � aÞ þ ð1� k21Þp1 þ pþ C2SðC1ðwy0
þ ð1� wÞy8ÞÞÞ � 2y4 � y1=s1e
s1i y5 ¼ H1i C4SðC3ðwy0 þ ð1� wÞy8ÞÞ � 2y5 � y2=s
1i
y6 ¼ y7
s2i y7 ¼ H2i C4SðC3ðwy0 þ ð1� wÞy8ÞÞ � 2y7 � y6=s
2i
y8 ¼ y9
s2e y9 ¼ H2e Sðwy1 þ ð1� wÞy10 � wy2 � ð1� wÞy6Þ � 2y9 � y8=s
2e
y10 ¼ y11
s2e y11 ¼ H2e ðk21* ðSðwðy13ðt � dÞ � y14ðt � dÞÞ þ ð1� wÞðy22ðt� dÞ
� y18ðt� dÞÞÞ� aÞ þ ð1� k21Þp1 þ pþ C2SðC1ðwy0þ ð1� wÞy8ÞÞÞ � 2y11 � y10=s
2e
y12 ¼ y15
y13 ¼ y16
y14 ¼ y17
s1e y15 ¼ H1e Sðwy13 þ ð1� wÞy22 � wy14 � ð1� wÞy18Þ � 2y15
� y12=s1e
s1e y16 ¼ H1e ðk12* ðSðwðy1ðt � dÞ � y2ðt � dÞÞ þ ð1� wÞðy10ðt � dÞ
� y6ðt � dÞÞÞ � aÞ þ ð1� k12Þp2 þ pþ C2SðC1ðwy12
þ ð1� wÞy20ÞÞÞ � 2y16 � y13=s1e
s1i y17 ¼ H1i C4SðC3ðwy12 þ ð1� wÞy20ÞÞ � 2y17 � y14=s
1i
y18 ¼ y19
s2i y19 ¼ H2i C4SðC3ðwy12 þ ð1� wÞy20ÞÞ � 2y19 � y18=s
2i
y20 ¼ y21
s2e y21 ¼ H2e Sðwy13 þ ð1� wÞy22 � wy14 � ð1� wÞy18Þ � 2y21
� y20=s2e
y22 ¼ y23
s2e y23 ¼ H2e ðk12* ðSðwðy1ðt � dÞ � y2ðt � dÞÞ þ ð1� wÞðy10ðt � dÞ
� y6ðt � dÞÞÞ � aÞ þ ð1� k12Þp2 þ pþ C2SðC1ðwy12þ ð1� wÞy20ÞÞÞ � 2y23 � y22=s
2e ðA1Þ
where
Signal1MEG ¼ wðy1 � y2Þ þ ð1� wÞðy10 � y6Þ
Signal2MEG ¼ wðy13 � y14Þ þ ð1� wÞðy22 � y18Þ
SðvÞ ¼ e0
1þ expðrðv0 � vÞÞ
k12* ¼ rp
ffiffiffiffiffiffiffiffiffiffiffiffiffiffiffiffiffiffiffiffi2k12 � k212
pstdðSðwðy1 � y2Þ þ ð1� wÞðy10 � y6ÞÞÞ
k21* ¼ rp
ffiffiffiffiffiffiffiffiffiffiffiffiffiffiffiffiffiffiffiffi2k21 � k221
pstdðSðwðy13 � y14Þ þ ð1� wÞðy22 � y18ÞÞÞ
ðA2Þ

O. David et al. / NeuroImage 21 (2004) 659–673672
with the following parameters: a = 3.501; c = 135; c1 = c2 =
0.8c; c3 = c4 = 0.25c; He1 = 3; He
2 = 7; Hi1 = 20; Hi
2 = 150; se1 =
0.0108; se2 = 0.0046; si
1 = 0.022; si2 = 0.0029; e0 = 5; v0 = 6; r =
0.56; rp = 22; p = 220.
The input noise p1,2 is Gaussian with standard deviation rp.
These stochastic differential equations must be integrated numer-
ically using appropriate procedures (Kloeden and Platen, 1999). In
this paper, they were integrated using a standard second order
Runge–Kutta algorithm that gave very similar results to those
obtained with its stochastic version (Honeycutt, 1992). Note that the
estimation of k12* and k21* is performed during the integration.
References
Abarbanel, H.D.I., Rabinovich, M.I., 2001. Neurodynamics: nonlinear dy-
namics and neurobiology. Curr. Opin. Neurobiol. 11, 423–430.
Abeles, M., 1991. Corticonics: Neural Circuits of the Cerebral Cortex.
Cambridge Univ. Press, Cambridge.
Arnhold, J., Grassberger, P., Lehnertz, K., Elger, C.E., 1999. A robust
method for detecting interdependences: application to intracranially re-
corded EEG. Physica, D 134, 419–430.
Baillet, S., Mosher, J.C., Leahy, R.M., 2001. Electromagnetic brain map-
ping. IEEE Signal Process. Mag., 14–30 (November).
Blake, R., Logothetis, N.K., 2002. Visual competition. Nat. Rev., Neurosci.
3, 13–21.
Boccaletti, S., Kurths, J., Osipov, G., Valladares, D.L., Zhou, C.S., 2002.
The synchronization of chaotic systems. Phys. Rep. 366, 1–101.
Breakspear, M., Terry, J.R., 2002. Detection and description of non-linear
interdependence in normal multichannel human EEG data. Clin. Neuro-
physiol. 113, 735–753.
Bressler, S., 1995. Large-scale cortical networks and cognition. Brain Res.
Rev. 20, 288–304.
Buzuk, Th., Pawelzik, K., von Stamm, J., Pfister, G., 1994. Mutual infor-
mation and global strange attractors in Taylor–Couette flow. Physica, D
72 (4), 343–350.
Chavez, M., Martinerie, J., Le Van Quyen, M., 2003. Statistical assessment
of nonlinear causality: application to epileptic EEG signals. J. Neurosci.
Methods 124, 113–128.
Clifford Carter, G., 1987. Coherence and time delay estimation. Proc.
I.E.E.E. 75, 236–255.
Cosmelli, D., David, O., Lachaux, J.-P., Martinerie, J., Garnero, L., Re-
nault, B., Varela, F., in preparation. Waves of consciousness: ongoing
dynamic cortical patterns during binocular rivalry.
Dale, A.M., Sereno, M.I., 1993. Improved localization of cortical activity
by combining EEG and MEG with MRI cortical surface reconstruction:
a linear approach. J. Cogn. Neurosci. 5, 162–176.
David, O., Friston, K.J., in press. A neural mass model for MEG/EEG:
coupling and neuronal dynamics. NeuroImage.
David, O., Garnero, L., 2002. Time-coherent expansion of MEG/EEG
cortical sources. NeuroImage 17, 1277–1289.
David, O., Garnero, L., Cosmelli, D., Varela, F.J., 2002. Estimation of
neural dynamics from MEG/EEG cortical current density maps: appli-
cation to the reconstruction of large-scale cortical synchrony. IEEE
Trans. Biomed. Eng. 49, 975–987.
David, O., Cosmelli, D., Hasboun, D., Garnero, L., 2003a. A multi-trial
analysis for revealing significant corticocortical networks in magneto-
encephalography and electroencephalography. NeuroImage 20 (1),
186–201.
David, O., Cosmelli, D., Lachaux, J.-P., Baillet, S., Garnero, L., Martinerie,
J., 2003b. A theoretical and experimental introduction to the non-inva-
sive study of large-scale neural phase synchronization in human beings.
Int. J. Comput. Cogn. 1 (4), 53–77.
Dehaene, S., Naccache, L., 2001. Towards a cognitive neuroscience of
consciousness: basic evidence and a workspace framework. Cognition
79 (1–2), 1–37.
Engel, A.K., Fries, P., Singer, W., 2001. Dynamic predictions: oscilla-
tions and synchrony in top-down processing. Nat. Rev., Neurosci. 2,
704–716.
Freeman, W.J., 1978. Models of the dynamics of neural populations. Elec-
troencephalogr. Clin. Neurophysiol., Suppl. 34, 9–18.
Friston, K.J., 2000. The labile brain: I. Neuronal transients and nonlinear
coupling. Philos. Trans. R. Soc. Lond., B Biol. Sci. 355, 215–236.
Gross, J., Kujala, J., Hamalainen, M., Timmermann, L., Schnitzler, A.,
Salmelin, R., 2001. Dynamic imaging of coherent sources: studying
neural interactions in the human brain. Proc. Natl. Acad. Sci. U. S. A.
98, 694–699.
Halgren, E., Tommi, R., Marinkovic, K., Jousmaki, V., Hari, R., 2000.
Cognitive response profile of the human fusiform area as determined
by MEG. Cereb. Cortex 10, 69–81.
Hamalainen, M., Hari, R., Ilmoniemi, R., Knuutila, J., Lounasmaa, O.,
1993. Magnetoencephalography. Theory, instrumentation and applica-
tions to the noninvasive study of brain function. Rev. Mod. Phys. 65,
413–497.
Haskell, E., Nykamp, D.Q., Tranchina, D., 2001. Population density meth-
ods for large-scale modeling of neuronal networks with realistic synap-
tic kinetics: cutting the dimension down to size. Network: Comput.
Neural Syst. 12, 141–174.
Honeycutt, R.L., 1992. Stochastic Runge –Kutta algorithms: I. White
noise. Phys. Rev., A 45, 600–603.
Jansen, B.H., Rit, V.G., 1995. Electroencephalogram and visual evoked
potential generation in a mathematical model of coupled cortical col-
umns. Biol. Cybern. 73, 357–366.
Kennel, M.D., Brown, R., Abarbanel, H.D.I., 1992. Determining embed-
ding dimension for phase-space reconstruction using a geometrical con-
struction. Phys. Rev., A 45, 3403–3411.
Kloeden, P.E., Platen, E., 1999. Numerical Solution of Stochastic Differ-
ential Equations. Springer-Verlag, Berlin, Heidelberg, New York.
Lachaux, J.-P., Rodriguez, E., Martinerie, J., Varela, F.J., 1999. Measuring
phase synchrony in brain signals. Hum. Brain Mapp. 8, 194–208.
Le Van Quyen, M., Foucher, J., Lachaux, J., Rodriguez, E., Lutz, A.,
Martinerie, J., Varela, F.J., 2001. Comparison of Hilbert transform
and wavelet methods for the analysis of neuronal synchrony. J. Neuro-
sci. Methods 111, 83–98.
Lopes da Silva, F.H., Hoeks, A., Smits, H., Zetterberg, L.H., 1974. Model
of brain rhythmic activity. The alpha-rhythm of the thalamus. Kyberne-
tik 15, 27–37.
Lopes da Silva, F., Pijn, J.P., Boeijinga, P., 1989. Interdependence of EEG
signals: linear vs. nonlinear associations and the significance of time
delays and phase shifts. Brain Topogr. 2 (1/2), 9–18.
Lumer, E.D., Rees, G., 1999. Covariation of activity in visual and prefron-
tal cortex associated with subjective visual perception. Proc. Natl. Acad.
Sci. 96 (4), 3198–3203.
Lumer, E.D., Friston, K.J., Rees, G., 1998. Neural correlates of perceptual
rivalry in the human brain. Science 280, 1930–1934.
Mesulam, M.M., 1999. Spatial attention and neglect: parietal, frontal and
cingulate contributions to the mental representation and attentional tar-
geting of salient extrapersonal events. Philos. Trans. R. Soc. Lond., B
Biol. Sci. 354 (1387), 1325–1346.
Mormann, F., Lehnertz, K., David, P., Elger, C.E., 2000. Mean phase
coherence as a measure for phase synchronization and its application
to the EEG of epilepsy patients. Physica, D 144, 358–369.
Netoff, T.I., Schiff, S.J., 2002. Decreased neuronal synchronization during
experimental seizures. J. Neurosci. 22, 7297–7307.
Nunez, P.L., 1981. Electric Fields of the Brain. Oxford Univ. Press,
New York.
Nunez, P.L., Srinivasan, R., Westdorp, A.F., Wijesinghe, R.S., Tucker,
D.M., Silberstein, R.B., Cadusch, P.J., 1997. EEG coherency: I. Statis-
tics, reference electrode, volume conduction, Laplacians, cortical imag-
ing, and interpretation at multiple scales. Electroencephalogr. Clin.
Neurophysiol. 103, 499–515.
O. David et al. / NeuroImage 21 (2004) 659–673 673
Palus, M., Hoyer, D., 1998. Detecting nonlinearity and phase synchroni-
zation with surrogate data. IEEE Eng. Med. Biol. Mag. 17, 40–45.
Pereda, E., Rial, R., Gamundi, A., Gonzalez, J., 2001. Assessment of
changing interdependencies between human electroencephalograms us-
ing nonlinear methods. Physica, D 148, 147–158.
Pijn, J.P., Velis, D.N., Lopes da Silva, F.H., 1992. Measurement of inter-
hemispheric time differences in generalised spike- and -wave. Electro-
encephalogr. Clin. Neurophysiol. 83, 169–171.
Pikovsky, A., Rosenblum, M., Kurths, J., 2001. Synchronization. A
Universal Concept in Nonlinear Sciences. Cambridge Univ. Press,
Cambridge.
Prichard, D., Theiler, J., 1994. Generating surrogate data for time series
with several simultaneously measured variables. Phys. Rev. Lett. 73,
951–954.
Quian Quiroga, R., Arnhold, J., Grassberger, P., 2000. Learning driver-
response relationships from synchronization patterns. Phys. Rev., E
61 (5), 5142–5148.
Quian Quiroga, R., Kraskov, A., Kreuz, T., Grassberger, P., 2002. Perform-
ance of different synchronization measures in real data: a case study on
electroencephalographic signals. Phys. Rev., E 65, 041903.
Rodriguez, E., George, N., Lachaux, J.P., Martinerie, J., Renault, B., Var-
ela, F.J., 1999. Perception’s shadow: long-distance synchronization of
human brain activity. Nature 397, 430–433.
Rosenblum, M., Pikovsky, A., Kurths, J., 1996. Phase synchronization of
chaotic oscillators. Phys. Rev. Lett. 76, 1804–1807.
Rosenstein, M.T., Collins, J.J., De Luca, C.J., 1994. Reconstruction expan-
sion as a geometry-based framework for choosing proper delay times.
Physica, D 73, 82–98.
Roulston, M.S., 1999. Estimating the errors on measured entropy and
mutual information. Physica, D 125, 285–294.
Rulkov, N.F., Sushchik, M.M., Tsimring, L.S., Abarbanel, H.D., 1995.
Generalized synchronization of chaos in directionally coupled chaotic
systems. Phys. Rev., E 51, 980–994.
Schiff, S.J., So, P., Chang, T., Burke, R.E., Sauer, T., 1996. De-
tecting dynamical interdependence and generalized synchrony
through mutual prediction in a neural ensemble. Phys. Rev., E
54, 6708–6724.
Sporns, O., Tononi, G., Edelman, G.M., 2000. Connectivity and complex-
ity: the relationship between neuroanatomy and brain dynamics. Neural
Netw. 13 (8–9), 909–922.
Srinivasan, R., Russell, D.P., Edelman, G.M., Tononi, G., 1999. Increased
synchronization of neuromagnetic responses during conscious percep-
tion. J. Neurosci. 19, 5435–5448.
Stam, C.J., van Dijk, B.W., 2002. Synchronization likelihood: an unbiased
measure of generalized synchronization in multivariate data sets. Phys-
ica, D 163, 236–251.
Stam, C.J., Pijn, J.P.M., Suffczynski, P., Lopes da Silva, F.H., 1999. Dy-
namics of the human alpha rhythm: evidence for non-linearity? Clin.
Neurophysiol. 110, 1801–1813.
Stam, C.J., Breakspear, M., van Cappellen van Walsum, A.M., van
Dijk, B.W., 2003. Nonlinear synchronization in EEG and whole-
head MEG recordings of healthy subjects. Hum. Brain Mapp. 19
(2), 63–78.
Takens, F., 1981. In: Rand, D.A., Young, L.S. (Eds.), Detecting Strange
Attractors in Turbulence. Springer, Berlin, p. 366.
Tallon-Baudry, C., Bertrand, O., 1999. Oscillatory gamma activity in
humans and its role in object representation. Trends Cogn. Sci. 3,
151–162.
Tass, P., Wienbruch, C., Weule, J., Kurths, J., Pikovsky, A., Volkmann, J.,
Schnitzler, A., Freund, H.-J., 1998. Detection of n:m phase locking from
noisy data: application to magnetoencephalography. Phys. Rev. Lett. 81,
3291–3294.
Theiler, J., 1986. Spurious dimension from correlation algorithms applied
to limited time-series data. Phys. Rev., A 34 (3), 2427–2432.
Tong, F., 2003. Primary visual cortex and visual awareness. Nat. Rev.,
Neurosci. 4 (3), 219–229.
Tononi, G., Sporns, O., Edelman, G.M., 1994. A measure for brain com-
plexity: relating functional segregation and integration in the nervous
system. Proc. Natl. Acad. Sci. U. S. A. 91, 5033–5037.
Varela, F., Lachaux, J.-P., Rodriguez, E., Martinerie, J., 2001. The brain-
web: phase synchronization and large-scale integration. Nat. Rev., Neu-
rosci. 2, 229–239.
von Stein, A., Sarnthein, J., 2000. Different frequencies for different scales
of cortical integration: from local gamma to long range alpha/theta
synchronization. Int. J. Psychophysiol. 38, 301–313.
Wendling, F., Bellanger, J.J., Bartolomei, F., Chauvel, P., 2000. Relevance
of nonlinear lumped-parameter models in the analysis of depth- EEG
epileptic signals. Biol. Cybern. 83, 367–378.
Wendling, F., Bartolomei, F., Bellanger, J.J., Chauvel, P., 2001. Inter-
pretation of interdependencies in epileptic signals using a macro-
scopic physiological model of the EEG. Clin. Neurophysiol. 112,
1201–1218.