evaluation of current louisiana flexible pavement april ... · before replacing the 1993 pavement...
TRANSCRIPT
1. Report No. FHWA/LA.11/482
2. Government Accession No. 3. Recipient's Catalog No.
4. Title and Subtitle Evaluation of Current Louisiana Flexible Pavement Structures Using PMS Data and New Mechanistic-Empirical Pavement Design Guide
5. Report Date
April 2012 6. Performing Organization Code LTRC Project Number: 07-6P SIO Number: 30000120
7. Author(s)
Zhong Wu and Xiaoming Yang 8. Performing Organization Report No.
9. Performing Organization Name and Address Louisiana Transportation Research Center 4101 Gourrier Ave. Baton Rouge, LA 70808
10. Work Unit No.
11. Contract or Grant No.
12. Sponsoring Agency Name and Address
Louisiana Department of Transportation and Development P.O. Box 94245 Baton Rouge, LA 70804-9245
13. Type of Report and Period Covered
Final Report 07/2009 to 06/2011 14. Sponsoring Agency Code
15. Supplementary Notes
Conducted in Cooperation with the U.S. Department of Transportation, Federal Highway Administration
16. Abstract The new Mechanistic-Empirical Pavement Design Guide (MEPDG) developed under the National Cooperative Highway Research Program (NCHRP)
Project 1-37A represents a major change as compared to the 1993 AASHTO Pavement Design Guide. The MEPDG provides a rational pavement design
framework based on mechanistic-empirical principles to characterize the impacts of traffic, climate, and material properties on the pavement performance.
Before replacing the 1993 Pavement Design Guide (and its accompanying DARWin 3.1 design software) currently used by Louisiana Department of
Transportation and Development (LADOTD), the nationally calibrated MEPDG distress prediction models need to be further validated and calibrated
against the local conditions in Louisiana. The objectives of this study were to use the MEPDG design software (version 1.1) to evaluate the performance of
typical Louisiana flexible pavement types, materials, and structures as compared with the pavement performance data from the pavement management
system (PMS) and identify the areas for further local calibration of the MEPDG in Louisiana. In this study, a total of 40 asphalt concrete (AC) pavement
projects were strategically selected throughout Louisiana with different design traffic and subgrade properties. The selected projects included five typical
Louisiana flexible pavement structure types: AC over AC base, AC over rubblized Portland cement concrete (RPCC) base, AC over crushed stone, AC
over soil cement base, and AC over stone interlayer pavements. The original pavement structural design information as well as network-level PMS data for
the selected projects were retrieved from multiple LADOTD data sources, including the Louisiana pavement management system (LA-PMS) and other
project tracking databases. Based on the sensitivity analyses and available pavement design information, a set of Louisiana-condition-based design inputs
(i.e., materials, climate, and traffic inputs) for the MEPDG flexible pavement design was developed, and the results were stored in a database named LA-
MEPDG along with the pavement performance data retrieved from the LA-PMS for all the projects evaluated in this study. The comparison results
between the MEPDG-predicted and the LA-PMS-measured distresses indicated that the MEPDG rutting model tended to over-predict the total rutting for
AC over RPCC base, AC over crushed stone, and AC over soil cement base pavements in Louisiana. However, it seemed to be adequate for those AC over
AC base pavements selected. Meanwhile, the MEPDG load-related fatigue cracking models were found to be adequate for Louisiana’s AC over AC base,
AC over RPCC base, and AC over crushed stone pavements. However, for AC over soil cement base pavements in Louisiana, the MEPDG-predicted
fatigue cracking was considerably less than the wheel-path cracking reported in the LA-PMS. Further statistical analyses generally indicated that the
MEPDG prediction errors for both the rutting and the load-related fatigue cracking models could be significantly influenced by different design factors,
such as pavement type, traffic volume, subgrade modulus, and project location. Finally, based on the available data, a preliminary local calibration of the
MEPDG rutting model was conducted for the selected AC over RPCC base and AC over soil cement base pavements, respectively. A set of local
calibration factors was proposed for different pavement materials. On the other hand, further local calibration of the MEPDG fatigue cracking models was
recommended before using the MEPDG for the AC over soil cement based pavement design in Louisiana.
17. Key Words
Pavement design, MEPDG, PMS 18. Distribution Statement Unrestricted. This document is available through the National Technical Information Service, Springfield, VA 21161.
19. Security Classif. (of this report)
20. Security Classif. (of this page)
21. No. of Pages
16922. Price
TECHNICAL REPORT STANDARD PAGE


Project Review Committee
Each research project will have an advisory committee appointed by the LTRC Director. The
Project Review Committee is responsible for assisting the LTRC Administrator or Manager
in the development of acceptable research problem statements, requests for proposals, review
of research proposals, oversight of approved research projects, and implementation of
findings.
LTRC appreciates the dedication of the following Project Review Committee Members in
guiding this research study to fruition.
LTRC Administrator
Zhongjie “Doc” Zhang, Ph.D., P.E.
Pavement and Geotechnical Research Administrator
Members
Phil Arena, FHWA
Jeff Lambert, DOTD
Mark Chenevert, DOTD
Michael Boudreaux, DOTD
Said Ismail, DOTD
Steve Draughon, DOTD
Patrick Landry, DOTD
Don Weathers, Asphalt Paving Association
Directorate Implementation Sponsor
Richard Savoie, P.E.
DOTD Chief Engineer


Evaluation of Current Louisiana Flexible Pavement Structures using PMS
Data and New Mechanistic-Empirical Pavement Design Guide
by
Zhong Wu
Xiaoming Yang
Louisiana Transportation Research Center
4101 Gourrier Avenue
Baton Rouge, LA 70808
LTRC Project No. 07-6P
SIO No. 30000120
conducted for
Louisiana Department of Transportation and Development
Louisiana Transportation Research Center
The contents of this report reflect the views of the author/principal investigator who is
responsible for the facts and the accuracy of the data presented herein. The contents of do
not necessarily reflect the views or policies of the Louisiana Department of Transportation
and Development or the Louisiana Transportation Research Center. This report does not
constitute a standard, specification, or regulation.
April 2012

iii
ABSTRACT
The new Mechanistic-Empirical Pavement Design Guide (MEPDG) developed under the
National Cooperative Highway Research Program (NCHRP) Project 1-37A represents a
major change as compared to the 1993 AASHTO Pavement Design Guide. The MEPDG
provides a rational pavement design framework based on mechanistic-empirical principles to
characterize the impacts of traffic, climate, and material properties on the pavement
performance. Before replacing the 1993 Pavement Design Guide (and its accompanying
DARWin 3.1 design software) currently used by Louisiana Department of Transportation and
Development (LADOTD), the nationally calibrated MEPDG distress prediction models need
to be further validated and calibrated against the local conditions in Louisiana.
The objectives of this study were to use the MEPDG design software (version 1.1) to
evaluate the performance of typical Louisiana flexible pavement types, materials, and
structures as compared with the pavement performance data from the pavement management
system (PMS) and identify the areas for further local calibration of the MEPDG in Louisiana.
In this study, a total of 40 asphalt concrete (AC) pavement projects were strategically
selected throughout Louisiana with different design traffic and subgrade properties. The
selected projects included five typical Louisiana flexible pavement structure types: AC over
AC base, AC over rubblized Portland cement concrete (RPCC) base, AC over crushed stone,
AC over soil cement base, and AC over stone interlayer pavements. The original pavement
structural design information as well as network-level PMS data for the selected projects
were retrieved from multiple LADOTD data sources, including the Louisiana pavement
management system (LA-PMS) and other project tracking databases. Based on the sensitivity
analyses and available pavement design information, a set of Louisiana-condition-based
design inputs (i.e., materials, climate, and traffic inputs) for the MEPDG flexible pavement
design was developed, and the results were stored in a database named LA-MEPDG along
with the pavement performance data retrieved from the LA-PMS for all the projects
evaluated in this study.
The comparison results between the MEPDG-predicted and the LA-PMS-measured
distresses indicated that the MEPDG rutting model tended to over-predict the total rutting for
AC over RPCC base, AC over crushed stone, and AC over soil cement base pavements in
Louisiana. However, it seemed to be adequate for those AC over AC base pavements
selected. Meanwhile, the MEPDG load-related fatigue cracking models were found to be
adequate for Louisiana’s AC over AC base, AC over RPCC base, and AC over crushed stone
pavements. However, for AC over soil cement base pavements in Louisiana, the MEPDG-

iv
predicted fatigue cracking was considerably less than the wheel-path cracking reported in the
LA-PMS.
Further statistical analyses generally indicated that the MEPDG prediction errors for both the
rutting and the load-related fatigue cracking models could be significantly influenced by
different design factors, such as pavement type, traffic volume, subgrade modulus, and
project location.
Finally, based on the available data, a preliminary local calibration of the MEPDG rutting
model was conducted for the selected AC over RPCC base and AC over soil cement base
pavements, respectively. A set of local calibration factors was proposed for different
pavement materials. On the other hand, further local calibration of the MEPDG fatigue
cracking models was recommended before using the MEPDG for the AC over soil cement
based pavement design in Louisiana.

v
ACKNOWLEDGMENTS
This study was supported by the Louisiana Transportation Research Center (LTRC) and the
Louisiana Department of Transportation and Development (LADOTD) under State Project
Number 136-99-1649 and LTRC Research Project Number 07-6P. The authors would like to
express thanks to all those who provided valuable help in this study. Specifically, Shashikant
Shah and Xingwei Chen from LADOTD provided great help in understanding LADOTD
databases and the project selection. Glenn Chustz from LADOTD helped convert the
Tracking of Projects (TOPS) database into an Access file. Christophe Fillastre from
LADOTD provided the latest copy of the PMS data. Mitchell Terrell, Shawn Elisar, and Ben
Hays from LTRC collected the additional pavement performance data and helped in the data
analysis.


vii
IMPLEMENTATION STATEMENT
This study provides a pilot evaluation of the current version MEPDG software (Version 1.1)
based on performance of typical flexible pavement structures in Louisiana. The outcomes
from this study provide valuable information for pavement design engineers when using the
newly released DARWin-ME software. Some of the MEPDG input data developed in this
study, such as the E* master curves for typical Louisiana hot mix asphalt (HMA) mixtures
and the local rutting calibration factors, can be used directly by the Department as initial
input trials when implementing the DARWin-ME.
It is realized that this research work is based on the data currently available within the
Department and some of the data may have deficiencies for model calibration purposes.
Also, some of the models in the current version MEPDG software need to be recalibrated
nationwide as indicated by other research work and also confirmed by this research study.
Therefore, the current version MEPDG software should be used only as a design comparison
tool to LADOTD’s currently used pavement design method (DARWin 3.1) until further
improvement is made on the software models and input data, as the result of the completion
of on-going research both nationally and by LTRC. Careful engineering judgment is needed
when large discrepancies exist in the design thickness results from the current version
MEPDG and the DARWin 3.1 design method.

ix
TABLE OF CONTENTS
ABSTRACT ............................................................................................................................. iii
ACKNOWLEDGMENTS .........................................................................................................v
IMPLEMENTATION STATEMENT .................................................................................... vii
TABLE OF CONTENTS ......................................................................................................... ix
LIST OF TABLES ................................................................................................................... xi
LIST OF FIGURES ............................................................................................................... xiii
INTRODUCTION .....................................................................................................................1
Problem Statement ........................................................................................................ 1 Introduction of the MEPDG .......................................................................................... 1
Development of the MEPDG ............................................................................ 1 Approach of the MEPDG.................................................................................. 2 Hierarchical Design Inputs ............................................................................... 4
HMA-surfaced Pavements in the MEPDG [1] ................................................. 4 Literature Review.......................................................................................................... 9
Arizona [3]...................................................................................................... 10
Arkansas [4], [5] ............................................................................................ 10 Iowa [6] .......................................................................................................... 11
Kansas [2] ....................................................................................................... 11 Michigan [7] ................................................................................................... 11 Minnesota [8].................................................................................................. 12
Montana [9] .................................................................................................... 12
New Jersey [10] .............................................................................................. 12 North Carolina [11] ........................................................................................ 13 Ohio [12] ........................................................................................................ 13
Texas [13], [14] .............................................................................................. 13 Virginia [15] ................................................................................................... 14
Washington [16] ............................................................................................. 14 Wisconsin [17]................................................................................................ 14 Summary ......................................................................................................... 14
Louisiana Pavement Management System ................................................................. 15
Other LADOTD Databases ......................................................................................... 16 Tracking of Projects (TOPS) .......................................................................... 17 Highway Need System (TAND) ..................................................................... 18
Materials Testing System (MATT) ................................................................. 18 Traffic Counts ADT (TATV).......................................................................... 19 Content Manager ............................................................................................. 19
OBJECTIVE ............................................................................................................................21
SCOPE .....................................................................................................................................23
METHODOLOGY ..................................................................................................................25
Step 1 – Identify Typical Flexible Pavement Structures in Louisiana........................ 25 Step 2 – Determine the Input Strategy ........................................................................ 28
Initial IRI ......................................................................................................... 28

x
Traffic Level ................................................................................................... 29
Climate ............................................................................................................ 29 Pavement Structure ......................................................................................... 30 Materials ......................................................................................................... 31
Step 3 – Construct the LA-MEPDG Database ............................................................ 32 Step 4 – Interpret the LA-PMS Data........................................................................... 33
Identify Irregularities in LA-PMS Data .......................................................... 33 Calculate the Mean and Variation of Distress (or IRI) ................................... 34
Step 5 – Validate the MPEDG using LA-PMS data ................................................... 35
Step 6 – Calibrate the Rutting Models ........................................................................ 37 DISCUSSION OF RESULTS .................................................................................................39
Validate the MEPDG with LA-PMS Data .................................................................. 39
AC over AC Base Pavement ........................................................................... 39
AC over RPCC Base Pavement ...................................................................... 45
AC over Crushed Stone Pavement .................................................................. 51 AC over Soil Cement Base Pavement ............................................................ 59
AC over Stone Interlayer Pavement ............................................................... 68 ANOVA and Multiple Comparisons .......................................................................... 70
The Effect of Pavement Type ......................................................................... 70 Effect of Traffic Volume ................................................................................ 73 Effect of Subgrade Modulus ........................................................................... 75
Effect of Location ........................................................................................... 76 Local Calibration Factors for the Rutting Models ...................................................... 78
Design Example of Using MEPDG ............................................................................ 80 CONCLUSIONS......................................................................................................................85
RECOMMENDATIONS .........................................................................................................87
ACRONYMS, ABBREVIATIONS, AND SYMBOLS ..........................................................89
REFERENCES ........................................................................................................................91
APPENDIX ..............................................................................................................................93
APPENDIX A ..........................................................................................................................95
Default Axle Load Distribution Factors for Louisiana ............................................... 95
APPENDIX B ..........................................................................................................................99
Default AC Materials Inputs for Louisiana ................................................................ 99 APPENDIX C ........................................................................................................................107
LA-MEPDG Database .............................................................................................. 107
APPENDIX D ........................................................................................................................110
Detailed Information about the Selected Projects ..................................................... 110

xi
LIST OF TABLES
Table 1 Selected projects ........................................................................................................ 27
Table 2 Traffic inputs used in this study ................................................................................. 29
Table 3 Pavement structures of the selected projects ............................................................. 30
Table 4 Pavement structures of the selected AC over AC base pavements ............................ 39
Table 5 Hypothesis analysis (rutting, AC over AC base pavement) ...................................... 42
Table 6 Hypothesis analysis (IRI, AC over AC base pavement) ............................................ 45
Table 7 Pavement structures of the selected AC over RPCC base pavements ....................... 46
Table 8 Hypothesis analysis (rutting, AC over RPCC base pavement) .................................. 49
Table 9 Hypothesis analysis (IRI, AC over RPCC base pavement) ....................................... 50
Table 10 Pavement structures of the selected AC over crushed stone pavements ................. 52
Table 11 Hypothesis analysis (fatigue cracking, AC over crushed stone pavement) ............. 54
Table 12 Hypothesis analysis (rutting, AC over crushed stone pavement) ............................ 56
Table 13 Hypothesis analysis (IRI, AC over crushed stone pavement) ................................. 58
Table 14 Pavement structures of the selected AC over soil cement base pavements ............. 60
Table 15 Hypothesis analysis (fatigue cracking, AC over soil cement base pavement) ........ 63
Table 16 Hypothesis analysis (rutting, AC over soil cement base pavement) ........................ 65
Table 17 Hypothesis analysis (IRI, AC over soil cement base pavement) ............................. 67
Table 18 ANOVA result on the error of the fatigue cracking prediction for different types of
pavement .................................................................................................................. 71
Table 19 Result of multiple comparisons (Fisher’s LSD, α=0.05) ......................................... 72
Table 20 ANOVA result on the error of the total rutting prediction for different types of
pavement .................................................................................................................. 72
Table 21 Result of multiple comparisons (Fisher’s LSD, α=0.05) ......................................... 73
Table 22 T-test result on the error of the MEPDG rutting model ........................................... 74
Table 23 T-test result on the error of the MEPDG load-related fatigue cracking model ....... 74
Table 24 T-test result on the error of the MEPDG rutting model ........................................... 76
Table 25 T-test result on the error of the MEPDG load-related fatigue cracking model ....... 76
Table 26 T-test result on the error of the MEPDG rutting model ........................................... 78
Table 27 T-test result on the error of the MEPDG load-related fatigue cracking model ....... 78
Table 28 Local calibration factors for the AC and subgrade rutting models .......................... 79
Table 29 Summary of the AASHTO 1993 design .................................................................. 80
Table 30 Input information for the MEPDG........................................................................... 81
Table 31 Number of axles per truck in Louisiana ................................................................... 95
Table 32 Level-3 input parameters for AC ............................................................................. 99
Table 33 Default AC material input parameters for typical AC mixtures in Louisiana ....... 104

xii
Table 34 Tables in LA-MEPDG database ............................................................................ 107
Table 35 Queries in LA-MEPDG database .......................................................................... 108

xiii
LIST OF FIGURES
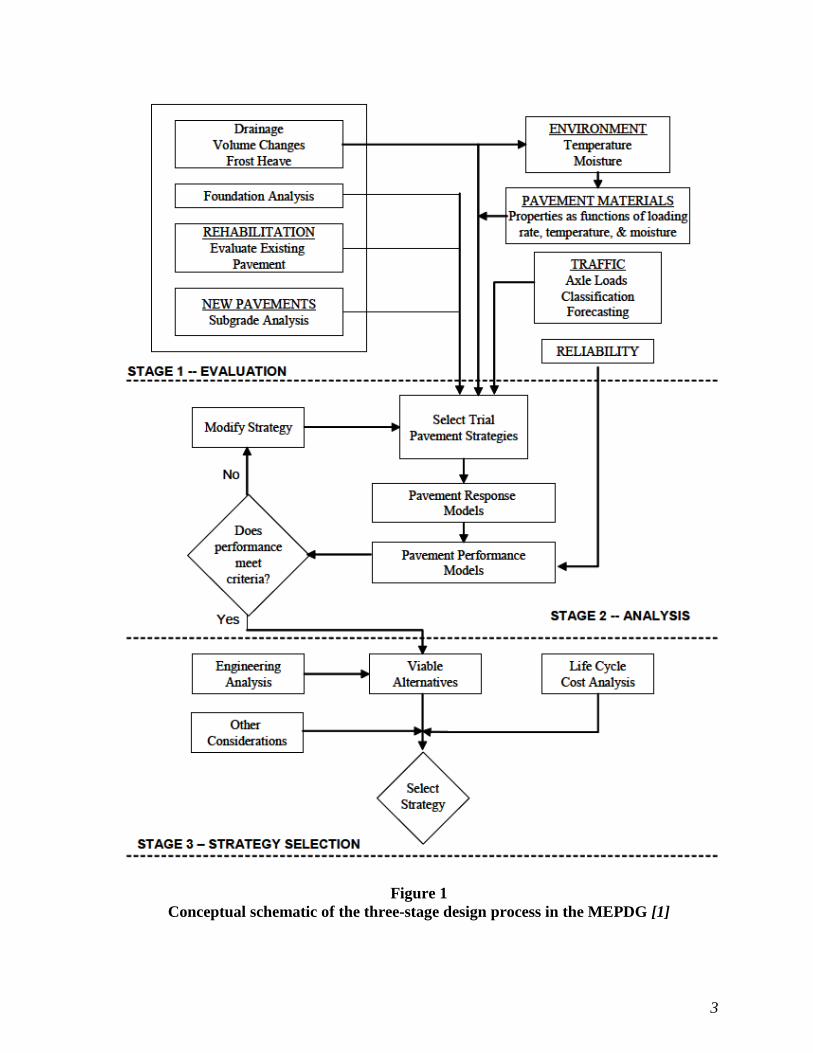
Figure 1 Conceptual schematic of the three-stage design process in the MEPDG [1] ............. 3
Figure 2 Different definitions in cracking between the LA-PMS and the LTPP.................... 16
Figure 3 Engineering applications menu in the Mainframe .................................................... 17
Figure 4 TOPS database in the Mainframe ............................................................................. 17
Figure 5 TAND database in the Mainframe ........................................................................... 18
Figure 6 MATT database in the Mainframe ........................................................................... 18
Figure 7 TATV database in the Mainframe ............................................................................ 19
Figure 8 Typical flexible pavement structures in Louisiana ................................................... 26
Figure 9 Locations of the selected projects (maps.google.com) ............................................. 28
Figure 10 Predicted distress by MEPDG vs. measured distress in PMS for project 019-05-
0025: (a) fatigue cracking, (b) rutting, and (c) IRI ................................................. 40
Figure 11 Predicted mean rutting by MEPDG vs. measured mean rutting in LA-PMS (AC
over AC base pavement) ........................................................................................ 42
Figure 12 Field variation of rutting vs. MEPDG design reliability (AC over AC base
pavement) ............................................................................................................... 43
Figure 13 Predicted mean IRI by MEPDG vs. measured mean IRI in LA-PMS (AC over AC
base pavement) ....................................................................................................... 44
Figure 14 Field variation of IRI vs. MEPDG design reliability (AC over AC base
pavement) ............................................................................................................... 44
Figure 15 Predicted distress by MEPDG vs. measured distress in PMS for project 450-04-
0065: (a) fatigue cracking, (b) rutting, and (c) IRI ................................................. 47
Figure 16 Predicted mean rutting by MEPDG vs. measured mean rutting in LA-PMS (AC
over RPCC base pavement) .................................................................................... 48
Figure 17 Field variation of rutting vs. MEPDG design reliability (AC over RPCC base
pavement) ............................................................................................................... 49
Figure 18 Predicted mean IRI by MEPDG vs. measured mean IRI in LA-PMS (AC over
RPCC base pavement) ............................................................................................ 50
Figure 19 Field variation of IRI vs. MEPDG design reliability (AC over RPCC base
pavement) ............................................................................................................... 51
Figure 20 Predicted distress by MEPDG vs. measured distress in PMS for project 230-03-
0022: (a) fatigue cracking, (b) rutting, and (c) IRI ................................................. 53
Figure 21 Predicted mean fatigue cracking by MEPDG vs. measured mean fatigue cracking
in LA-PMS (AC over crushed stone pavement) .................................................... 54
Figure 22 Field variation of fatigue cracking vs. MEPDG design reliability (AC over Stone
pavement) ............................................................................................................... 55

xiv
Figure 23 Predicted mean rutting by MEPDG vs. measured mean rutting in LA-PMS (AC
over crushed stone pavement) ................................................................................ 56
Figure 24 Field variation of rutting vs. MEPDG design reliability (AC over crushed stone
pavement) ............................................................................................................... 57
Figure 25 Predicted mean IRI by MEPDG vs. measured mean IRI in LA-PMS (AC over
crushed stone pavement) ........................................................................................ 58
Figure 26 Field variation of IRI vs. MEPDG design reliability (AC over crushed stone
pavement) ............................................................................................................... 59
Figure 27 Predicted distress by MEPDG vs. measured distress in PMS for project 803-32-
0001: (a) fatigue cracking, (b) rutting, and (c) IRI ................................................. 61
Figure 28 Predicted mean fatigue cracking by MEPDG vs. measured mean fatigue cracking
in LA-PMS (AC over soil cement base pavement) ................................................ 63
Figure 29 Field variation of fatigue cracking vs. MEPDG design reliability (AC over soil
cement base pavement) .......................................................................................... 64
Figure 30 Predicted mean rutting by MEPDG vs. measured mean rutting in LA-PMS (AC
over soil cement base pavement) ............................................................................ 65
Figure 31 Field variation of rutting vs. MEPDG design reliability (AC over soil cement base
pavement) ............................................................................................................... 66
Figure 32 Predicted mean IRI by MEPDG vs. measured mean IRI in LA-PMS (AC over soil
cement base pavement) .......................................................................................... 67
Figure 33 Field variation of IRI vs. MEPDG design reliability (AC over soil cement base
pavement) ............................................................................................................... 68
Figure 34 Predicted distress by MEPDG vs. measured distress in PMS for project 219-30-
0012: (a) fatigue cracking, (b) rutting, and (c) IRI ................................................. 69
Figure 35 Mean residual error of fatigue cracking prediction for different types of
pavement ................................................................................................................ 71
Figure 36 Mean residual error of total rutting prediction ....................................................... 73
Figure 37 Pavement types in each category: (a) low to medium volume, (b) high volume ... 75
Figure 38 Division of the two geographic regions in Louisiana (courtesy of
www.geology.com) ................................................................................................ 77
Figure 39 Local calibration of the rutting model .................................................................... 79
Figure 40 Predicted alligator cracking by the MEPDG .......................................................... 82
Figure 41 Predicted longitudinal cracking by the MEPDG .................................................... 82
Figure 42 Predicted rutting by the MEPDG ........................................................................... 83
Figure 43 Predicted IRI by the MEPDG ................................................................................. 83
Figure 44 Comparison of designed pavement structures by the AASHTO 1993 guide and the
MEPDG .................................................................................................................. 84

xv
Figure 45 Single axle load spectrum: (a) TTC1, (b) TTC3, (c) TTC12, (d) MEPDG
default ..................................................................................................................... 96
Figure 46 Tandem axle load spectrum: (a) TTC1, (b) TTC3, (c) TTC12, (d) MEPDG
default ..................................................................................................................... 97
Figure 47 Tridem axle load spectrum: (a) TTC1, (b) TTC3, (c) TTC12, (d) MEPDG
default ..................................................................................................................... 98
Figure 48 Changing the cumulative % retained on ¾ in. sieve ............................................ 100
Figure 49 Changing the cumulative % retained on 3/8 in. sieve .......................................... 100
Figure 50 Changing the cumulative % retained on #4 sieve ................................................ 101
Figure 51 Changing the cumulative % passing #200 sieve .................................................. 101
Figure 52 Changing the asphalt binder type ......................................................................... 102
Figure 53 Changing the effective binder content .................................................................. 102
Figure 54 Changing the air void ........................................................................................... 103
Figure 55 Representative master curve for PG 76-22 AC (based on 16 sample master curves,
including 8 wearing course mixtures and 8 binder course mixtures) ................... 104
Figure 56 Representative master curve for PG 70-22 AC (based on 15 sample master curves,
including 8 wearing course mixtures and 7 binder course mixtures) ................... 105
Figure 57 Representative master curve for PG 64-22 AC (based on 7 sample master curves,
all from base course mixtures) ............................................................................. 105
Figure 58 Representative master curve for PAC-40 AC (based on 18 sample master curves,
including 9 wearing course mixtures and 9 binder course mixtures) ................... 106
Figure 59 Representative master curve for AC-30 (and PAC-30) ........................................ 106
Figure 60 Structure of the LA-MEPDG database ................................................................. 108


INTRODUCTION
Problem Statement
LADOTD is currently using the 1993 AASHTO Pavement Design Guide. This design guide
was developed based on the AASHO Road Test completed in 1960. Due to its empirical
characteristics as well as other limitations, the 1993 design guide cannot account for the
rapidly developing pavement structure and traffic conditions today. The new MEPDG
developed under the NCHRP Project 1-37A represents a major change as compared to the
1993 design guide. The MEPDG provides a rational framework to consider the impact of
traffic, climate, and material properties on pavement performance. It is expected to replace
the 1993 pavement design in the near future. LADOTD is currently following the national
trend in the implementation of the MEPDG.
The successful use of the MEPDG in Louisiana requires evaluation and, if necessary,
calibration of the design model against local conditions. Ideally, the Long-Term Pavement
Performance (LTPP) database should be used in the local evaluation and calibration because
it has project-level information on pavement performance, traffic, and material properties.
Unfortunately, Louisiana has very few LTPP sites and none of them was included in the
national calibration. An alternative data source for the local evaluation and calibration of the
MEPDG is the network-level pavement performance data stored in the Louisiana Pavement
Management System (LA-PMS). Some of the MEPDG input information about traffic,
pavement structure, and material are available in other LADOTD databases (e.g., Content
Manager, Mainframe, etc.). LTRC has recently sponsored several completed and on-going
research projects to investigate the typical traffic and materials characteristics in Louisiana.
Some of the results from these studies can fill the gap between the available information and
the required input information by the MEPDG.
In this study, the network-level information available from the LA-PMS and other sources
(LTRC studies, LADOTD databases, etc.) were used to evaluate the new MEPDG for local
implementation in Louisiana.
Introduction of the MEPDG
Development of the MEPDG
The 1972, 1986, and 1993 versions of AASHTO Guide for Design of Pavement Structures are
based on empirical performance equations developed using 1960s’ AASHO Road Test data.
The 1986 and 1993 AASHTO design guides contain some refinements in material input,
design reliability, and empirical procedures for rehabilitation design. The NCHRP Project 1-

2
37A was sponsored by the AASHTO Joint Task Force on Pavements, NCHRP, and the
Federal Highway Administration (FHWA) to develop a mechanistic-empirical pavement
design procedure. The MEPDG was released to the public for review and evaluation in 2004.
A formal review of the MEPDG was conducted under NCHRP Project 1-40A. The Project 1-
40D resulted in version 1.0 of the MEPDG software and an updated design guide document.
The version 1.0 of the software was submitted to the NCHRP, FHWA, and AASHTO in
April 2007 for further consideration as an AASHTO provisional standard. To the date of this
report, the current version of the MEPDG design software is version 1.1.
Approach of the MEPDG
Pavement design using the MEPDG is an iterative process – the outputs of the design are
pavement distresses and smoothness, not layer thicknesses. The design approach consists of
three major stages, as shown in Figure 1.
Stage 1 consists of the development of input values for the analysis. During this stage,
potential strategies are identified for consideration in the analysis stage. A key step of this
process is the foundation analysis. The pavement material characterization and traffic input
data are developed as well. The Enhanced Integrated Climate Model (EICM) is used to
model temperatures and moistures within each pavement layer and the subgrade. Stage 2 of
the design process is the structural/performance analysis. The analysis approach is an
iterative one that begins with the selection of an initial trial design. If the trial design does not
meet the performance criteria, modifications have to be made and the analyses are re-run
until a satisfactory result is obtained. Stage 3 of the process includes activities required to
evaluate the structurally viable alternatives. These activities include the engineering analysis
and the life cycle cost analysis of the design alternatives.
One of the fundamental differences between the 1993 AASHTO guide and the MEPDG is
that the 1993 AASHTO guide only evaluates one performance indicator (Pavement Service
Index, PSI) while the MEPDG predicts multiple performance indicators and provides a direct
tie among materials, structural design, construction, climate, traffic, and pavement
management systems.
3
Figure 1
Conceptual schematic of the three-stage design process in the MEPDG [1]

4
Hierarchical Design Inputs
The hierarchical approach to design inputs is a unique feature of the MEPDG. This approach
is employed with regard to traffic, materials, and environmental inputs. Level-1 inputs
provide the highest level of accuracy. It would typically be used for designing heavily
trafficked pavements or wherever there is dire safety or economic consequences of early
failure. Level-1 inputs require laboratory/field testing, site-specific axle load spectra data
collection, and nondestructive deflection testing. Level-2 inputs provide an intermediate level
of accuracy and would be closest to the typical procedure used with earlier editions of the
AASHTO design guide. This level could be used when resources or testing equipments are
not available for tests required for Level-1. Level-3 inputs provide the lowest level of
accuracy. This level might be used for design where there are minimal consequences of early
failure (e.g., lower volume roads). Inputs may be user-selected values or typical average for
the region.
HMA-surfaced Pavements in the MEPDG [1]
In the MEPDG, the HMA-surfaced pavement types include: conventional flexible pavements,
deep strength flexible pavements, full-depth HMA pavements, semi-rigid pavements, full
depth reclamation (in-place pulverization of conventional flexible pavements), and HMA
overlays.
Performance indicators and the corresponding transfer functions for HMA-surfaced
pavements are introduced as follows:
Load-related Fatigue Cracking. Load-related fatigue cracking is the cracking in the
AC layer that is caused by the repeated traffic load. In the MEPDG, two types of load-related
fatigue cracking are predicted for flexible pavements: bottom-up cracking (sometimes also
referred as alligator cracking) and top-down cracking. The allowable number of axle-load
applications needed for the incremental damage index approach to predict both types of load-
related fatigue cracking is:
(1)
where,
= Allowable number of axle-load applications for a flexible pavement and HMA
overlays;
= Tensile strain at critical locations and calculated by the structural response
model, in./in.;
= Dynamic modulus of the HMA measured in compression, psi;
5
= Global field calibration parameters ( = 0.007566, = -3.9492, = -
1.281);
= Local or mixture specific field calibration constants; for the global calibration
effort, these constants were set to 1.0;
=
= Effective asphalt content by volume, percent;
= Percent of air voids in the HMA mixture; and
= Thickness correction term, dependent on type of cracking.
For bottom-up cracking:
For top-down cracking:
= Thickness of HMA layer
The MEPDG calculates the amount of fatigue cracking of each type by the cumulative
damage index . The cumulative damage index is determined by summing up the
incremental damage indices over time, as shown in Equation (2).
(2)
where,
= Actual number of axle load applications within a specific time period;
= Axle load interval;
= Axle load type (single, tandem, tridem, quad, or special axle configuration);
= Truck type using the truck classification groups included in the MEPDG;
= Month; and
= Median temperature for the five temperature intervals or quintiles used to
subdivide each month.
Bottom-up cracking is the fatigue cracking that initiates from the bottom of the of the HMA
layer. It starts as a few short longitudinal or transverse cracks in the early stage and will

6
develop into interconnected cracks with a chicken wire/alligator pattern. The unit for
alligator cracking in the MEPDG is the percentage of total lane area.
The transfer function for bottom-up alligator cracking in the MEPDG is:
(3)
where,
= area of alligator cracking, percentage of total lane area;
= cumulative damage index of alligator cracking;
= transfer function regression constants, = 1.00, = 1.00, = 6,000,
=
; and
=
.
Top-down cracking is another form of fatigue cracking that initiates at the surface of the
HMA layer. It is often parallel to the pavement longitudinal centerline and does not develop
into an alligator pattern. The unit for top-down cracking in the MEPDG is feet per mile.
The transfer function for top-down cracking in the MEPDG is:
(4)
where,
= length of longitudinal cracking, ft./mi.;
= cumulative damage index of longitudinal cracking; and
= transfer function regression constants, = 7.0, = 3.5, = 1,000.
Transverse Cracking (Thermal Cracking). Transverse cracking is a non-load-
related cracking, which is usually caused by low temperature or thermal cycling. The unit for
transverse cracking in the MEPDG is feet per mile.
The transfer function for transverse cracking in the MEPDG is:
(5)

7
where,
= amount of thermal cracking, ft./mi.;
= regression coefficient determined through global calibration (= 400);
= standard normal distribution evaluated at ;
= standard deviation of the log of the depth of cracks in the pavement (= 0.769
in.);
= crack depth, in.; and
= thickness of HMA layers.
Rutting (Rut Depth). Rutting is caused by permanent deformation developed in
different pavement layers. Rut depth is defined as the maximum difference in elevation
between the transverse profile of the HMA surface and a wire-line across the lane width. The
unit for rut depth in the MEDPG is inches.
The transfer function for the AC layer is:
(6)
where,
= accumulated permanent or plastic vertical deformation in the HMA
layer/sublayer, in.;
= accumulated permanent or plastic axial strain in the HMA layer/sublayer,
in./in.;
= Resilient or elastic strain calculated by the structural response model at the mid-
depth of each HMA sublayer, in./in.;
= Thickness of the HMA layer/sublayer, in.;
= Number of axle-load repetitions;
= Mix or pavement temperature, °F;
= Depth confinement factor;
;
;
;
= depth below the surface, in.;
= Total HMA thickness, in.;
= Global field calibration constants ( = -3.35412, = 0.4791, = 1.5606);
and

8
= Local or mixture field calibration constants; for the global calibration, these
constants were all set to 1.0.
The transfer function for rutting of the unbound layers is:
(7)
where,
= Permanent or plastic deformation for the layer/sublayer, in.;
= Number of axle-load repetitions;
= Intercept determined from laboratory repeated load permanent deformation
tests, in./in.;
= Resilient strain imposed in laboratory test to obtain material properties
, and , in./in.;
= Average vertical resilient or elastic strain in the layer/sublayer and calculated by
the structural response model, in./in.;
= Thickness of the unbound layer/sublayer, in.;
= Global calibration coefficients; = 1.673 for granular materials and 1.35 for
fine-grained materials;
= Local calibration constant for the rutting in the unbound layers; the local
calibration constant was set to 1.0 for the global calibration effort;
= ;
water content, percentage; and
=
.
Smoothness. International Roughness Index (IRI) is used to define the pavement
smoothness in the MEPDG. The unit for IRI is in./mi. In the MEPDG, IRI is calculated based
on an empirical function of other pavement distresses. The equation for calculating IRI in
new flexible pavements is:
(8)
where,
= initial IRI after construction, in./mi.;
= site factor;

9
= pavement age, years,
= plastic index of the soil,
= average annual freezing index, degree F-days, and
= average annual precipitation or rainfall, in.
= area of fatigue cracking (combined alligator, longitudinal, and reflection
cracking in the wheel path), percent of total lane area, (longitudinal cracking is
multiplied by 1-ft. to convert to an area basis);
= length of transverse cracking, ft./mi.; and
= average rut depth, in.
Literature Review
After first released in 2004, a large number of studies were conducted by state agencies on
the local implementation of the MEPDG. Common investigation issues include: development
of the local input strategy (traffic, materials, etc.), sensitivity of inputs, local evaluation and
calibration, and comparison of the MEPDG with the previous design methods (e.g., 1993
design guide). Due to the limited scope of this study, a literature review was conducted with
an emphasis on the local validation and calibration of the MEPDG.
AASHTO recently published a guideline on performing a local calibration of the MEPDG
[2]. According to the guideline, three types of roadway segments can be used in the local
validation and calibration: (1) long-term full-scale roadway segments (LTPP and PMS), (2)
APT sections with simulated truck loadings, and (3) APT sections with full-scale truck
loadings. Preferably, Long-term full-scale roadway segments should be used to fully validate
and calibrate the distress prediction models in the MEPDG. APT sections can be used in
local validation and calibration as a supplement to the LTPP or PMS data, but cannot be used
alone to evaluate the error of the estimate. When using PMS segments, the AASHTO
guideline recommends either performing pavement condition surveys according to LTPP
Distress Identification Manual or, as many agencies may prefer, adjusting the PMS distress
data to be consistent with the MEPDG distress definitions [2].
Many states have sponsored studies on local validation and calibration of the MEPDG. In
lieu of the LTPP sites, some states have used PMS data as a supplement. The methodologies
and the key findings/experiences of these studies are summarized next.

10
Arizona [3]
Data collected from 39 LTPP segments were used in the local calibration of the MEPDG.
Daily traffic and vehicle classification distribution were obtained from Arizona DOT PMS.
Arizona default axle load spectra developed from previous studies were adopted. Level-3
materials inputs were used. Subgrade moduli obtained from a local empirical correlation
were compared with the MEPDG default values. In analyzing the rutting model, the
predicted percentages of total rutting contributed by each layer were used to distribute the
total measured rutting to each layer. With the national calibration, the MEPDG under-
predicted the AC and subgrade rutting but over-predicted the granular base rutting.
Meanwhile, it was found that the MEPDG under-predicted the bottom-up cracking but over-
predicted the top-down cracking.
Arkansas [4], [5]
Wang et al. developed a database to store and process climate, traffic, material, and
performance data for supporting the MEPDG in the state of Arkansas [4]. The database
contained five categories of data similar to the data types in the MEPDG software: general
information, climate, traffic, materials, and performance. The climate hourly data for the
climate module were from 16 weather stations in Arkansas and 22 weather stations in six
bordering states from the National Climatic Data Center (NCDC). For water table depth data,
34,015 test points at 552 water table depth testing locations in all 75 counties in Arkansas
were collected from the National Water Information System online database. For traffic data,
there were 79 automated continuous traffic data collection sites in Arkansas, among which 55
data collection sites were based on Weigh-in-Motion (WIM). For the materials module,
several research projects were conducted to determine the dynamic modulus (E*) for asphalt
concrete (AC), coefficient of thermal expansion (CTE) for Portland cement concrete (PCC),
and resilient modulus (Mr) for unbound base, sub-base and subgrade. The LTPP database
was one of data sources used as well.
Hall et al. reported a local validation and calibration study using 26 LTPP and PMS segments
with flexible pavements [5]. Daily traffic volume information was available in the PMS.
Site-specific vehicle classification distribution was available for some projects in the PMS;
otherwise, the MPEDG default values were selected based on the truck traffic classification
(TTC) of the roadway. Axle load spectra were adopted from a previous study. Level-3
materials inputs were used. The predicted and measured fatigue cracking showed a poor
correlation. The MEPDG slightly over-predicted the subgrade rutting and under-predicted the
AC rutting.
11
Iowa [6]
In this study, PMS data were used in the local validation of the MEPDG in Iowa. New
flexible, new rigid, and overlaid pavement types were studied. Five PMS segments were
selected for the new flexible pavement type. Only daily truck traffic information was
available from the PMS. Other traffic inputs were either default values or the best estimated
values. Typical materials properties in Iowa were adopted from previous studies. Pavement
distress data were checked for irregularities. Only IRI and rutting models were validated for
flexible pavement type. The results showed that the MEPDG slightly over-predicted the total
rutting. The measured and predicted IRI were in good agreement.
Kansas [2]
This work was presented in the AASHTO local calibration guideline as a demonstration of
using PMS data to validate and calibrate the MEPDG [2]. Sixteen PMS segments were used
in the analysis. Default traffic inputs were used with the exception of operation speed,
number of lanes, traffic growth, vehicle classification distribution, and average annual daily
truck traffic (AADTT). Level-2 and Level-3, mostly Level-3, materials inputs were used
since Level-1 materials inputs were unavailable in the PMS. The Kansas PMS does not
distinguish between bottom-up and top-down cracking. The MEPDG predicted load-related
fatigue cracking (bottom-up and top-down cracking) was combined to compare with the
measured fatigue cracking in the PMS. Comparisons between the predicted and measured
performance showed that the bias of the rutting model in the MEPDG seems acceptable for
new flexible pavement, although the MEPDG over-predicted the rutting for HMA overlay
pavements. Comparison also showed that the MEPDG consistently under-predicted the load-
related fatigue cracking.
Michigan [7]
This study evaluated the feasibility of the MPEDG for local use in Michigan. Both flexible
and rigid pavements were evaluated. For flexible pavements, a sensitivity analysis of inputs
was first conducted. Eleven design and materials inputs were identified as having significant
effects on the predicted pavement performance. Field performance of eight LTPP segments
and five PMS segments were compared with the MEPDG-predicted performance. Traffic
inputs associated with PMS segments were collected from the closest WIM station. Level-3
materials inputs were used and many materials properties were assumed or estimated.
Comparisons from LTPP segments indicated that the MEPDG reasonably well predicted
bottom-up and top-down cracking, and IRI. However, the MEPDG over-predicted transverse
cracking and rutting. Comparisons from PMS segments showed some discrepancies. An
irregular trend (distress reduced without any maintenance records) was found in the PMS

12
data in some segments. The IRI model was not used since the initial IRI for the segments
were not recorded.
Minnesota [8]
A number of issues regarding the local implementation of the MEPDG in Minnesota were
investigated, including sensitivity of inputs, run-time issues with the software, and local
recalibration of the prediction models. A total of 13 MnROAD segments were used in the
local validation of the MEPDG for flexible pavements. Traffic, pavement structure, and
materials inputs were all from the MnROAD database. Previous trench tests revealed that
rutting in MnROAD segments happened mostly in the AC layer. However, the MEPDG
predicted considerable rutting in the unbound layers especially for the first month of
pavement life. Researchers proposed to modify the MEPDG rutting model by subtracting the
predicted rutting in the unbound layers in the first month. The modified rutting model
showed an improved prediction power. Since no alligator cracking was observed from the
selected segments, the alligator cracking model was calibrated against the MnPave software.
The transverse cracking model in the MEPDG under-predicted the field transverse cracking
for all segments.
Montana [9]
This study was sponsored by Montana DOT to develop the local calibration factors for
flexible pavements. A total of 89 LTPP and PMS segments from Montana and adjacent states
were selected. A calibration database was created. Initial daily traffic volume was back-
calculated from the measured traffic during the service life. Other traffic inputs were taken as
either MEPDG default or Montana default values. The validation results showed that the
MEPDG over-predicted the alligator cracking for new and in-place pulverized flexible
pavements while it under-predicted the alligator cracking for HMA-overlay pavements. Poor
correlation was found between the measured and predicted longitudinal top-down cracking
although the bias was low. The MEPDG generally over-predicted the transverse cracking of
flexible pavements in Montana.
New Jersey [10]
Mehta et al. presented the implementation of the MEPDG using Level-3 inputs for the state
of New Jersey [10]. The data were collected from LTPP, PaveView, and HPMA databases.
A case-by-case comparison was conducted between predicted and measured performance
data for every section and each distress, such as rutting, load-related fatigue cracking,
transverse cracking, and roughness.

13
North Carolina [11]
In this study, pavement performance data from 30 LTPP segments and 23 PMS segments in
North Carolina were used to validate and calibrate the MEPDG. These LTPP segments were
not included in the national calibration. Only the alligator cracking model and the rutting
model were studied. Traffic inputs for each segment were collected from nearby WIM
stations. Structure and materials inputs were collected from the construction unit of NCDOT.
In analyzing the rutting model, the predicted percentages of rutting from each layer were
used to distribute the total measured rut depth to each layer. With the national calibration, the
MEPDG over-predicted the total rutting and under-predicted the alligator cracking.
Ohio [12]
This study consists of an input sensitivity analysis and a validation of the MEPDG prediction
models for both flexible and rigid pavements in Ohio. A total of 24 roadway segments at 3
LTPP sites with flexible pavements were used. Some traffic inputs (daily traffic volume,
direction and lane distribution, and axle load spectrum, etc.) were available from the LTPP
traffic module and the Ohio DOT traffic database. The MEPDG default values were used for
other traffic inputs. Level-1 and Level-2 inputs were used for AC properties. Ohio typical
resilient moduli for unbound base/subbase were adopted. Subgrade resilient moduli were
from the LTPP database. The comparison result showed that the MEPDG over-predicted the
total rutting. The transverse cracking model in the MEPDG seemed adequate for Ohio
implementation. A poor correlation was found between the measured and predicted IRI.
Texas [13], [14]
Banerjee et al. reported an extensive local calibration effort that was undertaken to calibrate
the permanent deformation performance model in the MEPDG for five different regions in
Texas and for Texas in general (state defaults) [13]. This study focused on determining
Level-2 and Level-3 calibration factors. To determine Level-2 calibration factors, a joint
optimization approach was adopted by minimizing the sum of squared errors (SSE) between
the predicted and observed distresses; while trying to calculate the Level-3 calibration
parameter, an average of the Level-2 calibration coefficients was computed. The data used in
the calibration process were obtained from the LTPP database.
Aguiar-Moya et al. developed the Texas Flexible Pavement Database to aid in pavement
design through the development of new and the calibration of the MEPDG [14]. This
database was primarily based on FHWA’s LTPP database and had been upgraded with local
traffic data. It was divided into four main modules: structure and materials, traffic,
environment, and performance. The structure and materials module included information on
pavement structure, specific layer properties, and characterization of the materials that

14
constituted each layer. The traffic module contained indicators of traffic volume and traffic
loads. The environment module contained information pertaining to temperature,
precipitation, and other climatic factors considered important for flexible pavement design
and performance. The performance module incorporated typical asphalt pavement
performance measurements that included rutting, roughness, and cracking.
Virginia [15]
Flintsch et al. presented the results of dynamic modulus, creep compliance, and tensile
strength of 11 HMA mixtures (4 base, 4 intermediate, and 3 surface mixtures) collected from
different plants across Virginia [15]. They found that the MEPDG Level-2 dynamic modulus
prediction equation reasonably estimated the measured dynamic modulus.
Washington [16]
In this study, two PMS segments were used to validate the MEPDG prediction models in
Washington. Washington default axle load spectra were developed based on 38 WIM stations.
Vehicle classification distribution and growth factors were available from the Washington
DOT database. Materials inputs were collected from the PMS, construction standards, the
local standard practice, as well as the MEPDG default values. Comparisons showed that the
alligator cracking and transverse cracking models worked well. When all rutting was
assumed to be developed in the AC layer, the MEPDG under-predicted the measured rutting
in the PMS. The IRI model in the MEPDG showed a slight under-prediction.
Wisconsin [17]
Kang and Adams calibrated the MEPDG fatigue damage model for predicting the top-down
cracking in flexible pavements in Wisconsin based on the data from WisDOT’s Pavement
Information Files (PIF) database [17]. Representative sections were selected considering
three criteria: sections with severe distresses, sections with no rehabilitation and overlay, and
sections more than five years old.
Summary
With a lack of LTPP sites, many states used PMS data in the local validation and calibration
of the MEPDG. However, traffic and materials inputs required by the MEPDG are not
always available in the PMS, even at Level-3. Local default or best estimated input values
were often used to represent the characteristics of the local traffic and materials conditions.
Most DOTs’ databases are maintained for the purpose of network level optimization of
resources or monitoring the existing network. These databases are usually integral
components of the PMS. However, most PMS databases are not well suited for the local

15
validation and calibration of the MEPDG. Some states created new databases designed
especially for the local validation and calibration of the MEPDG.
The climate condition, traffic level, and pavement structure differ significantly among each
state. Therefore the conclusions drawn from the studies are also different from each other.
The MEPDG may show different prediction trends on different pavement structure types
even within one state.
It is commonly found that the MEPDG over-predicts the total rutting. It is difficult to tell in
which layer(s) the permanent deformation is over-estimated because the permanent
deformation in an individual layer is rarely measured. Many states attributed this
phenomenon to an over-estimation of deformation in unbound layers. A study in Minnesota
further pointed out that the predicted deformation in the unbound layers developed in the first
month was unreasonably high.
Many studies found a poor prediction power and a high standard error inherent to the top-
down cracking model. It is indicated that the top-down cracking model will be revised in the
later version of the MEPDG design software.
Run-time issues with the design software were also identified. Li, et al. found that the IRI
model cannot be calibrated due to a software bug in version 1.0 [16]. A number of issues of
the software in analyzing semi-rigid pavements were pointed out by a study in Minnesota.
For example, the fatigue cracking model for cement treated layer and the reflective cracking
model in new flexible pavements were found to be implemented by the software improperly.
Louisiana Pavement Management System
LADOTD began collecting pavement distress data by windshield surveys in the early 1970s.
Since 1995, LADOTD has used the Automatic Road Analyzer (ARAN) to conduct network-
level pavement condition surveys. Pavement distress data collected for flexible pavements
include rutting, IRI, alligator cracking, longitudinal cracking, transverse cracking, and block
cracking. The sum of longitudinal cracking and transverse cracking are also called random
cracking.
Louisiana network-level pavement condition survey is conducted once every two years, and
the data are stored in the LA-PMS. The mean and the standard deviation of the IRI and
rutting measurements are calculated and reported in every 0.1-mi. subsection. The length (or
area) of cracking is summed up and reported in every 0.1 mi.
16
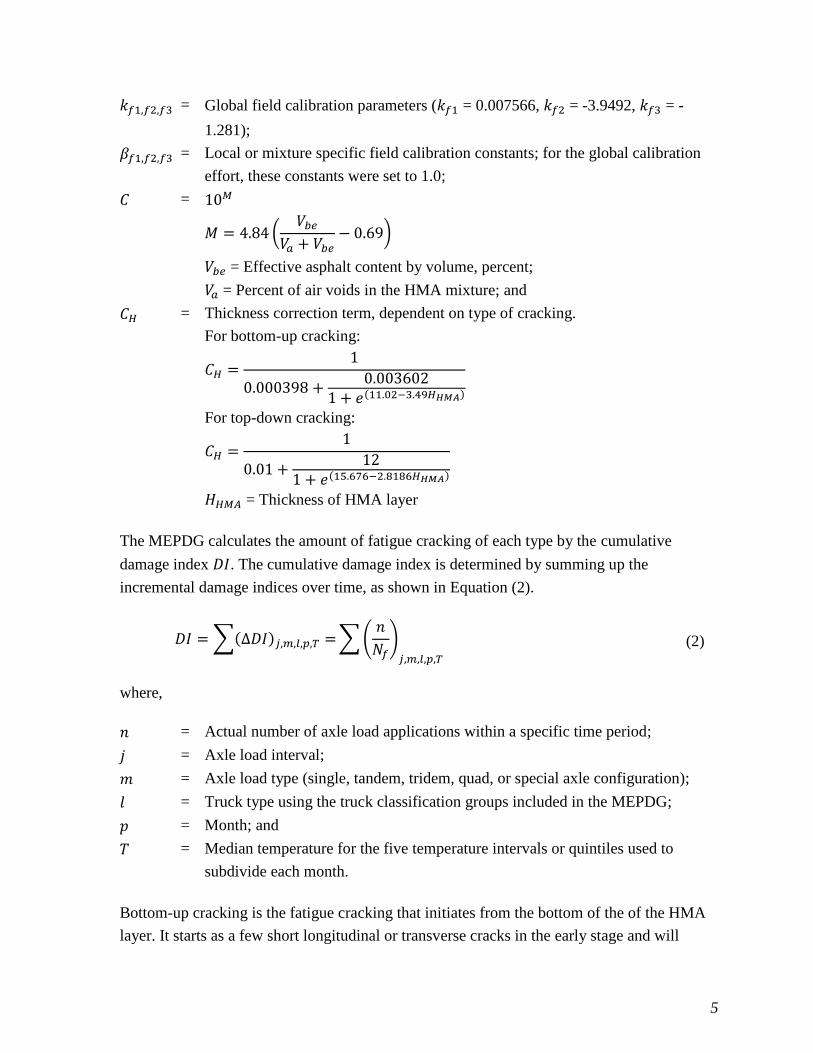
It should be noted that the definitions of cracking in the LA-PMS and the MEPDG are
different (Figure 2). The LA-PMS does not differentiate top-down and bottom-up load-
related fatigue cracking. All the cracks in the wheel paths are combined and reported as
“alligator cracking,” in square feet. The longitudinal cracking in the LA-PMS is actually the
non-load-related cracking in longitudinal direction outside the wheel path. The term “block
cracking” is not used in the MEPDG. In the LA-PMS, block cracking is used to report the
interconnected longitudinal and transverse cracking that form a distressed area and are hard
to quantify the amount of each type of cracking.
Figure 2
Different definitions in cracking between the LA-PMS and the LTPP
Other LADOTD Databases
LADOTD stores project, traffic, and materials information in isolated databases. These
databases are maintained and used by different sections. Sometimes different databases may
contain duplicated or even conflicted data. All the databases related to this study can be
accessed using the LADOTD Mainframe system (as shown in Figure 3). The Mainframe
Alligator cracking
Longitudinal cracking
Transverse cracking
Block cracking
Bottom up fatigue cracking inside the wheel path
Top-down fatigue cracking
inside the wheel path
Alligator cracking
Longitudinal cracking
Transverse cracking
Cracking in longitudinal
direction outside the wheel
path and easy to quantify.
Cracking in transverse direction, inside and outside
the wheel path, easy to
quantify.
Cracking in longitudinal
direction outside the wheel
path, hard to quantify
Cracking in transverse direction outside the wheel
path, hard to quantify
Cracks in flexible pavements LTPP Distress
Identification Manual
Louisiana Cracking
and Patching Protocol

17
system is a menu driven system that allows users to access and, for authorized users, to
update a number of databases through the LADOTD network.
Figure 3
Engineering applications menu in the Mainframe
Tracking of Projects (TOPS)
The TOPS database (Figure 4) in the Mainframe system contains general information for all
LADOTD projects from the time they are assigned through completion. Information
provided includes project name, location, important dates, status, work type, cost, etc.
Figure 4
TOPS database in the Mainframe
In the TOPS database, Each LADOTD project is identified by its unique nine-digit project
number (e.g., 000-00-0000). The first five digits identify the control section. The last four-
digit job number identifies the project in this control section.
18
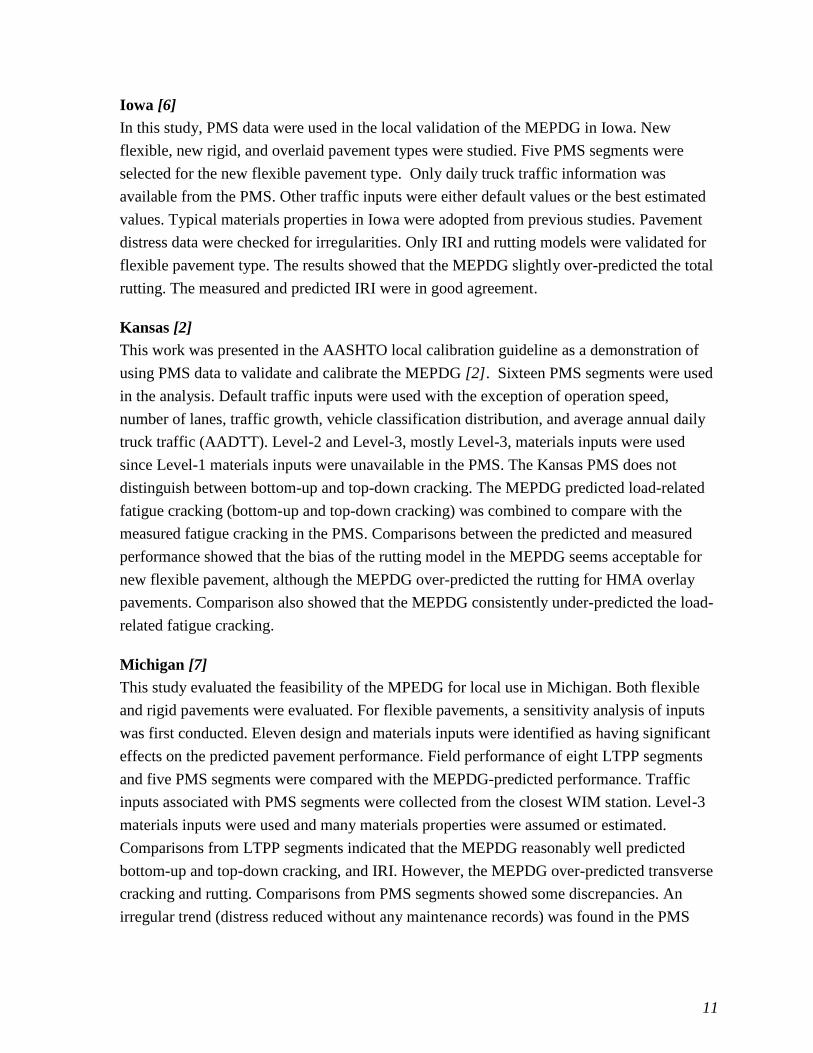
Highway Need System (TAND)
The TAND database (Figure 5) in the Mainframe system is used by LADOTD Highway
Needs Section for planning purposes. It contains the current conditions (e.g., traffic,
geometry, structural, etc.) of each control section or subsection.
Figure 5
TAND database in the Mainframe
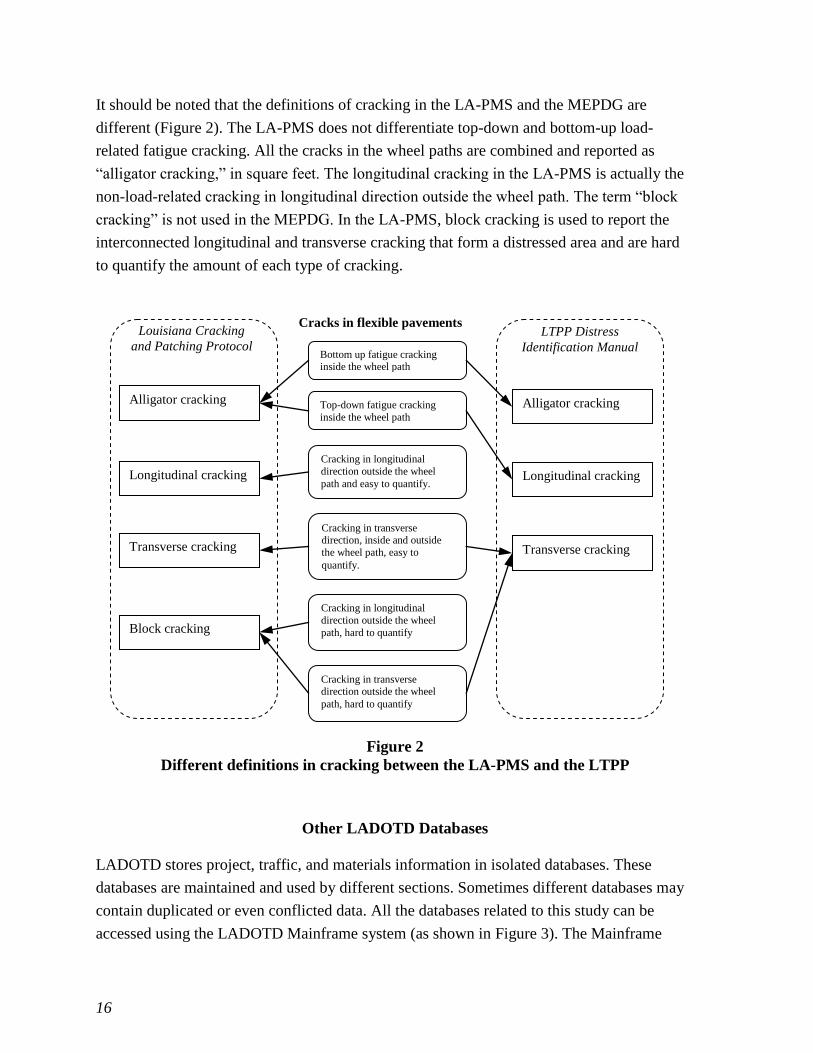
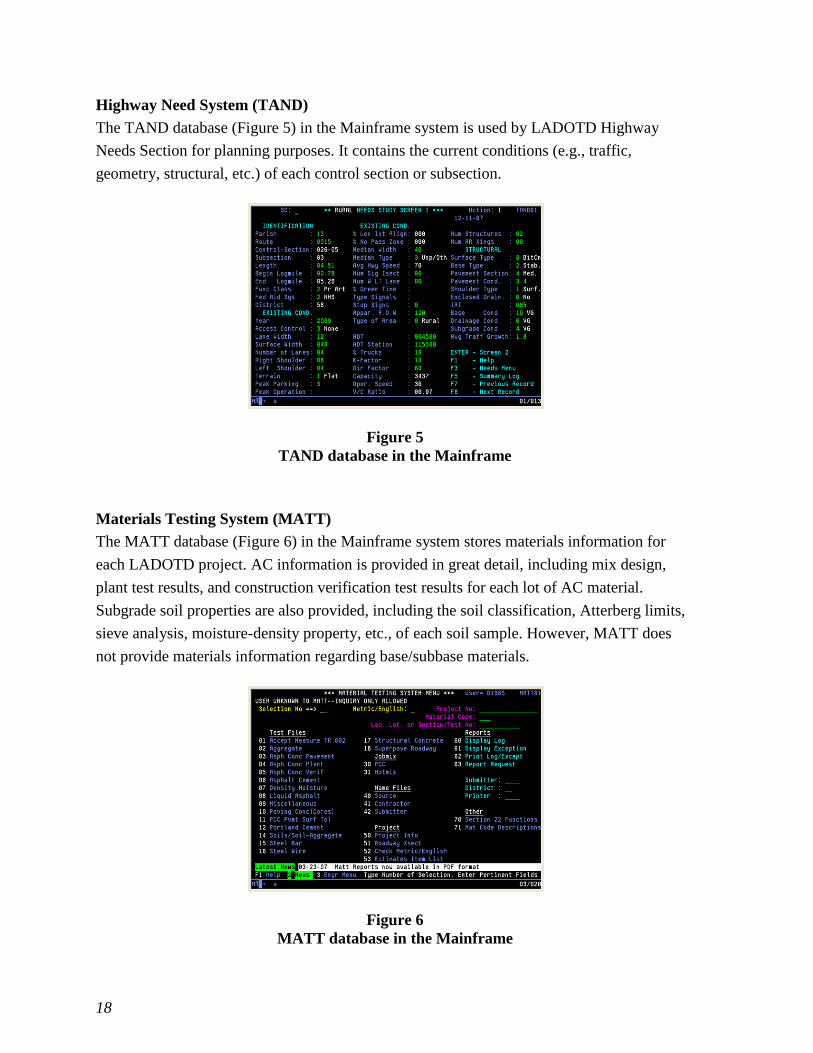
Materials Testing System (MATT)
The MATT database (Figure 6) in the Mainframe system stores materials information for
each LADOTD project. AC information is provided in great detail, including mix design,
plant test results, and construction verification test results for each lot of AC material.
Subgrade soil properties are also provided, including the soil classification, Atterberg limits,
sieve analysis, moisture-density property, etc., of each soil sample. However, MATT does
not provide materials information regarding base/subbase materials.
Figure 6
MATT database in the Mainframe
19
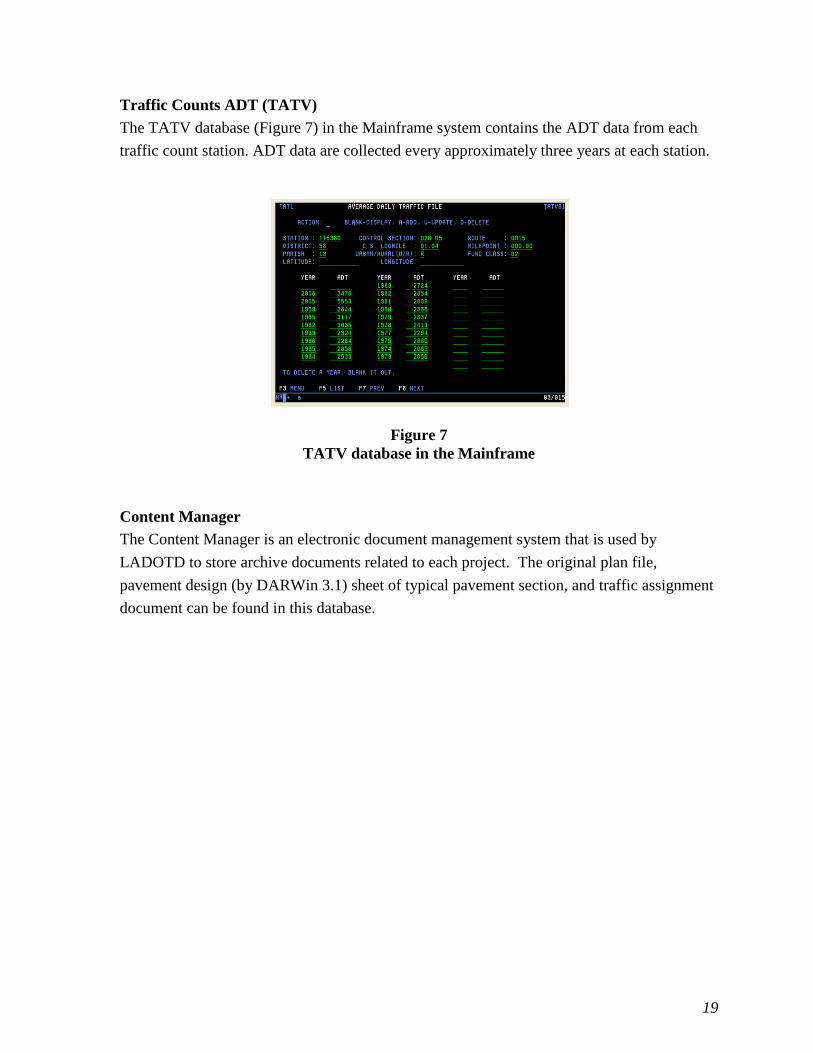
Traffic Counts ADT (TATV)
The TATV database (Figure 7) in the Mainframe system contains the ADT data from each
traffic count station. ADT data are collected every approximately three years at each station.
Figure 7
TATV database in the Mainframe
Content Manager
The Content Manager is an electronic document management system that is used by
LADOTD to store archive documents related to each project. The original plan file,
pavement design (by DARWin 3.1) sheet of typical pavement section, and traffic assignment
document can be found in this database.


21
OBJECTIVE
The objectives of this study were to use the MEPDG software (version 1.1) to evaluate the
performance of typical Louisiana flexible pavement types, materials, and structures as
compared with LA-PMS pavement performance data and identify the areas for further local
calibration of the MEPDG in Louisiana.


23
SCOPE
In this study, the MEPDG pavement performance models were validated against the LA-
PMS pavement condition data. Only new and full-depth rehabilitated (with a reconstruction
of the base) flexible pavements were investigated. The sensitivity of the MEPDG design
model to the inputs were studied based on typical flexible pavement structures and materials
used in Louisiana. In the validation process, the MEPDG input information was collected
from the network-level project information stored in LADOTD databases. When network-
level information was unavailable, Louisiana typical values were used for input parameters
that have sensitive effects to the design model. For parameters that do not vary significantly
or have less impact on the MEPDG design model, national default values were accepted.


25
METHODOLOGY
Step 1 – Identify Typical Flexible Pavement Structures in Louisiana
Pavement design plan files of Louisiana highway projects are stored in the LADOTD
Content Manager database and the Intranet Plan Room. A preliminary exploration of the plan
files was conducted on flexible pavements constructed between 1997 and 2005. For new and
rehabilitated pavement projects that involved a reconstruction of base, five typical flexible
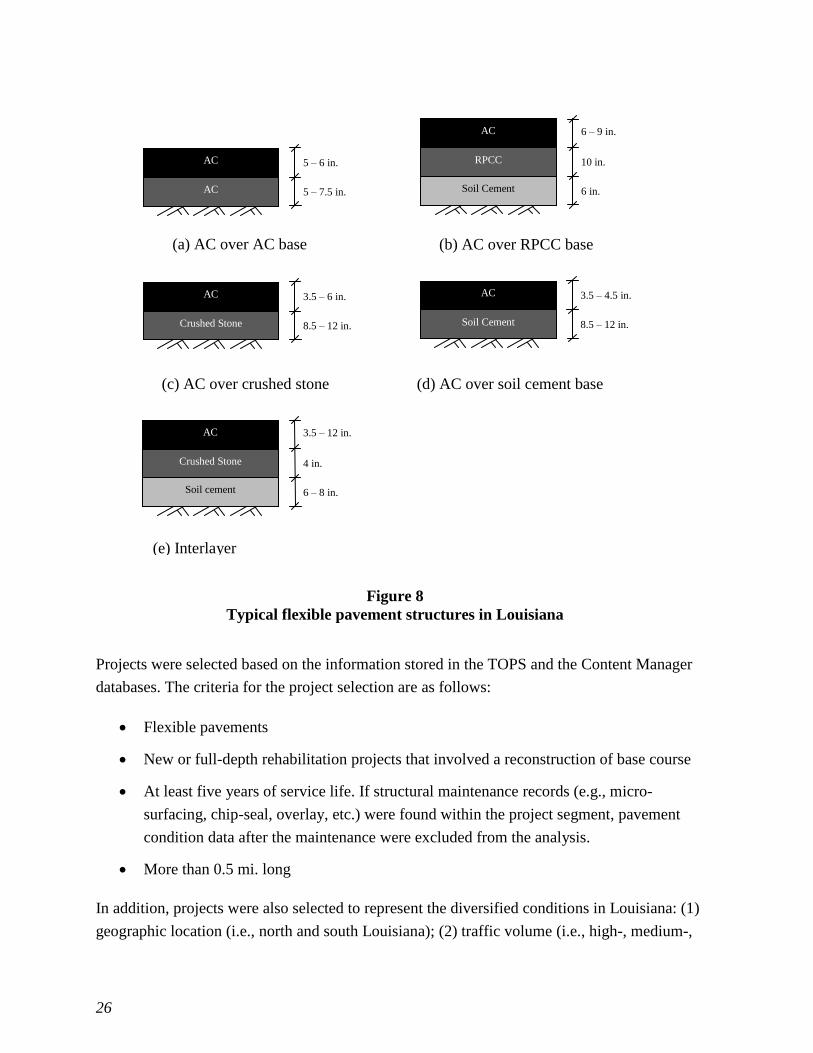
pavement structures (as shown in Figure 8) were identified:
AC over AC base pavement structure is often used in medium- and high-volume
highways in Louisiana. This type of pavement structure typically consists of a 5~6 in.
thick AC surface course (i.e., wearing course and binder course) over a 5~7.5 in.
thick AC base course.
AC over rubblized Portland cement concrete base pavement structure (referred as AC
over RPCC base hereafter) is often used in rigid pavement rehabilitation projects on
interstate highways. In these projects, the existing PCC (usually 10 in. thick) was
rubblized and overlaid by a 6~9 in. thick AC.
AC over crushed stone pavement structure (referred as AC over crushed stone
hereafter) is sometimes used in medium- and low-volume highways in Louisiana.
This type of pavement structure consists of a 3.5~6 in. thick AC on top of an 8.5~12
in. thick crushed stone or recycled PCC base course.
AC over soil cement base pavement structure is commonly used in medium- to low-
volume highways in Louisiana. This type of pavement structure consists of a 3.5~4.5
in. thick AC over an 8.5~12 in. thick base of cement stabilized/treated soil.
AC over stone interlayer pavement structure was modified from AC over soil cement
base pavement structure by introducing a 4 in. thick crushed stone base between the
AC and the soil cement layers. The crushed stone interlayer helps to mitigate the
reflective cracking from the soil cement layer.
26
Figure 8
Typical flexible pavement structures in Louisiana
Projects were selected based on the information stored in the TOPS and the Content Manager
databases. The criteria for the project selection are as follows:
Flexible pavements
New or full-depth rehabilitation projects that involved a reconstruction of base course
At least five years of service life. If structural maintenance records (e.g., micro-
surfacing, chip-seal, overlay, etc.) were found within the project segment, pavement
condition data after the maintenance were excluded from the analysis.
More than 0.5 mi. long
In addition, projects were also selected to represent the diversified conditions in Louisiana: (1)
geographic location (i.e., north and south Louisiana); (2) traffic volume (i.e., high-, medium-,
AC
AC
(a) AC over AC base (b) AC over RPCC base
(c) AC over crushed stone
(e) Interlayer
(d) AC over soil cement base
5 – 6 in.
5 – 7.5 in.
AC
RPCC 10 in.
6 in. Soil Cement
6 – 9 in.
AC
Crushed Stone
3.5 – 6 in.
8.5 – 12 in.
AC
Soil Cement
3.5 – 4.5 in.
8.5 – 12 in.
AC
Crushed Stone 4 in.
6 – 8 in. Soil cement
3.5 – 12 in.
27
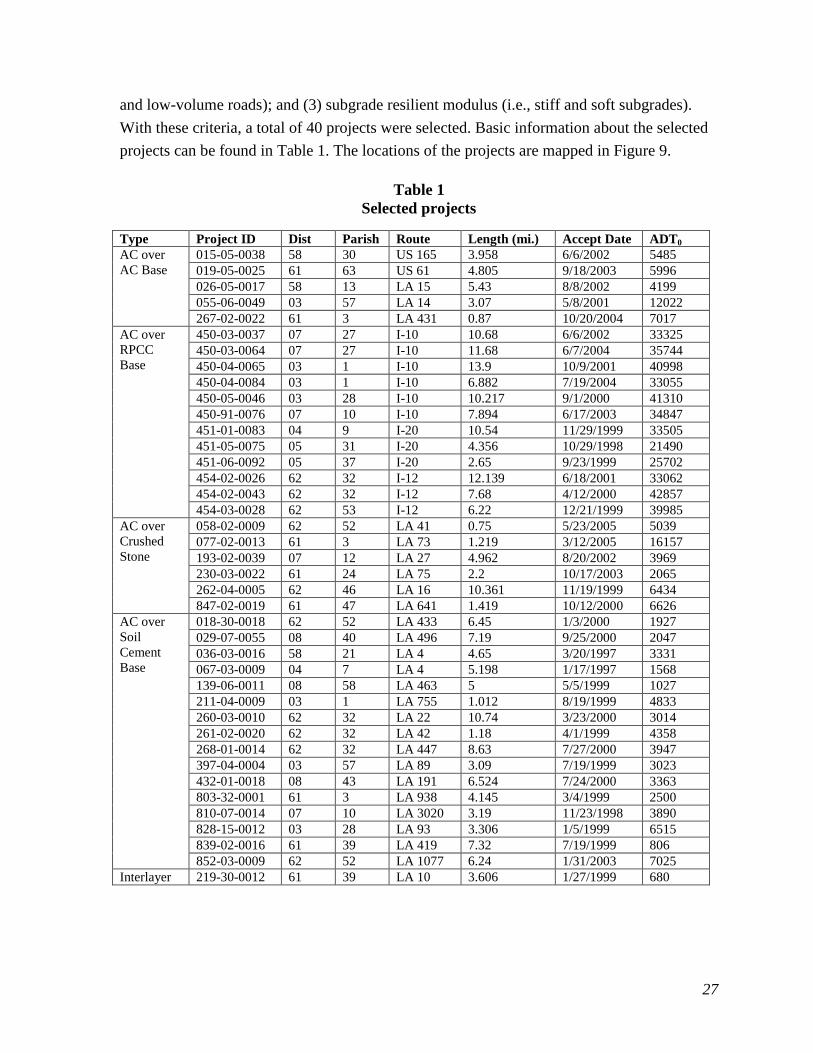
and low-volume roads); and (3) subgrade resilient modulus (i.e., stiff and soft subgrades).
With these criteria, a total of 40 projects were selected. Basic information about the selected
projects can be found in Table 1. The locations of the projects are mapped in Figure 9.
Table 1
Selected projects
Type Project ID Dist Parish Route Length (mi.) Accept Date ADT0
AC over
AC Base
015-05-0038 58 30 US 165 3.958 6/6/2002 5485
019-05-0025 61 63 US 61 4.805 9/18/2003 5996
026-05-0017 58 13 LA 15 5.43 8/8/2002 4199
055-06-0049 03 57 LA 14 3.07 5/8/2001 12022
267-02-0022 61 3 LA 431 0.87 10/20/2004 7017
AC over
RPCC
Base
450-03-0037 07 27 I-10 10.68 6/6/2002 33325
450-03-0064 07 27 I-10 11.68 6/7/2004 35744
450-04-0065 03 1 I-10 13.9 10/9/2001 40998
450-04-0084 03 1 I-10 6.882 7/19/2004 33055
450-05-0046 03 28 I-10 10.217 9/1/2000 41310
450-91-0076 07 10 I-10 7.894 6/17/2003 34847
451-01-0083 04 9 I-20 10.54 11/29/1999 33505
451-05-0075 05 31 I-20 4.356 10/29/1998 21490
451-06-0092 05 37 I-20 2.65 9/23/1999 25702
454-02-0026 62 32 I-12 12.139 6/18/2001 33062
454-02-0043 62 32 I-12 7.68 4/12/2000 42857
454-03-0028 62 53 I-12 6.22 12/21/1999 39985
AC over
Crushed
Stone
058-02-0009 62 52 LA 41 0.75 5/23/2005 5039
077-02-0013 61 3 LA 73 1.219 3/12/2005 16157
193-02-0039 07 12 LA 27 4.962 8/20/2002 3969
230-03-0022 61 24 LA 75 2.2 10/17/2003 2065
262-04-0005 62 46 LA 16 10.361 11/19/1999 6434
847-02-0019 61 47 LA 641 1.419 10/12/2000 6626
AC over
Soil
Cement
Base
018-30-0018 62 52 LA 433 6.45 1/3/2000 1927
029-07-0055 08 40 LA 496 7.19 9/25/2000 2047
036-03-0016 58 21 LA 4 4.65 3/20/1997 3331
067-03-0009 04 7 LA 4 5.198 1/17/1997 1568
139-06-0011 08 58 LA 463 5 5/5/1999 1027
211-04-0009 03 1 LA 755 1.012 8/19/1999 4833
260-03-0010 62 32 LA 22 10.74 3/23/2000 3014
261-02-0020 62 32 LA 42 1.18 4/1/1999 4358
268-01-0014 62 32 LA 447 8.63 7/27/2000 3947
397-04-0004 03 57 LA 89 3.09 7/19/1999 3023
432-01-0018 08 43 LA 191 6.524 7/24/2000 3363
803-32-0001 61 3 LA 938 4.145 3/4/1999 2500
810-07-0014 07 10 LA 3020 3.19 11/23/1998 3890
828-15-0012 03 28 LA 93 3.306 1/5/1999 6515
839-02-0016 61 39 LA 419 7.32 7/19/1999 806
852-03-0009 62 52 LA 1077 6.24 1/31/2003 7025
Interlayer 219-30-0012 61 39 LA 10 3.606 1/27/1999 680

28
AC over RPCC Base AC over AC Base AC over Crushed Stone
AC over Soil Cement Base AC over Stone Interlayer
Figure 9
Locations of the selected projects (maps.google.com)
Step 2 – Determine the Input Strategy
This study utilized the network level information stored in LADOTD databases. Thus only
Level-3 design input was available for most design parameters. Three categories of input
information were collected: traffic inputs, climate inputs, as well as pavement structure and
materials inputs.
Initial IRI
The initial IRI of the pavement immediately after the construction is unavailable in Louisiana.
This value was back-calculated based on a linear fit of the measured IRI values in LA-PMS.
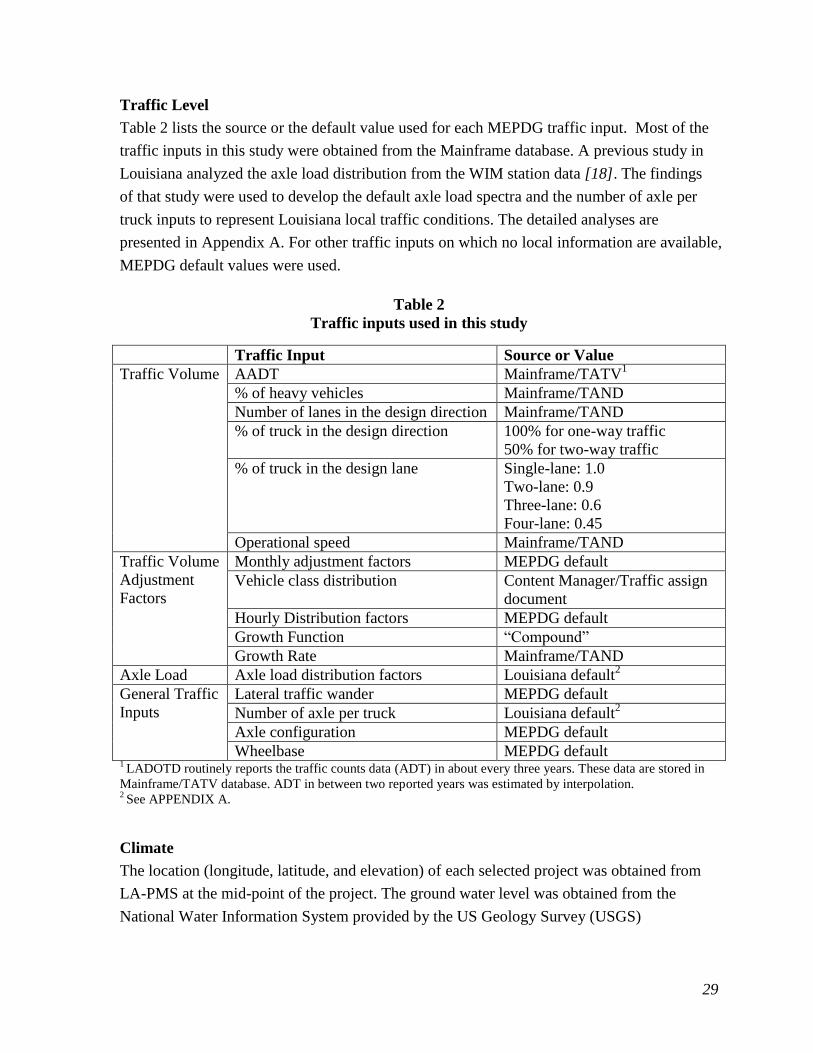
29
Traffic Level
Table 2 lists the source or the default value used for each MEPDG traffic input. Most of the
traffic inputs in this study were obtained from the Mainframe database. A previous study in
Louisiana analyzed the axle load distribution from the WIM station data [18]. The findings
of that study were used to develop the default axle load spectra and the number of axle per
truck inputs to represent Louisiana local traffic conditions. The detailed analyses are
presented in Appendix A. For other traffic inputs on which no local information are available,
MEPDG default values were used.
Table 2
Traffic inputs used in this study
Traffic Input Source or Value
Traffic Volume AADT Mainframe/TATV1
% of heavy vehicles Mainframe/TAND
Number of lanes in the design direction Mainframe/TAND
% of truck in the design direction 100% for one-way traffic
50% for two-way traffic
% of truck in the design lane Single-lane: 1.0
Two-lane: 0.9
Three-lane: 0.6
Four-lane: 0.45
Operational speed Mainframe/TAND
Traffic Volume
Adjustment
Factors
Monthly adjustment factors MEPDG default
Vehicle class distribution Content Manager/Traffic assign
document
Hourly Distribution factors MEPDG default
Growth Function “Compound”
Growth Rate Mainframe/TAND
Axle Load Axle load distribution factors Louisiana default2
General Traffic
Inputs
Lateral traffic wander MEPDG default
Number of axle per truck Louisiana default2
Axle configuration MEPDG default
Wheelbase MEPDG default 1 LADOTD routinely reports the traffic counts data (ADT) in about every three years. These data are stored in
Mainframe/TATV database. ADT in between two reported years was estimated by interpolation. 2 See APPENDIX A.
Climate
The location (longitude, latitude, and elevation) of each selected project was obtained from
LA-PMS at the mid-point of the project. The ground water level was obtained from the
National Water Information System provided by the US Geology Survey (USGS)

30
(http://wdr.water.usgsgov/nwisgmap/). A virtual weather station was generated for each
project by interpolating the climate data from the closest two or three weather stations.
Pavement Structure
Pavement structure design information can be found from several different sources: (1) plan
documents from the Content Manager or the LADOTD Intranet Plan Room
(\\h00001ms017\26Plan Room\Plans), (2) typical section DARWin design sheets from the
Content Manager, and (3) the Mainframe database (Mainframe/MATT/X-SECT).
Information from different sources may conflict with each other.
After some preliminary comparisons, it was found that the X-SECT database in the
Mainframe has lots of incorrect and missing information. Thus it was not considered as a
reliable source of information. Project plan and DARWin design files are more reliable but
sometimes plan changes may not be recorded in the database. The investigators made their
best effort to identify the final pavement structure for each project selected. The pavement
structures of the selected projects are presented in Table 3.
Table 3
Pavement structures of the selected projects
Project ID AC
thickness
Base Type Base
Thickness
Subbase
Type
Subbase
Thickness
Subgrade
(psi.)
015-05-0038 6.0 AC 6.5 9176
019-05-0025 5.5 AC 7.5 10634
026-05-0017 5.5 AC 5.5 8797
055-06-0049 5.5 AC 6.5 7627
267-02-0022 5.0 AC 5.0 8413
450-03-0037 7.5 RPCC 10 Soil Cement 6 8413
450-03-0064 8.0 RPCC 10 Soil Cement 6 8413
450-04-0065 7.5 RPCC 10 Soil Cement 6 8797
450-04-0084 8.0 RPCC 10 Soil Cement 6 8797
450-05-0046 6.0 RPCC 10 Soil Cement 6 9916
450-91-0076 7.5 RPCC 10 Soil Cement 6 9176
451-01-0083 8.0 RPCC 10 Soil Cement 6 10278
451-05-0075 6.0 RPCC 10 Soil Cement 6 10278
451-06-0092 8.0 RPCC 10 Soil Cement 6 9916
454-02-0026 8.0 RPCC 10 Soil Cement 6 9549
454-02-0043 6.0 RPCC 10 Soil Cement 6 9549
454-03-0028 9.0 RPCC 10 Soil Cement 6 10634
058-02-0009 5.0 AC 5 Stone 10 9176
077-02-0013 3.5 AC 4.5 Stone 8.5 8413
193-02-0039 4.5 Stone 12 9176
230-03-0022 5.0 Stone 8.5 8413
262-04-0005 6.0 AC 4.5 Stone 8.5 9549
847-02-0019 6.0 Stone 8.5 8023
018-30-0018 3.5 Soil Cement 8.5 9176
029-07-0055 3.5 Soil Cement 8.5 9916
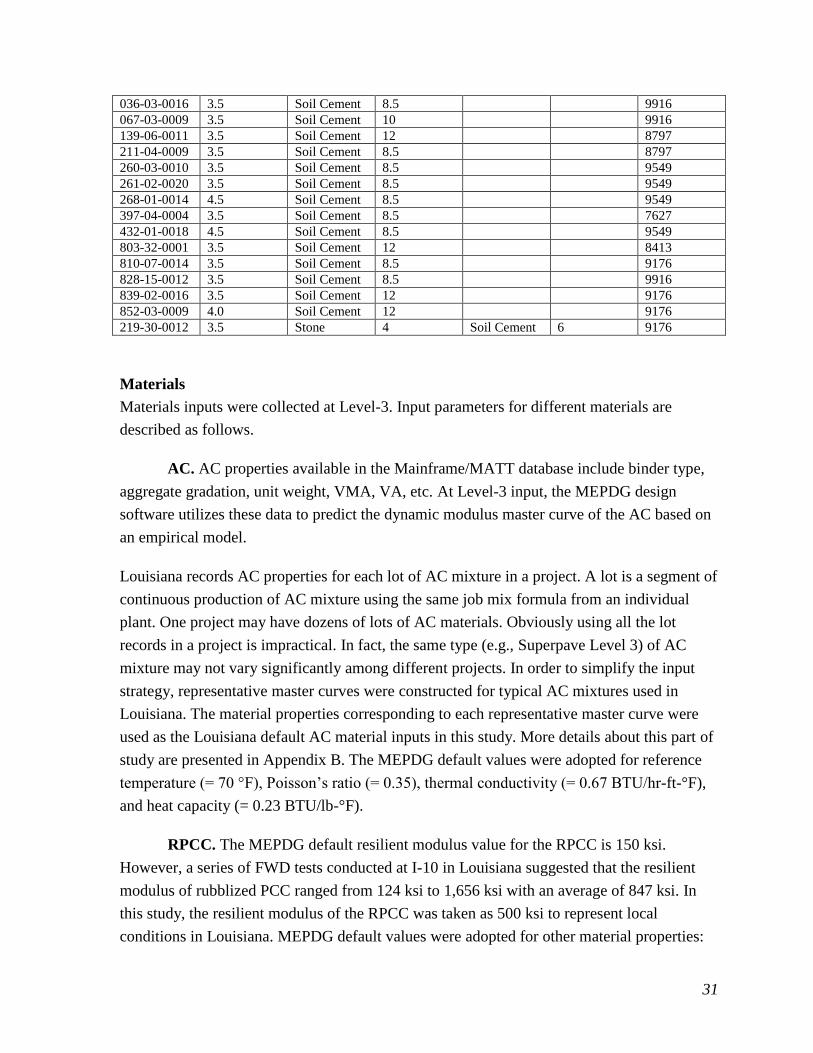
31
036-03-0016 3.5 Soil Cement 8.5 9916
067-03-0009 3.5 Soil Cement 10 9916
139-06-0011 3.5 Soil Cement 12 8797
211-04-0009 3.5 Soil Cement 8.5 8797
260-03-0010 3.5 Soil Cement 8.5 9549
261-02-0020 3.5 Soil Cement 8.5 9549
268-01-0014 4.5 Soil Cement 8.5 9549
397-04-0004 3.5 Soil Cement 8.5 7627
432-01-0018 4.5 Soil Cement 8.5 9549
803-32-0001 3.5 Soil Cement 12 8413
810-07-0014 3.5 Soil Cement 8.5 9176
828-15-0012 3.5 Soil Cement 8.5 9916
839-02-0016 3.5 Soil Cement 12 9176
852-03-0009 4.0 Soil Cement 12 9176
219-30-0012 3.5 Stone 4 Soil Cement 6 9176
Materials
Materials inputs were collected at Level-3. Input parameters for different materials are
described as follows.
AC. AC properties available in the Mainframe/MATT database include binder type,
aggregate gradation, unit weight, VMA, VA, etc. At Level-3 input, the MEPDG design
software utilizes these data to predict the dynamic modulus master curve of the AC based on
an empirical model.
Louisiana records AC properties for each lot of AC mixture in a project. A lot is a segment of
continuous production of AC mixture using the same job mix formula from an individual
plant. One project may have dozens of lots of AC materials. Obviously using all the lot
records in a project is impractical. In fact, the same type (e.g., Superpave Level 3) of AC
mixture may not vary significantly among different projects. In order to simplify the input
strategy, representative master curves were constructed for typical AC mixtures used in
Louisiana. The material properties corresponding to each representative master curve were
used as the Louisiana default AC material inputs in this study. More details about this part of
study are presented in Appendix B. The MEPDG default values were adopted for reference
temperature (= 70 °F), Poisson’s ratio (= 0.35), thermal conductivity (= 0.67 BTU/hr-ft-°F),
and heat capacity (= 0.23 BTU/lb-°F).
RPCC. The MEPDG default resilient modulus value for the RPCC is 150 ksi.
However, a series of FWD tests conducted at I-10 in Louisiana suggested that the resilient
modulus of rubblized PCC ranged from 124 ksi to 1,656 ksi with an average of 847 ksi. In
this study, the resilient modulus of the RPCC was taken as 500 ksi to represent local
conditions in Louisiana. MEPDG default values were adopted for other material properties:
32
unit weight (= 150 psi), Poisson’s ratio (= 0.3), thermal conductivity (= 1.25 BTU/hr-ft-°F),
and heat capacity (= 0.28 BTU/lb-°F).
Crushed Stone. No local information is available about the crushed stone properties
in Louisiana. MEPDG default input values for crushed stone were adopted in this study.
Soil Cement. The MEPDG default resilient modulus for the cement stabilized soil (=
2,000 ksi) is much higher than the values in Louisiana’s local experience. In this study, the
resilient modulus of the existing soil cement layer in the interstate projects was taken as 30
ksi, because the soil cement layers in these projects were constructed at least 40 years ago.
For newly constructed soil cement layers, the resilient modulus value was taken as 100 ksi.
Subgrade. The coring/sampling log records for LADOTD projects have been
recorded in the Mainframe/MATT database since 1990. Soil property data that can be input
into the MEPDG includes sieve analysis data, soil classification, liquid limit, plasticity index,
optimum moisture content, and maximum dry density. Louisiana does not have subgrade soil
resilient modulus test data. Instead, each parish in Louisiana uses a default subgrade resilient
modulus value. These parish default resilient moduli were used as the input for the subgrade
in this study.
Type D lime treatment is commonly used in Louisiana to prepare the subgrade for pavement
construction. The presence of lime treated layer was accounted for by assigning a higher
resilient modulus, which is twice of that of the untreated subgrade soil, within the thickness
of the treatment [2].
Step 3 – Construct the LA-MEPDG Database
This study utilized a number of LADOTD databases: Mainframe, Content Manager, LA-
PMS, etc. These databases are maintained separately by different offices in LADOTD. There
is a need to link these databases together so that researchers can easily collect, manage, and
analyze the data. To fulfill this requirement, a database named LA-MEPDG was created in
this study using the Access 2007 format. This database linked a number of LADOTD
databases (TOPS, TAND_NEEDS, TATV, and MATT/SOILS) together. A detailed
introduction and a step-by-step procedure of using the database are presented in Appendix C.

33
Step 4 – Interpret the LA-PMS Data
Identify Irregularities in LA-PMS Data
Ideally, pavement distresses (or IRI), if without any maintenance, should show a smoothly
increasing trend with year of service. However, decreasing trend and abrupt changes are
often observed when the pavement condition data of a particular project are retrieved from
the LA-PMS. These irregularities may be introduced from several sources.
LA-PMS stores network-level pavement condition data. These data are measured
continuously by an automatic surveyor. Measurement errors are unavoidable. For
example, the surveyor may run off the lane for a short period.
Minor maintenance (e.g., micro surfacing, chip seal, etc.) may not always be recorded
in the TOPS.
Cracking is categorized and quantified manually from the road images. Joints on
bridges may be ignored in one year but counted as cracking in another year. Although
similar survey protocols were used every year, personal judgment still has to be made,
which will introduce inconsistencies in the results.
Rutting and IRI measurement are more automatic. However, pavement survey
technology improves year by year. Pavement profile was measured with a three-point
laser in 2000-2003 surveys and with a 1280-point laser in the 2004-2005 survey and
after. Different technology often produces different outputs.
For the above reasons, pavement condition data for each selected project were inspected
carefully before comparing with the MEPDG. The following procedure was taken to
minimize the irregular trend in the LA-PMS data.
When a project has more than one subsection with considerably different traffic levels,
traffic and pavement condition data from one of the subsections should be used.
If any maintenance record was found for a project, only the PMS data before the
maintenance should be used.
Structures were excluded from the PMS data.
Data acquisition errors (often recorded as -1) were excluded from the analysis.

34
If the pavement condition data at a particular part of the project were believed to be
abnormal, only the range of project with reasonable pavement condition data was
used.
After employing the previous procedures, pavement distress (or IRI) data were fitted using
linear or power trend line to eliminate the data inconsistency among different years of
surveys. The fitted distress development curve was used instead of the real measurement to
compare with the MEPDG predictions. If pavement condition data still showed an irregular
trend after the previous procedure, the project was excluded unless the data point of
particular year(s) was obviously unreasonable while other data points showed a good trend.
The abnormal data point was ignored and the pavement distress trend line was fitted based on
the remaining data points.
Calculate the Mean and Variation of Distress (or IRI)
Pavement condition data stored in the LA-PMS were summarized in every 0.1 mi. For
cracking, the lengths (or areas) of measured cracking were summed up and reported in each
0.1 mi. For IRI and rutting, both mean and standard deviation of the distress were reported in
each 0.1 mi. The mean and standard deviation (also called pooled mean and pooled standard
deviation) were then calculated from the measurement in both wheel paths.
Each project was considered as a single case, thus only the overall mean and standard
deviation of the distress were of interest. For cracking, the total length (or area) of cracking
was simply calculated by summing up the total length (or area) of cracking in each 0.1-mi.
subsection. Standard deviation among different subsections was calculated directly. For IRI
and rutting, the total mean value was calculated by averaging the pooled mean values. The
total standard deviation was more complicated to obtain, which is explained below.
From the theory of statistics, the total sum of squares (TSS) equals the sum of the within
sample sum of squares (SSW) and the sum of squares between samples (SSB).
(9)
or
(10)
where, is the jth
individual distress (IRI or rutting) measurement in the ith
subsection, is
the pooled mean distress in the ith
subsection, and is the total mean distress of the entire
project. Let be the number of 0.1-mi. subsections in a project and be the number of
35
distress measurements in each subsection. Equation (10) can be re-written in terms of total
standard deviation s and pooled standard deviation is of the ith
0.1-mi. subsection.
(11)
Equation (11) can be used to calculate the total standard deviation of rutting or IRI of a
particular project. The number of distress measurements in each subsection depends on the
configuration of the surveyor. Based on a communication with the PMS section in Louisiana
DOTD, = 20 and = 100 were used for rutting and IRI measurements, respectively.
Step 5 – Validate the MPEDG using LA-PMS data
With the input information collected and the PMS data processed, the MEPDG design
software were run for each of the selected projects. The MEPDG-predicted distresses (or IRI)
were compared with the PMS data.
As mentioned previously, the different definitions of cracking between the LA-PMS and the
MEPDG must be carefully considered in the comparison. The LA-PMS reports the total
wheel-path cracking, termed as alligator cracking in sq. ft., rather than differentiating top-
down and bottom-up cracking as used in the MEPDG. Based on the distress survey manual,
the wheel-path cracking in LA-PMS should be considered as load-related fatigue cracking.
Therefore, the total MEPDG predicted load-related fatigue cracking (i.e., the combined
bottom-up and top-down predicted cracking) was used to compare with the LA-PMS
measured wheel-path alligator cracking. Equation (12) is used to combine the MEPDG-
predicted bottom-up and top-down cracking for the cracking comparison analysis in this
study.
(12)
Thermal (transverse) cracking is not considered in this study because it is not a major distress
type in most parts of Louisiana.
The MEPDG predicts the pavement distress (or IRI) in two levels: average level and
reliability level. On the other hand, field mean distress (or IRI) and the variation (standard

36
deviation) were calculated from the PMS data. In this study, the following comparisons were
made to validate the MEPDG design models.
In order to determine whether the MEPDG prediction models are biased from the pavement
performance in Louisiana, the MEPDG predicted average distresses were compared with the
field mean distresses.
In addition, the predicted distresses at the reliability level were also compared with the field
distresses at the mean-plus-one-standard-deviation level. This comparison indicates to what
extent the MEPDG-predicted pavement distress reflects the field variation of distress in
Louisiana. Different reliability levels were used, depending on the highway functional class
and pavement structure type. For example, the AC over RPCC pavement structure was often
used on interstate highways. Therefore the design reliability for AC over RPCC pavements
was set as 95 percent. Similarly, the design reliability for AC over AC base pavements, AC
over crushed stone pavements, AC over soil cement base pavements, and interlayer
pavements were set as 85 percent, 85 percent, 75 percent, and 75 percent, respectively.
When determining the bias between the MEPDG-predicted and LA-PMS measured distresses,
a statistical analysis was performed according to the AASHTO Local Calibration Guide [2].
Bias can be evaluated by performing the following three null hypothesis tests:
Test 1. Determine if the mean of residual error er (the predicted value minors the
measured value) is zero:
H0: Mean (er) = 0
H1: Mean (er) ≠ 0
Test 2. Determine if the linear regression relationship between measured and
predicted distresses has an intercept of zero:
H0: Intercept = 0
H1: Intercept ≠ 0
Test 3. Determine if the linear regression relationship between measured and
predicted distresses has a slope of 1.0:
H0: Slope = 1.0
H1: Slope ≠ 1.0

37
A rejection of any of the three null hypotheses indicates that bias exists between the
predicted and measured distresses.
The accuracy of the MEPDG model can be determined by the standard error of estimate ( ).
The standard error of estimate is the standard deviation of the residual error (i.e., the
predicted value – measured value) of the model. Prediction power of the MEPDG model can
be determined by the coefficient of determination . The calculated and in this study
were also compared with the values obtained from the national calibration of the MEPDG.
Finally, analysis of variance (ANOVA) was conducted to determine whether the errors in the
MEPDG prediction models were affected by factors such as pavement type, traffic volume
(ADT), subgrade modulus, and geographic location.
Step 6 – Calibrate the Rutting Models
In the current MEPDG, the permanent deformation of the RPCC and the stabilized base
layers is not considered. Thus the total rutting of the pavement is the sum of the permanent
deformation in AC, granular base/subbase, and subgrade layers. Each component of the total
rutting corresponds to a rutting model for a specific material type.
Ideally, the permanent deformation in individual layers should be measured (by trench tests)
and used to calibrate the sublayer rutting models. However, this information was not
available in this study. Therefore, the sublayer rutting models may be calibrated either
separately by making some assumptions about the contribution of rutting by each layer or at
the same time by minimizing the Sum of Squared Errors (SSE) of the total rutting. Previous
studies often used the former method by assuming the percentage of rutting in each layer
predicted by the MEPDG is the “true” percentage of rutting distribution in the field.
In this study, the second method was used. An obvious advantage of this method is that the
“same rutting distribution” assumption is avoided. This method works best when the biases
of the three sublayer rutting models are significantly different. For example, one is over-
predicting and the others are under-predicting the rutting. This method also relies on a
sufficient amount of good-quality data; otherwise calibration factors obtained may be
unreasonably large or small.
Calibration of the MEPDG rutting models was conducted for AC over RPCC and AC over
soil cement pavements. These two pavement types were selected because we were able to
locate a suitable number of projects. The following local calibration factors were obtained:

38
[in equation (6)] for AC and [in equation (7)] for subgrade. The optimization was
performed using the Solver add-in in Microsoft Excel® 2007.
The prediction power of the AC rutting model can be further improved by calibrating the
local calibration factors and in equation (6) through iterative method. However, it is
beyond the scope of this study.

39
DISCUSSION OF RESULTS
Validate the MEPDG with LA-PMS Data
This section presents the comparisons between the MEPDG-predicted pavement performance
and the LA-PMS data for the 40 selected projects.
AC over AC Base Pavement
A total of five projects with this type of pavement structure were selected. Table 4 presents
the corresponding pavement structures of the AC over AC base pavements selected. Other
project information can be found in Table 1. As mentioned in the preceding “Methodology”
section, each of the selected projects was analyzed using the MEPDG software (version 1.1)
with a set of Louisiana default inputs obtained from multiple sources. The example below
provides the analysis procedure for one of these projects.
Table 4
Pavement structures of the selected AC over AC base pavements
Pro
ject
ID
AC
S
urf
ace
Th
ick
nes
s o
f
AC
(in
.)
Ba
se
Th
ick
nes
s o
f
Ba
se (
in.)
Su
bg
rad
e an
d
Sta
bil
iza
tion
015-05-0038
2" SMA WC + 4"
SUPERPAVE LEVEL-2 BC 6.0 AC Type 5A 6.5 A-4
019-05-0025
1.5" TYPE 8F WC + 4"
TYPE 8 BC 5.5 AC Type 5A 7.5
A-4, 12" TYPE D LIME
TREATED
026-05-0017
1.5" TYPE 8F WC + 4"
TYPE 8 BC 5.5 AC Type 5A 5.5
A-4, 12" TYPE D LIME
TREATED
055-06-0049
1.5" TYPE 8F WC + 4"
TYPE 8 BC 5.5 AC Type 5A 6.5 A-6
267-02-0022
2" TYPE 8F WC + 3" TYPE
8 BC 5.0 AC Type 5 5.0
A-4, 12" TYPE D LIME
TREATED
WC = Wearing Course, BC = Binder Course
Project 019-05-0025 was a new flexible pavement project located on US-61 in south
Louisiana. Two new lanes were added to the existing two-lane highway. The flexible
pavement consisted of 1.5-in. Type 8F wearing course, 4-in. Type 8 binder course, and 7.5-in.
Type 5A asphalt concrete base course. The project was accepted on September 18, 2003.
Two-way ADT on this route was 5,996 in the year 2003. Pavement condition surveys were
conducted in 2005, 2007, and 2008, respectively. The MEPDG design program was run with
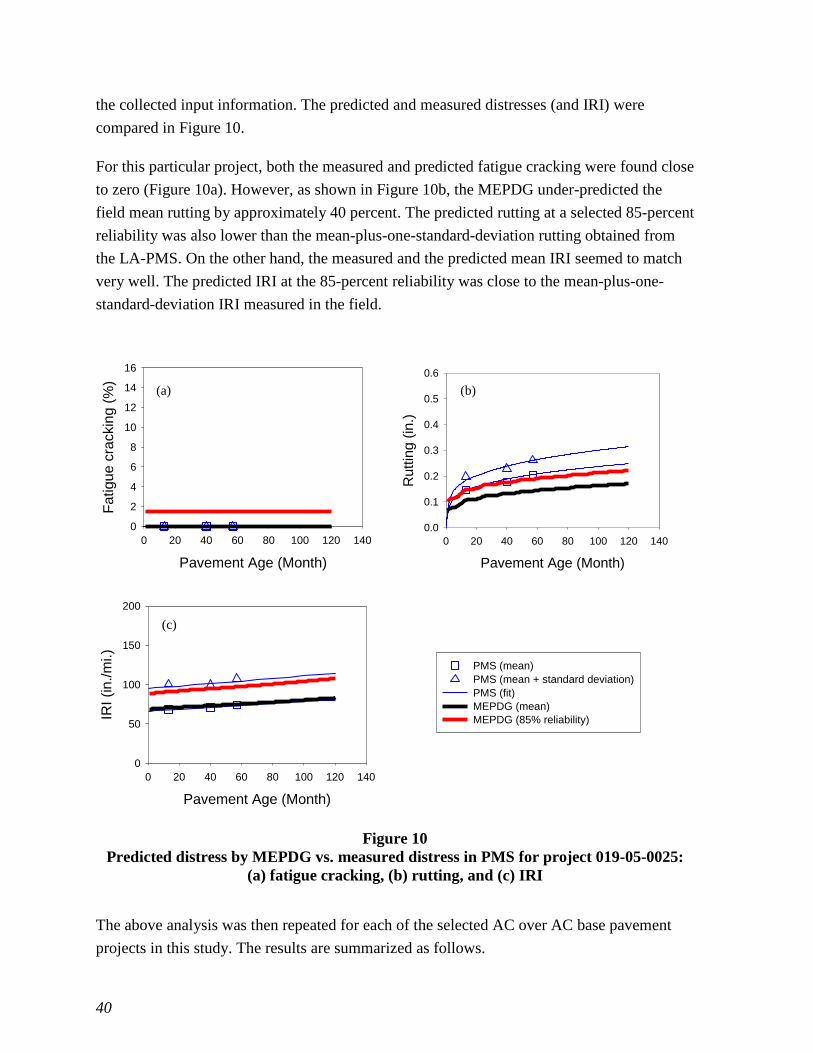
40
the collected input information. The predicted and measured distresses (and IRI) were
compared in Figure 10.
For this particular project, both the measured and predicted fatigue cracking were found close
to zero (Figure 10a). However, as shown in Figure 10b, the MEPDG under-predicted the
field mean rutting by approximately 40 percent. The predicted rutting at a selected 85-percent
reliability was also lower than the mean-plus-one-standard-deviation rutting obtained from
the LA-PMS. On the other hand, the measured and the predicted mean IRI seemed to match
very well. The predicted IRI at the 85-percent reliability was close to the mean-plus-one-
standard-deviation IRI measured in the field.
Pavement Age (Month)
0 20 40 60 80 100 120 140
Fatigue c
rackin
g (
%)
0
2
4
6
8
10
12
14
16
Pavement Age (Month)
0 20 40 60 80 100 120 140
Ruttin
g (
in.)
0.0
0.1
0.2
0.3
0.4
0.5
0.6
Pavement Age (Month)
0 20 40 60 80 100 120 140
IRI
(in./m
i.)
0
50
100
150
200
PMS (mean)
PMS (mean + standard deviation)
PMS (fit)
MEPDG (mean)
MEPDG (85% reliability)
Figure 10
Predicted distress by MEPDG vs. measured distress in PMS for project 019-05-0025:
(a) fatigue cracking, (b) rutting, and (c) IRI
The above analysis was then repeated for each of the selected AC over AC base pavement
projects in this study. The results are summarized as follows.
(a) (b)
(c)

41
Load-related Fatigue Cracking. In this part of analysis, the MEPDG-predicted
fatigue cracking (i.e., combined with both bottom-up and top-down cracking) were compared
with the measured wheel-path alligator cracking obtained from the LA-PMS. For all selected
AC over AC base projects, almost no wheel-path alligator cracking was reported in the LA-
PMS. The MEPDG also predicted less than 0.1 percent of fatigue cracking in each of those
projects. Under such a low cracking distress level, the predicted and the measured fatigue
cracking seemed to match each other. Therefore, the MEPDG load-related fatigue cracking
models seemed to be adequate in predicting the mean load-related fatigue cracking for the
AC over AC base pavements in Louisiana. More details of the MEPDG prediction results can
be found in Appendix D.
Rutting. Figure 11 shows the comparison between the predicted and measured mean
rutting for the AC over AC base pavements considered. Overall, it was observed that the
MEPDG could predict roughly (with up-and-down variations) the mean of field rutting for
the projects selected, although the hypothesis tests (see Table 5) showed that the MEPDG
rutting prediction model was “biased.” Furthermore, the MEPDG-predicted rutting at a
selected 85-percent design reliability level was compared with the field variations of rutting
obtained from the LA-PMS. Figure 12 indicates that the MEPDG-predicted rut depths at the
85-percent reliability level were found either close or higher than the field measured rut
depths at the mean-plus-one-standard-deviation level for three of selected projects, but lower
than the field rut depths for the other two projects. Such results indicate that the MEPDG
rutting model without local calibration seems to have a certain degree of prediction power for
the AC over AC base pavements in Louisiana.

42
Measured rutting (in.)
0.0 0.1 0.2 0.3 0.4 0.5
Pre
dic
ted r
uttin
g (
in.)
0.0
0.1
0.2
0.3
0.4
0.5
Line of E
quality LA National
N 20 334R2
0.021 0.577
Bias (in.) 0.01Se (in.) 0.067 0.107Se/Sy 1.147 0.818
Figure 11
Predicted mean rutting by MEPDG vs. measured mean rutting in LA-PMS
(AC over AC base pavement)
Table 5
Hypothesis analysis (rutting, AC over AC base pavement)
Null hypothesis (H0) P-Value Result
1 The mean of residual error (predicted rutting - predicted rutting) is zero. 0.547 H0 accepted
2 The slope of the predicted rutting versus the measured rutting is one. < 0.001 H0 rejected
3 The intercept of the predicted rutting versus the measured rutting is zero. < 0.001 H0 rejected
Conclusion: Two of the H0 hypotheses are rejected. The MEPDG-predicted rutting is “biased” from the
measured rutting for AC over AC Base pavements.

43
Project ID
019-
05-0
025
026-
05-0
017
015-
05-0
038
055-
06-0
049
267-
02-0
022
Ruttin
g (
in.)
0.0
0.1
0.2
0.3
0.4
0.5
0.6
Measured rutting(Error bar = ± standard deviation)
Predicted rutting at 85% reliability
Figure 12
Field variation of rutting vs. MEPDG design reliability
(AC over AC base pavement)
IRI. Figure 13 shows the comparison between the predicted and measured mean IRI.
Overall, the predicted mean IRI seemed to agree well with the measured mean IRI with a
slight over-prediction, although the hypothesis tests (see Table 6) showed that the MEPDG
IRI prediction model was “biased.” Figure 13 also indicates that the MEPDG IRI model
seemed to be able to provide a better set of the goodness-of-fit parameters (such as R2 and Se)
for the selected Louisiana pavements than those obtained in the national calibration.
Furthermore, the MEPDG-predicted IRI at a selected 85-percent design reliability level was
larger than the measured mean IRI for all five projects considered (see Figure 14). In four of
the five projects (except project 026-05-0017), the predicted IRI at the 85-percent reliability
level was close to the measured IRI at the mean-plus-one-standard-deviation level. Therefore,
the MEPDG IRI prediction model seems to be adequate to the AC over AC base pavements
in Louisiana. It should be noted that, however, the MEPDG IRI prediction model is a
function of other predicted distresses (e.g., cracking and rutting). If any of the MEPDG
distress prediction models will be locally calibrated, the IRI model should be, thus, also re-
calibrated.
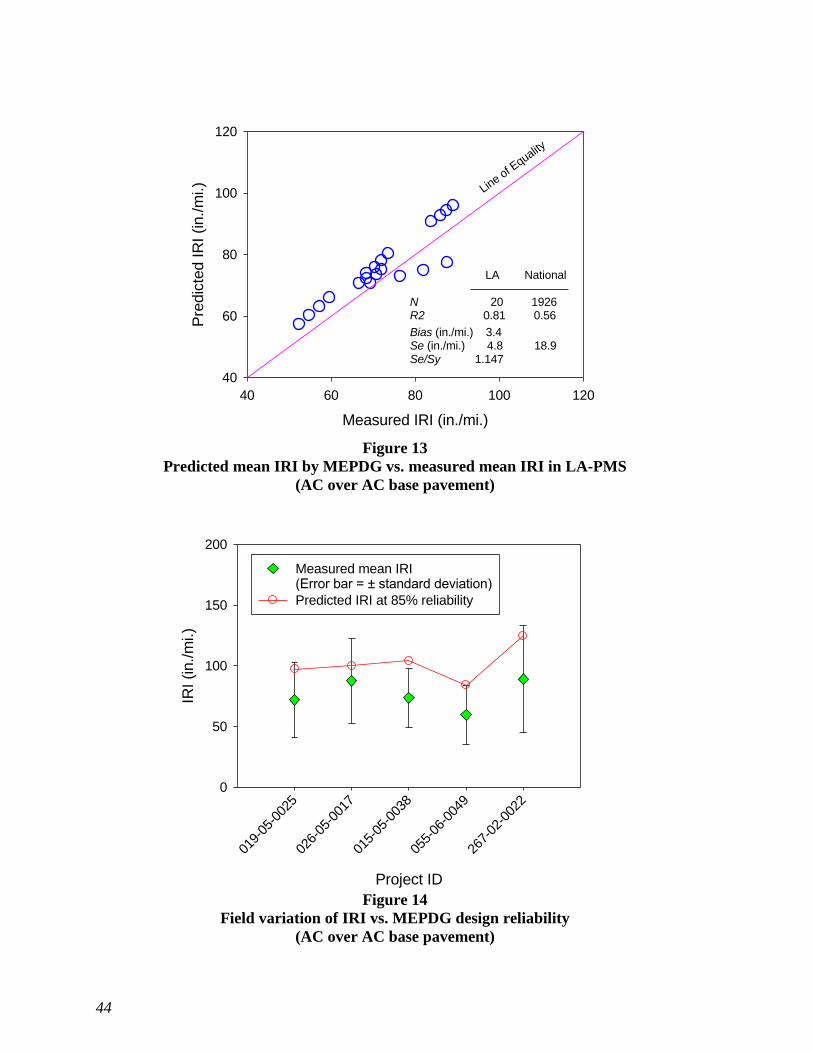
44
Measured IRI (in./mi.)
40 60 80 100 120
Pre
dic
ted IR
I (in./m
i.)
40
60
80
100
120
Line of E
quality
LA National
N 20 1926R2
0.81 0.56
Bias (in./mi.) 3.4Se (in./mi.) 4.8 18.9Se/Sy 1.147
Figure 13
Predicted mean IRI by MEPDG vs. measured mean IRI in LA-PMS
(AC over AC base pavement)
Project ID
019-
05-0
025
026-
05-0
017
015-
05-0
038
055-
06-0
049
267-
02-0
022
IRI (in./m
i.)
0
50
100
150
200
Measured mean IRI(Error bar = ± standard deviation)
Predicted IRI at 85% reliability
Figure 14
Field variation of IRI vs. MEPDG design reliability
(AC over AC base pavement)
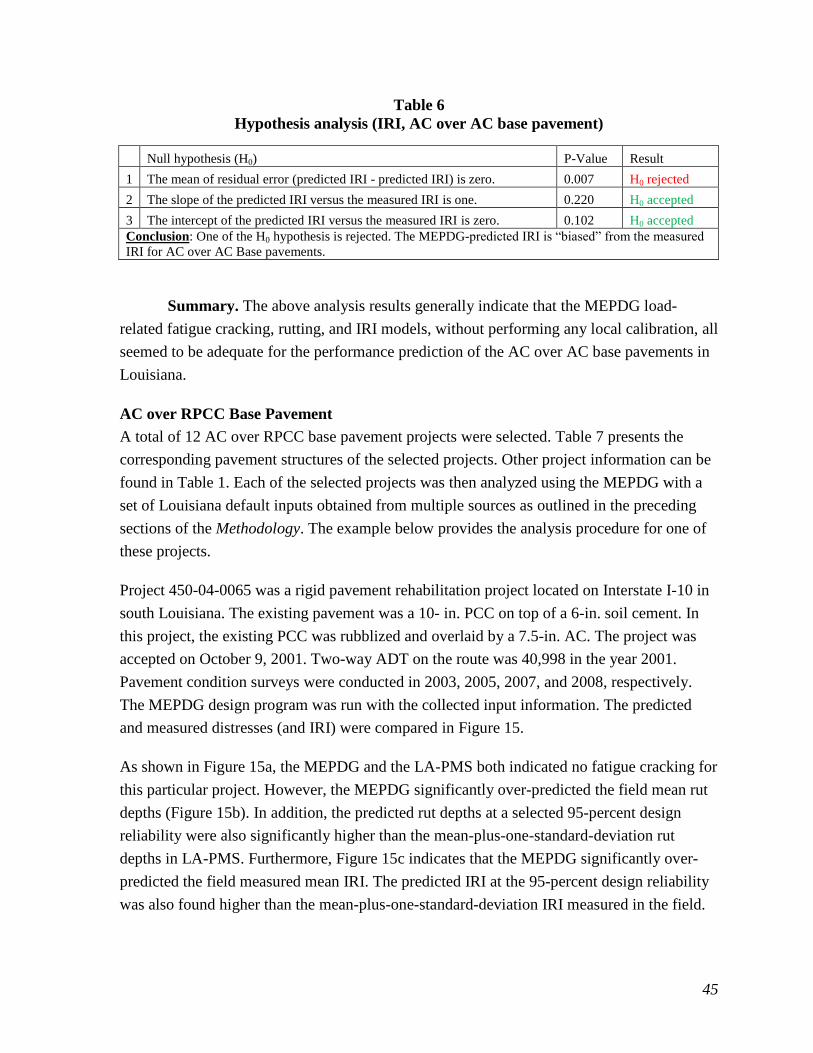
45
Table 6
Hypothesis analysis (IRI, AC over AC base pavement)
Null hypothesis (H0) P-Value Result
1 The mean of residual error (predicted IRI - predicted IRI) is zero. 0.007 H0 rejected
2 The slope of the predicted IRI versus the measured IRI is one. 0.220 H0 accepted
3 The intercept of the predicted IRI versus the measured IRI is zero. 0.102 H0 accepted
Conclusion: One of the H0 hypothesis is rejected. The MEPDG-predicted IRI is “biased” from the measured
IRI for AC over AC Base pavements.
Summary. The above analysis results generally indicate that the MEPDG load-
related fatigue cracking, rutting, and IRI models, without performing any local calibration, all
seemed to be adequate for the performance prediction of the AC over AC base pavements in
Louisiana.
AC over RPCC Base Pavement
A total of 12 AC over RPCC base pavement projects were selected. Table 7 presents the
corresponding pavement structures of the selected projects. Other project information can be
found in Table 1. Each of the selected projects was then analyzed using the MEPDG with a
set of Louisiana default inputs obtained from multiple sources as outlined in the preceding
sections of the Methodology. The example below provides the analysis procedure for one of
these projects.
Project 450-04-0065 was a rigid pavement rehabilitation project located on Interstate I-10 in
south Louisiana. The existing pavement was a 10- in. PCC on top of a 6-in. soil cement. In
this project, the existing PCC was rubblized and overlaid by a 7.5-in. AC. The project was
accepted on October 9, 2001. Two-way ADT on the route was 40,998 in the year 2001.
Pavement condition surveys were conducted in 2003, 2005, 2007, and 2008, respectively.
The MEPDG design program was run with the collected input information. The predicted
and measured distresses (and IRI) were compared in Figure 15.
As shown in Figure 15a, the MEPDG and the LA-PMS both indicated no fatigue cracking for
this particular project. However, the MEPDG significantly over-predicted the field mean rut
depths (Figure 15b). In addition, the predicted rut depths at a selected 95-percent design
reliability were also significantly higher than the mean-plus-one-standard-deviation rut
depths in LA-PMS. Furthermore, Figure 15c indicates that the MEPDG significantly over-
predicted the field measured mean IRI. The predicted IRI at the 95-percent design reliability
was also found higher than the mean-plus-one-standard-deviation IRI measured in the field.

46
Table 7
Pavement structures of the selected AC over RPCC base pavements
Pro
ject
ID
AC
Su
rfa
ce
Th
ick
nes
s o
f
AC
(in
.)
Ba
se
Th
ick
nes
s o
f
Ba
se (
in.)
Su
bb
ase
Th
ick
nes
s o
f
Su
bb
ase
(in
.)
Su
bg
rad
e an
d
Sta
bil
iza
tion
450-03-0037
2" SUPERPAVE WC + 5.5"
SUPERPAVE BC 7.5
RUBBLIZED
PCC 10
EXISTING SOIL
CEMENT 6.0 A-6
450-03-0064
2" SUPERPAVE LEVEL 3
WC + 6" SUPERPAVE
LEVEL 3 BC 8.0
RUBBLIZED
PCC 10
EXISTING SOIL
CEMENT 6.0 A-7-6
450-04-0065
2" SMA WC + 5.5 " TYPE 8
BC 7.5
RUBBLIZED
PCC 10
EXISTING SOIL
CEMENT 6.0 A-4
450-04-0084
2" SUPERPAVE LEVEL 3
WC + 6" SUPERPAVE
LEVEL 3 BC 8.0
RUBBLIZED
PCC 10
EXISTING SOIL
CEMENT 6.0 A-4
450-05-0046 2" SMA WC + 4" TYPE 8 BC 6.0
RUBBLIZED
PCC 10
EXISTING SOIL
CEMENT 6.0 A-7-6
450-91-0076
2" SMA WC + 5.5"
SUPERPAVE LEVEL 3 BC 7.5
RUBBLIZED
PCC 10
EXISTING SOIL
CEMENT 6.0 A-4
451-01-0083 2" SMA WC + 6" TYPE 8 BC 8.0
RUBBLIZED
PCC 10
EXISTING SOIL
CEMENT 6.0 A-4
451-05-0075
2" SMA WC + 4"
SUPERPAVE LEVEL 3 BC 6.0
RUBBLIZED
PCC 10
EXISTING SOIL
CEMENT 6.0 A-2-4
451-06-0092 2" SMA WC + 6" TYPE 8 BC 8.0
RUBBLIZED
PCC 10
EXISTING SOIL
CEMENT 6.0 A-4
454-02-0026
4" SUPERPAVE LEVEL 3
WC + 4" SUPERPAVE
LEVEL 3 BC 8.0
RUBBLIZED
PCC 10
EXISTING SOIL
CEMENT 6.0 A-7-6
454-02-0043
2" SUPERPAVE LEVEL 3
WC + 4" SUPERPAVE
LEVEL 3 BC 6.0
RUBBLIZED
PCC 10
EXISTING SOIL
CEMENT 6.0 A-7-6
454-03-0028
2" SMA WC + 4" TYPE 8 BC
+ 3" TYPE 5A BS 9.0
RUBBLIZED
PCC 10
EXISTING SOIL
CEMENT 6.0 A-4
WC = Wearing Course, BC = Binder Course, BS = Base Course
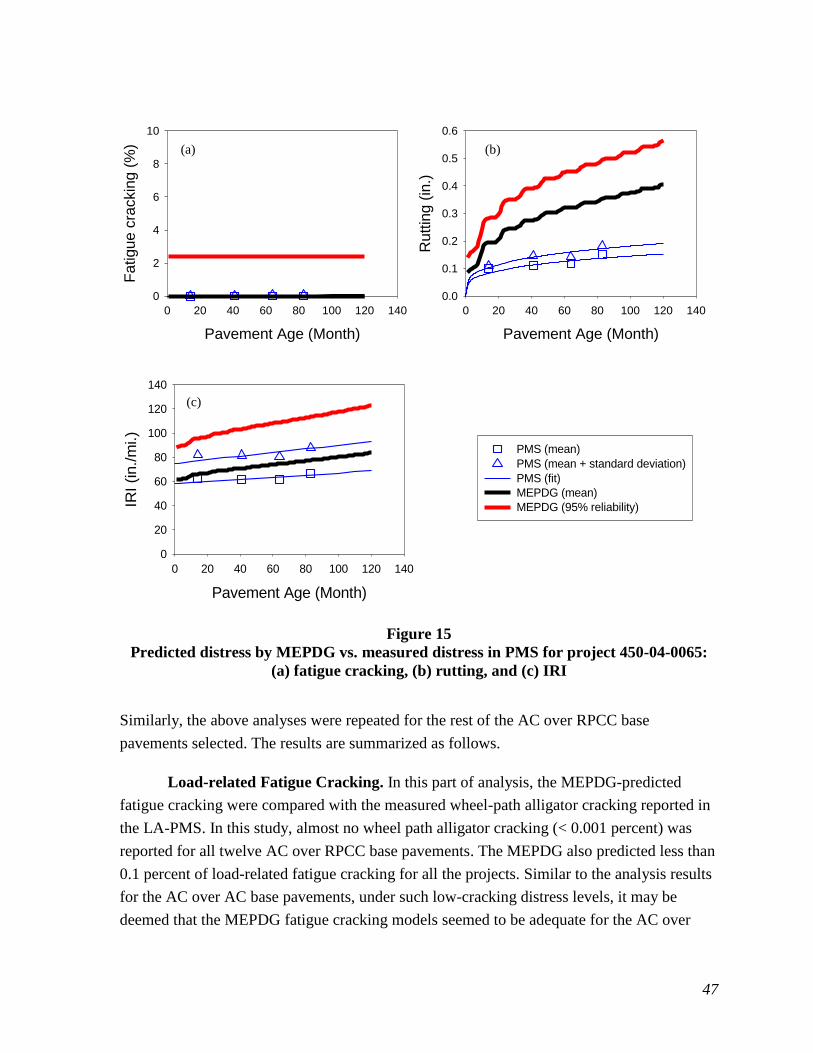
47
Pavement Age (Month)
0 20 40 60 80 100 120 140
Fa
tig
ue
cra
ckin
g (
%)
0
2
4
6
8
10
Pavement Age (Month)
0 20 40 60 80 100 120 140
Rutt
ing (
in.)
0.0
0.1
0.2
0.3
0.4
0.5
0.6
Pavement Age (Month)
0 20 40 60 80 100 120 140
IRI (in./m
i.)
0
20
40
60
80
100
120
140
PMS (mean)
PMS (mean + standard deviation)
PMS (fit)
MEPDG (mean)
MEPDG (95% reliability)
Figure 15
Predicted distress by MEPDG vs. measured distress in PMS for project 450-04-0065:
(a) fatigue cracking, (b) rutting, and (c) IRI
Similarly, the above analyses were repeated for the rest of the AC over RPCC base
pavements selected. The results are summarized as follows.
Load-related Fatigue Cracking. In this part of analysis, the MEPDG-predicted
fatigue cracking were compared with the measured wheel-path alligator cracking reported in
the LA-PMS. In this study, almost no wheel path alligator cracking (< 0.001 percent) was
reported for all twelve AC over RPCC base pavements. The MEPDG also predicted less than
0.1 percent of load-related fatigue cracking for all the projects. Similar to the analysis results
for the AC over AC base pavements, under such low-cracking distress levels, it may be
deemed that the MEPDG fatigue cracking models seemed to be adequate for the AC over
(a) (b)
(c)
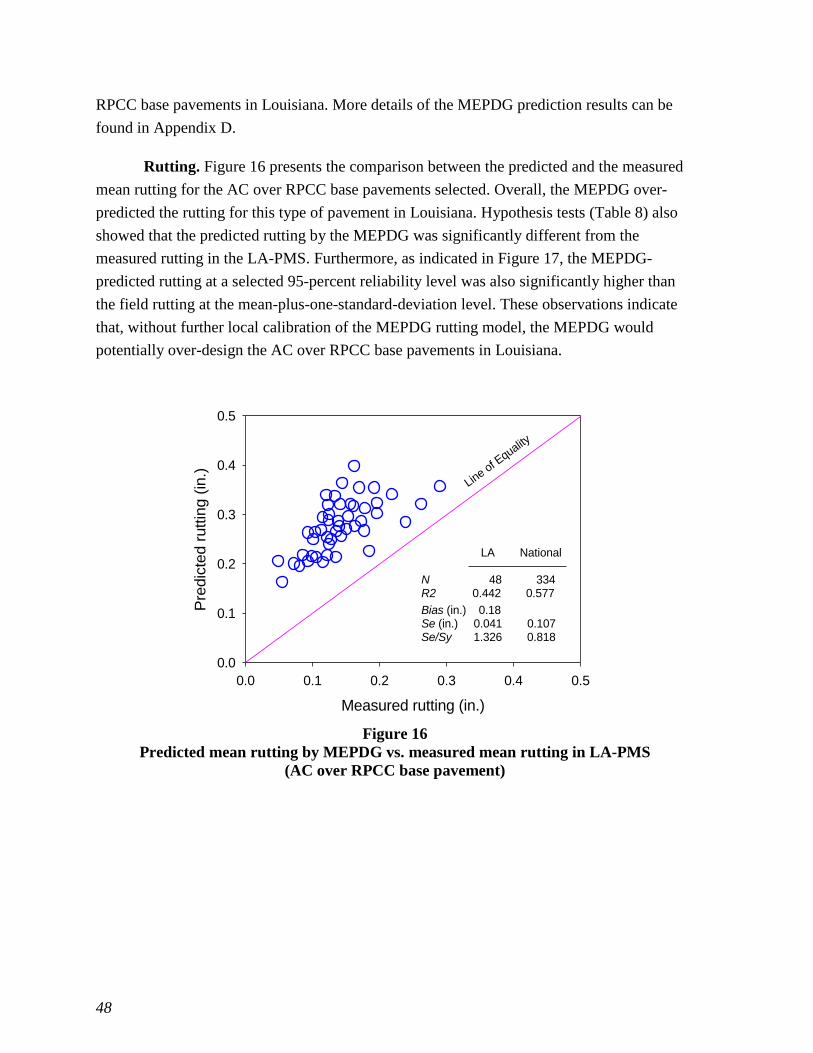
48
RPCC base pavements in Louisiana. More details of the MEPDG prediction results can be
found in Appendix D.
Rutting. Figure 16 presents the comparison between the predicted and the measured
mean rutting for the AC over RPCC base pavements selected. Overall, the MEPDG over-
predicted the rutting for this type of pavement in Louisiana. Hypothesis tests (Table 8) also
showed that the predicted rutting by the MEPDG was significantly different from the
measured rutting in the LA-PMS. Furthermore, as indicated in Figure 17, the MEPDG-
predicted rutting at a selected 95-percent reliability level was also significantly higher than
the field rutting at the mean-plus-one-standard-deviation level. These observations indicate
that, without further local calibration of the MEPDG rutting model, the MEPDG would
potentially over-design the AC over RPCC base pavements in Louisiana.
Measured rutting (in.)
0.0 0.1 0.2 0.3 0.4 0.5
Pre
dic
ted r
uttin
g (
in.)
0.0
0.1
0.2
0.3
0.4
0.5
Line of E
quality
LA National
N 48 334R2
0.442 0.577
Bias (in.) 0.18Se (in.) 0.041 0.107Se/Sy 1.326 0.818
Figure 16
Predicted mean rutting by MEPDG vs. measured mean rutting in LA-PMS
(AC over RPCC base pavement)
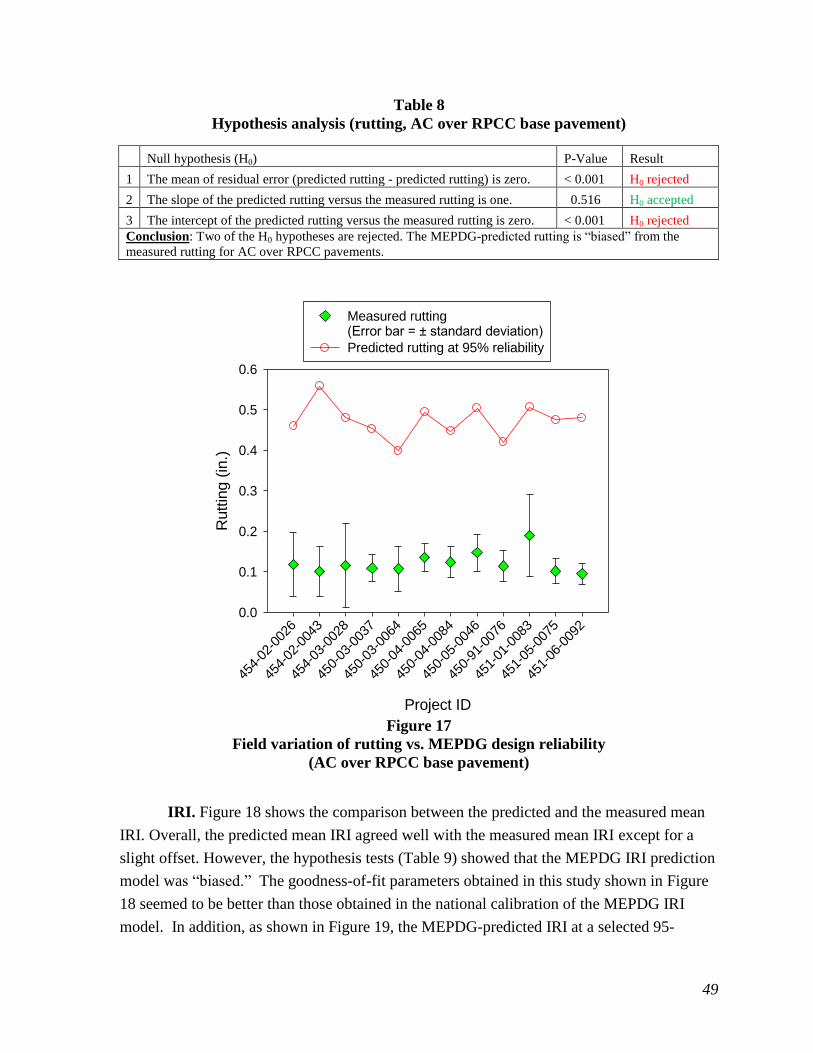
49
Table 8
Hypothesis analysis (rutting, AC over RPCC base pavement)
Null hypothesis (H0) P-Value Result
1 The mean of residual error (predicted rutting - predicted rutting) is zero. < 0.001 H0 rejected
2 The slope of the predicted rutting versus the measured rutting is one. 0.516 H0 accepted
3 The intercept of the predicted rutting versus the measured rutting is zero. < 0.001 H0 rejected
Conclusion: Two of the H0 hypotheses are rejected. The MEPDG-predicted rutting is “biased” from the
measured rutting for AC over RPCC pavements.
Project ID
454-
02-0
026
454-
02-0
043
454-
03-0
028
450-
03-0
037
450-
03-0
064
450-
04-0
065
450-
04-0
084
450-
05-0
046
450-
91-0
076
451-
01-0
083
451-
05-0
075
451-
06-0
092
Ruttin
g (
in.)
0.0
0.1
0.2
0.3
0.4
0.5
0.6
Measured rutting(Error bar = ± standard deviation)
Predicted rutting at 95% reliability
Figure 17
Field variation of rutting vs. MEPDG design reliability
(AC over RPCC base pavement)
IRI. Figure 18 shows the comparison between the predicted and the measured mean
IRI. Overall, the predicted mean IRI agreed well with the measured mean IRI except for a
slight offset. However, the hypothesis tests (Table 9) showed that the MEPDG IRI prediction
model was “biased.” The goodness-of-fit parameters obtained in this study shown in Figure
18 seemed to be better than those obtained in the national calibration of the MEPDG IRI
model. In addition, as shown in Figure 19, the MEPDG-predicted IRI at a selected 95-

50
percent design reliability level was higher than both the measured mean IRI and the IRI at the
mean-plus-one-standard-deviation level for all 12 projects. This indicates that the MEPDG
IRI model seemed to be adequate for the AC over RPCC base pavements in Louisiana.
However, as mentioned before, the MEPDG IRI model should be re-evaluated if any other
MEPDG distress prediction models (e.g., cracking and rutting) are to be locally calibrated.
Measured IRI (in./mi.)
20 40 60 80 100 120
Pre
dic
ted IR
I (in./m
i.)
20
40
60
80
100
120
Line of E
quality
LA National
N 48 1926R2
0.77 0.56
Bias (in./mi.) 8.4Se (in./mi.) 1.8 18.9Se/Sy 0.151
Figure 18
Predicted mean IRI by MEPDG vs. measured mean IRI in LA-PMS
(AC over RPCC base pavement)
Table 9
Hypothesis analysis (IRI, AC over RPCC base pavement)
Null hypothesis (H0) P-Value Result
1 The mean of residual error (predicted IRI - predicted IRI) is zero. < 0.001 H0 rejected
2 The slope of the predicted IRI versus the measured IRI is one. 0.115 H0 accepted
3 The intercept of the predicted IRI versus the measured IRI is zero. < 0.001 H0 rejected
Conclusion: Two of the H0 hypotheses are rejected. The MEPDG-predicted IRI is “biased” from the
measured IRI for AC over RPCC pavements.

51
Project ID
454-
02-0
026
454-
02-0
043
454-
03-0
028
450-
03-0
037
450-
03-0
064
450-
04-0
065
450-
04-0
084
450-
05-0
046
450-
91-0
076
451-
01-0
083
451-
05-0
075
451-
06-0
092
IRI (in./m
i.)
0
50
100
150
200
Measured mean IRI(Error bar = ± standard deviation)
Predicted IRI at 95% reliability
Figure 19
Field variation of IRI vs. MEPDG design reliability
(AC over RPCC base pavement)
Summary. Similar to AC over AC base pavements, the MEPDG load-related fatigue
cracking model and the IRI model both seemed to be adequate for the AC over RPCC base
pavements in Louisiana without the need of local calibration. However, since the MEPDG
rutting model significantly over-predicted the field rutting for all 12 AC over RPCC base
pavements selected in this study, a local calibration of the rutting models is recommended
before implementing the MEPDG in Louisiana to design AC over RPCC base pavements.
AC over Crushed Stone Pavement
A total of six projects with this type of pavement structure were selected. Table 10 provides
the corresponding pavement structures of the selected projects. Other project information can
be found in Table 1. Each of the selected projects was then analyzed using the MEPDG with
a set of Louisiana default inputs obtained from multiple sources as outlined in the preceding
sections of the Methodology. The next example provides the analysis procedure for one of
these projects.

52
Table 10
Pavement structures of the selected AC over crushed stone pavements
Pro
ject
ID
AC
Su
rfa
ce
Th
ick
nes
s o
f
AC
(in
.)
Ba
se
Th
ick
nes
s o
f
Ba
se (
in.)
Su
bb
ase
Th
ick
nes
s o
f
Su
bb
ase
(in
.)
Su
bg
rad
e an
d
Sta
bil
iza
tion
058-02-0009
2" TYPE 8F WC + 3" TYPE 8
BC 5.0 AC TYPE 5 5.0 STONE 10.0
A-6, 12" TYPE
D LIME
TREATED
077-02-0013
1.5" TYPE 8F WC + 2" TYPE
8 BC 3.5 AC TYPE 5 4.5 STONE 8.5
A-4, 12" TYPE
D LIME
TREATED
193-02-0039
1.5" TYPE 8F WC + 3" TYPE
8 BC 4.5 STONE 12.0 A-4
230-03-0022
1.5" TYPE 3 WC + 3.5 TYPE
3 BC 5.0 STONE 8.5
A-6, 15" TYPE
D LIME
TREATED
262-04-0005
1.5" TYPE 8 WC + 4.5"
TYPE 8 BC 6.0 AC TYPE 5B 4.5 STONE 8.5 A-4
847-02-0019
1.5" TYPE 8F WC + 4.5"
TYPE 8 BC 6.0 STONE 8.5
A-7-6, 12"
TYPE D LIME
TREATED
WC = Wearing Course, BC = Binder Course
Project 230-03-0022 was a flexible pavement rehabilitation project located on LA 75 in south
Louisiana. The existing AC and base course were removed and reconstructed. The finished
flexible pavement consisted of a 1.5-in. Type 8F wearing course, a 3.5-in. Type 8 binder
course, and an 8.5-in. crushed stone base course. The project was accepted on October 17,
2003. Two-way ADT on this route was 2,065 in the year 2003. Pavement condition surveys
were conducted in 2005, 2007, and 2008, respectively. The MEPDG-predicted pavement
distresses (and IRI) and the LA-PMS pavement performance data were compared in Figure
20.
For this particular project, the MEPDG significantly under-predicted the field wheel-path
cracking. The predicted fatigue cracking at a selected 85-percent reliability level was lower
than the mean wheel-path cracking in the field. Meanwhile, the MEPDG over-predicted the
mean rutting. However, the predicted mean IRI seemed to match well with the measured
mean IRI. The predicted IRI at 85-percent reliability level was close to the mean-plus-one-
standard-deviation IRI measured in the field.

53
Pavement Age (Month)
0 20 40 60 80 100 120 140
Fa
tig
ue
cra
ckin
g (
%)
0
2
4
6
8
10
12
14
Pavement Age (Month)
0 20 40 60 80 100 120 140
Rutt
ing (
in.)
0.0
0.1
0.2
0.3
0.4
Pavement Age (Month)
0 20 40 60 80 100 120 140
IRI
(in./
mi.)
0
20
40
60
80
100
120
140
160
PMS (mean)
PMS (mean + standard deviation)
PMS (fit)
MEPDG (mean)
MEPDG (85% reliability)
Figure 20
Predicted distress by MEPDG vs. measured distress in PMS for project 230-03-0022:
(a) fatigue cracking, (b) rutting, and (c) IRI
The similar analyses were repeated for the other five selected projects and the summary
results are presented below.
Load-related Fatigue Cracking. In this part of analysis, the MEPDG predicted
fatigue cracking was used to compare to the measured wheel-path alligator cracking reported
in the LA-PMS. As shown in Figure 21, the MEPDG predicted fatigue cracking was
generally very low, less than 0.5 percent for all six selected projects. On the other hand, most
of the measured alligator cracking values were less than 1 percent except six individual
points, all of which were from two selected projects. In fact, the majority of the selected AC
over crushed stone projects (four out of six) had less than 1 percent of the measured alligator
cracking after approximate 10 years of service. Since the fatigue cracking may be not the
(a) (b)
(c)

54
critical distress for this type of pavement in Louisiana, under such a low level of fatigue
cracking, the MEPDG fatigue cracking models seemed to be adequate in this study for AC
over crushed stone pavements in Louisiana. However, the results of hypothesis tests in Table
11 indicated that the MEPDG fatigue cracking prediction model was “biased,” partially due
to the distinct observations from two of the six selected projects. Figure 22 further indicates
that the MEPDG-predicted fatigue cracking at a selected 85-percent reliability level was able
to cover the field mean alligator cracking for four out of six selected projects.
Measured fatigue cracking (%)
0 2 4 6 8
Pre
dic
ted fatigue c
rackin
g (
%)
0
2
4
6
8
Line of E
quality LA National
N 24 405R2
0.006 0.275
Bias (%) -0.90Se (%) 1.59 5.01Se/Sy 1.007 0.815
Figure 21
Predicted mean fatigue cracking by MEPDG vs. measured mean fatigue cracking in
LA-PMS (AC over crushed stone pavement)
Table 11
Hypothesis analysis (fatigue cracking, AC over crushed stone pavement)
Null hypothesis (H0) P-Value Result
1 The mean of residual error (predicted cracking - predicted cracking) is zero. 0.012 H0 rejected
2 The slope of the predicted cracking versus the measured cracking is one. < 0.001 H0 rejected
3 The intercept of the predicted cracking versus the measured cracking is zero. 0.001 H0 rejected
Conclusion: All of the H0 hypotheses are rejected. The MEPDG-predicted fatigue cracking is “biased” from the
measured fatigue cracking for AC over crushed stone pavements.

55
Project ID
193-
02-0
039
230-
03-0
022
847-
02-0
019
058-
02-0
009
077-
02-0
013
262-
04-0
005
Fatigue c
rackin
g (
%)
0
2
4
6
8
10
Measured fatigue cracking
Predicted fatigue cracking at 85% reliability
Figure 22
Field variation of fatigue cracking vs. MEPDG design reliability
(AC over Stone pavement)
Rutting. Figure 23 shows the comparison between the predicted and the measured
mean rutting for the AC over crushed stone pavements considered. Overall, the MEPDG
over-predicted the field rutting for this type of pavement structure in Louisiana. Hypothesis
tests (Table 12) also showed that the MEPDG rutting prediction model was “biased.” In
addition, the MEPDG-predicted rut depths at a selected 85-percent reliability level were
compared with the field variation of rutting as shown in Figure 24. The results indicate that
the MEPDG-predicted rutting at the 85-percent reliability level was significantly higher than
both the measured mean rutting and the measured rutting at the mean-plus-one-standard-
deviation level. Obviously, without local calibration the MEPDG rutting model is not
applicable for the AC over crushed stone pavements in Louisiana.
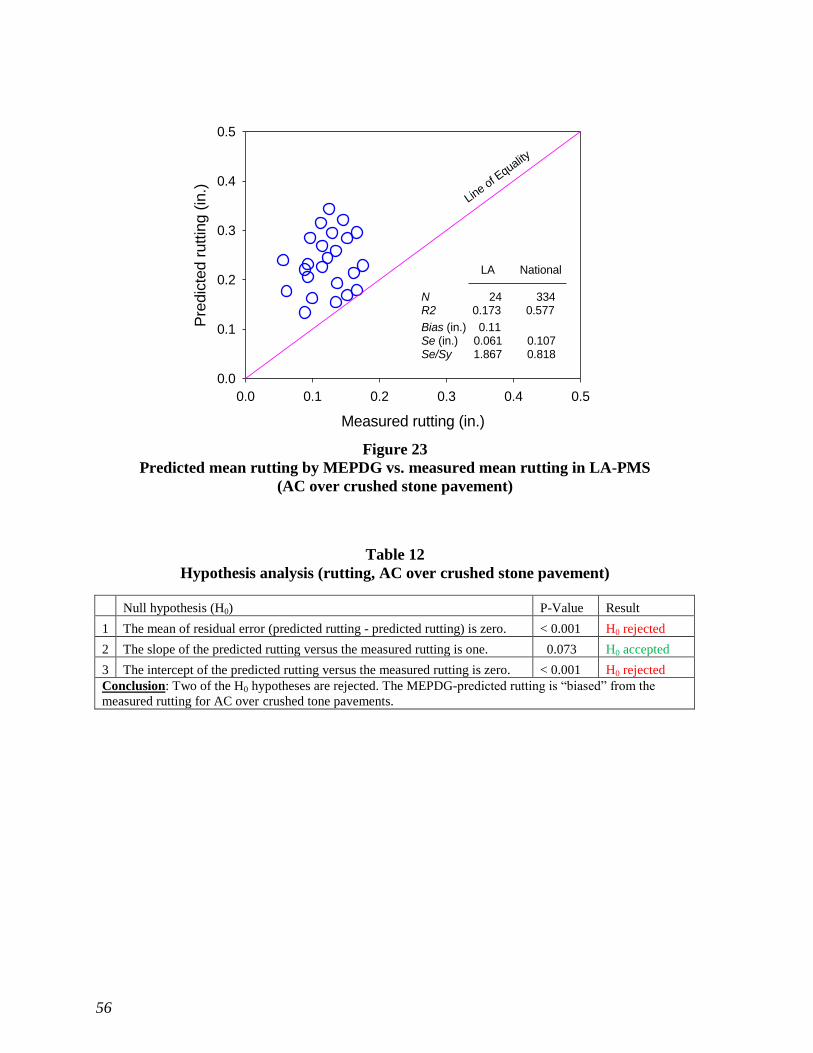
56
Measured rutting (in.)
0.0 0.1 0.2 0.3 0.4 0.5
Pre
dic
ted r
uttin
g (
in.)
0.0
0.1
0.2
0.3
0.4
0.5
Line of E
quality
LA National
N 24 334R2
0.173 0.577
Bias (in.) 0.11Se (in.) 0.061 0.107Se/Sy 1.867 0.818
Figure 23
Predicted mean rutting by MEPDG vs. measured mean rutting in LA-PMS
(AC over crushed stone pavement)
Table 12
Hypothesis analysis (rutting, AC over crushed stone pavement)
Null hypothesis (H0) P-Value Result
1 The mean of residual error (predicted rutting - predicted rutting) is zero. < 0.001 H0 rejected
2 The slope of the predicted rutting versus the measured rutting is one. 0.073 H0 accepted
3 The intercept of the predicted rutting versus the measured rutting is zero. < 0.001 H0 rejected
Conclusion: Two of the H0 hypotheses are rejected. The MEPDG-predicted rutting is “biased” from the
measured rutting for AC over crushed tone pavements.

57
Project ID
193-
02-0
039
230-
03-0
022
847-
02-0
019
058-
02-0
009
077-
02-0
013
262-
04-0
005
Ruttin
g (
in.)
0.0
0.1
0.2
0.3
0.4
0.5
0.6
Measured rutting(Error bar = ± standard deviation)
Predicted rutting at 85% reliability
Figure 24
Field variation of rutting vs. MEPDG design reliability
(AC over crushed stone pavement)
IRI. Figure 25 shows the comparison between the predicted and the measured mean
IRI for the selected AC over crushed stone pavements. Overall, the MEPDG-predicted mean
IRI matched very well with the field mean IRI, although hypothesis tests shown in Table 13
indicated that the MEPDG IRI prediction model was “biased.” Figure 25 also indicates that
the goodness-of-fit parameters obtained in this study were better than those obtained in the
national calibration of the MEPDG. In addition, Figure 26 shows that the MEPDG-predicted
IRI at an 85-percent reliability level was higher than the field mean IRI but very close to the
field IRI at the mean-plus-one-standard-deviation level for all six AC over crushed stone
projects considered. Based on the above results, the MEPDG IRI model seemed to be
adequate for the AC over crushed stone pavements in Louisiana.
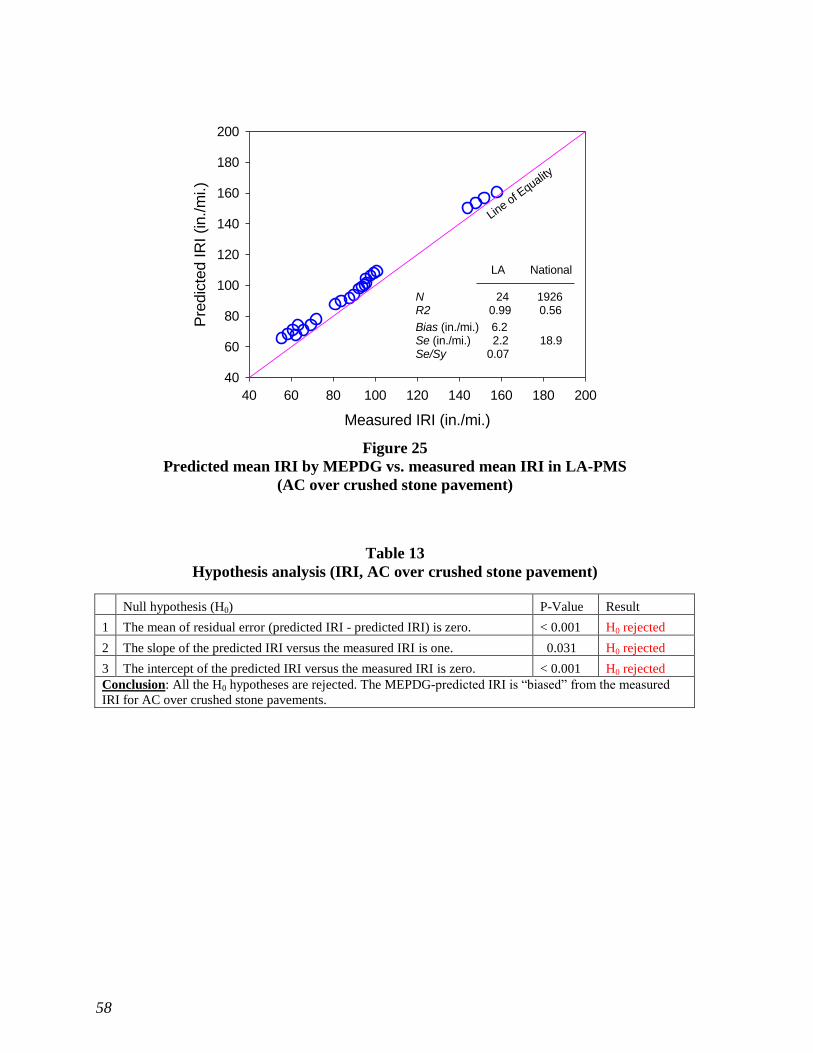
58
Measured IRI (in./mi.)
40 60 80 100 120 140 160 180 200
Pre
dic
ted IR
I (in./m
i.)
40
60
80
100
120
140
160
180
200
Line of E
quality
LA National
N 24 1926R2
0.99 0.56
Bias (in./mi.) 6.2Se (in./mi.) 2.2 18.9Se/Sy 0.07
Figure 25
Predicted mean IRI by MEPDG vs. measured mean IRI in LA-PMS
(AC over crushed stone pavement)
Table 13
Hypothesis analysis (IRI, AC over crushed stone pavement)
Null hypothesis (H0) P-Value Result
1 The mean of residual error (predicted IRI - predicted IRI) is zero. < 0.001 H0 rejected
2 The slope of the predicted IRI versus the measured IRI is one. 0.031 H0 rejected
3 The intercept of the predicted IRI versus the measured IRI is zero. < 0.001 H0 rejected
Conclusion: All the H0 hypotheses are rejected. The MEPDG-predicted IRI is “biased” from the measured
IRI for AC over crushed stone pavements.
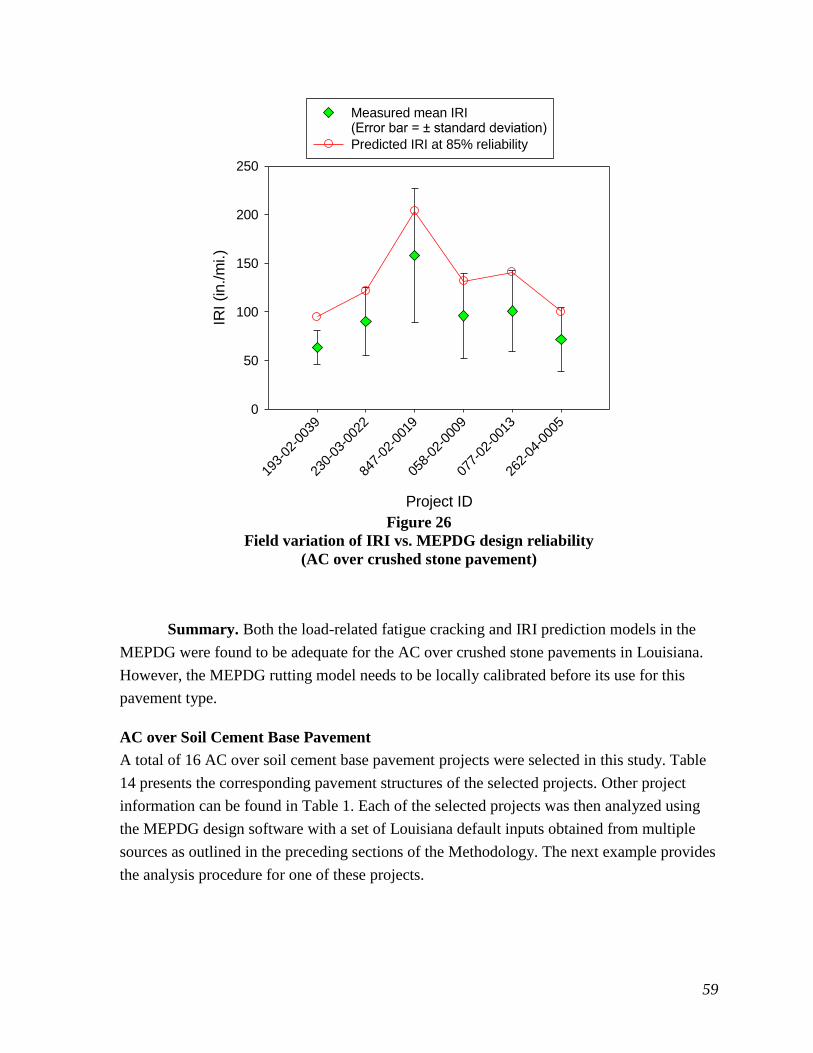
59
Project ID
193-
02-0
039
230-
03-0
022
847-
02-0
019
058-
02-0
009
077-
02-0
013
262-
04-0
005
IRI (in./m
i.)
0
50
100
150
200
250
Measured mean IRI(Error bar = ± standard deviation)
Predicted IRI at 85% reliability
Figure 26
Field variation of IRI vs. MEPDG design reliability
(AC over crushed stone pavement)
Summary. Both the load-related fatigue cracking and IRI prediction models in the
MEPDG were found to be adequate for the AC over crushed stone pavements in Louisiana.
However, the MEPDG rutting model needs to be locally calibrated before its use for this
pavement type.
AC over Soil Cement Base Pavement
A total of 16 AC over soil cement base pavement projects were selected in this study. Table
14 presents the corresponding pavement structures of the selected projects. Other project
information can be found in Table 1. Each of the selected projects was then analyzed using
the MEPDG design software with a set of Louisiana default inputs obtained from multiple
sources as outlined in the preceding sections of the Methodology. The next example provides
the analysis procedure for one of these projects.

60
Table 14
Pavement structures of the selected AC over soil cement base pavements
Pro
ject
ID
AC
Su
rfa
ce
Th
ick
nes
s o
f
AC
(in
.)
Ba
se
Th
ick
nes
s o
f
Ba
se (
in.)
Su
bg
rad
e an
d
Sta
bil
iza
tion
018-30-0018
1.5" TYPE 8 WC + 2" TYPE
8 BC 3.5
CEMENT
STABILIZED 8.5 A-6
029-07-0055
1.5" TYPE 3 WC + 2" TYPE
3 BC 3.5
CEMENT
STABILIZED 8.5 A-4
036-03-0016
1.5" TYPE 8 WC +2" TYPE
8 BC 3.5
CEMENT
STABILIZED 8.5
A-6, 12" TYPE D LIME
TREATED
067-03-0009
1.5" TYPE 3 WC + 2" TYPE
3 BC 3.5
LIME FLYASH
STABILIZED 10.0 A-6
139-06-0011
1.5" TYPE 8 WC + 2" TYPE
8 BC 3.5
CEMENT
TREATED 12.0
A-4, 12" TYPE D LIME
TREATED
211-04-0009
1.5" TYPE 8 WC + 2" TYPE
8 BC 3.5
CEMENT
STABILIZED 8.5 A-4, TYPE D LIME TREATED
260-03-0010
1.5" TYPE 8 WC + 2" TYPE
8 BC 3.5
CEMENT
STABILIZED 8.5
A-6, 15" TYPE D LIME
TREATED
261-02-0020
1.5" TYPE 8F WC + 2"
TYPE 8 BC 3.5
CEMENT
STABILIZED 8.5 A-6
268-01-0014
2" TYPE 8F WC + 2.5"
TYPE 8 BC 4.5
CEMENT
STABILIZED 8.5 A-6
397-04-0004
1.5" TYPE 8 WC + 2" TYPE
8 BC 3.5
CEMENT
STABILIZED 8.5
A-4, 12" TYPE D LIME
TREATED
432-01-0018
2" TYPE 8F WC + 2.5"
TYPE 8 BC 4.5
CEMENT
STABILIZED 8.5
A-4, 12" TYPE D LIME
TREATED
803-32-0001
1.5" TYPE 3 WC + 2" TYPE
3 BC 3.5
CEMENT
TREATED 12.0 A-4
810-07-0014
1.5" TYPE 8 WC + 2" TYPE
8 BC 3.5
CEMENT
STABILIZED 8.5
A-6, 15" TYPE D LIME
TREATED
828-15-0012
1.5" TYPE 8 WC + 2" TYPE
8 BINDER COURSE 3.5
CEMENT
STABILIZED 8.5
A-4, 12" TYPE D LIME
TREATED
839-02-0016
1.5" TYPE 3 WC + 2" TYPE
3 BC 3.5
CEMENT
TREATED 12.0 A-4
852-03-0009
2" TYPE 8F WC + 2" TYPE
8 BC 4.0
CEMENT
TREATED 12.0
A-7, 15" TYPE D LIME
TREATED, 9% BY VOLUME
WC = Wearing Course, BC = Binder Course
Project 803-32-0001 was a flexible pavement rehabilitation project located on LA 938 in east
Louisiana. The existing AC and base course were removed and reconstructed. The finished
flexible pavement consisted of a 1.5-in. Type 3 wearing course, a 2-in. Type 3 binder course,
and a 12-in. cement treated base course. The project was accepted on March 4, 1999. Two-
way ADT on this route was 2,500 in the year 1999. Pavement condition surveys were
conducted in 2000, 2002, 2004, 2007, and 2008. The MEPDG design program was run with
the collected input information. The predicted and measured distresses (and IRI) were
compared in Figure 27.
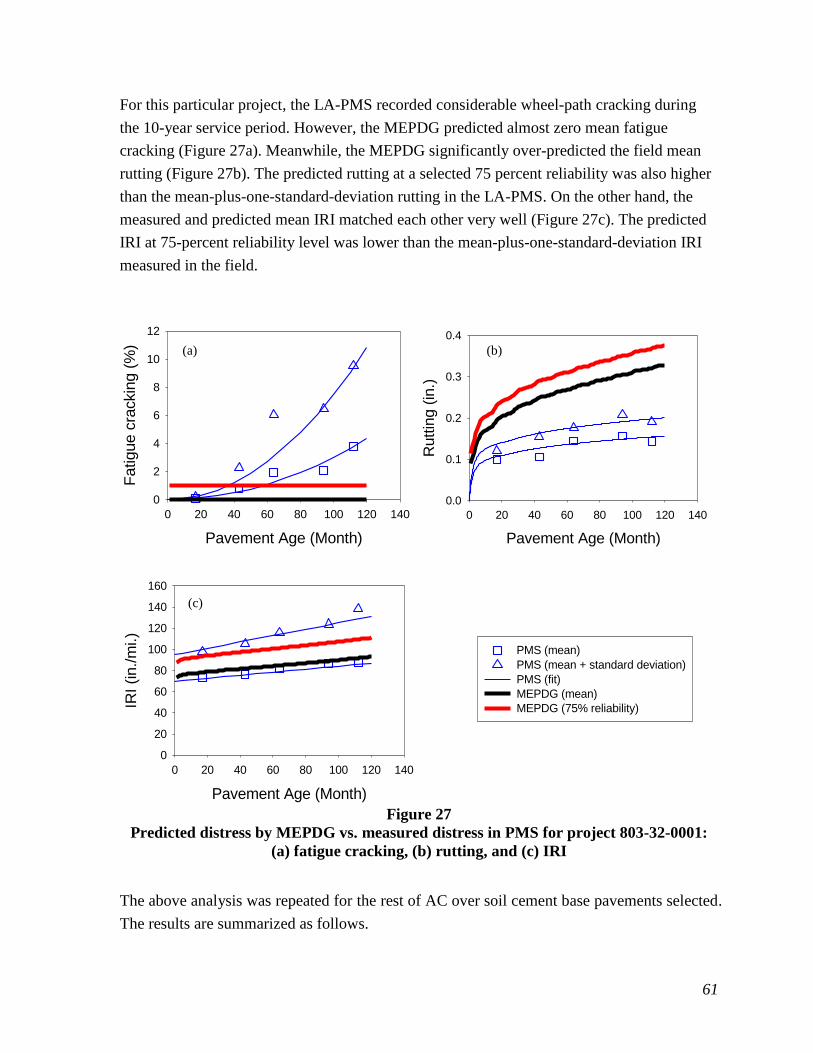
61
For this particular project, the LA-PMS recorded considerable wheel-path cracking during
the 10-year service period. However, the MEPDG predicted almost zero mean fatigue
cracking (Figure 27a). Meanwhile, the MEPDG significantly over-predicted the field mean
rutting (Figure 27b). The predicted rutting at a selected 75 percent reliability was also higher
than the mean-plus-one-standard-deviation rutting in the LA-PMS. On the other hand, the
measured and predicted mean IRI matched each other very well (Figure 27c). The predicted
IRI at 75-percent reliability level was lower than the mean-plus-one-standard-deviation IRI
measured in the field.
Pavement Age (Month)
0 20 40 60 80 100 120 140
Fatigue c
rackin
g (
%)
0
2
4
6
8
10
12
Pavement Age (Month)
0 20 40 60 80 100 120 140
Ruttin
g (
in.)
0.0
0.1
0.2
0.3
0.4
Pavement Age (Month)
0 20 40 60 80 100 120 140
IRI (in./m
i.)
0
20
40
60
80
100
120
140
160
PMS (mean)
PMS (mean + standard deviation)
PMS (fit)
MEPDG (mean)
MEPDG (75% reliability)
Figure 27
Predicted distress by MEPDG vs. measured distress in PMS for project 803-32-0001:
(a) fatigue cracking, (b) rutting, and (c) IRI
The above analysis was repeated for the rest of AC over soil cement base pavements selected.
The results are summarized as follows.
(a) (b)
(c)

62
Load-related Fatigue Cracking. In this part of the analysis, the MEPDG-predicted
load-related fatigue cracking was compared with the field wheel-path cracking reported in
the LA-PMS. In contrast to other pavement structures analyzed previously, AC over soil
cement base pavements in Louisiana often develop higher amounts of wheel-path cracking as
reported in the LA-PMS (Figure 28). However, the MEPDG predicted almost zero load-
related fatigue cracking for all the projects. Hypothesis tests (Table 15) also showed a
significant difference between the predicted fatigue cracking and the measured wheel-path
cracking. In addition, as shown in Figure 29, the MEPDG-predicted fatigue cracking at the
75-percent reliability level was also lower than the field mean wheel-path cracking for all but
one select project (810-07-0014).
According to the user manual of the MEPDG, the design software should be able to predict
the soil cement fatigue cracking and the resultant reduction of soil cement resilient modulus
over time. The predicted load-related fatigue cracking on the pavement surface by the
MEPDG should include both the load-related fatigue cracking in the AC and the reflective
cracking from the soil cement base [1]. However, it was found in this study that the
predicted reflective cracking from the soil cement base was always zero, and the resilient
modulus of the soil cement base remained constant over time. It is suspected that the soil
cement fatigue cracking model in the MEPDG may not be properly incorporated into the
design software. Furthermore, based on the local experience in Louisiana, a considerable
amount of surface cracks observed on AC over soil cement base pavements were reflective
cracking due to soil cement shrinkage. This reflective cracking, if extended into the wheel-
path, would be recorded as wheel-path alligator cracking by the LA-PMS. However, the
current MEPDG does not consider the shrinkage cracking of the soil cement base. Both of
the above two factors may contribute to the discrepancy between the measured wheel-path
cracking and the MEPDG-predicted load-related fatigue cracking for AC over soil cement
base pavements. Therefore, it is difficult to validate the accuracy of the MEPDG load-related
fatigue cracking models for AC over soil cement base pavements in this study.

63
Measured fatigue cracking (%)
0 5 10 15 20
Pre
dic
ted fatigue c
rackin
g (
%)
0
5
10
15
20
Line of E
quality LA National
N 64 405R2
0.04 0.275
Bias (%) -2.04Se (%) 2.94 5.01Se/Sy 1.000 0.815
Figure 28
Predicted mean fatigue cracking by MEPDG vs. measured mean fatigue cracking in
LA-PMS (AC over soil cement base pavement)
Table 15
Hypothesis analysis (fatigue cracking, AC over soil cement base pavement)
Null hypothesis (H0) P-Value Result
1 The mean of residual error (predicted cracking - predicted cracking) is zero. < 0.001 H0 rejected
2 The slope of the predicted cracking versus the measured cracking is one. < 0.001 H0 rejected
3 The intercept of the predicted cracking versus the measured cracking is zero. < 0.001 H0 rejected
Conclusion: All of the H0 hypotheses are rejected. The MEPDG-predicted fatigue cracking is “biased” from the
measured fatigue cracking for AC over soil cement pavements.

64
Project ID
018-
30-0
018
261-
02-0
020
268-
01-0
014
810-
07-0
014
828-
15-0
012
852-
03-0
009
260-
03-0
010
801-
32-0
001
067-
03-0
009
029-
07-0
055
839-
02-0
016
432-
01-0
018
139-
06-0
011
211-
04-0
009
036-
03-0
016
397-
04-0
004
Fatigue c
rackin
g (
%)
0
5
10
15
20
25
30
Measured fatigue cracking
Predicted fatigue cracking at 75% reliability
Figure 29
Field variation of fatigue cracking vs. MEPDG design reliability
(AC over soil cement base pavement)
Rutting. Figure 30 shows the comparison between the predicted and the measured
mean rutting for the AC over soil cement base pavements selected. Overall, the MEPDG
over-predicted the rutting for this type of pavement in Louisiana. Hypothesis tests (Table 16)
also indicated a significant difference between the MEPDG-predicted and the measured
rutting in the LA-PMS. In addition, as shown in Figure 31, the MEPDG-predicted rutting at a
selected 75-percent reliability level was consistently higher than the field measured rutting at
the mean-plus-one-standard-deviation level. These results suggest that a local calibration of
the MEPDG rutting model is needed for designing the AC over soil cement base pavements
in Louisiana.
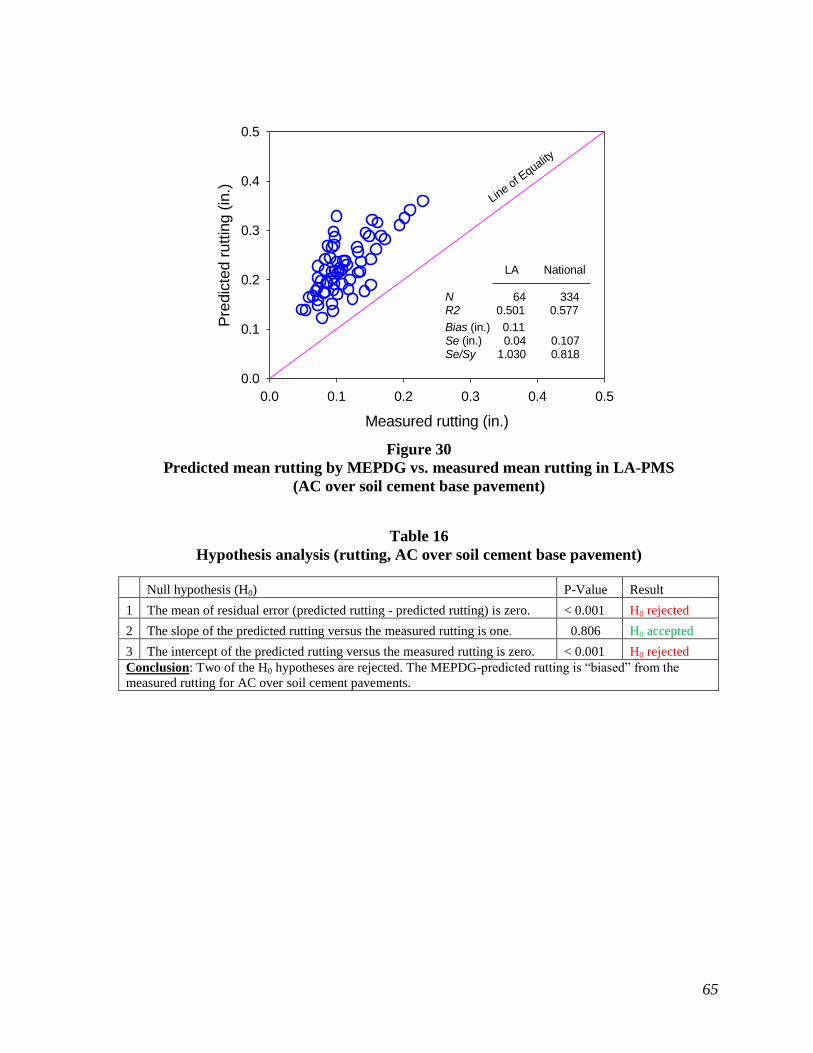
65
Measured rutting (in.)
0.0 0.1 0.2 0.3 0.4 0.5
Pre
dic
ted r
uttin
g (
in.)
0.0
0.1
0.2
0.3
0.4
0.5
Line of E
quality
LA National
N 64 334R2
0.501 0.577
Bias (in.) 0.11Se (in.) 0.04 0.107Se/Sy 1.030 0.818
Figure 30
Predicted mean rutting by MEPDG vs. measured mean rutting in LA-PMS
(AC over soil cement base pavement)
Table 16
Hypothesis analysis (rutting, AC over soil cement base pavement)
Null hypothesis (H0) P-Value Result
1 The mean of residual error (predicted rutting - predicted rutting) is zero. < 0.001 H0 rejected
2 The slope of the predicted rutting versus the measured rutting is one. 0.806 H0 accepted
3 The intercept of the predicted rutting versus the measured rutting is zero. < 0.001 H0 rejected
Conclusion: Two of the H0 hypotheses are rejected. The MEPDG-predicted rutting is “biased” from the
measured rutting for AC over soil cement pavements.
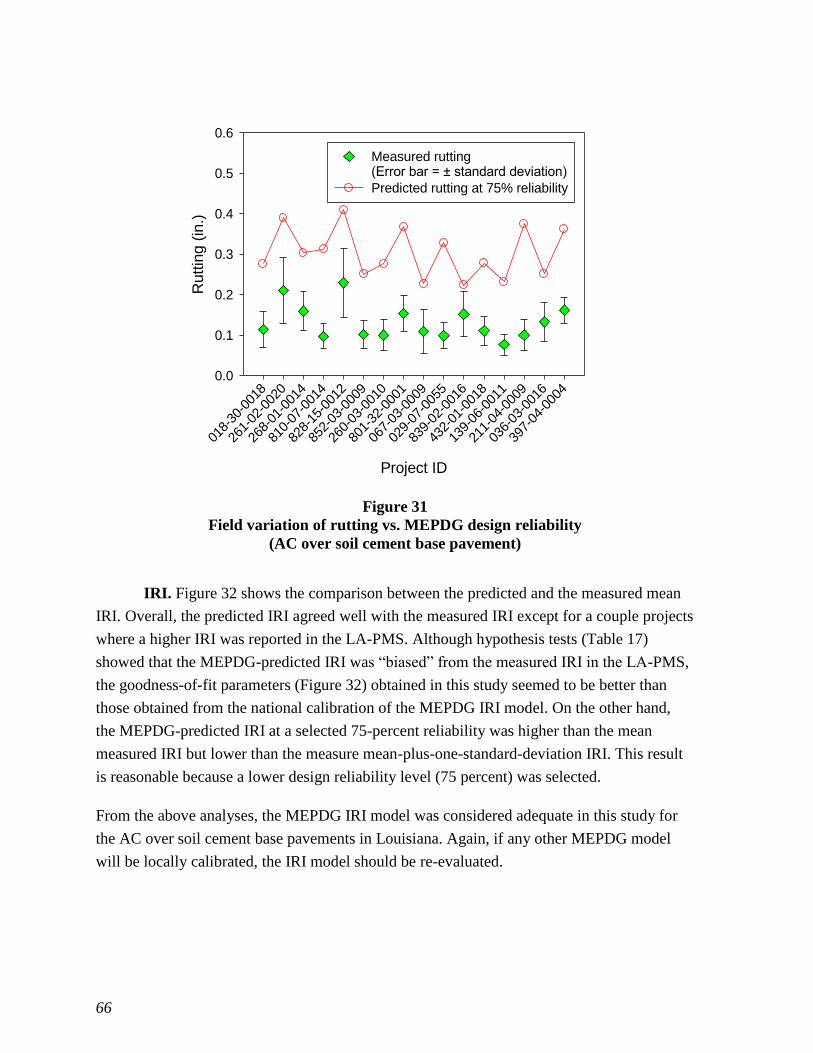
66
Project ID
018-
30-0
018
261-
02-0
020
268-
01-0
014
810-
07-0
014
828-
15-0
012
852-
03-0
009
260-
03-0
010
801-
32-0
001
067-
03-0
009
029-
07-0
055
839-
02-0
016
432-
01-0
018
139-
06-0
011
211-
04-0
009
036-
03-0
016
397-
04-0
004
Ruttin
g (
in.)
0.0
0.1
0.2
0.3
0.4
0.5
0.6
Measured rutting(Error bar = ± standard deviation)
Predicted rutting at 75% reliability
Figure 31
Field variation of rutting vs. MEPDG design reliability
(AC over soil cement base pavement)
IRI. Figure 32 shows the comparison between the predicted and the measured mean
IRI. Overall, the predicted IRI agreed well with the measured IRI except for a couple projects
where a higher IRI was reported in the LA-PMS. Although hypothesis tests (Table 17)
showed that the MEPDG-predicted IRI was “biased” from the measured IRI in the LA-PMS,
the goodness-of-fit parameters (Figure 32) obtained in this study seemed to be better than
those obtained from the national calibration of the MEPDG IRI model. On the other hand,
the MEPDG-predicted IRI at a selected 75-percent reliability was higher than the mean
measured IRI but lower than the measure mean-plus-one-standard-deviation IRI. This result
is reasonable because a lower design reliability level (75 percent) was selected.
From the above analyses, the MEPDG IRI model was considered adequate in this study for
the AC over soil cement base pavements in Louisiana. Again, if any other MEPDG model
will be locally calibrated, the IRI model should be re-evaluated.
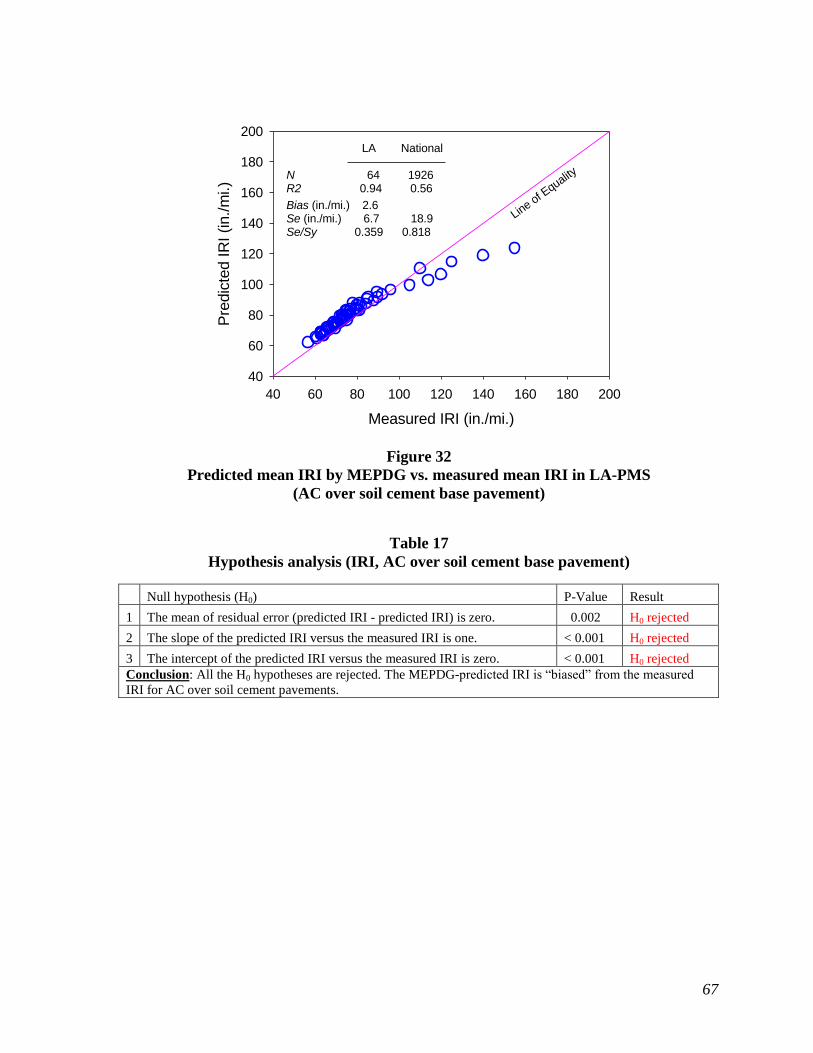
67
Measured IRI (in./mi.)
40 60 80 100 120 140 160 180 200
Pre
dic
ted IR
I (in./m
i.)
40
60
80
100
120
140
160
180
200
Line of E
quality
LA National
N 64 1926R2
0.94 0.56
Bias (in./mi.) 2.6Se (in./mi.) 6.7 18.9Se/Sy 0.359 0.818
Figure 32
Predicted mean IRI by MEPDG vs. measured mean IRI in LA-PMS
(AC over soil cement base pavement)
Table 17
Hypothesis analysis (IRI, AC over soil cement base pavement)
Null hypothesis (H0) P-Value Result
1 The mean of residual error (predicted IRI - predicted IRI) is zero. 0.002 H0 rejected
2 The slope of the predicted IRI versus the measured IRI is one. < 0.001 H0 rejected
3 The intercept of the predicted IRI versus the measured IRI is zero. < 0.001 H0 rejected
Conclusion: All the H0 hypotheses are rejected. The MEPDG-predicted IRI is “biased” from the measured
IRI for AC over soil cement pavements.

68
Project ID
018-
30-0
018
261-
02-0
020
268-
01-0
014
810-
07-0
014
828-
15-0
012
852-
03-0
009
260-
03-0
010
801-
32-0
001
067-
03-0
009
029-
07-0
055
839-
02-0
016
432-
01-0
018
139-
06-0
011
211-
04-0
009
036-
03-0
016
397-
04-0
004
IRI (in./m
i.)
0
50
100
150
200
250
Measured mean IRI(Error bar = ± standard deviation)
Predicted IRI at 75% reliability
Figure 33
Field variation of IRI vs. MEPDG design reliability
(AC over soil cement base pavement)
Summary. AC over soil cement base pavements developed considerable wheel-path
cracking as reported in the LA-PMS. The MEPDG-predicted load-related fatigue cracking
was significantly less compared with the field wheel-path cracking for most of the selected
projects. The discrepancy was likely caused by (1) the software issue in the MEPDG and (2)
soil cement shrinkage cracking issue in the LA-PMS. Meanwhile, the MEPDG over-
predicted the rutting for all the 16 selected projects. A local calibration of the MEPDG
fatigue cracking and rutting models is thus recommended. The IRI model in the MEPDG
seemed to be adequate for AC over soil cement base pavements in Louisiana.
AC over Stone Interlayer Pavement
AC over stone interlayer pavement is a special pavement structure used in Louisiana, which
is modified from the conventional AC over soil cement base pavement structure. In this type
of pavement, a crushed stone interlayer is placed between the AC and the soil cement layer in
order to mitigate the reflective cracking in the AC due to soil cement shrinkage. Most of the
projects with the AC over stone interlayer pavement structure in Louisiana were constructed
within the last five years. These projects only have one or two pavement condition survey
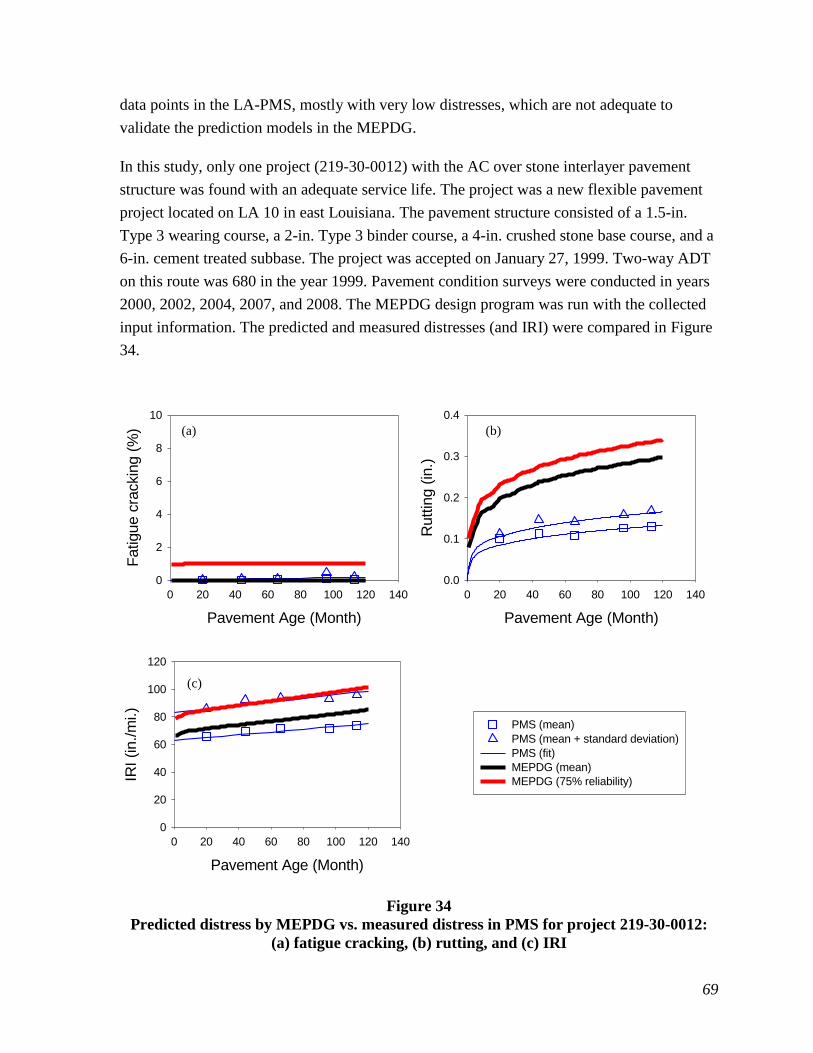
69
data points in the LA-PMS, mostly with very low distresses, which are not adequate to
validate the prediction models in the MEPDG.
In this study, only one project (219-30-0012) with the AC over stone interlayer pavement
structure was found with an adequate service life. The project was a new flexible pavement
project located on LA 10 in east Louisiana. The pavement structure consisted of a 1.5-in.
Type 3 wearing course, a 2-in. Type 3 binder course, a 4-in. crushed stone base course, and a
6-in. cement treated subbase. The project was accepted on January 27, 1999. Two-way ADT
on this route was 680 in the year 1999. Pavement condition surveys were conducted in years
2000, 2002, 2004, 2007, and 2008. The MEPDG design program was run with the collected
input information. The predicted and measured distresses (and IRI) were compared in Figure
34.
Pavement Age (Month)
0 20 40 60 80 100 120 140
Fatigue c
rackin
g (
%)
0
2
4
6
8
10
Pavement Age (Month)
0 20 40 60 80 100 120 140
Ruttin
g (
in.)
0.0
0.1
0.2
0.3
0.4
Pavement Age (Month)
0 20 40 60 80 100 120 140
IRI (in./m
i.)
0
20
40
60
80
100
120
PMS (mean)
PMS (mean + standard deviation)
PMS (fit)
MEPDG (mean)
MEPDG (75% reliability)
Figure 34
Predicted distress by MEPDG vs. measured distress in PMS for project 219-30-0012:
(a) fatigue cracking, (b) rutting, and (c) IRI
(a) (b)
(c)

70
As expected, in a 10-year service life, very little wheel-path cracking was reported in the LA-
PMS for this project as compared to conventional AC over soil cement base pavements. The
MEPDG-predicted load-related fatigue cracking was also almost zero (Figure 34a). However,
the MEPDG significantly over-predicted the field measured rutting (as shown in Figure 34b).
Similar trends were observed for AC over RPCC base, AC over crushed stone, and AC over
soil cement base pavements. In addition, the measured and predicted mean IRI matched well
with each other. The predicted IRI at a selected 75-percent reliability also matched well with
the mean-plus-one-standard-deviation IRI measured in the field (Figure 34c).
The above analyses seemed to indicate that both the MEPDG fatigue cracking and the IRI
models were adequate; whereas, the MEPDG rutting model over-predicted the field rutting
for AC over stone interlayer pavements in Louisiana. However, these results have to be
further verified as more projects with this type of pavement structure and longer service
periods become available.
ANOVA and Multiple Comparisons
The ANOVA and multiple comparisons analyses were performed to determine whether the
residual errors (the predicted value minus the measured value) of the MEPDG prediction
models were affected by factors such as pavement type, traffic volume, subgrade modulus,
and geographic locations.
Since the MEPDG IRI model was found generally adequate for most of the selected projects,
only the residual errors of the MEPDG load-related fatigue cracking and rutting models were
evaluated in the ANOVA and multiple comparisons analyses.
The Effect of Pavement Type
A total of 39 projects were included in this part of analysis except the AC over stone
interlayer pavement project, because a single case cannot represent the statistical
characteristics for this type of pavement.
The ANOVA result (Table 18) indicated that the mean residual error of the MEPDG fatigue
cracking prediction models for at least one of the four pavement types was different from that
of the other pavement types.
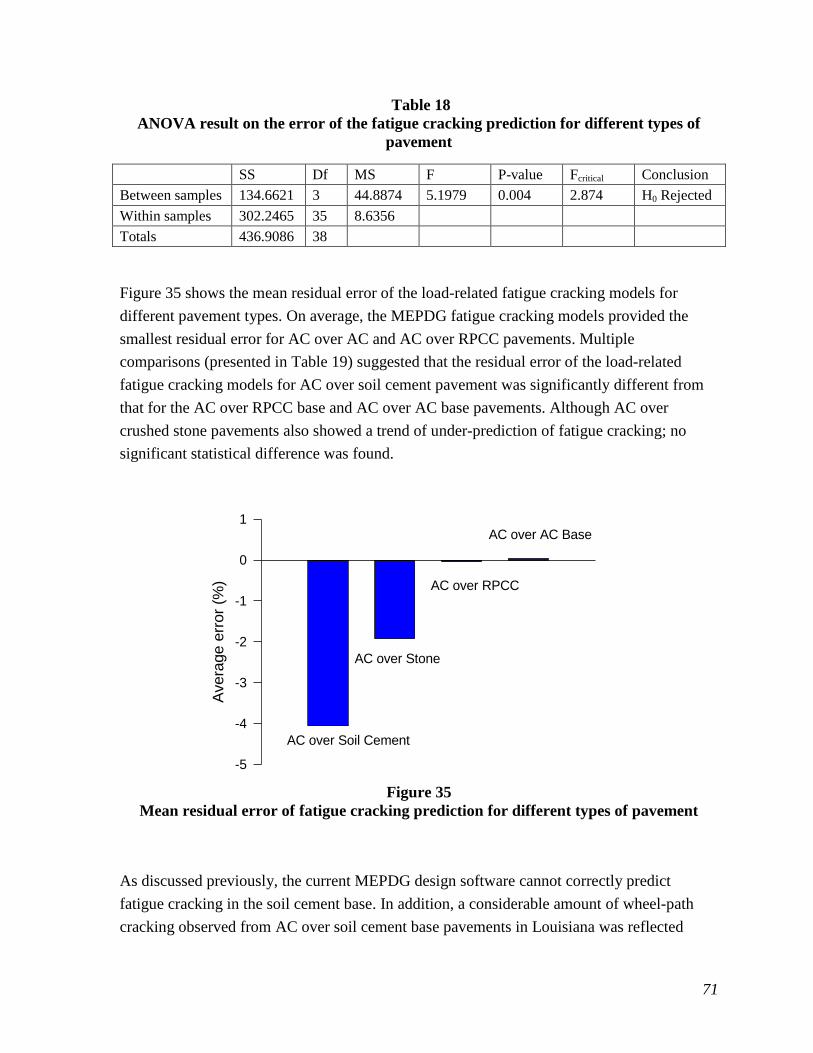
71
Table 18
ANOVA result on the error of the fatigue cracking prediction for different types of
pavement
SS Df MS F P-value Fcritical Conclusion
Between samples 134.6621 3 44.8874 5.1979 0.004 2.874 H0 Rejected
Within samples 302.2465 35 8.6356
Totals 436.9086 38
Figure 35 shows the mean residual error of the load-related fatigue cracking models for
different pavement types. On average, the MEPDG fatigue cracking models provided the
smallest residual error for AC over AC and AC over RPCC pavements. Multiple
comparisons (presented in Table 19) suggested that the residual error of the load-related
fatigue cracking models for AC over soil cement pavement was significantly different from
that for the AC over RPCC base and AC over AC base pavements. Although AC over
crushed stone pavements also showed a trend of under-prediction of fatigue cracking; no
significant statistical difference was found.
Avera
ge e
rror
(%)
-5
-4
-3
-2
-1
0
1
AC over Soil Cement
AC over Stone
AC over RPCC
AC over AC Base
Figure 35
Mean residual error of fatigue cracking prediction for different types of pavement
As discussed previously, the current MEPDG design software cannot correctly predict
fatigue cracking in the soil cement base. In addition, a considerable amount of wheel-path
cracking observed from AC over soil cement base pavements in Louisiana was reflected
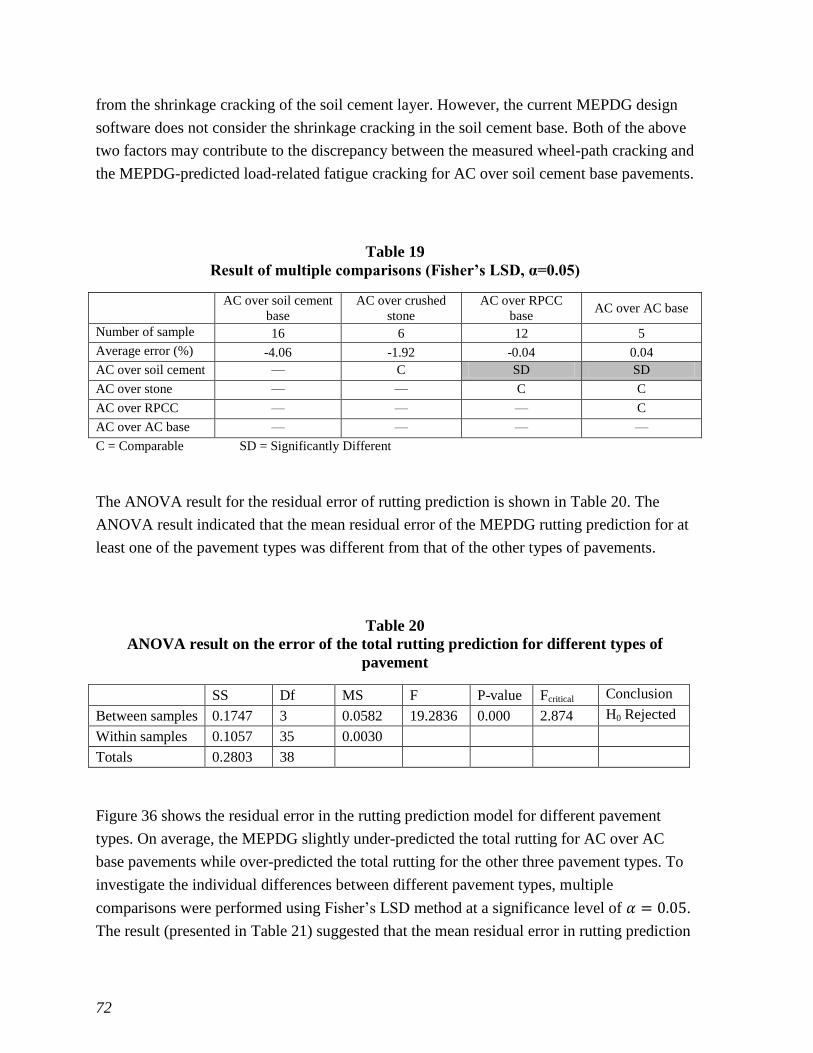
72
from the shrinkage cracking of the soil cement layer. However, the current MEPDG design
software does not consider the shrinkage cracking in the soil cement base. Both of the above
two factors may contribute to the discrepancy between the measured wheel-path cracking and
the MEPDG-predicted load-related fatigue cracking for AC over soil cement base pavements.
Table 19
Result of multiple comparisons (Fisher’s LSD, α=0.05)
AC over soil cement
base
AC over crushed
stone
AC over RPCC
base AC over AC base
Number of sample 16 6 12 5
Average error (%) -4.06 -1.92 -0.04 0.04
AC over soil cement — C SD SD
AC over stone — — C C
AC over RPCC — — — C
AC over AC base — — — —
C = Comparable SD = Significantly Different
The ANOVA result for the residual error of rutting prediction is shown in Table 20. The
ANOVA result indicated that the mean residual error of the MEPDG rutting prediction for at
least one of the pavement types was different from that of the other types of pavements.
Table 20
ANOVA result on the error of the total rutting prediction for different types of
pavement
SS Df MS F P-value Fcritical Conclusion
Between samples 0.1747 3 0.0582 19.2836 0.000 2.874 H0 Rejected
Within samples 0.1057 35 0.0030
Totals 0.2803 38
Figure 36 shows the residual error in the rutting prediction model for different pavement
types. On average, the MEPDG slightly under-predicted the total rutting for AC over AC
base pavements while over-predicted the total rutting for the other three pavement types. To
investigate the individual differences between different pavement types, multiple
comparisons were performed using Fisher’s LSD method at a significance level of .
The result (presented in Table 21) suggested that the mean residual error in rutting prediction
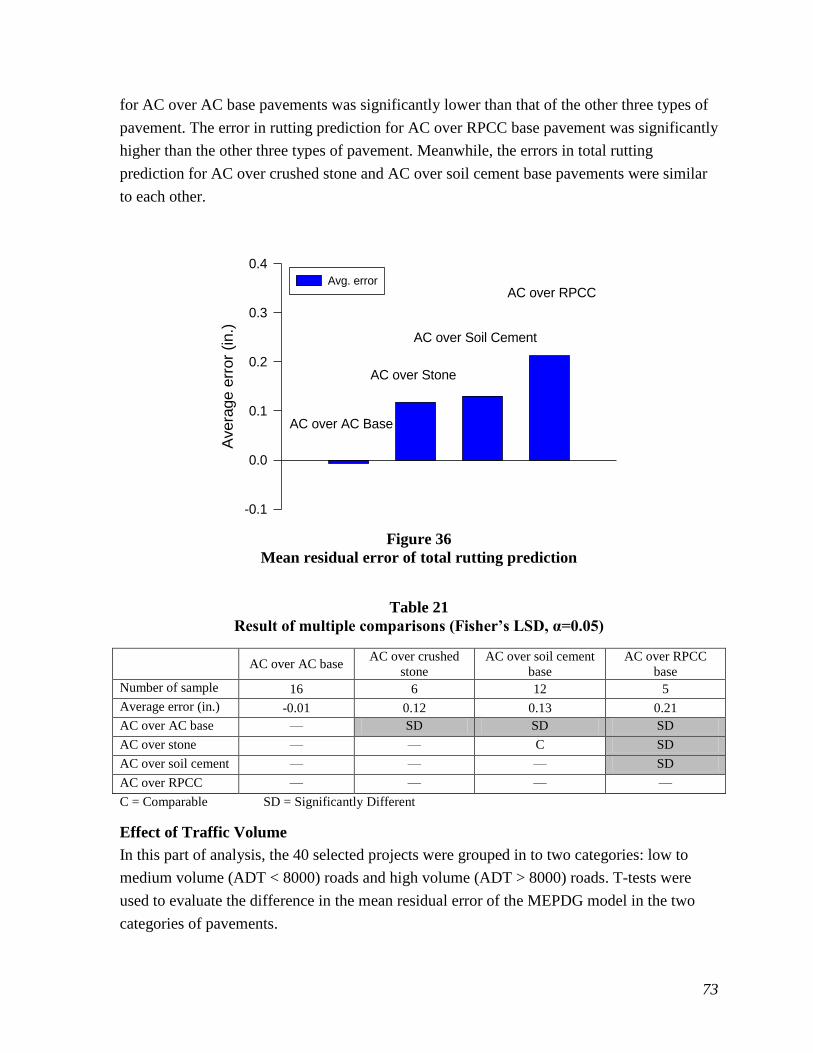
73
for AC over AC base pavements was significantly lower than that of the other three types of
pavement. The error in rutting prediction for AC over RPCC base pavement was significantly
higher than the other three types of pavement. Meanwhile, the errors in total rutting
prediction for AC over crushed stone and AC over soil cement base pavements were similar
to each other.
Avera
ge e
rror
(in.)
-0.1
0.0
0.1
0.2
0.3
0.4
Avg. error
AC over AC Base
AC over Stone
AC over Soil Cement
AC over RPCC
Figure 36
Mean residual error of total rutting prediction
Table 21
Result of multiple comparisons (Fisher’s LSD, α=0.05)
AC over AC base
AC over crushed
stone
AC over soil cement
base
AC over RPCC
base
Number of sample 16 6 12 5
Average error (in.) -0.01 0.12 0.13 0.21
AC over AC base — SD SD SD
AC over stone — — C SD
AC over soil cement — — — SD
AC over RPCC — — — —
C = Comparable SD = Significantly Different
Effect of Traffic Volume
In this part of analysis, the 40 selected projects were grouped in to two categories: low to
medium volume (ADT < 8000) roads and high volume (ADT > 8000) roads. T-tests were
used to evaluate the difference in the mean residual error of the MEPDG model in the two
categories of pavements.
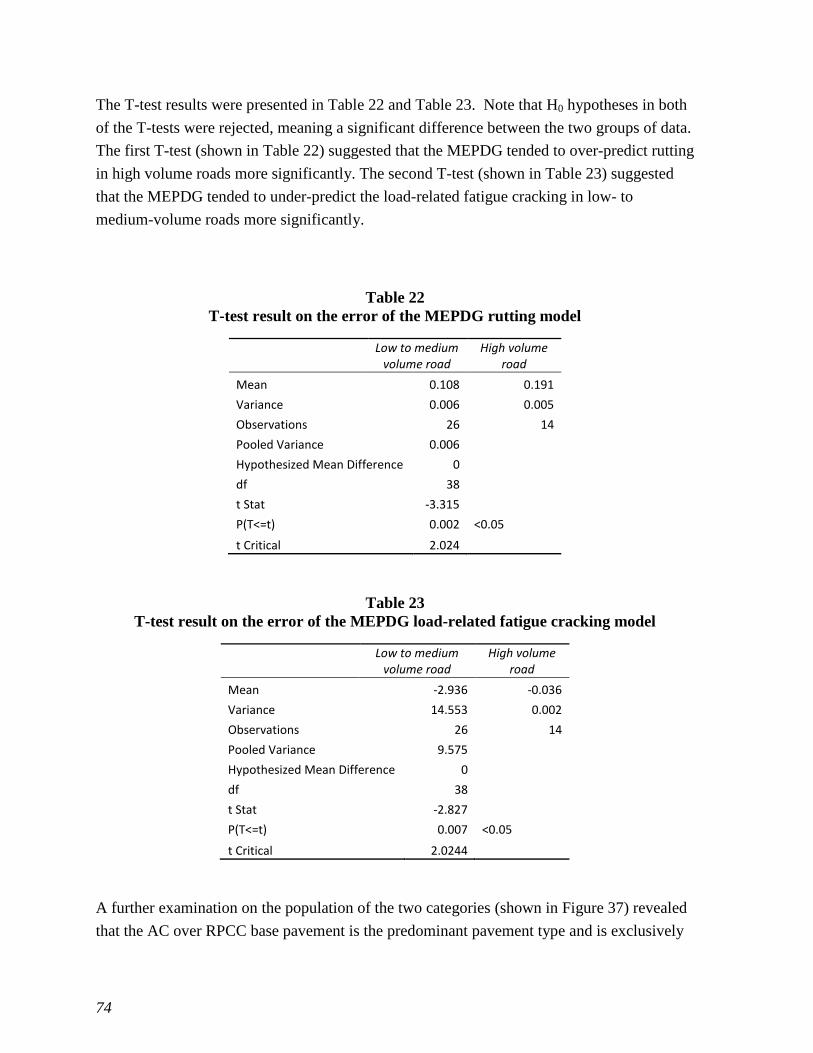
74
The T-test results were presented in Table 22 and Table 23. Note that H0 hypotheses in both
of the T-tests were rejected, meaning a significant difference between the two groups of data.
The first T-test (shown in Table 22) suggested that the MEPDG tended to over-predict rutting
in high volume roads more significantly. The second T-test (shown in Table 23) suggested
that the MEPDG tended to under-predict the load-related fatigue cracking in low- to
medium-volume roads more significantly.
Table 22
T-test result on the error of the MEPDG rutting model
Low to medium
volume road High volume
road
Mean 0.108 0.191
Variance 0.006 0.005
Observations 26 14
Pooled Variance 0.006 Hypothesized Mean Difference 0 df 38 t Stat -3.315 P(T<=t) 0.002 <0.05
t Critical 2.024
Table 23
T-test result on the error of the MEPDG load-related fatigue cracking model
Low to medium
volume road High volume
road
Mean -2.936 -0.036
Variance 14.553 0.002
Observations 26 14
Pooled Variance 9.575 Hypothesized Mean Difference 0 df 38 t Stat -2.827 P(T<=t) 0.007 <0.05
t Critical 2.0244
A further examination on the population of the two categories (shown in Figure 37) revealed
that the AC over RPCC base pavement is the predominant pavement type and is exclusively

75
used in high volume roads. Similarly, AC over soil cement base pavement is the predominant
pavement type and is exclusively used in the low to medium volume roads. Thus the
difference in the error of the MEPDG models for the two levels of traffic volume can be
explained by the different pavement type as discussed previously.
Rubblized PCC
Full-depth AC
Stone base
CSM base
Interlayered
(a) (b)
Figure 37
Pavement types in each category: (a) low to medium volume, (b) high volume
Effect of Subgrade Modulus
The subgade Mr values of the 40 selected projects ranged from 7,627 to 10,634 psi with an
average of 9,212 psi. In this part of analysis, the selected projects were grouped into two
categories: stiffer subgrade (Mr > 9000 psi) and weaker subgrade (Mr < 9000 psi).
In order to balance the effect of the pavement type, 26 projects were selected in this part of
analysis, 13 of which are on stiffer subgrade and the other 13 projects are on softer subgrade.
Each category includes the same amount of project of each pavement type. The result of the
T-test result (shown in Table 24) on the error of total rutting indicated that the MEPDG
tended to over-predict rutting for pavements on weaker subgrade more significantly.
However, no significant difference was found in the error of fatigue cracking model between
softer and stiffer subgrades, as shown in Table 25.

76
Table 24
T-test result on the error of the MEPDG rutting model
Weaker subgrade Stiffer subgrade
Mean 0.157 0.089
Variance 0.003 0.011
Observations 13 13
Pooled Variance 0.007 Hypothesized Mean Difference 0 df 24 t Stat 2.066 P(T<=t) 0.049 <0.05
t Critical 2.064
Table 25
T-test result on the error of the MEPDG load-related fatigue cracking model
Weaker subgrade Stiffer subgrade
Mean -1.273 -2.482
Variance 2.746 26.408
Observations 13 13
Pooled Variance 14.577 Hypothesized Mean Difference 0 df 24 t Stat 0.807 P(T<=t) 0.427 >0.05
t Critical 2.064
Effect of Location
In this part of analysis, the state of Louisiana was divided into two geographic regions by a
line with a latitude of 30.6 degree (shown in Figure 38). North of this line represents the hilly
area with a higher average elevation, a lower year-round average temperature, and a wider
range of temperature variation. South of this line represents the coastal plain areas with a
lower average elevation, a higher year-round average temperature, and a narrower range of
temperature variation.
To balance the effect of the pavement type, 10 projects were selected from each geographic
region with same numbers of projects of each pavement type. The result of the T-test (shown
in Table 26) on the error of total rutting indicated that the MEPDG tended to over-predict
rutting more significantly for pavements in south Louisiana. Since subgrade soils in south

77
Louisiana are generally softer than those in the north Louisiana, the influence of the
geographic location can be explained by the different subgrade Mr as described in the
previous section of this report.
Figure 38
Division of the two geographic regions in Louisiana (courtesy of www.geology.com)
When analyzing load-related fatigue cracking, the AC over RPCC and AC over AC base
projects were excluded because this two types of pavements show very small amounts of
field cracking. For the remaining seven AC over soil cement base and AC over crushed stone
projects in each group, T-test results (shown in Table 27) indicated that the MEPDG tended
to under-predict load-related fatigue cracking in north Louisiana more significantly. Since the
MEPDG predicted almost no fatigue cracking for all the selected projects as shown
previously, the PMS records more fatigue cracking in pavements in north than in south
Louisiana.
Latitude =30.6°

78
Table 26
T-test result on the error of the MEPDG rutting model
South North
Mean 0.154 0.060
Variance 0.007 0.010
Observations 10 10
Pooled Variance 0.008 Hypothesized Mean Difference 0 Degree of freedom 18 t Stat 2.298 P(T<=t) 0.034 <0.05
t Critical 2.100
Table 27
T-test result on the error of the MEPDG load-related fatigue cracking model
South North
Mean -0.904 -3.064
Variance 0.619 3.847
Observations 7 7
Pooled Variance 2.233 Hypothesized Mean Difference 0 df 12 t Stat 2.705 P(T<=t) 0.019 <0.05
t Critical 2.179
Local Calibration Factors for the Rutting Models
A preliminary calibration of the MEPDG rutting models was conducted for AC over RPCC
base and AC over soil cement base pavements. These two pavement types were selected
because the investigators were able to locate a sufficient number of projects to run a valid
local calibration. Since the MEPDG does not consider the permanent deformation within
either the RPCC or the soil cement layer, only the local calibration factors for AC ( ) and
subgrade ( ) were obtained.
Table 28 presents the local calibration factors obtained in this study using the special
calibration approach described in the preceding section of the Methodology. It is shown that
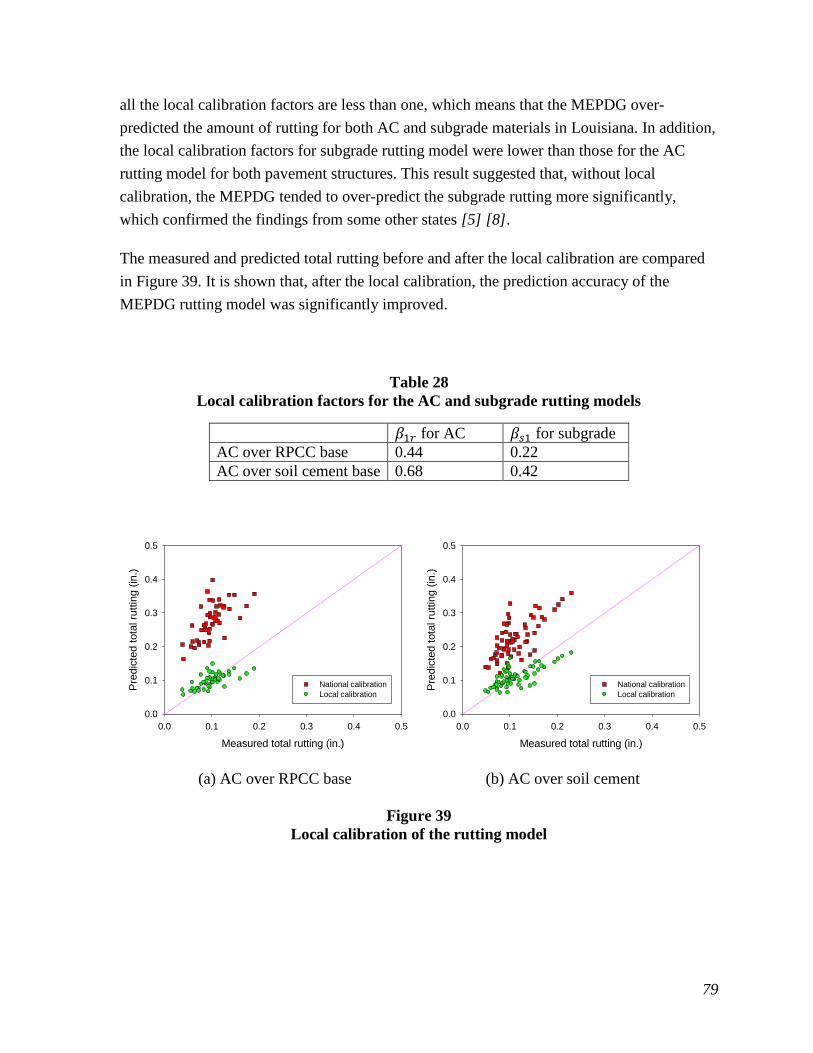
79
all the local calibration factors are less than one, which means that the MEPDG over-
predicted the amount of rutting for both AC and subgrade materials in Louisiana. In addition,
the local calibration factors for subgrade rutting model were lower than those for the AC
rutting model for both pavement structures. This result suggested that, without local
calibration, the MEPDG tended to over-predict the subgrade rutting more significantly,
which confirmed the findings from some other states [5] [8].
The measured and predicted total rutting before and after the local calibration are compared
in Figure 39. It is shown that, after the local calibration, the prediction accuracy of the
MEPDG rutting model was significantly improved.
Table 28
Local calibration factors for the AC and subgrade rutting models
for AC for subgrade
AC over RPCC base 0.44 0.22
AC over soil cement base 0.68 0.42
Measured total rutting (in.)
0.0 0.1 0.2 0.3 0.4 0.5
Pre
dic
ted tota
l ru
ttin
g (
in.)
0.0
0.1
0.2
0.3
0.4
0.5
National calibration
Local calibration
Measured total rutting (in.)
0.0 0.1 0.2 0.3 0.4 0.5
Pre
dic
ted tota
l ru
ttin
g (
in.)
0.0
0.1
0.2
0.3
0.4
0.5
National calibration
Local calibration
(a) AC over RPCC base (b) AC over soil cement
Figure 39
Local calibration of the rutting model

80
Design Example of Using MEPDG
An AC over AC base pavement project (ID: 267-02-0022) was selected to demonstrate the
use of the MEPDG. AC over AC base pavement type was selected because the nationally
calibrated MEPDG, based on the current available data, showed adequate prediction power
for both rutting and fatigue cracking of this type of pavement. Table 29 summarizes the
original design of the project according to the AASHTO 1993 design guide. The designed
pavement structure consists of a 2.0-in. Type 8F AC wearing course, a 3.0-in. Type 8 AC
binder course, and a 5.0-in. Type 5 AC base course. The calculated structure number of the
designed pavement structure is 3.69, which meets the design requirement.
Table 29
Summary of the AASHTO 1993 design
Flexible Pavement Design Design Life 20 years
18-kip ESALs over Initial Performance Period 2,257,822
Initial Serviceability 4
Terminal Serviceability 2
Reliability Level 85%
Roadbed Soil Resilient Modulus 8400 psi
Calculated Design Structural Number
3.56
Specified Layer Design Layer Material Struct. Coef. Drain. Coef. Thickness (in.) SN
1 Type 8FAC WC 0.44 1 2.0 0.88
2 Type 8 AC BC 0.44 1 3.0 1.32
3 Type 5 AC BS 0.33 0.9 5.0 1.49
Total 10.0 3.69
If the same project is to be designed using the MEPDG, more input information is needed.
Table 30 summarizes the input information for the project. Most of the inputs were collected
as described in the Methodology section of this report except that the design traffic volume
(AADTT and growth factor) was used rather than the monitored traffic volume. The
pavement structure shown in Table 30 was determined from a trial-and-error process. The
designed pavement structure, with a total of 8.5-in. thick AC, was able to meet all the
performance criteria. The predicted pavement performance by the MEPDG is presented in
Figures 40 to 43.

81
Table 30
Input information for the MEPDG
General Information Design Life 20 years
Base/Subgrade Construction Month July, 2004
Pavement Construction Month September, 2004
Traffic Open Month October, 2004
Type of Design Flexible Pavement
Analysis Parameters
Initial IRI 83
Performance Criteria MEPDG Default
Reliability 85%
Traffic
Two-way AADTT 770
Number of Lane in Design Direction 1
% of Truck in the Design Direction 50%
% of Truck in the Design Lane 100%
Operation Speed 52
Growth Factor No growth
Vehicle Class Distribution Class: 4 5 6 7 8 9 10 11 12 13
%: 5 36.8 14 1.4 13.3 25.1 2.7 0 0 1.7
Monthly Adjustment MEPDG Default
Hourly Truck Distribution MEPDG Default
Axle Load Distribution Factors Louisiana Default (TTC 12)
Number of Axle/Truck Louisiana Default (See Table 31)
Axle Configuration MEPDG Default
Wheel Base MEPDG Default
Climate
Weather Station Baton Rouge, LA
Groundwater Table Annual Average 10 ft.
Structure
Type 8F AC Wearing Course 1.5 in. PG 76-22
Type 8 AC Binder Course 2.0 in. PG 76-22
Type 5 AC Base course 5.0 in. PG 64-22
Subgrade (Treated) 12 in., A-6, Mr = 16800 psi
Subgrade (Natural)
A-6, Mr = 8400 psi
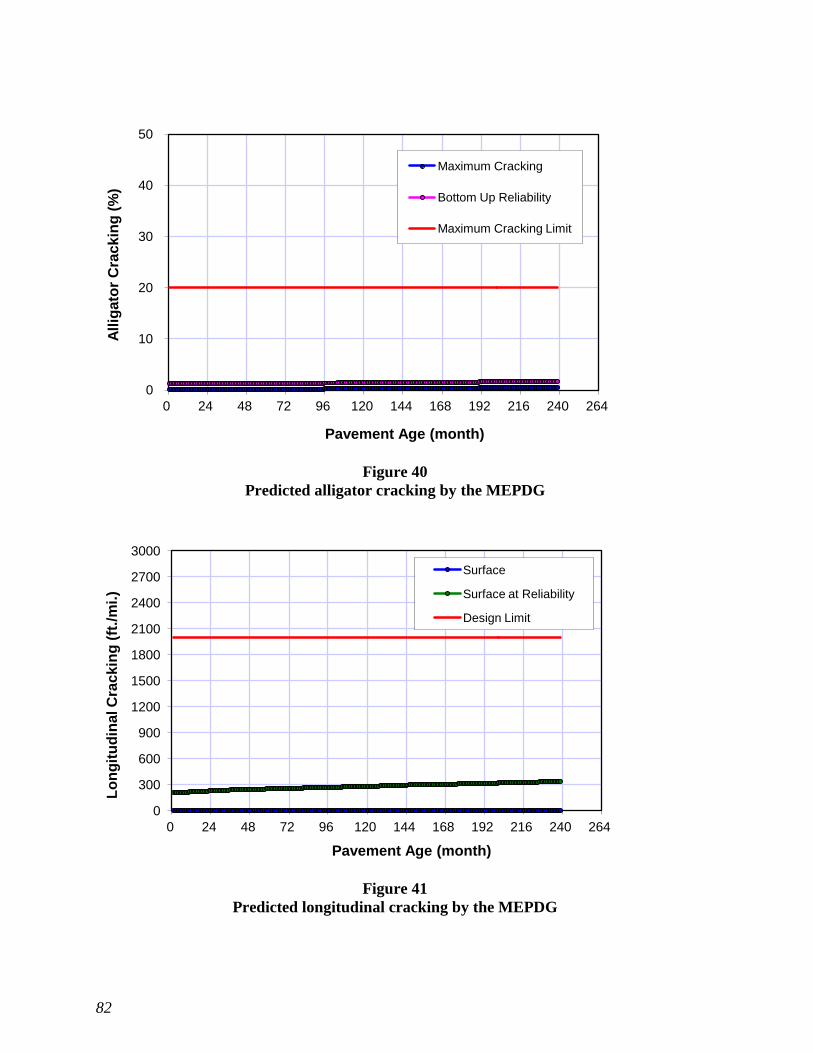
82
Figure 40
Predicted alligator cracking by the MEPDG
Figure 41
Predicted longitudinal cracking by the MEPDG
0
10
20
30
40
50
0 24 48 72 96 120 144 168 192 216 240 264
All
igato
r C
rac
kin
g (
%)
Pavement Age (month)
Maximum Cracking
Bottom Up Reliability
Maximum Cracking Limit
0
300
600
900
1200
1500
1800
2100
2400
2700
3000
0 24 48 72 96 120 144 168 192 216 240 264
Lo
ng
itu
din
al C
rac
kin
g (
ft./
mi.
)
Pavement Age (month)
Surface
Surface at Reliability
Design Limit
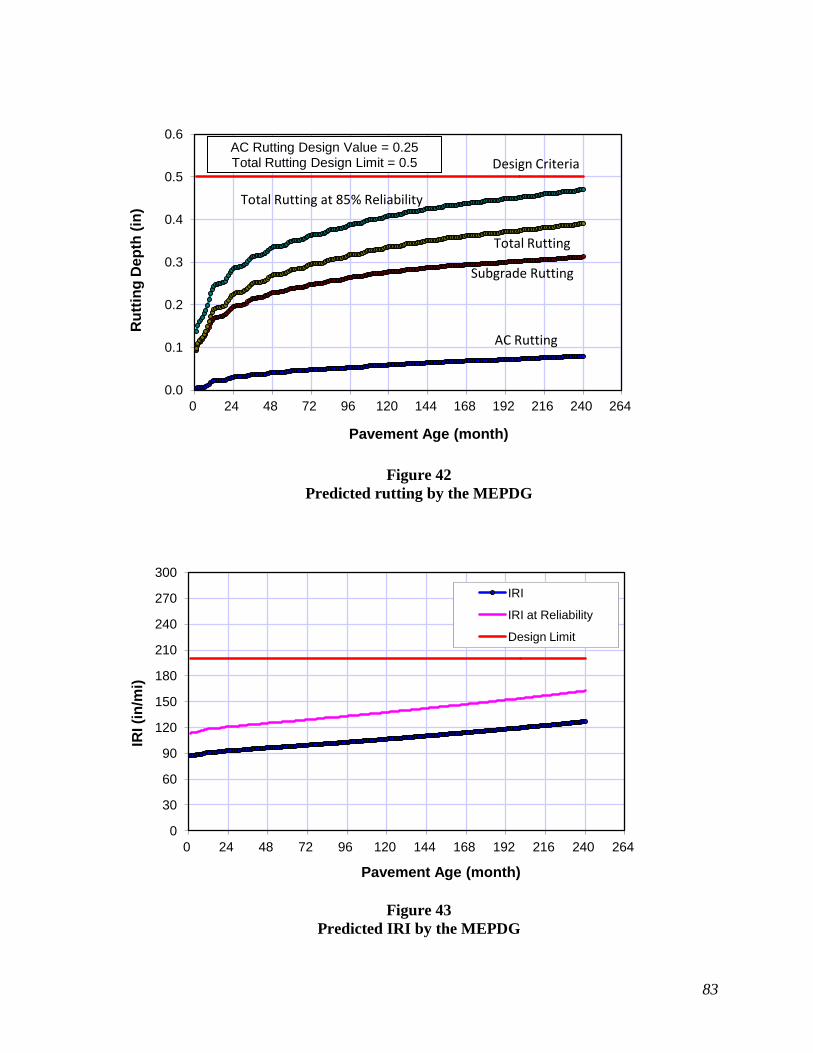
83
Figure 42
Predicted rutting by the MEPDG
Figure 43
Predicted IRI by the MEPDG
0.0
0.1
0.2
0.3
0.4
0.5
0.6
0 24 48 72 96 120 144 168 192 216 240 264
Ru
ttin
g D
ep
th (
in)
Pavement Age (month)
AC Rutting Design Value = 0.25 Total Rutting Design Limit = 0.5
AC Rutting
Subgrade Rutting
Total Rutting
Total Rutting at 85% Reliability
Design Criteria
0
30
60
90
120
150
180
210
240
270
300
0 24 48 72 96 120 144 168 192 216 240 264
IRI (i
n/m
i)
Pavement Age (month)
IRI
IRI at Reliability
Design Limit

84
The designed pavement structures by both the 1993 design guide and the MEPDG are
compared in Figure 44. At the same design reliability level (85 percent), the MEPDG design
saved the AC thickness by 1.5 in. Project 267-02-0022 is 0.87 mi. long and has two 12 ft.
wide lanes. Assuming that the unit cost of Type 8 AC is 75 dollars/ton, the material cost
saved by using the MEPDG design totals 1.5 in. × 0.87 mi. × 5280 ft./mi. × 0.33 yd./ft. × 2
lanes × 12 ft./lane × 0.33 yd./ft. × 110 lb/sq. yd./in. × 0.0005 ton/lb. × $75/ton = $74,286.
Note that the cost-benefit analysis was based on the nationally calibrated MEPDG models
and typical traffic and materials inputs in Louisiana. The material saving only applies to the
design scenario outlined above and should not be taken as the cost-benefit of using the
MEPDG. The MEPDG design may require thicker AC in another design scenario.
Figure 44
Comparison of designed pavement structures by the AASHTO 1993 guide and the
MEPDG
2.0 in. Type 8F AC Wearing Course
5.0” Type 5 AC Base Course
(a) AASHTO 1993
1.5” Type 8F AC Wearing Course 3.0 in. Type 8 AC Binder Course
2.0” Type 8 AC Binder Course
5.0” Type 5 AC Base Course
(b) MEPDG

85
CONCLUSIONS
In this study, pavement performance of five typical Louisiana flexible pavement structures
(i.e., AC over AC base, AC over RPCC base, AC over crushed stone, AC over soil cement
base, and AC over stone interlayer pavement) were evaluated using the MEPDG design
software (version 1.1) and the LA-PMS data. The MEPDG design inputs for the selected
projects were obtained from different database sources as outlined in the report. A set of
Louisiana default material design inputs in the MEPDG were developed for typical AC
mixes (default master curves), soil cement layer, RPCC layer, and crushed stone layer.
Pavement performance evaluated in this study included fatigue cracking (i.e., combined top-
down and bottom-up cracking), rutting, and IRI. In addition to comparing the mean values of
pavement performance, MEPDG-predicted distresses at certain design reliability levels were
also compared with the field variation of pavement distresses. The following observations
and conclusions can be drawn from this study:
For the AC over AC base pavements in Louisiana, the MEPDG load-related fatigue
cracking, rutting, and IRI models, without performing any local calibration, all
seemed to be adequate.
For the AC over RPCC base and the AC over crushed stone pavements in Louisiana,
the MEPDG load-related fatigue cracking and the IRI models both seemed to be
adequate without the need of local calibration. However, the MEPDG rutting model
significantly over-predicted the field rutting for these types of pavement structures. A
local calibration of the rutting model is needed before using the MEPDG to design the
AC over RPCC base and the AC over crushed stone pavements in Louisiana.
For the AC over soil cement base pavements in Louisiana, the MEPDG-predicted
load-related fatigue cracking was significantly less when compared with the field
wheel-path cracking found on most of the selected projects. Meanwhile, the MEPDG
also over-predicted the rutting for this type of pavement in Louisiana. However, the
IRI model in the MEPDG seemed to be adequate. Therefore, local calibration of the
fatigue cracking and the rutting models is recommended before using the MEPDG to
design the AC over soil cement base pavements in Louisiana.
Sensitivity analyses results indicated that, of all the Level-3 inputs for AC materials
in the MEPDG, the binder type is the most influential parameter. Other input
parameters (e.g., gradation and volumetric properties) were found to have minor

86
effects on the shape of the predicted master curve within a practical range of
temperature variations.
Statistical analyses indicated that the mean difference between the predicted and the
measured fatigue cracking was significantly influenced by pavement structure type,
traffic volume, and geographic location. Among all the flexible pavement structures
evaluated, AC over soil cement base pavements showed the largest mean difference
between the predicted and the measured cracking. Meanwhile, a larger mean
difference was found from pavements of high-volume roads. Furthermore, the
selected pavements in north Louisiana seemed to have a significantly higher mean
difference in cracking than those in south Louisiana.
Statistical analyses also indicated that the mean difference between the measured and
the predicted rutting was significantly affected by pavement structure type, traffic
volume, subgrade stiffness, and geographic location. The largest mean difference
between the predicted and the measured rutting was found from the AC over RPCC
base pavements. In addition, larger mean differences between the predicted and the
measured rutting were observed from pavements of high-volume roads, located in
south Louisiana, or built upon softer subgrade.
A unique calibration procedure was developed for local calibration of the MEPDG
rutting model of the Louisiana AC over RPCC base and AC over soil cement base
pavements. It was demonstrated that this calibration method was able to differentiate
the MEPDG prediction errors of rutting from each sublayer. The obtained local
calibration factors for different sublayer materials further indicated that the MEPDG
over-predicted the rutting for both AC and subgrade layers, where the over-prediction
for subgrade layer was more significant than that for AC layer.

87
RECOMMENDATIONS
1. LADOTD pavement design engineers may start to use the current version MEPDG
software (version 1.1) as a design comparison tool to LADOTD’s currently used
DARWin 3.1 design method until further improvement can be made to the MEPDG
prediction models and input data based on the results of several national on-going
research studies as well as research projects currently being conducted by LTRC.
2. Some of the input data developed by this study, such as the E* master curves for
typical Louisiana AC mixtures, the various calibration factors of rutting models for
different pavement types and materials, etc., can be used as initial MEPDG input
trials (or Level-3 inputs) by the Department. Careful engineering judgment is required
when large discrepancies in the design thicknesses are encountered.
3. It is understood that the axle load spectra, developed under LTRC Project 07-2P
(LTRC Report 445), were not recommended for a direct use in the implementation of
the MEPDG in Louisiana. However, it was found in this study that the MEPDG
default axle load spectra tend to significantly overload the Louisiana typical flexible
pavements which results in a set of unreasonably high predicted distresses. Because
the developed spectra of 07-2P project are deemed more representative of Louisiana’s
traffic conditions than the MEPDG default, it is suggested that the three axle load
spectra (TTC1, TTC3, and TTC12) selected in this study be used in the comparative
pavement design using the MEPDG until more accurate axle load spectra data
become available in Louisiana.
4. LADOTD needs to begin developing a calibration database by monitoring newly
constructed pavements. The database developed in this study creates links to a
number of LADOTD databases (TOPS, TAND_NEEDS, TATV, and MATT/SOILS),
which can be used as a starting point of the calibration database for the future work of
the MEPDG local calibration.
5. The MEPDG load-related fatigue models need to be further calibrated based on
different flexible pavement types.
6. The rutting calibration factors developed should be further validated and continuously
updated. A number of trench tests on typical pavement structures are recommended.


89
ACRONYMS, ABBREVIATIONS, AND SYMBOLS
AADTT Average Annual Daily Truck Traffic
AASHO American Association of State Highway Officials
AASHTO American Association of State Highway and Transportation
Officials
AC asphalt concrete
ANOVA analysis of variance
residual error
EICM enhanced integrated climate model
ESAL equivalent single axle load
FHWA Federal Highway Administration
ft. foot (feet)
HMA hot mix asphalt
in. inch(es)
IRI international roughness index
LADOTD Louisiana Department of Transportation and Development
LA-PMS Louisiana pavement management system
lb. pound(s)
LTPP Long-term Pavement Performance
LTRC Louisiana Transportation Research Center
MATT Material Testing System
MEPDG Mechanistic-Empirical Pavement Design Guide
mi. mile(s)
resilient modulus
NCDC National Climate Data Center
NCHRP National Cooperative Highway Research Program
PCC Portland cement concrete
pcf pound per cubic foot (feet)
PMS pavement management system
psi pound per square inch
RPCC rubblized Portland cement concrete
standard error of estimate
SSE sum of squared errors
SSV soil support value
TAND Highway Need System
TATV Traffic Count ADT

90
TOPS Tracking of Projects
TRB Transportation Research Board
TTC truck traffic classification
WIM weigh-in-motion
USGS US Geology Survey
VCD vehicle class distribution

91
REFERENCES
1. Von Quintus, H. L., Darter, M. I., and Mallela, J. User Manual for the M-E Pavement
Design Guide. NCHRP Project 1-40B, Applied Research Associates, Inc., 2007.
2. AASHTO. Guide for the Local Calibration of the Mechanistic-Empirical Pavement
Design Guide. American Association of State Highway and Transportation Officials,
2010.
3. Souliman, M., Mamlouk, M., El-Basyouy, M., and Zapata, C. “Calibration of the
AASHTO MEPDG for Flexible Pavement for Arizona Conditions.” in Compendium of
Papers of the 89th TRB Annual Meeting. CD-ROM., Washington, D.C., 2010.
4. Wang, K. C.P., Li, Q., Hall, K. D., Nguyen, V., and Gong, W. “Database Support for the
New Mechanistic-Empirical Pavement Design Guide (MEPDG).” in Transportation
Research Board 87th Annual Meeting, CD-ROM, National Research Council,
Washington, D.C., 2008.
5. Hall, K. D., Xiao, D. X., and Wang, K. C.P. “Calibration of the MEPDG for Flexible
Pavement Design in Arkansas.” in Compendium of Papers of the 89th TRB Annual
Meeting, CD-ROM, National Research Council, Washington D.C., 2010.
6. Kim, S., Ceylan, H., Gopalakrishnan, K., and Smadi, O. “Use of Pavement Management
Information System for Verification of Mechanistic-Empirical Pavement Design Guide
Performance Predictions.” In Transportation Research Record 2153. Transportation
Research Board, National Research Council, Washington, D.C., 2010, pp. 30-39.
7. Buch, N., Chatti, K., Haider, S. W., and Manik, A. Evaluation of the 1-37A Design
Process for the New and Rehabilitated JPCP and HMA Pavements. RC-1516, Michigan
State University, East Lansing, MI, 2008.
8. Velasquez, R., Hoegh, K., Yut, I., Funk, N., Cochran, G., Marasteanu, M., and
Khazanovich, L. Implementation of the MEPDG for New and Rehabilitated Pavement
Structures for Design of Concrete and Asphalt Pavements in Minnesota. MN/RC 2009-
06, University of Minnesota, Minneapolis, MN, 2009.
9. Von Quintus, H. L., and Moulthrop, J. Mechanistic-Empirical Pavement Design Guide
Flexible Pavement Performance Prediction Models for Montana. FHWA/MT-07-
008/8158, Applied Research Associates, Inc., Champaign, IL, 2008.
10. Mehta, Y. A., Sauber, R. W., Owad, J., and Krause, J. “Lessons Learned during
Implementation of Mechanistic-Empirical Pavement Design Guide.” in Transportation
Research Board 87th Annual Meeting, CD-ROM , National Research Council,
Washington, D.C., 2008.

92
11. Muthadi, N., and Kim, R. Y. “Local Calibration of Mechanistic-Empirical Pavement
Design Guide for Flexible Pavement Design.” In Transportation Research Record 2087.
Transportation Research Board, National Research Council, Washington, D.C., 2008, pp.
131-141.
12. Mellela, J., Titus-Glover, L., Darter, M. I., Von Quintus, H. L., Gotlif, A., Stanley, M.,
and Sadasivam, S. Guidelines for Implementing NCHRP 1-37A M-E Design Procedures
in Ohio:Volume 1 - Summary of Findings, Implementation Plan, and Next Steps.
FHWA/OH-2009/9A, Applied Research Associates, Inc., Champaign, IL, 2009.
13. Banerjee, A., Aguiar-Moya, J. P., and Prozzi, J. A. “Texas Experience Using LTPP for
Calibration of the MEPDG Permanent Deformation Models.” in Transportation Research
Board 88th Annual Meeting, CD-ROM, National Research Council, Washington, D.C.,
2009.
14. Aguiar-Moya, J. P., Hong, F., and Prozzi, J. A. “Upgrading the Texas LTPP Database to
Support the M-E Pavement Design Guide.” in Transportation Research Board 88th
Annual Meeting, CD-ROM, National Research Council, Washington, D.C., 2008.
15. Flintsch, G. W., Loulizi, A., Diefenderfer, S. D., and Diefenderfer, B. K. “Asphalt
Materials Characterization in Support of Mechanistic-Empirical Pavement Design Guide
Implementation Efforts in Virginia.” in Transportation Research Board 87th Annual
Meeting, CD-ROM, National Research Council, Washington, D.C., 2008.
16. Li, J., Preice, L., and Ulhmeyer, J. “Calibration of Flexible Pavement in Mechanistic-
Empirical Pavement Design Guide for Washington State.” In Transportation Research
Record 2095. Transportation Research Board, National Research Council, Washington,
D.C., 2009, pp. 73-83.
17. Kang, M., and Adams, T. M. “Local Calibration of the Fatigue Model in the Mechanistic-
Empirical Pavement Design Guide.” in Transportation Research Board 87th Annual
Meeting, CD-ROM, National Research Council, Washington, D.C., 2008.
18. Ishak, S., Shin, H.-C., and Sridhar, B. Characterization and Development of Truck Load
Spectra and Growth Factors for Current and Future Pavement Design Practices in
Louisiana. FHWA/LA.0x/445, Louisiana State University, Baton Rouge, LA, 2009.

93
APPENDIX
APPENDIX A Default Axle Load Distribution Factors for Louisiana
APPENDIX B Default AC Materials Inputs for Louisiana
APPENDIX C LA-MEPDG Database
APPENDIX D Detailed Information about the Selected Projects


95
APPENDIX A
Default Axle Load Distribution Factors for Louisiana
Axle load spectra (also called axle load distribution) are important traffic inputs for the
MEPDG. It has a direct impact on the amount of predicted distresses (and IRI) of the
MEPDG. In the MEPDG design software, users have the options to either input the
distribution of axle load of each axle type in each month of a year (level 1) or accept the
national default axle load spectra (level 3). To better represent the local traffic conditions,
many states chose to develop their local axle load spectra, often based on WIM station data.
In a previous study, Ishak et al. analyzed the axle load data from about 200 WIM stations in
Louisiana. He grouped the WIM data based on the truck traffic classification (TTC) and
developed the default axle load spectra for each typical TTC in Louisiana. In this study, the
design vehicle class distribution of the selected project can be categorized as either TTC 1,
TTC 3, or TTC 12. Thus the Louisiana default axle load spectra for these three TTC groups
are used in this study. Louisiana default axle load spectra and the national default axle load
spectra are plotted in Figures 45 to 47. The number of axle per truck inputs (shown in Table
31) were also modified based on the Louisiana default axle load spectra.
Table 31
Number of axles per truck in Louisiana
Single Tandem Tridem Quad
Class 4 1.62 0.39 0 0
Class 5 2 0 0 0
Class 6 1.02 0.99 0 0
Class 7 1 0 1.09 0
Class 8 3.05 0 0 0
Class 9 1.13 1.93 0 0
Class 10 1.19 1.09 0.89 0
Class 11 4.61 0 0 0
Class 12 3.52 1.2 0 0
Class 13 2.15 2.48 0 0

96
Axle load (lb)
0 10000 20000 30000 40000 50000
Pe
rce
nta
ge
(%
)
0
10
20
30
40
50
Class 4
Class 5
Class 6
Class 7
Class 8
Class 9
Class 10
Class 11
Class 12
Class 13
Axle load (lb)
0 10000 20000 30000 40000 50000
Pe
rce
nta
ge
(%
)
0
10
20
30
40
50
Class 4
Class 5
Class 6
Class 7
Class 8
Class 9
Class 10
Class 11
Class 12
Class 13
Axle load (lb)
0 10000 20000 30000 40000 50000
Pe
rce
nta
ge
(%
)
0
10
20
30
40
50
Class 4
Class 5
Class 6
Class 7
Class 8
Class 9
Class 10
Class 11
Class 12
Class 13
Axle load (lb)
0 10000 20000 30000 40000 50000
Pe
rce
nta
ge
(%
)
0
10
20
30
40
50
Class 4
Class 5
Class 6
Class 7
Class 8
Class 9
Class 10
Class 11
Class 12
Class 13
Figure 45
Single axle load spectrum: (a) TTC1, (b) TTC3, (c) TTC12, (d) MEPDG default
(a)
(b)
(c)
(d)

97
Axle load (lb)
0 20000 40000 60000 80000 100000
Perc
en
tage
(%
)0
10
20
30
40
50
60
70
Class 4
Class 5
Class 6
Class 7
Class 8
Class 9
Class 10
Class 11
Class 12
Class 13
Axle load (lb)
0 20000 40000 60000 80000 100000
Pe
rce
nta
ge
(%
)
0
10
20
30
40
50
60
70
Class 4
Class 5
Class 6
Class 7
Class 8
Class 9
Class 10
Class 11
Class 12
Class 13
Axle load (lb)
0 20000 40000 60000 80000 100000
Pe
rce
nta
ge
(%
)
0
10
20
30
40
50
60
70
Class 4
Class 5
Class 6
Class 7
Class 8
Class 9
Class 10
Class 11
Class 12
Class 13
Axle load (lb)
0 20000 40000 60000 80000 100000
Pe
rce
nta
ge
(%
)
0
10
20
30
40
50
60
70
Class 4
Class 5
Class 6
Class 7
Class 8
Class 9
Class 10
Class 11
Class 12
Class 13
Figure 46
Tandem axle load spectrum: (a) TTC1, (b) TTC3, (c) TTC12, (d) MEPDG default
(a)
(b)
(c)
(d)

98
Axle load (lb)
0 20000 40000 60000 80000 100000 120000
Pe
rce
nta
ge
(%
)
0
20
40
60
80
100
Class 4
Class 5
Class 6
Class 7
Class 8
Class 9
Class 10
Class 11
Class 12
Class 13
Axle load (lb)
0 20000 40000 60000 80000 100000 120000
Pe
rce
nta
ge
(%
)
0
20
40
60
80
100
Class 4
Class 5
Class 6
Class 7
Class 8
Class 9
Class 10
Class 11
Class 12
Class 13
Axle load (lb)
0 20000 40000 60000 80000 100000 120000
Pe
rce
nta
ge
(%
)
0
20
40
60
80
100
Class 4
Class 5
Class 6
Class 7
Class 8
Class 9
Class 10
Class 11
Class 12
Class 13
Axle load (lb)
0 20000 40000 60000 80000 100000 120000
Pe
rce
nta
ge
(%
)
0
10
20
30
40
50
60
70
80
90
100
Class 4
Class 5
Class 6
Class 7
Class 8
Class 9
Class 10
Class 11
Class 12
Class 13
Figure 47
Tridem axle load spectrum: (a) TTC1, (b) TTC3, (c) TTC12, (d) MEPDG default
(a)
(b)
(c)
(d)
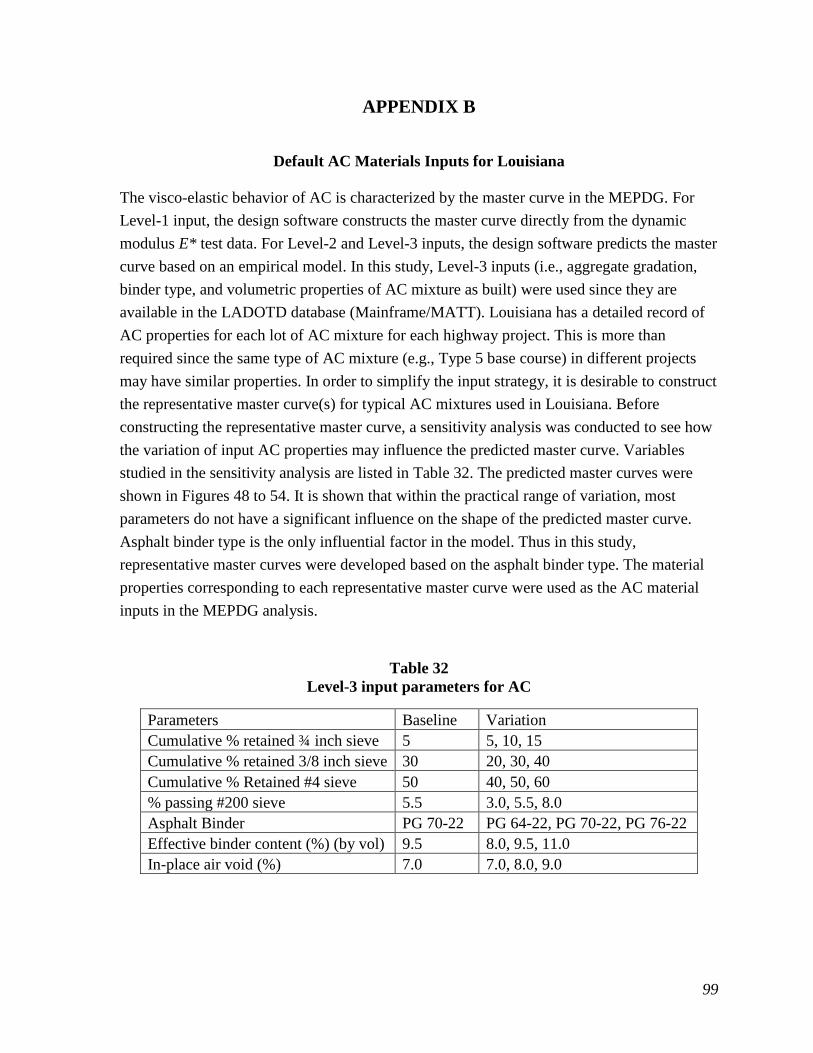
99
APPENDIX B
Default AC Materials Inputs for Louisiana
The visco-elastic behavior of AC is characterized by the master curve in the MEPDG. For
Level-1 input, the design software constructs the master curve directly from the dynamic
modulus E* test data. For Level-2 and Level-3 inputs, the design software predicts the master
curve based on an empirical model. In this study, Level-3 inputs (i.e., aggregate gradation,
binder type, and volumetric properties of AC mixture as built) were used since they are
available in the LADOTD database (Mainframe/MATT). Louisiana has a detailed record of
AC properties for each lot of AC mixture for each highway project. This is more than
required since the same type of AC mixture (e.g., Type 5 base course) in different projects
may have similar properties. In order to simplify the input strategy, it is desirable to construct
the representative master curve(s) for typical AC mixtures used in Louisiana. Before
constructing the representative master curve, a sensitivity analysis was conducted to see how
the variation of input AC properties may influence the predicted master curve. Variables
studied in the sensitivity analysis are listed in Table 32. The predicted master curves were
shown in Figures 48 to 54. It is shown that within the practical range of variation, most
parameters do not have a significant influence on the shape of the predicted master curve.
Asphalt binder type is the only influential factor in the model. Thus in this study,
representative master curves were developed based on the asphalt binder type. The material
properties corresponding to each representative master curve were used as the AC material
inputs in the MEPDG analysis.
Table 32
Level-3 input parameters for AC
Parameters Baseline Variation
Cumulative % retained ¾ inch sieve 5 5, 10, 15
Cumulative % retained 3/8 inch sieve 30 20, 30, 40
Cumulative % Retained #4 sieve 50 40, 50, 60
% passing #200 sieve 5.5 3.0, 5.5, 8.0
Asphalt Binder PG 70-22 PG 64-22, PG 70-22, PG 76-22
Effective binder content (%) (by vol) 9.5 8.0, 9.5, 11.0
In-place air void (%) 7.0 7.0, 8.0, 9.0

100
Log(Reduced time) (second)
-6 -4 -2 0 2 4 6
E*
(psi)
104
105
106
107
5
10
15
Cumulative % retained on 3/4 inch sieve:
Figure 48
Changing the cumulative % retained on ¾ in. sieve
Log(Reduced time) (second)
-6 -4 -2 0 2 4 6
E*
(psi)
104
105
106
107
20
30
40
Cumulative % retained on 3/8 inch sieve:
Figure 49
Changing the cumulative % retained on 3/8 in. sieve
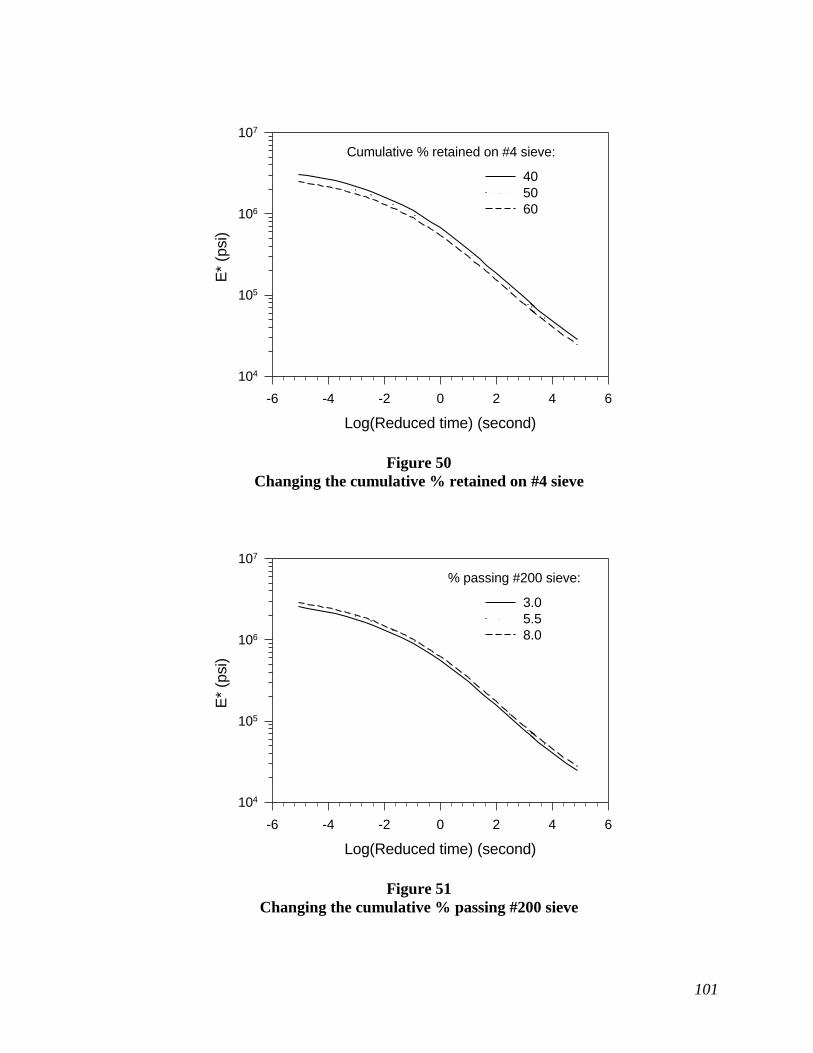
101
Log(Reduced time) (second)
-6 -4 -2 0 2 4 6
E*
(psi)
104
105
106
107
40
50
60
Cumulative % retained on #4 sieve:
Figure 50
Changing the cumulative % retained on #4 sieve
Log(Reduced time) (second)
-6 -4 -2 0 2 4 6
E*
(psi)
104
105
106
107
3.0
5.5
8.0
% passing #200 sieve:
Figure 51
Changing the cumulative % passing #200 sieve

102
Log(Reduced time) (second)
-6 -4 -2 0 2 4 6
E*
(psi)
104
105
106
107
PG 64-22
PG 70-22
PG 76-22
Asphalt binder:
Figure 52
Changing the asphalt binder type
Log(Reduced time) (second)
-6 -4 -2 0 2 4 6
E*
(psi)
104
105
106
107
8.0
9.5
11.0
Effective binder content (%):
Figure 53
Changing the effective binder content

103
Log(Reduced time) (second)
-6 -4 -2 0 2 4 6
E*
(psi)
104
105
106
107
7.0
8.0
9.0
Air void (%):
Figure 54
Changing the air void
For each binder type, two plant mix test records were randomly selected from each district,
one wearing course mix and one binder course mix. PG 64-22 and AC-30 binders are almost
exclusively used for base courses. Thus only one record was selected for these types of
mixture. The collected plant mix test records were used to generate master curves with the
MEPDG software. The average value of each parameter was used to develop the
representative master curve (shown in Figures 55 to 59) for each type of AC mixture.
Table 33 lists the default AC material input parameters for typical AC mixtures in Louisiana.
Note that the total unit weight of the mixture is not used in the predictive model for master
curve, thus it is taken as 144 pcf (average of all records collected) for simplicity.

104
Table 33
Default AC material input parameters for typical AC mixtures in Louisiana
Conventional/Superpave Superpave Superpave Superpave Conventional Conventional
Asphalt Binder PG 76-22 PG 70-22 PG 64-22 PAC-40 PAC-30, AC-30
Use (WC = wearing course,
BC = binder course)
Level 2 WC
Level 2 BC
Level 1 WC
Level 1 BC Level 1 BS
Type 8 WC
Type 8 BC Type 5 BS
Cumulative % retained 3/4
inch sieve 5 4 11 5 11
Cumulative % retained 3/8
inch sieve 31 28 28 30 26
Cumulative % retained #4
sieve 52 48 46 49 44
% passing #200 sieve 5.1 5.6 5.3 5.2 5.5
Effective binder content
(%) 9.49 9.46 9.17 10.04 9.42
In-place air void (%) 6.95 6.90 6.94 6.92 6.86
Total unit weight (pcf) 144 144 144 144 144
Log(Reduced time) (second)
-6 -4 -2 0 2 4 6
E*
(psi)
104
105
106
107
Sample master curve
Representative master curve
Figure 55
Representative master curve for PG 76-22 AC (based on 16 sample master curves,
including 8 wearing course mixtures and 8 binder course mixtures)
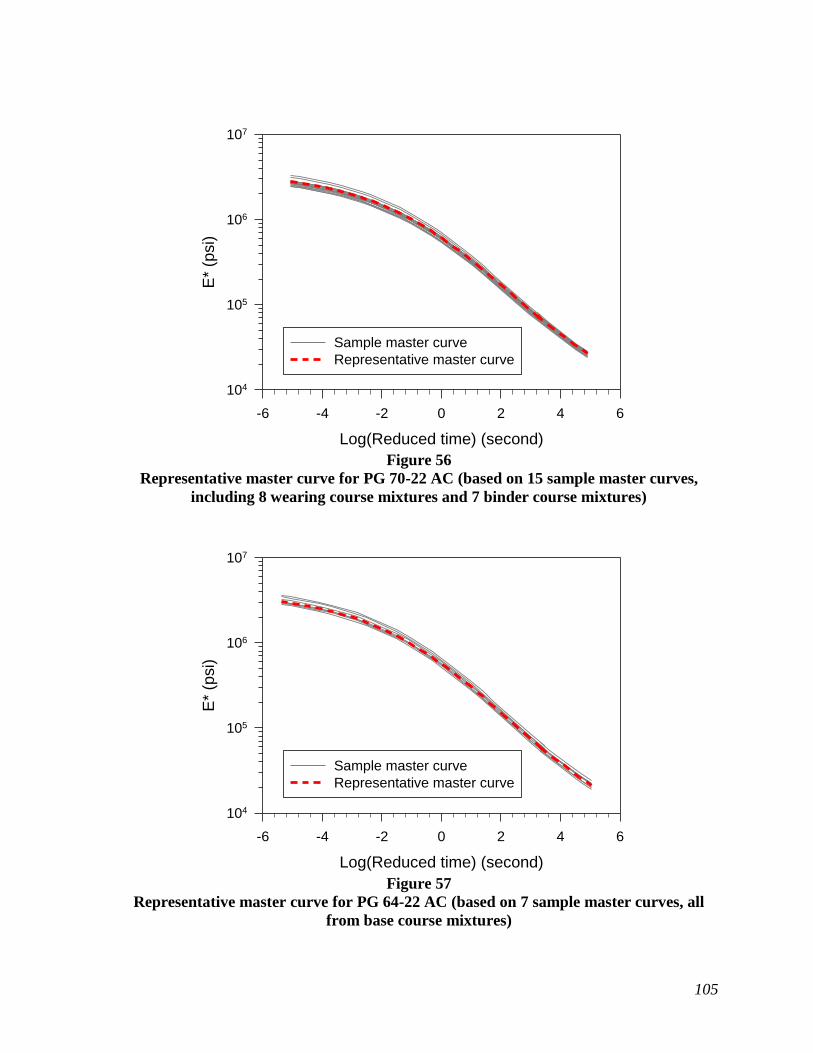
105
Log(Reduced time) (second)
-6 -4 -2 0 2 4 6
E*
(psi)
104
105
106
107
Sample master curve
Representative master curve
Figure 56
Representative master curve for PG 70-22 AC (based on 15 sample master curves,
including 8 wearing course mixtures and 7 binder course mixtures)
Log(Reduced time) (second)
-6 -4 -2 0 2 4 6
E*
(psi)
104
105
106
107
Sample master curve
Representative master curve
Figure 57
Representative master curve for PG 64-22 AC (based on 7 sample master curves, all
from base course mixtures)
106
Log(Reduced time) (second)
-6 -4 -2 0 2 4 6
E*
(psi)
104
105
106
107
Sample master curve
Representative master curve
Figure 58
Representative master curve for PAC-40 AC (based on 18 sample master curves,
including 9 wearing course mixtures and 9 binder course mixtures)
Log(Reduced time) (second)
-6 -4 -2 0 2 4 6
E*
(psi)
104
105
106
107
Sample master curve
Representative master curve
Figure 59
Representative master curve for AC-30 (and PAC-30)

107
APPENDIX C
LA-MEPDG Database
This study utilized a number of LADOTD databases: Mainframe, Content Manager, LA-
PMS, etc. These databases are maintained separately by different offices in LADOTD. There
is a need to link these databases together so that researchers can easily collect, manage, and
analyze the data. For example, researchers want to find the general information, traffic data,
and subgrade soil properties of a specific project by simply typing-in the project ID (xxx-xx-
xxxx).
To fulfill this requirement, a database (named LA-MEPDG) was created in Access 2007
format. This database linked a number of LADOTD databases (TOPS, TAND_NEEDS,
TATV, and MATT/SOILS) together. The structure of the database is illustrated in Figure 60.
The tables in the database are introduced in Table 34. A number of useful queries were
created to facilitate data collection and data management. The functions of the queries are
introduced in Table 35. Unfortunately, pavement structure (material and thickness)
information in Louisiana is stored in image format. This information has to be input
manually into the database. Note that LA-PMS is not automatically linked to the LA-
MEPDG database because manual inspection must be made to check the abnormal trends and
errors in the pavement condition data. The interpretation of the LA-PMS data will be
described later.
Table 34
Tables in LA-MEPDG database
Table Description
DOTD_TOPSPROJS This table stores inventory information about the LADOTD projects. It is converted
(into Access format) from the TOPS database in Mainframe.
PLAN This table stores the pavement design information collected from the plan files and
DARWIN design sheets. Each record in this table represents a selected project in this
study. Data in this table are input manually. This is the only table in the LA-MEPDG
database that needs manually input. Remarks about a project are also input in this
table.
MATT_SOILS This table stores boring/sampling information on each LADOTD projects. It is
converted from the MATT/SOILS database in Mainframe.
LA_ADT This table stores the two-way ADT information from the traffic stations in Louisiana.
It is converted from the TATV database in Mainframe.
TAND_NEEDS This table contains some traffic input information such as lane width, operation
speed, truck factor, growth factor, etc. It is converted from the TAND database in
Mainframe.
PMS_VS_MEPDG This table contains the measured distresses from LA-PMS and the predicted
distresses from the MEPDG. Data in this table are input manually.
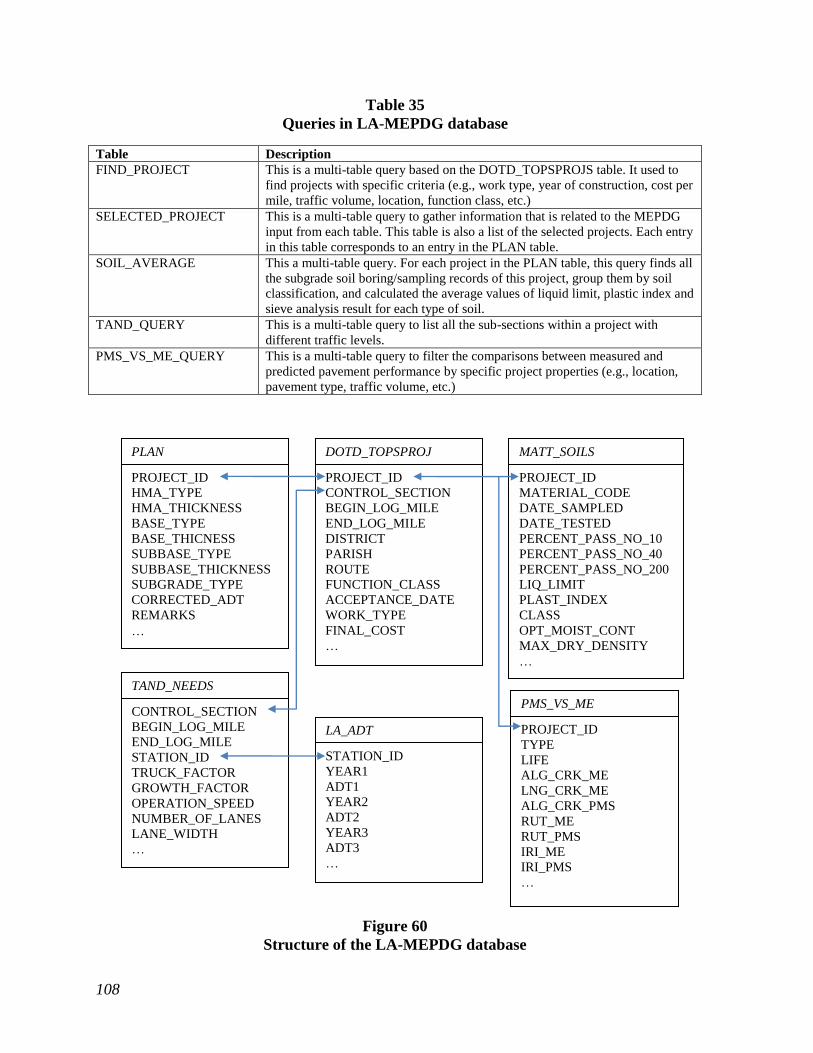
108
Table 35
Queries in LA-MEPDG database
Table Description
FIND_PROJECT This is a multi-table query based on the DOTD_TOPSPROJS table. It used to
find projects with specific criteria (e.g., work type, year of construction, cost per
mile, traffic volume, location, function class, etc.)
SELECTED_PROJECT This is a multi-table query to gather information that is related to the MEPDG
input from each table. This table is also a list of the selected projects. Each entry
in this table corresponds to an entry in the PLAN table.
SOIL_AVERAGE This a multi-table query. For each project in the PLAN table, this query finds all
the subgrade soil boring/sampling records of this project, group them by soil
classification, and calculated the average values of liquid limit, plastic index and
sieve analysis result for each type of soil.
TAND_QUERY This is a multi-table query to list all the sub-sections within a project with
different traffic levels.
PMS_VS_ME_QUERY This is a multi-table query to filter the comparisons between measured and
predicted pavement performance by specific project properties (e.g., location,
pavement type, traffic volume, etc.)
Figure 60
Structure of the LA-MEPDG database
DOTD_TOPSPROJ
PROJECT_ID
CONTROL_SECTION
BEGIN_LOG_MILE
END_LOG_MILE
DISTRICT
PARISH
ROUTE
FUNCTION_CLASS
ACCEPTANCE_DATE
WORK_TYPE
FINAL_COST
…
MATT_SOILS
PROJECT_ID
MATERIAL_CODE
DATE_SAMPLED
DATE_TESTED
PERCENT_PASS_NO_10
PERCENT_PASS_NO_40
PERCENT_PASS_NO_200
LIQ_LIMIT
PLAST_INDEX
CLASS
OPT_MOIST_CONT
MAX_DRY_DENSITY
…
PLAN
PROJECT_ID
HMA_TYPE
HMA_THICKNESS
BASE_TYPE
BASE_THICNESS
SUBBASE_TYPE
SUBBASE_THICKNESS
SUBGRADE_TYPE
CORRECTED_ADT
REMARKS
…
TAND_NEEDS
CONTROL_SECTION
BEGIN_LOG_MILE
END_LOG_MILE
STATION_ID
TRUCK_FACTOR
GROWTH_FACTOR
OPERATION_SPEED
NUMBER_OF_LANES
LANE_WIDTH
…
PMS_VS_ME
PROJECT_ID
TYPE
LIFE
ALG_CRK_ME
LNG_CRK_ME
ALG_CRK_PMS
RUT_ME
RUT_PMS
IRI_ME
IRI_PMS
…
LA_ADT
STATION_ID
YEAR1
ADT1
YEAR2
ADT2
YEAR3
ADT3
…

109
The step-by-step procedure of working with LA-MEPDG database is described below:
1. Run the “FIND_PROJECT” query. An example set of criteria is: WORK_TYPE =
“C2,” “C3,” “A1,” “A2,” “A3,” “A4,” “A5,” “A6,” “A7,” “A8,” and “ZA”;
ACCEPTANCE_DATE between “1/1/1997” and “12/31/2005”; and Length ≥ 0.5.
This query created a list of 1,839 projects for initial selection. Note that a wide range
of work types is used here (from flexible to rigid pavement construction), because
researchers found that “work type” is a poor, yet the only, indicator of the pavement
structure. For example, an AC over RPCC bass pavement project may be categorized
as “A1,” “A4,” “A8,” “C2,” or “C3” in the TOPS database.
2. For each project in the initial selection list, go to the Content Manger and the Intranet
Plan Room to find the design file. If typical section design confirmed this project has
a pavement structure of interest, go to step 3.
3. Create a new entry in the “PLAN” table. Input the project number and pavement
structure/materials information.
4. Run the “TAND_QUERY” query. If a project has more than one sub-section with
significantly different traffic levels, the user must choose the traffic inputs from one
sub-section and input the traffic sub-section ID into the “PLAN” table. If the project
has only one sub-subsection, input “00” in the corresponding field in the “PLAN”
table.
5. Run the “SELECTED_PROJECT” query. The MEPDG input information for each
project in the “PLAN” table will be collected and displayed.
6. Input the collected input information into the MEPDG design software to analyze a
project.
7. Copy the predicted pavement performance from the MEPDG and the measured
pavement performance from LA-PMS to the “PMS_VS_MEPDG” table.
8. Keep adding and analyzing more projects.
9. Compare the predicted performance columns to the corresponding measured
performance columns in the “PMS_VS_MEPDG” table. If necessary, run the
“PMS_VS_ME_QUERY” query to narrow the comparison results by specific criteria.

110
APPENDIX D
Detailed Information about the Selected Projects
Project ID: 015-05-0038
General Information: District: 58 Two-Way ADT:
5485
Parish: 30 Number of Lane in Design Direction: 4
Route: US 165 Growth Factor:
3%
Accept Date: 6/6/2002 Axle Load Spectrum: Louisiana Default (TTC1)
Pavement Structure:
Asphalt Concrete: 2" SMA WEARING COURSE (PG 76-22)+ 4" SUPERPAVE LEVEL 2 BINDER COURSE (PG 76-22)
Base:
6.5” TYPE 5A AC (PG 64-22)
Subbase: Subgrade:
A-4 (Mr = 9176 psi)
Predicted vs. Measured Pavement Performance
0
20
40
60
80
100
120
140
160
180
0 50 100 150
IRI (
in./
mi.
)
Pavement age (month)
PMS Mean
PMS Mean Fit
PMS Mean + STD
PMS Mean + STD Fit
MEPDG Mean
MEPDG Reliability
0
0.1
0.2
0.3
0.4
0.5
0.6
0 50 100 150
Ru
ttin
g (i
n.)
Pavement age (month)
0
0.5
1
1.5
2
0 50 100 150
Fati
gue
cra
ckin
g (%
)
Pavement age (month)

111
Project ID: 018-30-0018
General Information: District: 62 Two-Way ADT:
1927
Parish: 52 Number of Lane in Design Direction: 2
Route: LA 433 Growth Factor:
3%
Accept Date: 1/3/2000 Axle Load Spectrum: Louisiana Default (TTC12)
Pavement Structure:
Asphalt Concrete: 1.5" TYPE 8 WEARING COURSE (PG 76-22) + 2" TYPE 8 BINDER COURSE (PG 76-22)
Base:
8.5” CEMENT STABILIZED (Mr = 100 ksi)
Subbase: Subgrade:
A-6 (Mr = 9176 psi)
Predicted vs. Measured Pavement Performance
0
20
40
60
80
100
120
140
160
0 50 100 150
IRI (
in./
mi.
)
Pavement age (month)
PMS Mean
PMS Mean Fit
PMS Mean + STD
PMS Mean + STD Fit
MEPDG Mean
MEPDG Reliability
0
0.05
0.1
0.15
0.2
0.25
0.3
0.35
0 50 100 150
Ru
ttin
g (i
n.)
Pavement age (month) -2
0
2
4
6
8
10
12
14
0 50 100 150
Fati
gue
cra
ckin
g (%
)
Pavement age (month)
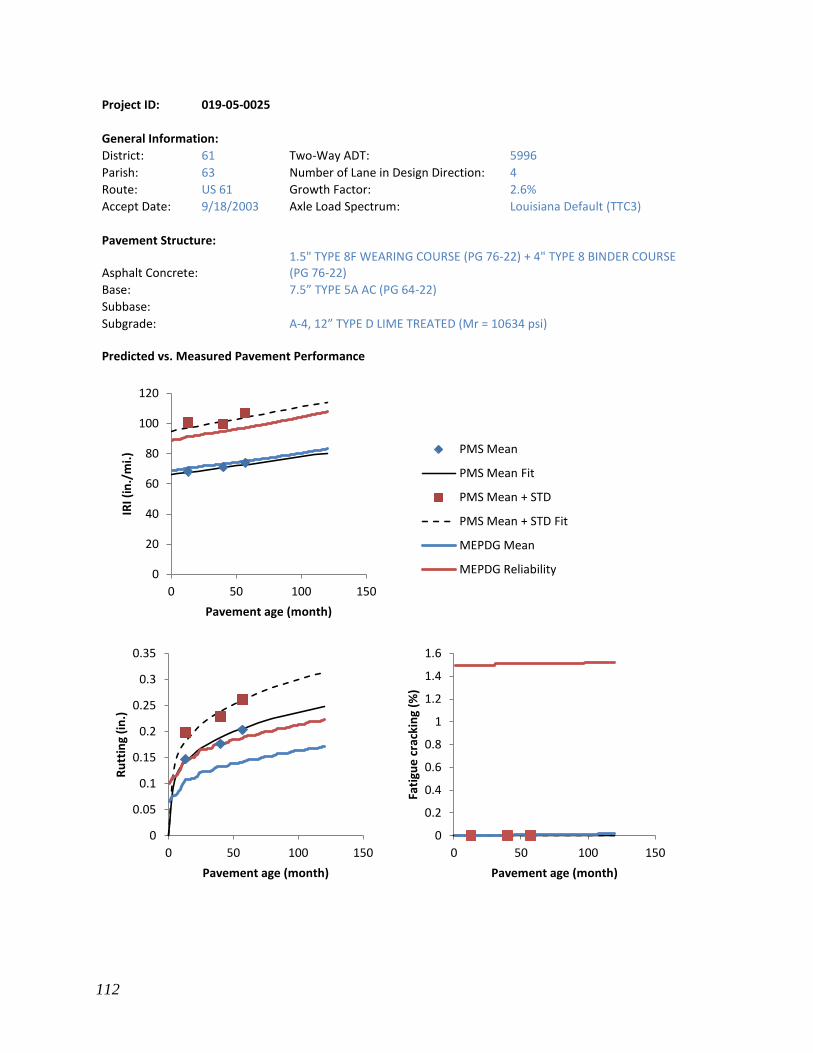
112
Project ID: 019-05-0025
General Information: District: 61 Two-Way ADT:
5996
Parish: 63 Number of Lane in Design Direction: 4
Route: US 61 Growth Factor:
2.6%
Accept Date: 9/18/2003 Axle Load Spectrum: Louisiana Default (TTC3)
Pavement Structure:
Asphalt Concrete: 1.5" TYPE 8F WEARING COURSE (PG 76-22) + 4" TYPE 8 BINDER COURSE (PG 76-22)
Base:
7.5” TYPE 5A AC (PG 64-22)
Subbase: Subgrade:
A-4, 12” TYPE D LIME TREATED (Mr = 10634 psi) Predicted vs. Measured Pavement Performance
0
20
40
60
80
100
120
0 50 100 150
IRI (
in./
mi.
)
Pavement age (month)
PMS Mean
PMS Mean Fit
PMS Mean + STD
PMS Mean + STD Fit
MEPDG Mean
MEPDG Reliability
0
0.05
0.1
0.15
0.2
0.25
0.3
0.35
0 50 100 150
Ru
ttin
g (i
n.)
Pavement age (month)
0
0.2
0.4
0.6
0.8
1
1.2
1.4
1.6
0 50 100 150
Fati
gue
cra
ckin
g (%
)
Pavement age (month)
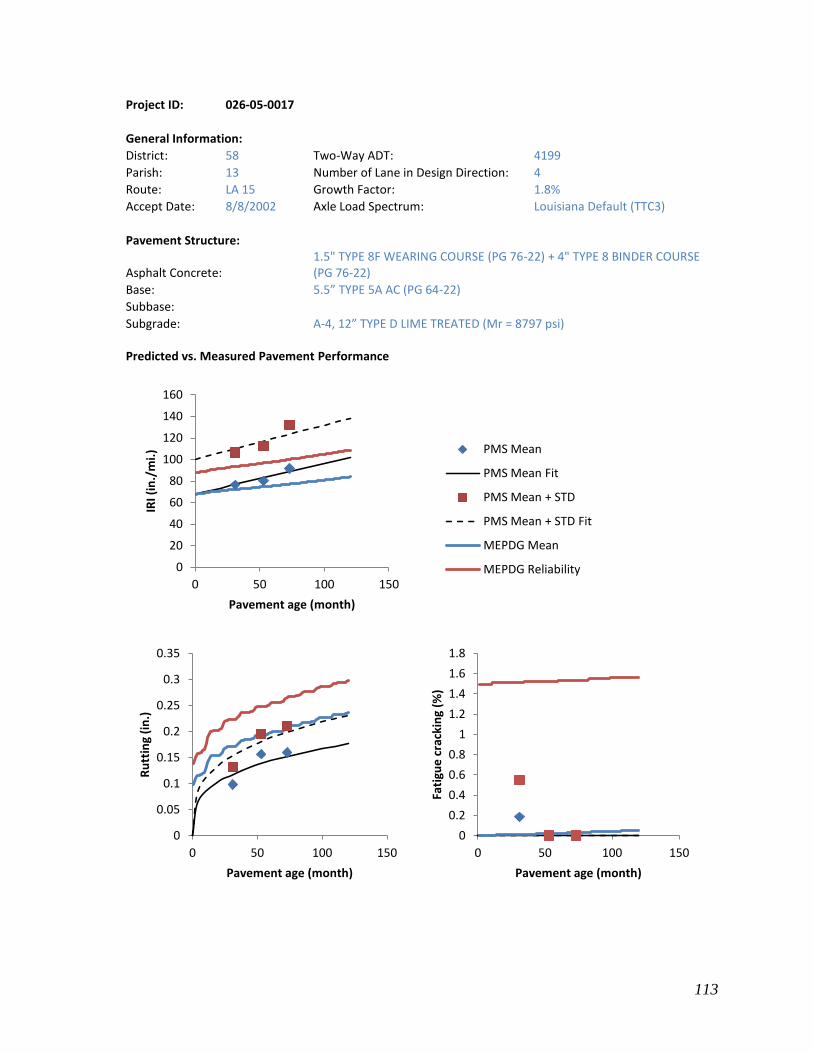
113
Project ID: 026-05-0017
General Information: District: 58 Two-Way ADT:
4199
Parish: 13 Number of Lane in Design Direction: 4
Route: LA 15 Growth Factor:
1.8%
Accept Date: 8/8/2002 Axle Load Spectrum: Louisiana Default (TTC3)
Pavement Structure:
Asphalt Concrete: 1.5" TYPE 8F WEARING COURSE (PG 76-22) + 4" TYPE 8 BINDER COURSE (PG 76-22)
Base:
5.5” TYPE 5A AC (PG 64-22)
Subbase: Subgrade:
A-4, 12” TYPE D LIME TREATED (Mr = 8797 psi) Predicted vs. Measured Pavement Performance
0
20
40
60
80
100
120
140
160
0 50 100 150
IRI (
in./
mi.
)
Pavement age (month)
PMS Mean
PMS Mean Fit
PMS Mean + STD
PMS Mean + STD Fit
MEPDG Mean
MEPDG Reliability
0
0.05
0.1
0.15
0.2
0.25
0.3
0.35
0 50 100 150
Ru
ttin
g (i
n.)
Pavement age (month)
0
0.2
0.4
0.6
0.8
1
1.2
1.4
1.6
1.8
0 50 100 150
Fati
gue
cra
ckin
g (%
)
Pavement age (month)

114
Project ID: 029-07-0055
General Information: District: 08 Two-Way ADT:
2047
Parish: 40 Number of Lane in Design Direction: 2
Route: LA 496 Growth Factor:
1%
Accept Date: 9/25/2000 Axle Load Spectrum: Louisiana Default (TTC12)
Pavement Structure:
Asphalt Concrete: 1.5" TYPE 3 WEARING COURSE (PG 70-22) + 2" TYPE 3 BINDER COURSE (PG 70-22)
Base:
8.5” CEMENT STABILIZED (Mr = 100 ksi)
Subbase: Subgrade:
A-4 (Mr = 9916 psi) Predicted vs. Measured Pavement Performance
0
20
40
60
80
100
120
0 50 100 150
IRI (
in./
mi.
)
Pavement age (month)
PMS Mean
PMS Mean Fit
PMS Mean + STD
PMS Mean + STD Fit
MEPDG Mean
MEPDG Reliability
0
0.05
0.1
0.15
0.2
0.25
0.3
0.35
0.4
0 50 100 150
Ru
ttin
g (i
n.)
Pavement age (month)
0
2
4
6
8
10
12
0 50 100 150
Fati
gue
cra
ckin
g (%
)
Pavement age (month)

115
Project ID: 036-03-0016
General Information: District: 58 Two-Way ADT:
3331
Parish: 21 Number of Lane in Design Direction: 2
Route: LA 4 Growth Factor:
1.1%
Accept Date: 3/20/1997 Axle Load Spectrum: Louisiana Default (TTC12)
Pavement Structure:
Asphalt Concrete: 1.5" TYPE 8 WEARING COURSE (PAC-40) + 2" TYPE 8 BINDER COURSE (PAC-40)
Base:
8.5” CEMENT STABILIZED (Mr = 100 ksi)
Subbase: Subgrade:
A-6, 12” TYPE D LIME TREATED (Mr = 9916 psi) Predicted vs. Measured Pavement Performance
0
20
40
60
80
100
120
140
0 50 100 150
IRI (
in./
mi.
)
Pavement age (month)
PMS Mean
PMS Mean Fit
PMS Mean + STD
PMS Mean + STD Fit
MEPDG Mean
MEPDG Reliability
0
0.05
0.1
0.15
0.2
0.25
0.3
0 50 100 150
Ru
ttin
g (i
n.)
Pavement age (month)
0
2
4
6
8
10
12
14
16
0 50 100 150
Fati
gue
cra
ckin
g (%
)
Pavement age (month)

116
Project ID: 055-06-0049
General Information: District: 03 Two-Way ADT:
12022
Parish: 57 Number of Lane in Design Direction: 4
Route: LA 14 Growth Factor:
1%
Accept Date: 5/8/2001 Axle Load Spectrum: Louisiana Default (TTC12)
Pavement Structure:
Asphalt Concrete: 1.5" TYPE 8F WEARING COURSE (PG 76-22) + 4" TYPE 8 BINDER COURSE (PG 76-22)
Base:
6.5” TYPE 5A AC (PG 64-22)
Subbase: Subgrade:
A-6 (Mr = 7627 psi) Predicted vs. Measured Pavement Performance
0
10
20
30
40
50
60
70
80
90
100
0 50 100 150
IRI (
in./
mi.
)
Pavement age (month)
PMS Mean
PMS Mean Fit
PMS Mean + STD
PMS Mean + STD Fit
MEPDG Mean
MEPDG Reliability
0
0.05
0.1
0.15
0.2
0.25
0.3
0.35
0 50 100 150
Ru
ttin
g (i
n.)
Pavement age (month)
0
0.5
1
1.5
2
2.5
3
3.5
4
4.5
0 50 100 150
Fati
gue
cra
ckin
g (%
)
Pavement age (month)
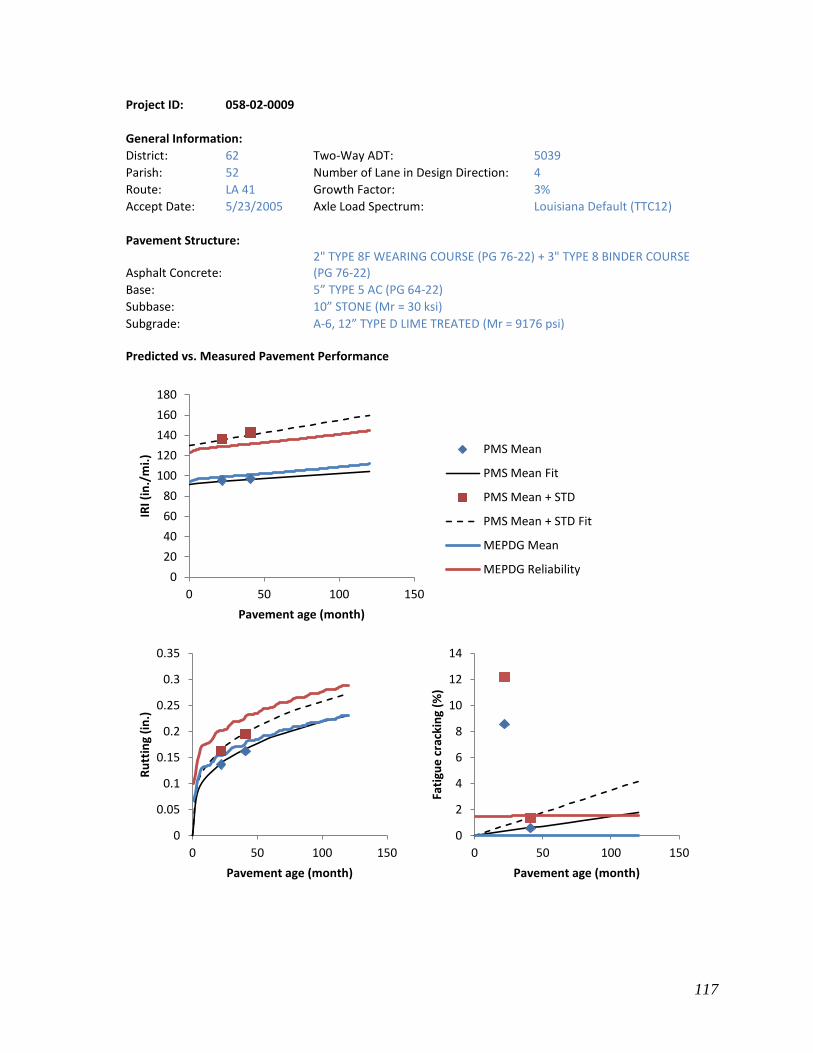
117
Project ID: 058-02-0009
General Information: District: 62 Two-Way ADT:
5039
Parish: 52 Number of Lane in Design Direction: 4
Route: LA 41 Growth Factor:
3%
Accept Date: 5/23/2005 Axle Load Spectrum: Louisiana Default (TTC12)
Pavement Structure:
Asphalt Concrete: 2" TYPE 8F WEARING COURSE (PG 76-22) + 3" TYPE 8 BINDER COURSE (PG 76-22)
Base:
5” TYPE 5 AC (PG 64-22)
Subbase:
10” STONE (Mr = 30 ksi)
Subgrade:
A-6, 12” TYPE D LIME TREATED (Mr = 9176 psi) Predicted vs. Measured Pavement Performance
0
20
40
60
80
100
120
140
160
180
0 50 100 150
IRI (
in./
mi.
)
Pavement age (month)
PMS Mean
PMS Mean Fit
PMS Mean + STD
PMS Mean + STD Fit
MEPDG Mean
MEPDG Reliability
0
0.05
0.1
0.15
0.2
0.25
0.3
0.35
0 50 100 150
Ru
ttin
g (i
n.)
Pavement age (month)
0
2
4
6
8
10
12
14
0 50 100 150
Fati
gue
cra
ckin
g (%
)
Pavement age (month)
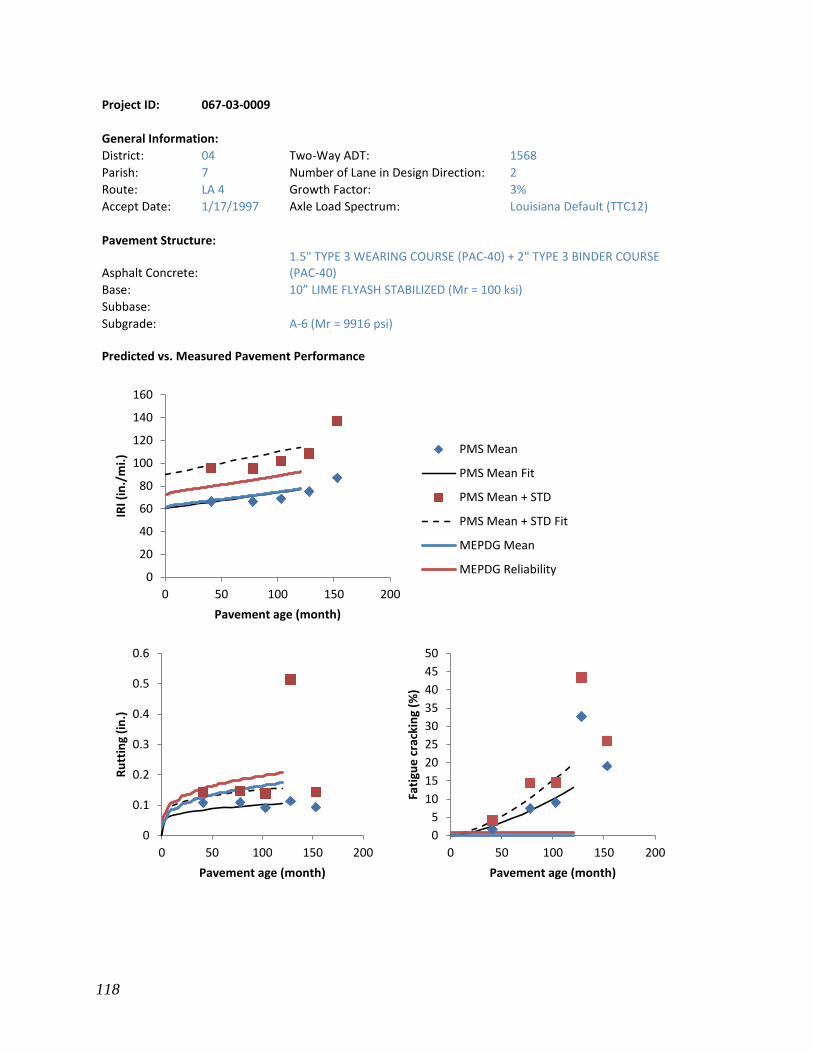
118
Project ID: 067-03-0009
General Information: District: 04 Two-Way ADT:
1568
Parish: 7 Number of Lane in Design Direction: 2
Route: LA 4 Growth Factor:
3%
Accept Date: 1/17/1997 Axle Load Spectrum: Louisiana Default (TTC12)
Pavement Structure:
Asphalt Concrete: 1.5" TYPE 3 WEARING COURSE (PAC-40) + 2" TYPE 3 BINDER COURSE (PAC-40)
Base:
10” LIME FLYASH STABILIZED (Mr = 100 ksi)
Subbase: Subgrade:
A-6 (Mr = 9916 psi) Predicted vs. Measured Pavement Performance
0
20
40
60
80
100
120
140
160
0 50 100 150 200
IRI (
in./
mi.
)
Pavement age (month)
PMS Mean
PMS Mean Fit
PMS Mean + STD
PMS Mean + STD Fit
MEPDG Mean
MEPDG Reliability
0
0.1
0.2
0.3
0.4
0.5
0.6
0 50 100 150 200
Ru
ttin
g (i
n.)
Pavement age (month)
0
5
10
15
20
25
30
35
40
45
50
0 50 100 150 200
Fati
gue
cra
ckin
g (%
)
Pavement age (month)

119
Project ID: 077-02-0013
General Information: District: 61 Two-Way ADT:
16157
Parish: 3 Number of Lane in Design Direction: 2
Route: LA 73 Growth Factor:
1%
Accept Date: 3/12/2005 Axle Load Spectrum: Louisiana Default (TTC12)
Pavement Structure:
Asphalt Concrete: 1.5" TYPE 8F WEARING COURSE (PG 76-22) + 2" TYPE 8 BINDER COURSE (PG 76-22)
Base:
4.5” TYPE 5 AC (PG 64-22)
Subbase:
8.5“ STONE (Mr = 30 ksi)
Subgrade:
A-4, 12” TYPE D LIME TREATED (Mr = 8413 psi) Predicted vs. Measured Pavement Performance
0
20
40
60
80
100
120
140
160
180
0 50 100 150
IRI (
in./
mi.
)
Pavement age (month)
PMS Mean
PMS Mean Fit
PMS Mean + STD
PMS Mean + STD Fit
MEPDG Mean
MEPDG Reliability
0
0.05
0.1
0.15
0.2
0.25
0.3
0.35
0.4
0.45
0.5
0 50 100 150
Ru
ttin
g (i
n.)
Pavement age (month)
0
0.5
1
1.5
2
2.5
0 50 100 150
Fati
gue
cra
ckin
g (%
)
Pavement age (month)

120
Project ID: 139-06-0011
General Information: District: 08 Two-Way ADT:
1027
Parish: 58 Number of Lane in Design Direction: 2
Route: LA 463 Growth Factor:
1%
Accept Date: 5/5/1999 Axle Load Spectrum: Louisiana Default (TTC12)
Pavement Structure:
Asphalt Concrete: 1.5" TYPE 8 WEARING COURSE (PAC-40) + 2" TYPE 8 BINDER COURSE (PAC-40)
Base:
12” CEMENT TREATED (Mr = 100 ksi)
Subbase: Subgrade:
A-4, 12” TYPE D LIME TREATED (Mr = 8797 psi) Predicted vs. Measured Pavement Performance
0
20
40
60
80
100
120
0 50 100 150
IRI (
in./
mi.
)
Pavement age (month)
PMS Mean
PMS Mean Fit
PMS Mean + STD
PMS Mean + STD Fit
MEPDG Mean
MEPDG Reliability
0
0.05
0.1
0.15
0.2
0.25
0 50 100 150
Ru
ttin
g (i
n.)
Pavement age (month)
0
1
2
3
4
5
6
7
8
9
0 50 100 150
Fati
gue
cra
ckin
g (%
)
Pavement age (month)

121
Project ID: 193-02-0039
General Information: District: 07 Two-Way ADT:
3969
Parish: 12 Number of Lane in Design Direction: 2
Route: LA 27 Growth Factor:
2.8%
Accept Date: 8/20/2002 Axle Load Spectrum: Louisiana Default (TTC12)
Pavement Structure:
Asphalt Concrete: 1.5" TYPE 8F WEARING COURSE (PG 76-22) + 3" TYPE 8 BINDER COURSE (PG 76-22)
Base:
12” STONE (Mr = 30 ksi)
Subbase: Subgrade:
A-4 (Mr = 9176 psi) Predicted vs. Measured Pavement Performance
0
20
40
60
80
100
120
0 50 100 150
IRI (
in./
mi.
)
Pavement age (month)
PMS Mean
PMS Mean Fit
PMS Mean + STD
PMS Mean + STD Fit
MEPDG Mean
MEPDG Reliability
0
0.05
0.1
0.15
0.2
0.25
0.3
0.35
0.4
0.45
0.5
0 50 100 150
Ru
ttin
g (i
n.)
Pavement age (month)
0
0.5
1
1.5
2
2.5
3
0 50 100 150
Fati
gue
cra
ckin
g (%
)
Pavement age (month)

122
Project ID: 211-04-0009
General Information: District: 03 Two-Way ADT:
4833
Parish: 1 Number of Lane in Design Direction: 2
Route: LA 755 Growth Factor:
1.9%
Accept Date: 8/19/1999 Axle Load Spectrum: Louisiana Default (TTC12)
Pavement Structure:
Asphalt Concrete: 1.5" TYPE 8F WEARING COURSE (PAC-40) + 2" TYPE 8 BINDER COURSE (PAC-40)
Base:
8.5” CEMENT STABILIZED (Mr = 100 ksi)
Subbase: Subgrade:
A-4, 12” TYPE D LIME TREATED (Mr = 8797 psi) Predicted vs. Measured Pavement Performance
0
20
40
60
80
100
120
140
160
0 50 100 150
IRI (
in./
mi.
)
Pavement age (month)
PMS Mean
PMS Mean Fit
PMS Mean + STD
PMS Mean + STD Fit
MEPDG Mean
MEPDG Reliability
0
0.05
0.1
0.15
0.2
0.25
0.3
0.35
0.4
0.45
0 50 100 150
Ru
ttin
g (i
n.)
Pavement age (month) -1
0
1
2
3
4
5
6
7
0 50 100 150
Fati
gue
cra
ckin
g (%
)
Pavement age (month)
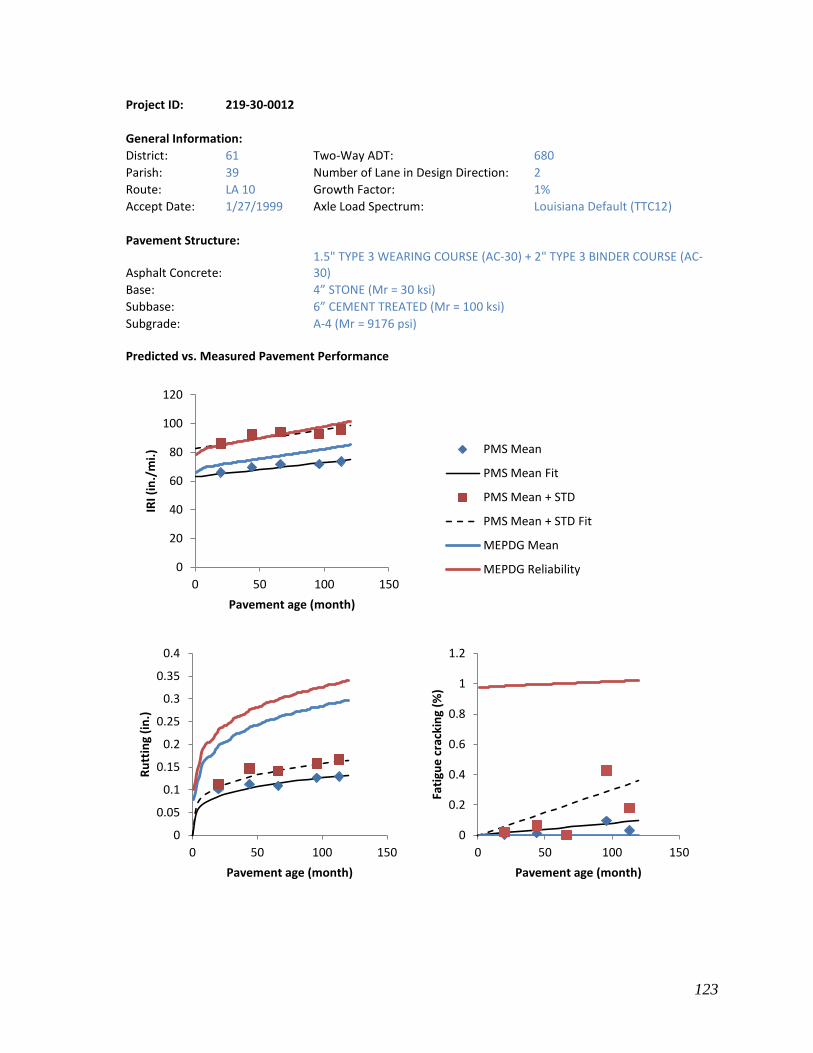
123
Project ID: 219-30-0012
General Information: District: 61 Two-Way ADT:
680
Parish: 39 Number of Lane in Design Direction: 2
Route: LA 10 Growth Factor:
1%
Accept Date: 1/27/1999 Axle Load Spectrum: Louisiana Default (TTC12)
Pavement Structure:
Asphalt Concrete: 1.5" TYPE 3 WEARING COURSE (AC-30) + 2" TYPE 3 BINDER COURSE (AC-30)
Base:
4” STONE (Mr = 30 ksi)
Subbase:
6” CEMENT TREATED (Mr = 100 ksi)
Subgrade:
A-4 (Mr = 9176 psi) Predicted vs. Measured Pavement Performance
0
20
40
60
80
100
120
0 50 100 150
IRI (
in./
mi.
)
Pavement age (month)
PMS Mean
PMS Mean Fit
PMS Mean + STD
PMS Mean + STD Fit
MEPDG Mean
MEPDG Reliability
0
0.05
0.1
0.15
0.2
0.25
0.3
0.35
0.4
0 50 100 150
Ru
ttin
g (i
n.)
Pavement age (month)
0
0.2
0.4
0.6
0.8
1
1.2
0 50 100 150
Fati
gue
cra
ckin
g (%
)
Pavement age (month)

124
Project ID: 230-03-0022
General Information: District: 61 Two-Way ADT:
2065
Parish: 24 Number of Lane in Design Direction: 2
Route: LA 75 Growth Factor:
2.3%
Accept Date: 10/17/2003 Axle Load Spectrum: Louisiana Default (TTC12)
Pavement Structure:
Asphalt Concrete: 1.5" TYPE 3 WEARING COURSE (PG 70-22) + 3.5 TYPE 3 BINDER COURSE (PG 70-22)
Base:
8.5” STONE (Mr = 30 ksi)
Subbase: Subgrade:
A-4 (Mr = 8413 psi) Predicted vs. Measured Pavement Performance
0
20
40
60
80
100
120
140
160
0 50 100 150
IRI (
in./
mi.
)
Pavement age (month)
PMS Mean
PMS Mean Fit
PMS Mean + STD
PMS Mean + STD Fit
MEPDG Mean
MEPDG Reliability
0
0.05
0.1
0.15
0.2
0.25
0.3
0.35
0.4
0 50 100 150
Ru
ttin
g (i
n.)
Pavement age (month)
0
5
10
15
20
25
30
35
40
45
0 50 100 150
Fati
gue
cra
ckin
g (%
)
Pavement age (month)

125
Project ID: 260-03-0010
General Information: District: 62 Two-Way ADT:
3014
Parish: 32 Number of Lane in Design Direction: 2
Route: LA 22 Growth Factor:
3%
Accept Date: 3/23/2000 Axle Load Spectrum: Louisiana Default (TTC12)
Pavement Structure:
Asphalt Concrete: 1.5" TYPE 8 WEARING COURSE (PAC-40) + 2" TYPE 8 BINDER COURSE (PAC-40)
Base:
8.5” CEMENT STABILIZED (Mr = 100 ksi)
Subbase: Subgrade:
A-6, 15” TYPE D LIME TREATED (Mr = 9549 psi) Predicted vs. Measured Pavement Performance
0
20
40
60
80
100
120
140
0 50 100 150
IRI (
in./
mi.
)
Pavement age (month)
PMS Mean
PMS Mean Fit
PMS Mean + STD
PMS Mean + STD Fit
MEPDG Mean
MEPDG Reliability
0
0.05
0.1
0.15
0.2
0.25
0.3
0.35
0 50 100 150
Ru
ttin
g (i
n.)
Pavement age (month)
0
2
4
6
8
10
12
0 50 100 150
Fati
gue
cra
ckin
g (%
)
Pavement age (month)
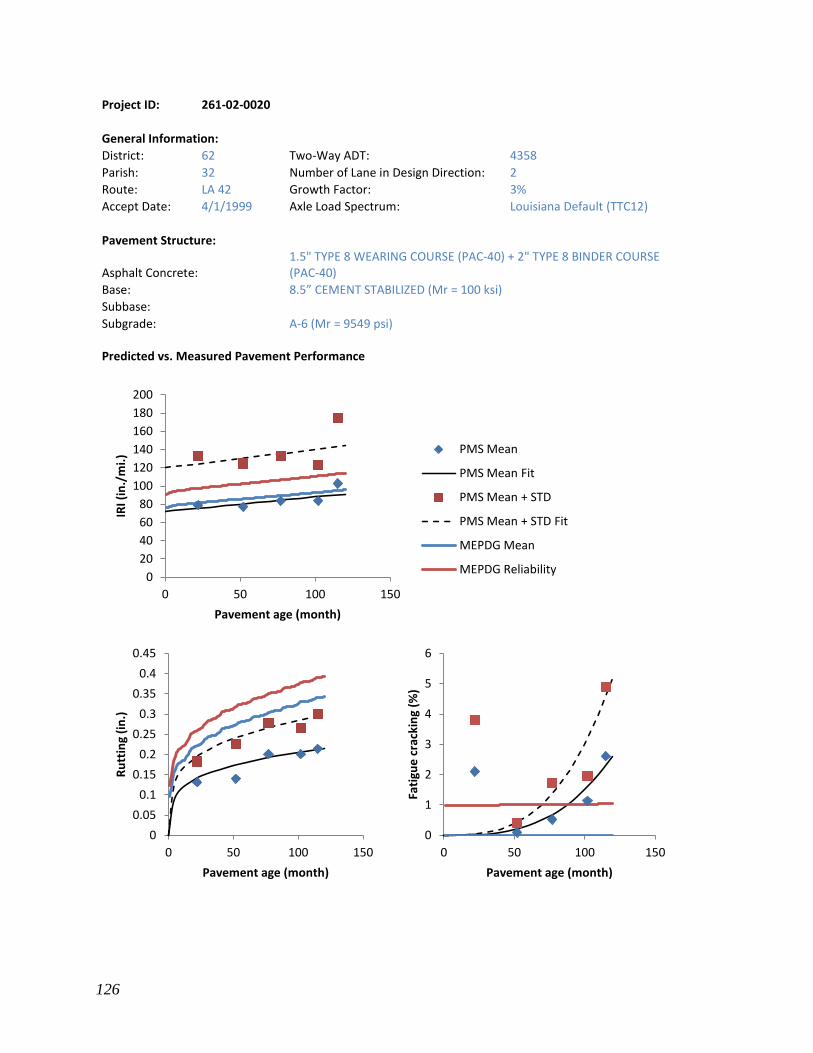
126
Project ID: 261-02-0020
General Information: District: 62 Two-Way ADT:
4358
Parish: 32 Number of Lane in Design Direction: 2
Route: LA 42 Growth Factor:
3%
Accept Date: 4/1/1999 Axle Load Spectrum: Louisiana Default (TTC12)
Pavement Structure:
Asphalt Concrete: 1.5" TYPE 8 WEARING COURSE (PAC-40) + 2" TYPE 8 BINDER COURSE (PAC-40)
Base:
8.5” CEMENT STABILIZED (Mr = 100 ksi)
Subbase: Subgrade:
A-6 (Mr = 9549 psi) Predicted vs. Measured Pavement Performance
0
20
40
60
80
100
120
140
160
180
200
0 50 100 150
IRI (
in./
mi.
)
Pavement age (month)
PMS Mean
PMS Mean Fit
PMS Mean + STD
PMS Mean + STD Fit
MEPDG Mean
MEPDG Reliability
0
0.05
0.1
0.15
0.2
0.25
0.3
0.35
0.4
0.45
0 50 100 150
Ru
ttin
g (i
n.)
Pavement age (month)
0
1
2
3
4
5
6
0 50 100 150
Fati
gue
cra
ckin
g (%
)
Pavement age (month)
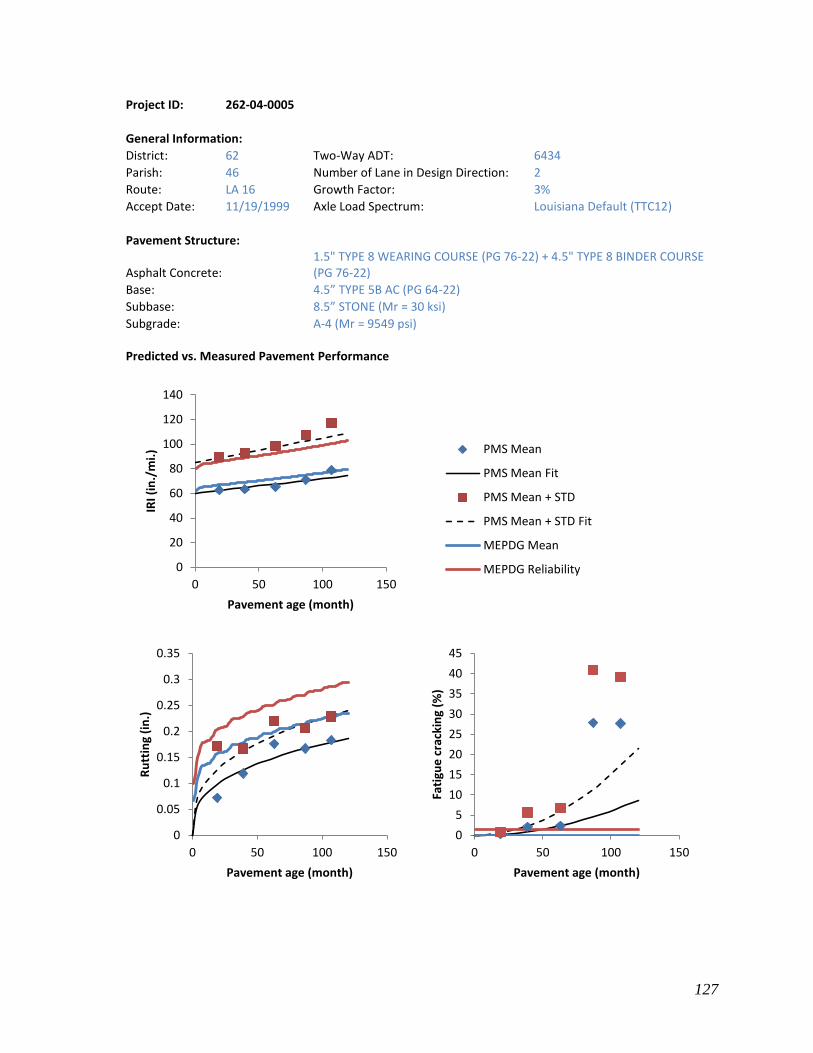
127
Project ID: 262-04-0005
General Information: District: 62 Two-Way ADT:
6434
Parish: 46 Number of Lane in Design Direction: 2
Route: LA 16 Growth Factor:
3%
Accept Date: 11/19/1999 Axle Load Spectrum: Louisiana Default (TTC12)
Pavement Structure:
Asphalt Concrete: 1.5" TYPE 8 WEARING COURSE (PG 76-22) + 4.5" TYPE 8 BINDER COURSE (PG 76-22)
Base:
4.5” TYPE 5B AC (PG 64-22)
Subbase:
8.5” STONE (Mr = 30 ksi)
Subgrade:
A-4 (Mr = 9549 psi) Predicted vs. Measured Pavement Performance
0
20
40
60
80
100
120
140
0 50 100 150
IRI (
in./
mi.
)
Pavement age (month)
PMS Mean
PMS Mean Fit
PMS Mean + STD
PMS Mean + STD Fit
MEPDG Mean
MEPDG Reliability
0
0.05
0.1
0.15
0.2
0.25
0.3
0.35
0 50 100 150
Ru
ttin
g (i
n.)
Pavement age (month)
0
5
10
15
20
25
30
35
40
45
0 50 100 150
Fati
gue
cra
ckin
g (%
)
Pavement age (month)
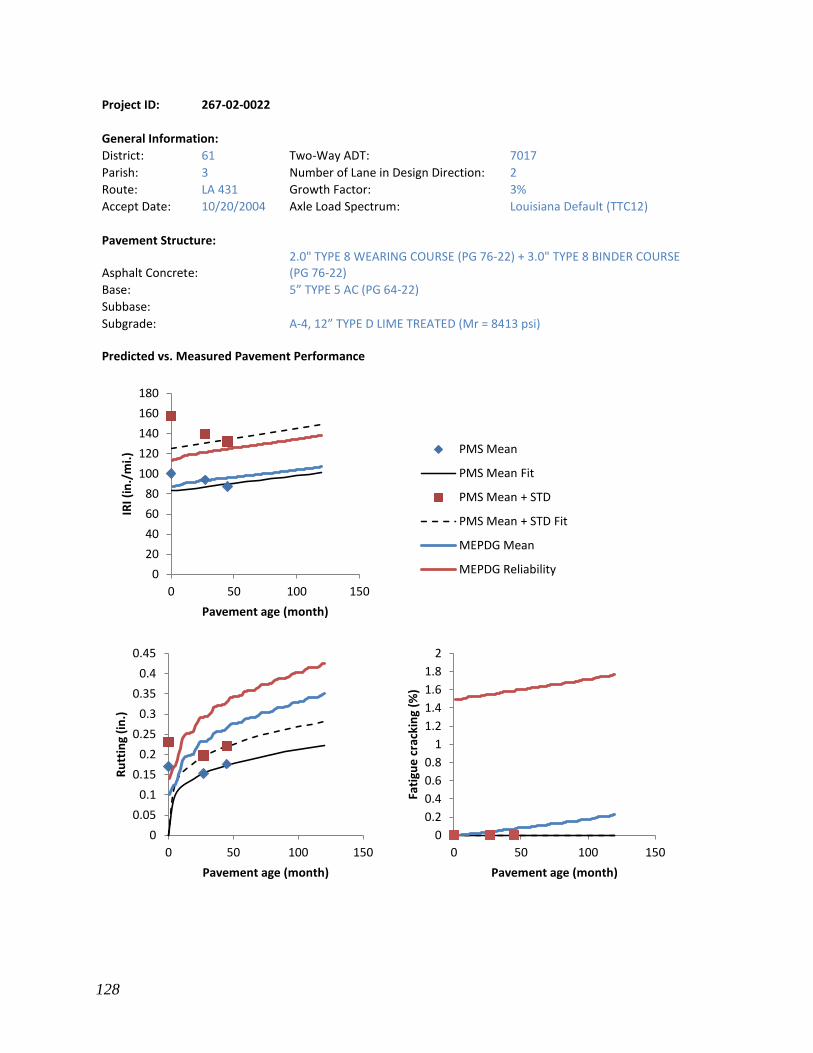
128
Project ID: 267-02-0022
General Information: District: 61 Two-Way ADT:
7017
Parish: 3 Number of Lane in Design Direction: 2
Route: LA 431 Growth Factor:
3%
Accept Date: 10/20/2004 Axle Load Spectrum: Louisiana Default (TTC12)
Pavement Structure:
Asphalt Concrete: 2.0" TYPE 8 WEARING COURSE (PG 76-22) + 3.0" TYPE 8 BINDER COURSE (PG 76-22)
Base:
5” TYPE 5 AC (PG 64-22)
Subbase: Subgrade:
A-4, 12” TYPE D LIME TREATED (Mr = 8413 psi) Predicted vs. Measured Pavement Performance
0
20
40
60
80
100
120
140
160
180
0 50 100 150
IRI (
in./
mi.
)
Pavement age (month)
PMS Mean
PMS Mean Fit
PMS Mean + STD
PMS Mean + STD Fit
MEPDG Mean
MEPDG Reliability
0
0.05
0.1
0.15
0.2
0.25
0.3
0.35
0.4
0.45
0 50 100 150
Ru
ttin
g (i
n.)
Pavement age (month)
0
0.2
0.4
0.6
0.8
1
1.2
1.4
1.6
1.8
2
0 50 100 150
Fati
gue
cra
ckin
g (%
)
Pavement age (month)
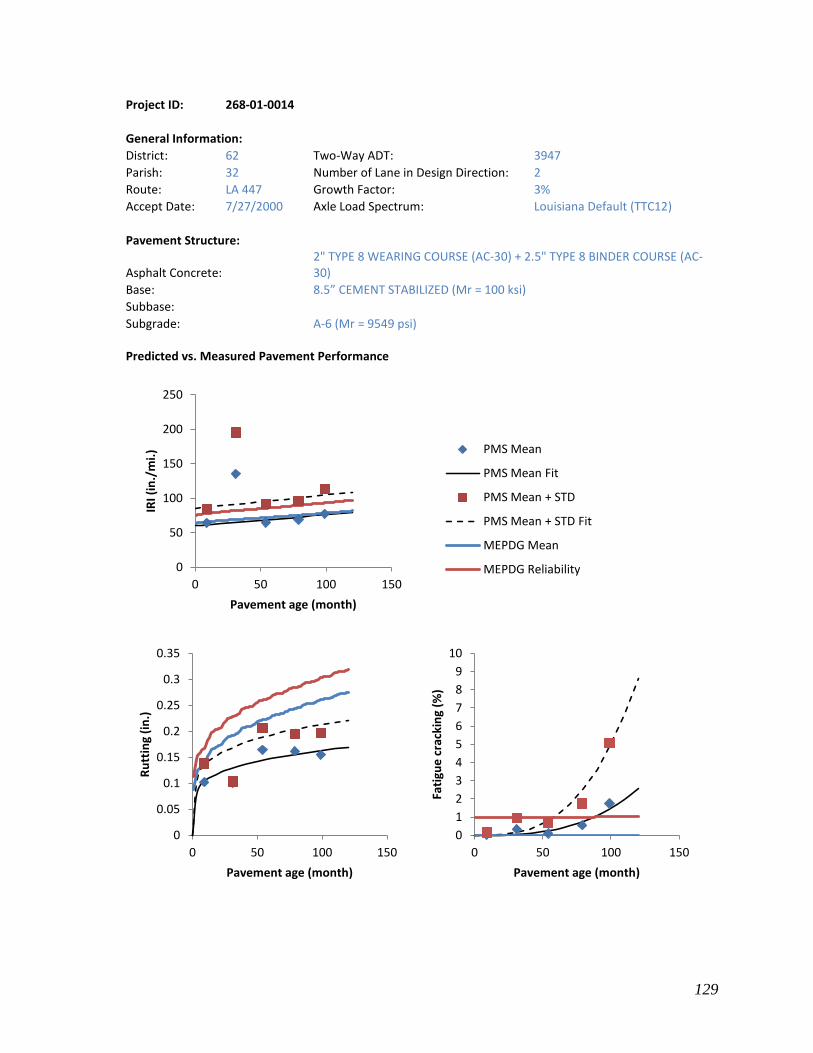
129
Project ID: 268-01-0014
General Information: District: 62 Two-Way ADT:
3947
Parish: 32 Number of Lane in Design Direction: 2
Route: LA 447 Growth Factor:
3%
Accept Date: 7/27/2000 Axle Load Spectrum: Louisiana Default (TTC12)
Pavement Structure:
Asphalt Concrete: 2" TYPE 8 WEARING COURSE (AC-30) + 2.5" TYPE 8 BINDER COURSE (AC-30)
Base:
8.5” CEMENT STABILIZED (Mr = 100 ksi)
Subbase: Subgrade:
A-6 (Mr = 9549 psi) Predicted vs. Measured Pavement Performance
0
50
100
150
200
250
0 50 100 150
IRI (
in./
mi.
)
Pavement age (month)
PMS Mean
PMS Mean Fit
PMS Mean + STD
PMS Mean + STD Fit
MEPDG Mean
MEPDG Reliability
0
0.05
0.1
0.15
0.2
0.25
0.3
0.35
0 50 100 150
Ru
ttin
g (i
n.)
Pavement age (month)
0
1
2
3
4
5
6
7
8
9
10
0 50 100 150
Fati
gue
cra
ckin
g (%
)
Pavement age (month)

130
Project ID: 397-04-0004
General Information: District: 03 Two-Way ADT:
3023
Parish: 57 Number of Lane in Design Direction: 2
Route: LA 89 Growth Factor:
3%
Accept Date: 7/19/1999 Axle Load Spectrum: Louisiana Default (TTC12)
Pavement Structure:
Asphalt Concrete: 1.5" TYPE 8 WEARING COURSE (PAC-40) + 2" TYPE 8 BINDER COURSE (PAC-40)
Base:
8.5” CEMENT STABILIZED (Mr = 100 ksi)
Subbase: Subgrade:
A-4 12” TYPE D LIME TREATED (Mr = 7627 psi) Predicted vs. Measured Pavement Performance
0
20
40
60
80
100
120
140
160
180
0 50 100 150
IRI (
in./
mi.
)
Pavement age (month)
PMS Mean
PMS Mean Fit
PMS Mean + STD
PMS Mean + STD Fit
MEPDG Mean
MEPDG Reliability
0
0.05
0.1
0.15
0.2
0.25
0.3
0.35
0.4
0 50 100 150
Ru
ttin
g (i
n.)
Pavement age (month)
0
2
4
6
8
10
12
0 50 100 150
Fati
gue
cra
ckin
g (%
)
Pavement age (month)
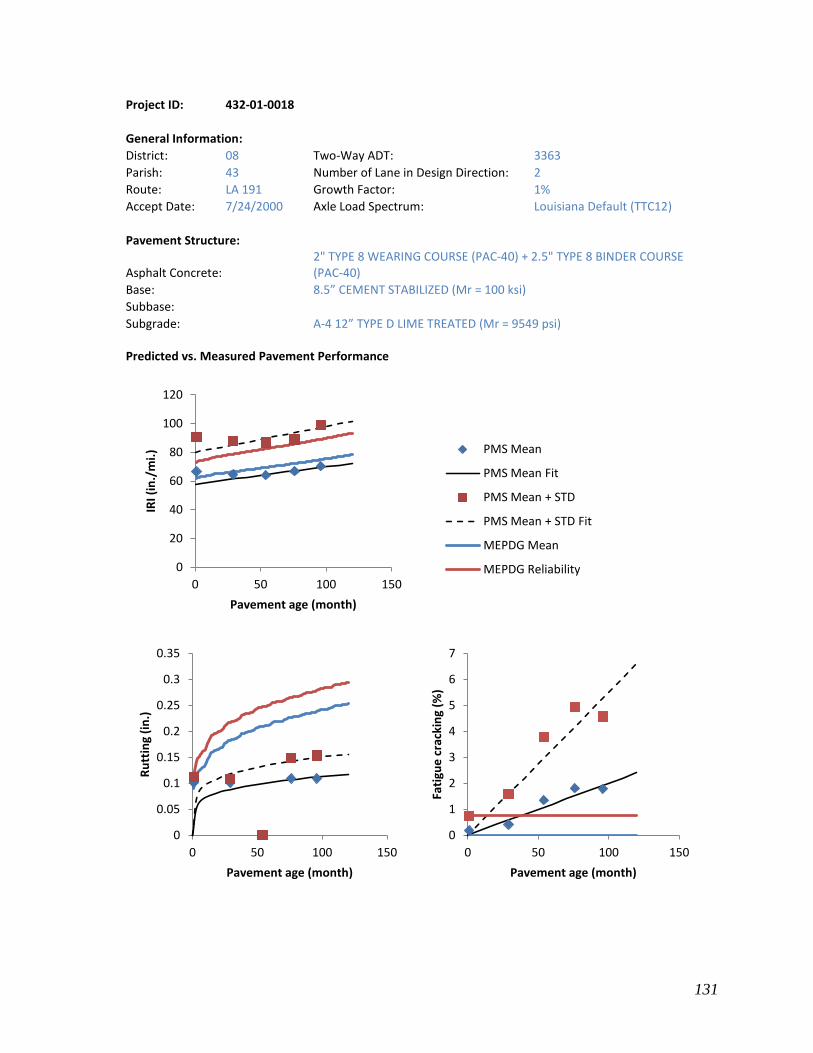
131
Project ID: 432-01-0018
General Information: District: 08 Two-Way ADT:
3363
Parish: 43 Number of Lane in Design Direction: 2
Route: LA 191 Growth Factor:
1%
Accept Date: 7/24/2000 Axle Load Spectrum: Louisiana Default (TTC12)
Pavement Structure:
Asphalt Concrete: 2" TYPE 8 WEARING COURSE (PAC-40) + 2.5" TYPE 8 BINDER COURSE (PAC-40)
Base:
8.5” CEMENT STABILIZED (Mr = 100 ksi)
Subbase: Subgrade:
A-4 12” TYPE D LIME TREATED (Mr = 9549 psi) Predicted vs. Measured Pavement Performance
0
20
40
60
80
100
120
0 50 100 150
IRI (
in./
mi.
)
Pavement age (month)
PMS Mean
PMS Mean Fit
PMS Mean + STD
PMS Mean + STD Fit
MEPDG Mean
MEPDG Reliability
0
0.05
0.1
0.15
0.2
0.25
0.3
0.35
0 50 100 150
Ru
ttin
g (i
n.)
Pavement age (month)
0
1
2
3
4
5
6
7
0 50 100 150
Fati
gue
cra
ckin
g (%
)
Pavement age (month)

132
Project ID: 450-03-0037
General Information: District: 07 Two-Way ADT:
33325
Parish: 27 Number of Lane in Design Direction: 4
Route: I-10 Growth Factor:
1%
Accept Date: 6/6/2002 Axle Load Spectrum: Louisiana Default (TTC3)
Pavement Structure:
Asphalt Concrete: 2" SUPERPAVE WEARING COURSE (PG 76-22) + 5.5" SUPERPAVE BINDER COURSE (PG 76-22)
Base:
10” RUBBLIZED PCC (Mr = 500 ksi)
Subbase:
6” EXISTED SOIL CEMENT (Mr = 30 ksi)
Subgrade:
A-4 12” TYPE D LIME TREATED (Mr = 8413 psi) Predicted vs. Measured Pavement Performance
0
10
20
30
40
50
60
70
80
90
100
0 50 100 150
IRI (
in./
mi.
)
Pavement age (month)
PMS Mean
PMS Mean Fit
PMS Mean + STD
PMS Mean + STD Fit
MEPDG Mean
MEPDG Reliability
0
0.1
0.2
0.3
0.4
0.5
0.6
0 50 100 150
Ru
ttin
g (i
n.)
Pavement age (month)
0
0.5
1
1.5
2
2.5
3
0 50 100 150
Fati
gue
cra
ckin
g (%
)
Pavement age (month)

133
Project ID: 450-03-0064
General Information: District: 07 Two-Way ADT:
35744
Parish: 27 Number of Lane in Design Direction: 4
Route: I-10 Growth Factor:
1%
Accept Date: 6/7/2004 Axle Load Spectrum: Louisiana Default (TTC3)
Pavement Structure:
Asphalt Concrete: 2" SUPERPAVE LEVEL 3 WEARING COURSE (PG 76-22) + 6" SUPERPAVE LEVEL 3 BINDER COURSECOURSE (PG 76-22)
Base:
10” RUBBLIZED PCC (Mr = 500 ksi)
Subbase:
6” EXISTED SOIL CEMENT (Mr = 30 ksi)
Subgrade:
A-7-6 (Mr = 8413 psi) Predicted vs. Measured Pavement Performance
0
20
40
60
80
100
120
0 50 100 150
IRI (
in./
mi.
)
Pavement age (month)
PMS Mean
PMS Mean Fit
PMS Mean + STD
PMS Mean + STD Fit
MEPDG Mean
MEPDG Reliability
0
0.1
0.2
0.3
0.4
0.5
0.6
0 50 100 150
Ru
ttin
g (i
n.)
Pavement age (month)
0
0.5
1
1.5
2
2.5
3
0 50 100 150
Fati
gue
cra
ckin
g (%
)
Pavement age (month)

134
Project ID: 450-04-0065
General Information: District: 03 Two-Way ADT:
40998
Parish: 1 Number of Lane in Design Direction: 4
Route: I-10 Growth Factor:
1%
Accept Date: 10/9/2001 Axle Load Spectrum: Louisiana Default (TTC3)
Pavement Structure:
Asphalt Concrete: 2" SMA WEARING COURSE (PG 76-22) + 5.5 TYPE 8 BINDER COURSE (PG 76-22)
Base:
10" RUBBLIZED PCC (Mr = 500 ksi)
Subbase:
6" EXISTED SOIL CEMENT (Mr = 30 ksi)
Subgrade:
A-4 (Mr = 8797 psi)
Predicted vs. Measured Pavement Performance
0
20
40
60
80
100
120
140
0 50 100 150
IRI (
in./
mi.
)
Pavement age (month)
PMS Mean
PMS Mean Fit
PMS Mean + STD
PMS Mean + STD Fit
MEPDG Mean
MEPDG Reliability
0
0.1
0.2
0.3
0.4
0.5
0.6
0 50 100 150
Ru
ttin
g (i
n.)
Pavement age (month)
0
0.5
1
1.5
2
2.5
3
0 50 100 150
Fati
gue
cra
ckin
g (%
)
Pavement age (month)
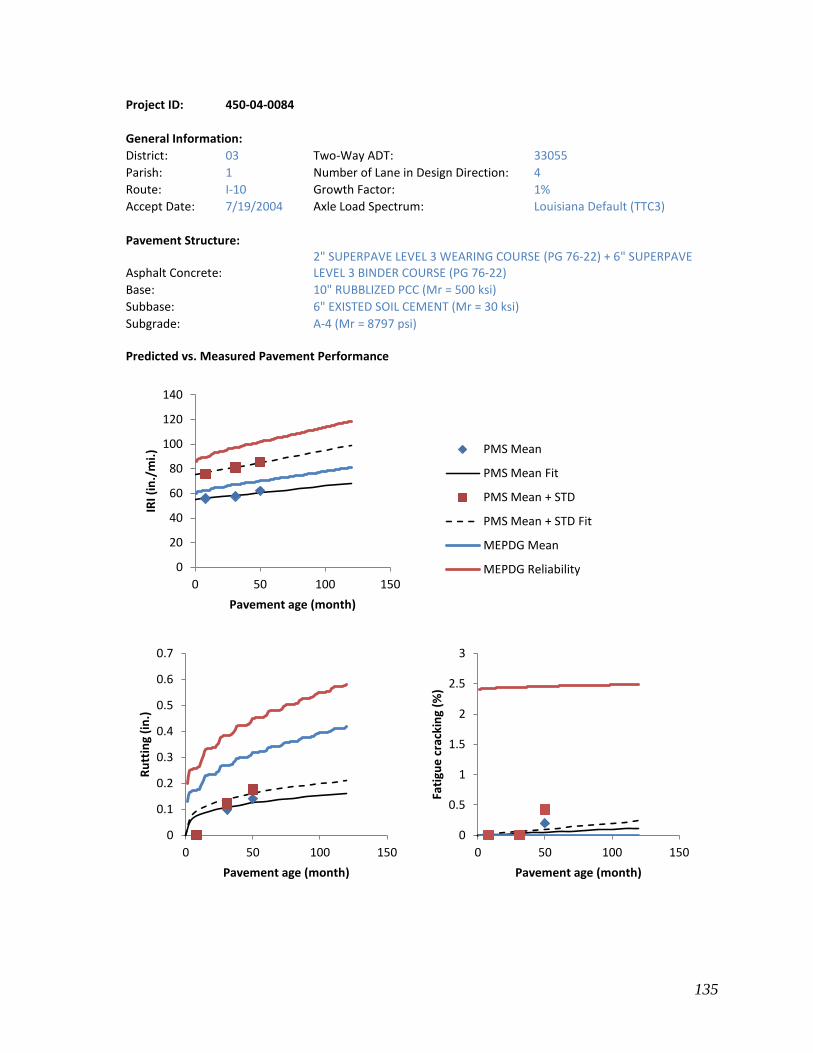
135
Project ID: 450-04-0084
General Information: District: 03 Two-Way ADT:
33055
Parish: 1 Number of Lane in Design Direction: 4
Route: I-10 Growth Factor:
1%
Accept Date: 7/19/2004 Axle Load Spectrum: Louisiana Default (TTC3)
Pavement Structure:
Asphalt Concrete: 2" SUPERPAVE LEVEL 3 WEARING COURSE (PG 76-22) + 6" SUPERPAVE LEVEL 3 BINDER COURSE (PG 76-22)
Base:
10" RUBBLIZED PCC (Mr = 500 ksi)
Subbase:
6" EXISTED SOIL CEMENT (Mr = 30 ksi)
Subgrade:
A-4 (Mr = 8797 psi)
Predicted vs. Measured Pavement Performance
0
20
40
60
80
100
120
140
0 50 100 150
IRI (
in./
mi.
)
Pavement age (month)
PMS Mean
PMS Mean Fit
PMS Mean + STD
PMS Mean + STD Fit
MEPDG Mean
MEPDG Reliability
0
0.1
0.2
0.3
0.4
0.5
0.6
0.7
0 50 100 150
Ru
ttin
g (i
n.)
Pavement age (month)
0
0.5
1
1.5
2
2.5
3
0 50 100 150
Fati
gue
cra
ckin
g (%
)
Pavement age (month)

136
Project ID: 450-05-0046
General Information: District: 03 Two-Way ADT:
41310
Parish: 28 Number of Lane in Design Direction: 4
Route: I-10 Growth Factor:
1%
Accept Date: 9/1/2000 Axle Load Spectrum: Louisiana Default (TTC3)
Pavement Structure:
Asphalt Concrete: 2" SMA WEARING COURSE (PAC-40) + 4" TYPE 8 BINDER COURSE (PAC-40)
Base:
10" RUBBLIZED PCC (Mr = 500 ksi)
Subbase:
6" EXISTED SOIL CEMENT (Mr = 30 ksi)
Subgrade:
A-7-6 (Mr = 9916 psi)
Predicted vs. Measured Pavement Performance
0
20
40
60
80
100
120
0 50 100 150
IRI (
in./
mi.
)
Pavement age (month)
PMS Mean
PMS Mean Fit
PMS Mean + STD
PMS Mean + STD Fit
MEPDG Mean
MEPDG Reliability
0
0.1
0.2
0.3
0.4
0.5
0.6
0 50 100 150
Ru
ttin
g (i
n.)
Pavement age (month)
0
0.5
1
1.5
2
2.5
3
0 50 100 150
Fati
gue
cra
ckin
g (%
)
Pavement age (month)
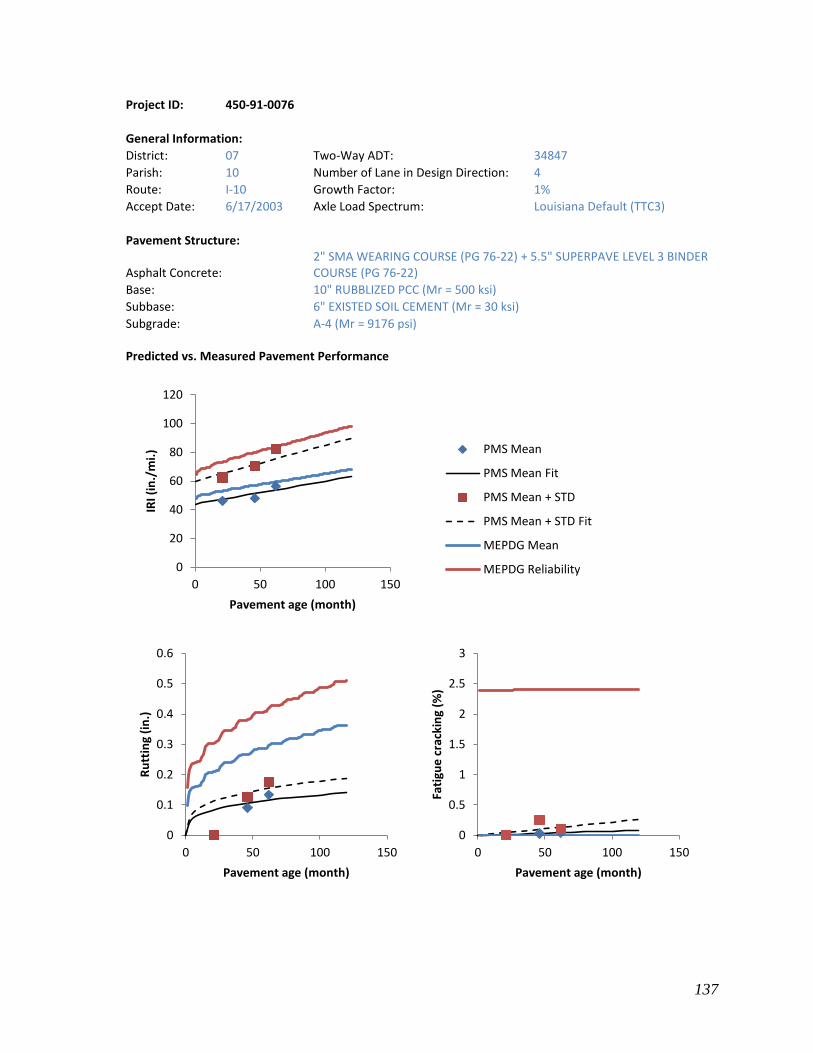
137
Project ID: 450-91-0076
General Information: District: 07 Two-Way ADT:
34847
Parish: 10 Number of Lane in Design Direction: 4
Route: I-10 Growth Factor:
1%
Accept Date: 6/17/2003 Axle Load Spectrum: Louisiana Default (TTC3)
Pavement Structure:
Asphalt Concrete: 2" SMA WEARING COURSE (PG 76-22) + 5.5" SUPERPAVE LEVEL 3 BINDER COURSE (PG 76-22)
Base:
10" RUBBLIZED PCC (Mr = 500 ksi)
Subbase:
6" EXISTED SOIL CEMENT (Mr = 30 ksi)
Subgrade:
A-4 (Mr = 9176 psi)
Predicted vs. Measured Pavement Performance
0
20
40
60
80
100
120
0 50 100 150
IRI (
in./
mi.
)
Pavement age (month)
PMS Mean
PMS Mean Fit
PMS Mean + STD
PMS Mean + STD Fit
MEPDG Mean
MEPDG Reliability
0
0.1
0.2
0.3
0.4
0.5
0.6
0 50 100 150
Ru
ttin
g (i
n.)
Pavement age (month)
0
0.5
1
1.5
2
2.5
3
0 50 100 150
Fati
gue
cra
ckin
g (%
)
Pavement age (month)

138
Project ID: 451-01-0083
General Information: District: 04 Two-Way ADT:
33505
Parish: 9 Number of Lane in Design Direction: 4
Route: I-20 Growth Factor:
1%
Accept Date: 11/29/1999 Axle Load Spectrum: Louisiana Default (TTC3)
Pavement Structure:
Asphalt Concrete: 2" SMA WEARING COURSE (PAC-40) + 6" TYPE 8 BINDER COURSE (PAC-40)
Base:
10" RUBBLIZED PCC (Mr = 500 ksi)
Subbase:
6" EXISTED SOIL CEMENT (Mr = 30 ksi)
Subgrade:
A-4 (Mr = 10278 psi)
Predicted vs. Measured Pavement Performance
0
20
40
60
80
100
120
140
0 50 100 150
IRI (
in./
mi.
)
Pavement age (month)
PMS Mean
PMS Mean Fit
PMS Mean + STD
PMS Mean + STD Fit
MEPDG Mean
MEPDG Reliability
0
0.1
0.2
0.3
0.4
0.5
0.6
0 50 100 150
Ru
ttin
g (i
n.)
Pavement age (month)
0
0.5
1
1.5
2
2.5
3
0 50 100 150
Fati
gue
cra
ckin
g (%
)
Pavement age (month)

139
Project ID: 451-05-0075
General Information: District: 05 Two-Way ADT:
21490
Parish: 31 Number of Lane in Design Direction: 4
Route: I-20 Growth Factor:
1%
Accept Date: 10/29/1998 Axle Load Spectrum: Louisiana Default (TTC3)
Pavement Structure:
Asphalt Concrete: 2" SMA WEARING COURSE (PAC-40) + 4" SUPERPAVE LEVEL 3 BINDER COURSE (PAC-40)
Base:
10" RUBBLIZED PCC (Mr = 500 ksi)
Subbase:
6" EXISTED SOIL CEMENT (Mr = 30 ksi)
Subgrade:
A-2-4 (Mr = 10278 psi)
Predicted vs. Measured Pavement Performance
0
20
40
60
80
100
120
0 50 100 150
IRI (
in./
mi.
)
Pavement age (month)
PMS Mean
PMS Mean Fit
PMS Mean + STD
PMS Mean + STD Fit
MEPDG Mean
MEPDG Reliability
0
0.1
0.2
0.3
0.4
0.5
0.6
0 50 100 150
Ru
ttin
g (i
n.)
Pavement age (month)
0
0.5
1
1.5
2
2.5
3
0 50 100 150
Fati
gue
cra
ckin
g (%
)
Pavement age (month)

140
Project ID: 451-06-0092
General Information: District: 05 Two-Way ADT:
25702
Parish: 37 Number of Lane in Design Direction: 4
Route: I-20 Growth Factor:
1%
Accept Date: 9/23/1999 Axle Load Spectrum: Louisiana Default (TTC3)
Pavement Structure:
Asphalt Concrete: 2" SMA WEARING COURSE (PAC-40) + 6" TYPE 8 BINDER COURSE (PAC-40)
Base:
10" RUBBLIZED PCC (Mr = 500 ksi)
Subbase:
6" EXISTED SOIL CEMENT (Mr = 30 ksi)
Subgrade:
A-4 (Mr = 9916 psi)
Predicted vs. Measured Pavement Performance
0
20
40
60
80
100
120
140
160
0 50 100 150
IRI (
in./
mi.
)
Pavement age (month)
PMS Mean
PMS Mean Fit
PMS Mean + STD
PMS Mean + STD Fit
MEPDG Mean
MEPDG Reliability
0
0.1
0.2
0.3
0.4
0.5
0.6
0 50 100 150
Ru
ttin
g (i
n.)
Pavement age (month)
0
0.5
1
1.5
2
2.5
3
0 50 100 150
Fati
gue
cra
ckin
g (%
)
Pavement age (month)

141
Project ID: 454-02-0026
General Information: District: 62 Two-Way ADT:
33062
Parish: 32 Number of Lane in Design Direction: 4
Route: I-12 Growth Factor:
1%
Accept Date: 6/18/2001 Axle Load Spectrum: Louisiana Default (TTC3)
Pavement Structure:
Asphalt Concrete: 4" SUPERPAVE LEVEL 3 WEARING COURSE (PG 76-22) + 4" SUPERPAVE LEVEL 3 BINDER COURSE (PG 76-22)
Base:
10" RUBBLIZED PCC (Mr = 500 ksi)
Subbase:
6" EXISTED SOIL CEMENT (Mr = 30 ksi)
Subgrade:
A-7-6 (Mr = 9549 psi)
Predicted vs. Measured Pavement Performance
0
20
40
60
80
100
120
0 50 100 150
IRI (
in./
mi.
)
Pavement age (month)
PMS Mean
PMS Mean Fit
PMS Mean + STD
PMS Mean + STD Fit
MEPDG Mean
MEPDG Reliability
0
0.05
0.1
0.15
0.2
0.25
0.3
0.35
0.4
0.45
0.5
0 50 100 150
Ru
ttin
g (i
n.)
Pavement age (month)
0
0.5
1
1.5
2
2.5
3
0 50 100 150
Fati
gue
cra
ckin
g (%
)
Pavement age (month)
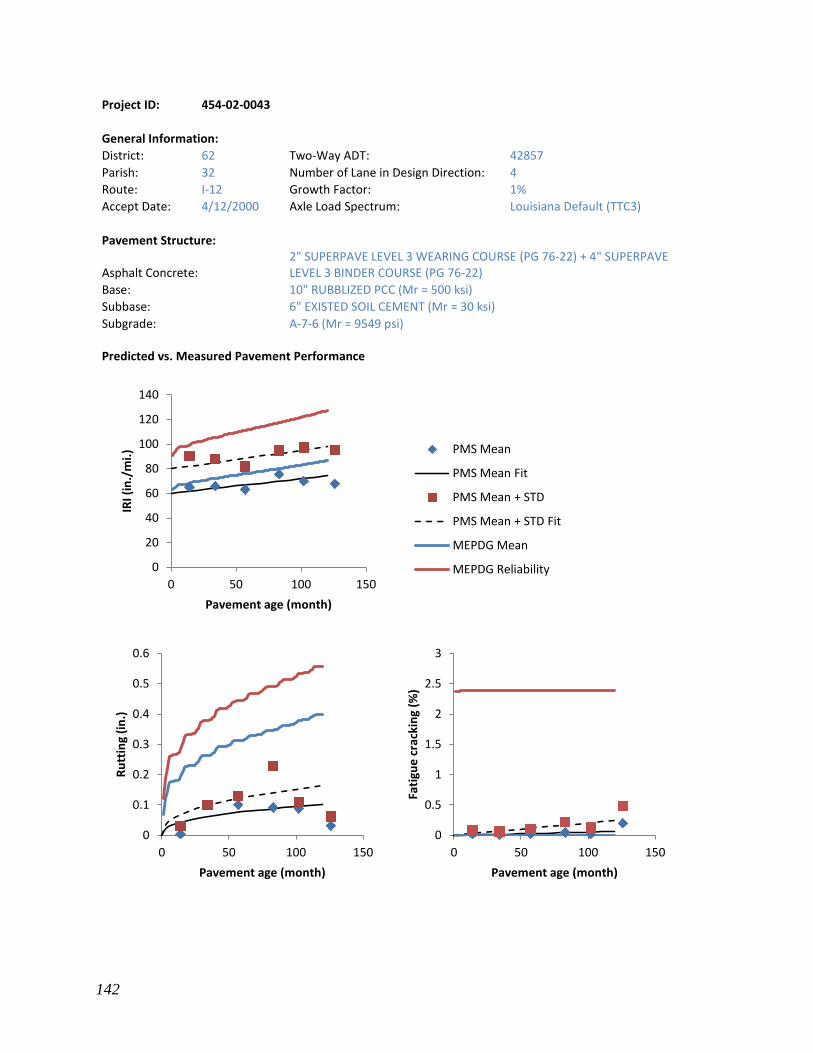
142
Project ID: 454-02-0043
General Information: District: 62 Two-Way ADT:
42857
Parish: 32 Number of Lane in Design Direction: 4
Route: I-12 Growth Factor:
1%
Accept Date: 4/12/2000 Axle Load Spectrum: Louisiana Default (TTC3)
Pavement Structure:
Asphalt Concrete: 2" SUPERPAVE LEVEL 3 WEARING COURSE (PG 76-22) + 4" SUPERPAVE LEVEL 3 BINDER COURSE (PG 76-22)
Base:
10" RUBBLIZED PCC (Mr = 500 ksi)
Subbase:
6" EXISTED SOIL CEMENT (Mr = 30 ksi)
Subgrade:
A-7-6 (Mr = 9549 psi)
Predicted vs. Measured Pavement Performance
0
20
40
60
80
100
120
140
0 50 100 150
IRI (
in./
mi.
)
Pavement age (month)
PMS Mean
PMS Mean Fit
PMS Mean + STD
PMS Mean + STD Fit
MEPDG Mean
MEPDG Reliability
0
0.1
0.2
0.3
0.4
0.5
0.6
0 50 100 150
Ru
ttin
g (i
n.)
Pavement age (month)
0
0.5
1
1.5
2
2.5
3
0 50 100 150
Fati
gue
cra
ckin
g (%
)
Pavement age (month)

143
Project ID: 454-03-0028
General Information: District: 62 Two-Way ADT:
39985
Parish: 53 Number of Lane in Design Direction: 4
Route: I-12 Growth Factor:
1%
Accept Date: 12/21/1999 Axle Load Spectrum: Louisiana Default (TTC1)
Pavement Structure:
Asphalt Concrete: 2" SMA WEARING COURSE (PAC-40) + 4" TYPE 8 BINDER COURSE (PAC-40) + 3" TYPE 5A BASE COURSE (AC-30)
Base:
10" RUBBLIZED PCC (Mr = 500 ksi)
Subbase:
6" EXISTED SOIL CEMENT (Mr = 30 ksi)
Subgrade:
A-4 (Mr = 10634 psi)
Predicted vs. Measured Pavement Performance
0
20
40
60
80
100
120
140
0 50 100 150
IRI (
in./
mi.
)
Pavement age (month)
PMS Mean
PMS Mean Fit
PMS Mean + STD
PMS Mean + STD Fit
MEPDG Mean
MEPDG Reliability
0
0.1
0.2
0.3
0.4
0.5
0.6
0 50 100 150
Ru
ttin
g (i
n.)
Pavement age (month)
0
0.5
1
1.5
2
2.5
3
0 50 100 150
Fati
gue
cra
ckin
g (%
)
Pavement age (month)
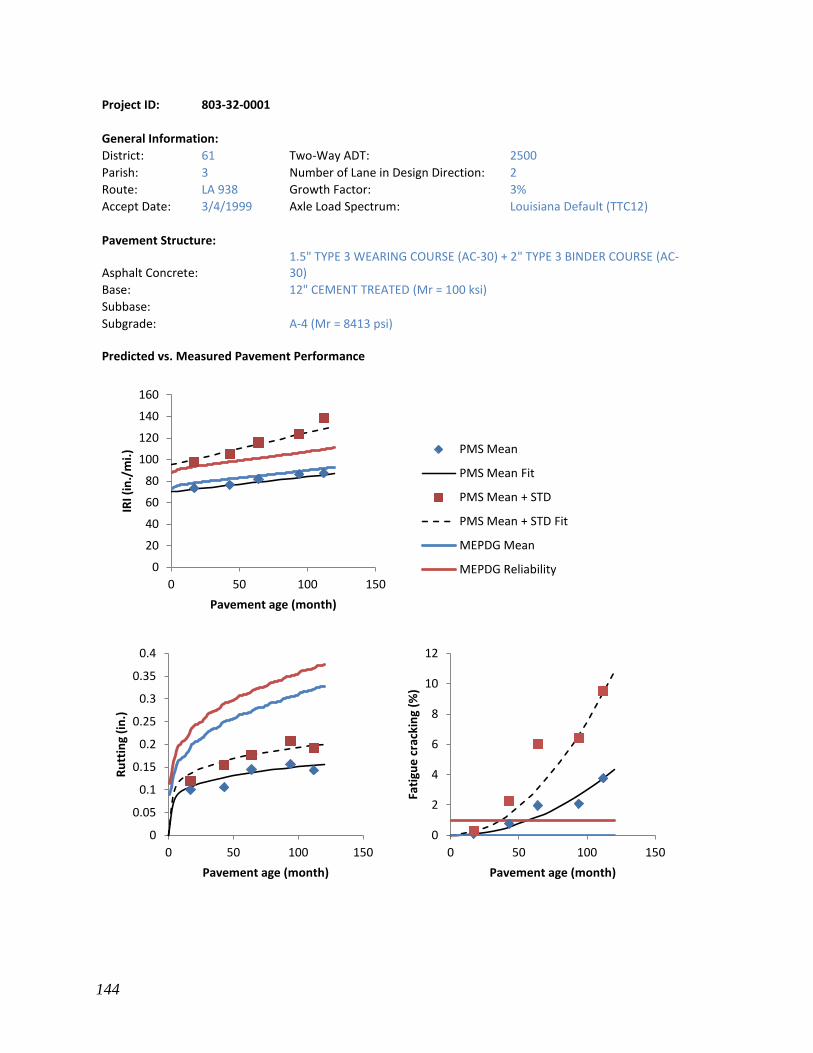
144
Project ID: 803-32-0001
General Information: District: 61 Two-Way ADT:
2500
Parish: 3 Number of Lane in Design Direction: 2
Route: LA 938 Growth Factor:
3%
Accept Date: 3/4/1999 Axle Load Spectrum: Louisiana Default (TTC12)
Pavement Structure:
Asphalt Concrete: 1.5" TYPE 3 WEARING COURSE (AC-30) + 2" TYPE 3 BINDER COURSE (AC-30)
Base:
12" CEMENT TREATED (Mr = 100 ksi)
Subbase: Subgrade:
A-4 (Mr = 8413 psi)
Predicted vs. Measured Pavement Performance
0
20
40
60
80
100
120
140
160
0 50 100 150
IRI (
in./
mi.
)
Pavement age (month)
PMS Mean
PMS Mean Fit
PMS Mean + STD
PMS Mean + STD Fit
MEPDG Mean
MEPDG Reliability
0
0.05
0.1
0.15
0.2
0.25
0.3
0.35
0.4
0 50 100 150
Ru
ttin
g (i
n.)
Pavement age (month)
0
2
4
6
8
10
12
0 50 100 150
Fati
gue
cra
ckin
g (%
)
Pavement age (month)

145
Project ID: 810-07-0014
General Information: District: 07 Two-Way ADT:
3890
Parish: 10 Number of Lane in Design Direction: 2
Route: LA 3020 Growth Factor:
2.4%
Accept Date: 11/23/1998 Axle Load Spectrum: Louisiana Default (TTC12)
Pavement Structure:
Asphalt Concrete: 1.5 TYPE 8 WEARING COURSE (PAC-40) + 2" TYPE 8 BINDER COURSE (PAC-40)
Base:
8.5" CEMENT STABILIZED (Mr = 100 ksi)
Subbase: Subgrade:
A-6 15” TYPE D LIME TREATED (Mr = 9176 psi) Predicted vs. Measured Pavement Performance
0
20
40
60
80
100
120
0 50 100 150
IRI (
in./
mi.
)
Pavement age (month)
PMS Mean
PMS Mean Fit
PMS Mean + STD
PMS Mean + STD Fit
MEPDG Mean
MEPDG Reliability
0
0.05
0.1
0.15
0.2
0.25
0.3
0.35
0 50 100 150
Ru
ttin
g (i
n.)
Pavement age (month)
0
0.5
1
1.5
2
2.5
3
3.5
0 50 100 150
Fati
gue
cra
ckin
g (%
)
Pavement age (month)
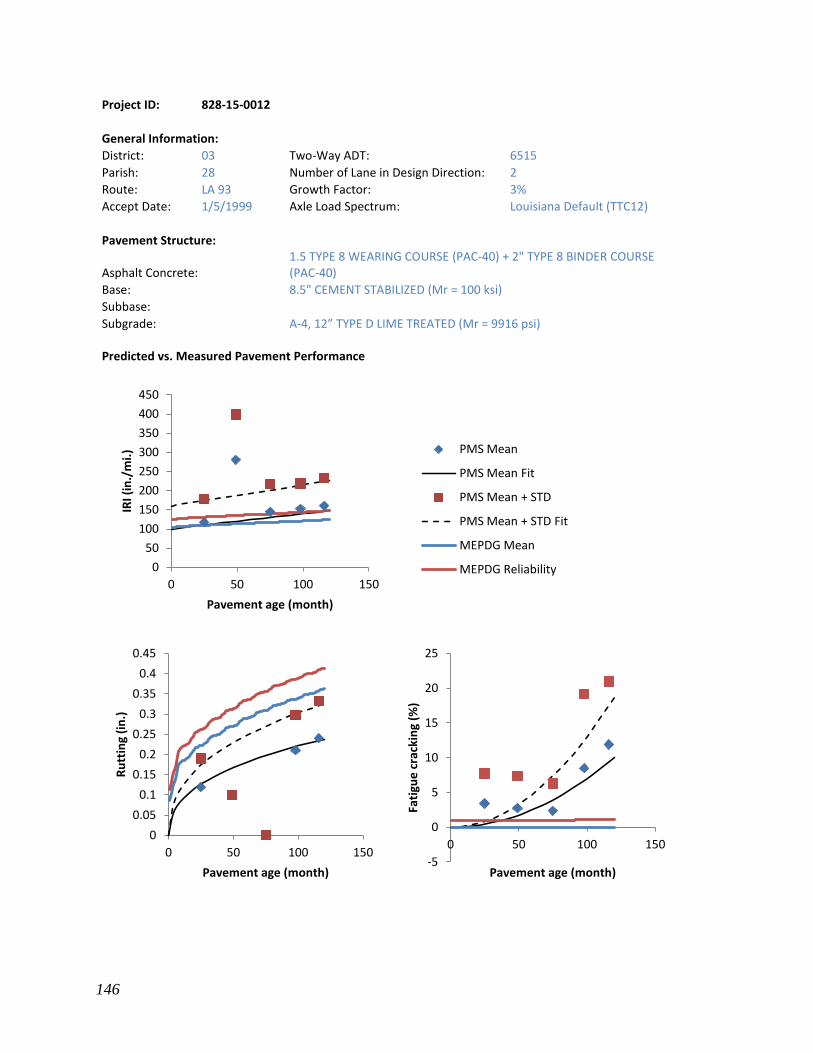
146
Project ID: 828-15-0012
General Information: District: 03 Two-Way ADT:
6515
Parish: 28 Number of Lane in Design Direction: 2
Route: LA 93 Growth Factor:
3%
Accept Date: 1/5/1999 Axle Load Spectrum: Louisiana Default (TTC12)
Pavement Structure:
Asphalt Concrete: 1.5 TYPE 8 WEARING COURSE (PAC-40) + 2" TYPE 8 BINDER COURSE (PAC-40)
Base:
8.5" CEMENT STABILIZED (Mr = 100 ksi)
Subbase: Subgrade:
A-4, 12” TYPE D LIME TREATED (Mr = 9916 psi) Predicted vs. Measured Pavement Performance
0
50
100
150
200
250
300
350
400
450
0 50 100 150
IRI (
in./
mi.
)
Pavement age (month)
PMS Mean
PMS Mean Fit
PMS Mean + STD
PMS Mean + STD Fit
MEPDG Mean
MEPDG Reliability
0
0.05
0.1
0.15
0.2
0.25
0.3
0.35
0.4
0.45
0 50 100 150
Ru
ttin
g (i
n.)
Pavement age (month) -5
0
5
10
15
20
25
0 50 100 150
Fati
gue
cra
ckin
g (%
)
Pavement age (month)

147
Project ID: 839-02-0016
General Information: District: 61 Two-Way ADT:
806
Parish: 39 Number of Lane in Design Direction: 2
Route: LA 419 Growth Factor:
1%
Accept Date: 7/19/1999 Axle Load Spectrum: Louisiana Default (TTC12)
Pavement Structure:
Asphalt Concrete: 1.5 TYPE 3 WEARING COURSE (AC-30) + 2" TYPE 3 BINDER COURSE (AC-30)
Base:
12" CEMENT TREATED (Mr = 100 ksi)
Subbase: Subgrade:
A-4 (Mr = 9176 psi) Predicted vs. Measured Pavement Performance
0
50
100
150
200
250
0 50 100 150
IRI (
in./
mi.
)
Pavement age (month)
PMS Mean
PMS Mean Fit
PMS Mean + STD
PMS Mean + STD Fit
MEPDG Mean
MEPDG Reliability
0
0.05
0.1
0.15
0.2
0.25
0 50 100 150
Ru
ttin
g (i
n.)
Pavement age (month)
0
2
4
6
8
10
12
14
16
0 50 100 150
Fati
gue
cra
ckin
g (%
)
Pavement age (month)

148
Project ID: 847-02-0019
General Information: District: 61 Two-Way ADT:
6626
Parish: 47 Number of Lane in Design Direction: 2
Route: LA 641 Growth Factor:
1%
Accept Date: 10/12/2000 Axle Load Spectrum: Louisiana Default (TTC12)
Pavement Structure:
Asphalt Concrete: 1.5" TYPE 8F WEARING COURSE (PAC-40) + 4.5" TYPE 8 BINDER COURSE (PAC-40)
Base:
8.5” STONE (Mr = 30 ksi)
Subbase: Subgrade:
A-7-6, 12” TYPE D LIME TREATED (Mr = 8023 psi) Predicted vs. Measured Pavement Performance
0
50
100
150
200
250
300
350
0 50 100 150
IRI (
in./
mi.
)
Pavement age (month)
PMS Mean
PMS Mean Fit
PMS Mean + STD
PMS Mean + STD Fit
MEPDG Mean
MEPDG Reliability
0
0.05
0.1
0.15
0.2
0.25
0.3
0.35
0.4
0.45
0 50 100 150
Ru
ttin
g (i
n.)
Pavement age (month)
0
1
2
3
4
5
6
7
8
0 50 100 150
Fati
gue
cra
ckin
g (%
)
Pavement age (month)
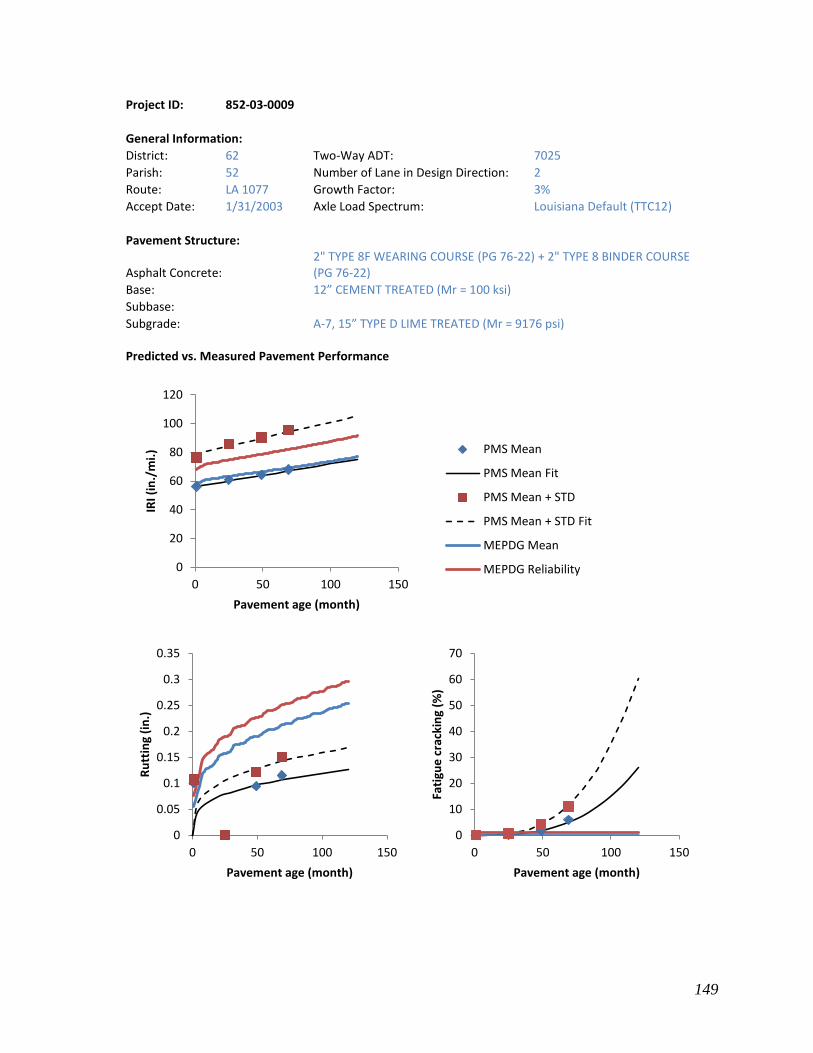
149
Project ID: 852-03-0009
General Information: District: 62 Two-Way ADT:
7025
Parish: 52 Number of Lane in Design Direction: 2
Route: LA 1077 Growth Factor:
3%
Accept Date: 1/31/2003 Axle Load Spectrum: Louisiana Default (TTC12)
Pavement Structure:
Asphalt Concrete: 2" TYPE 8F WEARING COURSE (PG 76-22) + 2" TYPE 8 BINDER COURSE (PG 76-22)
Base:
12” CEMENT TREATED (Mr = 100 ksi)
Subbase: Subgrade:
A-7, 15” TYPE D LIME TREATED (Mr = 9176 psi) Predicted vs. Measured Pavement Performance
0
20
40
60
80
100
120
0 50 100 150
IRI (
in./
mi.
)
Pavement age (month)
PMS Mean
PMS Mean Fit
PMS Mean + STD
PMS Mean + STD Fit
MEPDG Mean
MEPDG Reliability
0
0.05
0.1
0.15
0.2
0.25
0.3
0.35
0 50 100 150
Ru
ttin
g (i
n.)
Pavement age (month)
0
10
20
30
40
50
60
70
0 50 100 150
Fati
gue
cra
ckin
g (%
)
Pavement age (month)