evaluation of calotropis procera as a biomonitor of soil
TRANSCRIPT

International Journal of Applied Environmental Sciences
ISSN 0973-6077 Volume 12, Number 4 (2017), pp. 643-660
© Research India Publications
http://www.ripublication.com
Evaluation of Calotropis procera as a biomonitor of
soil pollution in Mysore and Periyapatna.
Prakruthi. T. R1, and Dr. Raju N. S2
1Department of Environmental Science, Yuvaraja’s college, University of Mysore
2DOS in Environmental Science, Manasa Gangotri, University of Mysore
Abstract
The increase in population in the few last decades has caused uncontrolled and
unplanned industrialization and urbanization. The main source of pollutants in
the environment is from traffic and industrial establishments. In the present
study soil pollution has been assessed using the plant Calotropis procera. The
concentration of nutrients (Ca, Mg, Na, K, P, S, Tot N and Org C) and heavy
metals(B, Ni, Fe, Mn, Zn, Cu, Pb and Cd) were analyzed in the leaves of C.
procera and soil collected from Mysore and Periyapatna roadsides of traffic
area as per following the APHA 2012 standards. In C. procera of both the
areas Iron is most dominant followed by Manganese and Zinc. Higher
concentration of some physico chemical parameters were observed in Pre-
monsoon followed by Post-monsoon and in Monsoon seasons. The results
showed that C. procera can be used as a bio-monitor of soil pollution.
Keywords: Heavy metals, Calotropis procera, biomonitoring, biomonitor and
soil pollution
Corresponding author: *Prakruthi. T. R, Assistant Professor,
Yuvaraja’s college, University of Mysore, Mysore, Karnataka, India.
e-mail: [email protected]
Co-author : Dr. N. S. Raju, Assistant Professor, DOS in Environmental Science,
Manasa Gangotri, University of Mysore, Mysore, Karnataka, India.
644 Prakruthi T.R. and Dr. Raju N.S.
INTRODUCTION
The increase in population in the last few decades has caused uncontrolled and
unplanned industrialization and urbanization. The pollutants in the urban areas are
mainly from traffic and industrial establishments. The pollution can be assessed using
plants as biomonitors. Biomonitors are the organisms which provide quantitative
information on environmental quality (Bargagli, 19981; Markert etal., 20032).
Biomonitors provide site – specific information on the soil quality as they incorporate
local environment (Wright and Welborn, 20023). Analysis of soil does not give the
information about the availability status of elements for the living organisms.
Therefore the availability of metals can be assesed simultaneously by analyzing soil
and plant samples (Bargagli, 19981). Both leaf and soil analysis are required for
assessing the extent of pollution or otherwise the quality of environment and hence it
should be treated as complementary to each other. (Ross 19944, Pilgrim and Huges,
19945; Kabata- Pendias and Pendias, 19926). The extent of accumulation of heavy
metal depends on the growing plant species and even heavy metal which will be
observed (Sesli, 20047; Ozturk et.al, 20088). In the last few decades the use of plant
leaves as Biomonitors of pollution in the environment has been increasing.
Determination of environmental pollution using Bioindicators and Biomonitors is a
cheap, simple and reliable method. It is observed that the presence of heavy metals in
the soil will be reflected by vegetation growing in it. (Butcher 19929, KabatPendias
and Pendias 19926, Badri and Springuel, 199410). Therefore plants can be used as
Biomonitors of heavy metals and it is also documented in literature (Ernst, 199311).
The aim of the present study is to determine the concentration of heavy metals and
other elements in soil and in plant leaves of C. procera.
MATERIALS AND METHODS
Calotropis procera is a large shrub belongs to the family Apocynaceae and grows to a
height of 3-6 ft. The stems are waxy and leaves are greyish green colored and contain
milky sap. They are native to Western and Southern Asia, Africa and Indochina. C.
procera is considered as an indicator of disturbed and overgrazed lands in arid and
semiarid regions (Tezara etal 201112). It helps in soil binding and can act as a nursing
crop for other species in afforestation programs (Orwa etal 200913). And it is also
used as green manure in paddy fields (Orwaetal 200913, Banta etal 198414).
Samples of soil and C. procera were collected from roadsides of Mysore and
Periyapatna in three different seasons; pre-monsoon, monsoon and post monsoon.
Mysore is the second largest city in Karnataka, India. It is spread across an area of
128.42 sq Km and is located at 120 181 N 760 391 E 12.300 N 76.650 E. Periyapatna is
a taluk in Mysore district. It is located at 120201N 760061E/ 12.340N
76.10E/12.34;76.1. The study areas are situated on National Highway 275. In each

Evaluation of Calotropis procera as a Biomonitor of Soil Pollution... 645
area, leaves were collected from 5 trees of C. procera randomly at a distance of
0 to 3 mts away from roads having high traffic density of Mysore and P. Patna.
Samples were mixed together to get a composite sample and packed in muslin bags.
They were brought to the laboratory and washed with distilled water to remove
adhering dust and soil particles. The leaves were shade dried followed by oven drying
at 65-700C for 48 h. They were grounded using homogenizer with stainless steel
blades (mixers), after grinding, the samples were mixed thoroughly and dried again at
700 C to remove moisture and passed through 1.5 mm sieve. Plant samples were
stored in screw type plastic bottles for further use. The soil samples were collected
from the top 10 cm using stainless steel trowel around the C. procera which has been
sampled. It was air dried and passed through 2 mm sieve and stored in self – sealing
plastic bags for analysis. Samples were analyzed for some physico chemical
parameters using standard analytical procedures (APHA 201215). The heavy metal
concentrations were detected using ICP (Perkin Elmer Optima 8000).
RESULTS AND DISCUSSION
Table 1: Physico-chemical parameters and heavy metals concentration (mg/kg) in soil
collected from roadsides of Mysore traffic area.
Sl. No Parameters PRM MON POM Min Max Ave
1 pH 7.41 7.42 7.51 7.41 7.51 7.45
2 EC 100.2 96.4 98.2 96.4 100.2 98.27
3 Ca 11.43 8.67 10.12 8.67 11.43 10.07
4 Mg 9.21 5.85 6.18 5.85 9.21 7.08
5 Na 0.81 0.78 0.81 0.78 0.81 0.80
6 K 5.24 5.26 4.72 4.72 5.26 5.07
7 T. Phosphate 0.62 0.48 0.52 0.48 0.62 0.54
8 Sulphate 15.6 12.52 13.26 12.52 15.6 13.79
9 Tot N 6.46 4.36 4.34 4.34 6.46 5.05
10 Org C 0.32 0.34 0.29 0.29 0.34 0.32
11 Tot Cr 62.3 39.8 52.3 39.8 62.3 51.47
12 Boron BDL BDL BDL 0 0 0.00
13 Ni 58.6 39.6 47.8 39.6 58.6 48.67
14 Fe 5213 3972 4783 3972 5213 4656.00
15 Mn 362.3 284.5 353.2 284.5 362.3 333.33
16 Zn 94.5 69.4 86.2 69.4 94.5 83.37
17 Cu 51.8 28.3 45.6 28.3 51.8 41.90
18 Pb 22.4 11.23 18.32 11.23 22.4 17.32
19 Cd 1.2 1.8 4.36 1.2 4.36 2.45
BDL: Below detectable level PRM: Pre-monsoon
MON: Monsoon POM: Post-monsoon

646 Prakruthi T.R. and Dr. Raju N.S.
Table 2: Physico-chemical parameters and heavy metals concentration (mg/kg) in soil
collected from roadsides of Periyapatna traffic area.
Sl. No Parameters PRM MON POM Min Max Ave
1 pH 7.68 7.74 7.52 7.52 7.74 7.65
2 EC 98.3 92.4 94.3 92.4 98.3 95.00
3 Ca 10.83 8.53 10.23 8.53 10.83 9.86
4 Mg 7.13 4.16 8.23 4.16 8.23 6.51
5 Na 0.92 0.58 0.72 0.58 0.92 0.74
6 K 6.14 4.56 5.86 4.56 6.14 5.52
7 T. Phosphate 0.61 0.51 0.53 0.51 0.61 0.55
8 Sulphate 16.21 10.12 13.8 10.12 16.21 13.38
9 Tot N 5.86 5.27 5.82 5.27 5.86 5.65
10 Org C 0.61 0.43 0.42 0.42 0.61 0.49
11 Tot Cr 37.4 28.3 33.6 28.3 37.4 33.10
12 Boron BDL BDL BDL 0 0 0.00
13 Ni 44.6 32.14 44.3 32.14 44.6 40.35
14 Fe 4234 3721 4023 3721 4234 3992.67
15 Mn 222.4 140.4 203.4 140.4 222.4 188.73
16 Zn 71.86 53.2 72.4 53.2 72.4 65.82
17 Cu 30.2 21.4 28.6 21.4 30.2 26.73
18 Pb 12.2 6.21 12.2 6.21 12.2 10.20
19 Cd BDL BDL BDL 0 0 0.00
Table 3: Physico-chemical parameters and heavy metals concentration (mg/kg) in the
leaves of C. procera collected from roadsides of Mysore traffic area.
Sl. No Parameters PRM MON POM Min Max Ave
1 pH 6.91 6.41 6.56 6.41 6.91 6.63
2 EC 91.3 90.4 89.8 89.8 91.3 90.50
3 Ca 6.95 4.45 5.23 4.45 6.95 5.54
4 Mg 0.88 1.21 0.85 0.85 1.21 0.98
5 Na 0.58 0.61 0.62 0.58 0.62 0.60
6 K 0.78 0.62 0.63 0.62 0.78 0.68
7 T. Phosphate 0.64 0.5 0.51 0.5 0.64 0.55
8 Sulphate 0.78 0.54 0.82 0.54 0.82 0.71
9 Tot N 3.92 3.52 3.54 3.52 3.92 3.66
10 Org C 0.34 0.45 0.32 0.32 0.45 0.37
11 Tot Cr 10.46 8.6 11.68 8.6 11.68 10.25
12 Boron BDL BDL BDL 0 0 0.00
13 Ni 3.61 2.74 5.81 2.74 5.81 4.05

Evaluation of Calotropis procera as a Biomonitor of Soil Pollution... 647
14 Fe 410.4 321.6 386.4 321.6 410.4 372.80
15 Mn 192.4 163.8 189.3 163.8 192.4 181.83
16 Zn 61.4 34.2 54.3 34.2 61.4 49.97
17 Cu 21.3 18.21 20.5 18.21 21.3 20.00
18 Pb 10.6 3.88 7.28 3.88 10.6 7.25
19 Cd BDL BDL 1.57 1.57 1.57 1.57
Table 4: Physico-chemical parameters and heavy metals concentration (mg/kg) in the
leaves of C. procera collected from roadsides of Periyapatna traffic area.
Sl. No Parameters PRM MON POM Min Max Ave
1 pH 6.63 6.92 6.63 6.63 6.92 6.75
2 EC 80.32 73.4 81.3 73.4 81.3 77.94
3 Ca 4.12 3.84 3.63 3.63 4.12 3.87
4 Mg 0.92 0.64 0.81 0.64 0.92 0.79
5 Na 0.69 0.49 0.63 0.49 0.69 0.60
6 K 0.66 0.53 0.54 0.53 0.66 0.58
7 T. Phosphate 0.72 0.48 0.68 0.48 0.72 0.62
8 Sulphate 0.68 0.54 0.52 0.52 0.68 0.59
9 Tot N 4.12 3.72 3.71 3.71 4.12 3.88
10 Org C 0.56 0.37 0.46 0.37 0.56 0.46
11 Tot Cr 5.23 3.43 4.86 3.43 5.23 4.44
12 Boron BDL BDL BDL 0 0 0.00
13 Ni 2.63 0.92 3.23 0.92 3.23 2.19
14 Fe 342.4 201.8 334.7 201.8 342.4 284.62
15 Mn 344.7 44.2 108.4 44.2 344.7 177.24
16 Zn 40.6 15.5 36.2 15.5 40.6 29.68
17 Cu 12.4 4.21 11.2 4.21 12.4 8.88
18 Pb 5.4 2.23 6.32 2.23 6.32 4.50
19 Cd BDL BDL BDL 0 0 0
Soil
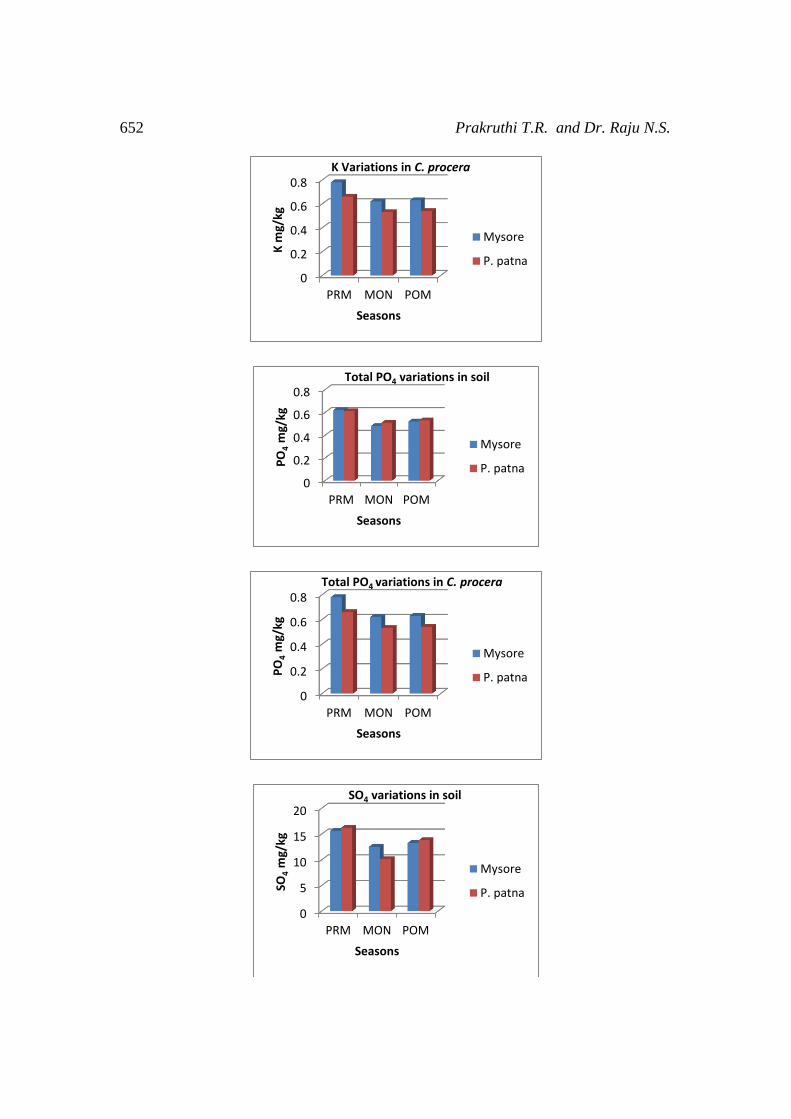
Soil samples pH ranged from 7.41-7.51 in Mysore and 7.52-7.68 in P.patna. In the
three seasons tested pH of soil remained alkaline in both places. EC was maximum in
PRM and low in Monsoon season in both Mysore and P.patna. The average organic
carbon concentration was 0.32% and 0.49 % in Mysore and P.patna respectively. The
average concentration of nutrients (mg/kg) and heavy metals (mg/kg) in Mysore soil
were 10.07(Ca), 7.08(Mg), 0.80(Na), 5.07(K), 0.54(P), 13.79(S), 5.05(Tot.N),
51.47(Cr), 48.67(Ni), 4656(Fe), 333.33(Mn), 83.37(Zn), 41.90(Cu), 13.72(Pb) and

648 Prakruthi T.R. and Dr. Raju N.S.
2.45(Cd). The concentration of nutrients (mg/kg) and heavy metals (mg/kg) in P.
patna soil were 9.86(Ca), 6.51(Mg), 0.74(Na), 5.52(K), 0.55(P), 13.38(S),
5.65(Tot.N), 33.10(Cr), 40.35(Ni), 3992.67(Fe), 188.73(Mn), 65.82(Zn), 26.73(Cu)
and 10.20(Pb). Cadmium was absent in P.patna soil and Boron was below detectable
limit in both places in all the seasons.
The source of contamination of soil by heavy metals may be as a result of industrial
activity and traffic density and also their natural presence in the soil as they are non-
degradable (Nriagu 199016, Adeyeye 200517). The heavy metals concentration in soil
was in the order Fe>Mn>Zn>Cr>Ni>Cu>Pb>Cd, and it was higher in soil as
compared to plant. The accumulation level of elements depends on the type of plant
and kind of heavy metal being studied (Alloway 199618).
Calotropis procera
pH variation was from 6.41 to 6.91 and from 6.63 to 6.92 in Mysore and Periyapatna
plants respectively. EC ranged from 89.8 to 91.3 dS/m and from 73.42 to 81.3 dS/m.
Average values for calcium, magnesium and Sulphate were 5.54 mg/kg, 0.98 mg/kg
and 0.71mg/kg respectively in Mysore and 3.87 mg/kg, 0.79 mg/kg and 0.59 mg/kg
respectively in Periyapatna. In both places Ca and Mg contents in C. procera were
above the prescribed values (GKVK Manual 201019). Average Sodium and Organic
carbon were 0.6 mg/kg and 0.46 mg/kg in Mysore and 0.6 mg/kg and 0.37 mg/kg in
Periyapatna. Potassium and Total N were within the recommended values (GKVK
Manual 201019) in all the seasons in both areas. Phosphate ranged from 0.48 to 0.72
mg/kg in Mysore and 0.5 to 0.64 mg/kg in Periyapatna, and it was above the
prescribed limit (GKVK Manual 201019) in PRM and POM seasons in both areas.
Chromium is known as a toxic element. In the present study total Cr ranged from 8.6
to 11.68 mg/kg and 3.43 to 5.23 mg/kg in Mysore road side and Periyapatna road side
respectively. High contents of Cr were observed in Mysore city area compared to
Periyapatna. In both the places Cr concentrations were high compared to prescribed
limits (Burke et al 200020). Boron was below detectable limit in both places. Nickel is
essential in minute quantity for organisms as it plays an important role in insulin
production, and it varied from 3.61 to 5.81 mg/kg and 0.92 to 3.23mg/kg in Mysore
and Periyapatna respectively. Both areas had Ni content within permissible limits
(Allen 198921, Kabata Pendias & Pendias 200122) except in POM season in Mysore.
The average values of Iron, Manganese, Zinc and Copper in C.procera were 372.8
mg/kg, 181.83 mg/kg, 49.97 mg/kg, and 20 mg/kg respectively in Mysore road side.
In Periyapatna the average values of Iron, Manganese, Zinc, and Copper were 284.62
mg/kg, 177.24 mg/kg, 29.68 mg/kg and 8.88 mg/kg respectively. All these parameters
were within the recommended values (Kabata Pendias & Pendias 199423). Lead is the
most toxic element for the living organisms; main source for lead pollution is

Evaluation of Calotropis procera as a Biomonitor of Soil Pollution... 649
vehicular smoke. Both areas had Pb content within prescribed limits (Kabata Pendias
& Pendias 19926) except in PRM season (10.6 mg/kg) in Mysore. Cadmium enters
into the environment mainly due to vehicular exhaust and industrial activities. It
showed its presence only in Mysore in POM season and its content was above the
recommended level (Kabata Pendias & Pendias 199423).
Graphical Representation of Variations in Physico Chemical Parameters and
Heavy Metals :
7.27.37.47.57.67.77.8
PRM MON POM
pH
Seasons
pH variations in soil
Mysore
P. patna
6
6.5
7
PRM MON POM
pH
Seasons
pH Variations in C. procera
Mysore
P. patna
889092949698
100102
PRM MON POM
EC d
S/m
Seasons
EC variations in soil
Mysore
P. patna

650 Prakruthi T.R. and Dr. Raju N.S.
0
50
100
PRM MON POM
EC d
S/m
Seasons
EC Variations in C. procera
Mysore
P. patna
0
5
10
15
PRM MON POM
Ca
mg/
kg
Seasons
Ca variations in soil
Mysore
P. patna
0
2
4
6
8
PRM MON POM
Ca
mg/
kg
Seasons
Ca Variations in C. procera
Mysore
P. patna
0
2
4
6
8
10
PRM MON POM
Mg
mg/
kg
Seasons
Mg variations in soil
Mysore
P. patna

Evaluation of Calotropis procera as a Biomonitor of Soil Pollution... 651
0
0.5
1
1.5
PRM MON POMM
g m
g/kg
Seasons
Mg Variations in C. procera
Mysore
P. patna
0
0.2
0.4
0.6
0.8
1
PRM MON POM
Na
mg/
kg
Seasons
Na variations in soil
Mysore
P. patna
0
0.2
0.4
0.6
0.8
PRM MON POM
Na
mg/
kg
Seasons)
Na Variations in C. procera
(Mysore)
P. patna
0
2
4
6
8
PRM MON POM
K m
g/kg
Seasons
K variations in soil
Mysore
P. patna
652 Prakruthi T.R. and Dr. Raju N.S.
0
0.2
0.4
0.6
0.8
PRM MON POM
K m
g/kg
Seasons
K Variations in C. procera
Mysore
P. patna
0
0.2
0.4
0.6
0.8
PRM MON POM
PO
4m
g/kg
Seasons
Total PO4 variations in soil
Mysore
P. patna
0
0.2
0.4
0.6
0.8
PRM MON POM
PO
4m
g/kg
Seasons
Total PO4 variations in C. procera
Mysore
P. patna
0
5
10
15
20
PRM MON POM
SO4
mg/
kg
Seasons
SO4 variations in soil
Mysore
P. patna

Evaluation of Calotropis procera as a Biomonitor of Soil Pollution... 653
0
0.2
0.4
0.6
0.8
1
PRM MON POM
SO4
mg/
kg
Seasons
SO4 variations in C. procera
Mysore
P. patna
0
2
4
6
8
PRM MON POM
Tota
l N m
g/kg
Seasons
Total N variations in soil
Mysore
P. patna
3
3.5
4
4.5
PRM MON POM
Tota
l N m
g/kg
Seasons
Total N Variations in C. procera
Mysore
P. patna
0
0.2
0.4
0.6
0.8
PRM MON POM
Org
C %
Seasons
Org C variations in soil
Mysore
P. patna

654 Prakruthi T.R. and Dr. Raju N.S.
0
0.2
0.4
0.6
PRM MON POMO
rg C
%
Seasons
Org C variations in C. procera
Mysore
P. patna
0
20
40
60
80
PRM MON POM
Tot
Cr
mg/
kg
Seasons
Tot Cr variations in soil
Mysore
P. patna
0
5
10
15
PRM MON POM
Tot
Cr
mg/
kg
Seasons
Tot Cr variations in C. procera
Mysore
P. patna
0
10
20
30
40
50
60
PRM MON POM
Ni m
g/kg
Seasons
Ni variations in soil
Mysore
P. patna

Evaluation of Calotropis procera as a Biomonitor of Soil Pollution... 655
0
1
2
3
4
5
6
PRM MON POM
Ni m
g/kg
Seasons
Ni variations in C. procera
Mysore
P. patna
0
2000
4000
6000
PRM MON POM
Fe m
g/kg
Seasons
Fe variations in soil
Mysore
P. patna
0
100
200
300
400
500
PRM MON POM
Fe m
g/kg
Seasons
Fe variations in C. procera
Mysore
P. patna
0
100
200
300
400
PRM MON POM
Mn
mg/
kg
Seasons
Mn variations in soil
Mysore
P. patna

656 Prakruthi T.R. and Dr. Raju N.S.
0
100
200
300
400
PRM MON POMM
n m
g/kg
Seasons
Mn variations in C. procera
Mysore
P. patna
0
20
40
60
80
100
PRM MON POM
Zn m
g/kg
Seasons
Zn variations in soil
Mysore
P. patna
0
20
40
60
80
PRM MON POM
Zn m
g/kg
Seasons
Zn variations in C. procera
Mysore
P. patna
0
20
40
60
PRM MON POM
Cu
mg/
kg
Seasons
Cu variations in soil
Mysore
P. patna

Evaluation of Calotropis procera as a Biomonitor of Soil Pollution... 657
0
5
10
15
20
25
PRM MON POMC
u m
g/kg
Seasons
Cu variations in C. procera
Mysore
P. patna
0
5
10
15
20
25
PRM MON POM
Pb
mg/
kg
Seasons
Pb variations in soil
Mysore
P. patna
0
5
10
15
PRM MON POM
Pb
mg/
kg
Seasons
Pb variations in C. procera
Mysore
P. patna
0
1
2
3
4
5
PRM MON POM
Cd
mg/
kg
seasons
Cd variations in soil
Mysore
P. patna

658 Prakruthi T.R. and Dr. Raju N.S.
CONCLUSION
In the present study nineteen parameters have been considered from C. procera and
soil samples in Mysore and P. Patna study area. Their levels varied from element wise
and from location wise. Variations may be due to differences in anthropogenic
activities of that region especially traffic density. In both areas Iron is most dominant
followed by Manganese and Zinc. Higher contents of elements were evident in PRM
season followed by POM and Monsoon seasons. This is mainly due to leaching of
nutrients and heavy metals during precipitation. The results provide baseline
information for biomonitoring of soil pollution. The study also recommends the use of
C. procera as an effective biomonitor. And also further studies can be done to know
the variations in uptake between different plant species.
ACKNOWLEDGEMENTS
One of the author (Prakruthi. T.R.) is thankful to DST, Ministry of Science and
Technology, Government of India for INSPIRE Fellowship.
REFERENCES
[1] Bargagli, R., 1998 Trace elements in Terrestrial plants. An Ecophysiological
Approach to Biomonitoring and Biorecovery. , verlag, Berlin.
[2] Markert, B.A, Breure A.M, Zechmeister, H.G., 2003, Definitions, strategies
and principles for bioindication / biomonitoring of the environment. Elsevier
Science Ltd.
[3] Wright D.A, welbroun, P., 2002,Environmental Toxicology Cambridge
University Press, Cambridge.
[4] Ross, S.M. 1994. Toxic metals in soil-plant systems John wiley and sons,
chichester.
[5] Pilgrim, W. Hughes, R.N., 1994, Lead, cadmium, arsenic and Zinc in the
0
0.5
1
1.5
2
PRM MON POM
Cd
mg/
kg
Seasons
Cd variations in C. procera
Mysore
P. patna

Evaluation of Calotropis procera as a Biomonitor of Soil Pollution... 659
ecosystem surrounding a lead smelter. Environmental monitoring and
Assessment 32, 1-20.
[6] Kabata – Pendias, A. and H. Pendias., 1992, Trace elements in soils and
plants. Boca Raton, FL: CRC press, pp. 365.
[7] Sesli, M., 2004, A study of lead contamination in tobacco leaves sampled from
alongside motor road in the rapidly industrializing city of Manisa, Turkey J.
Biological Sci., 4, 768-770.
[8] Ozturk, M., E. Yucel, S. Gucel, S. Sakcali and A. Aksoy., 2008, Plants as
Biomonitors of Trace Elements Pollution in soil. Trace Elements: Nutritional
Benefits, Environmental contamination and Health, Chapter 28, John wiley
and sons.
[9] Butcher, S.S., 1992, Global Biogeochemical cycles. International geophysics
Series, Vol 50. Academic Press, London.
[10] Badri, M and I. Springuel., 1994, Biogeochemical prospecting in the south
eastern desert of Egypt. J. Arid Environ. 28: 257-264.
[11] Ernst, W.H.O., 1993, Geobotanical and biogeochemical prospecting for heavy
metal deposits in Europe and Africa. In: plants as Biomonitors, (Ed): B.
Markert, 107-126. VCH, New York.
[12] Tezara, W.; Colombo, R. ; Coronel, I. ; Marín, O., 2011. Water relations and
photosynthetic capacity of two species of Calotropis in a tropical semi-arid
ecosystem. Ann. Bot., 107 (3): 397-405.
[13] Orwa, C.; Mutua, A.; Kindt, R.; Jamnadass, R.; Anthony, S., 2009.
Agroforestree Database: a tree reference and selection guide version 4.0.
World Agroforestry Centre, Kenya.
[14] Banta, S; Mendoza, C. V., 1984. Organic matter and rice. International Rice
Research Institute, 631 p.
[15] American Public Health Association (APHA) 2012.
[16] Nriagu, J.O., 1990, Global metal pollution: Poisoning the biopher.
Environment Envtar, 32 (9): 7-11, 28-33.
[17] Adeyeye, E.I., 2005, Trace metals in soils and plants from Fadama farms in
Ekiti state, Nigeria, Bulletin of chemical Society of Ethiopia 19: 23-24.
[18] Alloway, B.J., 1996, Heavy metal in soils. Halsted press, John Wiley and sons
Inc., London.
[19] GKVK manual 2010
[20] Burke et al 2000
[21] Allen S.E. Analysis of Ecological materials, 2nd ed. Blackwell scientific
publications, oxford 1989.
[22] Kabata – Pendias, A,;Pendias H., 2001, Trace elements in soils and plants. 3rd
Ed., Crc Press Inc., Boca Ralon, Florida, USA.
[23] Kabata – Pendias, A and H. Pendias., 1994, Trace element in soil and plants,
second edition. Boca Raton, Florida. CRC. PP: 365.

660 Prakruthi T.R. and Dr. Raju N.S.
[24] Alam. A and Srivastava S.C., 2009, Marchantia Paleacea Bert – As an
indicator of heavy metal pollution. Indian journal of Forestry 32 (3). 365-470.
[25] Bowen HJM., 1979, Environmental chemistry of the elements. Academic
press, New York, PP: 333.
[26] Campolucci, P. ; Paolini, C., 1990. Desertification control in the Sahel regions
- low-cost large-scale afforestation techniques. Note Tecniche 10. Centro di
Sperimentazione Agricola e Forestale di Sperimentazione per la Pioppicoltura.
24 p.
[27] Chatterjee, J., Chatterjee, F., 2000, Phytotoxicity of chromium, cabalt and
copper in cauliflour. Environmental pollution 109: 69-74.
[28] Cleik, A. and A. Aslihan., 2004, Determining the heavy metal pollution in
Denizli (Turkey) by usingRobinia pseudo acacia L. 31 (1): 105-112.
[29] Elekes, C.C., Dumitriu, I., Busuioc, G., Iliescu, N.S., 2010, The appreciation
of mineral element accumulation level in some herbaceous plants species by
ICP-AES method. Environmental Science and Pollution Research 17: 1230-
1236.
[30] Ellen, S.E., 1989, Chemical analyses of ecological material, 2ndedn. Blackwell
scientific, London, P. 367.
[31] Fleming G and Parle P., 1977, Heavy metals in soils, herbage and vegetables
from an industrialized area west of Dublin city. Irish Journal of Agricultural
research 16, 35-48.
[32] Lindroos, A.J, J. Derome, H. Raitio and P. Raution., 2007, Heavy metal
concentration in soil solution, soil and needles in a Norway spruce stand on an
acid sulphate forest soil. Water Air Soil Pollution. 180, 155-170.
[33] M. Miclean, M. Senila, C. Roman. T. Frentie, E. Cordor., 2009, Plant uptake
factors for 55 elements in a rural mining area, NW Romania, metal elements
in Environment, Medicine and Biology, 162-165.
[34] Madyon p, Murillo JM, Maranon T, Cabrera F, Lopez R., 2002,
Bioaccumulation of As, Cd, Cu, Fe and Pb in wild grasses affected by the
Aznalcollar mine spill (Sw Spain). The Science of the Total Environment 290,
105-120.
[35] Markert, B, 1993, Plant as biomoniotors / Indicators for heavy metals in the
terrestrial environment – weinbeim VCH. Press: 670. White poplar (Popular
alba) as a biomonitor of trace element in contaminated riparian forest.
Environ. Pollution, 132: 145-155.
[36] Prasad, M.N.V., Freitas, H.M.O., 2003, Metal hyperaccumulation in plants –
Biodiversity prospecting for phytoremediation technology. Electronic Journal
of Biotechnology 6 (3): 285-321.
[37] Wittig, R., 1993, General aspects of biomonitoring heavy metals by plants. In:
Plants as Biomonitors / Indicators for Heavy metals in the Terrestrial
environment. Markert B., VCH publisher, Weinheim, 3-28.