evaluation of binary decision diagrams for redundancy
TRANSCRIPT

Evaluation of Binary Decision Diagrams forRedundancy, Shadowing, Generalisation andCorrelation in an Information Sharing Model
Omair Uthmani, Prof William J Buchanan, Dr Lu Fan, Alistair Lawson
May 21, 2013
Abstract
This paper defines a structured methodology which is based on the founda-tional work of Al-Shaer et al. in [1] and that of Hamed and Al-Shaer in [2]. Itdefines a methodology for the declaration of policy field elements, through to thesyntax, ontology and functional verification stages. In their works of [1] and [2]the authors concentrated on developing formal definitions of possible anomaliesbetween rules in a network firewall rule set. Their work is considered as the foun-dation for further works on anomaly detection, including those of Fitzgerald et al.[3], Chen et al. [4], Hu et al. [5], among others. This paper extends this work byapplying the methods to information sharing policies, and outlines the evaluationrelated to these.

1 Introduction
In an increasingly connected world, data is becoming a key asset, especially within aBig Data context, where data from different domains can be brought together to pro-vide new in-sights. Most of the systems we have in-place, though, have been built tosecurely keep data behind highly secure environments, and have difficulty in integrat-ing with other disparate systems. This is now a major barrier to using data in a widerange of applications. Along with this, information sharing has many regulatory con-straints, which often disable information sharing across domains, but, with carefullymanaged information architectures, it is possible to overcome many of these problems.An important challenge is thus to support information sharing across different domainsand groups across multiple information systems. In the context of this paper, a domainis defined as the governance (and possible ownership) of a set of data, which is exposedto others through well-managed services.
The problem of providing governance around trusted infrastructures is highlighted byBoris Evelson who outlines that:
“Big data is such a new area that nobody has developed governance procedures andpolicies, there are more questions than answers.”
This paper outlines a novel modelling method for information sharing policies usingBinary Decision Diagrams using a syntax defined in [6] and which is currently beingused in a range of information sharing applications in health and social care.
2
2 Literature Review
2.1 Introduction
Information-sharing between police and community partner organisations lies at thevery centre of the Intelligence-Led Policing model. However, a number of key barri-ers need to be overcome to ensure that this sharing occurs within a legal frameworkand is proportionate to the goal of the sharing. This chapter outlines a perspectiveon the Intelligence-Led Policing model, from its historical origins to the present state,including recent developments and identification of areas of concern. A number of ex-amples of information sharing frameworks and a brief outline of their characteristicsis included in order to highlight some of the advantages of collaborative working. Thechapter defines certain key issues affecting enterprise systems interoperability, a keybarrier to information sharing, and proposed measures for addressing these.
2.2 Policies
Policies are sets of rules which govern the behaviour of a system. The correct def-inition, implementation and audit of policies is essential to ensure that the system iscompliant with its governing rules. High-level security policies are typically definedby an organisation’s upper management and usually describe the what, or goals, of thesecurity of the organisation. Without this definition of security goals, it is difficult touse security mechanisms effectively [7]. The lower-level implementation, or technicalpolicies, are then created from the overall high-level policy. This is the how of theorganisation’s security policy and it is used to enforce the security policy. The generalterm policy is used interchangeably in literature to describe both the high-level poli-cies, as well as the low-level implementation rules. In this paper, the term policy isused explicitly to refer to high-level policies while the term rules is used to refer tolower-level implementation rules. The processes involved in security policy creationand implementation are illustrated in Figure 1. A useful definition, taken from The SiteSecurity handbook - RFC2196 [7], of an overarching security policy is:
‘a formal statement of the rules by which people who are given access toan organization’s technology and information assets must abide’
The principles and guidelines outlined in RFC2196 provide a good reference for sys-tem administrators and policy decision makers when creating security policies. At itscore is a five-step iterative process detailing the processes for the creation and main-tenance of security policies. A key element of this is that the definition of a policy isan ongoing process, with regular reviews and auditing of mechanisms and providingfeedback to improve it. This highlights a fundamental principle that the process ofcreation, development and implementation of a policy is an integral part of the designof a system and is also a continuously evolving process, rather than simply being theimplementation of various security products [8, 9].
3

Figure 1: Policy creation and implementation processes.
4

2.3 Policy Enforcement
A number of industry standards and frameworks also highlight further principles ofthe policy creation process based on industry best practices. Two widely-used frame-works are Control Objectives for Information and Related Technology (COBIT) andthe ISO27002 Code of Practice for Information Security Management (previously ISO17799) which provide detailed industry standards in information security managementand audit compliance [10]. A common theme, often emphasised in these guidelines, isthe involvement of end-users in the implementation of policies, and their understand-ing of the goals the policies aim to enforce. End-users’ awareness and comprehensionof policies is often cited as a key factor in the policy’s successful implementation.Danchev [11] refers to this as an awareness program which emphasises that even themost technologically advanced security measures, such as firewalls and intrusion de-tection and prevention systems, can be rendered useless by careless or misinformedend-users. As illustrated in Figure 1, defining security policies includes details on howthe integrity, availability and confidentiality of assets belonging to an organisation areprotected. In order to accomplish this, Sandhu et al. state in [12] that policy documen-tation should contain details of authentication, authorisation and auditing procedures,which are used to enforce higher policy goals and, often, should also specify the de-ployment of services including authentication systems, encryption and firewalls as partof the mechanisms used to enforce these policies. Samarati and de Vimercati [13] alsoshow that, typically, the authorisation aspect of policy definition is usually of primaryimportance as it specifies who has access to what resource. Once this has been speci-fied, the authentication policy is then used to reinforce this by defining what criteria auser needs to satisfy to ensure that they are who they claim to be. Finally, the auditingpolicy allows logs to be kept of any relevant action carried out by users on objects.This paper focuses on the authorisation aspect of policy definition as it forms the coreof higher-level policy, and because both the authentication and auditing aspects of pol-icy definition are inherently dependent on the authorisation conditions. Sandhu andSamarati refer to authorisation in [14] as the specification of what one party allows an-other to do with respect to the resources and objects mediated by the former. In termsof information sharing, this relates to ensuring that authorised individuals can accessresources and that others cannot. It also means ensuring that requests to access a spe-cific resource are only granted if the request is permitted in the policy definition. Interms of networks, the most commonly used access control mechanisms are firewallsand filtering routers which control access to resources by filtering network traffic, onlyallowing access that is specified by the security policy [15]. It is, however, difficult toensure that lower-level implementation policies are always compliant with their higher-level security goals. This issue is frequently aggravated in multi-domain environmentswhere policies need to be translated, interpreted and applied between the different do-mains involved, such as those of the police and various community partners. A possiblesolution to this, as described by Susan Hinrichs in [16], is to define the goals of a policyat a high-level and decouple these from the specifics of its implementation, which aredefined at a lower-level. For example, Hinrichs states that a high-level policy statementmay be in the form shown in Listing 1. Such a statement does not identify implemen-tation details, such as which machines are part of the Engineering Department or onwhat port the server is listening. High-level policies, therefore, need to be translatedinto a format which is understandable by policy enforcement devices, such as routersor firewalls. Listing 2, for example, shows a firewall rule derived from the higher-level
5

policy shown in Listing 1.
Listing 1: Example of a high-level policy.Engineering Department should have access to the
web server
Listing 2: Example of a firewall rule derived from Listing 1.permit TCP traffic on port 80 from 192.168.56.0/24
to 128.45.67.34/32
Abrams and Bailey also propose an approach in [17] which is similar to Hinrichs’top-down approach. They suggest the use of a layered concept, where a policy is firstdefined at a high-level and then abstracted at a number of lower-levels according tolayers. Further, they suggest that users are grouped at different layers based on howthe policy affects them. The higher-level policy can then be abstracted according tothe layer at which the user resides. This approach allows the policy to be framed in acontext that is relevant to the user and in terms with which the user is familiar. Abramsand Bailey suggest the following three-layered approach:
1. Top-level management.
2. Computer users.
3. Process level.
The management level is the highest level where the policy is defined in terms of itsgoals. In an enterprise, the management will, typically, view the policy as it affects theentire enterprise and define it in broad and general terms. At the computer user level,Abrams and Bailey suggest that the policy be abstracted based on the job functions per-formed by individual users. For example, certain users may require access to a systemwhich allows them to update customer details, while other users may require accessto payroll systems. Hence, the policy at this layer is abstracted so that it is defined interms that are relevant to the specific user and the function they perform. The processlayer forms the lowest level of this hierarchy, where the policy is abstracted in terms ofhow data is handled by individual systems, such as a customer management or payrollprocessing system. This would typically also include firewall and routing specifica-tions detailing how data is filtered, routed and handled by the systems involved. Thetop-down approach suggested by Abrams and Bailey in [17] and Hinrichs in [16] hasthe advantage that policies are represented at a high-level using syntax and expressionswhich are close to natural language, such as written English. The motivation for thisis to make the initial, high-level policy statements as clear and accessible to a humanreader as possible. Such high-level abstractions also allow policy statements to be ableto capture specific nuances, or intents of the administrator. A policy statement at ahigh-level, therefore, defines the policy in terms of its goal without being biased toits method of enforcement. This statement can then be interpreted by different appli-cations and devices based on their own specific enforcement mechanisms. High-levelpolicies, therefore, should only need to be defined once and can subsequently be trans-lated to their specific enforcement points. Hence, a range of diverse policy enforcementmechanisms, including vendor-specific devices which use different syntaxes, may beused within a single domain as each device would derive its own rules from the samehigh-level policy. This mechanism ensures that although various policy enforcement
6

mechanisms may express a specific policy differently, based on their own lower-levellanguages, they should be uniform in their policy interpretation and enforcement. Afurther benefit resulting from decoupling the mechanism for policy definition from themethod for policy enforcement is that business rules, which change frequently and re-quire continuous management, can be administered more efficiently. This is difficultto monitor in an environment where policy definition and policy enforcement are notdecoupled. Fraser et al. outline a five-step iterative process in their Site Security Hand-book [7] for policy creation and maintenance. One central component of their work isthe definition of a security policy as a continuously evolving process. This implies thatpolicies are audited and reviewed regularly to ensure that mechanisms for providingfeedback and improvements are in place. The authors, therefore, see policy formali-sation as an intrinsic aspect of the design of a system, an observation echoed by otherresearchers including security expert Bruce Schneier [8]. They also echo the observa-tions of Cheswick et al. [9] that policy formalisation is an evolving process, requiringregular review, of which the actual implementation of security products is simply theconsequence.
2.4 High-Level Policy Approaches
The development of effective methods for defining formal policies has been an activeresearch area since the 1960s, which saw the development of strategies for securingmainframes and large-scale industrial computers. With increasing reliance on morecomplex systems, the area of policy-based management (PBM) [18] has seen signif-icant interest not only from its traditional computer-security discipline, but also fromthe more diverse systems management community [19]. Damianou et al. identify a keydriver for this in [20] as being the increased dependency of large-scale business pro-cesses on policy-based systems, where business goals, service-level agreements andtrust relationships within or between enterprises, all have an impact on defining poli-cies. However, as Susan Hinrichs identifies in [16], there is often a conceptual gapbetween high-level policy statements and their translation to respective lower-level en-forcement configurations.
2.4.1 Role-Based Policy Definition
One area of exploration in addressing the gap between high-level policy statements andlower-level enforcement configurations is the development of policy specification lan-guages based on formal logic. The attractiveness of logic-based languages is in theirunambiguous mathematical formalism. This makes these languages amenable to mod-elling and analysis. Chen and Sandhu [21] describe the need for Role-Based AccessControl (RBAC) constraints to be expressed in an unambiguous and precise mannerand use mathematical logic notation. They describe RBAC Subjects, Privileges, Rolesand Sessions in first order logic format. Hayton et al. [22] also use a logic-based lan-guage in the Role Definition Language (RDL). Their method uses roles as credentialsand is based on the definite clause property of Horn clauses. In [23] Joshua Guttmanproposes the Network Policy Tool (NPT). The NPT tool uses a high-level policy lan-guage, which is decoupled and independent of device configurations, to describe anenterprise’s packet routing policy and defines where in an organisation’s network spec-ified packets can be routed. The tool describes the relationship between entities, such
7

as network devices and users, using a description of the networks topology. These arespecified using a Lisp-like policy specification language and modelled using a bipartitegraph which represents network traffic routing devices, as well as the different areasof the network, using nodes. The undirected edges between the nodes represent theinterfaces of the devices connected to the different areas. Each interface can have anassociated filtering posture created, in both in-bound and out-bound directions. List 3shows an example of NPT code specifying a corporate network. These postures areabstract representation of the bi-directional packet filtering that is enforced by rout-ing and firewall devices. Although the NPT tool is useful as a reference mechanismfor administrators creating lower-level specifications, it does not generate the deviceconfigurations itself.
Listing 3: Example of NPT-generated code specifying a corporate network [23].(areas;; name distinguished hosts(external)(periphery proxy-host)(engineering eng-mail-server db-server)(financial financial-mail-server)(allied))(connectivity;; router name areas(per/ext-router periphery external)(per/eng/fin-router periphery engineeringfinancial)(eng/allied-router engineering allied)(allied/ext-router allied external))(services(telnet tcp 23)(ftp tcp 21)(ftp_data tcp 20) ...)
Guttman documents in later work [24] how aspects of the NPT tool can be improvedupon. Specifically, he mentions how administrators find it difficult to use the abstractpolicy representations generated by NPT to model an existing network policy. Heproposes the use of the Atomizer tool in [25] which allows administrators to generateNPT specifications directly from Cisco access control lists. One major advance ofthe Atomizer tool in achieving this is the use of Binary Decision Diagrams (BDD)[26]. Guttman uses BDDs to represent criteria which can then be used to classifynetwork packets and, hence, be used to describe existing configuration files. BDDs arediscussed in greater detail in Section 2.5.
2.4.2 Logic-Based Formal Policies
Another approach uses the Z-notation logic-based language which uses a combina-tion of formal logic and set theory. Boswell [27] uses Z-notation in producing logic-based Mandatory Access Control (MAC) and Discretionary Access Control (DAC) for-mal security policy model for the NATO Air Command and Control System (ACCS).Hoagland et al. [28] take a different approach with the introduction of the Language for
8

Security Constraints on Objects (LaSCO), a formal policy language that expresses con-straints based on graphs. The main advantage of this method is that it provides a visualrepresentation of policies, which the author claims is easier to understand than complexformal logic statements. However, this approach is limited in that it is unable to handleobligation policies and often requires additional information, usually expressed as textin conjunction with graphical representation. While the graphical-textual hybrid rep-resentation makes LaSCO more expressive than the purely graphical version, it addssignificant complexity. Listing 4 shows a sample of Boswell’s Z-notation code whichdefines the basic Bell-LaPadula [29] security concept of no read up. This concept stip-ulates that no user is allowed to read from an object with a classification higher thanthe user’s security clearance, which is a common requirement for classified informa-tion. Figure 2 illustrates a similar Bell-LaPadula concept in Hoagland et al.’s graphicalrepresentation.
Listing 4: Z-notation sample [27] defining Bell-LaPadula no read up concept.SystemElements∀ proc : ProcessId; obj : ObjectId; mode :
AccessMode‖(proc, obj, mode) ∈ cat ∧ mode ∈ ReadControlModes •(clearanceOf proc) dominates (secLevelOf obj) ∨(proc, obj, mode) ∈ activeTwoPersonRuleOps
type = “user” &&sec_level = $UL
type = “file” &&sec_level = $FL
method = “read”$UL = $FL
Figure 2: LaSCO policy graph [28] defining Bell-LaPadula no read up concept.
In [30], Bartal et al. propose another tool which takes a top-down approach calledFirmato, a firewall management toolkit. Firmato uses a high-level policy languageto create a vendor independent global policy, which can be compiled into individualvendor specific device configurations. The network topology is first defined in the high-level policy definition language, which is then translated into an entity-relationshipmodel using a role-based model of the access policy and the relationship to the networktopology. A core strength of the Firmato system, and an important improvement overGuttman’s work in [24], is that it allows high-level policies to be defined independentlyof a network’s topology. The advantage of this is that changes to the topology do notmean that the policy has to be reworked. Other motivations behind the system wereto abstract the policy away from low-level languages, enabling vendor-independentmanagement of firewall configurations, and to automatically generate configurationsacross multiple filtering devices from the high-level global policy. Firmato uses theModel Definition Language (MDL) as its high-level language. A sample of MDL,shown in Listing 5, defines network services and hosts.
Listing 5: A sample of Firmato Model Definition Language (MDL) [30].<service-name> ‘=’<protocol-base>
9
‘[’<Dest-Port-No-Range> ‘,’<Src-Port-No-Range>‘]’<host-name> ‘=’ ‘[’ <IP-Addr>‘]’ ‘:’ <role-grp-name><host-grp-name> ‘=’ ‘[’<IP-Range> ‘]’ ‘:’<role-grp-name>
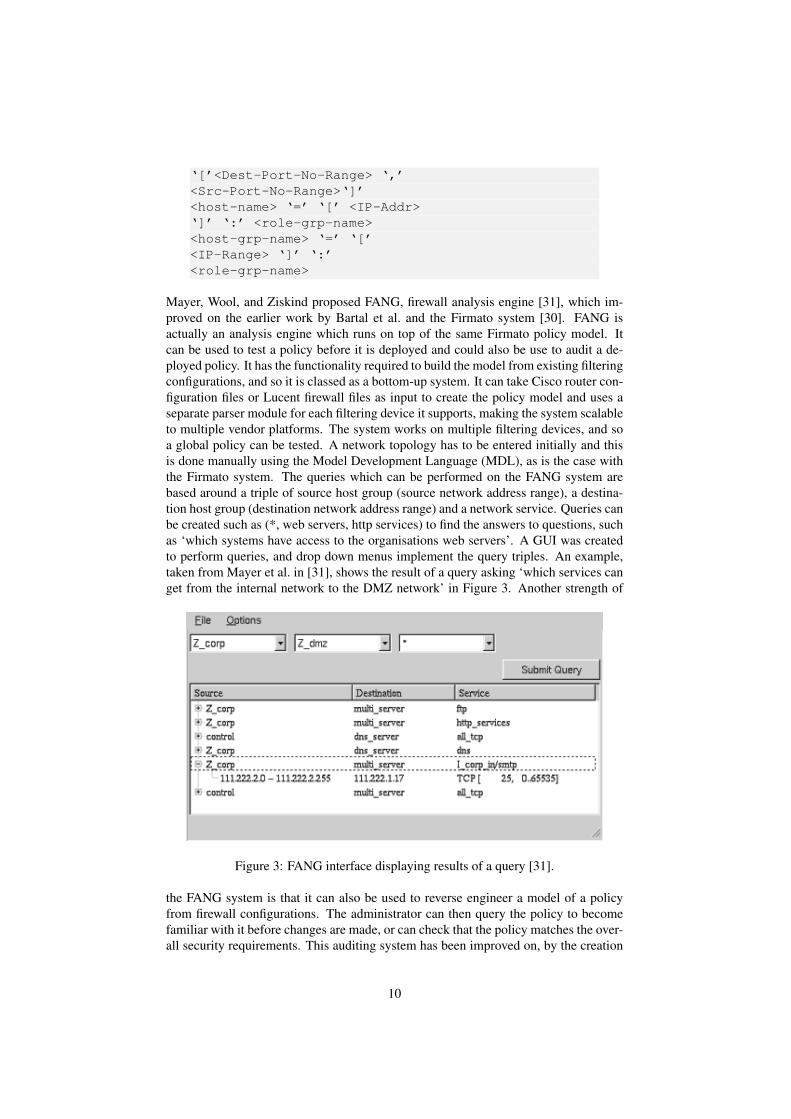
Mayer, Wool, and Ziskind proposed FANG, firewall analysis engine [31], which im-proved on the earlier work by Bartal et al. and the Firmato system [30]. FANG isactually an analysis engine which runs on top of the same Firmato policy model. Itcan be used to test a policy before it is deployed and could also be use to audit a de-ployed policy. It has the functionality required to build the model from existing filteringconfigurations, and so it is classed as a bottom-up system. It can take Cisco router con-figuration files or Lucent firewall files as input to create the policy model and uses aseparate parser module for each filtering device it supports, making the system scalableto multiple vendor platforms. The system works on multiple filtering devices, and soa global policy can be tested. A network topology has to be entered initially and thisis done manually using the Model Development Language (MDL), as is the case withthe Firmato system. The queries which can be performed on the FANG system arebased around a triple of source host group (source network address range), a destina-tion host group (destination network address range) and a network service. Queries canbe created such as (*, web servers, http services) to find the answers to questions, suchas ‘which systems have access to the organisations web servers’. A GUI was createdto perform queries, and drop down menus implement the query triples. An example,taken from Mayer et al. in [31], shows the result of a query asking ‘which services canget from the internal network to the DMZ network’ in Figure 3. Another strength of
Figure 3: FANG interface displaying results of a query [31].
the FANG system is that it can also be used to reverse engineer a model of a policyfrom firewall configurations. The administrator can then query the policy to becomefamiliar with it before changes are made, or can check that the policy matches the over-all security requirements. This auditing system has been improved on, by the creation
10

of the Lumeta Firewall Analyser [32, 33]. This improved on the FANG system by au-tomatically creating the queries needed to analyse the firewall policy model. Lumetagenerates what the authors describe as the most interesting queries, and then displaysthe results of these queries. This attempts to highlight possible risks in the firewallpolicy and limits the need for user input to the system. The authors recognised thefact that one of the problems with their earlier system was that the administrator hadto decide which queries to ask the system, and then create the queries manually. Thisis described as a significant usability issue with FANG. In the FANG system, the ad-ministrator has to enter the network topology description manually, using the FirmatoMDL language. The requirement to use MDL, however, was identified as a consider-able problem during beta testing and, in the new Lumeta system, the network topologycan be created automatically using the network routing table. The graphical interfaceto FANG, shown in Figure 3, was also replaced as it was deemed difficult to use bytesters. This has been replaced by a batch process which performs a comprehensivesimulation of traffic through the firewall policy and reports on this. This is interestingas the administrator users found the original Firmato CLI interface easy to use, and yetit was replaced with a GUI. This shows the design was perhaps not tailored to the typeof user correctly [34]. The output from the system is now a report in the form of webpages, with the ability to drill down into more detail if the user needs to. Using HTMLto provide this type of flexible reporting is described as an ideal mechanism for securityanalysis tools. However, one significant problem with the FANG system is that it canonly translate Lucent managed firewall, which does not have a large market share. TheLumeta system has added parser modules for CheckPoint firewall and Cisco accesscontrol list (ACL) configurations, so heterogeneous networks could be modelled, andtherefore the product would be useful to a wider audience. The low-level configura-tions are abstracted to the Lucent managed firewall-based language used by Firmatoand FANG, and the analysis query engine uses this as an input. The Lucent ManagedFirewall language was used as it is contains high-level constructs and is easy to parse.The Lumeta architecture [33] is shown in Figure 4. A query-based system, similar
Figure 4: Lumeta architecture [33] illustrating data flow through the firewall analyser.
to the FANG system [31], was developed by Marmorstein and Kearns in [35] for theLinux iptables firewall. The ITVal system uses multi-way decision diagrams (MDDs)rather than binary decision diagrams (BDDs), but operates in much the same way. Theauthors’ main motivation was to provide a simple query tool to aid in firewall configura-tion, so that an administrator could test a firewall configuration before it was deployed.The query language is designed to be simple and based on natural language. A singlerule set can be read-in by the tool and an MDD model built. The queries are created inan English-based query language and return a simple textual answer, in a similar way
11
as the FANG system does. However, a common problem with analysis systems usingqueries is that they have to be created by the administrator. The system administratorhas to learn another query language, as well as knowing which queries to perform.The onus is on the administrator to work out what needs to be queried and when thequery should be executed. Further, as a consequence of using MDDs, the number ofpossible decisions that can be made at any single node becomes variable. This is not asignificant issue for the ITVal system, as it is designed for use in network environmentswhere the rule syntax is strictly controlled and the number of bits required to representa field does not change. Within the context of this paper, however, where informationsharing policies can have multiple, user-defined fields which can, in turn, be of anylength, using MDDs becomes unfeasible.
2.4.3 Graphical Approaches to Policy Formalisation
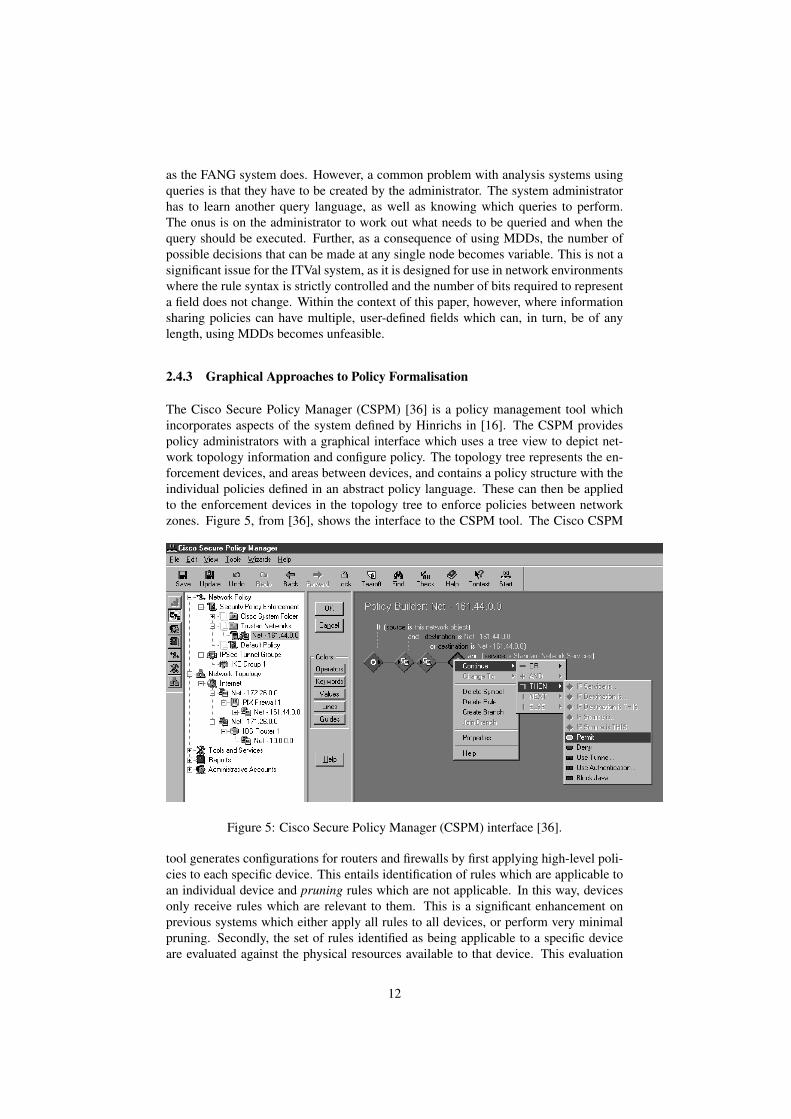
The Cisco Secure Policy Manager (CSPM) [36] is a policy management tool whichincorporates aspects of the system defined by Hinrichs in [16]. The CSPM providespolicy administrators with a graphical interface which uses a tree view to depict net-work topology information and configure policy. The topology tree represents the en-forcement devices, and areas between devices, and contains a policy structure with theindividual policies defined in an abstract policy language. These can then be appliedto the enforcement devices in the topology tree to enforce policies between networkzones. Figure 5, from [36], shows the interface to the CSPM tool. The Cisco CSPM
Figure 5: Cisco Secure Policy Manager (CSPM) interface [36].
tool generates configurations for routers and firewalls by first applying high-level poli-cies to each specific device. This entails identification of rules which are applicable toan individual device and pruning rules which are not applicable. In this way, devicesonly receive rules which are relevant to them. This is a significant enhancement onprevious systems which either apply all rules to all devices, or perform very minimalpruning. Secondly, the set of rules identified as being applicable to a specific deviceare evaluated against the physical resources available to that device. This evaluation
12

would take into account factors such as processing power and memory available tothe device, and whether these are adequate for the device to enforce the rules applied.Another factor which is part of this evaluation process is rule set anomaly analysis.This includes checking for conflicts and anomalies in the rule set. For example, iftwo rules specify the same source address, destination address and service, but dif-ferent actions, the CSPM too would generate a notification to the administrator. Theadministrator can then decide to take corrective action, such as removing one of thetwo conflicting rules from the rule set. Once the administrator has taken the correctiveaction needed, the CSPM tool creates an intermediate, abstract, rule set for each de-vice and stores it in a database. The database is used to store semantics of the deviceconfigurations to be created, but leaves the actual generation of specific configurationsto an agent which reads the generic filter rules, and creates low-level rules in the de-vice’s native configuration language. This process allows different devices to be usedwhile only requiring the final stage to be repeated to create configurations for the newdevices. Although this is a Cisco-specific closed system, it could, in theory, be used tocreate other low-level vendor device configurations. Uribe and Cheung [37, 38] pro-pose a similar mechanism to that proposed by Guttman [23], which generates low-levelconfigurations from high-level policies. Their approach extends Guttman’s approachof modelling and configuring firewalls to include intrusion detection systems as well.Enck et al. propose a configuration management system called PRESTO [39] whichmakes use of templates to create a hybrid scripting language, rather than introducingan entirely new language for high-level policy syntax definition. The templates arethen used to generate low-level device configurations at run-time. Damianou et al. pro-pose the multi-purpose policy specification language, Ponder [18]. Ponder is designedto meet multiple needs including providing a means of specifying security policiesthat map onto various access control implementation mechanisms, including firewalls,operating systems, databases and Java. Ponder has the capability to specify the entirehigh-level security policy, including access control policies, user authorisation policies,and traffic filtering policies. However, Ponder is more complex than other approachesmentioned and requires extensive training and familiarity to construct effective filteringpolicies. Another high-level policy modelling language, FLIP, is proposed by Zhanget al. in [40]. FLIP also allows high-level policies to be compiled into low-level de-vice configurations. The scope of the FLIP system is global and can manage firewallsacross an entire network. FLIP generates conflict free rules automatically, by perform-ing conflict analysis as it generates the low-level device configurations. This improveson most of the systems described, which would need to be analysed separately for ruleconflicts. Although this allows configurations to be generated more automatically, theintegration of multiple functionalities together, as is proposed in FLIP, implies a re-duction in its flexibility [34]. Listing 6 shows an example of a high-level policy whichallows the use of ‘Yahoo!’ instant messaging and Windows remote desktop service(tcp, port 3389) from the 140.192.* network, while blocking an on-line game on port3724 and web proxy cache squid, which can be exploited by Trojans, on port 3128. Inthe example shown, the administrator has chosen to block all traffic on ports between3100 and 3800.
Listing 6: An example of a high-level policy definition in FLIP [40].service yahoo_msg = tcp.[port=5050],torrent = tcp.[port >= 6881, port <= 6999];policy_group student_policy{
13

incoming:yahoo_msg { deny any }torrent { deny any }outgoing:http { allow any }}policy_group dom_std_policy extend student_policy{incoming:yahoo_msg { allow any }tcp.[port>=3100, port < 3800] { deny any }tcp.[port=3389] { allow 140.192.* }}
Pozo et al. propose another high-level policy language, AFPL in [41] and AFPL2 in[42], resulting from work at the University of Seville. This, again, intends to fill thegap between high-level network security policies and low-level firewall languages. Ithas been designed to be simpler than some of the preceding high-level languages whilestill retaining the functionality needed to describe filtering policies, and can also beautomatically compiled into leading vendor firewall filtering languages. A similar pro-posal by Hinrichs et al. in [43] is the Flow-based Management Language (FML). FMLis a formal, high-level network policy specification language designed to replace thelow-level policy rules by controlling the flows of data within the network, regardlessof the physical devices that they flow through. After specifying a policy, FML canbe translated to low-level network hardware configuration rule sets automatically, us-ing tools provided by the authors. This work contributes an extensible, adaptable andefficient mechanism for controlling network access. A number of policy verificationinitiatives are based on the Extensible Markup Language (XML). The Netconf protocolproposed by Bierman et al. in [44] arose out of recommendations made at a workshopof the Internet Engineering Task Force (IETF) in 2002. It was designed to be a simplemechanism through which device configurations could be managed using an XML-based system [45]. The entire, or partial, XML encoded configurations, of a Netconfenabled device can be retrieved, updated, and deployed back to the device by remotemanagement applications. The protocols control messages are encoded in XML, aswell as the data being sent. Major network device vendors, such as Cisco and JuniperNetworks, now have XML-based agents in their latest products and are participatingin Netconf standardisation [46]. Cisco Netconf configuration is detailed in [47] andJuniper in [48]. Although XML-based systems have many advantages over more tra-ditional low-level languages, as highlighted by Munz et al. in [49], complex policiesframed in XML are still not easily read and understood by non-expert human end users.From the perspective of information sharing between community partner organisations,this presents a significant hurdle to effective collaboration.
2.5 Policy Definition and Binary Decision Diagrams (BDDs)
A number of policy definition approaches are inspired by packet filtering techniques.Testing of packet filtering rule sets was explored by Hazelhurst et al. in the late 1990s[50]. The motivations for their work included the analysis of low-level rule sets to
14

identify and understand their dependencies on the high-level policies that they imple-ment. A further area of investigation, as explored by Chomsiri et al. in [51], centred onthe performance advantages of using Binary Decision Diagrams (BDDs) instead of thetraditional methods of processing rules sequentially. Their work developed a query-based system to analyse rule sets. BDDs were used to represent firewall and routeraccess policies. Each rule in the rule set can be converted into a Boolean expressionwhich is then combined in a BDD. Queries are used to pose questions about the rules,which can then be answered using the BDDs. An example of these ‘what if?’ queriesmight be ‘which destination addresses can packets reach from a source address and acertain port?’. The user can analyse, and so test, a policy by querying the rule set invarious ways. This can be used to validate and explore the policy before deployingthe rule set onto filtering devices. The language used to specify the queries is a func-tional language (FL), and the output is a textual representation of the query answer.The FL query language is low-level and, often, difficult to use for the system admin-istrator when creating queries. This was recognised, and the system was improved toinclude a graphical interface for easier querying of the policy in [52]. The authors alsorecognised that the best interface was one for visualising important information aboutthe rule set, and for basic querying, but a textual interface was better suited for anadvanced user to develop more powerful queries. The scope of the system describedby Hazelhurst et al. [50] only extends to a single rule set, but later research expandedquery-based systems to cover entire networks. The primary analysis mechanism is themanual query and answer system, but a basic rule set conflict analysis process was alsodeveloped. This automated the task of detecting redundant rules in the rules set prior todeployment and seems to be one of the first systems to perform conflict analysis withinrule sets and is often cited by other research in the area. A further key finding of thework carried out by Hazelhurst et al. [50] and a key motivation for this paper, centreson the performance advantages offered by the use of binary decision diagrams (BDDs)over that of sequential processing of access rules, as used by most firewall and routerpacket filtering devices. The following sections provide an overview of packet filter-ing, as utilised by most firewall and routing systems, and identify areas where BDDscan be used to improve packet filtering system performance. Packet filtering devices,including routers and firewalls, operate at Layer 3, the network layer, of the Open Sys-tems Interconnection (OSI) model, as illustrated in Figure 6. Devices operating at thislevel have no way of interpreting high-level security policies and usually only inspectthe IP header of a packet to make filtering decisions. Security policies designed to beenforced by devices operating at this layer, therefore, need to be expressed in terms ofthe packet’s protocol and source and destination IP addresses. Devices inspect packetspassing through them and will attempt to match the relevant fields in a packet’s headerto specified rules. If a rule match is found, the devices undertake the action, either per-mit or deny, specified by the rule. If no rule match is found, the device denies the packetfrom passing through. Packet filtering devices are relatively inexpensive to implement[53] and have found widespread use in firewall and routing implementations. Devicesusing packet filtering have also seen better performance results [54] than application-level [55] or transport-level firewalls. The security rules which govern the behaviourof packet filtering devices are typically structured in the form of an access-control list,and are usually evaluated sequentially in a top-down fashion. Thus, whether the packetis permitted to pass through or denied depends on the action specified by first rulewhich matches the packet’s relevant header fields. Although this structure allows forthe uncomplicated representation of rules, it relies heavily on their correct ordering.Further, administrators need to be aware of the potential interaction between rules in
15
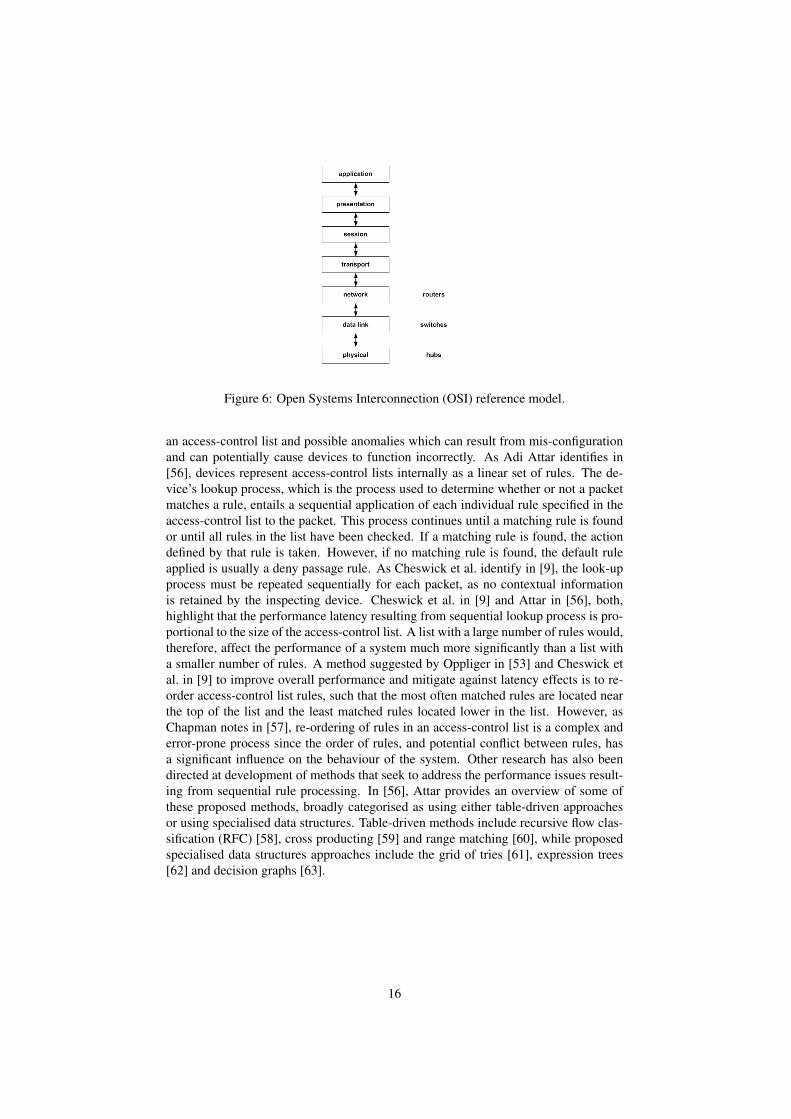
Figure 6: Open Systems Interconnection (OSI) reference model.
an access-control list and possible anomalies which can result from mis-configurationand can potentially cause devices to function incorrectly. As Adi Attar identifies in[56], devices represent access-control lists internally as a linear set of rules. The de-vice’s lookup process, which is the process used to determine whether or not a packetmatches a rule, entails a sequential application of each individual rule specified in theaccess-control list to the packet. This process continues until a matching rule is foundor until all rules in the list have been checked. If a matching rule is found, the actiondefined by that rule is taken. However, if no matching rule is found, the default ruleapplied is usually a deny passage rule. As Cheswick et al. identify in [9], the look-upprocess must be repeated sequentially for each packet, as no contextual informationis retained by the inspecting device. Cheswick et al. in [9] and Attar in [56], both,highlight that the performance latency resulting from sequential lookup process is pro-portional to the size of the access-control list. A list with a large number of rules would,therefore, affect the performance of a system much more significantly than a list witha smaller number of rules. A method suggested by Oppliger in [53] and Cheswick etal. in [9] to improve overall performance and mitigate against latency effects is to re-order access-control list rules, such that the most often matched rules are located nearthe top of the list and the least matched rules located lower in the list. However, asChapman notes in [57], re-ordering of rules in an access-control list is a complex anderror-prone process since the order of rules, and potential conflict between rules, hasa significant influence on the behaviour of the system. Other research has also beendirected at development of methods that seek to address the performance issues result-ing from sequential rule processing. In [56], Attar provides an overview of some ofthese proposed methods, broadly categorised as using either table-driven approachesor using specialised data structures. Table-driven methods include recursive flow clas-sification (RFC) [58], cross producting [59] and range matching [60], while proposedspecialised data structures approaches include the grid of tries [61], expression trees[62] and decision graphs [63].
16

2.5.1 Table-Driven Packet Filtering Approaches
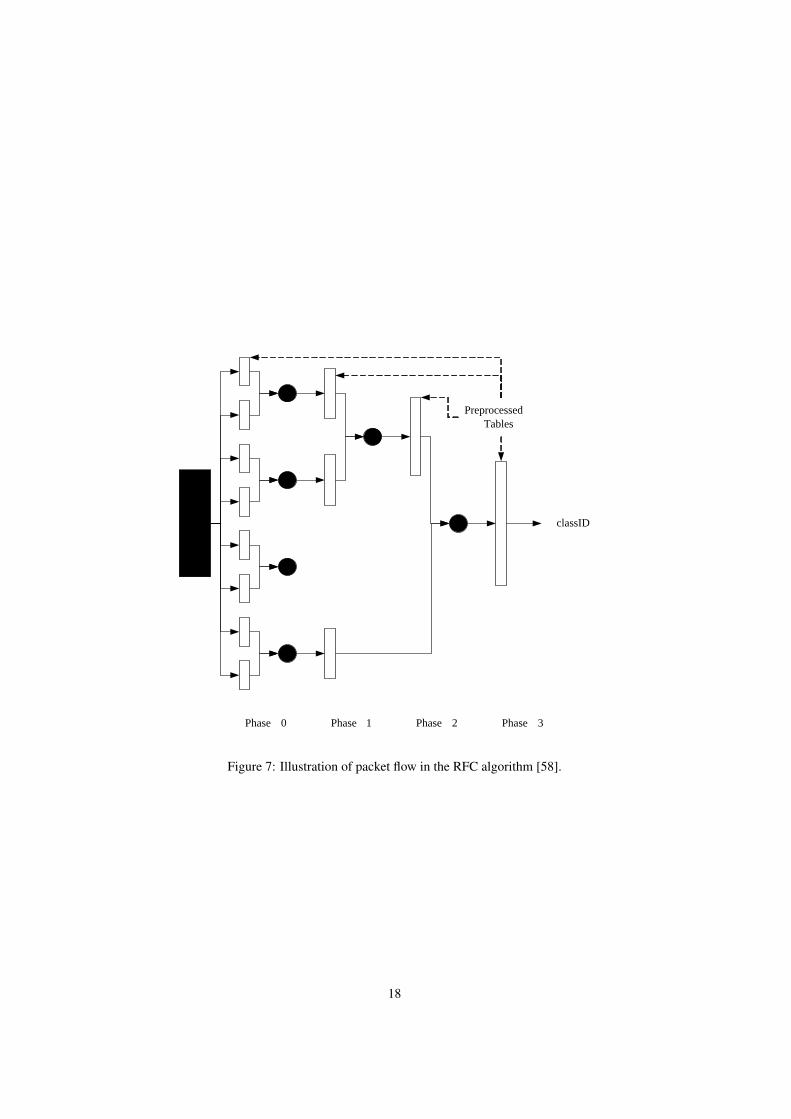
Table-driven approaches to improve packet filtering classification mainly use algorith-mic techniques which can represent access-control lists in tabular form. To achieve this,the algorithms rely on identification of specific patterns in the access list rules. For thisreason, table-driven approaches tend to yield better performance results when appliedto access-control lists which mainly contain similar rules but not to lists in which rulesare dissimilar. Gupta and McKeown describe a table-driven approach called recursiveflow classification (RFC) in [58]. The RFC approach essentially uses a multi-stageclassification of rules that is able to filter one million packets per second in softwareand up to 30 million packets per second, in optimised hardware. Their proposed al-gorithm involves classification of rules which contain similar fields into classes andassociating each class of rules with an identifier, classID. The algorithm then maps S-bits of the packet header to T-bits of the classID, where T = logN , T << S and N isthe number of rules. The authors suggest that a quick way of achieving this mappingwould be to pre-emptively compute the value of classID for each of the 2S differentpacket headers. Although this would achieve a mapping in one single memory ac-cess step, it would require very large amounts of memory. Hence, the authors suggestrecursively performing the same mapping over several stages where each successivestage reduces the target rule set size to achieve a match. Due to the classification algo-rithm, as illustrated in Figure 7, relying on identifying similarities between fields, RFCtends to yield better performance results on access-control lists with a large numberof similar rules which can be grouped into classes. However, where the target accesslists contains dissimilar rules, an increase in the number of rules in the access list re-sults in an exponential increase in the memory required to process it which, in turn,causes significant deterioration in performance. Srinivasan et al. also propose a sim-ilar approach in [59] where the rule’s syntactical structure is used to mitigate againstexponential memory requirements. Their method, similar to that proposed by Guptaand McKeown in [58], utilises a pre-emptive conversion of rules in an access-controllist to generate cross-product table. Their method is based on a decomposition-basedalgorithm which utilises successive prefix matching of rules over a number of steps.This method relies on at least two steps where, initially, the longest prefix in the packetheader field is matched and, secondly, using the cross-product of the results of the pre-fix match to determine the target rule. However, due to the multiplicative nature of thecross-product calculations, the table resulting from the algorithm is often extremelylarge and requires, either, very large memory space or long lookup times. In [60], Lak-shman and Stiliadis attempt to address performance issues resulting from the sequentialprocessing of rules by using bit-parallelism. Their algorithm defines a set of rules ofsize N in K-dimensional filter space. This process relies on a two-stage process where,initially, bit vectors of all rules for each field are calculated and, secondly, the rulesmost likely to complete the header are identified. The second stage is completed bycalculating the bit vectors corresponding to each header field and then computing theircommon intersection. The first set bit in the resulting bit vector is used to locate theposition of the applicable rule. Although use of the bit-parallelism technique yields bet-ter performance over sequential rule processing, it generally produces most significantimprovements when used in conjunction with specialised parallel-processing hardwareimplementations. However, as with all approaches which make use of pre-processing,using bit-parallelism still suffers from poor update times.
17
classID
Phase 0 Phase 1 Phase 2 Phase 3
Preprocessed Tables
Figure 7: Illustration of packet flow in the RFC algorithm [58].
18

2.5.2 Packet Filtering Approaches Using Specialised Data Structures
Packet filtering approaches which seek to address sequential rule processing perfor-mance issues tend to use graph-based techniques to represent access-control lists. Hence,they are less sensitive than table-driven methods to a device’s internal representation ofthe access list. In [61], for example, Cheung and McCanne, propose the Grid of Triessolution. The define a trie as a tree-based data structure, based on Edward Fredkin’swork in [64]. Each node in a trie has one or more children and edges to each onecorrespond to different bit sequences. Tracing a path from the root of the trie to anyspecific node would, therefore, yield a distinctive sequence of bits for that node. In theirimplementation, Cheung and McCanne extend the trie structure to two fields with pos-itive results. However, their solution does is not easily extensible to multi-dimensionalfilters with greater number of fields. The work of Mogul et al. in [62] forms semi-nal contribution to packet filtering using the technique of representing access-controllist rules as expression trees. The authors describe the technique as kernel resident,protocol-independent packet demultiplexing which functions as a programmable ab-straction of a Boolean predicate function. This process can then be applied to a packetstream in order to filter a defined subset of the stream. Their original packet filter wasknown as known as the CMU/Stanford packet filter or CSPF and was based on a stack-oriented virtual machine, where selected packet contents could be pushed on a stackand Boolean and arithmetic operations could be performed over these stack operands.A drawback of this method is that repeated computations may be needed to computethe Boolean expression used to represent the packet header. This expression must thenbe matched to the expression tree representing the list of rules in order to locate the de-sired target rule, if one exists. However, this process causes a linear growth in lookuptimes as the number of rules in the access-control list grows. In [63], Decasper etal. seek to improve rule lookup performance times through the use of directed acyclicgraphs (DAGs). Their approach uses tables of filters, where each filter represents afield in the packet header. A key advantage of this approach is that the size of the filtertable is equivalent to the number of fields being checked. Hence, lookup times shouldbe dependent on the syntax of rules but, theoretically, independent of the number ofrules in an access-control list. Although the authors list fast packet classification timesachieved through that this approach, they do not mention the memory required for thisprocess. Due to the lack of comparative testing and the scarcity of analytical resultsof approaches to improving on the performance issues inherent in sequential rule pro-cessing, it is difficult to make definitive comparisons. However, performance resultsindicate that those approaches that make use of specialised data structures tend to yieldbetter performance results than those approaches that are table-driven. For this reason,this research uses binary decision diagrams (BDDs) which is also a specialised datastructure approach and is closely related to the Grid of Tries method proposed in [61].However, as noted by Attar in [56], the BDD approach has the advantage that it pro-vides more control over the order in which bits in the packet are inspected which couldbe defined with a specific field order in mind and, hence, provide faster lookup timeswhile avoiding redundant checks. The BDD approach also has the advantage over theGrid of Tries method in that it is not restricted in the number of fields that it can filter.
19

2.6 Firewall Rule Set Management Tools
The work by Ehab Al-Shaer and Hazem Hamed at DePaul University in Chicago hascontributed greatly to research in the areas of policy modelling and analysis. Al-Shaerand Hamed have been the main contributors with over a dozen publications betweenthem. Their first research into policy analysis focused on auditing legacy firewallpolicies to automatically discover conflicts and anomalies in firewall policies. Thisanomaly checking can also assist administrators when editing the deployed policies[65, 66]. The rule set conflict detection aims to highlight possible problems in a ruleset, based on the order of the rules and the dependencies between rules resulting fromrule ordering. For example, a more general rule before a more specific rule in a rule setwould mean the more specific rule would never be reached. The more specific rule isclassified as shadowed by the first rule if the filtering actions taken are different (passand drop), or redundant if the actions are the same (for example, both rules pass thepacket). These are classed, by the authors, as rule set anomalies [66]. The firewall pol-icy advisor (FPA) tool was created based around a formal model of the firewall rulesand the relationships between them. Modelling of the filtering policies is done usingbinary decision diagrams (BDDs) and algorithms have been created to detect anoma-lies in the rule set model. To prove the concept, the authors demonstrate a five tuplefiltering syntax, using protocol type, source IP address, source port, destination IP ad-dress and destination port, to describe the filtering rules used as input to the system.These five tuples, along with the additional rule order and action fields, map directlyto current low-level filtering languages such as Cisco access control lists (ACLs). Theformat of the five tuple filtering rule is shown in Listing 7. The literature only showsexamples of these commonly used filtering fields, but the authors state this could easilybe extended to include any other filtering fields from low-level languages [65]. Thiscould be extended to include the filtering options available in modern low-level filter-ing languages, such as Cisco ACLs or Linux IP Tables. Note that the filters used in theexamples only use classful ranges of IP addresses, and classless ranges would need amore sophisticated wildcard specification. Al-Shaer and Hamed define all the possiblerelationships between rules, which are then proved mathematically to be the union ofall possible relations. Details of how anomalies within rule sets are defined are coveredin Section 2.6.1.
Listing 7: Example of a high-level policy.<order> <protocol> <src_ip> <src_port> <dst_ip> <
dst_port><action>
In [1] Al-Shaer and Hamed describe an example policy rule set, as shown in Figure 8.This rule set and the relations within it are then modelled as a BDD. This is then repre-sented as a policy tree, with nodes on the tree representing filtering fields, and branchesbeing the values. Each path through the tree represents a rule in the input rule set. Thismodel was chosen, as the rule set and the anomalies can be visualised by the users. Anexample of this type of tree, taken from [1], is shown in Figure 9, which illustrates thefour anomaly types of redundancy, shadowing, generalisation and correlation. Section2.6.1 offers a further detailed discussion on these anomaly types. Algorithms used todetect any anomalies within the rule set are then run, and can be displayed to the userin the FPA tool interface. The system provides a graphical interface which can showthe policy tree and any rule set anomalies. The interface is shown in Figure 10, which
20

Figure 8: Example of policy rule set [1].
is taken from [65]. The policy tree is shown in the left hand pane, and the discoveredanomalies in the right hand pane. The rule set is shown in the bottom pane with theconflicts highlighted. The FPA tool also allows the user to maintain the rule set, byinserting, modifying and deleting rules. As the user edits the rules, the tool providesfeedback on any conflicts that may be introduced by these actions. Although Al-Shaerand Hamed describe the Firewall Policy Advisor system in [66] as able to analyselegacy firewall policies, no automatic importing of these policies is described. The sys-tem seems to need an administrator to manually translate the low-level rule set into thefive tuple syntax. This would classify the systems top-down, however, the translationof deployed policies is not difficult as it is a direct mapping from most firewall configu-ration languages. Fixed format configurations from devices can be easily parsed usinga scripting language, such as Perl, as used by Avishai Wool in [32]. The FPA sys-tem does, however, provide advancement over the query-based analysis systems suchas FANG [31] and Lumeta [32], in that it does not require as much effort to redefinedeployed rules sets into the high-level policy specification languages used by these sys-tems, as the FPA system can analyse the rule sets directly. Although the initial scopeof the FPA system was as a single device and rule set, this was extended to anomalydetection across multiple firewalls in further work by Al-Shaer and Hamed in [67] and[2]. Application of the FPA to include other policy enforcement devices by Al-Shaer etal. in [68], such as intrusion-detection systems (IDS) and gateways, extended the sys-tem even further and allowed inter-device anomaly analysis across the global policy.The FIREMAN Firewall Analysis system, proposed by Yuan et al. in [69], can performanalysis of firewall filtering including detecting anomalies resulting from redundantand conflicting rules, which may cause errors in security configurations. Again, binarydecision diagrams (BDDs) are used to model one or more interconnected firewalls. Theanalysis can discover policy anomalies, similar to the anomalies defined in the FirewallPolicy Advisor system in [66], as well as detecting certain violations in the policy. Theauthors define policy violations as based on a blacklist or whitelist, which is definedby the administrator, as well as a general policy for all rule sets based on the twelvecommon firewall configuration errors identified by Avishai Wool in [70]. The model
21

rule
4ru
le 8
rule
12
actio
nac
tion
actio
nac
tion
actio
nac
tion
actio
nac
tion
actio
nac
tion
actio
n
deny
deny
deny
acce
ptac
cept
acce
ptac
cept
deny
acce
ptac
cept
deny
dst_
port
dst_
port
dst_
port
dst_
port
dst_
port
dst_
port
dst_
port
dst_
port
dst_
port
8021
8021
8021
80*
5353
*
dst_
ip161.1
20.33.4
0
*.*.*.
*
dst_
ip
161.120.33.40
dst_
ipds
t_ip
161.120.33.40
*.*.*.*
161.120.33.40
dst_
ipds
t_ip
*.*.*.*
*.*.*.*
src_
port
src_
port
src_
port
src_
port
*
src_
port
src_
port
**
**
*
src_
ip
140
.192
.37.
20
140.
192.
37.3
0
140.192.37.*
*.*.
*.*
src_
ip
140.192.37.*
*.*.*.*
prot
ocol
tcp
ud
p
Shad
owin
g
Red
unda
ncy
Cor
rela
tion
Gen
eral
isat
ion
rule
1
23
rule
5
67
rule
7
8
rule
2
48
rule
6
78
rule
3
48
rule
9
12
rule
10
912
*.*.*.*
Figure 9: Policy tree derived from policy rule set in Figure 8.
22
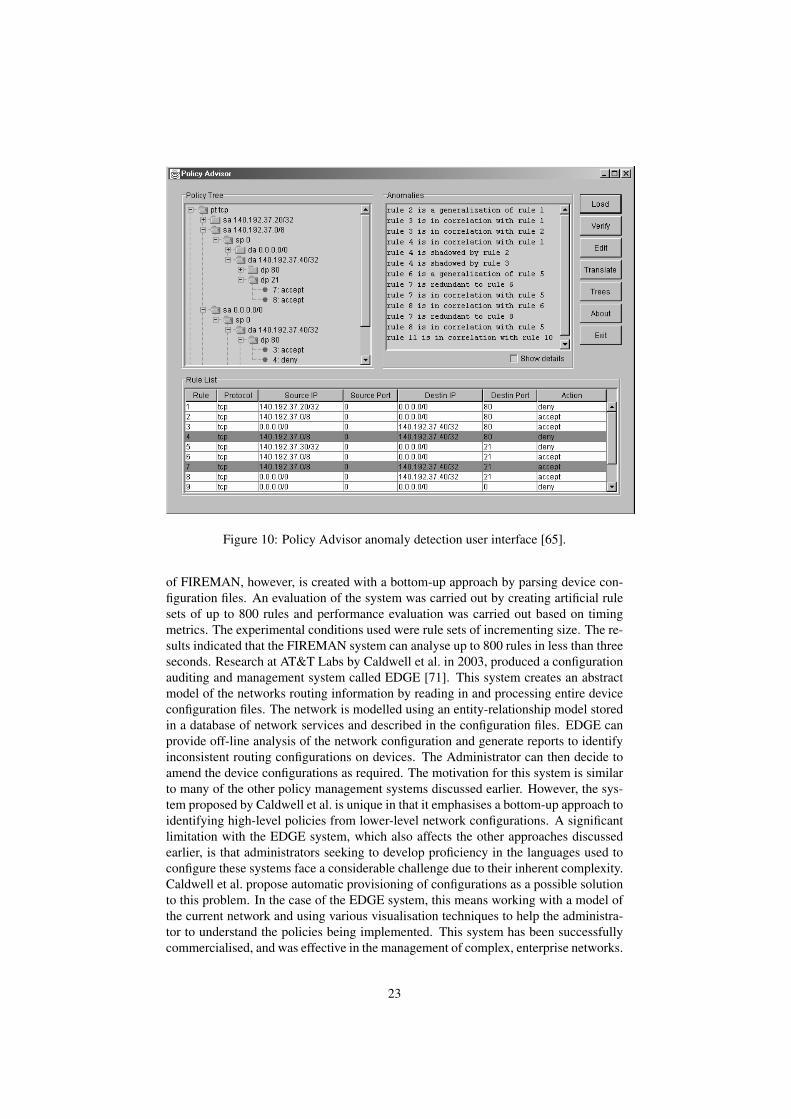
Figure 10: Policy Advisor anomaly detection user interface [65].
of FIREMAN, however, is created with a bottom-up approach by parsing device con-figuration files. An evaluation of the system was carried out by creating artificial rulesets of up to 800 rules and performance evaluation was carried out based on timingmetrics. The experimental conditions used were rule sets of incrementing size. The re-sults indicated that the FIREMAN system can analyse up to 800 rules in less than threeseconds. Research at AT&T Labs by Caldwell et al. in 2003, produced a configurationauditing and management system called EDGE [71]. This system creates an abstractmodel of the networks routing information by reading in and processing entire deviceconfiguration files. The network is modelled using an entity-relationship model storedin a database of network services and described in the configuration files. EDGE canprovide off-line analysis of the network configuration and generate reports to identifyinconsistent routing configurations on devices. The Administrator can then decide toamend the device configurations as required. The motivation for this system is similarto many of the other policy management systems discussed earlier. However, the sys-tem proposed by Caldwell et al. is unique in that it emphasises a bottom-up approach toidentifying high-level policies from lower-level network configurations. A significantlimitation with the EDGE system, which also affects the other approaches discussedearlier, is that administrators seeking to develop proficiency in the languages used toconfigure these systems face a considerable challenge due to their inherent complexity.Caldwell et al. propose automatic provisioning of configurations as a possible solutionto this problem. In the case of the EDGE system, this means working with a model ofthe current network and using various visualisation techniques to help the administra-tor to understand the policies being implemented. This system has been successfullycommercialised, and was effective in the management of complex, enterprise networks.
23

However, as identified by Zhang et al. [72], with increasing provisioning of enterprise-class cloud computing solutions, systems such as EDGE, which were not designedwith cloud services in mind, are finding this limitation progressively more restrictive.Another limitation with systems which convert to, and from, vendor-specific configu-rations is that the configuration languages tend to change rapidly. For example, Cisco’saccess control list (ACL) filtering language has had many additional features added toit since the first version in the mid 1990s. This means that the parser modules haveto be continually reviewed to keep them up-to-date with the latest syntax changes. Aspart of another configuration management system developed by Caldwell et al. in [73],some interesting research into Cisco router parsing and modelling was carried out atAT&T Labs. In [73], Caldwell et al. describe a learning system and adaptive parser.The overall system will be able to process and extract information from existing net-work configurations, much as described in their previous work with the EDGE systemin [71]. However, the advance on the EDGE system is that the parser can adapt tochanges in the configuration language being parsed. The parser is automatically gen-erated from valid configurations, which are fed into the learning system. Hence, thesystem would not need manual changes to be made whenever the configuration lan-guage version was modified. This would overcome one of the major problems withthe bottom-up approach to any type of policy modelling, especially when dealing withrapidly changing configuration languages such as Cisco device operating systems.
2.6.1 Anomalies in Firewall Rule Sets
In their cornerstone work of [1], Al-Shaer et al. define the fundamental principles ofconflict-detection within firewall rule sets. This work, which also extends to a dis-tributed scenario in [74] and led to formal anomaly definitions in [2], defines access-control list rules as having the structure as shown in Listing 8 and consisting of threecomponents: condition, permission and order.
• Condition: The condition component of a rule is made up of a number of sub-fields. Although, these may vary depending on the proprietary syntax used by thedevice manufacturer, they usually contain protocol, source and destination IP ad-dress and source and destination port numbers. The first rule in an access-controllist which matches the condition is applied to the packet.
• Permission: The permission component of a rule can either be permit or denyand defines whether a packet which matches the condition is permitted or deniedpassage through the device.
• Order: The order component of a rule identifies where, from top to bottom, therule occurs in the access-control list.
Listing 8: Structure of access-control list rules as defined in [74]Order ; Permission ; Condition
Al-Shaer et al. classify possible anomalies in access-control lists as redundancy, shad-owing, generalisation and correlation anomalies, as shown in Figure 11. Following is adetailed description of these anomaly types. The description is based on two examplerules, shown in Listing 9, which are derived from the structure shown in Listing 8.
24

Listing 9: Example of rules based on the rule structure shown in Listing 8Rule X (Rx) has the structureRx = Order (Ox) ; Permission (Px) ; Condition (Cx)Rule Y (Ry) has the structureRy = Order (Oy) ; Permission (Py) ; Condition (Cy)
Figure 11: Anomaly state diagram from [66] for rules Rx and Ry , where Rx precedesRy in the rules list.
Redundancy Anomaly A redundant rule has the same permission and the same con-ditions as another rule, such that if the redundant rule is removed, the behaviour of therules list will not be affected. Redundancy can be determined by the logical criteriashown in Listing 10.
Listing 10: Logical criteria for the redundancy anomaly typeif the permissions of Rx and Ry are the same,
(Px = Py),then Ry is redundant to Rx if every field of Ry is
a subset or equal to the corresponding field inRx, (∀i : Ry[i] ⊆ Rx[i])
or Rx is redundant to Ry if every field of Rx is asubset or equal to the corresponding field in Ry
,(∀i : Rx[i] ⊆ Ry[i]), where i ∈ {protocol, s_ip, s_port,
d_ip, d_port}
25

Shadowing Anomaly A rule is shadowed when a previous rule, higher up in the setof rules, matches all the conditions that match this rule, such that the shadowed rulewill never be activated. Listing 11 illustrates the case where Rule Y (Ry) is shadowedby Rule X (Rx).
Listing 11: Logical criteria for the shadowing anomaly typeRule Y (Ry) is shadowed by Rule X (Rx)if (Rx) precedes (Ry) in the rule set order, (Ox < Oy)
,and the permissions of Rx and Ry are different,
(Px 6= Py),and every field in the condition of Ry is a subset
or equal to the corresponding field in thecondition of Rx,
(∀i : Ry[i] ⊆ Rx[i]), where i ∈ {protocol, s_ip, s_port,d_ip, d_port}
Generalisation Anomaly A rule is generalisation of another preceding rule if itmatches all the packets of the preceding rule. Listing 12 illustrates the case whereRule Y (Ry) is a generalisation by Rule X (Rx).
Listing 12: Logical criteria for the generalisation anomaly typeRule Y (Ry) is a generalisation of Rule X (Rx)if (Rx) precedes (Ry) in the rule set order, (Ox < Oy)
,and the permissions of Rx and Ry are different,
(Px 6= Py),and every field in the condition of Rx is a subset
or equal to the corresponding field in thecondition of Ry,
(∀i : Rx[i] ⊆ Ry[i]), where i ∈ {protocol, s_ip, s_port,d_ip, d_port}
Correlation Anomaly Two rules are correlated if the first rule in order matches someof the fields of the condition of the second rule and the second rule matches some ofthe fields of the condition of the first rule. If some fields of the condition of RuleX (Rx) are subsets or equal to the corresponding fields of the condition of Rule Y(Ry), and the remaining fields of the condition of rule Rule X (Rx) are supersets tothe corresponding fields of the condition of Rule Y (Ry), and the permissions of thetwo rules are different, then Rx is in correlation with Ry . Listing 13 illustrates the casewhere Rule X (Rx) is in correlation with Rule Y (Ry).
Listing 13: Logical criteria for the correlation anomaly typeRule X (Rx) is in correlation with Rule Y (Ry)if the permissions of Rx and Ry are different,
(Px 6= Py),
26
and some fields in the condition of Rx are subsetsor equal to the corresponding fields in thecondition of Ry and the rest of the fields inthe condition of Rx are supersets of thecorresponding fields in the condition of Ry,
(∀i : Rx[i] . /Ry[i], ∃i, j such that Rx[i] ⊆ Ry[i] andRy[j] ⊂ Rx[j] and i 6= j), where i, j ∈ {protocol, s_ip,s_port, d_ip, d_port}
2.7 Reverse-Engineering Policies
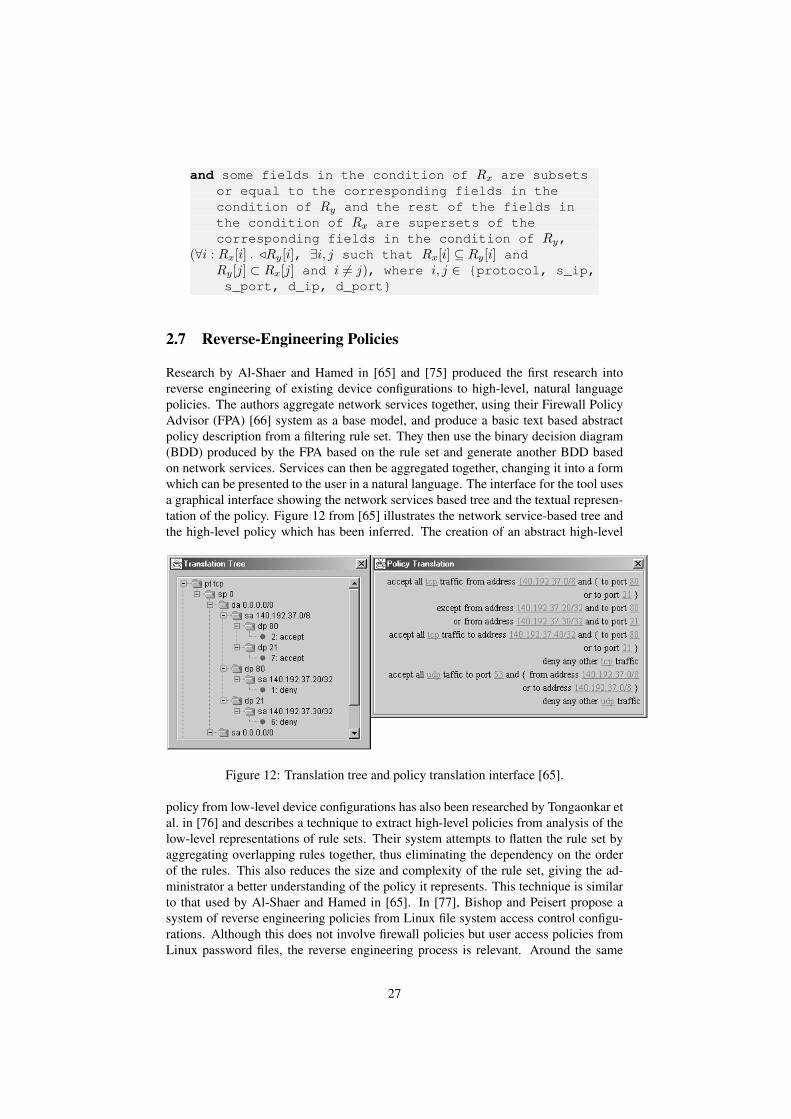
Research by Al-Shaer and Hamed in [65] and [75] produced the first research intoreverse engineering of existing device configurations to high-level, natural languagepolicies. The authors aggregate network services together, using their Firewall PolicyAdvisor (FPA) [66] system as a base model, and produce a basic text based abstractpolicy description from a filtering rule set. They then use the binary decision diagram(BDD) produced by the FPA based on the rule set and generate another BDD basedon network services. Services can then be aggregated together, changing it into a formwhich can be presented to the user in a natural language. The interface for the tool usesa graphical interface showing the network services based tree and the textual represen-tation of the policy. Figure 12 from [65] illustrates the network service-based tree andthe high-level policy which has been inferred. The creation of an abstract high-level
Figure 12: Translation tree and policy translation interface [65].
policy from low-level device configurations has also been researched by Tongaonkar etal. in [76] and describes a technique to extract high-level policies from analysis of thelow-level representations of rule sets. Their system attempts to flatten the rule set byaggregating overlapping rules together, thus eliminating the dependency on the orderof the rules. This also reduces the size and complexity of the rule set, giving the ad-ministrator a better understanding of the policy it represents. This technique is similarto that used by Al-Shaer and Hamed in [65]. In [77], Bishop and Peisert propose asystem of reverse engineering policies from Linux file system access control configu-rations. Although this does not involve firewall policies but user access policies fromLinux password files, the reverse engineering process is relevant. Around the same
27

time Golnabi et al. have also worked on the problem of inferring high-level policiesin [78], but their approach is based around an active system and data mining of de-vice logs, and not by static analysis of the device configurations. Similarly, Abedin etal. describe techniques in [79] which are used to mine firewall log files to regenerateeffective firewall rules. Their method uses algorithms to reduce the data set throughmining of firewall network traffic logs using packet frequencies. These are then usedto calculate the occurrence of each attribute of a log record in a firewall log file, thusgenerating primitive rules. Actual firewall rules are then regenerated from these prim-itive rules using aggregation and a set of heuristics. Anomalies in the original rule setand defects in the firewall implementation are then identified through a comparison ofthe regenerated rules with the original, manually-defined rules.
28

3 Framework Implementation
3.1 Introduction
This paper builds upon the information sharing policy verification framework. Specif-ically, it extends the work of Al-Shaer et al. in [1] and that of Hamed and Al-Shaerin [2]. In these, the authors concentrated on developing formal definitions of possibleanomalies between rules in a network firewall rule set.
3.2 Policy Verification Process
This section describes the mode of operation of the policy verification framework asillustrated in Figure 13. The process used to verify a proposed policy against possibleanomalies uses:
• Definition of policy syntax structure and declaration of policy field elements.
• Syntactic verification of the proposed policy.
• Ontological verification of the proposed policy.
• Functional verification of the proposed policy.
Definition
Start
Input new policy
New policy syntax verification
New policy ontology verification
New policy functional verification
End
Figure 13: Mode of operation of the policy verification framework.
29

3.2.1 Definition
The definition stage comprises a two-step process where the first step requires the defi-nition of the syntax to be used to describe information sharing policies, and the secondstep requires a declaration of all possible elements which can occur as part of the fieldsof a policy. Thus, the definition stage defines the universe of all possible policy fields,as well as the possible elements of each field, and forms the basis of any subsequentpolicy verification processes. The following example illustrates the definition process.
Policy Definition Example This example assumes the scenario that two organisa-tions, Police Force A and Child Protection Agency B, have initiated an informationsharing agreement, a policy from which is shown in Listing 14.
Listing 14: Example of a policy in an information sharing agreement.The Records Admin from the Records Unit of
Child Protection Agency B permits a Sergeantfrom the Domestic Violence Unit ofPolice Force A to read the Unique Identifier ofa Child, whilst complying with theHuman Rights Act, 1998, as long as it is for anabuse investigation and the Sergeant is theInvestigating Officer.
The first step of the definition stage requires the specification of the information sharingpolicy syntax. For the purposes of this example, information sharing policies are de-fined as having a nine-field syntax, where each field is enclosed within square brackets,‘[’ and ‘]’, as illustrated in Listing 15.
30

Listing 15: Nine-field syntax used to define information sharing policies.[permission] [requester] [relationship] [action] [
attribute] [object] [context] [owner] [compliance]
Once the information sharing policy syntax has been specified, it can be used to repre-sent polices from the information sharing agreement. For the purposes of this example,the requester and owner fields are defined as hierarchical, while the remainderof the fields are non-hierarchical. The requester and owner fields are, both, sub-divided into domain, organisation, unit and role, with a full stop (‘.’) usedto delineate between each field sub-division. Listing 16 shows the example informationsharing policy from Listing 14 using the syntax from Listing 15.
Listing 16: Information sharing policy from 14 espressed in syntax from 15.[Permit] [Police.Police_Force_A.
Domestic_Violence_Unit.Sergeant] with [Investigating_Officer] relationship [R] [Unique_Identifier] of [Child] with [Abuse_Investigation] context from [Social_Care.Child_Protection_Agency_B.Records_Unit.Records_Admin] with Compliance [Human_Rights_Act_1998]
The second step of the definition stage requires a declaration of all possible elementswhich can occur within the fields of a policy. Table 1 illustrates all possible elementsfrom an example information sharing agreement. In fact, elements used to define theexample policy shown in Listing 16 have all been selected from Table 1. It should benoted that a policy field can also be defined using the ‘*’ wildcard, which symbolisesthat an element has not been declared for a specific field in a policy. Further, as illus-trated in Table 1, the elements of the hierarchical requester and owner fields aredeclared with respect to their specific higher-level fields. This means that the elementsof the highest-level field, domain, would be declared by themselves. For example, inTable 1, the domains Police and Social_Care would be declared by themselves.The elements of the organisation field, however, are declared in relation to theirrespective domains. For example, the organisation Police_Force_A is declaredin relation to its specific domain, as Police.Police_Force_A. Similarly, the or-ganisation Child_Protection_Agency_B is declared in relation to its specificdomain, as Social_Care.Child_Protection_Agency_B. The same princi-ple applies to the subsequent lower-level fields of unit and role.
3.2.2 Syntax Verification
Syntax verification is the initial stage of the policy verification process. During thisstage, a proposed policy is checked to verify that it satisfies the defined syntax crite-ria for information sharing policies, as specified previously during the definition stage,illustrated in Listing 15. The following example illustrates the syntax verification pro-cess. If the proposed policy does not comply with this syntax structure, the testingprocess is terminated, as other tests only need to be carried out if a policy meets therequired syntax criteria.
31
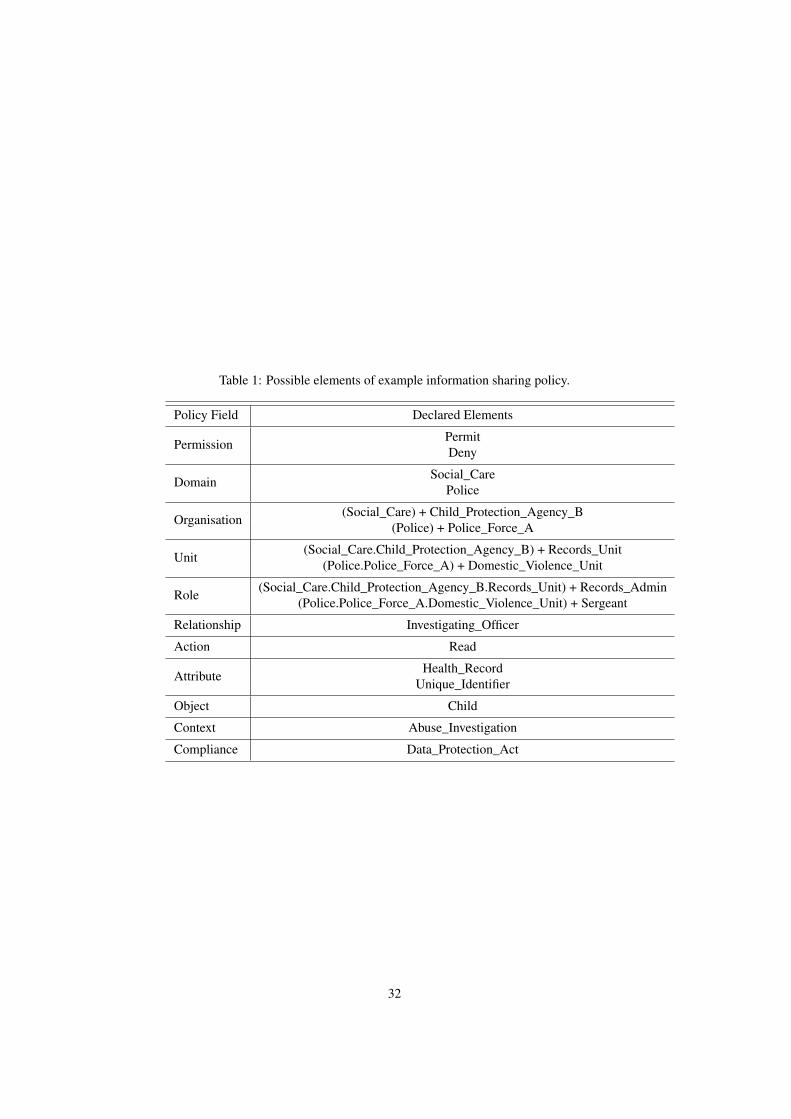
Table 1: Possible elements of example information sharing policy.
Policy Field Declared Elements
Permission PermitDeny
Domain Social_CarePolice
Organisation (Social_Care) + Child_Protection_Agency_B(Police) + Police_Force_A
Unit (Social_Care.Child_Protection_Agency_B) + Records_Unit(Police.Police_Force_A) + Domestic_Violence_Unit
Role (Social_Care.Child_Protection_Agency_B.Records_Unit) + Records_Admin(Police.Police_Force_A.Domestic_Violence_Unit) + Sergeant
Relationship Investigating_Officer
Action Read
Attribute Health_RecordUnique_Identifier
Object Child
Context Abuse_Investigation
Compliance Data_Protection_Act
32
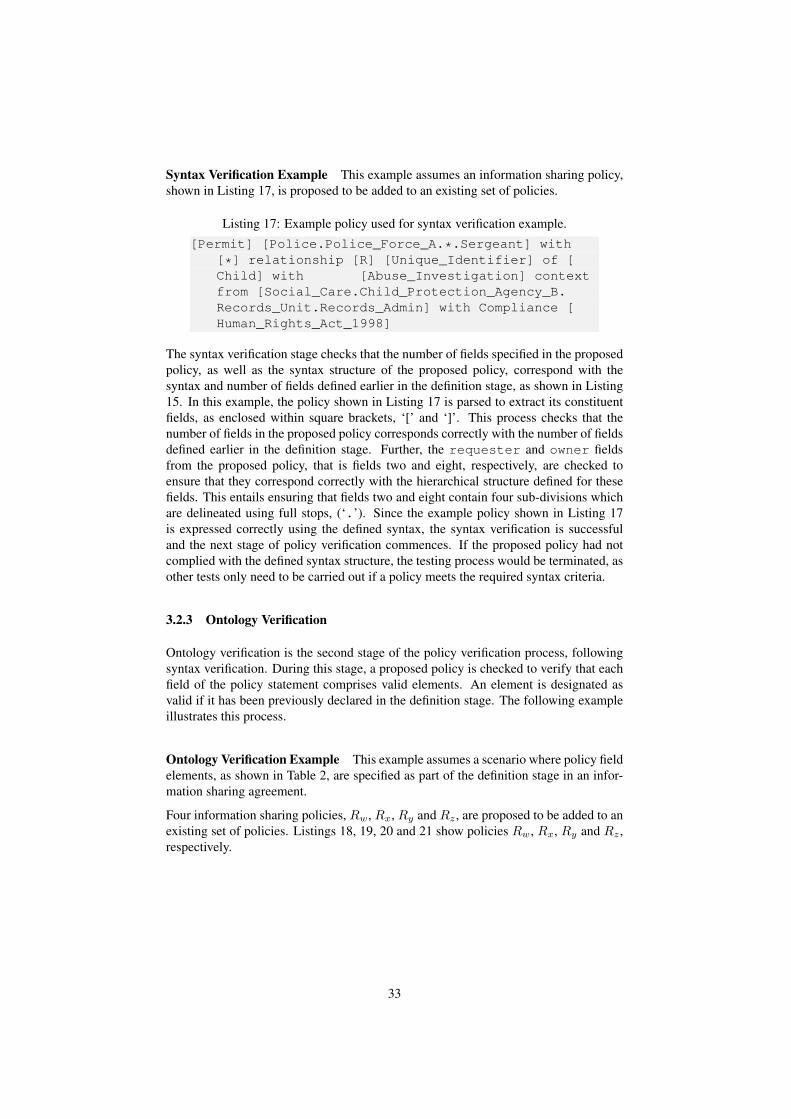
Syntax Verification Example This example assumes an information sharing policy,shown in Listing 17, is proposed to be added to an existing set of policies.
Listing 17: Example policy used for syntax verification example.[Permit] [Police.Police_Force_A.*.Sergeant] with
[*] relationship [R] [Unique_Identifier] of [Child] with [Abuse_Investigation] contextfrom [Social_Care.Child_Protection_Agency_B.Records_Unit.Records_Admin] with Compliance [Human_Rights_Act_1998]
The syntax verification stage checks that the number of fields specified in the proposedpolicy, as well as the syntax structure of the proposed policy, correspond with thesyntax and number of fields defined earlier in the definition stage, as shown in Listing15. In this example, the policy shown in Listing 17 is parsed to extract its constituentfields, as enclosed within square brackets, ‘[’ and ‘]’. This process checks that thenumber of fields in the proposed policy corresponds correctly with the number of fieldsdefined earlier in the definition stage. Further, the requester and owner fieldsfrom the proposed policy, that is fields two and eight, respectively, are checked toensure that they correspond correctly with the hierarchical structure defined for thesefields. This entails ensuring that fields two and eight contain four sub-divisions whichare delineated using full stops, (‘.’). Since the example policy shown in Listing 17is expressed correctly using the defined syntax, the syntax verification is successfuland the next stage of policy verification commences. If the proposed policy had notcomplied with the defined syntax structure, the testing process would be terminated, asother tests only need to be carried out if a policy meets the required syntax criteria.
3.2.3 Ontology Verification
Ontology verification is the second stage of the policy verification process, followingsyntax verification. During this stage, a proposed policy is checked to verify that eachfield of the policy statement comprises valid elements. An element is designated asvalid if it has been previously declared in the definition stage. The following exampleillustrates this process.
Ontology Verification Example This example assumes a scenario where policy fieldelements, as shown in Table 2, are specified as part of the definition stage in an infor-mation sharing agreement.
Four information sharing policies, Rw, Rx, Ry and Rz , are proposed to be added to anexisting set of policies. Listings 18, 19, 20 and 21 show policies Rw, Rx, Ry and Rz ,respectively.
33

Table 2: Defined policy field elements for Ontology Verification Example.
Policy Field Declared Elements
Permission PermitDeny
Domain Social_CarePolice
Organisation (Social_Care) + Child_Protection_Agency_B(Police) + Police_Force_A
Unit (Social_Care.Child_Protection_Agency_B) + Records_Unit(Police.Police_Force_A) + Domestic_Violence_Unit
Role (Social_Care.Child_Protection_Agency_B.Records_Unit) + Records_Admin(Police.Police_Force_A.Domestic_Violence_Unit) + Sergeant
Relationship Investigating_Officer
Action
Read (R)Create (C)Update (U)Delete (D)
Attribute Health_RecordUnique_Identifier
Object Child
Context Abuse_Investigation
Compliance Data_Protection_Act
34

Listing 18: Policy Rw used for ontology verification example.[Permit] [Police.Police_Force_A.
Domestic_violence_Unit.Sergeant] with [*]relationship [R] [Unique_Identifier] of [Child]with [Abuse_Investigation] context from
[Social_Care.Child_Protection_Agency_B.Records_Unit.Records_Admin] with Compliance [Human_Rights_Act_1998]
Listing 19: Policy Rx used for ontology verification example.[Permit] [Police.Police_Force_A.
Domestic_violence_Unit.*] with [*] relationship[R] [Unique_Identifier] of [Child] with [Abuse_Investigation] context from [Social_Care.Child_Protection_Agency_B.Records_Unit.Records_Admin] with Compliance [Human_Rights_Act_1998]
Listing 20: Policy Ry used for ontology verification example.[Permit] [Police.Police_Force_A.
Domestic_violence_Unit.Constable] with [*]relationship [R] [Unique_Identifier] of [Child]with [Abuse_Investigation] context from
[Social_Care.Child_Protection_Agency_B.Records_Unit.Records_Admin] with Compliance [Human_Rights_Act_1998]
Listing 21: Policy Rz used for ontology verification example.[Permit] [Police.Police_Force_A.
Domestic_violence_Unit.Records_Admin] with [*]relationship [R] [Unique_Identifier] of [Child] with [Abuse_Investigation] context from [Social_Care.Child_Protection_Agency_B.Records_Unit.Records_Admin] with Compliance [Human_Rights_Act_1998]
The initial step of the ontology verification stage comprises parsing of the proposedpolicies in order to extract their constituent field elements, as enclosed within squarebrackets, ‘[’ and ‘]’. Table 3 shows field elements extracted from the example proposedpolicies.
It must be noted here that where the ‘*’ wildcard is used instead of a field element,the corresponding field is not checked for against an entry in the definition. Compari-son between elements of the proposed policies, as shown in Table 3, and the declaredelements shown in Table 2, illustrates that each element in the proposed policy, Rw,exists as a valid declared element, in its respective declared field. Therefore, for policyRw, the ontology verification process is successful, and the next stage of verificationcan commence. Similar to policy Rw, each element in the proposed policy, Rx, also
35
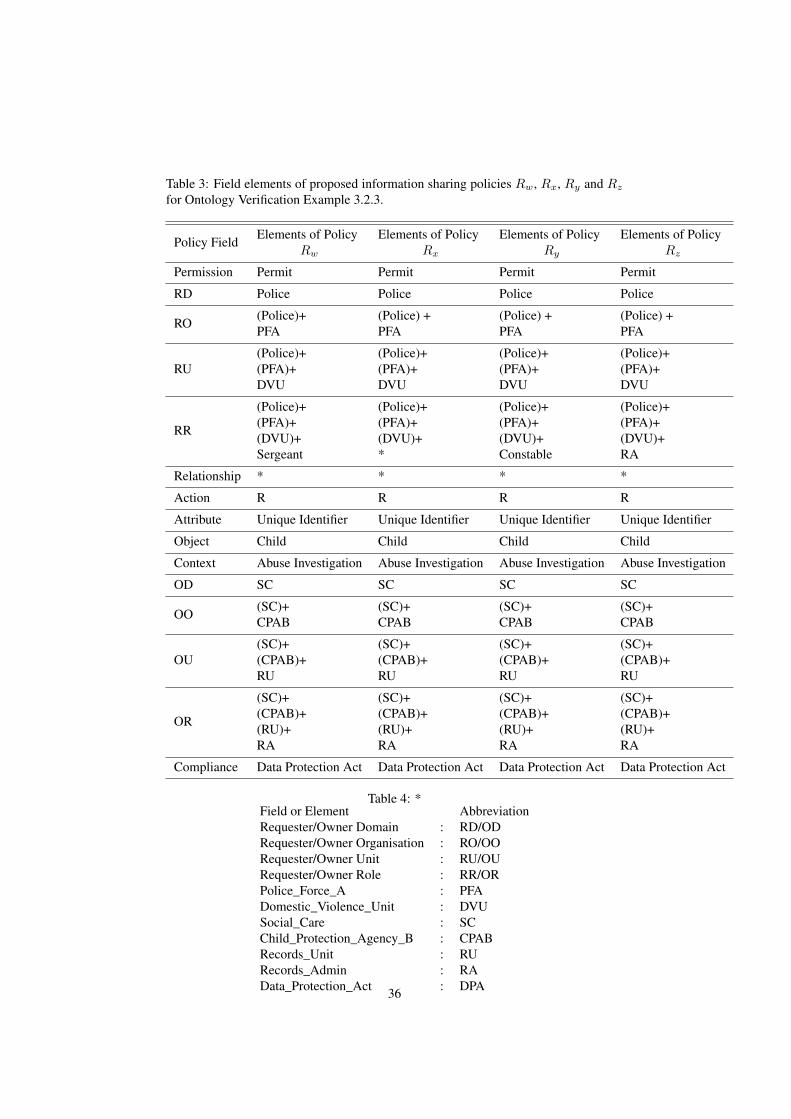
Table 3: Field elements of proposed information sharing policies Rw, Rx, Ry and Rz
for Ontology Verification Example 3.2.3.
Policy Field Elements of Policy Elements of Policy Elements of Policy Elements of PolicyRw Rx Ry Rz
Permission Permit Permit Permit Permit
RD Police Police Police Police
RO (Police)+ (Police) + (Police) + (Police) +PFA PFA PFA PFA
RU(Police)+ (Police)+ (Police)+ (Police)+(PFA)+ (PFA)+ (PFA)+ (PFA)+DVU DVU DVU DVU
RR
(Police)+ (Police)+ (Police)+ (Police)+(PFA)+ (PFA)+ (PFA)+ (PFA)+(DVU)+ (DVU)+ (DVU)+ (DVU)+Sergeant * Constable RA
Relationship * * * *
Action R R R R
Attribute Unique Identifier Unique Identifier Unique Identifier Unique Identifier
Object Child Child Child Child
Context Abuse Investigation Abuse Investigation Abuse Investigation Abuse Investigation
OD SC SC SC SC
OO (SC)+ (SC)+ (SC)+ (SC)+CPAB CPAB CPAB CPAB
OU(SC)+ (SC)+ (SC)+ (SC)+(CPAB)+ (CPAB)+ (CPAB)+ (CPAB)+RU RU RU RU
OR
(SC)+ (SC)+ (SC)+ (SC)+(CPAB)+ (CPAB)+ (CPAB)+ (CPAB)+(RU)+ (RU)+ (RU)+ (RU)+RA RA RA RA
Compliance Data Protection Act Data Protection Act Data Protection Act Data Protection Act
Table 4: *Field or Element AbbreviationRequester/Owner Domain : RD/ODRequester/Owner Organisation : RO/OORequester/Owner Unit : RU/OURequester/Owner Role : RR/ORPolice_Force_A : PFADomestic_Violence_Unit : DVUSocial_Care : SCChild_Protection_Agency_B : CPABRecords_Unit : RURecords_Admin : RAData_Protection_Act : DPA36

exists as a valid declared element, in its respective declared field. Since Rx showsthe Requester_Role element as the wildcard ‘*’, this field is not checked againstthe respective field in the definition, and, hence, the ontology verification process forpolicy Rx is also successful.
In the case of policy Ry , however, the element for the Requester_Role field isshown as Constable. Since Constable is not a defined element for the Requester_Rolefield, and, hence, does not appear as a defined element in the column in Table 2, pol-icy Ry will fail the ontology verification stage. In the case of policy Rz , although theRequester_Role field, shown as Records_Admin, exists as a declared elementin the definitions in Table 2, it does not belong to the Police.Police_Force_A.Domestic_violence_Unithierarchy. Therefore, policy Rz will also fail the ontology verification stage. In the casewhere a policy fails the ontology verification stage, the testing process would be termi-nated as other tests only need to be carried out if a policy meets the required ontologycriteria.
3.2.4 Functional Verification
The functional verification stage is the final stage of the policy verification processand identifies any potential anomalies which may exist between a proposed policy andthose present in an existing set of policies. This stage uses the anomaly definitionsof redundancy, shadowing, generalisation and correlation, as detailed in Section 2.6.1.Therefore, functional verification is split into four stages, each to check for a specificcategory of anomaly. The logical state diagram for anomaly classification is based onthe work of Al-Shaer and Hamed in [66], illustrated in Figure 14.
Figure 14: Anomaly state diagram from [66] for rules Rx and Ry , where Rx precedesRy in the rules list.
37

A simplified version of the anomaly classification method, derived from the work of Al-Shaer and Hamed in [66], is shown in Figure 15. As indicated, anomalies are detectedby logically comparing the permissions, Px and Py , and conditions, Cx and Cy , forany two policies, Rx and Ry .
Figure 15: Simplified anomaly classification method for functional verification.
The comparison process, with respect to anomaly detection, entails identification of asubset, superset or equivalence relation between respective fields of the policies, Rx
and Ry , which is achieved by carrying out bitwise logical operations between compar-ative fields. When operating on non-hierarchical fields, the operation simply involvesusing the entire field in the comparison. For hierarchical fields, however, this involvesthe definition of the fields as logical conjunctions (∧), of all of their sub-fields. Thelogical operation is then performed for the entire hierarchical field. For example, theRequester and Owner fields can both be defined as logical conjunctions of theirconstituent Domain, Organisation, Unit and Role sub-fields:
Requesterx, Ownerx : Domainx ∧Organisationx ∧ Unitx ∧RolexRequestery , Ownery : Domainy ∧Organisationy ∧ Unity ∧Roley
In practice, the logical comparisons are carried out using Binary Decision Diagrams(BDDs), as implemented for firewall rules by Hazelhurst et al. in [52] and access listmodelling by Hazelhurst in [80]. However, the logical ‘AND’ operation, or conjunction(∧), is used here to identify subset, superset or equivalence relations. This allows ageneric method of illustrating logical relationships, which is independent of the internalcomputations of any specific Binary Decision Diagram (BDD) software package.
Since BDDs perform bitwise logical operations, the permissions, Px and Py , and con-ditions, Cx and Cy , of policies Rx and Ry must first be represented in binary bits.However, unlike modelling firewall rules and access lists, information sharing policiescan have fields of varying lengths. This is due to the fact that there is no limit on thenumber of possible elements which may be declared as part of a field in an informationsharing agreement. Hence, since the number of possible elements in a field can vary,
38

where each field must be adjusted for the number of bits before any bitwise operationscan be performed on it. The adjustment process involves assigning an element identi-fier, Element ID, to each element in a field and then representing the element identifierin binary form. Hence, the total number of binary variables needed to represent a fieldelement is dependent on the total number of possible field elements declared duringthe definition stage. Table 5 illustrates the assignment of Element IDs to elements fromTable 2, from the Ontology Verification Example, and their binary representations.
Table 5: Assignment of Element IDs to elements from Table 2 and their binary repre-sentation.
Policy Field Elements from Definition Element ID Binary Representation
Permission Deny 0 0Permit 1 1
Domain Social Care 1 01Police 2 10
Organisation Child Protection Agency B 1 01Police Force A 2 10
Unit Records Unit 1 01Domestic Violence Unit 2 10
Role Records Admin 1 01Sergeant 2 10
Relationship Investigating Officer 1 1
Action
Read (R) 1 001Create (C) 2 010Update (U) 3 011Delete (D) 4 100
Attribute Health Record 1 01Unique Identifier 2 10
Object Child 1 1
Context Abuse Investigation 1 1
Compliance Data Protection Act 1 1
Listing 22 shows an example information sharing policy with field elements populatedfrom elements defined in Table 5. Listing 23 illustrates the example policy from Listing22 in its binary representation.
39
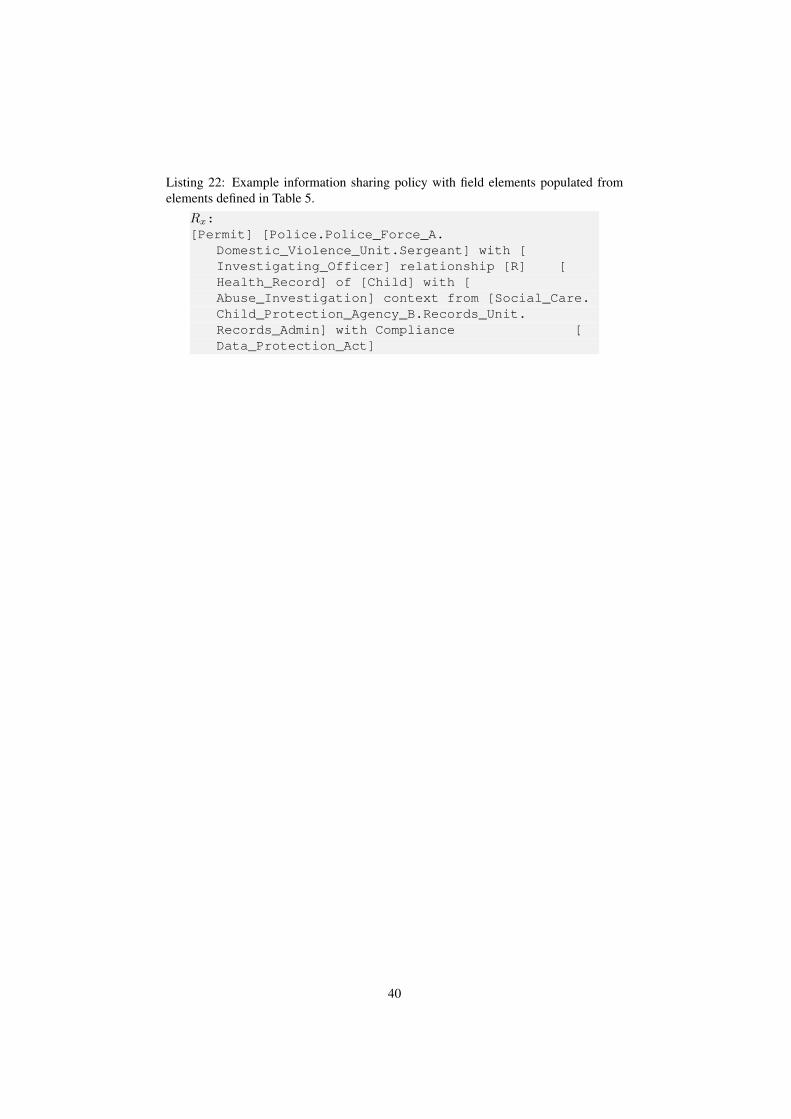
Listing 22: Example information sharing policy with field elements populated fromelements defined in Table 5.
Rx:[Permit] [Police.Police_Force_A.
Domestic_Violence_Unit.Sergeant] with [Investigating_Officer] relationship [R] [Health_Record] of [Child] with [Abuse_Investigation] context from [Social_Care.Child_Protection_Agency_B.Records_Unit.Records_Admin] with Compliance [Data_Protection_Act]
40

Listing 23: Example information sharing policy from Listing 22 in binary representa-tion.
Rx:[1] [10.10.10.10] [1] [001] [01] [1] [1]
[01.01.01.01] [1]
The binary representation in Listing 23 shows that an information sharing policy pop-ulated from elements defined in Table 5 will consist of 26 binary bits. If, however, theRole field is now updated to include two additional roles, Constable and Analyst, thenumber of bits required to represent the policy will change. Table 6 shows the Rolefield from Table 5 updated with the additional roles.
Table 6: Role field from Table 5 updated with Constable and Analyst roles.
Policy Field Elements from Definition Element ID Binary Representation
Role
Records Admin 1 001Sergeant 2 010Constable 3 011Analyst 4 100
The same information sharing policy, Rx from Listing 22, now expressed using theupdated Role field from Table 6, will have the binary form as shown in Listing 24.As shown, 28 binary bits are now required to represent Rx whereas previously only26 binary bits were required. This illustrates the sensitivity of binary expressions and,hence, any binary calculations, to modifications made to the set of elements registeredfor an information sharing agreement.
Listing 24: Example information sharing policy from Listing 22 represented in binaryform using updated Role field from Table 6.
Rx:[1] [10.10.10.010] [1] [001] [01] [1] [1]
[01.01.01.001] [1]
The following examples provide details on each stage of the functional verificationprocess. The methods used for functional verification are as illustrated in Figure 15.Each example assumes an information sharing agreement between two organisations,Police Force A and Child Protection Agency B. Only the requester and ownerfields are manipulated in the following anomaly verification examples for reasons ofbrevity.
3.2.5 Example of Redundancy Anomaly Verification
Elements from Table 5 are used to define two information sharing policies. Listing 25shows Rx, an existing policy in the agreement and Listing 26 shows Ry , a proposedpolicy to be added. Listing 27 shows the binary representations of the two policies.
41
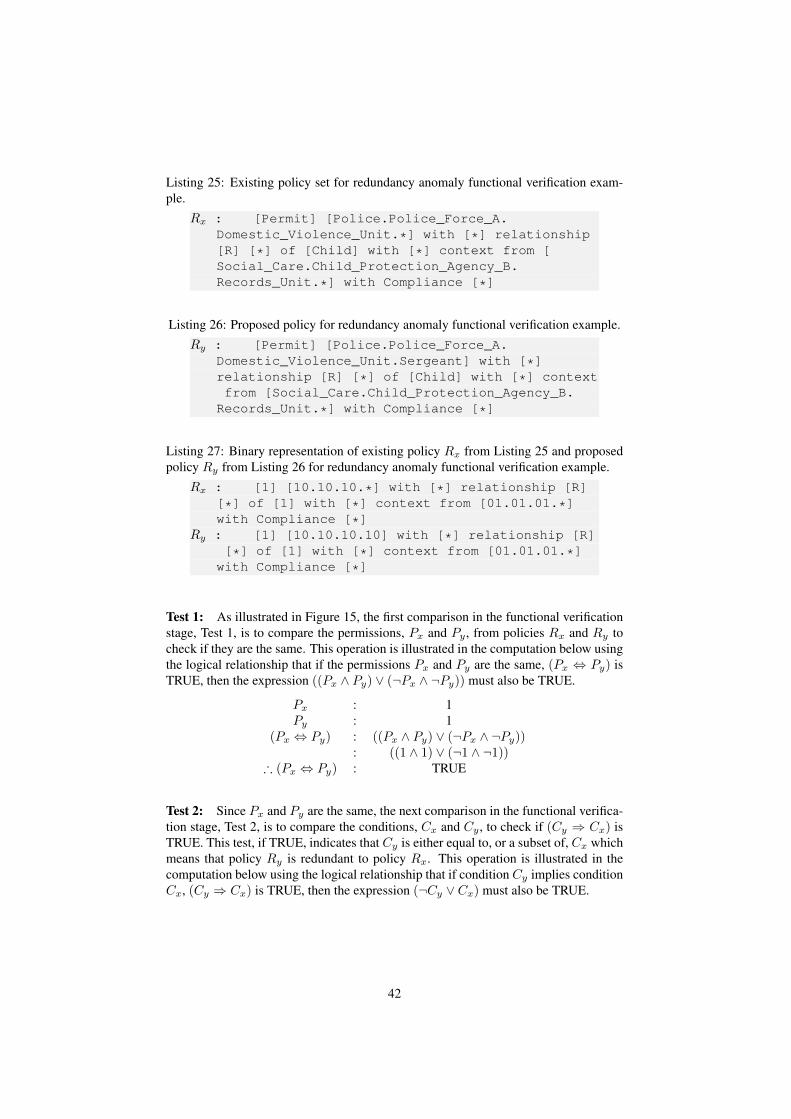
Listing 25: Existing policy set for redundancy anomaly functional verification exam-ple.
Rx : [Permit] [Police.Police_Force_A.Domestic_Violence_Unit.*] with [*] relationship[R] [*] of [Child] with [*] context from [Social_Care.Child_Protection_Agency_B.Records_Unit.*] with Compliance [*]
Listing 26: Proposed policy for redundancy anomaly functional verification example.Ry : [Permit] [Police.Police_Force_A.
Domestic_Violence_Unit.Sergeant] with [*]relationship [R] [*] of [Child] with [*] contextfrom [Social_Care.Child_Protection_Agency_B.
Records_Unit.*] with Compliance [*]
Listing 27: Binary representation of existing policy Rx from Listing 25 and proposedpolicy Ry from Listing 26 for redundancy anomaly functional verification example.
Rx : [1] [10.10.10.*] with [*] relationship [R][*] of [1] with [*] context from [01.01.01.*]with Compliance [*]
Ry : [1] [10.10.10.10] with [*] relationship [R][*] of [1] with [*] context from [01.01.01.*]
with Compliance [*]
Test 1: As illustrated in Figure 15, the first comparison in the functional verificationstage, Test 1, is to compare the permissions, Px and Py , from policies Rx and Ry tocheck if they are the same. This operation is illustrated in the computation below usingthe logical relationship that if the permissions Px and Py are the same, (Px ⇔ Py) isTRUE, then the expression ((Px ∧ Py) ∨ (¬Px ∧ ¬Py)) must also be TRUE.
Px : 1Py : 1
(Px ⇔ Py) : ((Px ∧ Py) ∨ (¬Px ∧ ¬Py)): ((1 ∧ 1) ∨ (¬1 ∧ ¬1))
∴ (Px ⇔ Py) : TRUE
Test 2: Since Px and Py are the same, the next comparison in the functional verifica-tion stage, Test 2, is to compare the conditions, Cx and Cy , to check if (Cy ⇒ Cx) isTRUE. This test, if TRUE, indicates that Cy is either equal to, or a subset of, Cx whichmeans that policy Ry is redundant to policy Rx. This operation is illustrated in thecomputation below using the logical relationship that if condition Cy implies conditionCx, (Cy ⇒ Cx) is TRUE, then the expression (¬Cy ∨ Cx) must also be TRUE.
42

Cx : 10.10.10.XXCy : 10.10.10.10
Cy ⇒ Cx : ¬Cy ∨ Cx
: 01.01.01.01 ∨ 10.10.10.XX∴ Cy ⇒ Cx : TRUE
Conclusion: As can be seen from Figure 15, if Test 1 and Test 2 result in TRUE,policy Ry is redundant to policy Rx.
3.2.6 Example of Shadow Anomaly Verification
Elements from Table 5 are used to define two information sharing policies. Listing 28shows Rx, an existing policy in the agreement and Listing 29 shows Ry , a proposedpolicy to be added. Listing 30 shows the binary representations of the two policies.
Listing 28: Existing policy set for shadow anomaly functional verification example.Rx : [Deny] [Police.Police_Force_A.
Domestic_Violence_Unit.*] with [*] relationship[R] [*] of [Child] with [*] context from [Social_Care.Child_Protection_Agency_B.Records_Unit.*] with Compliance [*]
Listing 29: Proposed policy for shadow anomaly functional verification example.Ry : [Permit] [Police.Police_Force_A.
Domestic_Violence_Unit.Sergeant] with [*]relationship [R] [*] of [Child] with [*] contextfrom [Social_Care.Child_Protection_Agency_B.
Records_Unit.*] with Compliance [*]
Listing 30: Binary representation of existing policy Rx from Listing 28 and proposedpolicy Ry from Listing 29 for shadow anomaly functional verification example.
Rx : [0] [10.10.10.*] with [*] relationship [R][*] of [1] with [*] context from [01.01.01.*]with Compliance [*]
Ry : [1] [10.10.10.10] with [*] relationship [R][*] of [1] with [*] context from [01.01.01.*]
with Compliance [*]
Test 1: As illustrated in Figure 15, the first comparison in the functional verificationstage, Test 1, is to compare the permissions, Px and Py , from policies Rx and Ry tocheck if they are the same. This operation is illustrated in the computation below usingthe logical relationship that if the permissions Px and Py are the same, (Px ⇔ Py) isTRUE, then the expression ((Px ∧ Py) ∨ (¬Px ∧ ¬Py)) must also be TRUE.
43

Px : 0Py : 1
(Px ⇔ Py) : ((Px ∧ Py) ∨ (¬Px ∧ ¬Py)): ((0 ∧ 1) ∨ (¬0 ∧ ¬1))
∴ (Px ⇔ Py) : FALSE
Test 2: Since Px and Py are different, the next comparison in the functional verifica-tion stage, Test 2, is to compare the conditions, Cx and Cy , to check if (Cy ⇒ Cx) isTRUE. This test, if TRUE, indicates that Cy is either equal to, or a subset of, Cx whichmeans that policy Ry is shadowed by policy Rx. This operation is illustrated in thecomputation below using the logical relationship that if condition Cy implies conditionCx, (Cy ⇒ Cx) is TRUE, then the expression (¬Cy ∨ Cx) must also be TRUE.
Cx : 10.10.10.XXCy : 10.10.10.10
Cy ⇒ Cx : ¬Cy ∨ Cx
: 01.01.01.01 ∨ 10.10.10.XX∴ Cy ⇒ Cx : TRUE
Conclusion: As can be seen from Figure 15, if Test 1 results in FALSE and Test 2results in TRUE, policy Ry is shadowed by policy Rx.
3.2.7 Example of Generalisation Anomaly Verification
Elements from Table 5 are used to define two information sharing policies. Listing 31shows Rx, an existing policy in the agreement and Listing 32 shows Ry , a proposedpolicy to be added. Listing 33 shows the binary representations of the two policies.
Listing 31: Existing policy set for generalisation anomaly functional verification ex-ample.
Rx : [Deny] [Police.Police_Force_A.Domestic_Violence_Unit.Sergeant] with [*]relationship [R] [*] of [Child] with [*] contextfrom [Social_Care.Child_Protection_Agency_B.
Records_Unit.*] with Compliance [*]
Listing 32: Proposed policy for generalisation anomaly functional verification exam-ple.
Ry : [Permit] [Police.Police_Force_A.Domestic_Violence_Unit.*] with [*] relationship[R] [*] of [Child] with [*] context from [Social_Care.Child_Protection_Agency_B.Records_Unit.*] with Compliance [*]
44

Listing 33: Binary representation of existing policy Rx from Listing 31 and proposedpolicy Ry from Listing 32 for generalisation anomaly functional verification example.
Rx : [0] [10.10.10.10] with [*] relationship [R][*] of [1] with [*] context from [01.01.01.*]
with Compliance [*]Ry : [1] [10.10.10.*] with [*] relationship [R]
[*] of [1] with [*] context from [01.01.01.*]with Compliance [*]
Test 1: As illustrated in Figure 15, the first comparison in the functional verificationstage, Test 1, is to compare the permissions, Px and Py , from policies Rx and Ry tocheck if they are the same. This operation is illustrated in the computation below usingthe logical relationship that if the permissions Px and Py are the same, (Px ⇔ Py) isTRUE, then the expression ((Px ∧ Py) ∨ (¬Px ∧ ¬Py)) must also be TRUE.
Px : 0Py : 1
(Px ⇔ Py) : ((Px ∧ Py) ∨ (¬Px ∧ ¬Py)): ((0 ∧ 1) ∨ (¬0 ∧ ¬1))
∴ (Px ⇔ Py) : FALSE
Test 2: Since Px and Py are different, the next comparison in the functional verifica-tion stage, Test 2, is to compare the conditions, Cx and Cy , to check if (Cy ⇒ Cx) isTRUE. This test, if TRUE, indicates that Cy is either equal to, or a subset of, Cx whichmeans that policy Ry is shadowed by policy Rx. This operation is illustrated in thecomputation below using the logical relationship that if condition Cy implies conditionCx, (Cy ⇒ Cx) is TRUE, then the expression (¬Cy ∨ Cx) must also be TRUE.
Cx : 10.10.10.10Cy : 10.10.10.XX
Cy ⇒ Cx : ¬Cy ∨ Cx
: 01.01.01.00 ∨ 10.10.10.10∴ Cy ⇒ Cx : FALSE
Test 3: Since the result of Test 2 is FALSE, the next comparison in the functionalverification stage, Test 3, is to compare the conditions, Cx and Cy , to check if (Cx ⇒Cy) is TRUE. This test, if TRUE, indicates that Cx is either equal to, or a subset of,Cy which means that policy Ry is a generalisation of policy Rx. This operation isillustrated in the computation below using the logical relationship that if condition Cx
implies condition Cy , (Cx ⇒ Cy) is TRUE, then the expression (¬Cx∨Cy) must alsobe TRUE.
Cx : 10.10.10.10Cy : 10.10.10.XX
Cx ⇒ Cy : ¬Cx ∨ Cy
: 01.01.01.01 ∨ 10.10.10.11∴ Cy ⇒ Cx : TRUE
45
Conclusion: As can be seen from Figure 15, if Test 1 results in FALSE, Test 2 resultsin FALSE and Test 3 results in TRUE, policy Ry is a generalisation of policy Rx.
3.2.8 Example of Correlation Anomaly Verification
Elements from Table 5 are used to define two information sharing policies. Listing 34shows Rx, an existing policy in the agreement and Listing 35 shows Ry , a proposedpolicy to be added. Listing 36 shows the binary representations of the two policies. Itmust be noted that, unlike in previous examples, in this example the conditions Cx andCy of policies Rx and Ry have different Requester and Owner fields. Therefore,the conjunction of both these fields will be used in the tests below when comparingconditions.
Listing 34: Existing policy set for correlation anomaly functional verification example.Rx : [Deny] [Police.Police_Force_A.
Domestic_Violence_Unit.Sergeant] with [*]relationship [R] [*] of [Child] with [*] contextfrom [Social_Care.Child_Protection_Agency_B.
Records_Unit.*] with Compliance [*]
Listing 35: Proposed policy for correlation anomaly functional verification example.Ry : [Permit] [Police.Police_Force_A.
Domestic_Violence_Unit.*] with [*] relationship[R] [*] of [Child] with [*] context from [Social_Care.Child_Protection_Agency_B.Records_Unit.Records_Admin] with Compliance [*]
Listing 36: Binary representation of existing policy Rx from Listing 34 and proposedpolicy Ry from Listing 35 for correlation anomaly functional verification example.
Rx : [0] [10.10.10.10] with [*] relationship [R][*] of [1] with [*] context from [01.01.01.*]
with Compliance [*]Ry : [1] [10.10.10.*] with [*] relationship [R]
[*] of [1] with [*] context from [01.01.01.01]with Compliance [*]
Test 1: As illustrated in Figure 15, the first comparison in the functional verificationstage, Test 1, is to compare the permissions, Px and Py , from policies Rx and Ry tocheck if they are the same. This operation is illustrated in the computation below usingthe logical relationship that if the permissions Px and Py are the same, (Px ⇔ Py) isTRUE, then the expression ((Px ∧ Py) ∨ (¬Px ∧ ¬Py)) must also be TRUE.
46

Px : 0Py : 1
(Px ⇔ Py) : ((Px ∧ Py) ∨ (¬Px ∧ ¬Py)): ((0 ∧ 1) ∨ (¬0 ∧ ¬1))
∴ (Px ⇔ Py) : FALSE
Test 2: Since Px and Py are different, the next comparison in the functional verifica-tion stage, Test 2, is to compare the conditions, Cx and Cy , to check if (Cy ⇒ Cx) isTRUE. This test, if TRUE, indicates that Cy is either equal to, or a subset of, Cx whichmeans that policy Ry is shadowed by policy Rx. This operation is illustrated in thecomputation below using the logical relationship that if condition Cy implies conditionCx, (Cy ⇒ Cx) is TRUE, then the expression (¬Cy ∨ Cx) must also be TRUE.
Requester Field Owner FieldCx : 10.10.10.10 01.01.01.XXCy : 10.10.10.XX 01.01.01.01
Cy ⇒ Cx : ¬Cy ∨ Cx ¬Cy ∨ Cx
: 01.01.01.00 ∨ 10.10.10.10 10.10.10.10 ∨ 01.01.01.11: FALSE TRUE
∴ Cy ⇒ Cx : FALSE
Test 3: Since the result of Test 2 is FALSE, the next comparison in the functionalverification stage, Test 3, is to compare the conditions, Cx and Cy , to check if (Cx ⇒Cy) is TRUE. This test, if TRUE, indicates that Cx is either equal to, or a subset of,Cy which means that policy Ry is a generalisation of policy Rx. This operation isillustrated in the computation below using the logical relationship that if condition Cx
implies condition Cy , (Cx ⇒ Cy) is TRUE, then the expression (¬Cx∨Cy) must alsobe TRUE.
Requester Field Owner FieldCx : 10.10.10.10 01.01.01.XXCy : 10.10.10.XX 01.01.01.01
Cx ⇒ Cy : ¬Cx ∨ Cy ¬Cx ∨ Cy
: 01.01.01.01 ∨ 10.10.10.11 10.10.10.00 ∨ 01.01.01.01: TRUE FALSE
∴ Cx ⇒ Cy : FALSE
Test 4: Since the result of Test 3 is FALSE, the next comparison in the functional ver-ification stage, Test 4, is to compare the conditions, Cx and Cy , to check for correlatedfields. For this example, this requires checking that the Requester and Owner fieldsof one policy are the same as, or subsets of, the corresponding fields of the other policyand that the remaining fields of the former policy are supersets of the correspondingfields of the latter policy. Formally, this means that for the fields being compared, if forcertain fields (Cx ⇒ Cy) is TRUE, then (Cy ⇒ Cx) must be TRUE for the remainingfields being compared. This operation is illustrated in the computation below using thelogical relationship that if condition Cx implies condition Cy , (Cx ⇒ Cy) is TRUE,then the expression (¬Cx ∨ Cy) must also be TRUE.
47

Requester Field Owner FieldCx : 10.10.10.10 01.01.01.XXCy : 10.10.10.XX 01.01.01.01
Requesterx ⇒ Requestery : ¬Requesterx ∨Requestery: 01.01.01.01 ∨ 10.10.10.11: TRUE
Ownery ⇒ Ownerx : ¬Ownery ∨Ownerx: 10.10.10.10 ∨ 01.01.01.11: TRUE
∴ Requesterx ⇒ Requestery∧Ownery ⇒ Ownerx : TRUE
Conclusion: As can be seen from Figure 15, if Test 1 results in FALSE, Test 2 resultsin FALSE, Test 3 results in FALSE and Test 4 results in TRUE, policies Rx and Ry arecorrelated.
48

4 Framework Evaluation
4.1 Introduction
This section presents an analysis of the evaluation scenarios which are constructedin order to analyse the performance of the proposed information sharing framework,based on varying central processing unit (CPUs) and random-access memory (RAM)availability.
4.2 Total Processing-Time
This section offers an overview of the total processing times for the four scenariosunder evaluation. As illustrated in Figures 16, 17, 18 and 19, the total processingtimes increase with respect to increasing policy set size for all four scenarios. Thisis expected, since the resource configurations do not change within a scenario, andonly the policy set size varies. Hence, with the same available resource configuration,it is expected that the total processing time will increase proportionally to the sizeof the policy set. In fact, as illustrated by the graphs in the figures mentioned, therate of change of the total processing time increases with increasing policy set size,indicating a polynomial relationship. A related observation from Figures 16, 17, 18
0 0.2 0.4 0.6 0.8 1
·106
0
0.2
0.4
0.6
0.8
1
1.2
1.4
·105
Rule Set Size
Proc
essi
ng-T
ime
(Sec
onds
)
Sequential total processing timeBDD total processing time
Figure 16: Scenario 1: Comparison of total processing times using sequential and BDDmethods against increasing rule set size
and 19 is that the total processing times for the sequential method are higher than thetotal processing times for the method using Binary Decision Diagrams (BDDs), for allfour evaluation scenarios. This result is expected, as the process using BDDs, due to
49

0 0.2 0.4 0.6 0.8 1
·106
0
2
4
6
·105
Rule Set Size
Proc
essi
ng-T
ime
(Sec
onds
)Sequential total processing time
BDD total processing time
Figure 17: Scenario 2: Comparison of total processing times using sequential and BDDmethods against increasing rule set size
0 0.2 0.4 0.6 0.8 1
·106
0
0.2
0.4
0.6
0.8
1
1.2
1.4
·105
Rule Set Size
Proc
essi
ng-T
ime
(Sec
onds
)
Sequential total processing timeBDD total processing time
Figure 18: Scenario 3: Comparison of total processing times using sequential and BDDmethods against increasing rule set size
50

0 0.2 0.4 0.6 0.8 1
·106
0
0.2
0.4
0.6
0.8
1
1.2
1.4
·105
Rule Set Size
Proc
essi
ng-T
ime
(Sec
onds
)Sequential total processing time
BDD total processing time
Figure 19: Scenario 4: Comparison of total processing times using sequential and BDDmethods against increasing rule set size
their tree structure, involves fewer computations than sequential comparisons. Further,it should be noted that the total processing time for the sequential process increasesat a greater rate than the total processing time for the process using BDDs. This isillustrated in Figures 20, 21, 22 and 23, where each figure highlights the increasingdifference between sequential and BDD total processing times. The calculation for thisis formalised as f(x) in Function 1.
f(x) = (TotalProcessingT ime)Sequential − (TotalProcessingT ime)BDD (1)
An important outcome from this observation is that, as policy set sizes increase, policyverification processes using BDDs offer increasingly better performance, in terms offaster total completion times, than verification processes using sequential matching. Itis also important to note that, apart from total processing times, measurements werealso made of the percentage processor utilisation over time and are shown in the resultsin the Appendices. These were taken for each stage of the policy verification processand for every policy set size (50,000 to 1,000,000 policies) under test, during each ofthe four evaluation scenarios. An analysis of these measurements indicates that the per-cent processor utilisation does not vary noticeably with either increasing policy set sizeor with changes in the resource configuration as defined by each evaluation scenario.However, it is interesting to note that the arithmetic mean value of the percent pro-cessor utilisation for the sequential method is consistently lower than that BDD-basedmethod. This implies that, although there is no direct relationship between increasedprocessor utilisation and increasing policy set sizes, the BDD-based method, registerslower processor utilisation than the sequential comparison method. Table 7 offers acomparison of the variation in total processing times against available resources, basedon the four scenarios under evaluation. This involves computing the arithmetic mean
51

0 0.2 0.4 0.6 0.8 1
·106
0
0.2
0.4
0.6
0.8
1
1.2
·104
Rule Set Size
Proc
essi
ng-T
ime
(Sec
onds
)Seq-TT − BDD-TT
Figure 20: Scenario 1: Graph of difference in total processing times of sequential andBDD methods against increasing policy set size.
0 0.2 0.4 0.6 0.8 1
·106
0
0.5
1
1.5
2
·105
Rule Set Size
Proc
essi
ng-T
ime
(Sec
onds
)
Seq-TT − BDD-TT
Figure 21: Scenario 2: Graph of difference in total processing times of sequential andBDD methods against increasing policy set size.
52

0 0.2 0.4 0.6 0.8 1
·106
0
2,000
4,000
6,000
8,000
Rule Set Size
Proc
essi
ng-T
ime
(Sec
onds
)Seq-TT − BDD-TT
Figure 22: Scenario 3: Graph of difference in total processing times of sequential andBDD methods against increasing policy set size.
0 0.2 0.4 0.6 0.8 1
·106
0
1,000
2,000
3,000
4,000
5,000
6,000
Rule Set Size
Proc
essi
ng-T
ime
(Sec
onds
)
Seq-TT − BDD-TT
Figure 23: Scenario 4: Graph of difference in total processing times of sequential andBDD methods against increasing policy set size.
53

for the total processing time using the sequential method, (PTMeanSeq), and again forthe BDD-based method, (PTMeanBDD), for each scenario. As can be seen from Table7, there is minimal variation in the total processing times, for the sequential and BDD-based methods, for Scenarios 1, 3 and 4. The variation in PTMeanSeq for Scenarios1, 3 and 4 is 4004 seconds, while the variation in PTMeanBDD is 4559 seconds. Theresults for Scenario 2, however, indicate significantly higher values, with a PTMeanSeq
time of 234263 seconds and a PTMeanBDD time of 172911 seconds. These values arein excess of the range values for the other evaluation scenarios by a factor of 58.5 forPTMeanSeq and 37.9 for PTMeanBDD. As the resource configuration for Scenario 2
Table 7: Mean total processing times by scenario.
Evaluation PTMeanSeq PTMeanBDD PTMeanSeq − PTMeanBDD
Scenario Seconds Seconds Seconds
Scenario 1 52966 49531 3435Scenario 2 234263 172911 61352Scenario 3 56324 53449 2875Scenario 4 56970 54090 2880
has the lowest amount of random-access memory (RAM), this result implies a highdependence of the testing process, for both the sequential and BDD-based methods, onRAM availability. It could be argued that this result may be influenced by the avail-ability of the number of central processing units (CPUs). However, this argument isdiscounted on the basis that Scenario 3, which includes the same number of CPUs asScenario 2 but has double the available RAM, shows similar results to the other evalu-ation scenarios. Also, Scenario 1, which includes half the number of available CPUs asScenario 2, but with double the available RAM, also shows similar results to the otherevaluation scenarios. A comparison of these results indicates that varying the numberof available CPUs has only a minimal effect on total processing times, while a decreasein the amount of available RAM may significantly affect processing times. The rela-tively negligible variation between Scenarios 1, 3 and 4 also imply that a minimumamount of RAM is required for optimal performance. Based on the results in Table 7,this amount seems to be 2048MB in the case of the selected evaluation scenarios, asan increase in this amount, in Scenario 4 for example, does not result in an improve-ment in total processing times. Further, as shown in Figure 17, Scenario 2 displaysthe largest difference between sequential and BDD-based total processing times. Thisis an indication that, under constrained RAM conditions, the sequential method is ad-versely affected to a much higher degree than the BDD-based method. Table 8 offersa more detailed overview of total processing time by providing a breakdown of themean total processing times of each stage of the policy verification process. The meanprocessing times for both the sequential, PTMeanSeq, and BDD-based, PTMeanBDD,methods are expressed as percentages of the total mean processing time. As indicatedin Table 8, the majority of the processing time is utilised at the functional verificationstage and, secondly, by the ontology verification stage. The syntax verification utilisesthe minimum amount of processing time for each scenario. This holds true for both thesequential and BDD-based methods.
54

Table 8: Mean processing times by scenario and verification stage, expressed as per-centage of PTMeanSeq and PTMeanBDD.
Scenario Verification Stage Percentage of Mean Processing Percentage of Mean ProcessingTime (Sequential) Time (BDD)
Scenario 1 Syntax 0.27 0.26Ontology 15.12 16.20Functional 84.61 83.54
Scenario 2 Syntax 0.05 0.96Ontology 5.50 6.50Functional 94.45 92.54
Scenario 3 Syntax 0.22 0.30Ontology 21.43 22.52Functional 78.35 77.18
Scenario 4 Syntax 0.24 0.28Ontology 23.14 24.34Functional 76.62 75.38
4.3 Random-Access Memory (RAM) Usage
As identified in Section 4.2, the performance of policy verification process is sensi-tive to the amount of available random-access memory (RAM). This section offers ananalysis of the mean RAM usage with respect to each stage of the verification process.
4.3.1 Syntax Verification Stage
Figure 24 illustrates the mean random-access memory (RAM) usage for the syntaxverification stage of each of the four evaluation scenarios. As indicated, the generaltrend of RAM usage for this stage is a logarithmic increase approaching a stable value.Table 9 lists these values, in megabytes (MB), for all four scenarios, along with thecorresponding policy set sizes, where they occur. The results indicate that Scenario 1approaches a stable mean RAM usage value of 11.47 MB, while Scenarios 2, 3 and 4approach a value of 11.70 MB.
Table 9: Stable mean RAM usage values (S-MRU) for the syntax verification stage andcorresponding policy set sizes.
Scenario Stable RAM Value Policy Set(Megabytes) Size
Scenario 1 11.47 600000Scenario 2 11.70 350000Scenario 3 11.70 400000Scenario 4 11.70 550000
55
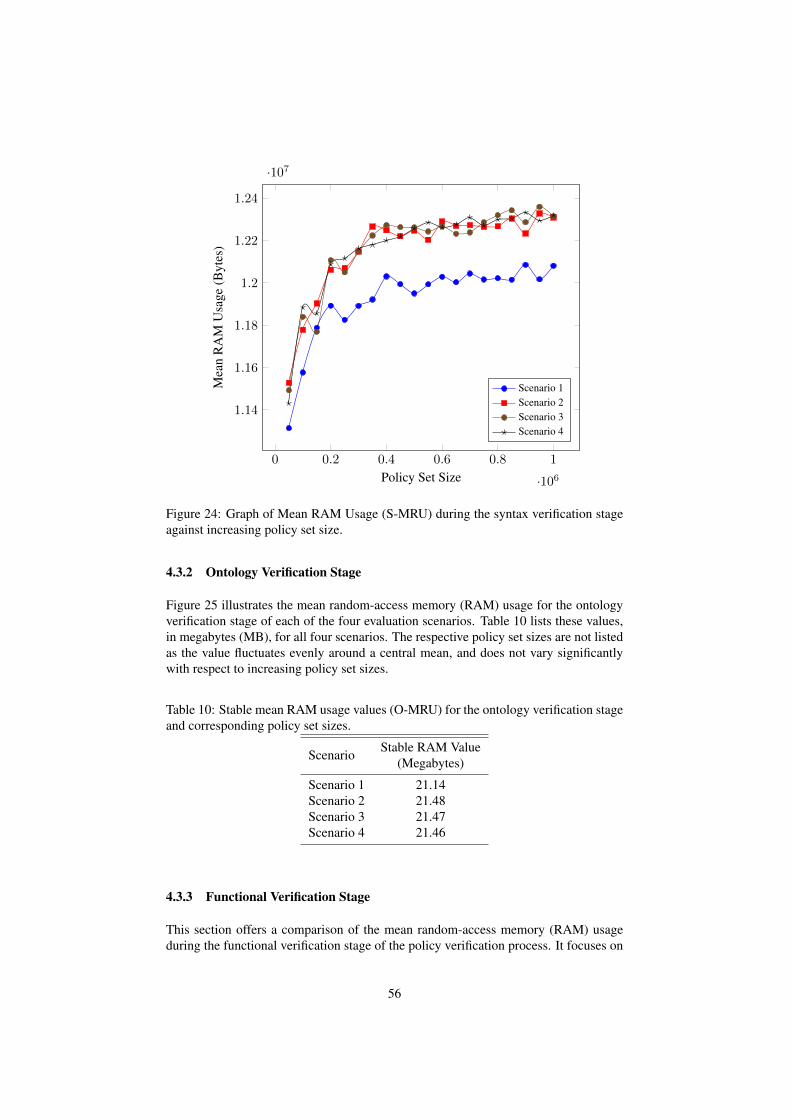
0 0.2 0.4 0.6 0.8 1
·106
1.14
1.16
1.18
1.2
1.22
1.24
·107
Policy Set Size
Mea
nR
AM
Usa
ge(B
ytes
)
Scenario 1Scenario 2Scenario 3Scenario 4
Figure 24: Graph of Mean RAM Usage (S-MRU) during the syntax verification stageagainst increasing policy set size.
4.3.2 Ontology Verification Stage
Figure 25 illustrates the mean random-access memory (RAM) usage for the ontologyverification stage of each of the four evaluation scenarios. Table 10 lists these values,in megabytes (MB), for all four scenarios. The respective policy set sizes are not listedas the value fluctuates evenly around a central mean, and does not vary significantlywith respect to increasing policy set sizes.
Table 10: Stable mean RAM usage values (O-MRU) for the ontology verification stageand corresponding policy set sizes.
Scenario Stable RAM Value(Megabytes)
Scenario 1 21.14Scenario 2 21.48Scenario 3 21.47Scenario 4 21.46
4.3.3 Functional Verification Stage
This section offers a comparison of the mean random-access memory (RAM) usageduring the functional verification stage of the policy verification process. It focuses on
56
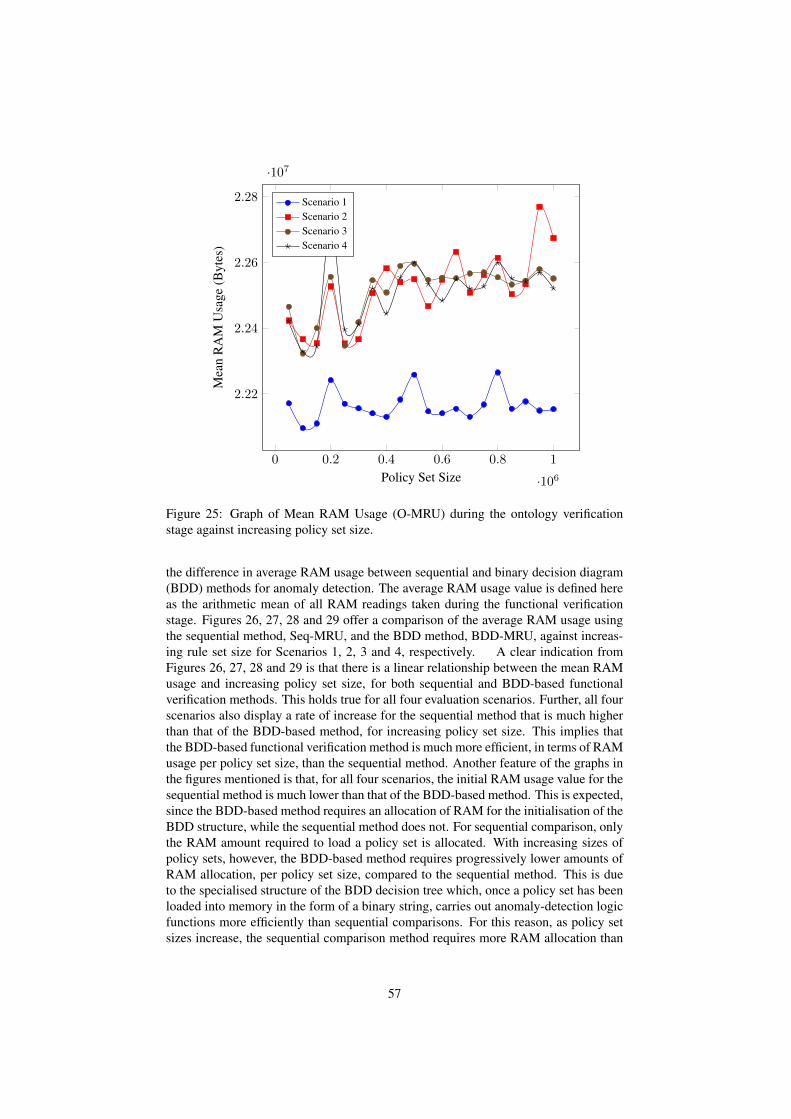
0 0.2 0.4 0.6 0.8 1
·106
2.22
2.24
2.26
2.28
·107
Policy Set Size
Mea
nR
AM
Usa
ge(B
ytes
)Scenario 1Scenario 2Scenario 3Scenario 4
Figure 25: Graph of Mean RAM Usage (O-MRU) during the ontology verificationstage against increasing policy set size.
the difference in average RAM usage between sequential and binary decision diagram(BDD) methods for anomaly detection. The average RAM usage value is defined hereas the arithmetic mean of all RAM readings taken during the functional verificationstage. Figures 26, 27, 28 and 29 offer a comparison of the average RAM usage usingthe sequential method, Seq-MRU, and the BDD method, BDD-MRU, against increas-ing rule set size for Scenarios 1, 2, 3 and 4, respectively. A clear indication fromFigures 26, 27, 28 and 29 is that there is a linear relationship between the mean RAMusage and increasing policy set size, for both sequential and BDD-based functionalverification methods. This holds true for all four evaluation scenarios. Further, all fourscenarios also display a rate of increase for the sequential method that is much higherthan that of the BDD-based method, for increasing policy set size. This implies thatthe BDD-based functional verification method is much more efficient, in terms of RAMusage per policy set size, than the sequential method. Another feature of the graphs inthe figures mentioned is that, for all four scenarios, the initial RAM usage value for thesequential method is much lower than that of the BDD-based method. This is expected,since the BDD-based method requires an allocation of RAM for the initialisation of theBDD structure, while the sequential method does not. For sequential comparison, onlythe RAM amount required to load a policy set is allocated. With increasing sizes ofpolicy sets, however, the BDD-based method requires progressively lower amounts ofRAM allocation, per policy set size, compared to the sequential method. This is dueto the specialised structure of the BDD decision tree which, once a policy set has beenloaded into memory in the form of a binary string, carries out anomaly-detection logicfunctions more efficiently than sequential comparisons. For this reason, as policy setsizes increase, the sequential comparison method requires more RAM allocation than
57
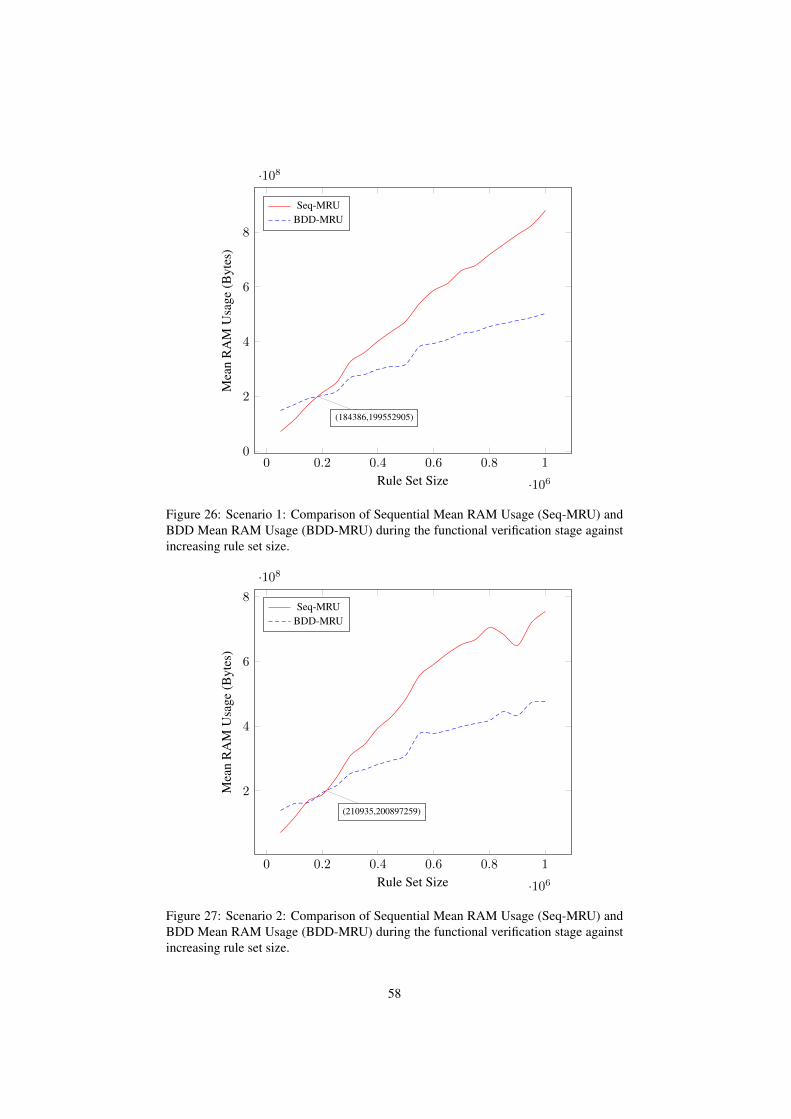
0 0.2 0.4 0.6 0.8 1
·106
0
2
4
6
8
·108
(184386,199552905)
Rule Set Size
Mea
nR
AM
Usa
ge(B
ytes
)
Seq-MRUBDD-MRU
Figure 26: Scenario 1: Comparison of Sequential Mean RAM Usage (Seq-MRU) andBDD Mean RAM Usage (BDD-MRU) during the functional verification stage againstincreasing rule set size.
0 0.2 0.4 0.6 0.8 1
·106
2
4
6
8
·108
(210935,200897259)
Rule Set Size
Mea
nR
AM
Usa
ge(B
ytes
)
Seq-MRUBDD-MRU
Figure 27: Scenario 2: Comparison of Sequential Mean RAM Usage (Seq-MRU) andBDD Mean RAM Usage (BDD-MRU) during the functional verification stage againstincreasing rule set size.
58

0 0.2 0.4 0.6 0.8 1
·106
0
2
4
6
8
·108
(180676,198718538)
Rule Set Size
Mea
nR
AM
Usa
ge(B
ytes
)
Seq-MRUBDD-MRU
Figure 28: Scenario 3: Comparison of Sequential Mean RAM Usage (Seq-MRU) andBDD Mean RAM Usage (BDD-MRU) during the functional verification stage againstincreasing rule set size.
0 0.2 0.4 0.6 0.8 1
·106
0
2
4
6
8
·108
(181094,198789830)
Rule Set Size
Mea
nR
AM
Usa
ge(B
ytes
)
Seq-MRUBDD-MRU
Figure 29: Scenario 4: Comparison of Sequential Mean RAM Usage (Seq-MRU) andBDD Mean RAM Usage (BDD-MRU) during the functional verification stage againstincreasing rule set size.
59

the BDD-based method for the same size of policy set. An interesting aspect of thistrend is that, for each evaluation scenario, the sequential comparison method requireslower RAM allocation than the BDD-based method for certain policy set sizes. Ta-ble 11 lists the points at which the RAM usage for both methods is the same. Thelowest RAM value where this occurs is 189.51MB for Scenario 3, while the highestis 191.59MB for Scenario 2. Interestingly, these points also form the boundaries forthe range of policy set sizes where RAM usage is the same, which is 180676 policiesfor Scenario 3 and 210935 policies for Scenario 2. An important consequence of these
Table 11: Rule set sizes by scenario at which the sequential and BDD-based RAMusage values are equal.
Scenario No. of policies in RAM Usage ValuePolicy Set Size (Megabytes)
Scenario 1 184386 190.31Scenario 2 210935 191.59Scenario 3 180676 189.51Scenario 4 181094 189.58
values is that, for policy set sizes of approximately 180000 policies and less, the se-quential comparison method is more efficient than the BDD-based method, in terms ofRAM usage per policy set size, for all four evaluation scenarios. This means that, in or-der to successfully complete the functional verification process, the sequential methodrequires a much lower allocation of RAM than the BDD-based method, as long as thepolicy set size is lower than approximately 180000 policies. For all policy set sizeslarger than 180000 policies, however, the BDD-based method displays a lower RAMallocation requirement. Further, the difference in RAM allocation amounts between thesequential and BDD-based methods is linear. The linear relation here demonstrates thehigher rate of RAM usage against policy set size for the sequential method comparedagainst the BDD-based method. In terms of a ratio of policy set size against RAMusage amount, the BDD-based method, therefore, offers a more efficient application ofavailable RAM than the sequential method.
5 Conclusion
This paper outlined an evaluation and discussion on the performance of the informa-tion sharing framework, based on an analysis of its performance during each of thefour evaluation scenarios. As expected, it was evident from the analysis that increas-ing policy set sizes required an increasing amount of resources, especially in terms ofrandom-access memory (RAM), and resulted in longer processing times. Although thistrend was true for all four evaluation scenarios, it was evident that the binary decisiondiagram (BDD) based method performed better than the sequential method. This resultwas verified in the analysis of total processing times and percent processor utilisation,where the BDD-based method consistently resulted in faster times and lower utilisationthan the sequential method. Further, the difference in total processing times betweenthe sequential and BDD-based methods increased significantly with increasing policyset sizes, as was shown in Table 7. Although this trend was observed for all four evalua-tion scenarios, that is the BDD-based method had faster total processing times than the
60

sequential method for all four scenarios, it was particularly pronounced for Scenario2. While the difference in total processing times was 3435, 2875 and 2880 secondsfor Scenarios 1, 3 and 4, respectively, it was 61352 seconds for Scenario 2. Furtheranalysis of the RAM usage values over time for Scenario 2, indicate anomalous valuesfor sets consisting of greater than 500,000 policies. This implies a high dependence ofthe framework on available resources, as limited RAM availability in Scenario 2 mayhave contributed to the anomalous values recorded for larger policy sets. The analysisalso verified that the performance of the policy verification process is dependent on thefunctional verification stage more than the syntax or ontology verification stages, irre-spective of available resources. As indicated in Table 8, for example, over 75 percentof the mean processing time is taken up by the functional verification stage. This is acrucial argument in favour of the BDD-based method. This is not only because the to-tal processing times for the BDD-based method are lower than those for the sequentialcomparison method, but also because the rate of increase in processing time is signif-icantly higher for the sequential comparison method than for the BDD-based method.This observation holds true for all four evaluation scenarios and, therefore, highlightsthe increasing advantage of the BDD-based relative to increasing policy set sizes. Asdiscussed earlier in Section 2, there is a one-to-many relationship between high-levelpolicies and their lower-level implementations. Due to the large number of legal juris-dictions and organisations involved in collaborative frameworks, a single informationsharing policy may require a large number of abstractions and interpretations, resultingin large policy sets. Hence, it is likely that the advantage offered by the BDD methodwill be of vital advantage in this context.
61

References[1] E. Al-Shaer and H. Hamed, “Modeling and management of firewall policies,”
IEEE Transactions on Network and Service Management, vol. 1-1, pp. 2–10,2004.
[2] H. Hamed and E. Al-Shaer, “Taxonomy of conflicts in network security policies,”Communications Magazine, IEEE, vol. 44, no. 3, pp. 134 – 141, 2006.
[3] W. M. Fitzgerald, F. Turkmen, S. N. Foley, and B. O’Sullivan, “Anomaly analysisfor physical access control security configuration,” in Risk and Security of Internetand Systems (CRiSIS), 2012 7th International Conference on. IEEE, 2012, pp.1–8.
[4] Z. Chen, S. Guo, and R. Duan, “Research on the anomaly discovering algorithmof the packet filtering rule sets,” in Pervasive Computing Signal Processing andApplications (PCSPA), 2010 First International Conference on, 2010, pp. 362–366.
[5] H. Hu, G.-J. Ahn, and K. Kulkarni, “Detecting and resolving firewall policyanomalies,” Dependable and Secure Computing, IEEE Transactions on, vol. 9,no. 3, pp. 318–331, 2012.
[6] L. Fan, W. Buchanan, C. Thuemmler, O. Lo, A. Khedim, O. Uthmani, A. Lawson,and D. Bell, “Dacar platform for ehealth services cloud,” The 4th InternationalConference on Cloud Computing (IEEE Cloud ’11), In Press.
[7] B. Fraser, J. P. Aronson, N. Brownlee, and F. Byrum, “Site SecurityHandbook (rfc 2196),” Online, September 1997. [Online]. Available: http://tools.ietf.org/html/rfc2196
[8] B. Schneier, Secrets and lies : digital security in a networked world. New York:John Wiley, 2000.
[9] W. R. Cheswick, S. M. Bellovin, and A. D. Rubin, Firewalls and Internet Secu-rity. Boston: Addison-Wesley, 2003.
[10] Y. Bhaiji, CCIE Professional Development - Network Security Technologies andSolutions. Cisco Press, 2008.
[11] D. Danchev, “Building and implementing a successful information security pol-icy,” online at ddanchev.blogspot.com, 2011.
[12] R. S. Sandhu, E. J. Coyne, H. L. Feinstein, and C. E. Youman, “Role-based accesscontrol models, rbac,” Computer, vol. 29, no. 2, pp. 38–47, 1996.
[13] P. Samarati and S. C. de Vimercati, “Access control: Policies, models, and mech-anisms,” Lecture Notes in Computer Science, vol. 2171, pp. 137–196, 2000.
[14] R. Sandhu and P. Samarati, “Authentication, access control, and audit,” ACMComputing Survey, vol. 28, no. 1, pp. 241–243, 1996.
[15] T. Corbitt, “Protect your computer system with a security policy,” ManagementServices, vol. 46(5), pp. 20–21, 2002.
62

[16] S. Hinrichs, “Policy-based management: bridging the gap,” in Computer SecurityApplications Conference, 1999. (ACSAC ’99) Proceedings. 15th Annual, 1999,pp. 209 –218.
[17] M. Abrams and D. Bailey, “Abstraction and refinement of layered security pol-icy,” in Information Security: An Integrated Collection of Essays. IEEE Com-puter Society Press, 1995, pp. 126–136.
[18] N. Damianou, N. Dulay, E. Lupu, and M. Sloman, “The ponder policy specifi-cation language,” in Policies for Distributed Systems and Networks, ser. LectureNotes in Computer Science, M. Sloman, E. Lupu, and J. Lobo, Eds. SpringerBerlin / Heidelberg, 2001, vol. 1995, pp. 18–38.
[19] “Integrated network management: Moving from bits to business value,” in TenthIFIP/IEEE International Symposium on Integrated Network Management (IM2007), A. Keller, E. Al-Shaer, and H.-G. Hegering, Eds., Munich, Germany, May2007.
[20] N. C. Damianou, A. K. Bandara, M. S. Sloman, and E. C. Lupu, “A survey ofpolicy specification approaches,” Tech. Rep., 2002.
[21] F. Chen and R. S. Sandhu, “Constraints for role-based access control,” in RBAC’95: Proceedings of the first ACM Workshop on Role-based access control. NewYork, NY, USA: ACM, 1996, p. 14.
[22] R. Hayton, J. Bacon, and K. Moody, “Access control in an open distributed envi-ronment,” in IEEE Symposium on Security and Privacy, May 1998, pp. 3–14.
[23] J. Guttman, “Filtering posture: Local enforcement for global policies,” in Proc.IEEE Symp. Security Privacy, 1997.
[24] J. D. Guttman, “Rigorous automated network security management,” Interna-tional Journal of Information Security, vol. 4, pp. 29–48, 2005.
[25] ——, “Security goals: Packet trajectories and strand spaces,” Lecture Notes inComputer Science, pp. 197–261, 2001.
[26] R. Bryant, “Graph-based algorithms for boolean function manipulation,” Com-puters, IEEE Transactions on, vol. C-35, no. 8, pp. 677–691, August 1986.
[27] A. Boswell, “Specification and validation of a security policy model,” SoftwareEngineering, IEEE Transactions on, vol. 21, no. 2, pp. 63–68, Feb 1995.
[28] J. Hoagland, R. Pandey, and K. N. Levitt, “Security policy specification usinga graphical approach,” Computer Science Department, University of CaliforniaDavis, Tech. Rep., 1998.
[29] D. E. Bell and L. J. LaPadula, “Secure computer system: Unified exposition andmultics interpretation,” Electronic Systems Division, Air Force Systems Com-mand, Hanscom AFB, Bedford, MA 01731, Tech. Rep., March 1976.
[30] Y. Bartal, A. Mayer, K. Nissim, and A. Wool, “Firmato: a novel firewall man-agement toolkit,” in Security and Privacy, 1999. Proceedings of the 1999 IEEESymposium on, 1999, pp. 17–31.
63

[31] A. Mayer, A. Wool, and E. Ziskind, “Fang: a firewall analysis engine,” in Securityand Privacy, 2000. S P 2000. Proceedings. 2000 IEEE Symposium on, 2000, pp.177–187.
[32] A. Wool, “Architecting the lumeta firewall analyzer,” in Proceedings of the 10thconference on USENIX Security Symposium - Volume 10, ser. SSYM’01. Berke-ley, CA, USA: USENIX Association, 2001, pp. 7–7.
[33] A. Mayer, A. Wool, and E. Ziskind, “Offline firewall analysis,” InternationalJournal of Information Security, vol. 5, pp. 125–144, July 2006.
[34] P. Jaferian, D. Botta, F. Raja, K. Hawkey, and K. Beznosov, “Guidelines for de-signing it security management tools,” in CHiMiT ’08: Proceedings of the 2ndACM Symposium on Computer Human Interaction for Management of Informa-tion Technology. New York, NY, USA: ACM, 2008, pp. 1–10.
[35] R. Marmorstein and P. Kearns, “A tool for automated iptables firewall analysis,” inProceedings of the annual conference on USENIX Annual Technical Conference(ATEC). Berkeley, CA, USA: USENIX Association, 2005, pp. 44–44.
[36] Cisco Systems, “Cisco secure policy manager.” [Online]. Available: http://www.cisco.com/warp/public/cc/pd/sqsw/tech/csmp_rg.pdf
[37] T. E. Uribe and S. Cheung, “Automatic analysis of firewall and network intrusiondetection system configurations,” in Proceedings of the 2004 ACM workshop onFormal methods in security engineering, ser. FMSE ’04. New York, NY, USA:ACM, 2004, pp. 66–74.
[38] T. Uribe and S. Cheung, “Automatic analysis of firewall and network intrusiondetection system configurations,” Journal of Computer Security, vol. 15, no. 6,pp. 691–715, 2007.
[39] W. Enck, P. McDaniel, S. Sen, P. Sebos, S. Spoerel, A. Greenberg, S. Rao, andW. Aiello, “Configuration management at massive scale: system design and ex-perience,” in 2007 USENIX Annual Technical Conference. Berkeley, CA, USA:USENIX Association, 2007, pp. 1–14.
[40] B. Zhang, E. Al-Shaer, R. Jagadeesan, J. Riely, and C. Pitcher, “Specifications ofa high-level conflict-free firewall policy language for multi-domain networks,” inSACMAT ’07: Proceedings of the 12th ACM symposium on Access control modelsand technologies. New York, NY, USA: ACM, 2007, pp. 185–194.
[41] S. Pozo, R. Ceballos, and R. M. Gasca, “Model-based development of firewallrule sets: Diagnosing model inconsistencies,” Information and Software Technol-ogy, vol. 51, no. 5, pp. 894–915, 2009.
[42] S. Pozo, A. J. Varela-Vaca, and R. M. Gasca, “Afpl2, an abstract language forfirewall acls with nat support,” International Conference on Dependability, pp.52–59, 2009.
[43] T. L. Hinrichs, N. S. Gude, M. Casado, J. C. Mitchell, and S. Shenker, “Practicaldeclarative network management,” in Proceedings of the 1st ACM workshop onResearch on enterprise networking, ser. WREN ’09. New York, NY, USA: ACM,2009, pp. 1–10.
64

[44] A. Bierman, K. Crozier, R. Enns, T. Goddard, E. Lear, P. Shafer, S. Waldbusser,and M. Wasserman, “Netconf configuration protocol (rfc 4741),” December2006. [Online]. Available: http://tools.ietf.org/html/rfc4741
[45] S. Halle, R. Deca, O. Cherkaoui, R. Villemaire, and D. Puche, “A formal valida-tion model for the netconf protocol,” 15th IFIP/IEEE International Workshop onDistributed Systems: Operations and Management (DSOM 2004), pp. 147–158,2004.
[46] M. Choi, H. Choi, J. Hong, H. Ju, and S. POSTECH, “Xml-based configurationmanagement for ip network devices,” Communications Magazine, IEEE, vol. 42,no. 7, pp. 84–91, 2004.
[47] Cisco Systems, “Network configuration protocol,” Jun 2009. [Online].Available: http://www.cisco.com/en/US/docs/ios/netmgmt/configuration/guide/nm_cns_netconf.pdf
[48] Juniper Networks, “Netconf api guide,” 2008. [Online]. Available: http://www.juniper.net/techpubs/software/junos/junos91/netconf-guide/netconf-guide.pdf
[49] G. Munz, A. Antony, F. Dressler, and G. Carle, “Using netconf for configuringmonitoring probes,” in IEEE/IFIP Network Operations & Management Sympo-sium (IEEE/IFIP NOMS 2006), Poster Session, Vancouver, Canada, Apr, 2006.
[50] S. Hazelhurst, A. Fatti, and A. Henwood, “Binary decision diagram representa-tions of firewall and router access lists,” University of the Witwatersrand, Johan-nesburg, South Africa, Tech. Rep. TR-Wits-CS-1998-3, 1998.
[51] T. Chomsiri, X. He, and P. Nanda, “Limitation of listed-rule firewall andthe design of tree-rule firewall,” in Proceedings of the 5th internationalconference on Internet and Distributed Computing Systems, ser. IDCS’12.Berlin, Heidelberg: Springer-Verlag, 2012, pp. 275–287. [Online]. Available:http://dx.doi.org/10.1007/978-3-642-34883-9_22
[52] S. Hazelhurst, A. Attar, and R. Sinnappan, “Algorithms for improvingthe dependability of firewall and filter rule lists,” in Proceedings ofthe 2000 International Conference on Dependable Systems and Networks(formerly FTCS-30 and DCCA-8), ser. DSN ’00. Washington, DC,USA: IEEE Computer Society, 2000, pp. 576–585. [Online]. Available:http://portal.acm.org/citation.cfm?id=647881.737947
[53] R. Oppliger, Internet and Intranet Security, ser. Artech House Computer SecuritySeries. Artech House, 2001.
[54] M. Gonçalves, Firewalls: a complete guide, ser. Standards and Protocols Series.McGraw-Hill, 2000, no. v. 1.
[55] L. Medina, The Weakest Security Link Series. iUniverse, 2003.
[56] A. Attar, “Performance characteristics of bdd-based packet filters,” University ofthe Witwatersrand, Johannesburg, South Africa, Tech. Rep. TR-Wits-CS-2002-2,2002.
[57] D. B. Chapman, “Network (in)security through ip packet filtering,” in Proceed-ings of the Third Usenix Unix Security Symposium, Baltimore, MD, September1992, pp. 63–76.
65
[58] P. Gupta and N. McKeown, “Packet classification on multiple fields,” SIGCOMMComput. Commun. Rev., vol. 29, no. 4, pp. 147–160, August 1999.
[59] V. Srinivasan, G. Varghese, S. Suri, and M. Waldvogel, “Fast and scalable layerfour switching,” SIGCOMM Comput. Commun. Rev., vol. 28, no. 4, pp. 191–202,October 1998.
[60] T. V. Lakshman and D. Stiliadis, “High-speed policy-based packet forwarding us-ing efficient multi-dimensional range matching,” SIGCOMM Comput. Commun.Rev., vol. 28, no. 4, pp. 203–214, October 1998.
[61] G. Cheung and S. McCanne, “Dynamic memory model based framework for opti-mization of ip address lookup algorithms,” in Proceedings of the Seventh AnnualInternational Conference on Network Protocols, ser. ICNP ’99. Washington,DC, USA: IEEE Computer Society, 1999, pp. 11–.
[62] J. Mogul, R. Rashid, and M. Accetta, “The packer filter: an efficient mechanismfor user-level network code,” SIGOPS Oper. Syst. Rev., vol. 21, no. 5, pp. 39–51,November 1987.
[63] D. Decasper, Z. Dittia, G. Parulkar, and B. Plattner, “Router plugins: a softwarearchitecture for next-generation routers,” IEEE/ACM Trans. Netw., vol. 8, no. 1,pp. 2–15, February 2000.
[64] E. Fredkin, “Trie memory,” Commun. ACM, vol. 3, no. 9, pp. 490–499, Sep.1960. [Online]. Available: http://doi.acm.org/10.1145/367390.367400
[65] E. Al-Shaer and H. Hamed, “Design and implementation of firewall policy advi-sor tools,” DePaul University, CTI Technical Report, Tech. Rep. CTI-TR-02-006,August 2002.
[66] ——, “Firewall policy advisor for anomaly discovery and rule editing,” in Inte-grated Network Management, 2003. IFIP/IEEE Eighth International Symposiumon, 2003, pp. 17 – 30.
[67] ——, “Discovery of policy anomalies in distributed firewalls,” in INFOCOM2004. Twenty-third AnnualJoint Conference of the IEEE Computer and Commu-nications Societies, vol. 4, 2004, pp. 2605 – 2616 vol.4.
[68] E. Al-Shaer, W. Marrero, A. El-Atawy, and K. ElBadawi, “Towards global verifi-cation and analysis of network access control configuration,” DePaul University,Chicago, IL, USA, Tech. Rep., 2008.
[69] L. Yuan, H. Chen, J. Mai, C.-N. Chuah, Z. Su, and P. Mohapatra, “Fireman: atoolkit for firewall modeling and analysis,” in Security and Privacy, 2006 IEEESymposium on, May 2006, pp. 15 pp. –213.
[70] A. Wool, “A quantitative study of firewall configuration errors,” Computer,vol. 37, no. 6, pp. 62–67, june 2004.
[71] D. Caldwell, A. Gilbert, J. Gottlieb, A. Greenberg, G. Hjalmtysson, and J. Rex-ford, “The cutting edge of ip router configuration,” in Proceedings of 2nd ACMWorkshop on Hot Topics in Networks (Hotnets-II), 2003.
[72] M. Zhang, R. Ranjan, S. Nepal, M. Menzel, and A. Haller, “A declarativerecommender system for cloud infrastructure services selection,” in Proceedingsof the 9th international conference on Economics of Grids, Clouds, Systems,
66
and Services, ser. GECON’12. Berlin, Heidelberg: Springer-Verlag, 2012, pp.102–113. [Online]. Available: http://dx.doi.org/10.1007/978-3-642-35194-5_8
[73] D. Caldwell, S. Lee, and Y. Mandelbaum, “Learning to talk cisco ios: Inferringthe ios command language from router configuration data,” AT&T, Tech. Rep.,2007.
[74] E. Al-Shaer, H. Hamed, R. Boutaba, and M. Hasan, “Conflict classificationand analysis of distributed firewall policies,” Selected Areas in Communications,IEEE Journal on, vol. 23, no. 10, pp. 2069 – 2084, 2005.
[75] E. Al-Shaer and H. Hamed, “Management and translation of filtering securitypolicies,” in 2003 IEEE International Conference on Communications. IEEEPress, 2003.
[76] A. Tongaonkar, N. Inamdar, and R. Sekar, “Inferring higher level policies fromfirewall rules,” in Proceedings of the 21st conference on Large InstallationSystem Administration Conference. Berkeley, CA, USA: USENIX Association,2007, pp. 2:1–2:10. [Online]. Available: http://portal.acm.org/citation.cfm?id=1349426.1349428
[77] M. Bishop and S. Peisert, “Your security policy is what,” University of Californiaat Davis, Tech. Rep., 2006.
[78] K. Golnabi, R. Min, L. Khan, and E. Al-Shaer, “Analysis of firewall policy rulesusing data mining techniques,” in Network Operations and Management Sympo-sium, 2006. NOMS 2006. 10th IEEE/IFIP, april 2006, pp. 305 –315.
[79] M. Abedin, S. Nessa, L. Khan, E. Al-Shaer, and M. Awad, “Analysis of firewallpolicy rules using traffic mining techniques,” International Journal of InternetProtocol Technology, vol. 5, pp. 3–22, April 2010.
[80] S. Hazelhurst, “Algorithms for analysing firewall and router access lists,” Univer-sity of the Witwatersrand, Johannesburg, South Africa, Tech. Rep. TR-WitsCS-1999-5, 2000.
67