evaluation of a gridded ionization chamber for of
TRANSCRIPT

- -AA5i 856 EVALUATION OF A GRIDDED IONIZATION CHAMBER FOR THE 1/1DETECTION OF RADIORCTI..(U) AIR FORCE INST OF TECHWRIGHT-PRTTERSON RF8 OH SCHOOL OF ENGI.. N R GIBBONS
UNCLASSIFIED MAR 84 RFIT/GNE/PH/84M-3 F/G 18/4 NL
'IIIIf IIIIlIIIII ffffffIfIIEEII//EI/EIIEEI I///IEEEI/EIhIII//llIlfl
III

1111112 L .2
136 -
LL
iiiiia Rim[,,,
1111IL25
MICROCOPY RESOLUTION TEST CHART
NATIONAL BUMEAU Of ',TNDAROS 1963 A
, ..._ " ...• ......., .., o , .., , . ... .,:.. . .. . . . . ... . . . . . . . . . . . . . . . . . . . . . . . . . . . . . . . . .".. . . . . . . . . . . . . . . . . . . . . . . ., *, .. *o .- .., . .*. . , , , , . ... .

EVALUATION OF A GRID1I2D IONIZATIONCHAMBER FOR THE DETECTION OF
RADIOACTIVE NOBLE GASES
TH~ESIS
Matthew R. GibbonsSecond Lieutenant, USAF
AFIT/GNE/PH/84M- 3
DPRMNOFTEAIR FORCE T I RARUNIVERSITY (ATC)
Wright-Patterson Air Force Base, Ohio
85 -3 13 10

- - - r rr-r ".
AFIT/GNE/PH/84M-3
40, EVALUATION OF A GRIDLED IONIZATIONCHAMBER FOR THE DETECTION OF
RADIOACTIVE NOBLE GASES
THESIS
Matthew R. GibbonsSecond Lieutenant, USAF
AFIT/GNE/PH/84M-3D r1GSTIDELECTEII :
-A 2 " M
Approved for public release; distribution unlimited
................................................
.-. ,-... . . . . .. . . . . . . . . . .
* *.**'..*-.*.*; * *-- *
:']:2>".i-) .:):i;:1'-. j)i2?:;:.:-.-i) )-.-:¢":' -;:1"i.:'i-:.:.- " .- '::-,i. 1.-K: -l"i-i-:'3-3 - "" ".,---i .-.. '-.."..*.

- . - - - ---. - .-
AFIT/GNE/PH/84M-3
EVALUATION OF A GRIDDED IONIZATION CHAMBER FOR THE
DETECTION OF RADIOACTIVE NOBLE GASES -"---
THESIS
Presented to the Faculty of the School of Engineering
of the Air Force Institute of Technology
Air University
In Partial Fulfillment of the
Requirements for the Degree of
Master of Science in Nuclear Engineering
Matthew R. Gibbons, B.S.
Second Lieutenant, USAF
March 1984
Approved for public release; distribution unlimited

-* * ..-.
Preface
The objective of this study was to evaluate the energy resolution
of a liquid noble gas gridded ionization chamber. The particular
application of the chamber was the differentiation of radioactive noble
gases. The gas samples are to be detected as sources inside the chamber.
The detector was tested with a number of radioactive sources
outside of the chamber and a number of sources inside the chamber. A
sample of radioactive xenon-131m and xenon-133 was used as the radioactive
noble gas.
Energy resolution in the chamber was not sufficient to differentiate
the xenon isotopes. The electric fields attainable in the chamber were
insufficient to overcome electron attachment effects.
I would like to thank my thesis advisor, Dr. George John, for his
help in this study and also his confidence in my work. Bob Hendricks
provided a great deal of help with equipment in the lab. I am also
indebted to the workers in the Fabrication Shop and Jim Ray who built
the chamber.
A Li
DTIC
INSPI-r * .
iii
_____________________________________________ :::: !j.

Table of Contents
Page
Pref ace . . . . . .* . .. .. .. .. .. .. .. .. . .
List of Figures . . .. .. .. .. .. .. .. .. .. ... v
List of Tables . .. .. .. .. . . . . . . .. .. .. .. . .vi
Abstract .. .... ........... .......... .. vii
I. Introduction . . .. .. .. .. .. .. .. .. . .. .1
Background .. .... .......... .......... 1Problem and Scope. ..... ...... .. .. . .. 2Approach . . . . . * . . . . .. . . . . 2Sequence of Presentation...............3
II. Theory . .. .. .. .. .. .. . ... .. .. .. .. .... 5
Ionizing Radiati ... .. .. .. ............ 5Pulse Formation. ..... .......... ...... 7Efficiency. .. ........ .......... .... 11Energy Resolution .... .. .. .. .. .. .. .. 17
III. ThefDetecting Gases and the Sources .. ......... ... 19 -
Xenon and Argon .. ............ . .. .. .. .. 19*Xenon-131u and Xenon-133 .. .... ............. 19*-Bismuth-207 .. ......... .... .. .. .. .. 23
Uranium-233 . .. .. .. .. .. .. .. .. .. .. .. 24The GamnmaRay Sources . . . . .. .. .. .. .. .. .. 25
IV. Equipment . . . . .. .. .. .. .. .. .. .. .. ... 26
The Detector...... ....... 26The Gas Handling ystem..................29
V. Pro~cedure . .. .. .. .. .. .. .. .. .. .. .. .... 32
Gas Purification . .. .. .. .. .. .. .. .. .. .. 32Sample Introduction .. ....... .. .. .. .. .. 33Data Collection . . . . . . . .. .. .. .. .. . .. 34

Page
VI. Results . . . . . . . * . . . . . . . . . . . . . * 35
Initial Considerations........... . 35The Exr ourcec..es... ........ 36Interior Sou ces.. .. .. .. .. .......... 43
*VII. Conclusions and Recommendations . . . . . . . . . . . . . . 51
Conclusions . . . . . .. .. .. .. .. . .. . . .. 51Recommendations .. ......... ........... 52
Bibliography .. .... .......... .............. 55
Appendix: Discharge in Gases .. ..... .......... .. 57
L1W ~ Vita.... .. .. .. .. .. .. .. .. .. .. .. .. .. ... 6o
~0
iv
List of Figures
Figure Page
1. The Simplified Ionization Chamber ............... 8
2. Electron Mobilities in Liquified Noble Gases .. ......... ... 10
3. Xenon-131m Decay Scheme . .. ................. 21
4. Xenon-133 Decay Scheme .... .................... 21
5. The Combined Spectrum of Xenon-131m and Xenon-133 . . . .... 21
6. The Bismuth-207 Decay Scheme..... . ..... ... . . 23
7. Bismuth-207 Energy Spectra . .. .................... . 24
8. The Ionization Chamber ....................... . 27
9. The Supporting Electronics for the Ionization Chamber . .... 29
10. The Gas Handling System ..... ..... .... .... 30
11. Americium-241 Electron Drift Velocity Study .......... 37
(@ 12. The Vray Sources Energy Spectra ................... 40
13. Pulse Height vs Electric Field (Co57) . . . . ......... 41
14. Pulse Height vs Electric Field (Bi2 .... ............ . 44
15. Fraction of Electrons Passed vs Ea/E. .... ............. ... 46
16. Decrease in Grid Voltage with -5.0 kV on the Cathode . . ... 47
17. The Uranium-233 4.82 Mev Alpha Peak .... ............ . 49
.b 18. The Xenon-131m and Xenon-133 Combined Spectrum .. ......... 50
19. A Liquid Noble Gas Proportional Counter ...... ... . . . 53
20. The Ionization Coefficient in Various Gases ... ........ . . 58
21. The Secondary Emission Coefficient ................. 58
22. Paschen Curves ..... .. ...................... . . . 58
v
"°- . .. . . . . . . .
: : .:- .

List of Tables
iTable Page
I. The aConstants for Oxygenlmpurities .. ......... .. 16
-II. Energy Resolution of a 1 MeV Particle in LA and Me .. .... 17
IIII. Some Physical Properties of Xenon and Argon . . . . . . . . 20
IV. Nuclear Decay Schemes of Xenon-131m and Xenon-133. ... ... 22
V. Uranium-233 and its Progeny. .... .......... ... 24
VI. The Efficiy nrcion act. ions. ... .. .. .. . .... 38
VII. The Yray Source Counting Rates. .. ... . . . .. . .. . .39
vi

AFIT/GNE/PH/84M-3
Abstract
This study investigates the feasibility of quantifying the constituents
of a radioactive noble gas sample with a liquid noble gas gridded
ionization chamber. Xe13 1m and Xe1 33 are the noble gases used to test
the chamber. Several other sources are used to characterize other
aspects of the chamber. The chamber is designed to hold the liquid noble
gas between the cathode and the grid while vapor remains between the anode
and the grid. Thus the ionization caused by the radioactive noble gas
B sample is confined for the most part between the grid and the cathode.
In this way position dependence of generated voltage pulse heights is
eliminated. The efficiencies found for the detector are high, but the
i energy resolution is only 40% fwhm. The poor resolution is due to
.*. limited electric fields in the chamber, 2.4 kV/cm. Discharge in the
vapor prevented higher electric fields in the chamber. Without good
energy resolution, ratios of radioactive noble gases in a sample can not
be found. Some possible solutions to the energy resolution problem are
presented.
vii
I. j
vii
"p - • "••- . " . - + . - . ' " . "- •"•"" - . •""" - -- - •' . - ' - "' - . ' "- " - ' - - - - "°• - .'. S . -- . . --
EVALUATION OF A GRIDDD IONIZATIONCHAMBER FOR THE DETECTION OFRADIOACTIVE NOBLE GASES
I Introduction
Background
Nuclear reactors, nuclear weapons, natural processes and other
phenomena can cause the release of radioactive noble gases into the
atmosphere. These gases can be separated from samples of air and analyzed.
The study of the quantities of these gases and the ratios of their
isotopes can help in the determination of their origin.
Previous studies have used scintillation counters and germanium
semi-conductor detectors. The scintillation counters prove to have high
efficiency since the gas can be dissolved into the scintillation liquid.
The problem with scintillation counters is their relatively poor resolu-
tion. The resolution of the germanium detectors is much better, but only
small gas samples may used with these detectors. Also low energy
photons are absorbed by the containers for the gas.
In an effort to obtain high efficiency and good resolution several
previous AFIT students have analyzed radionuclides of xenon with Si(Li)
detectors (1). Identification of the radionuclides under study was
possible, but a highly accurate quantitative analysis of the radionuclides
could not be made. The detection system suffered from low efficiency
and self-absorption of internal conversion electrons.
In order to overcome these problems a liquid noble gas ionization
chamber was constructed. This is a high efficiency detector since the
.............................. . .. .

radioactive noble gas sample can be mixed in with the detecting medium.
The detector should also have good resolution. The energy resolution
found by several researchers for the 976 keV internal conversionelectron peak of Bi207 is 34 keV fwhm (25:255). The energy resolution
is much better than the energy resolution of scintillation counters.
Two other AFIT students, Berggren and Benedetti, designed and
studied liquid noble gas ionization chambers. Berggren found that
pulse heights were dependent on the position of energy deposition in
the chamber (2). Also corona discharge tended to limit the maximum
obtainable detector bias. Benedetti constructed a parallel plate chamber
with a Frisch grid in order to remove the position dependence of the
pulse heights.
Problem and Scope
The objective of this thesis is to continue the study of the liquid
noble gas ionization chamber. The operating characteristics and the
energy resolution of the system are the major areas of concern. The
detector must have good resolution with a radioactive noble gas as an
internal source.
Xenon and argon are used as the detection media inside the chamber.
Samples of Xe13 1m and Xe13 3 serve as the noble gas radioisotopes.
Quantitative and qualitative differentiation of these isotopes is the
criterion for the successful operation of this detection system.
Approach
The research began with the construction of a new ionization
chamber. The chamber was made to increase the uniformity of the electric
field in the detection medium. The probability of corona discharge in
2
* . ... :
., _ . . .. . . .

the chamber was also reduced.
The chamber was then tested with a number of different sources
before the radioactive xenon was introduced. This was done to determine
whether the chamber was functioning properly since the radioactive xenon
sample was limited.
Gamma ray sources were placed external to the chamber. In this
way the operating characteristics could be roughly determined. Also
the sources could be removed so that the magnitude of the background
could be found.
Solid sources of Bi20 " and U2 33 were then placed inside the chamber
on the cathode. These gave data on the chamber response to internal
conversion electrons, beta particles and alpha particles. Since these
sources rested on the cathode, any complexities due to a source spread
throughout the detecting volume were eliminated.
Finally, the radioactive xenon samples were studied. During the
runs, liquid argon was used first as the detecting medium because of its
lower cost.
Sequence of Presentation
The theory of operation of a gridded ionization chamber is presented
in Chapter II. Recombination and electron attachment effects in such
a chamber are also discussed. Theoretical calculations for the chamber
efficiency are included as well.
Decay schemes of the radioactive sources are tabulated in Chapter
III. The schemes are abbreviated to include only those radiations which
- - are of interest to the study. This chapter also includes the physical
characteristics of the ionization chamber media.
... .

Chapter IV contains the detection system design, and Chapter V
lists the procedure for operation, of the system. The results obtained
are presented and discussed in Chapter VI. The conclusions and
recommendations of the study are in Chapter VII.
4
. . . .. . . .
.- .-

II Theoxy
An ionization chamber operates through the collection of electrons
and positive ions produced by the passage of radiation into the chamber.
Thus the effects caused by the radiation in the detecting material of
the chamber must be known. The determination of the number of charges
produced and the efficiency of collection of these charges must also
be understood. An estimate of the energy resolution of the detector
is presented for comparison with the actual resolution obtained.
Ionizing Radiation
Beta and Alpha Particles. Two types of charged particles emitted
by radioactive sources are beta and alpha particles. These charged
particles interact mainly through coulombic attraction and repulsion
with the electrons and nuclei of the neutral atoms in matter. The
interactions cause electrons to be stripped from the atoms.
The beta and alpha particles eventually come to rest after depositing
their kinetic energy in this manner. The result is a track of ion pairs.
The number of ion pairs formed depends on the initial energy of the
particle, and the average energy loss per ion pair formed. The average
energy lost is called the W value. The W values for liquid argon and
xenon are 23.6 eV and 15.8 eV respectively (25:257).
Photons. Gamma ray photons emitted by certain radionuclides also
interact with the detector medium. The gammas of interest in this study
are of lower energies (less than 0.2 MeV). Their main interaction
mechanisms are photoelectric absorption and Compton scattering.
In the photoelectric effect the photon transfers all of its energy
5
..: . .. ... .. . . . . . . . . . . . . . .. .. .2** ** -%
r
to an atom as a whole. This energy is then transfered to an electron.
Since the binding energy of the electron is usually negligible, most
of the energy transfered to the electron manifests itself as kinetic
energy. The electron then acts in the same manner as a beta particle
leaving a track of ion pairs. The number of ion pairs is basically
directly proportional to the initial photon energy.
In Compton scattering the photon interacts with an orbiting electron.
The electron is considered a free electron as long as the photon energy
is large compared to the electron binding energy. The interaction
results in a scattered photon and a recoil electron. The energy transfered
to the electron is less than that of the initial photon. The electron
again creates a track of ion pairs.
Ranges. The distance which a charged particle travels through a
material is its range. The range can be calculated from tables provided
(. by various sources (24:155). Since the purpose of the chamber is to
131m 133study the various electrons emitted by Xe and Xe1 , the range of
the most energetic of these electrons determines the size of the chamber.
The section on efficiency discusses this.
Absorption of Photons. Since the chamber is initially calibrated
with gamma emitting sources, the number of photons stopped in the chamber
must be known. This is given by the equation
N N exp(-(lA/p)px) (1)0
where
N is the initial number of photons entering the detector0
p/P is the mass attenuation coefficient in cm2/g
p is the density of the detector medium
6
...........................................

x is the distance traveled through the detector medium
The mass attenuation coefficients for the elements are tabulated
(21). The coefficients depend on the type of interaction and the energy
- . of the photon.
Pulse Formation
The Parallel Plate Chamber. One method of collecting the ion pairs
produced in the chamber is to use parallel conducting plates. With one
plate set at a negative potential and the other set at zero potential
an electric field is set up which causes the electrons and positive
ions to move toward the plates of opposite charge. The movement of the
charges causes a change in the potential of the anode. This change in
potential is measured as a voltage pulse.
The change in potential on the collecting electrode has been derived
by Knoll and others (17:176). It takes the form
O P(t) Net (w+ + w_)/Cd (2) -
where
N is the number of ion pairs
e is the electronic charge
t is the time
C is the capacitance of the system
d is the separation of the electrodes
w+,w are the velocities of the positive ions and electrons
The potential induced on the collector by the ion pairs from one
track must be removed after the ions reach the plates so that the
potential induced by subsequent ion tracks can be measured. The result
. is a voltage pulse indirectly caused by each particle of ionizing
radiation. Usually a preamplifier performs this task, but for illustra-
".7
..........................................- A .

+ .o a P(t) " C R V(t)+
Fig. 1. The Simplified Ionization Chamber
tive purposes a simple RC circuit is considered here.
Since the drift velocity of the massive positive ions is much less
than that of the electrons, the time constant of the RC circuit is set
at much less than the positive ion collecting time. Only the electrons
are collected by the time the voltage pulse decays. The chamber is -
ready to receive another pulse much sooner.
During the time that the electrons are collected, the positive ion
motion can be neglected. The time dependent potential simplifies to
P(t) -New t/Cd (3)
The following differential equation describes the potential, V(t),
which one finds on the output side of the RC circuit (26:93).
dP/dt dV/dt + V/RC (4)
S. For RC much less than one this becomes
dP/dt V V/RC (5)
~~~~~~~~~~. . . . .. . . . . . . . ..... .. ....-. _.--'--.-.... ...... . . ....--..

Thus the measured potential is
v(t) = -NewRC (1 - exp(-t/RC))/Cd (6)
After the electrons are collected the potential measured is
V(t) = -New R (exp(xo/RCw) - 1) exp(-t/RC)/d (7)
With all variables held constant except for N, the maximum ampli-
tude of the voltage pulse is proportional to the energy of the initial
ionizing particle. But this equation shows two important variables which
affect the maximum amplitude of the voltage pulse. The first is the
electron drift velocity. A larger drift velocity for a given plate
separation causes a larger voltage pulse.
The second variable is the initial ion pair location, x . The am-
plitudes of the voltage pulses are proportional to the energy of the
(.- initial radiation only if all of the ion pair tracks are formed in the
same location in the chamber. This is not a practical situation. Pro-
blems of this sort were reported by Berggren in previous work with the
liquid noble gas ionization chamber (2). The solution to this problem
is the Frisch grid.
Electron Drift Velocity. The main concern with the drift of the
electrons is to allow them to be collected before the decay of the vol-
tage pulse. By using larger and larger shaping times on the voltage pulse
a maximum amplitude can be reached. This represents the time needed to
collect the electrons. With the known separation of the plates the elec-
tron drift velocity is calculable. Others have calculated the drift
velocity of electrons in liquid noble gases. Some of their results are
shown in Figure 2.
9 J
* - * * - * . * * - . * *. . . . **.* . .**..*"

i l qAr(MaiI*.Naw* W Spewg)E " Liq Xe(Miir.Howeand Sper)E
a LqAr(NkiknLShutz) -
Z*1* At.* (0 *4) I
Electric Field Strength(Wcm)
Fig. 2. glectron ,iobilities in Liquified Noble Gases (25.4)
The Friscn Grid. A gria consisting of evenly spaced parallel wires
can eliminate the dependence of the voltage pulse amplitude on the posi-
tion of the initial ion pair track. A grid, inserted between the anode
and the cathode, was first suggested by 0. R. Frisch (5:192). if ion
pairs are created only between the cathode and the grid, the grid shielas
the collecting anode from the cnarges. The anode potential changes only
after the electrons move past the grid. The pulse heights are based on
the constant anod. to grid distance.
in an article by Bunemann tne dimensions of such gridded ionization
chambers are discussed (5). The dimensions are governed by the efficiency
of the shielding for the anode and the extent to which electrons are
allowed to pass the grid.
The shielding is measured b, the amount of change in the electric
field between the anode and the grid, E a given a cnange in the electric
field between the cathode and the grid, E. The ratio of these cnangesc
is defined as the inefficiency, a. The inefficiency is given by
- * - .. * * . . * . - . ... . . ..
0d ln(d/21rr)/2lrD(8
where
d is the distance between the center of the grid wires
r is the radius of the grid wires
D is the distance from the anode to the grida
In order to assure that the electrons are collected on the anode
and not on the grid, the cathode and the grid must be set at certain
voltages. Assuming that the anode is at ground, the following relation-
ship applies
D c Da (1 + 2-,r/d)(Vo - V )/(1 - Z r/d) V 9
where
D is the distance from the cathode to the grid
V is the potential on the cathodeC .
V is the potential on the grid
The Chamber. Since the radioactive xenon is diffused throughout
the detection medium, the ionization chamber must be specifically designed
to take advantage of the Frisch grid. This is accomplished by liquifying
the detecting noble gas only between the cathode and the grid. Vapor
remains between the grid and the anode. The ionization caused in the
vapor is negligible, and thus for all practical purposes ion pairs are
only created between the cathode and the grid.
Efficiency
The efficiency of a detector is calculated as the ratio of the
number of counts measured by the detector for radiation of a certain energy
over the actual number of particles emitted by the source of that energy.
The number of particles emitted is given by
11I

o - -. -, - - - - - - . - -. - - - - -o ,- r , . . .
Ni =fSt (10)I c
where
fi is the branching ratio for the ith particle emitted
S is the activity of the source
t is the time of the countC
The efficiency of the detector depends on a number of factors. In -,
this system the important factors include the geometry of the system,
the scattering of particles outside of the chamber, and the escape of
particles from the chamber. With these factors the number of counts mea-AA
sured can be estimated with the equation
C=f f N ( )g ab s i
where
f is a geometry factor
gf ab is the fraction of particles interacting outside of the chamber
f is the fraction of particles stopped in the chambers
Geometry. The position of the source in relation to the chamber
affects the number of ionizing particles emitted by the source which
reach the chamber. Since the chamber is designed to hold the source inter-
nally, the geometry factor is one.
Geometry must still be considered for the gamma sources which were
placed external to the chamber. The solid angle taken up by the surface
area of the detector determines the fraction of particles which are emitted
toward the detector. This fraction takes the form
fg
For a circular detector surface of radius r and a distance from source
1212" "
................... "..,...," .. .. .. . . . . . . . . . . . . . . . . . . . . . . . ..- . . . . . ...,°,,..°...o" " o, .. .-, . ...-.. ."..•
-.. - " .•.,, ,...-.°..-.. .

* - . -. -~- .-. * - ~ ..- r -'i
to detector of h, the fraction becomes
f (1 - h/(h2 + r2)1/2)/2 (13)
Scattering and Absorption. Particles emitted by the source may also
be scattered or absorbed by materials between the source and the detector.
This again only applies to sources outside of the detector. This fraction
takes the form
fab = exp(-(A/P)t x) (14)_j
where
(P/P)t is the total absorption coefficient for the material
p is the density of the intervening material
x is the thickness of the intervening material
This equation assumes that scattered photons will not enter the
detector.
Escape. For those particles which enter or are created in the detec-
tor, the number which are stopped in the chamber must be determined.
Photons again depend on the scattering and absorption cross sections.
The fraction stopped is given by the equation
f = 1 - exp(-(./p) x) (15)
where
(p/p) is the cross section for the interaction of interest
Charged particles have a certain range in the chamber. The fraction
of these particles which escape is determined by their range and their
distance from the edge of the chamber.
Sources spread throughout the volume of the chamber present a unique
13
-.. ""°-

situation. Those charged particles created in the volume bounded by the
chamber and a surface inside the chamber by a distance equal to the par-
ticle range are considered as capable of escape. In a cylindrical chamber
this volume is
AV= irrd - ,(r - R) 2 (d - 2R) (16)
where
r is the chamber radius
d is the chamber length
R is the particle range
A measure of the particles escaping is this volume divided by the
total chamber volume, V . This fraction may be further divided by fourC
since not all of the particles are emitted in the outward direction. The
fraction of particles stopped in the chamber thus becomes
ow( f5 1AV/4V (17
Recombination
Recombination can prevent the collection of the electrons and ion
pairs created by ionizing radiation. In a liquid noble gas chamber the
main types of recombination are electron attachment and initial recombi-
nation.
0 Electron attachment occurs because of electronegative impurities in
the detection medium. Once an electron attaches to a slow moving impurity
atom it can easily recombine with a positive ion. The attachment is
governed by the equation (15:153)
Q 2% (1- (A/D)(1 - exp(-D/A)))/D (18)
14
...................................

* . r - . - - ...
where
Q is the detected charge
Q is the maximum available charge
D is the ionization chamber plate separation
A is the mean free path length for electron attachment
The mean free path length for electron attachment is determined by
k =a /p (19)
where
E is the electric field
p is the impurity concentration
& is a proportionality constant
The values of , for oxygen impurities are given in Table I. The
effect of nitrogen impurities is 200 times less than the effect of oxygen
impurities.
j ~ Equation 19 does not fully quantify the situation for alpha parti-
cles. The high ion pair density in the initial track left by alpha
particles requires the consideration of columnar recombination as discussed
by Kramers (15:153). Here electrons can recombine with positive ions in -
the initial track before they drift away from the track. The expression
for alpha particles becomes
2fAQ (1- exp(-D/A))/Df x -1) + 1(20)00 f exp(x) + x (0
where
f = El (21)f 0
This does not consider the angle between the track and electric field
lines. The term E is the saturation field strength for the ion pair0
15
..- .

TABLE I
The a Constants for Oxygen Impurities
Ionizing a ppm cm2/kVParticle
LA LXe
alpha .14 + .03 ---
beta .15 + .03 0.2
(15:154, 3:39)
column. It is given by
0 = 4lr2eN/b (22)0
where
e is the electron charge
N is the charge density of the column
b is the diameter of the ionization column
The saturation field strength has been calculated to have a value
near 800 kV/cm (15:154).
Obviously, initial recombination affects the ion pairs in beta par-
ticle tracks, but its effect is of much less importance. Electron attach-
ment is the major concern in the energy resolution of the chamber. Ion
pairs formed in different parts of the chamber travel through different
amounts of liquid before reaching the grid. Since electron attachment
occurs throughout the volume of the chamber, it can cause a position
dependence for the magnitude of the voltage pulses. Such a dependence Iwould decrease the energy resolution of the chamber. Hoffman found a
saturation field of about 15 kV/cm for a chamber with an electrode sepa-
ration of 2 mm (15:151). Oxygen impurities were less than 1 ppm, and
nitrogen impurities were less than 4 ppm.
'F 16
S _.. .... ....... ....... ..... .. . . . . ..

TABLE II
Energy Resolution of 1 MeVParticle in LA and LXe
Liquid F E (keV) E. (keV) Et (keV)n i •
A 0.116 3.57 3.88 5.27
Xe 0.059 2.36 2.25 3.26
(8:356-357)
Energy Resolution
The ultimate energy resolution in the ionization chamber is expressed
by the full width at half maximum (fwhm) of a peak in the energy spectrum.
It is calculated from the formula
Et = (En2 + E'2)1/2 (23)t n 1
where
E is the contribution from electronic noisenE. is caused by fluctuations in the initial number of ion pairs
The contribution from the fluctuation in the number of ion pairs
when a particle with energy E0 deposits all of its energy is
E. = 2.36 (EoFW)1/2 (24)1
where
E is the energy of the initial particle0
F is the Fano factor
W is the average energy required to form an ion pair
The Fano factors and the energy resolutions for a 1 MeV particle are
given in Table II. The Fano factor is an experimentally determined value
which quantifies the departure of the observed statistical fluctuations
17
.'i. -. .. ..- .. ... .""" ' " " "** "". "".- "" 4' .' " "".. ; .'. '".." •. .,.i, ""''''.,.-..i.. ~ ..

in the number of ion pairs from pure Poisson statistics (17392). The
electronic noise factors were estimated for systems using low temperature
FETs.
The values indicate an energy resolution near that of semiconductor
detectors. In practice such resolutions have not been achieved. The
resolution for a 1 MeV particle has been near 34 keV fwhm. As reported
by Edmiston, the resolution of the detectors appears to be limited by the
electronics and the geometry (9:353). Still the achieved resolutions are
much better than those of liquid scintillators.
18.
181
.................................................................................................

III The Detecting Gases and the Sources
The physical characteristics of the detecting gases determine the
operating conditions of the chamber. The various sources meanwhile test
different aspects of the chamber. In this chapter some of the properties
of argon and xenon are presented along with decay data on the sources
studied.
Xenon and Argon
Both xenon and argon are noble gases. They are essentially chemically
inert. They are ideal as ionization chamber media since they do not
undergo electron attachment.
Argon makes up almost 1% of the earth's atmosphere while xenon is
the rarest of the stable elements (13). Xenon has an estimated abundance
of 2.9 x 10⁻⁹% of the earth's crust. Both of these elements can be ob-
(- tained in commercially purified samples. The gas used in the laboratory
is 99.999% pure. Table III lists some of the properties of xenon and
argon.
The greater atomic mass and density of xenon allow it to stop
ionizing particles and photons more easily than argon. Thus the volume
of a chamber utilizing xenon may be less than that of a chamber utilizing
argon. Yet the greater density of xenon may also cause an increase of
recombination. Thus both elements have favorable and unfavorable
characteristics.
Xenon-131m and Xenon-133
Both Xe13 3 and Xe13 1m are produced in fission reactions along with
a number of other noble gas radioisotopes. After three days these two
isotopes and Kr 8 5 are the only major radioisotopes remaining (6:76). The
19
. .- . . .. .. . .

TABLE III
Some Physical Properties of Xenon and Argon
Properties Xenon Argon
Triple Point
Temperature (K) 161.391 83.806Pressure (Torr) 612.2 517.1Density
Solid (g/cc) 3.54 1.622Liquid (g/cc) 3.076 1.414Gas (mg/cc) 8.18 4.05
Liquid
Boiling Point (K) 165.03 87.27Density at BP (g/cc) 2.987 1.3998
Atomic Mass 131.30 39.948
(12,111)
other noble gas isotopes have decayed or had extremely small abundances
initially. Therefore, the study of these two xenon isotopes is reasonable
if one wishes to obtain additional data on a fission reaction from air
samples.
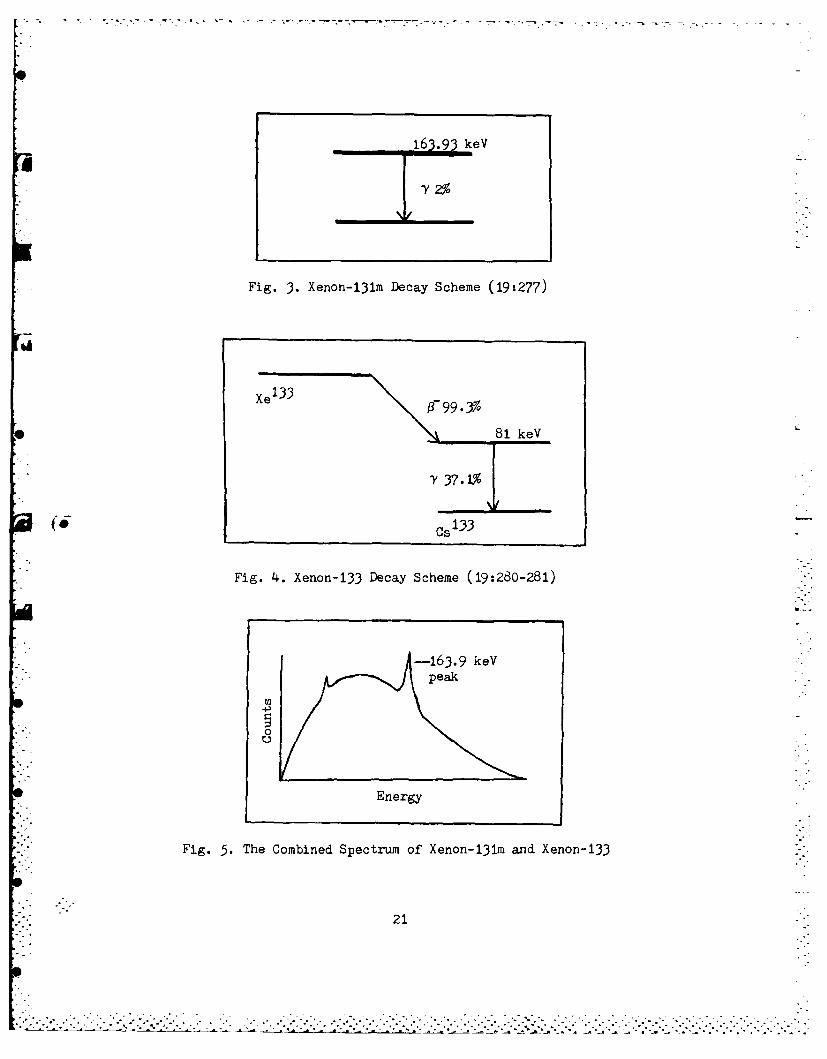
Xe13 1m exists in an excited state 163.93 keV above the ground state.
It has a half-life of 11.8 days and decays mainly through an internal
conversion electron.
133 133. t aflf s52 asXe decays by beta emission to Cs1 . Its half-life is 5.27 days.
Almost all of these decays leave the cesium in an excited state 81 keV
above the ground state. The excited state decays in 6.3 x 10⁻⁹ s.
Detailed nuclear decay scheme data for Xe13 1m and Xe13 3 are listed
in Table IV. The combined spectrum of the two radioisotopes should ideally
resemble Figure 5. The counts in the beta spectrum and under the 164 keV
peak can be compared to obtain the ratio between the two isotopes.
20
~~~~~~~~~~~~~~~~~~~.-.,..o-.... .... . . ... .. ......... ... .. o". o. .. ... -°
... .... ,. %.i• .. • . ° ° - .o ° o• • o •. ," ° " • - • o. ,.AAo • . . . ••A
S16393 keV
Fig. 3. Xenon-131m Decay Scheme (19:277)
Xe133 7-99.3%
\\L91 81 keV
37.1%"
Cs 13 3
Fig. 4. Xenon-133 Decay Scheme (19:280-281)
!:". -163.9 keV
0
Energy
Fig. 5. The Combined Spectrum of Xenon-131m and Xenon-133
21
'.- .. .
• - ° ", .-
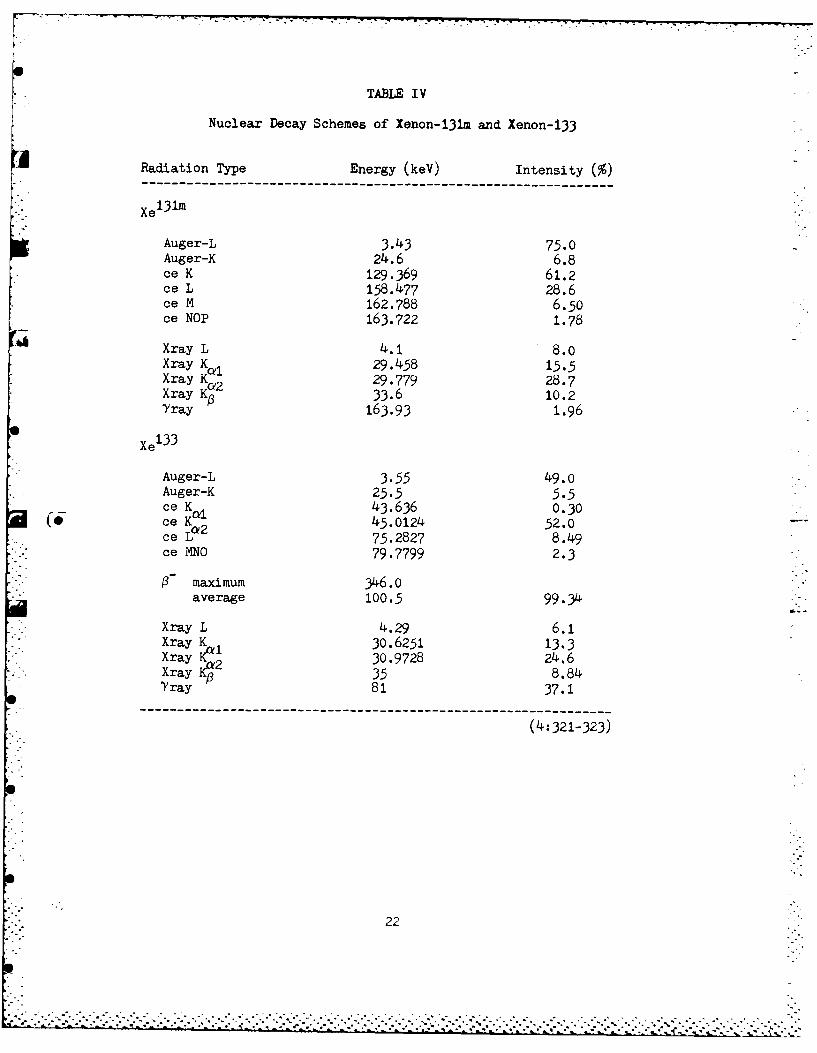
TABLE IV
Nuclear Decay Schemes of Xenon-131m and Xenon-133
Radiation Type Energy (keV) Intensity (%)
---------------------------------------------xel3 1m
Auger-L 3.43 75.0Auger-K 24.6 6.8ce K 129.369 61.2ce L 158.477 28.6ce M 162.788 6.50ce NOP 163.722 1.78
Xray L 4.1 8.0Xray K a 29.458 15.5Xray Ka 29.779 28.7Xray K 2 33.6 10.2Yray 163.93 1.96
Xe133
Auger-L 3.55 49.0Auger-K 25.5 5.5ce K 43.636 0.30ce Kai 45.0124 52.0ce 212 75.2827 8.49
ce MNO 79.7799 2.3
(3 maximum 346.0average 100.5 99.34
Xray L 4.29 6.1Xray K 30.6251 13.3Xray 30.9728 24.6Xray 35 8.84Tray 81 37.1
--------------------------------------------------(4:321-323)
22
..-. . ... - . . . . . . .
. + ' . , . . -..l~ . " - .. -. - -+ - . ' ,i' - . " . -° " + ++ . . . . .' ° " .° ' - "_ . "X. . + - + " . " • . . - - + ° .. . . . . . .
,.,i + " . .,+ ° , '.' . .' + + - + - + + - . + . " ' , + ,,q . .' . ,' . . ' "+ '. ". ,. '. m m % .. .o o . +- • . ,-.. .- - 5. . .'.
h.o.
Pb207
9%ism/"Bh2070:
2.3393 MeV . 5 a 1
Th nr io am asoe two an'hrear .79 iI
1.633 MeV
T /.5069el6 MeV te
220 7
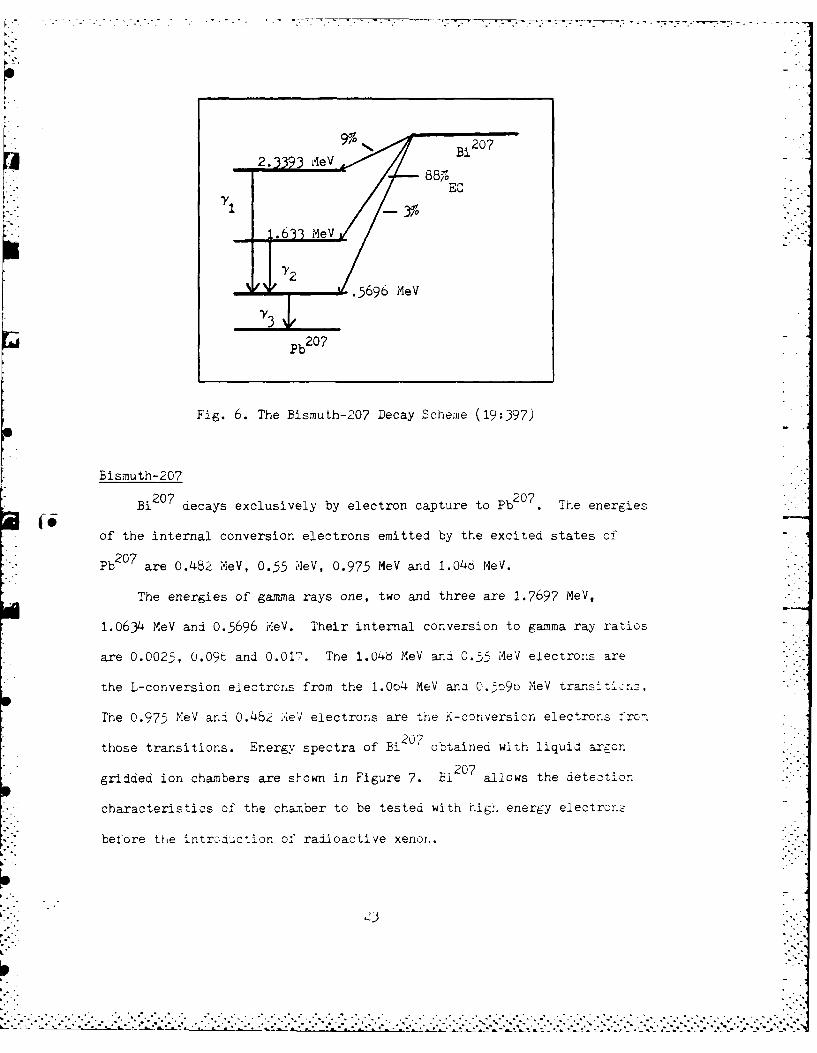
Fig. 6. The Bismuth-207 Decay Scheme (19:397)
Bismuth-207
Bi decays exclusively by electron capture to Pbws The energies
of the internal conversion electrons emitted by the excited states of
Pb 2 0 7 are 0.482 MeV, 0.55 AeV, 0.975 MeV and 1.040 MeV.
The energies of gmma rays one, two and three are 1.7697 MeV,
1.0634 MeV and 0.5696 MeV. Their internal conversion to gamma ray ratios
are 0.0025, 009r' and 0.01. The 1.04b MeV and 0.55 MeV electrons are ].
he L-conversion electrons from the 1.0o4 MeV ana 0.5o9b MeV trans--' T .1' z
The 0.975 MeV and 0.462 'iel electrons are the K-conversin electrons fro.-.
those transitions. Energy spectra of Ei20 ob-tained with liquid argon.)
gridded ion chambers are shown in Figure 7. Ei 27allows the detection -
characteristics of the chaber to be tested with high energy electrcr.Z
before thie introdaiction of rad~ioactive xenor,..
U " I S -- -- S I I I -
- r-Liq Ar (purified) 0976MeV300 E 158KV/cmi
3200 0481/eV
-- j Liq Ar+XeIO?%)
I 300 158KV/cm .
200 - 04aMV"}\-foo(16:o6) o
s 00 I.o2(Y-Relative Pulse Height
(25:255)Electric Field 3.5 kv/on 1.5o ,-V/cmEiectroide Separation 14.o mm
Fig. 7. Bismuth-207 Energy Spectra
Uranium-2 33U233 sa lh atce "U2 3 is an alpha particle ?mnitter. A few of its progeny and iheir
4 emissions are listed in Tatle /. zecause of the long nalf-iife cf Tnorium,
the progen.y cf U2 3- will Io: ye- be in secular equilibrium. This source
allows data collection -r- ;.,e onamber response to the 4.bL AeV alp"'as of
'ABL - V
Urani -:-.J3 and its Progeny
7 sotope Radiation Energy (,,eV) Half-life
U2 3 3 o .2 1.59 x
Th22 9 ( 4.t4 7340 yr
Ra 225 0.35 14. d
Ac 2 o 5.824 i0.0 d221•
Fr o.34 4.0 m
24**. ........... -*.... . . .-. .. . . . . .. .. .* .*.*. . .*.*.*... . . . *. . . .. .*]
The Gamma Ray Sources
241 19 57 241The gamma ray sources are Am2 4 1 , Cd1 , and Co5 7 . Am is used as
a gamma ray source exterior to the chamber. It decays by alpha emission
to Np2 3 7 . Most of the decays (86%) leave the Np2 3 7 in an excited state
59.54 keV above the ground state. The Cd10 9 source emits an 88.03 keV
gamma with a branching ratio of 0.361. Finally, the Co5 7 source emits
two gamma rays of interest. They are 122 keV with a branching ratio of
0.8559 and 136 keV with a branching ratio of 0.1061. The other photons
emitted by these sources are either too energetic to be stopped by the
chamber or too weak to penetrate to the chamber.
25.
25 "
......................................................-: '. "° :° ": " " " " . ": % " 2 ° - 2; .° .... '. ". ", ' n ." " -° . " " •2" *2 '° "' "' " / " .' : ". '-. 2" . . . " "i .2 i .2. "2 2".< ,°'.2 *." '*2;' - " *°'-. ° - 2 " ' " J "i,

IV Equipment
The detection system consists of two main parts. The first is the
ionization chamber and its supporting electronics. The second is the gas
handling system which supplies the purified noble gas to the chamber.
This chapter describes these subsystems.
The Detector
The Chamber. The chamber itself is constructed from a Varian glass
adaptor. A 1.5 in. kovar tube is attached to a 2.75 in. ConFlat flange.
A 7052 glass tube is sealed to the kovar. The tube is reduced in size to
form a short cylinder about 1.6 cm in diameter and 1.2 cm in length. The
bottom of the cylinder is sealed to a kovar disk. The disk provides a
cathode for the chamber.
Above the cylinder a kovar rod extends through the side of the chain-
ber. The wire grid rests on a nickel tab connected to the rod. The rod
itself is connected to a high voltage lead exterior to the chamber. The
chamber is shown in Figure 8.
The chamber flange is bolted to a 6 in. blank ConFlat flange. This
flange is supported by two 0.75 in. stainless steel tubes which also act
as an inlet and outlet for liquid nitrogen. The blank flange has high
voltage feedthroughs for the cathode and grid. It has insulated feed-
throughs for thermocouple wires. The thermocouvle wires are pressed
against the kovar tube by 5 mil kovar wire which is wrapped around the
tube. The flange also has a tube extending into the chamber. This tube
provides an inlet for the detecting gas.
A 2.75 in. miniflange bolted to the top of the blank flange has an
26
I ""' ""
. . .* ...*-. . ..-- .- -.- .'•. , .C . i , - ) -' : ) i . "- - .' ( ' ] - .- " . -.. *, - " '. *, -.' , ' '..- .- '( , -] - , .. -.' ) . ....• .

Anode RodLN Inlet LN Outlet
2 2
tor Detecting GasConnet r -- XInlet
~~1~~1-4
Gri Rin I
Ceramococpl
1-. 5 in4 .0Oin _______
Fig. 8. The Ionization Chamber
27
. . .

insulated 0.25 in. copper rod which extends into the chamber. A copper
plate with a threaded stem screws into the rod. The plate acts as the
anode. The threaded stem allows variation of the grid to anode separa-
tion. The end of the copper rod is soldered to a wire which leads to a
feedthrough for connection of a preamplifier.
The wire grid is a 0.125 in. by 0.125 in. stainless steel ring with
an outer diameter of 1.25 in. The 2 mil stainless steel wires are soldered
to the ring. Their separation center to center is 0.015 in. In order
A to decrease the cathode to grid separation a copper cylinder was placed
in the bottom cylinder of the chamber. The grid to cathode distance with
the copper cylinder is 0.7 cm. The grid to anode distance is 0.55 cm.
These dimensions impose a ratio of the allowed electric fields. The ratio
of the cathode to grid e'.ectric field to the grid to anode electric field
is 0.409.
* (j Resting on top of the grid ring is a ceramic cylinder. A 0.75 in.
hole runs down the center of the cylinder allowing the anode to pass
through. The ceramic helps shield the anode from the sharp edges of the
grid ring. The sharp edges may act as potential discharge points.
Surrounding the whole chamber is a stainless steel bucket. This
bucket is welded to a ConFlat flange which is bolted to the blank flange.
The bucket provides a container for the liquid nitrogen used to cool the
chamber. The whole assembly rests in an outer bucket which is evacuated.
The vacuum provides insulation for the liquid nitrogen bucket.
The Electronics. The charge collected at the anode is converted into
a voltage pulse by an Ortec 142-B preamplifier. Originally an Ortec 120-5
preamplifier with cooled FET was to be used, but the preamp was defective.
The signal from the preamplifier is further modified by a Canberra Model
28
-- 7!

LieaDetector S i c s ho aAnode
Oscilloscope
Counter/ SC CTimer SA --- C
2020 linear amplifier. These signals are viewed on an oscilloscope.
Pulse height spectra are obtained through the use of a Nuclear Data multi-
channel analyzer. A single channel analyzer and a counter/timer can re-
place the MCA in order to provide counts for specific areas of the spec-
trum.
High voltage power supplies set the grid and cathode at their nega- -
tive potentials. Noise is reduced by Ortec Model 119 high voltage filters.
II
The Gas Handling System
I
The gas handling system is diagrammed in Figure 10. The upper sys-
- tem provides access to the gases used in the chamber. The purification
II
furnace leads to the chamber itself. The outer bucket provides extra
volume for gas storage and connects to the vacuum pumps.
The Purification Furnace. The purification furnace is a quartz tube
29

-4
VI
-~ L4

filled with turnings of titanium and zirconium. When heated to 1000 C
these metals act as getters of nitrogen and oxygen. Plugs of fine copper
turnings at both ends of the tube keep the titanium and zirconium in
place (11). Dysprosium, which was also placed in the tube in the begin-
ning, has a vapor pressure six orders of magnitude greater than the other
metals. Signals were not observed from the chamber until after the dys-
prosium had been removed from the purification furnace.
One end of the tube is sealed to the noble gas inlet of the ioniza-
tion chamber. The other end of the furnace is sealed to a glass adaptor.
The glass adaptor is bolted to a metal "T". The "T" leads to a cold
finger and valve number three. Valve three allows gas into the furnace.
The Upper System. The upper system provides a known volume for gas
storage and a number of valves for gas entry. Valves 1 and 4 allow argon
and xenon to enter the system from storage bottles. Valve 2 is fitted
0 with an o-ring seal. A breakseal tube filled with a radioactive xenon
sample is connected to the system here. Valve 5 connects the upper sys-
tem to the outer bucket. A transducer gage permits pressure readings
from 0 to 25 psi.
The Outer Bucket. The outer bucket can be evacuated as noted pre-
viously. Valve 6 leads to the vacuum system. The vacuum system consists
of a roughing pump and a diffusion pump with a cold trap. A Penning Type
vacuum gage is positioned in front of valve 6. The outer bucket can also
be used as a large volume for gas storage.
31
|...................................................

* - .. _- .-- _.
V Procedure
Gas Purification
The first step in the operation of the detector involves the puri-
fication of the noble gas to be used as the detection medium. The system
is prepared by allowing the diffusion pump to evacuate it overnight. The
vacuum obtained is less than 10-6 Torr. The system is then flushed with
argon four times. The process is accomplished by injecting 99.999% pure
argon into the system to a pressure of approximately 100 mm Hg. The
system is evacuated, and the process is repeated.
After the argon flush the detecting gas is introduced into the sys-
tem. The gas is injected into the outer bucket and the upper system at
a pressure which allows enough gas to eventually enter the chamber. When
the chamber is cooled, 2.5 ml of liquid must exist in the bottom of the
chamber. Also enough gas must be present to allow the vapor pressure of
the liquid to exist in the rest of the system.
The gas is brought into the purification furnace by condensing it
in the cold finger. A dewar filled with liquid nitrogen is slowly raised
around the cold finger. The valve to the outer bucket is then closed,
and the furnace is heated to 1000 C.
After the outer bucket is evacuated, liquid nitrogen is injected
into the bucket surrounding the chamber. As the chamber cools, the dewar
surrounding the cold finger is lowered. The solidified gas in the cold
finger boils off and diffuses through the furnace. This process is re-
versed and repeated two more times.
With the chamber cool and the cold finger warm, the furnace is turned 132

off, and the chamber is allowed to warm to the correct temperature. The
correct temperature is 83 K for argon and 163 K for xenon. The temper-
ature of the liquid is monitored by its vapor pressure. The transducer
gage in the upper system is used for pressure readings. The purification
process lasts an average of ii hours.
Sample Introduction
The different sources under study were prepared for detection by the
chamber in different manners.
Gamma Ray Exterior Sources. The gamma ray sources are encased in
containers which preclude placing the sources inside the chamber. Also
internal placement would not facilitate the observation of a number of
different sources during one run. Therefore, the gamma ray sources are
fixed to the side of the outer bucket during runs. Since the gamma photons
penetrate through materials relatively well, a reasonable number of the
(5 photons still reach the detector. Calculations of the number of photons
stopped in the detector are presented in Chapter VI.
207Solid Interior Sources. The Bi used is plated onto the end of a
small threaded metal cylinder. The copper cylinder, used in the chamber,
was tapped in the center to accommodate the Bi20 7 source. The Bi20 7
rested in line with the surface of the copper cylinder. The copper cy-
linder was replaced in the chamber before the beginning of the purifica-
tion process.
233The U source is plated on a small metal punch 3 mm in diameter.
Before a run the U2 3 3 was simply placed on top of the copper cylinder in
the chamber.
Xenon-133 and Xenon-131m. An untapped copper cylinder was placed
in the chamber for radioactive xenon detection. The xenon was introduced
33
, * . ............. ..°. ,....-,.......... . ,......•..., °q .°,-. .° . . .

into the system through the use of a breakseal tube. After the detection
gas had been solidified in the cold finger, the breakseal was broken to
allow the xenon into the system. Thus any impurities in the xenon sample
would also be removed during purification.
Data Collection
With the gas purified and the source prepared, data collection can
begin. The cathode and the grid are set at their specified potentials.
The pulses from the amplifiers are analyzed. Adjustments of the gain,
shaping time, or chamber potentials may be required before the signals
are routed to the multi-channel analyzer.
The counting is limited since the detecting gas continually warms,
and the pressure in the system rises. A rise in pressure indicates less
liquid in the detecting volume of the chamber. Also high enough internal
pressures can damage the glass chamber. Thus another injection of liquid
(. nitrogen is necessary to recool the chamber. The chamber must warm again
to the correct temperature before further data can be collected. After
data collection is complete, the valve to the outer bucket is opened to
allow expansion of the gas.
34

VI Results
The data from the various sources is presented in two subsections
one for the exterior sources and one for the interior sources. Some ini-
tial considerations about maximum pulse heights, xenon detecting gas and
background noise are presented first.
Initial Considerations
The maximum pulse heights for particles of a certain energy are es-
timated from the conversion gain of the preamplifier. The output from
the preamplifier is 20 mV for a 1 MeV particle in silicon. The W value
used is 3.6 eV/ip so 20 mV is generated from 277,777 ion pairs. A 1 KeV
particle in argon produces 42,373 ion pairs. This would result in a
3.05 mV pulse from the preamplifier. Similar calculations are carried
out for particles of different energies.
e' After initial results were obtained with argon and the exterior
- . sources, xenon was introduced as the detecting gas. No significant results
were obtained with xenon in four runs. It is assumed that the higher
density of xenon increased recombination effects. Although signals may
have been detected for the higher energy electrons of Bi 2 07 it was decided
to stay with argon. The energy of the radioactive xenon emissions are
207not as high energy as those of Bi2 , and xenon isotope detection is the
main purpose of the chamber.
The background observed without sources present was negligible. It
was less than one count per second as long as the voltage was kept below
the discharge point. Noise was still observed at the low energy end of
some of the spectra. The ions diffusing through the gas may have acted
35

to induce some small discharges. Magnitudes of breakdown voltages in the
gas are calculated in the appendix. Discharges did appear for electric
fields in the gas between 4.0 kV/cm and 6.0 kV/cm.
The Exterior Sources
241Electron Mobility. The Am source displayed the most distinguish-
able peak of the exterior sources. This occurred because of its high
activity. Also the detector has a relatively high efficiency for the
59.96 keV gammas emitted by the source.
Am24 1 provided electron mobility data in liquid argon. The pulse
241height spectra of Am for a grid to cathode electric field of 2.447 kV/cm
are shown in Figure 11. The different spectra illustrate the effect of
different linear amplifier shaping times on the magnitude of the voltage
pulses. The pulse heights are maximized with a shaping time of 6 ws.
The peak of the pulse heights with a 6 ps shaping time represents an
electron collection time of 6 ps. The electrons pass through 0.7 cm of
liquid argon and 0.55 cm of gaseous argon. The transit time through the
6gas is 0.13 Ps given a drift velocity of 4.2 x 10 cm/s (24:59). The
electron drift time in the liquid is thus 5.87 Ps implying a drift velo-
city of 1.2 x 105 cm/s. The value reported by Shibamura at this electric
field is approximately 2.5 x 105 cm/s (25:254).
Activity. Theoretical count rates reported by the detector for the
different sources have been calculated and compared to the actual measured
counts. The sources are placed on the side of the outer bucket 10.2 cm
from the chamber in line with the chamber bottom. The cross sectional
area of the chamber is 1.4 cm2. For the purpose of calculating the geo-
metry fraction, the area is considered to be a circle. With these values
the geometry fraction, fg, is 1.08 x 10⁻³
S9 36.. .. "

00
0
W1 6 .
4 .0 + -I4-)-sz0*S
Enrg
Energy
-21Eeto0oftVlct td
Fi. Aercu
S3

TABLE VI
The Efficiency Fractions
Source Photon f f fbEnergy keV ab Photons Electrons
241Am 59.96 0.0422 0.530 0.994 0.359
Cd109 88.03 0.278 0.200 0.991 0.0361
Co5? 123.0 0.478 0.0913 0.990 0.962
The scattering and absorption of photons before they reach the cham-
ber must be considered for a 0.34 cm thickness of stainless steel. The
calculated absorption fractions are listed in Table VI. These were cal-
culated using the mass attenuation coefficients of iron.
The fraction of photons stopped by 1.6 cm of argon then affects the
intrinsic efficiency of the detector. Since the photons are stopped
throughout the volume of the chamber, the fraction of scattered elections
which are subsequently stopped must also be considered. The last column
in the table lists the branching fractions of the radionuclides for the
photons which are detected by the chamber. The listing for Co5 7 is an
average of the 122 keV and 136 keV photons.
In Table VII the theoretical number of photons which reach the
chamber, the theoretical number of photons stopped in the chamber, and
the actual measured number of counts are listed. The intrinsic efficien-
cies of the chamber for the photons of energies from 60 keV to 136 keV
range from 70% to 7.2%.
The measured counting rates differ from the theoretical values by
20% to 30%. Because of the assumptions in the theoretical values, these
percentages are reasonable. The photopeaks observed were also partially
38
. .,
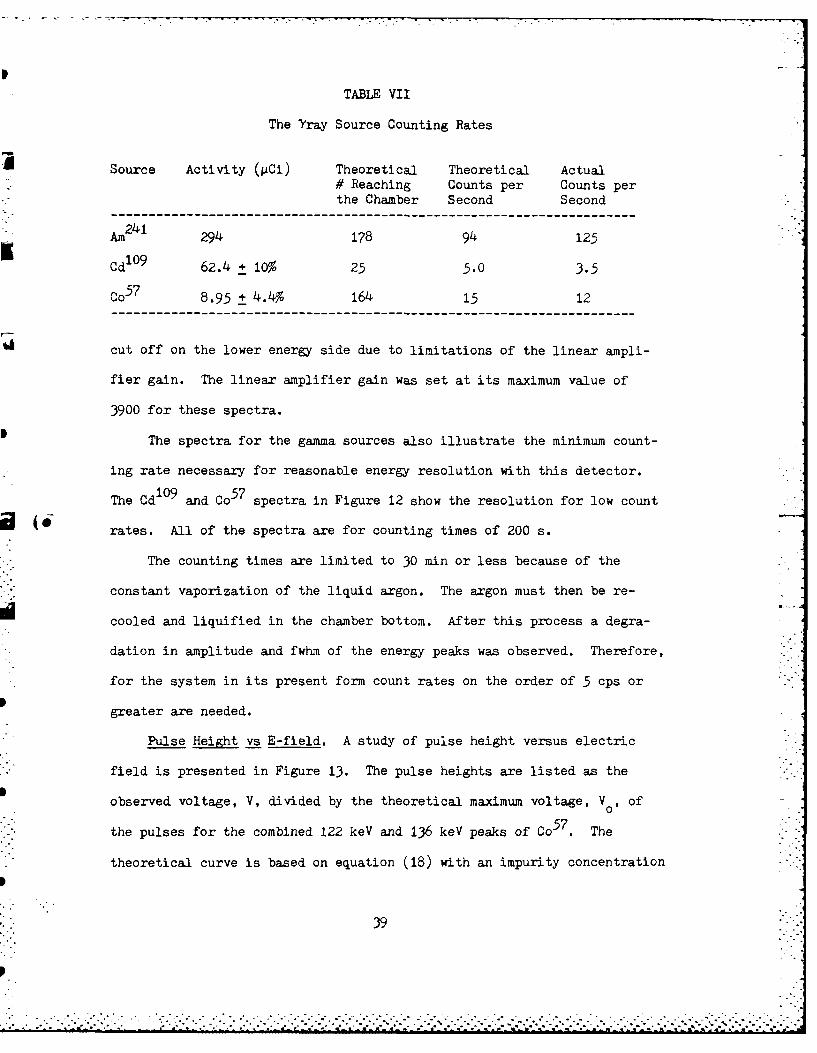
TABLE VII
The Vray Source Counting Rates
Source Activity (PCi) Theoretical Theoretical Actual# Reaching Counts per Counts perthe Chamber Second Second
Am241 294 178 94 125
Cd 62.4 + 10% 25 5.0 3.5
Co5 7 8.95 + 4.4% 164 15 12
cut off on the lower energy side due to limitations of the linear ampli-
fier gain. The linear amplifier gain was set at its maximum value of
3900 for these spectra.
0 The spectra for the gamma sources also illustrate the minimum count-
ing rate necessary for reasonable energy resolution with this detector.
The Cd1 0 9 and Co5 7 spectra in Figure 12 show the resolution for low count
0 rates. All of the spectra are for counting times of 200 s.
The counting times are limited to 30 min or less because of the
constant vaporization of the liquid argon. The argon must then be re-
cooled and liquified in the chamber bottom. After this process a degra-
dation in amplitude and fwhm of the energy peaks was observed. Therefore,
for the system in its present form count rates on the order of 5 cps or
greater are needed.
Pulse Height vs E-field. A study of pulse height versus electric
field is presented in Figure 13. The pulse heights are listed as the
observed voltage, V, divided by the theoretical maximum voltage, Vo, of
the pulses for the combined 122 keV and 136 keV peaks of Co5 7. The
theoretical curve is based on equation (18) with an impurity concentration
39
.op
* *. .*.* . . . . . .. . . . . . ... * . .... .*

500- Arn24 1 50- log0
400- 40_
u2300 rn 30-)l
0 00 2 0 0 -S ~ 20 0
100- 4100*
6o 88 123 60 88 123
Energy (keV) Energy (keV)
50
400
%]
*" 0
D' 30 00..
0 *
20 **~ . p
10
0 _ -,
I o
6o 88 123Energy (kek)
Fig. 12. The Tray Sources Energy Spectra
40
-A

0
00
> LO
o esue
0hoeia
0 m
-- -- - -. . .
190 20 10 200 20n40 20
Elct i Fil V'm
Fi.1.PleHih eEeti il CI7
41 esue

of 0.8 ppm calculated from the V/V0 value at an electric field of
2.153 kV/cm.
The greater slope of the measured curve may be due to uncertainties
57in the magnitude of the peaks measured for Co . The number of counts
recorded was low, and the peaks were not far above the noise level in
the system.
Resolution. The energy resolution of the Am24 1 peak is 29 keV for
the 59.9 keV peak. The full width at half maximum of a test pulse set to
a corresponding voltage is 11.5 keV. The energy resolution for the argon
without noise can be approximated by
fwhmA = (fwhmt2 - fwhm 2)1/2 (25)
where
fwhmt is the total resolution
fwhm is the test pulse resolution
The measured resolution for liquid argon is thus 27 keV fwhm or 45%
for a 60 keV peak. This resolution is not good enough to make this system
a useful substitute for liquid scintillators.
42

Interior Sources
Bismuth-207. The high energy internal conversion electrons of Bi20 7
allowed a study of chamber characteristics further above the background
noise inherent in the system. The activity of this source is 0.227 PCi
as determined with a Ge(Li) detector. The branching fraction for the
1.064 MeV transition is 0.88. This is further modified by an internalI1conversion electron to gamma ratio of 0.115. The geometry factor with
the Bi2 07 on the cathode is 0.5. Since the range of the electrons is
0.31 cm, those emitted onto the chamber are presumed to be stopped.
Thus the expected count rate for the internal conversion electrons
from the 1.064 MeV transition is 425 cps. The measured count rate is
332 cps. The measured value is low by 22%. The large fwhm of the peak-
leads to uncertainties in the actual number of counts under the peak.
The efficiency for the 1.064 AeV electrons is 39%.
The mobility study with Bi2 07 resulted in a different value for the
electron drift velocity. The maximum magnitude for pulse heights was
obtained with a shaping time of 4 ps. With an electron transit time
through the gas of 0.13 Ps, the transit time through the liquid is 3.87 Ps.
The drift velocity thus has a value of 2.58 x 10 cm/s. This value agrees
closely with that obtained by Shibamura.
In Figure 14 a second study of pulse height versus electric field
is shown. In this case the measured values appear to correspond more
closely to the theoretical curve. The theoretical curve is a fit for an
impurity level of 1.3 ppm 02 . Such fluctuations in impurity levels are
possible since the purification process is not exactly repeatable for
every run.
One feature of the gridded ion chamber is the decrease of the signal
43
~~~~~~~~.. . .. .. . . . .. . .. . . . . . . . . . . . . . . ... . . . . . . . . . .. . . -. . . . . . - -.

------
L-I
0p
~~m
C9
o *u 1 e
Ru 8 Jo
* hoeia
140 10080 200 20 40 20
Elecr-i Fiel (Vc*
Fi. 4 Pls eihtv Eecrc ied(B-*7
* 04

if the electric field between the grid and the cathode, Ec, becomes too
large in comparison to the electric field between the grid and the anode,
E a. This causes a violation of equation (9), and electrons begin to col-
lect on the grid. A theoretical measure of this decrease of the signal
in relation to the electric field ratio has been calculated by Bunemann
(5:197-198). The curve appropriate for the grid dimensions used in this
study is shown in Figure 15.
The experimental values were obtained by holding E constant andC
varying E . In this way recombination effects in the liquid did nota
interfere with the results. The signals measured are 5% to 8% smaller
than they should be, but they follow the theoretical curve fairly close.
Bends in the wires or other grid imperfections could have caused the loss
in signal voltage. This data indicates that the gridded chamber is func-
tioning according to theory.
A study of pulse height with a change in grid voltage is shown in
Figure 16. The channel of the peak recorded by the MCA does not change
significantly. As mentioned above, the decrease of the grid voltage tends
to decrease the magnitude of the voltage pulses. Opposing this is the
increase of the voltage pulses due to a larger electric field across the
liquid argon.
* These spectra show an increase in energy resolution. The visible
peak is a combination of the 0.975 MeV and 1.050 MeV internal conversion
electron peaks. Further decreases of the grid voltage lead to loss of
* signal magnitude and energy resolution. The energy resolution of the
peak for a chamber electric field of 2447 V/cm is 430 keV fwhm or 43%.
241This resolution is comparable to that obtained with Am The resolution
for the highest electric field of 3429 V/cm is 172 keV fwhm or 17%. These
45
S%

C)
41
00
0~
OD
Ln
0 MeasuredTheoret ical2
1.2 1.4 1.6 1. 8 2.0 2.2 2.4 2.6
Eo /EcFie. 15. Fraction of Electrons Passed vs Eo,'Ec
46

Grid -3287 V Grid -3000 V
0 %
S° Energy Eeg
Gri -20 Vrd-2O 00
Energy Energy
Fi. Grid -20i0 Vta" Grid-2-00
• . I
@ I ." .
o- 0
a C.2 7
U 'S'
* resolutions are poor enough to combine pulses from electrons of the two
[" different energies into one peak.
These peaks have been distinguished by Shibamura with an energy
resolution of 34 keV fwhm as shown in Chapter II. Also shown in Chapter
II is the Bi 2 0 7 spectrum obtained with an electric field of 5.5 kV/cm and
an electrode separation of 1.43 cm. The resolution obtained in this study
lies between these two extremes. These three studies illustrate the
characteristics needed in a liquid noble gas ionization chamber for accu-
rate energy resolution. The electric field across the liquid must exceed
10 kV/cm. The impurity concentration must be around 1 ppm 02. The dis-
tance traveled by ion pairs through the liquid must be minimized.
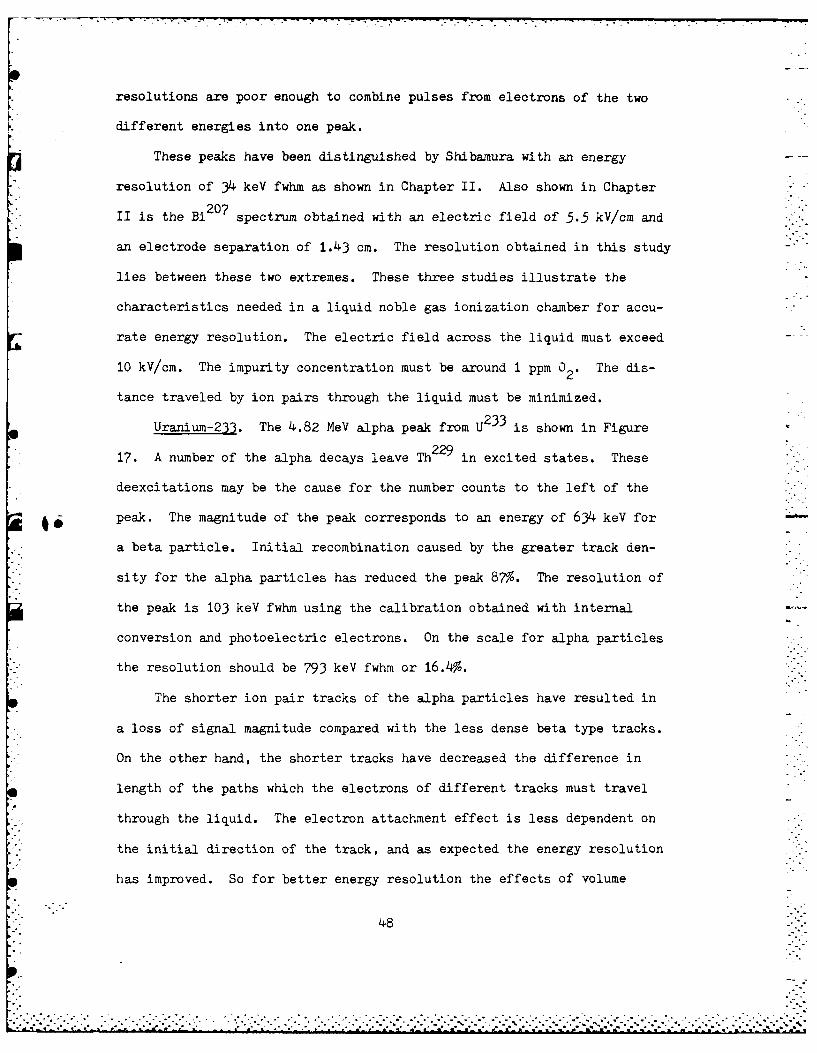
Uranium-233. The 4.82 MeV alpha peak from U233 is shown in Figure
17. A number of the alpha decays leave Th in excited states. These
deexcitations may be the cause for the number counts to the left of the
* peak. The magnitude of the peak corresponds to an energy of 634 keV for
a beta particle. Initial recombination caused by the greater track den-
sity for the alpha particles has reduced the peak 87$. The resolution of
the peak is 103 keV fwhm using the calibration obtained with internal
conversion and photoelectric electrons. On the scale for alpha particles
the resolution should be 793 keV fwhm or 16.4%.
The shorter ion pair tracks of the alpha particles have resulted in
*a loss of signal magnitude compared with the less dense beta type tracks.
On the other hand, the shorter tracks have decreased the difference in
length of the paths which the electrons of different tracks must travel
through the liquid. The electron attachment effect is less dependent on
the initial direction of the track, and as expected the energy resolution
has improved. So for better energy resolution the effects of volume
48
... . . . . . . . . . . . . . . . . . . ..-

o° I
plo inicts a easetubtnaekcrepnigt h 6 e
* . e ; .
oftesml.Snete•13dcy at t he14ke ek ol
Th spctu ends nea 40 k . Wt neeryrsltinao.
.. S • * S * *t
4eo the 34 ke maiu o th actual beasetu alswti h ro
!49
systemiga1? The aciUrai m the 64.8 k eV alpa Po e a g nog
* it distnguishan Xn-3. Thepacolbe rsts ofihe differewntiatione bewee
*Do sample . c the tw uci e ispecsee if iguerte 18. TeY spe wofuth
Splot ivnuatso abee beta spectrum. opa orsonigt h 6 e
* ecyTfhe pet su vidsible.r Du0e ° to th poo energy resolution outh
eventuall show keaoveo the aa beta spectrumflswti h ro
Th pctu2ns er40 e.Wiha eeg esltonaon
40% he 36 RV maimumof he atua bet spetru fals wihinthe rro
PAW
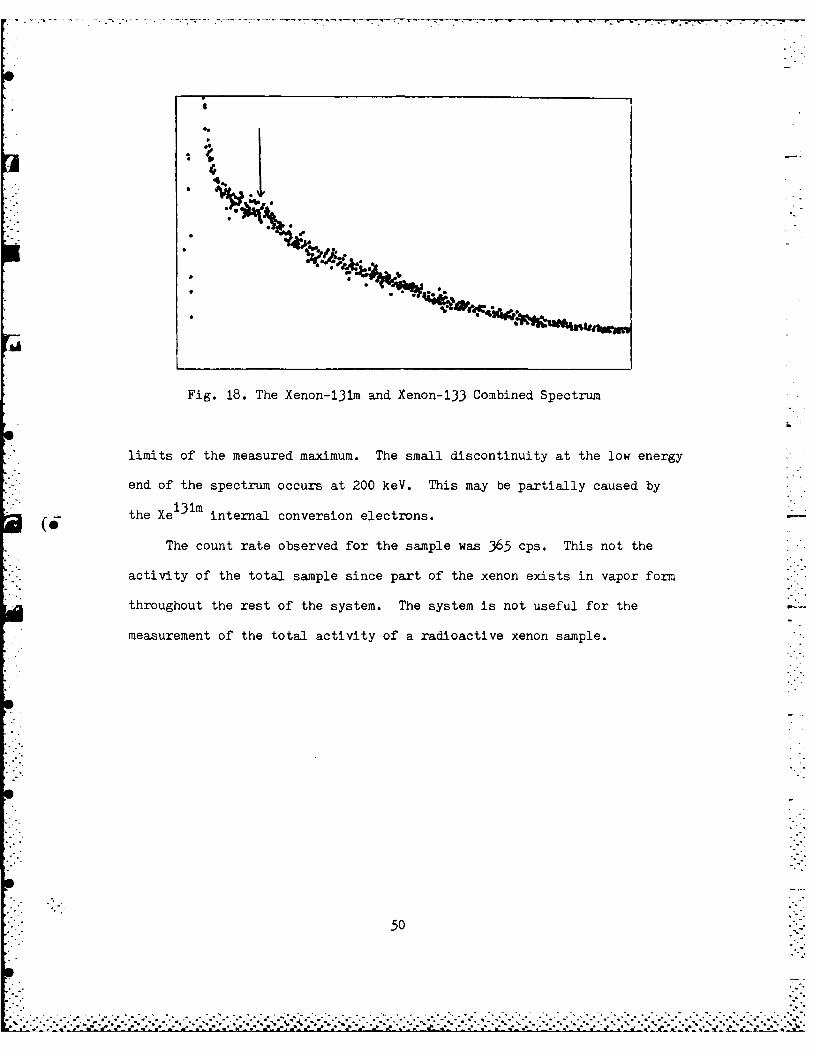
Fig. 18. The Xenon-131m and Xenon-133 Combined Spectrum
limits of the measured maximum. The small discontinuity at the low energy
end of the spectrum occurs at 200 keV. This may be partially caused by
the Xe13 1m internal conversion electrons.
The count rate observed for the sample was 365 cps. This not the
activity of the total sample since part of the xenon exists in vapor form
throughout the rest of the system. The system is not useful for the
measurement of the total activity of a radioactive xenon sample.
50
.

VII Conclusions and Recommendations
Conclusions
The detecting system in its present form does not achieve the goal
131m 13of differentiating the radioisotopes of Xe and Xe133 They may be
differentiated by allowing the decay of the isotopes until the Xe1 3 1m
peak is visible. Even so the energy resolution of the system is about
45% for energies of interest. This is not much better than liquid scin-
tillators. The effort spent to run the system is also a drawback.
The different sources studied provide information on the character-
istics of the chamber. The intrinsic efficiency of the chamber has a
maximum of 70% for 60 keV Trays. The efficiency decreases to 7.2% for
Trays of 122 keV. The resolution at these energies is 48% with 11.5 keV
fwhm caused by noise from the preamplifier.
The higher energy internal conversion electrons from Bi2 07 exhibit
resolutions of 43%. A decrease in the grid voltage improves resolution
at the expense of voltage pulse magnitude. The efficiency for a source
set on the cathode is 39%. A volume distribution of the source could
241lead to efficiencies of 80% as shown by Am2 4 1 This was not proven with
the xenon samples. On the whole the detector does exhibit high efficiency
properties, but high energy resolution has not been attained.
Electron attachment throughout the liquid volume of the chamber is
the most likely cause of the poor resolution. The influence of electron
attachment can be decreased by changing two parameters of the system.
The electric field across the liquid can be increased, or the electro-
negative impurity concentration in the liquid can be decreased.
51
.........................................................

Both alternatives present difficulties. In the present chamber set-
up an increase in electric field will cause more noise in the system
because of discharges. These discharges occur through the vapor between
the grid and the anode. A decrease in impurity concentration would re-
quire a lengthening of the purification process. The present purification
time puts a strain on the experimenter. There may be methods to solve
these problems.
Recommendations
Purification System. The purification process can be improved by
designing an automatic system. In this way the experimenter could let
it function overnight, and the system would be ready to run in the morning.
This would result in faster turn around times for the study of different
internal sources.
The basic design of such a purification furnace is simply a high
pressure bottle. The titanium and zirconium turnings are placed in the
bottle, and the detecting gas is injected into the bottle for purification.
The increase in pressure due to the heating of the gas would not affect
the bottle. The bottle could be connected at one of the valves presently
on the system. The connecting tube should be made of glass to insulate
the system from the hot bottle.
The bottle could be heated to lower temperatures than the present
system and still achieve greater purification. All of the gas would be
inside the furnace during the whole procedure, and the purification would
be carried out for a longer time. Also during purification the rest of
the system would still be evacuated. This proposal is similar to the
system used by Shibamura, et al for their noble gas chamber (25).
The Present Chamber. Changes in the present detector could also
52
A°,

improve resolution. The preamplifier should be replaced with one of lower
noise. The Ortec 120-5 preamplifier with a FET attached to the cooled
part of the system may have fulfilled this requirement, but it did not
function properly.
The grid voltage could be set at values below those determined by
the Bunemann equations. This would increase the electric field in the
liquid. With a lower noise preamplifier the gain of the system could be
increased to offset the decrease in pulse amplitude.
Proportional Counter. A liquid noble gas proportional counter could
be constructed. With this counter only liquid would be in the chamber.
Higher electric fields could be obtained without causing discharges.
The question remains whether multiplication and high energy resolution
could be achieved with such a chamber (3:36). A possible design for the
chamber appears in Figure 19.
Gas Inlet
Kovar Glass
Kovar Stainless Steel Kovar
Anode Wire -
Fig. 19. A Liquid Noble Gas Proportional Counter
53
----------------------------------------------------.-. .. A. ... .

The center of the tube is stainless steel with kovar tubes silver
soldered to the ends. Kovar glass end caps are sealed to the kovar metal.
Hypodermic needles in the end caps act as holders for the anode wire.
Smaller hypodermic needles are soldered to the wire on the inside to
prevent multiplication outside of the uniform electric field region. The
smaller hypodermic needles are then soldered to the needles in the end
caps. The glass inlet tube can extend from an end cap to a 1.5 in. dia-
meter flange. This flange can be connected to the present system.
With a cathode radius of 0.3 cm and an anode radius of 7.62 x 10⁻⁴ cm
a 5000 V potential at the cathode provides substantial electric fields
in the chamber. The electric field at the cathode is 2.8 kV/cm. The
electric field at the anode surface is 1100 kV/cm.
The preceding proposals may or may not provide the energy resolutions .-
required. Many of the problems occur because of a need for high energy
j-( resolution with a volume distributed source of low activity. A study
completed in this laboratory with a high pressure noble gas proportional
counter appears to have more promising results (18).
7 -!
5i
I.-I -, - .
54.'
* .-
............................................. ~-.*........:*.-

Bibliograhy
1. Andrews, W. L. "Evaluation of a Detection System Employing Two
Silicon Semiconductors for the Analysis of Radioactive Noble Gases,"Unpublished thesis. School of Engineering, Air Force Institute ofTechnology, Wright-Patterson AFB, OH, March 1982.
2. Berggren, S. R. "A Cryogenic Argon Ionization Chamber Detector forAnalysis of Radioactive Noble Gases," Unpublished thesis. School ofEngineering, Air Force Institute of Technology, Wright-PattersonAFB, OH, March 1982.
3. Brassard, C. "Liquid Ionization Detectors," Nuclear Instruments andMethods, 162: 29-47 (1979).
4. Brodsky, A. B. Handbook of Radiation Measurement and Protection.West Palm Beach: CRC Press, 1978.
5. Bunemann, 0. et al. "Design of Grid Ionization Chambers," CanadianJournal of Research, 27 (A): 191-205 (1949).
6. Chitwood, R. B. "Production of Noble Gases by Nuclear Fission," page76 in Proceedings of the Noble Gas Symposium, ERDA CONF-730915,Stanley, R. E. and Moghissi, A. A., Editors, 1974.
( 7. Condon and Odishaw. Handbook of Physics. New York: McGraw-Hill, 1958.
8. Doke, T., et al. "Estimation of Fano Factors in Liquid Argon, Krypton,Xenon, and Xenon-Doped Liquid Argon," Nuclear Instruments andMethods, 134: 353-357 (1976).
9. Edmiston, M. D. and Gruhn, C. R. "Energy Resolution Considerationsin Liquid Ionization Chambers," IEEE Transactions on Nuclear Science,NS-25 (1). 352-353 (February 197_8)T
10. Francis, Gordon. Ionization Phenomena in Gases. New York: AcademicPress Inc., 1960.
11. Gibbs, D. S. et al. "Purification of the Rare Gases," Industrialand Engineering Chemistry, 48 (2): 289-296 (February 1956).
12. Gruhn, C. R. and Loveman, R. "A Review of the Physical Propertiesof Liquid Ionization Chamber Media," IEEE Transactions on NuclearScience, NS-26 (1): 110-119 (February 1979.
13. Hallett, A. C. "Liquid- and Solid-State Properties" in Argon, Helium,and the Rare Gases, Volume 1, edited by Gerhard A. Cook. New York:Interscience Publishers, 1961.
55
• ..

14. Hampel, C. A., Editor. The Encyclopedia of the Chemical Elements.New York: Reinhold Book Corporation, 1968.
15. Hofmann, W., et al. "Production and Transport of Conduction Electronsin a Liquid Argon Ionization Chamber," Nuclear Instruments andMethods, 35: 151-156 (1976).
16. Huffman, W. A., et al. "Recent Results in the Development of LiquidArgon Imaging Chambers," IEEE Transactions on Nuclear Science, NS-26
(1): 64-67 (February 1979).
17. Knoll, Glenn F. Radiation Detection and Measurement. New York:John Wiley and Sons, 1979.
18. Lackey, R. "A High Pressure Noble Gas Proportional Counter forAnalysis of Radioactive Noble Gases," Unpublished thesis. School ofEngineering, Air Force Institute of Technology, Wright-Patterson AFB,OH, May 1984.
19. Lederer, M. C., et al. Table of Isotopes (Sixth Edition). New York:John Wiley and Sons Inc., 1967.
20. Meek, M. E. and B. F. Rider. "Compilation of Fission Product Yields,"Vallecitos Nuclear Center, ORNL-T-3515, August 1971.
21. McMaster, W. H., et al. Compilation of Xray Cross Sections.UCRL-50174 Sec. II, Rev. 1. Livermore: Lawrence Radiation Laboratory,University of California, 1969.
22. Moses, A. J. The Practicing Scientist's Handbook. New York: VanNostrand Reihold Co., 1978.
23. Papoular, R. Electrical Phenomena in Gases. New York: AmericanElsevier Publishing Co., 1965.
24. Price, W. J. Nucleonics Instrumentation (a preliminary manuscript forChapters I through 5), unpublished text. School of Engineering, AirForce Institute of Technology, Wright-Patterson AFB, OH.
25. Shibamura, E., et al. "Drift Velocities of Electrons, SaturationCharacteristics of Ionization and W-Values for Conversion Electronsin Liquid Argon, Liquid Argon-Gas Mixtures and Liquid Xenon,"Nuclear Instruments and Methods, 131: 249-258 (1975).
26. Wilkinson, D. H. Ionization Chambers and Counters. New York:Cambridge University Press, 1950.
56
. . .-.. .

Appendixt Discharge in Gases
Since the argon or xenon is in gaseous form between the anode and
the grid, the breakdown potential of these gases limits the magnitude of
the electric fields used in the chamber. Breakdown occurs when the fol-
lowing condition is met (23:115) .
r(exp(ad) - 1) : 1 (26)
where
d is the distance between the electrodes
a and Y are the Townsend coefficients
Alpha is a measure of the number of ion pairs produced in the gas
given a cretain electric field. Alpha can be found from Figure 20 with
the equation
S E/p (27)
where
i7 is the ionization coefficient in ion pairs per volt
E is the electric field in V/cm
p is the gas pressure in mm Hg
The secondary emission coefficient, , depends on the gas and the
composition of the electrodes. Figure 21 gives values of ' for values
of electric field divided by gas pressure. The bias voltages required
to cause discharge are shown graphically by the Paschen curves in
Figure 22.
In order to avoid discharges the vapor pressure of the liquid noble
gas in the chamber must be above a certain point or below a certain point.
57
1. -.
...........................................................

f2 io________
00
Is -2

In the chamber under study the grid to anode distance is 0.55 cm. The
chamber is usually operated with a liquid argon vapor pressure of
480 mm Hg. Figure 22 indicates a breakdown voltage of approximately
3000 V.
The approximate value of the breakdown voltage is used to determine
a more accurate value. With this value of E/p near 11.4, gamma can be
determined from Figure 21 to be 0.07, and is 9 x 10.4 ip/V. By mani-
pulation of equation (26) c is solved for as
cY ln(l + i/-y)/d (28)
The value of oz in this case is 4.96 ip/cm. Using 77 the breakdown
voltage is found as 5500 V/cm. Through further .terations the breakdown
voltage is estimated as 3800 V/cm.
.5
i- -
59 j
.........................................-.
. .. . . . . . . . . . .

VITA
Matthew R. Gibbons was born in Detroit, Michigan on July 23, 1960.
He graduated from high school in Woodstock, Illinois in 1978. He attended
Purdue University from which he received a Bachelor of Science degree in
Physics in May 1982. Upon graduation he was commissioned as an officer
in the USAF through the ROTC program. He entered active duty in August
1982 and entered the School of Engineering, Air Force Institute of
Technology.
Permanent address: 1698 Woodside Court
Woodstock, Illinois 60098
60
...... ........... .... .

UNCLASSIFIEDSECURITY CLASSIFICATION OF THIS PAGE
REPORT DOCUMENTATION PAGEla REPORT SECURITY CLASSIFICAT ION lb. RESTRICTIVE MARKINGS
UNCLASSIFIED ______________________
2a. SECURITY CLASSIFICATION AUTHORITY 3. DISTRI BUTION/AVAI LABILITY OF REPORT
__________________________________ Approved for public release;2b. DECLASSIF ICATIONOOWNGRAOING SCHEDULE distribution unlimited.
4. PERFORMING ORGANIZATION REPORT NUMBER(S) 5. MONITORING ORGANIZATION REPORT NUMBER(S)
AFIT/GNE/PH/84M4-36a. NAME OF PERFORMING ORGANIZATION 5b. OFF ICE SYMBOL 7a. NAME OF MONITORING ORGANIZATION
Schol ofEngneernglit appica ble)
School f Enginering FIT/ENP ______________________
6c. ADDRFESS (City. Slate and ZIP Code)I 7b. ADDRESS (City. State and ZIP Code)
Air Force Institute of TechnologyWright-Patterson AFB, Ohio 115433
8B& NAME OF FUNOING/SPONORING Fb FFICE SYMBOL 9. PROCUREMENT INSTRUMENT IDENTIFICATION NUMBERORGANIZATION 'If applicobli
* So. ADDRESS ICity. State and ZIP Code) 10. SOURCE OF FUNDING NOS.
PROGRAM PROJECT TASK WORK UNIT*ELEMENT NO. NO. NO. NO.
11. TITLE dinclude Security Classificationj
See Box 1912. PERSONAL AUTHOR(S)
Matthew R. Gibbons, B.S., 2d Lt, USAF@TYPE OF REPORT 13b. TIME COVERED 14. DATE OF REPORT (Yr.. Mo., Day) 15. PAGE COUNT
AS Thesis FROM _____TO ____ 1984 March 6716, SUPPLEMENTARY NOTATION
17 COSATI CODES 18, SUBJECT TERMS Continue on reverse If necessary and identify by block number)
FIEL GRUPSB.G Ionization Chambers, Radiation N'easurement Systems,18 04Radioactive Isotopes, Rare Gases
18 0219. ABSTRACT IWonlinue on reverse if necesaa,- and Identify by block numbero
* Title: Evaluation of a Gridded Ionization Chamber for theDetection of Radioactive Noble Gases
Thesis Chairman: Dr. George John pI oTVI!dIj,. 19T4 ~ ev~ II 19J-74
XV c o i " .--- "I Veeopmslli:2Wr Force lr:-.
I.~IlghIht O il "I MIv .. l 3,
20. DISTRIBUTION/AVAILABILITY OF ABSTRACT 21 ABSTRACT SECURITY CLASSIFICATION
'ASSIFIEO/UNLIMITED ZSAME AS RPT. -OTIC USERS ED CNCLASSIFIED
22. NAME OF RESPONSIBLE INDIVIDUAL 22b TELEPHONE NUMBER 22c OFFICE SYMBOL
Dr. George John5125-33AI/N
DD FORM 1473, 83 APR EDITION OF 1 JAN 73 IS OBSOLETE. UNCLASSIFIEDSECURITY CLASSIFICATION OF THIS PAGE

UNCLASSIFIED
SECURITY CLASSIFICATION OF THIS PAGE
This study investigates the feasibility of quantifying the constituentsof a radioactive noble gas sample with a liquid noble gas griddedionization chamber. Xenon-131m and xenon-133 are the noble gases usedto test the chamber. Several other sources are used to characterize other
aspects of the chamber. The chamber is designed to hold the liquid noblegas between the cathode and the grid while vapor remains between the anodeand the grid. Thus the ionization caused by the radioactive noble gassample is confined for the most part between the grid and the cathode.In this way position dependence of generated voltage pulse heights is
elimated. The efficiencies found for the detector are high, but theenergy resolution is only 40% fwhm. The poor resolution is due to
limited electric fields in the chamber, 2.4 kV/cm. Discharge in thevapor prevented higher electric fields in the chamber. Without goodenergy resolution, ratios of radioactive nobles in a sample can not
be found. Some possible solutions to the energy resolution problem arepresented. , ..
UNCLASSIFIED

FILMED
4-85
DTICS. . . . . . . .. S -.... . .. ..
. . .- * * * '.. 5S