evaluation dissertation submitted to the faculty of...
TRANSCRIPT

INTERROGATION OF THE LIMITATIONS AND CAPABILITIES OF THE MODEL-
GEL-TISSUE ASSAY AND APPLICATION TO SOFT TISSUE MODULUS
EVALUATION
By
Stephanie Lynne Barnes
Dissertation
Submitted to the Faculty of the
Graduate School of Vanderbilt University
in partial fulfillment of the requirements
for the degree of
DOCTOR OF PHILOSOPHY
in
Biomedical Engineering
May, 2011
Nashville, Tennessee
Approved:
Professor Michael I. Miga
Professor John C. Gore
Professor Robert J. Roselli
Professor Alissa M. Weaver
Professor Thomas E. Yankeelov

ii
TABLE OF CONTENTS
Page
ACKNOWLEDGEMENTS ..............................................................................................v
LIST OF TABLES .......................................................................................................... vii
LIST OF FIGURES ......................................................................................................... ix
Chapter
I. INTRODUCTION AND BACKGROUND ...............................................................1
Introduction ..............................................................................................................1
Specific Aims ...........................................................................................................3
Background ..............................................................................................................4
Compression Testing ...................................................................................5
Indentation Testing ......................................................................................8
Microstructural Change .............................................................................13
Introduction to this Thesis .....................................................................................16
Significance of this Thesis .....................................................................................19
II. EXPERIMENTAL PROTOCOL .............................................................................22
MGT Assay Overview ...........................................................................................22
Gel Generation .......................................................................................................23
Material Testing .....................................................................................................24
Imaging and Mesh Creation ...................................................................................25
Finite Element Model ............................................................................................26
Optimization Procedure .........................................................................................29
Soft Tissue Modulus Evaluation ............................................................................30
III. EX VIVO LIVER STUDY ........................................................................................32
Introduction and Contribution of Study .................................................................32
Experimental Study: Development of a Mechanical Testing Assay for Fibrotic
Murine Liver ..........................................................................................................33
Abstract ......................................................................................................33
Introduction ................................................................................................34
Methods......................................................................................................37
Fibrosis Model & Disease Scoring ................................................38
Model-Gel-Tissue (MGT) Assay Construction .............................40
Imaging ..........................................................................................42

iii
Indenter & Traditional Compressive Material Testing .................42
Computational Model for Indentation and Model-Gel-Tissue
Assay ..............................................................................................46
Results ........................................................................................................52
Discussion ..................................................................................................59
Conclusions ................................................................................................63
IV. EX VIVO TUMOR STUDY #1 ................................................................................64
Introduction and Contribution of Study .................................................................64
Experimental Study: A Novel Model-Gel-Tissue Assay Analysis for Comparing
Tumor Elastic Properties to Collagen Content ................................................65
Abstract ......................................................................................................65
Introduction ................................................................................................66
Methods......................................................................................................69
Results ........................................................................................................73
Discussion ..................................................................................................78
V. EX VIVO TUMOR STUDY #2 .................................................................................81
Introduction and Contribution of Study .................................................................81
Experimental Study: Investigation of a Modulus Dependence on Treatment
Responsiveness Using a Murine Model of HER2+ Breast Cancer .................82
Abstract ......................................................................................................82
Introduction ................................................................................................83
Methods......................................................................................................86
Results ........................................................................................................88
Discussion ..................................................................................................92
Conclusions ................................................................................................95
VI. OTHER RELATED STUDIES ................................................................................97
Introduction ............................................................................................................97
Gel Selection ..........................................................................................................99
Methods......................................................................................................99
Results ......................................................................................................100
Discussion ................................................................................................101
Gel Generation Reliability Test ...........................................................................102
Methods....................................................................................................102
Results ......................................................................................................103
Discussion ................................................................................................104
Effect of Gel Generation Reliability on Modulus Reconstruction.......................105
Methods......................................................................................................99

iv
Results ......................................................................................................106
Discussion ................................................................................................110
Reliability and Repeatability of Modulus Reconstruction ...................................112
Methods....................................................................................................112
Results ......................................................................................................115
Discussion ................................................................................................119
Soft Tissue Boundary Effect ................................................................................122
Methods....................................................................................................122
Results ......................................................................................................123
Discussion ................................................................................................124
VII. SUMMARY AND RECOMMENDATIONS .......................................................126
Protection of Research Subjects and Societal Implications .................................137
Appendix A: Polyacrylamide ...............................................................................138
REFERENCES ...............................................................................................................140
v
ACKNOWLEDGEMENTS
First and foremost, I want to thank my family. To my hubby-to-be, Adam, who is
my best friend, my relief from the day, and who is often the inevitable bearer of my
frustration – thank you for your love and support, and the many late nights spent hanging
out with me in the lab while I squished gels and scanned samples. I can‟t express with
words how much you mean to me and how lucky I am to have you. Thank you to my
mom and dad, my brother Jeff, and my sisters Courtney and Julie. My family has served
as my rock, giving me unwavering love and support and ensuring my confidence. I
always know that I can turn to you guys in good times and in bad, and that is a luxury of
which I am greatly appreciative. I love you all, and I hope I say it frequently enough, but
thank you for everything.
My gratitude also goes to my advisor, Dr. Miga. He has provided me with
insight, aided in problem solving, and been a constant source of enthusiasm and support
for this research. I thank you for your confidence and your constant willingness to help
me succeed. Also, to my committee members, Dr. Gore, Dr. Roselli, Dr. Weaver, and
Dr. Yankeelov: thank you for your patience and guidance throughout this process.
Especially thank you to Dr. Yankeelov who guided the direction of the final portion of
this research and to Jennifer Whisenant who put up with me through the incessant
emailing and many late nights of tissue collection.
Thank you to the members of BML and SNARL and all of my friends and
confidants within Biomedical Engineering. The willingness to help that is eminent in all
of the individuals within this department is amazing, and I am truly appreciative to have
been a part of this department. Additionally, thank you to everyone who has helped me
vi
in some way over the course of my years at Vanderbilt, including the machine shop,
members of VUIIS, specifically Jarrod True who dealt graciously with all of my
questions and issues, and Daniel Perrien who was always immediately available to help
with the CT, and the BME administrative staff.
Finally, this research would not have been possible without the funding provided
by the NSF Graduate Research Fellowship and the Vanderbilt University Discovery
Grant.

vii
LIST OF TABLES
Table .............................................................................................................................. Page
1. Polyacrylamide gel recipe utilized for liver evaluations................................................41
2. Results from indenter material testing and model compression simulation for fibrosis
and reference gels. .................................................................................................55
3. Average modulus values and standard deviations from indenter material testing and
model compression simulation for fibrotic livers. .................................................56
4. Average modulus values and standard deviations from indenter material testing and
model compression simulation for control gel.......................................................56
5. Gel-to-tissue volume ratio..............................................................................................74
6. Assay and acid-hydrolyzed homogenate results ............................................................75
7. Ariol data for percent collagen in each of the three slides from each tumor sample .....91
8. Components of the bulk solution for the gel generation reliability testing..................103
9. Gel generation reliability test modulus results.............................................................103
10. Tumor data for effect of gel generation reliability on modulus reconstruction
analysis ..................................................................................................................106
11. Effect of gel generation on modulus reconstruction results – 1% range ...................108
12. Tumor data for effect of gel generation on modulus reconstruction analysis ............108
13. Components of the bulk solution for the VMR analysis............................................114
14. Percent polyacrylamide for VMR analysis ................................................................114
15. Results for the reliability and repeatability of modulus reconstruction (VMR)
analysis ..................................................................................................................116
16. Slope of force versus displacement curve for VMR set #1 .......................................117
17. Slope of force versus displacement curve for VMR set #2 .......................................118
18. Optimized modulus values for chicken liver tests .....................................................124
viii
19. Effect of Embedded Modulus Segmented Volume on Modulus, embedded volume
= 140 mm3 .............................................................................................................129
20. Effect of Embedded Modulus Segmented Volume on Modulus, embedded volume
= 102 mm3 .............................................................................................................129
21. Stress relaxation time constants for reference gels and heterogeneous gels ..............133
22. Elasticity contrast ratios obtained by different material property analyses ...............134

ix
LIST OF FIGURES
Figure Page
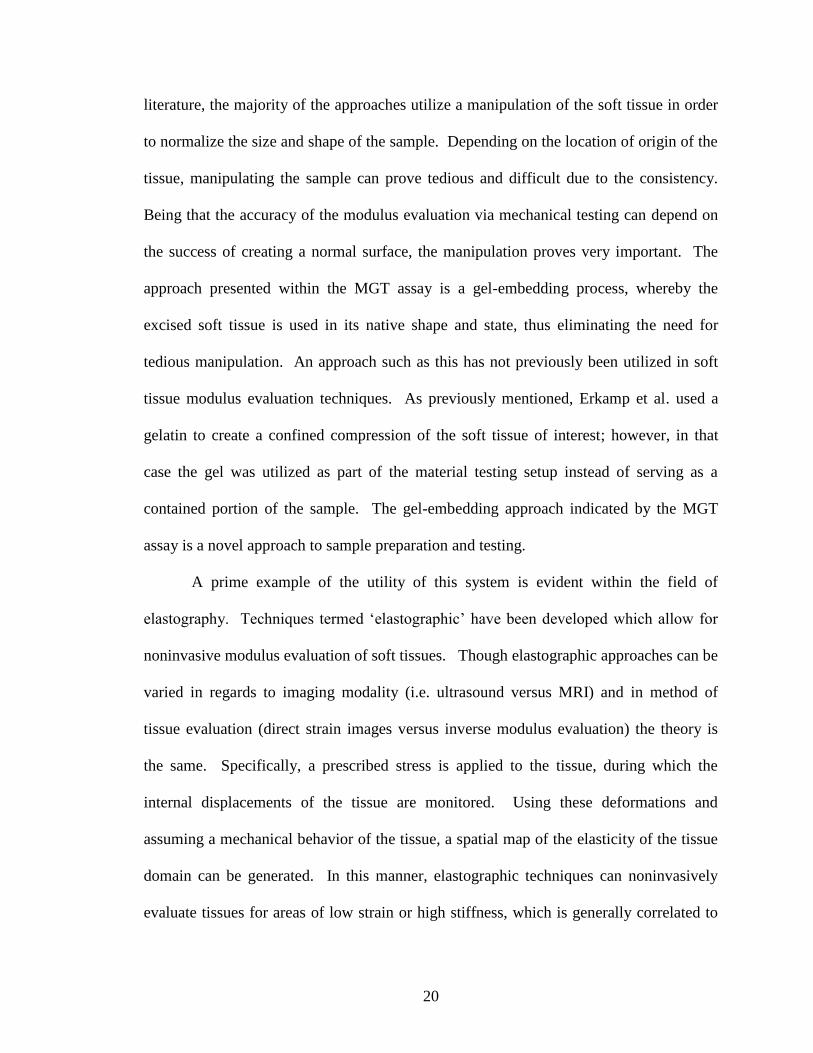
1. General mechanical testing framework for murine liver system. ..................................38
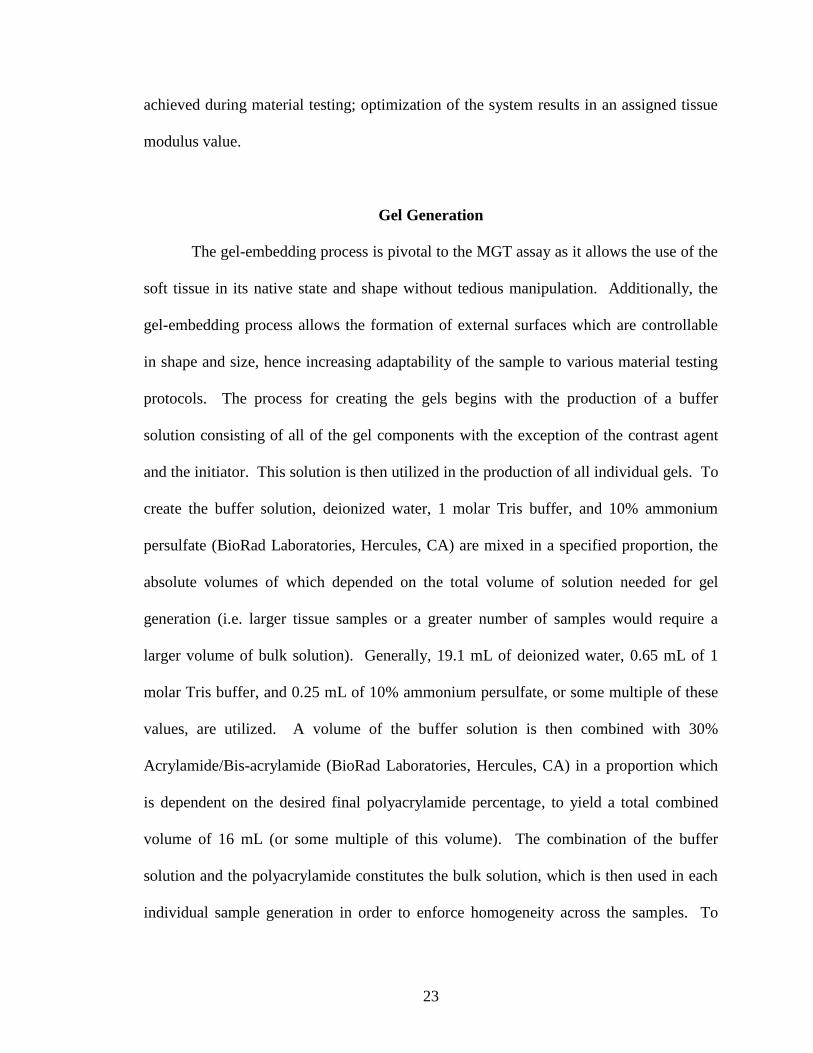
2. Material testing setup used in the MGT assay. ..............................................................43
3. Close up of liver indentation setup. The liver was positioned so that contact with the
indenter occurred at a point where the liver was uniform in height. ...........................43
4. Gel compression testing setup. ......................................................................................45
5. Computational domain construction with (a) liver microCT, (b) gel tetrahedral mesh,
and (c) liver tetrahedral mesh extracted from gel/liver model .....................................49
6. Stress-strain curves for reference gels from compression testing. A precompression of
approximately 4% strain (0.3 mm) was applied prior to testing. The values are
average values for the two compression tests performed on each gel, with error bars
indicating the standard deviation of the two tests ........................................................53
7. Stress-vs-strain behavior taken after the 60 second dwell for the gel-tissue system of a
fibrotic specimen. The two curves represent the two compression tests. The data
points represent the stress value after the dwell period at each step compression. .....53
8. Example of force data obtained from liver indentation test. The temporal decay of the
force data during sustained compression indicates the viscoelastic nature of the tissue.
However, the effect dampens and a steady state has been approximately established at
the end of the dwell ......................................................................................................54
9. Liver model modulus as a function of indenter modulus for fibrotic samples. The
correlation coefficient between the two sets (R2=0.741, R=0.861) indicates a
relationship between the two measures........................................................................57
10. Liver model modulus as a function of indenter modulus for fibrotic samples. When
the data point for liver 1 is removed, the correlation coefficient between the two sets
increases (R2=0.820, R=0.905). ...................................................................................58
11. Assay outline ................................................................................................................70
12. Collagen percentage as a function of tumor modulus for PyV-mT tumors. The black
line is the linear regression to the data set, while the red line is the 90% confidence
interval, and the blue line is the 95% confidence interval. ..........................................76

x
13. Representative slice from immunohistological analysis of murine mammary tumor
tissue. The two images are the same slice, with the left being at 10x magnification
and the right at 20x magnification ...............................................................................77
14. Representative slice from Masson‟s Trichrome staining of murine mammary tumor
tissue. The two images are the same slice, with the left being at 10x magnification
and the right at 20x magnification ...............................................................................77
15. Modulus values for the Herceptin-responsive (BT) and Herceptin-resistant (HR)
tumors ..........................................................................................................................89
16. Percent collagen and assay modulus for Herceptin-responsive (BT) and Herceptin-
resistant (HR) tumors ...................................................................................................89
17. Linear correlation between percent collagen and assay-assigned modulus. Data
points represent the seven tumor samples for the combined responsive and resistant
lines. The outlier (sample HR6-1) is excluded ............................................................89
18. Ariol images of histology slices from tumor sample HR6-1. The actual image set
obtained by the Ariol system is significantly higher resolution than the images
presented here; the image data had to be down-sampled to be contained in this
document ......................................................................................................................91
19. Ariol images of histology slices from tumor sample HR6-3. The actual image set
obtained by the Ariol system is significantly higher resolution than the images
presented here; the image data had to be down-sampled to be contained in this
document ......................................................................................................................92
20. Normalized tissue modulus as a function of percent background modulus noise for
each of the nine PyV-mT tumor samples in the effect of gel generation on modulus
reconstruction analysis ..............................................................................................109
21. Normalized modulus average range as a function of tissue to gel volume ratio in the
effect of gel generation on modulus reconstruction analysis. The different markers
indicate the three original background modulus values. The red square indicates an
original value of 2346 Pa, the green triangle was originally 989 Pa, and the blue
diamond was 4164 Pa ................................................................................................109
22. (a) Sample of embedded modulus gel with barium sulfate (left) and background
reference gel (right). (b) Heterogeneous gel with embedded polyacrylamide sample
from the VMR analysis ..............................................................................................114
23. Force values as a function of displacement for VMR set #1 ....................................117
24. Force values as a function of displacement for VMR set #2 ....................................118

xi
25. Effect of Embedded Volume on Optimized Modulus ..............................................128
26. Standard linear solid model ......................................................................................131
27. Sample material testing curve ....................................................................................132
28. Representative fitting of the SLS model to the experimental data ............................132
29. MIE data acquisition. (a) Photograph of compression chamber, (b) transverse CT
slice of setup, and (c) liver-gel block under compression .........................................134
30. B-mode ultrasound image of gel-liver interface ........................................................136
31. Strain image of gel-liver interface .............................................................................136
32. Polyacrylamide gel polymerization reaction and resulting polyacylamide matrix ....139

1
CHAPTER I
INTRODUCTION AND BACKGROUND
Introduction
Biological tissue mechanical property evaluation is generally concentrated on
load-bearing tissues such as bone and skin. However, recent effort has been directed
toward understanding the mechanical properties of soft tissue due mainly to motivations
in the areas of modeling and disease evaluation. In regards to modeling, soft tissue
models are used in a variety of applications, from predictive strategies such as surgical
planning, to teaching methodologies such as surgical simulations [1-4]. In order generate
accurate models, a precise input of the soft tissue properties is required. Due to this
recent need for accurate assessment of tissue modulus values, attempts have been made to
develop robust frameworks for soft tissue measurements. However, due to the
difficulties associated with soft tissue mechanical property evaluation, specifically
regarding sample shape and consistency, standard evaluation techniques have proven
elusive and highly variable.
The more prevalent motivating reason for evaluating the mechanical properties of
soft tissue is in regards to disease assessment. Disease in soft tissues generally results in
a restructuring of the normal tissue components, which manifests as a change in the
elastic modulus (the common mechanical property to observe in evaluation) of the tissue
[5]. In most cases, the tissue tends to stiffen with disease (an elevated elastic modulus),
though in some cases it can soften; regardless of directionality, changes in modulus have

2
been observed in many different pathological conditions which could potentially be used
as a macroscopic evaluation of disease. A common example of elastic modulus as an
indicator of disease is in the case of breast and prostate tissue, where a physical exam
consisting of palpation of the affected area is utilized as a preliminarily evaluation of the
presence of cancerous tissue [6, 7]. A change in mechanical properties has similarly been
identified in many other pathological conditions, including hepatic fibrosis, arterial
disease, myocardial infarction, thyroid disease, and skin cancer, among others [7-21].
Noninvasive methods of tissue evaluation, which rely on the correspondence between
tissue modulus and pathological condition, are being devised to mediate the necessity for
painful, invasive tissue evaluation methods; specifically, methods such as elastography
have been developed to non-invasively assess tissue modulus [7, 11, 22-28]. However, in
order for these methods to reach their full diagnostic potential, a baseline „normal‟ value
for the tissue modulus must be established as well as an understanding of the
discriminatory power that mechanical properties might provide in characterizing disease.
As a further consideration, since disease correlates to changes in the
microstructure, the elastic modulus of a tissue could potentially serve as a biomarker of
microscopic changes within the tissue. This prospective correlation is indicated by work
investigating the biological and molecular mechanisms of metastasis [29-32]. Work of
this nature has indicated that, in tumors with a propensity to metastasize, there tends to be
a dysregulation of extracellular matrix (ECM) gene expression [33]. Specifically,
invasiveness has been associated with degradation of the ECM by enzymes such as
metalloproteases [34, 35]. Additionally, many procollagen genes have been shown to be
altered in highly metastatic tumors [33]. These genes have been associated with
3
metastatic progression via remodeling of the tumor microenvironment and in promoting
cellular adhesion and motility [33, 36-39]. In breast cancer, fibrotic foci and desmoplasia
have been associated with the transition from localized tumor to invasive tumor [40, 41].
All of these observed microstructural phenomena could potentially affect the bulk
modulus of the tumor tissue, thus eliciting the consideration that a change in the tumor
state, such as the propensity to metastasize, could be observed through noninvasive
evaluation of the tissue modulus.
With the increasing interest in soft tissue modulus evaluation, an adaptable and
consistent soft tissue modulus evaluation technique is desirable. A system that is
compatible with noninvasive modulus evaluation techniques for validation purposes yet
could serve as a standalone parameterization technique would serve to fill a void in the
link between noninvasive diagnostic procedures and soft tissue modulus evaluation. The
hypothesis presented here is that an adaptable soft tissue modulus evaluation system can
be developed that allows for a simple tissue preparation and combines material testing
with computational modeling which could be amenable to elastographic validation as
well as independent modulus evaluation.
Specific Aims
The goal of the work presented here is the development, validation, and rigorous
examination of a soft tissue modulus evaluation technique developed with the purpose of
evaluating the elastic modulus of biological tissue samples which were not amenable,
either due to size, shape, or consistency, to traditional material testing methods. To this
avail, the method termed the MGT assay is described, which was developed with specific

4
consideration of the flexibility and practicality of the modulus evaluation procedure.
Additionally, this work serves to test the feasibility of the assay as a modulus evaluation
technique. Towards this end, the specific aims of this research are as follows:
1. Develop a soft tissue modulus evaluation technique that is amenable to tissue size
and shape and adaptable in technique, thus allowing validation of non-invasive
modulus evaluation techniques.
2. Validate MGT assay relative to traditionally accepted modulus evaluation
techniques.
3. Investigate propensity of modulus evaluation as an indicator of microstructural
differences in tissue.
4. Utilize the MGT assay to investigate the prospect of tissue elasticity as a
biomarker for tumor responsiveness.
5. Examine the sensitivity and repeatability of the MGT testing protocol by
assessing four different aspects:
a. Consistency of modulus between gels generated simultaneously.
b. Effect of background modulus on the evaluated tissue modulus.
c. Reliability and repeatability of embedded modulus reconstruction.
d. Embedded specimen interface effect on evaluation.
Background
Different basic modulus evaluation techniques include indentation, compression,
torsion, shear, and tension testing. Of these, the most utilized techniques for soft tissue

5
evaluation evolved in the categories of compression and indentation testing. When
considering the body of research that has been conducted concerning the mechanical
properties of biological soft tissues, one will notice the magnitude of different methods
for material testing and modulus calculation. Beyond the initial type of testing performed
(i.e. compression versus indenter), the testing protocol can vary from simple linear
compression to sinusoidal excitation to complex variations and combinations of
approaches, and the model used to describe the tissue behavior can be elastic, viscoelastic
hyperelastic, or some other more complex category. The combination of the plethora of
options leads to a wide variety of testing and characterization approaches, thus creating a
discrepancy in the literature concerning material testing of biological tissues as well as a
discord among the resulting modulus values.
Compression Testing
Traditional compression testing is a direct compression of the tissue between two
parallel plates. If the tissue is assumed to be elastic, isotropic, and near incompressible,
then the linear response can be characterized solely by the elastic modulus. However, the
method requires a uniform sample shape, in that the top and bottom surfaces need to be
parallel in order to implement standard compression testing. The sample shape
stipulation can prove difficult for soft tissues, as they are often hard to cut into a desired
shape. Though the shape requirements are tedious, the calculations associated with
modulus evaluation through compression testing are relatively simple in comparison to
other techniques, lending to the use of variations of compression testing in literature.

6
Chen et al. utilized uniaxial compression for testing bovine muscle and liver
tissue samples [42]. The research involved using a cylindrical punch for compression
that had a diameter that was larger than any given sample diameter, so that uniform
compression was applied to the surface. In addition, a lubricant was applied to the
specimen surface to guarantee unconfined compression during testing and linear elasticity
was assumed. The material testing results presented are compared to ultrasound
measurements made using a transducer with a diameter of 3.18 cm, which was not always
larger than the sample size. The authors recognize the inconsistency of using these two
conflicting testing methods and compensate for the differences using numerical analysis.
A correction factor is implemented for the ultrasound data that takes into account both the
radius of the compressor relative to the tissue radius as well as the confined compression
that is induced by the surrounding tissue on the tissue directly below the compressor.
The authors note that the soft tissues behave linearly for strains up to 5% and react
nonlinearly for strains above 10%. To calculate the average Young‟s modulus, a least
squares fit to the linear portion (<5% strain) of the curve was used. The results showed
an average compression value and ultrasound measurement of 2.12±0.91 kPa and
1.53±0.31 kPa, respectively, for the muscle tissue and 0.62±0.24 kPa and 0.94±0.65 kPa
for the liver.
Yeh et al. also used a compression-based testing system to evaluate the elastic
modulus of human fibrotic liver tissue [10]. In order to account for the necessary shape
restrictions, tissue samples were cut into cubes using a surgical blade. Cyclic
compression tests were utilized with varying amounts of prestrain (5, 10, and 15%)
applied prior to the cyclic compression. A linear evaluation of the upswing of the cyclic

7
stress-strain values was then used to calculate the modulus of the tissue. The tissue
samples were subjected to histology after material testing in order to grade the fibrosis of
the samples. The authors found that at the 5% prestrain level, the average modulus value
ranged from 0.640 to 1.650 kPa for the range of fibrosis scores. For 10% precompression
the values jumped to 1.080 to 4.930 kPa, and at 15% the values reached 2.000 to 19.980
kPa.
Hoyt et al. investigated the viscoelastic properties of human prostate tissue using
compression testing [43]. Similarly to previously mentioned work, a custom-made
coring tool was utilized to cut the samples. Cancerous and normal tissue samples were
cut into cylinders and then subjected to unconfined compression testing. The test
consisted of a compression to 5% strain followed by a dwell for 700 seconds. The stress-
relaxation curves were fit to a Kelvin-Voigt fractional derivative (KVFD) model by
nonlinear least squares in order to obtain the three parameters (E0, η, and α), from which
the frequency-dependent complex Young‟s modulus was calculated. Results showed a
contrast of approximately 2 to 1 in the stiffness of cancerous to normal tissue. At 0.1 Hz,
the complex Young‟s modulus for normal tissue was 3.8 kPa while the cancerous tissue
was 7.8 kPa. At 150 Hz, the normal tissue averaged 16.0 kPa while the cancerous tissue
was 40.6 kPa.
Kiss et al. also used the KVFD model to analyze the modulus of canine livers
[44]. As before, a custom tool was used to cut cylindrical specimen, and then some
specimen were ablated to create lesions to analyze differences in modulus values.
Unconfined compression was achieved by applying mineral oil to the platens, and a 2%
pre-strain was applied. The samples were then cyclically compressed an additional 2% at

8
frequencies ranging from 0.1 to 400 Hz. The Levenberg-Marquardt method for
nonlinear least squares fitting was used to evaluate the KVFD constants. Results showed
an average modulus value of 1.995 kPa for normal liver tissue, with lesion values ranging
from 10.00 kPa to 26.60 kPa.
This brief review of the compression testing literature illuminates two main
points. First, in almost all of the cases, the investigators utilize a specially devised coring
tool to create a relatively uniform shape of the samples. This approach is feasible when
the sample size is large enough or the tissue is stiff enough to allow for the use of the
coring device. However, in the case of a small sample, such as that obtained during a
biopsy, or a soft tissue sample, the tissue manipulation approach could prove difficult if
not impossible. The second point of interest is the breadth of approach utilized in
analyzing the tissue modulus values. In most cases a precompression is applied, though
the magnitude of the precompression typically varies. The testing protocol implemented
after the initial precompression varies greatly across investigations. Additionally, the
model of the tissue domain varies; specifically, some investigators consider the linear
portion of the testing curve, while some investigators specifically target the viscoelastic
nature of the tissue. The approach utilized is investigator dependent, and usually is
chosen so as to highlight a specific, desired aspect of the tissue. However, the different
testing protocols lead to different modulus values for similar tissues; hence for validation
purposes of a method it would be necessary to maintain a consistent approach across
testing protocols.

9
Indentation Testing
Indentation testing is another common testing method for biological tissues.
Indentation testing is more flexible concerning the shape of the specimen, and thus
proves easier to implement in soft tissues; however, stipulated dimensional ratios often
have to be obtained in order to validate the assumptions of the equations associated with
indentation analysis. For example, many types of indentation testing assume an infinite
elastic medium for the soft tissue; hence it is necessary that the tissue diameter be
significantly larger than the indenter diameter. Though indentation testing is more
amenable to irregular tissue shape, the calculations involved in evaluating the modulus
value can be difficult and tedious, and may change depending on the specifications of the
testing protocol. Specifically, different calculations are performed if a cylindrical punch
indenter is used as opposed to a spherical-tip indenter.
Krouskop et al. used uniaxial compression to test prostate and breast tissue [7].
However, the diameter of the compressor was only 4.83 mm, which was smaller than the
tissue sample radius, necessitating the consideration of the work as indentation. The
tissue was assumed to be linear and isotropic and the testing setup was modeled as a
uniform load applied over a portion of the top boundary of a semi-infinite elastic solid.
This approach required cutting the tissue into slab-shaped pieces, with height that was no
more than one-quarter of the diameter. The excitation pattern was sinusoidal, with three
different frequencies (0.1, 1.0, and 4.0 Hz) and the tissue was modeled as linear elastic,
though the cyclic loading was used to characterize any viscoelastic behavior. The
researchers found that at the experimental strain rate and strain range (20 to 30 percent),
the tissue was sufficiently linear. Two sets of precompression were evaluated for each

10
tissue; for the breast tissue precompression levels of 5 and 20% were evaluated, and for
the prostate precompression levels of 2 and 4% were used. For the breast tissue, the
modulus did not change with applied frequency but did change with precompression
level. Normal fat tissue had an average modulus of 19.7 kPa and 21.3 kPa, normal
glandular tissue was 32 kPa and 57 kPa, and fibrous tissue was 106.3 kPa and 231.3 kPa
for 5 and 20% precompression, respectively. Ductal carcinoma in situ was 24.3 kPa and
299.67 kPa and invasive ductal carcinoma was 73.7 kPa and 502.7 for 5 and 20%
precompression. For the prostate tissue, it was also found that modulus did not change
with loading frequency but did vary with precompression level. Normal anterior tissue
had average modulus values of 58.7 kPa and 62 kPa and normal posterior tissue had
values of 65.3 kPa and 69.7 kPa for 2 and 4% precompression. Tissue from regions of
benign prostatic hyperplasia was 37.3 kPa and 39 kPa and tissue from cancerous regions
was 98.3 kPa and 230.7 kPa for 2 and 4% precompression. In another paper, Kallel et al.
used the same testing setup on ovine kidney samples [45]. It was found that the elastic
modulus of the kidney ranged from about 10 kPa at low strains (<10%) to as high as 55
kPa at high strains (30%) for tissue obtained from the renal sinus, and from 20 kPa to 70
kPa for tissue obtained from the renal cortex.
Erkamp et al. also utilized indentation testing for modulus evaluation of canine
kidney tissue [46]. In the system, a cylindrical sample was constrained laterally using a
mold coupled with gelatin-agarose to fill the space between the sample and the mold. A
set of single step indentations was performed using a step motor and a cylindrical punch,
and the resulting data was converted to modulus values by means of a conversion factor
that was obtained experimentally and validated by finite element modeling. The resulting

11
modulus values ranged from 10 kPa to 50 kPa depending on the amount of strain applied
(0 to 9%). In other work, Carter at al. examined the modulus of pig liver and spleen and
human liver [47]. The work utilized a round-tip indenter that was 4.5 mm in diameter as
well as a cylindrical punch which was significantly larger at 30 mm in diameter. The
work utilized a nonlinear elasticity description of the tissue in the form of an exponential
stress-strain law, which contained two tissue parameters, γ and μ. The round-tip indenter
was used for basic stress-strain calculations, wherein the force and displacement values
were converted to stress and strain by dividing by the area of the indenter tip and the
thickness of the tissue, respectively. The cylindrical indenter data was used to calculate γ
and μ. An average porcine liver modulus of 4 MPa was obtained, and the average
porcine spleen modulus was 0.11 MPa. The human liver had an average modulus of 0.27
MPa. In comparing the exponential stress-strain description to the data obtained from the
cylindrical punch, the equation was representative of the physical data, matching the
curve well. The resulting parameter values were 0.08 for γ and 0.12 for μ.
Samani et al. have performed extensive evaluations of breast tissue modulus using
indentation techniques and an assumed linear elasticity of the tissue [6, 48, 49]. In the
earlier work, Samani et al. evaluated breast tissue samples using unconfined indentation
[48]. Tissue specimens were cut into a relative block shape using an apparatus devised
by the authors that utilized an agarose gel encasement of the tissue to prevent
deformation during the cutting process. Cyclic indentation was performed on the tissue
block using a cylindrical indenter, force-deformation data acquired, and the elastic
modulus was calculated using a conversion factor determined experimentally and
validated by finite element evaluation. Three tissue samples were tested, one of adipose

12
tissue, one of fibroglandular tissue, and one of a high grade ductal carcinoma. The
calculated modulus values were 1.9, 1.8, and 12.0 kPa, respectively. This system of
modulus evaluation was adapted for use in ex vivo breast tissue tumors [49]. However,
in this work, the authors calculated the elastic modulus by means of an iterative inversion
technique as opposed to the direct conversion factor used previously. The technique used
a finite element simulation of the tissue indentation to iteratively calculate a conversion
factor and consequently modulus of the tumor tissue. Four different tumor types were
evaluated: fibroadenoma, high grade ductal carcinoma in situ (DCIS), infiltrating lobular
carcinoma (LC), and invasive ductal carcinoma (DC). The average modulus values were
11.42, 14.15, 18.57, and 22.55 kPa, respectively. The authors then applied both of the
previously mentioned methods to investigate normal and pathological breast tissue
specimens [6]. For normal breast tissue, the average modulus was 3.245 kPa. For
diseased samples, the values ranged from 6.41 to 42.52 kPa, depending on the disease.
As with compression, the indentation literature serves to highlight the lack of data
available regarding the modulus of various tissue types as well as to indicate the variety
of approaches attempted by investigators. In the case of the indentation testing, the
approach does not vary so much in the actual material testing protocol, but rather in the
method of interpreting the resulting force-displacement data. As previously mentioned,
indentation testing requires a more rigorous evaluation method due to the unusual
geometries and the interaction of these geometries; the evaluation approach selected can
vary greatly among investigators. This again makes it inherently difficult to compare
results among investigators, and also impedes the use of these results as verification of
other modulus evaluation techniques.

13
Microstructural Change
Histological analysis of tissue biopsies has been well established and remains the
„gold standard‟ for disease evaluation and diagnosis. However, the methods for biopsy
collection are inherently invasive and often painful for the patient. Additionally,
temporal tracking of the disease requires repetitive evaluations of the tissue, which is
often not feasible due either to the invasiveness of the procedure or the amount of tissue
available. Acknowledgment of this problem has led to the development of diagnostic
techniques that aim to noninvasively differentiate diseased and normal tissue, often based
on the elastic modulus. Assuming a link exists between microstructure and/or
microstructural environment and macroscopic parameters, such as modulus, it is feasible
to conceive of a non-invasive modulus evaluation technique as an evaluation of
microstructural changes that could serve as a predictor of events such as tumor
progression or tumor invasion.
Recent research has focused on the microenvironment and changes within it that
contribute to and/or are driven by tumorigenesis and metastasis. Specifically, a series of
recent papers have identified the importance of stress cues on the behavior of the cell and
the resulting effect on the tissue microstructure. Paszek and Weaver provide a review of
mechanical homeostasis, discussing the concept of tensional homeostasis and the effect
that the tensional state of the tissue microenvironment has on the development and
potential transformation of the mammary epithelial cells [50]. The paper explores the
necessary function of physical forces on the development of the embryo and subsequent
mammary gland development. The authors then identify ongoing work indicating that
substrate compliance regulates cell shape, mammary tumor morphogenesis, and

14
endogenous basement membrane assembly. Considering the situation of perturbed
homeostasis and the malignant transformation of the breast, the authors indicate that,
given the changes in tissue tension and the difference in force sensing experienced by
transformed cells that is associated with tumorigenesis, it is likely that altered
mechanotransduction and loss of tensional-homeostasis account for a pivotal mechanism
regulating the pathogenesis of epithelial tumors. Specifically, the microstructural
changes that occur during tumorigenesis and the subsequent cellular changes form a
positive feedback loop wherein the reaction of the cells to the increased forces results in
responses that perpetuate the diseased state and promote increased tumorigenesis. This
paper touches not only on the importance of mechanical reciprocity between the
microenvironment and the cell in the development of the cell, but also identifies the
tumorigenic „journey‟ of the collective tissue and how force cues and mechanical changes
in the microenvironment potentiate cancer progression.
Regarding the specific changes in the microstructure that result in an altered
tensional state, a considerable body of research has been performed that explores the
changes in the extracellular matrix corresponding to tumorigenesis and tumor
progression. The paper by Butcher et al. summarizes the observed remodeling of the
extracellular matrix in tumors [51]. Specifically, the extracellular matrix is affected by
increased deposition of fibronectin, tenascin, collagen types I, III, and IV, and
proteoglycans, overexpression of matrix metalloproteinases (MMPs) resulting in MMP-
dependent cleavage, and increased levels of LOX-dependent matrix crosslinking. These
factors result in a progressive increase in the stiffness of the tissue and the extracellular
matrix. Additionally, the authors indicate that, in both in vitro and in vivo studies,

15
induced stiffening of the matrix promotes mammary epithelial cell transformation and
associated increased mechanosignalling from the cells, perpetuating the positive-
feedback loop suggested by Paszek and Weaver.
The paper by Levental et al. also addresses the matrix remodeling associated with
tumor progression, and, specifically, the effect of collagen crosslinking on the stiffness
and subsequent signaling [52]. The authors found that the transition of the mammary
gland from normal to premalignant to invasive cancer was paralleled by an incremental
stiffening of the tissue, as measured by unconfined compression and rheological testing,
which could be correlated to increased collagen crosslinking. The authors also showed
that ECM stiffening, in the presence of oncogenes such as ErbB2, promotes invasive
behavior of the mammary epithelium. Additionally, the authors provide data indicating
that focal adhesions, which serve as the force signaling pathways between cells and the
stroma, are elevated in the stiffened tissue state, and that the adhesions promote
mammary epithelial cell invasion, which resonates with the concept that force plays a
role in tumor progression.
Beyond the information available in the literature regarding changes in the tumor
stroma, an abundance of information also exists regarding the effect of these changes on
the behavior of the tumor. A paper by Lo et al. translates the changing stiffness of the
substrate into a locomotive effect on the cell [53]. Their work shows that ECM stiffness
affects the migration of cells within the substrate and enhances cell growth and survival.
In other work, Ramaswamy et al. evaluated the gene-expression profiles of various
metastatic and primary tumors to identify genes that distinguished the two [31]. In this
work, the authors found that collagen genes were upregulated in tumors with metastatic

16
potential, indicating that increased expression of collagen is associated with metastatic
behavior.
This evaluation of the literatures serves as a brief but salient investigation of the
many papers concerning the altered conditions of the tumor stroma and the effect that
these have on tumor progression and potential invasion. Given the remodeling of the
extracellular matrix, the deposition and crosslinking of collagen, the overall increase in
tissue stiffness generally observed, and the subsequent correlation between these changes
and the behavior of the tumor tissue, it is reasonable to conceptualize that certain events
(such as progression or invasion) which relate to changes in the microstructure of the
tissue may potentially be observable though the modulus of the tissue.
Introduction to this Thesis
The initial goal of this project was to develop an evaluation technique to quantify
the modulus of soft tissue in a manner which was compatible with non-invasive modulus
evaluation techniques for verification purposes. Specifically, the objective was to use a
mechanically-based modeling evaluation technique to verify the quantification of fibrotic
liver tissue modulus by means of ultrasound elastography, and thus the modulus
evaluation technique was conceived as a complementary component of an elastographic
technique. As the assay developed, the utility of it as a modulus evaluation technique
that could be utilized to investigate ex-vivo soft tissue samples became apparent. Soft
tissue modulus evaluation has historically proven difficult due to the irregular surfaces of
the tissue and the difficulty in manipulating the tissue to create a normal shape which is
generally required for basic mechanical testing techniques. Further, disease development

17
and progression often affects the microstructure and hence the modulus of the tissue in a
manner that is discernable from the surrounding, non-diseased tissue. Hence a modulus
evaluation method that would allow the tissue to be utilized in its natural, irregular shape
would prove useful as the correlation between modulus and disease is further
investigated. The assay described in this work serves to fill this need as it is an adaptable
system which could be utilized for soft tissue modulus evaluation under a variety of
preparation conditions. The skeleton of the system is a gel-embedding process by which
the tissue sample is embedded in a polyacrylamide gel. This coupled with a mechanical
testing protocol, imaging of the tissue-gel system, and modeling of the system resulted in
what has been termed the Model-Gel-Tissue (MGT) assay.
This thesis is the concatenation of work that focuses on the development,
utilization, and evaluation of the MGT assay. Chapter II focuses on the details of the
development of the MGT assay. This chapter provides information on the experimental
protocol for using the MGT assay. Additionally, it contains specifics regarding each
component of the evaluation of a modulus of interest utilizing the assay.
The next three chapters explore the application of the MGT assay to soft tissue
modulus evaluation ex-vivo. In the Chapter III, murine livers were utilized as the tissue
of interest, and the testing protocol consisted of 14 fibrotic livers, 3 control livers, and 3
normal livers. Two lobes from each liver were submerged in polyacrylamide and
evaluated using the MGT assay. A separate liver lobe was utilized in direct indentation
testing, which provided a baseline comparison for the results of the MGT assay. The
model-calculated modulus, though not equivalent to the indenter modulus, demonstrated
a high correlation to the indenter modulus, indicating a relationship between the two

18
testing methods. The results also showed a clear difference between non-diseased and
diseased livers.
Chapter IV describes the transition from the evaluation of liver tissue to the
evaluation of tumor tissue. Though still in the murine environment, this work
demonstrated the utility of the assay in evaluating various tissue types with inherently
different consistencies. The mouse mammary tumor virus polyomavirus middle T (PyV-
mT) transgenic model of breast cancer served as the system of interest. The tumors were
allowed to grow to a prescribed size, at which point they were resected and sectioned. A
portion of the tumor was utilized in the MGT assay, while a second portion was analyzed
for collagen content. The model-evaluated modulus values were correlated quantitatively
to type I collagen content of the tissue samples, providing a first consideration of the link
between the bulk modulus as evaluated by the MGT assay and the microstructural
composition of the tissue. The results demonstrate a strong linear correlation between
tumor mechanical properties and collagen content.
Chapter V revolves around the quantification of a third tissue type using the MGT
assay. In this evaluation, the modulus values of a HER2+ murine model of breast cancer
were assessed. Two strains of the tumor line were utilized, one which is resistant to
treatment with Herceptin, and one which is responsive to the treatment. The resistant and
responsive lines simulate non-responders and responders in the human case, and the work
aimed to gage the potential difference in modulus between the two cases for prognostic
evaluation.
Finally, the last investigative chapter of this work contains other pertinent studies
with a specific interest in the interrogation of the sensitivity and accuracy of the assay in

19
order to validate its use as a reliable soft tissue modulus evaluation technique. A series of
tests were performed which examined the repeatability and accuracy of the assay, and the
assumptions employed within the assay were considered.
Significance of this Thesis
The novelty of the work presented here lies in the method of tissue parameter
evaluation coupled to model-based analysis and correlated with traditional cellular
assays. As indicated by the material testing literature, an abundance of methods exist by
which the mechanical parameters of soft tissue can be evaluated. This leads to a
discordance regarding the published modulus values for soft tissues. Additionally,
manipulating the soft tissue, especially when the sample is on the scale of a biopsy
specimen, has proven difficult and often requires specialized equipment. The MGT assay
allows for the utilization of the soft tissue in its native state, without extensive and
tedious manipulation which could, quite feasibly, affect the integrity and structure of the
tissue, and hence the measured modulus. The method utilized within the MGT assay
allows for ease of manipulation of the tissue specimen while maintaining adaptability to
tissue size and shape. In regards to a unified protocol, the MGT assay allows integration
of a preferred testing protocol and provides flexibility regarding mechanical model of the
tissue domain. Concisely, a rigorous skeleton of the soft tissue evaluation protocol is
defined by the MGT assay, which can then be customized to reflect the testing
environment.
Additionally, the treatment of the soft tissue of interest which is presented by the
MGT assay is a novel approach. As presented in the review of the material testing
20
literature, the majority of the approaches utilize a manipulation of the soft tissue in order
to normalize the size and shape of the sample. Depending on the location of origin of the
tissue, manipulating the sample can prove tedious and difficult due to the consistency.
Being that the accuracy of the modulus evaluation via mechanical testing can depend on
the success of creating a normal surface, the manipulation proves very important. The
approach presented within the MGT assay is a gel-embedding process, whereby the
excised soft tissue is used in its native shape and state, thus eliminating the need for
tedious manipulation. An approach such as this has not previously been utilized in soft
tissue modulus evaluation techniques. As previously mentioned, Erkamp et al. used a
gelatin to create a confined compression of the soft tissue of interest; however, in that
case the gel was utilized as part of the material testing setup instead of serving as a
contained portion of the sample. The gel-embedding approach indicated by the MGT
assay is a novel approach to sample preparation and testing.
A prime example of the utility of this system is evident within the field of
elastography. Techniques termed „elastographic‟ have been developed which allow for
noninvasive modulus evaluation of soft tissues. Though elastographic approaches can be
varied in regards to imaging modality (i.e. ultrasound versus MRI) and in method of
tissue evaluation (direct strain images versus inverse modulus evaluation) the theory is
the same. Specifically, a prescribed stress is applied to the tissue, during which the
internal displacements of the tissue are monitored. Using these deformations and
assuming a mechanical behavior of the tissue, a spatial map of the elasticity of the tissue
domain can be generated. In this manner, elastographic techniques can noninvasively
evaluate tissues for areas of low strain or high stiffness, which is generally correlated to

21
disease. However, in most cases these techniques have not been rigorously validated
regarding their assessment of modulus value, and though areas of interest can be
identified, the accuracy of the assessment of tissue parameters has been elusive due to the
non-invasive nature of the techniques. A system such as that conceived within the MGT
assay would allow for a direct evaluation of elastographic techniques. The heterogeneous
gel-tissue system is developed in such a way that it is readily amenable to modulus
evaluation via elastographic techniques. The modulus evaluation could then also be
performed using the combined mechanical testing and modeling approach outlined by the
MGT assay, the specifics of which would be defined so as to mimic the deformation
experienced in the elastographic evaluation. This would allow for direct comparison of
the evaluated modulus between the two methods, providing a measure of the accuracy of
the elastographic technique. Additionally, the MGT assay provides a heterogeneous
system that is analogous to that which is evaluated by elastographic techniques. More
specifically, when an in vivo soft tissue evaluation is performed using elastography, the
tissue of interest is generally subdermal and at least semi-confined by other tissues which
inherently impose boundary conditions on the tissue of interest. This environment is not
accurately reflected in an ex vivo direct testing situation where either an indenter or
compression test is utilized, as the external surfaces of the tissue are typically stress-free
in these cases. A confined compression may more closely resemble the native
environment, but realistically the confining substrate is likely to be far more stiff than the
restraining soft tissues in vivo. The MGT assay serves to address this issue in that it
begins to replicate the in vivo environment by embedding the tissue of interest within a
gel of controllable modulus.

22
CHAPTER II
EXPERIMENTAL PROTOCOL
MGT Assay Overview
The MGT assay was developed as an adaptive soft tissue modulus evaluation
technique that couples mechanical testing with modeling to achieve tissue
parameterization. The system consists of three major components. The first is the gel-
embedding process, whereby the soft tissue of interest is embedded in a cylindrical
polyacrylamide gel of known and controllable height and diameter. This creates a
heterogeneous system with normal surfaces amenable to direct material testing. A
homogeneous gel is also created at this time, termed the reference gel. The reference gel
is evaluated to obtain a modulus value of the polyacrylamide gel, which is then assigned
as the background modulus in the heterogeneous gel-tissue system. The second
component of the assay is the mechanical testing, which can be adapted so as to mimic
the environment of interest in regard to the tissue. The final component of the three-part
assay is the CT scan and modeling. Both the homogeneous gel and the heterogeneous
gel-tissue system undergo a microCT scan. The resultant images are then segmented in
order to create a 3D mesh of the sample. This allows for a model which accurately
describes the shape, size, location, and surfaces of the tissue and gel. The mesh is
utilized in a finite element model (FEM) description of the tissue domain with assumed
modulus values, and boundary conditions are implemented so as to mimic the mechanical
testing routine. The model-calculated force values are compared to the mechanical forces
23
achieved during material testing; optimization of the system results in an assigned tissue
modulus value.
Gel Generation
The gel-embedding process is pivotal to the MGT assay as it allows the use of the
soft tissue in its native state and shape without tedious manipulation. Additionally, the
gel-embedding process allows the formation of external surfaces which are controllable
in shape and size, hence increasing adaptability of the sample to various material testing
protocols. The process for creating the gels begins with the production of a buffer
solution consisting of all of the gel components with the exception of the contrast agent
and the initiator. This solution is then utilized in the production of all individual gels. To
create the buffer solution, deionized water, 1 molar Tris buffer, and 10% ammonium
persulfate (BioRad Laboratories, Hercules, CA) are mixed in a specified proportion, the
absolute volumes of which depended on the total volume of solution needed for gel
generation (i.e. larger tissue samples or a greater number of samples would require a
larger volume of bulk solution). Generally, 19.1 mL of deionized water, 0.65 mL of 1
molar Tris buffer, and 0.25 mL of 10% ammonium persulfate, or some multiple of these
values, are utilized. A volume of the buffer solution is then combined with 30%
Acrylamide/Bis-acrylamide (BioRad Laboratories, Hercules, CA) in a proportion which
is dependent on the desired final polyacrylamide percentage, to yield a total combined
volume of 16 mL (or some multiple of this volume). The combination of the buffer
solution and the polyacrylamide constitutes the bulk solution, which is then used in each
individual sample generation in order to enforce homogeneity across the samples. To

24
generate the individual gel, the desired volume of the bulk solution is transferred to the
forming container. The container used to generate the individual gel can be varied
depending on desired shape and size of the resulting sample. Optiray (Mallinckrodt Inc,
Hazelwood, MO), a CT contrast agent, is subsequently added to the individual gels after
allocation of the solutions. The object to be embedded is suspended by means of forceps
in the gel solution while TEMED, the initiating agent, is added to the solution. The
sample is pipette-mixed for approximately one minute as the solution begins to solidify in
order to promote a uniform mixture. In addition to the heterogeneous, tissue-containing
samples, a homogeneous reference gel is also produced during all gel generation
instances. The homogeneous gel is generated from the same solution and in the same
manner as the homogeneous gels, without the addition of the submerged tissue. This gel
serves as the reference gel for evaluating the modulus of the polyacrylamide, which is
then utilized as the assumed background modulus in the heterogeneous gel.
Material Testing
As indicated previously, the MGT assay is amenable to the use of any desired
mechanical testing protocol. However, for this work, the same protocol was utilized in
all tissue evaluations. Specifically, the protocol adopted in this work consists of a series
of unconfined step compressions followed by a 60 second dwell which was implemented
to allow the viscoelastic behavior of the gel and tissue to dissipate. This protocol was
selected to create compatibility with elastography techniques as our initial liver work was
designed as a comparison mechanism for ultrasound elastography evaluation of hepatic
fibrosis. To perform the material testing, after gel generation the individual samples are

25
removed from their forming containers and placed on the lower platen of the Enduratec
Electroforce 3100 tester (Bose, Enduratec Systems Group, Eden Prairie, Minnesota),
which has been previously fitted with the appropriately sized force transducer, dependent
on the size of the sample. Additionally, both platens are lubricated using an oil-based
spray which allows the sample to displace laterally while being compressed. The system
is tared after placing the sample so as to remove the weight of the sample from the
evaluated force value. The lower platen is then raised until the tissue initially contacts
the top platen. Contact is determined both visually and by a slight increase in the force
reading. After establishing contact, a 0.3 mm precompression is applied and held for 60
seconds. The testing protocol then consists of consecutive step compressions from 0.35
mm to 0.65 mm in 0.05 mm increments. After each step a 60 second dwell is
implemented to allow the transient behavior to dissipate.
Imaging and Mesh Creation
Imaging of both the homogenous gel and the heterogeneous gels is necessary in
order to implement the modeling portion of the MGT assay evaluation, and thus
computed tomography (CT) scans are collected of each sample. After collection of the
CT images, image segmentation is performed using AnalyzeAVW (Mayo Foundation for
Medical Education and Research). The addition of the contrast agent to the gel
generation process allows for sufficient contrast between the gel-tissue and the gel-air
interfaces such that thresholding based on pixel intensity and connectivity can be utilized
to segment the images. A marching cubes surface extraction is then performed on the
segmented images to create a surface description of the samples which is then used as a

26
bounding description for a custom-built tetrahedral mesh generator [54]. This results in
a 3-dimensional mesh for each individual sample, which describes the size, shape, and
boundaries of the polyacrylamide gel, as well as (in the heterogeneous gel) the size,
shape, location, and boundaries of the embedded soft tissue.
Finite Element Model
A central concept of the MGT modulus evaluation assay is the finite element
model (FEM) used to represent the domain of interest. In all work presented here, a
linear elastic medium is assumed, so that the set of mathematical equations governing
linear elastic deformations for this model is given by:
( ) (1)
where ( )⁄ is the shear modulus, ν is Poisson‟s ratio, and is the vector of
Cartesian displacements. Given this equation, a numerical solution to the coupled set of
linear partial differential equations is obtained using a weighted residual method. The
method begins with standard residual weighting and integration:
⟨ ⟩ ⟨
( ) ⟩ ∬ (2)
where an integration by parts has taken place which reduces the basis function order
requirement, and introduces the surface integral via the divergence theorem. In the
previous equation, the ⟨ ⟩ operator indicates integration over the problem domain, and
is the ith
member of a complete set of scalar functions of position. The particular
functions used can vary, but this work utilizes the standard Co local Lagrange polynomial
interpolants associated with finite elements. Using the Galerkin approach, the unknown
displacement vector is also expanded using a Lagrange basis function of position:

27
( ) ( ) ∑ ( ) (3)
The element used in this work was the standard linear tetrahedral element. Upon
substituting the basis function, the local weighted residual expression for the ith
equation
and the jth
set of displacement coefficients can be written as:
[ ]{ } { } (4)
where
[ ]
[ ⟨
( )
⟩ ⟨
⟩ ⟨
⟩
⟨
⟩ ⟨
( )
⟩ ⟨
⟩
⟨
⟩ ⟨
⟩ ⟨
( )
⟩]
{ } {
} * + {
∮
∮
∮
}
and
. The contribution from each tetrahedral element can thus be
determined, and a global stiffness matrix can be constructed. Boundary conditions are
then assigned either as displacement boundary conditions or as applied stresses, the
location and magnitude of which are determined by the material testing protocol.
Corresponding to the material testing protocol previously described, the boundary
conditions at the top surface of the gel in this work are:
(5)
where d is the displacement at the step compression of interest. At the bottom surface of
the gel, the boundary conditions are:
(6)

28
In order to ensure solution uniqueness, at least one Dirichlet condition is required in the
lateral directions. To achieve this, the approximately 10 nodes on the top and bottom
surface that are closest to the center-line are fixed on each surface to restrain their
movement laterally. The remaining boundary conditions for the sides of the gel are stress-
free:
(7)
The matrix system is then assembled and solved using an iterative matrix solver which
uses a biconjugate gradient solver with an incomplete LU preconditioner, resulting in a
displacement solution for the domain of the mesh.
Once the displacement solution is calculated from the matrix system, the unused
Galerkin equations on the compressing model surface (the Dirichlet, or Type I, conditions
on the top surface) can be used to estimate the average surface stress applied. To be
specific, after the evaluation of the displacement solution, the finite element equation:
∬ ∑ ⟨ ⟩ ∑ ⟨
⟩ (8)
is available at nodes where a Dirichlet boundary condition was implemented. The right-
hand-side of the equation can be constructed using the displacement solution, allowing
for the solution of the left-hand-side surface integral for the local normal stress
distribution. This provides a surface stress description for the gel based on the defined
compression and the prescribed modulus value. The surface stress can subsequently be
averaged and multiplied by the model-based surface area for comparison to the respective
mechanically-tested average force value.

29
Optimization Procedure
The process of evaluating the elastic modulus of the embedded tissue sample is
achieved via an inverse evaluation of the previously described FEM wherein the resulting
stresses are known and the input modulus values are to be determined. This inverse
evaluation of the modulus values is achieved by the implementation of an iterative
optimization technique which minimizes the difference between the resultant model
forces and the measured mechanical forces. The optimization is initialized using an
estimate of the modulus value (E) to perform a forward evaluation of the model forces.
The unknown modulus value is then optimized iteratively using a custom-built
Levenberg-Marquardt non-linear optimization algorithm. The optimized modulus value
occurs when the error between the model-derived force values and the experimental force
values is minimized. Thus, the objective function of consideration is the sum of squares
of the difference between the model force values and the experimental force values, and
is given by:
( ) ∑ ( ( ) ( ))
(9)
where Fexptl is the set of experimental force values at each strain level, Fmodel is the set of
model-calculated force values at each strain level for the current modulus value, and N is
the number of strain levels. To optimize for the modulus value E which minimizes the
objective function, the derivative of the objective function is taken with respect to the
modulus of interest and set equal to zero:
∑ ( ( ) ( ))
( )
(10)
or,
{ }, - (11)

30
where , - is the transpose of the Jacobian matrix J, which is the matrix consisting of the
first-order partial derivatives of Fmodel with respect to the modulus. Applying a standard
Newton-Raphson root-finding approach to equation 11 results in:
, - { }
, - (12)
from which the parameter update can be calculated using a standard Levenberg-
Marquardt approach,
(, - , - ) , - { } (13)
where I is the identity matrix, and α is a regularization parameter
utilized to improve the conditioning of the iterative procedure:
( (, - , -) )
(14)
In the definition of α, λ is an empirical factor and SSE is the sum squared error between
measured and calculated forces [55]. Optimization of the modulus value occurs by a
series of iterative parameter updates, calculated using Eq. 13. The optimization proceeds
until the relative error between iterations is below a set tolerance or until the objective
function is static and a unique solution is obtained.
Tissue Modulus Evaluation
With the components of the MGT assay in place, the evaluation of the tissue
modulus takes place in a series of defined steps. First, the homogeneous and
heterogeneous gels are generated, tested, and imaged as previously described. The CT
scans are segmented and a tetrahedral mesh is generated for each sample. The FEM is
then utilized in the Levenberg-Marquardt optimization procedure to perform the modulus
evaluation. The homogeneous reference gel is evaluated first, and the optimization

31
procedure is implemented with the material testing data in order to obtain the modulus
value of the polyacrylamide gel. The optimized gel modulus value is then used as the
assigned background gel modulus in the heterogeneous sample. This reduces the two
parameter system (gel modulus and tissue modulus) to one unknown modulus value. The
heterogeneous sample is subsequently evaluated, using its associated material testing
data, and an optimized tissue modulus value is assigned.

32
CHAPTER III
EX VIVO LIVER STUDY
Introduction and Contribution of Study
This paper was the first publication regarding the MGT assay, and the murine
liver work presented here represents the initial development of the MGT assay as well as
the first implementation of the assay as a modulus evaluation technique. This study
addressed proof of concept of the assay in regards to its feasibility and application. The
combination of the gel-embedding, mechanical testing, and modeling proved to be
successful in evaluating the modulus of a soft tissue sample in its resected shape, without
alteration. The introduction and some of the methods may be repetitive in regards to
Chapter II due to the necessity of presenting a detailed description of the MGT in this
principal paper. Beyond the details of the assay, this paper served as the first evaluation
of a soft tissue specimen via the MGT assay and provides validation of the assay-
assigned modulus in comparison to indentation testing, thus verifying its utility as a
modulus evaluation technique. The motivation for this work was to develop a correlative
technique for soft tissue modulus evaluation that could be used in conjunction with
ultrasound elastography. The need for a sample preparation method that was compatible
with both ultrasound imaging and mechanical evaluation techniques led to the
development of the gel-embedding system utilized in the MGT assay. The development
of the assay serves to connect the material testing literature and the evaluation of
elastographic techniques. Additionally, this work adds to the material testing literature

33
by presenting a novel approach to soft tissue modulus evaluation that can be adapted to
suit the nature of the specific interrogation. This work was published in Medical Physics
in November of 2007.
Experimental Study
DEVELOPMENT OF A MECHANICAL TESTING ASSAY FOR FIBROTIC
MURINE LIVER
Appearing in
Medical Physics, Volume 34, Number 11, November 2007
Abstract
In this article, a novel protocol for mechanical testing, combined with finite
element modeling, is presented that allows the determination of the elastic modulus of
normal and fibrotic murine livers and is compared to an independent mechanical testing
method. The novel protocol employs suspending a portion of murine liver tissue in a
cylindrical polyacrylamide gel, imaging with a microCT, conducting mechanical testing,
and concluding with a mechanical property determination via a finite element method
analysis. More specifically, the finite element model is built from the computerized
tomography (CT) images, and boundary conditions are imposed in order to simulate the
mechanical testing conditions. The resulting model surface stress is compared to that
obtained during mechanical testing, which subsequently allows for direct evaluation of
the liver modulus. The second comparison method involves a mechanical indentation
test performed on a remaining liver lobe for comparison. In addition, this lobe is used for
histological analysis to determine relationships between elasticity measurements and

34
tissue health. This complete system was used to study 14 fibrotic livers displaying
advanced fibrosis (injections with irritant), three control livers (injections without
irritant), and three normal livers (no injections). The moduli evaluations for non-diseased
livers were estimated as 0.62±0.09 kPa and 0.59±0.1 kPa for indenter and model-gel-
tissue (MGT) assay tests, respectively. Moduli estimates for diseased liver ranged from
0.6–1.64 kPa and 0.96–1.88 kPa for indenter and MGT assay tests, respectively. The
MGT modulus, though not equivalent to the modulus determined by indentation,
demonstrates a high correlation, thus indicating a relationship between the two testing
methods. The results also showed a clear difference between non-diseased and diseased
livers. The developed MGT assay system is quite compact and could easily be utilized
for controlled evaluation of soft-tissue moduli as shown here. In addition, future work
will add the correlative method of elastography such that direct controlled validation of
measurement on tissue can be determined.
Introduction
Investigating the mechanical properties of soft tissue has important impact on
many application fronts within biomedical engineering. The nature of soft tissue is that
of a composite material whereby collagen and elastin fibers contribute most substantively
to its mechanical properties. Hepatic fibrosis is an example of a disease where the elastic
properties generally increase as the disease progresses due to elevated deposition of
collagen. Though the distribution of the scar tissue within the liver will vary based on the
cause of the fibrosis, the response is the same for all types; i.e. a cascade of events occurs
that cause stellate cells to become activated, and in turn, contract, and produce scar tissue.

35
A process known as fibrogenesis degrades the liver‟s normal matrix, and release
cytokines which cause inflammation. All of these effects result in disruption of the
liver‟s normal function [56, 57]. Quantifying the mechanical properties with novel
testing assays or imaging techniques could be an excellent way to stage disease and
outcomes. In recent years, noninvasive imaging techniques have been a very active area
of research, i.e. the field know as elastography [28, 58-61]. Within this domain, some
example applications using mechanical properties to assess organ health have been
forthcoming including breast [25, 62-66], prostate [67, 68], thyroid [69], and
intravascular evaluations [70, 71].
While the recognition that mechanical properties may be important for tissue
characterization, detailed quantitative experimental systems correlating imaging modality
and independent assessment have been difficult with real tissue. For example, one
popular method of mechanical property interrogation is compression testing and consists
of compressing a known geometric sample between two plates and measuring the applied
displacements and resulting forces [42]. From this data, various mathematical
constitutive models of the tissue can be generated that relate the stress, strain, and rates
thereof. While this testing is quite routine, the tissue sample preparation can be a
challenge especially with respect to small irregularly shaped samples. Due to this
restriction, mechanical indentation techniques have become a popular method for
modulus assessment also. A variety of different approaches to indentation testing have
been cited in the literature [46, 47, 72-74]. However, eliciting a modulus value from
indenter testing requires significant experimental assumptions, the basis of which is
dependent on many factors, such as sample size and shape, indenter type, and boundary
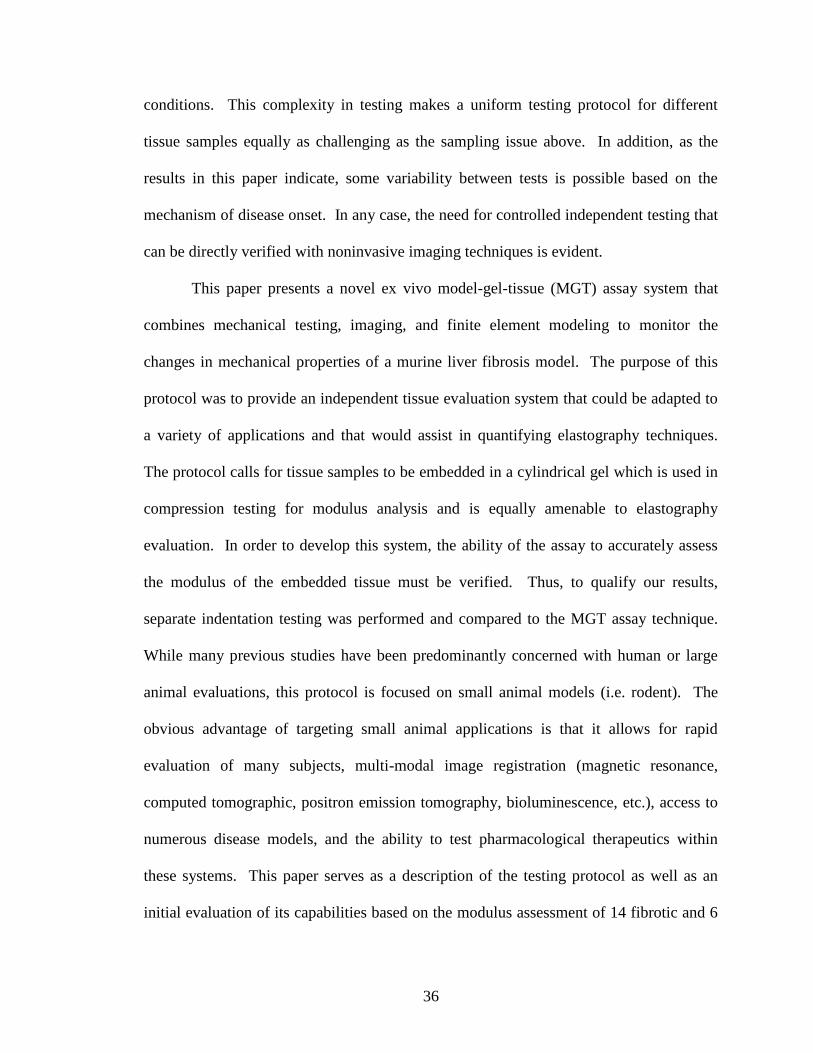
36
conditions. This complexity in testing makes a uniform testing protocol for different
tissue samples equally as challenging as the sampling issue above. In addition, as the
results in this paper indicate, some variability between tests is possible based on the
mechanism of disease onset. In any case, the need for controlled independent testing that
can be directly verified with noninvasive imaging techniques is evident.
This paper presents a novel ex vivo model-gel-tissue (MGT) assay system that
combines mechanical testing, imaging, and finite element modeling to monitor the
changes in mechanical properties of a murine liver fibrosis model. The purpose of this
protocol was to provide an independent tissue evaluation system that could be adapted to
a variety of applications and that would assist in quantifying elastography techniques.
The protocol calls for tissue samples to be embedded in a cylindrical gel which is used in
compression testing for modulus analysis and is equally amenable to elastography
evaluation. In order to develop this system, the ability of the assay to accurately assess
the modulus of the embedded tissue must be verified. Thus, to qualify our results,
separate indentation testing was performed and compared to the MGT assay technique.
While many previous studies have been predominantly concerned with human or large
animal evaluations, this protocol is focused on small animal models (i.e. rodent). The
obvious advantage of targeting small animal applications is that it allows for rapid
evaluation of many subjects, multi-modal image registration (magnetic resonance,
computed tomographic, positron emission tomography, bioluminescence, etc.), access to
numerous disease models, and the ability to test pharmacological therapeutics within
these systems. This paper serves as a description of the testing protocol as well as an
initial evaluation of its capabilities based on the modulus assessment of 14 fibrotic and 6

37
non-diseased livers. The separate indentation tests were consistent with the MGT assay
results for control and normal livers. While stiffening of the tissue was measured by both
MGT assay and indentation tests, there was inconsistency among the absolute values
established for fibrotic livers (consistency for the normals/controls). Interestingly
though, the offset between the values among the two testing methods was correlated. It is
also shown that statistical differences in modulus values for fibrosis and controls can be
detected in both the MGT assay and indentation tests. In addition, the results from the
liver testing seem to correlate with those found in the literature for normal and fibrotic
human liver testing post mortem [57].
Methods
The protocol used to evaluate fibrotic and non-diseased murine liver involves a
series of steps as shown in Figure 1. This three-pronged investigation sought to
characterize liver tissue in three distinct ways: (1) mechanical testing with an ex vivo
MGT assay, (2) mechanical testing by indentation, and (3) tissue characterization for
disease progression via histochemical staining. This system of tissue evaluation allows
for an investigation of the abilities of the proposed MGT assay by comparison with
traditional indenter testing technique, while correlating elasticity measurements with
normal and diseased subjects.

38
Fibrosis Model & Disease Scoring
Adult C57 mice (18-20 g, 8-10 weeks of age) purchased from Jackson Laboratory
were housed in cages with a 12-hour light/dark cycle (6 a.m. to 6 p.m.) and provided with
rodent chow and tap water ad libitum. All animals received humane care in compliance
with the institution's guidelines, and animal procedures were approved by the
Institutional Animal Care and Use Committee, which is certified by the American
Association for Accreditation of Laboratory Animal Care. The animals were divided into
three groups – fibrosis, controls, and normals. The fibrosis group of mice consisted of
fourteen animals that received weekly intraperitoneal (IP) injections of carbon
Figure 1. General mechanical testing framework for murine liver system.

39
tetrachloride (Sigma Chemical, St. Louis, MO) mixed with olive oil (Sigma Chemical, St.
Louis, MO) in a 1:4 ratio, respectively. Each dose of CCl4 was 1 ml/kg per injection.
The second group of mice consisted of three animals and was the control group. This
group received weekly IP injections of pure olive oil. The third group, the normal group,
consisted of three animals and did not receive IP injections (of note these mice were
several weeks older than groups 1 and 2). Diseased mice were sacrificed at variable time
points between 2 and 10 weeks of treatment. Using histological assessment, only mice
that were of an Ishak fibrosis scores of 3 or 4 (advanced fibrosis) were selected for
comparison. A control mouse was sacrificed after five, six, and eight weeks of treatment.
The liver was removed and divided into three sections. The first, and largest, section
consisted of two of the four lobes, and was embedded in the polyacrylamide gel. The
third lobe was preserved for use in indenter testing and histological analysis, and the
fourth lobe was frozen for future analysis.
Histological analysis of the liver tissue was performed using the liver lobe
designated for indenter testing. After indenter testing, the tissue was fixed in 10%
buffered formalin, dehydrated in graded ethylic alcohol, and embedded in paraffin.
Sections were generated with a thickness of 5 micrometers and were stained with
hematoxylin/eosin (H/E) or 0.1% Sirius red. The H/E stained sections were analyzed
under light microscope for histopathological assessment. The Sirius red stained sections
were used for fibrosis evaluation. These specimens were scored using Ishak (score 0-6)
systems, which is commonly used in clinical pathology. The Ishak system grades mild
fibrosis as 0-1, advanced fibrosis as 2-4, and cirrhosis as 5-6 [75].

40
Model-Gel-Tissue (MGT) Assay Construction
In order to provide a controllable evaluation technique, a system of embedding
extracted murine livers in a cylindrical gel has been developed. This gel-matrix provides
a reference material for evaluation, provides a measurable contrast in elasticity between
the gel and liver, and allows for use of true tissue shape by building a model based on
microCT scans of the gel. In addition, the cylindrical gel could easily be utilized in
multiple imaging modalities for possible elastography assessment. The gel-tissue
samples also needed to be appropriately shaped for both imaging applications and
material testing. In order to make the system amenable to compression testing, this
meant a small sample size with a uniform shape. To achieve this, the gel samples were
generated in Petri dishes that had a known diameter. This created a cylindrical shape
with a measurable surface area and a consistent height. The process of tissue submersion
involved a simultaneous tissue resection and mixing of base components of the
polyacrylamide gel (BioRad Laboratories, Hercules, CA). The components were 1 molar
Tris buffer, deionized water, and ammonium persulfate (APS). Graphite flakes (Sigma-
Aldrich Chemie GmbH, Buchs, Switzerland) were also added to the base solution; these
were necessary to provide ultrasound contrast (although this will not be reported in this
work at this time) for imaging. During liver resection, the buffer solution was mixed as
indicated in Table 1. Once the liver was removed and sectioned, the portion dedicated to
the gel sample was weighed using a digital balance. In order to generate the individual
gel sample, the buffer solution and acrylamide/polyacrylamide were mixed in a Petri dish
according to the proportions indicated in Table 1. To provide a perceivable distinction
between the liver and gel in the CT scans for segmentation purposes, a computed

41
tomography (CT) contrast agent, Optiray (Mallinckrodt Inc, Hazelwood, MO), was
included in the gel mixture. The liver sample was then suspended in the liquid gel using
forceps and TEMED was added, which initiates the polymerization reaction to cause
solidification of the gel. The solution was agitated during the solidification process,
which required approximately two minutes, using pipette mixing; the agitation prevented
settling of the graphite flakes. This process was performed for the fibrosis liver, the
control liver, and the normal liver; gels with a fibrotic liver embedded are referred to as
fibrosis gels, gels with a control liver embedded are referred to as control gels, and gels
with a normal liver are referred to as normal gels. In addition, a reference gel was
generated, which was produced as described above, without the addition of the liver
sample. This reference gel was utilized in material testing in order to evaluate the
modulus of the polyacrylamide gel generated on the occasion of each fibrotic liver
evaluation. Fourteen fibrosis gels, three control gels, and three normal gels were
generated over the course of the research.
Table 1. Polyacrylamide gel recipe utilized for the liver evaluations.
Polyacrylamide Gel Recipe
Buffer Solution
Individual Gel Recipe (5% Polyacrylamide)
38.2 mL deionized H2O 6.67 mL buffer solution
1.3 mL 1 M Tris buffer 1.33 mL 30%
Acrylamide/Polyacrylamide
0.5 mL 10% APS solution 0.2 mL Optiray CT contrast
1.5 g graphite 0.07 mL TEMED
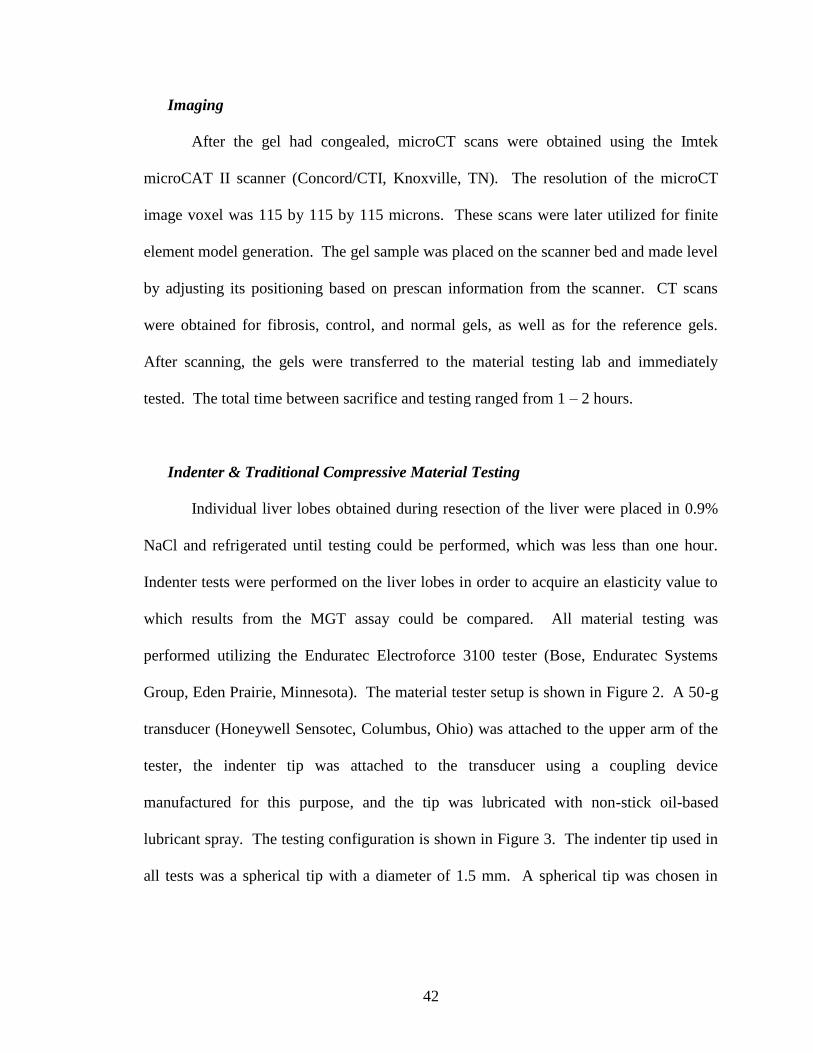
42
Imaging
After the gel had congealed, microCT scans were obtained using the Imtek
microCAT II scanner (Concord/CTI, Knoxville, TN). The resolution of the microCT
image voxel was 115 by 115 by 115 microns. These scans were later utilized for finite
element model generation. The gel sample was placed on the scanner bed and made level
by adjusting its positioning based on prescan information from the scanner. CT scans
were obtained for fibrosis, control, and normal gels, as well as for the reference gels.
After scanning, the gels were transferred to the material testing lab and immediately
tested. The total time between sacrifice and testing ranged from 1 – 2 hours.
Indenter & Traditional Compressive Material Testing
Individual liver lobes obtained during resection of the liver were placed in 0.9%
NaCl and refrigerated until testing could be performed, which was less than one hour.
Indenter tests were performed on the liver lobes in order to acquire an elasticity value to
which results from the MGT assay could be compared. All material testing was
performed utilizing the Enduratec Electroforce 3100 tester (Bose, Enduratec Systems
Group, Eden Prairie, Minnesota). The material tester setup is shown in Figure 2. A 50-g
transducer (Honeywell Sensotec, Columbus, Ohio) was attached to the upper arm of the
tester, the indenter tip was attached to the transducer using a coupling device
manufactured for this purpose, and the tip was lubricated with non-stick oil-based
lubricant spray. The testing configuration is shown in Figure 3. The indenter tip used in
all tests was a spherical tip with a diameter of 1.5 mm. A spherical tip was chosen in

43
order to minimize damage to the tissue so that the liver lobes could subsequently be
utilized for histological testing. The liver lobes were placed on the lower platen of the
material tester, and the force and displacement values were zeroed prior to lowering the
indenter. The indenter tip was manually lowered until it made contact with the liver
Figure 2. Material testing setup used in the MGT assay.
Figure 3. Close up of liver indentation setup. The liver was positioned so that contact
with the indenter occurred at a point where the liver was uniform in height.

44
surface, which was determined by visual inspection and by observation of a sudden
increase in the force values registered by the transducer. Contact between the liver and
indenter was regulated between specimens by maintaining a force value between 0.01
and 0.03 g at initial contact. The liver lobe was situated on the platen relative to the
indenter so as to provide a uniform surface for indentation. The indentation occurred at
the thickest portion of the liver, in an area where there were no steep surface gradients.
Development of an indentation protocol that correlated to the compression
protocol was necessary in order to generate results that could be analyzed relative to one
another. However, in indentation testing, it is necessary that the depth of indentation not
exceed the radius of the indenter tip to prevent aberrant behavior of the indentation
model. In order to remain within the confines of the indenter system, the indentation
protocol consisted of three indentations to a depth of 0.4 mm. Each indentation was held
for a 60 second dwell period, which allowed the viscoelastic effects to dissipate, and then
released. The indenter returned to zero position, and remained there for 60 seconds, at
which point another indentation occurred in the same manner. In addition, each liver was
measured after testing using a digital caliper to determine the thickness of the specimen at
the region of indentation for use in modulus calculation.
The gel-tissue cylindrical specimen was tested using traditional compression.
Due to the increased size of the specimen, the load cell used was a 250 gram transducer
(Honeywell Sensotec, Columbus, Ohio). Figure 4 illustrates the setup for compression
testing. Each gel was weighed using an analytical balance and measured using digital
calipers (diameter and height) prior to testing. Both platens of the material tester were
lubricated, again using the non-stick oil-based lubricant spray. The material tester was

45
zeroed after placing the gel specimen on the platen, so that the weight of the gel was not
considered in the measured force. The platen was then raised until initial contact with the
gel surface. This was determined by visual cues as well as a negligible increase in the
force reading. For the compression case, the initial force values were limited to between
1 and 2 grams. A precompression of 0.3 mm was applied to each gel prior to testing in
order to ensure full contact with the gel surface (~3-5% prestrain). The testing protocol
consisted of a series of step compressions, applied in 0.05 mm increments, from 0.35 mm
to 0.65 mm (~max strain 6.5-9%). After each step, the compression dwelled for 60
seconds, as was implemented in the indentation, to allow the force to reach steady state.
The test was performed twice for each gel.
Figure 4. Gel compression testing setup.

46
Computational Model for Indentation and Model-Gel-Tissue Assay
With respect to the indentation testing data, the mechanical properties were
determined using the correlation model suggested by Stevanocić et al. which concerned
the contact between a rigid sphere and an elastic layer bonded to a rigid substrate [76].
The assumption is that the boundary defined between the liver and the bottom platen
experiences no-slip conditions, and hence the liver can be modeled as an elastic medium
bonded to the rigid platen. Stevanocić et al. developed a set of equations that was able to
normalize the data presented by Chen and Engel [77] for a variety of varying modulus
combinations by utilizing a dimensionless radius and layer thickness, which caused all of
the curves to collapse onto one normalized curve. The correlation equation derived by
Stevanocić et al. is:
.
/
(15)
where c1,c2, and c3 are correlation coefficients, which, based on the analysis by
Stevanocić et al., are defined as -1.73, 0.734, and 1.04, respectively, a represents the
contact radius, aL is the contact radius corresponding to an infinitely thick elastic layer,
and t is the layer thickness. The contact radius, a, for a spherical indenter can be
calculated from:
√ (16)
where ρ is the radius of the spherical indenter tip and d is the penetration depth of the
indenter. To calculate the contact radius for an infinitely thick elastic layer, the Hertz
relation must be consulted:
√
( )
(17)

47
where E denotes the elastic modulus of the medium, υ the Poisson‟s ratio, and F the
applied load. For this research, if a Poisson‟s ratio is assumed for the tissue, all of the
elements of equation 3 are known except for Young‟s Modulus of the tissue. In past
work, it has shown that for general soft tissue organs 0.45 has captured 1st order elasticity
effects for liver and brain reasonably well [78-81]. This value would correlate with a 9:1
ratio of the Lamé constants (λ:G with G the shear modulus, and λ the bulk modulus)
which is reasonably below the convention for Poisson locking which is important for the
MGT assay (sometimes called mesh locking and typically has λ»G, or ν→0.5).
Substituting equations 16 and 17 into equation 15 and solving for the modulus gives:
( )
( .
/
)
√
(18)
The modulus for each liver lobe was calculated for each of the three indentations. The
indentation depth and applied force were both calculated as the average respective value
over the last 20 sampling points of the dwell, at which time the viscoelastic response had
dissipated. The three calculated modulus values were then averaged to obtain the final
elastic modulus value for each liver.
For the traditional compression test, a more complex model analysis was
performed. Finite element analysis was combined with physical material testing to
determine the modulus of interest. A critical component in this analysis was the selection
of the model to represent the continuum of interest. In this work a Hookean elastic solid
was chosen. This model assumes a symmetric, isotropic, specimen in equilibrium under
small strains. These assumptions linearize the strain tensor and simplify Cauchy‟s law
from 36 stiffness constants to 2 (Young‟s modulus E, and Poisson‟s ratio ν) and use the

48
traditional mechanical equilibrium equation. Similar to the indentation tests, Poisson‟s
ratio was assigned to be 0.45. However, sensitivity tests with respect to Poisson‟s ration
and the models associated with indentation and model-gel analysis are summarized at the
end of this section.
Based on the equations for linear elastic deformation, a finite element system was
developed for the gel-tissue domain. An iterative matrix solver was used to solve the
sparse FE system which used a biconjugate gradient solver with an incomplete LU
preconditioner [82]. To construct the domain, microCT image volumes were acquired
prior to compression. In all experiments, the control, normal, and fibrosis gel systems
were imaged and the gel and tissue were segmented using AnalyzeAVW (Mayo
Foundation for Medical Education and Research, Rochester, MN). Due to the doping of
the gel with CT contrast, it was relatively simple to extract the liver volume using the
standard morphometric operations of threshholding and region-growing. The segmented
volumes were found to agree with estimated volumes based on an assumed liver tissue
density and the measured mass of the tissue. Upon completion of the segmentation, a
surface description was generated and used as a bounding description for a custom-built
tetrahedral mesh generator [54]. Figure 5 illustrates the geometric model construction
process with Figure 5a demonstrating a representative CT slice of the murine liver within
a contrast-doped gel. Figure 5b illustrates a homogeneous gel tetrahedral mesh (as can be
seen, small gel surface defects were even captured with the process). Figure 5c illustrates
the extracted liver tetrahedral mesh within the gel system.
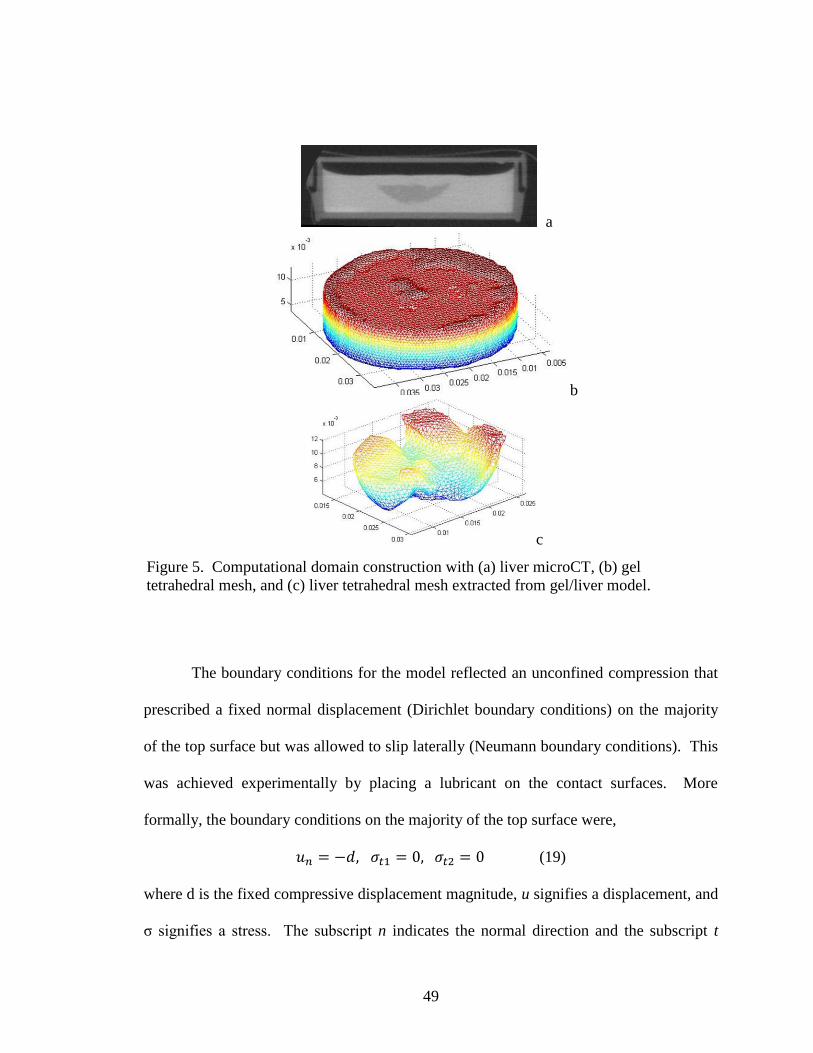
49
The boundary conditions for the model reflected an unconfined compression that
prescribed a fixed normal displacement (Dirichlet boundary conditions) on the majority
of the top surface but was allowed to slip laterally (Neumann boundary conditions). This
was achieved experimentally by placing a lubricant on the contact surfaces. More
formally, the boundary conditions on the majority of the top surface were,
(19)
where d is the fixed compressive displacement magnitude, u signifies a displacement, and
σ signifies a stress. The subscript n indicates the normal direction and the subscript t
a
b
c
Figure 5. Computational domain construction with (a) liver microCT, (b) gel
tetrahedral mesh, and (c) liver tetrahedral mesh extracted from gel/liver model.

50
indicates a tangent-to-the-surface direction (subscript 1 or 2 indicates the two tangent
axes associated with a right hand coordinate system). Similarly, at the bottom surface,
the boundary conditions were,
(20)
In order to ensure solution uniqueness, at least one Dirichlet condition is required in the
lateral directions. To achieve this, nodes on the top and bottom surface that were within
approximately 15 microns of the center-line (which translated to approximately 10 nodes)
were fixed on each surface to restrain their movement laterally. The remaining boundary
conditions for the sides of the gel were stress-free, i.e.
(21)
This paper serves to compare modulus estimates as provided by a novel MGT
assay and that provided by indentation theory. In the model-based comparison method,
the above model is compressed in simulation to a degree that matches the physical
compression of its mechanically tested physical counterpart. As mentioned previously,
for each gel with embedded liver, a corresponding homogeneous (reference) gel is also
constructed. From the mechanical tester, an average force applied to either gel surface
(homogeneous or liver-gel system) is recorded. By measuring the contact surface area,
an average stress can consequently be determined. Similarly, in the simulation, a
compression is prescribed according to (19), (20), and (21). Once the boundary
conditions are prescribed, a solution is calculated which is based on an initial estimate of
the gel and liver properties for each of the gel systems (homogeneous and liver-gel
systems). Once the displacement solution is calculated, the unused Galerkin (weighted
residual finite element technique) equations associated with implementing Dirichlet

51
conditions along the compressing surface can be used to estimate the boundary integral
resulting from the standard weighted residual form, and subsequently the local boundary
stress. This stress is averaged and multiplied by the surface area and then compared to
the mechanical tester result. The determination of the liver modulus occurs in two steps.
The reference gel (which is made at the same time as gel-tissue suspensions) is tested in
the mechanical tester, and the modulus to match the model to the mechanical testing
output is performed. Once determined, this is the assumed modulus of the gel within the
heterogeneous liver-gel system. The properties of the liver are then determined by the
same process of comparing measured to predictive average stresses.
As alluded to above, Poisson‟s ratio estimates were utilized in both the indenter
modulus calculation and the finite element simulation for model modulus calculation. In
order to assess the variability of the results based on Poisson‟s ratio selection, a range of
Poisson‟s ratio in both calculations were tested. Based on previous experience, a value of
0.45 was assumed to be a reasonable estimation. From this assumption, it was opted to
test a range of Poisson‟s ratio values from 0.43 to 0.49. For the indenter test calculations,
the evaluation only required changing the Poisson‟s ratio that was utilized in the
calculations for the modulus value. Each Poisson‟s ratio in the range was substituted into
the equation and the resulting modulus value was recorded. This evaluation was
performed for each of the tested livers (14 fibrotic, 3 control, and 3 normal). For the
model calculation, the evaluation was performed using one of the sample fibrotic livers
(analysis for #11). The range of Poisson‟s ratio values tested was from 0.43 to 0.48 (in
the case 0.49, conditioning in the stiffness matrix was poor). For the liver of interest, the
previously described modulus evaluation technique was performed a total of six times,

52
with each of the different Poisson‟s ratios. The modulus value obtained for each ratio
was recorded for comparison.
Results
Figure 6 illustrates the average stress-strain behavior of the reference gels with the
values extracted after the 60 second dwell period. Generating an estimate of the
reference gel properties (which was created at the same time as the gel-tissue suspension)
was important to the model-based characterization of mouse-liver properties. Figure 7
illustrates a similar stress-vs-strain application for a gel containing a murine liver, with
data points again collected after the 60 second dwell. Figure 8 illustrates the excitation
and dwell period of a typical indentation test.

53
Figure 6. Stress-strain curves for reference gels from compression testing. A
precompression of approximately 4% strain (0.3 mm) was applied prior to testing. The
values are average values for the two compression tests performed on each gel, with
error bars indicating the standard deviation of the two tests.
Figure 7. Stress-vs-strain behavior taken after the 60 second dwell for the gel-tissue
system of a fibrotic specimen. The two curves represent the two compression tests.
The data points represent the stress value after the dwell period at each step
compression.

54
The results from the indentation testing of the liver lobes are given in Tables 2, 3,
and 4. Table 2 contains the data for the fibrotic livers. The values are given as the
average of the three indentation tests for each liver. Table 3 contains the average
modulus values and the standard deviations for the indenter assessment of the fibrotic
livers. Table 4 contains the data for the control livers and the normal livers without
treatment. The average value and standard deviation are given for the three controls, the
three normals, and the non-diseased group, which contains all six control and normal
livers. In each case, the standard deviation is small, indicating the variability of inter-
sample moduli. The model-based calculation of fibrosis, control, and normal liver
moduli are given in Tables 2, 3, & 4, also. For the model-based simulations, the control
liver from liver 2 was not available so model data from only two control livers were used
Figure 8. Example of force data obtained from liver indentation test. The temporal
decay of the force data during sustained compression indicates the viscoelastic nature of
the tissue. However, the effect dampens and a steady state has been approximately
established at the end of the dwell.

55
to determine the control liver properties. In both the model-based and indenter cases, the
control and normal moduli did not vary over the course of the experimentation. When
considering the control/normal liver moduli as compared to the fibrosis liver moduli, both
the indenter testing and the model results show a difference between groups. Fibrotic
livers 6, 7, and 12 have indenter modulus values that are slightly lower than the others
and are not distinct from the non-diseased average modulus, but the average fibrosis
value for the indenter assessment is distinct from the average non-diseased value.
Table 2. Results from indenter material testing and model compression simulation for
fibrosis and reference gels.
Liver Number
Ishak Grade
Indentation Modulus
(kPa)
Model (Compression)
Indenter Percent of Model Modulus
- Fibrosis
Liver Modulus
(kPa)
Reference Modulus
(polyacrylamide) (kPa)
1 4 1.56 1.53 6.12 101.9%
2 4 1.26 1.70 6.52 74.3%
3 4 1.64 1.88 6.69 87.5%
4 4 1.18 1.53 6.67 77.5%
5 4 0.85 1.42 5.84 59.9%
6 3 0.70 0.96 5.84 73.1%
7 4 0.72 1.05 5.84 69.0%
8 4 1.06 1.39 5.79 76.3%
9 4 0.95 1.10 5.79 85.9%
10 4 1.07 1.31 5.52 81.8%
11 4 0.87 1.05 5.66 82.6%
12 3 0.60 0.97 5.66 61.1%
13 4 1.07 1.50 6.20 71.3%
14 4 1.08 1.60 6.20 67.8%

56
A correspondence is suggested between indenter and model-gel-tissue assays of
modulus, as can be seen in Figure 9 and in the last column of Table 2. Figure 9 plots the
model-based modulus for each fibrotic liver versus the indenter test modulus. A general
trend exists between the two sets of measures, whereas the indenter modulus increases, so
does the model modulus. This is again represented in the last column of Table 2, which
gives the indenter modulus as a percentage of the model modulus. With exception of the
liver 1 measurement, the modulus as measured by the indenter is consistently lower and
represents an approximate mean of 76.4% ± 11.1%. As Figure 9 indicates, a discrete
least squares approximation generates a reasonably good linear fit between the two
methods.
Table 3. Average modulus values and standard deviations from indenter material
testing and model compression simulation for fibrotic livers.
Indenter Model
Average 1.04 1.36
Standard Deviation 0.30 0.29
Table 4. Average modulus values and standard deviations from indenter material
testing and model compression simulation for control gel.
Indentation
Modulus (kPa) Model – Compression
Modulus (kPa)
Control Average (kPa) 0.69 ± 0.06 0.66 ± 0.13
Normal Average (kPa) 0.55 ± 0.04 0.55 ± 0.06
Average Non-Diseased Modulus (kPa) 0.62 ± 0.09 0.59 ± 0.10

57
A test for normality was conducted on both the model and indenter modulus
assessment data for the fibrotic livers. The Lilliefors test for normality was utilized,
which allows analysis on continuous data with estimated mean and standard deviation
[83]. In both cases, the null hypothesis of a normal distribution could not be rejected. A
t-test analysis was performed to assess the difference in means between the non-diseased
group and the fibrosis group for both the indenter analysis and the model analysis. In
both cases, a difference was detected at a significance level of 0.01. A t-test was also
utilized to assess the difference in means between the indenter and model analysis for the
fibrosis group. The analysis indicated that the average indentation modulus was lower
than the average model modulus for the fibrosis group at the 0.01 significance level. The
Figure 9. Liver model modulus as a function of indenter modulus for fibrotic samples.
The correlation coefficient between the two sets (R2=0.741, R=0.861) indicates a
relationship between the two measures.

58
non-diseased results from the indenter analysis and the model analysis were compared
using a t-test, and in this case, the null hypothesis of equal means could not be rejected.
Finally, an outliers test was performed on the data point for liver 1, which is the only
instance of the indentation modulus computed as larger than the model modulus.
Grubb‟s test was performed on the data for the ratio of the indenter test to the model test,
and the data point for liver 1 was found to be an outlier. Removing the data point for
liver 1 from the correlation curve (figure 9) increases the correlation between the two
curves, as shown in figure 10 below.
Figure 10. Liver model modulus as a function of indenter modulus for fibrotic
samples. When the data point for liver 1 is removed, the correlation coefficient
between the two sets increases (R2=0.820, R=0.905).

59
In the Poisson‟s ratio evaluation, the effects were generally minimal from varying
the Poisson‟s ratio. In the indenter case, the maximum difference in modulus for any of
the livers was approximately 75 Pascals between Poisson‟s ratio values of 0.43 and 0.49.
In the model evaluation, the maximum modulus difference was approximately 255
Pascals, between 0.43 and 0.48 (with 0.49 resulting in ill-conditioned stiffness matrix).
Discussion
Research has indicated that, in general, biological soft tissues are viscoelastic in
nature, and, therefore, research commonly utilizes cyclic compressions to estimate the
viscous reaction of biological soft tissue and isolate their elastic nature [84]. In contrast,
some testing regiments institute a dwell period if they are concerned with factoring out
such influences. When considering diagnostic processes such as elastography, in
particular static-based methods which involve a prolonged state of compression, using the
latter strategy to estimate properties would seem appropriate [28, 85]. When considering
surgical loading conditions also, a static-based assessment is more suitable [78]. Thus,
for compatibility reasons with research directions within the laboratory, a dwell period
was instituted to factor out transient behavior and data was analyzed at these approximate
steady state times. The dwell period length was chosen as 60 seconds for two reasons.
First, this length of time was sufficient to approximate steady state as is indicated by
Figure 8, which shows the force curve for a sample liver indentation under the protocol
described above. Second, this time frame is relative to how long it takes to acquire an
image in ultrasound elastography, or other elastography techniques, which is a current
focus within the laboratory. There is little doubt that tissue is viscoelastic, and the force-

60
to-displacement behavior will change with increasing load rate. However, as with any
material testing protocol, the loading environment concerned with the application must be
taken into account. In addition, the same dwell period was implemented for both the
indenter and compression tests in order to provide uniformity to the investigation. These
dwell periods may be adjusted in the future depending on the application or if certain
information regarding diseased tissue can be uncovered by looking at different loading
events temporally. It should be noted that a linear regression was performed on the
“steady-state” data to establish stress-to-strain relationships at these time points; in each
case, a consistent correlation value of greater than 0.99 was determined thus indicating a
reasonably robust analysis at this time point.
The main purpose of this research was to identify whether the MGT assay could
be utilized to measure the stiffness of an embedded piece of tissue. As indicated by the
correlation between the indenter and model modulus evaluations, the developed testing
protocol delivered reasonable results for the elastic modulus of these trial samples. This
is especially evident through the non-diseased analysis, in which case the model and
indenter values are statistically indifferent. In addition, a chemically-induced liver
fibrosis model was used to determine whether intuitive changes in these properties could
be monitored. The dual-testing methodology allowed for independent confirmation of
the MGT assay‟s measurement. It is interesting to note that while the control/normal
mice values were statistically the same between testing methods, i.e. MGT and
indentation assays, the fibrotic liver comparison indicated statistically different but
correlated moduli values. The controls/normals would indicate fidelity exists between
the two methods. However, the fibrotic discrepancy indicates that there is something

61
different with respect to the constituency of the tissue when performing indentation
versus MGT, i.e. a smaller value. Statistical analysis among fibrotic livers indicated a
difference in means between the indenter and MGT assay at a 0.01 level of significance,
which may signify differing sensitivities in the model-based and indentation methods.
One of the distinct differences between the two tests is the extent of the mouse liver used
within each test. The two largest lobes are used in the MGT test, while one of the smaller
lobes is used for the indentation. The other distinct difference is that indentation tests are
measured on the surface of a liver lobe. It is quite possible that the outer parenchymal
capsule associated with the liver may not have the same degree of fibrosis as the internal
regions of the organ. Any heterogeneity with respect to the fibrosis in regions near the
outer surface of the liver would inherently have a greater effect on indentation tests. The
fact that the moduli values were less for these tests would be consistent with this
assertion and the outer surface would be the most likely region to not have fully
developed fibrosis. The MGT assay would be more representative of global organ
fibrosis and the properties would reflect this.
There are several sources of error within the techniques that reflect limitations of
this protocol. All methods herein represent an ex vivo methodology. Without linking the
in vivo and ex vivo properties, it will be difficult to use this as a quantitative metric for in
vivo changes. Nevertheless, the protocol does represent a reasonably robust technique to
monitor changes under like conditions. It is interesting though that the values presented
here correlate with other results within the literature for human liver. Yeh et al. measured
normal and fibrotic livers in 19 fresh human cadaver livers using a standard compression
test. At 5% strain normal and fibrotic livers had moduli values of 640 ± 80, and 1110 ±

62
170 Pascals, respectively. These are remarkably consistent with the values reported here.
This may indicate that murine liver is a reasonably good model of human liver for
mechanical properties; however, this should be tempered by the fact that Yeh‟s results
were done 24-48 hours post-mortem (tissue was preserved) whereas the tests presented
here are done 1-2 hours post-mortem; nevertheless, an interesting correlation.
Another possible source of error is the Poisson‟s ratio selection. A value of 0.45
was chosen based on two primary reasons. The first is that this value has been used in
previous lab work and has proven successful in that application. The second is that this
value provides a nearly incompressible description which is sufficiently elastic (as
opposed to hyperelastic) to not invoke mesh-locking in the finite element solution. In
addition, the testing of the Poisson‟s ratio range indicated that the indenter testing is
somewhat insensitive to a small change in Poisson‟s ratio. The model is more sensitive
to the changing Poisson‟s ratio; however, the effect is still small. The analysis was
performed using a Poisson‟s ration of 0.45. Other research has utilized values higher
than this. It is important to note, though, that the same Poisson‟s ratio was used in both
analyses, which at the very least provides a very good relative comparison of moduli.
There are a myriad of other possible sources of error to include: segmentation,
tetrahedral element choice, variability in disease model, subjectivity of disease grading,
variability in pre-compression environment, etc. However, the independent method
testing performed herein does provide confirmation regarding the detection of disease.
The results also suggest that indentation and the MGT assay may provide information
regarding fibrosis at both a local and more global level. Furthermore, it should be noted

63
that one advantage of the MGT assay is it would be amenable for calibrating elastography
methods and conducting controlled experiments among different modalities.
Conclusions
The MGT method yielded results that could be correlated to indenter testing of
the individual liver lobes. The control/normal liver modulus values are consistent for
both the model and indenter tests. However, the fibrotic livers resulted in modulus values
that were consistently higher in the model calculation than in the indenter calculation.
Rather than thinking this is a limitation of either theory, it is hypothesized that this may
be due to the indentation being performed at the liver surface, which is a region that may
experience less fibrosis formation than the organ volume. The results reported here
support this hypothesis thus far. The results demonstrated that normal and advanced
fibrotic livers can be statistically identified with these techniques. Unfortunately, the
Ishak scoring system is not specific enough to determine whether the extent of fibrosis
can be correlated to the variability within modulus measurements. Future work would
have to be focused at providing disease scoring that is more quantitative such as by image
analysis. In addition, enhancements to the model regarding element-type and perhaps
more complicated constitutive relations to match the transient properties would be
appropriate for investigation. Despite some limitations though, the techniques and results
produced herein should serve as a robust framework for testing elastography techniques
as well as to monitor small-animal diseases systems that affect soft tissue architecture.

64
CHAPTER IV
EX VIVO TUMOR STUDY #1
Introduction and Contribution of Study
The work presented in this manuscript served to further the breadth of analysis of
the MGT assay as well as to investigate the potential of linking microstructural content of
tissue samples to evaluated modulus values. Continuing the work of the previous
manuscript, this paper concerned the application of the MGT assay to tumor tissue
evaluation, further demonstrating the capability of the assay as a soft tissue modulus
evaluation technique. In addition, this paper served as an initial investigation into the
relationship between microstructure and modulus. Specifically, collagen content of the
samples was quantified and compared to the assay-evaluated modulus, and a correlation
between the two measures was established. Finally, this work highlighted a potential
limitation of the assay relative to the ratio of the size of the tissue specimen to the volume
of the gel in which it is embedded, thus indicating the need to qualitatively evaluate the
capabilities of the assay in order to ensure its application as a modulus evaluation
technique. This work was initiated with the notion of evaluating the suspected
mechanical differences between tumors with membrane-tethered TNF-α versus those
with cytoplasmic TNF-α, which was being evaluated by a collaborator; the collagen
content of the samples was also evaluated due to the expected effect of the TNF-α
differences. The results showed that the TNF-α state of the tumors was not differentiated
by either the MGT assay modulus or the collagen content of the tissue. However, the

65
collagen content and the modulus value demonstrated a correlation, which provided an
interesting first observation of the potential quantitative link between microstructure and
macroscopic property. This work was published in Biomechanics and Modeling in
Mechanobiology in August of 2009.
Experimental Study
A NOVEL MODEL-GEL-TISSUE ASSAY ANALYSIS FOR COMPARING
TUMOR ELASTIC PROPERTIES TO COLLAGEN CONTENT
Appearing in
Biomechanics and Modeling in Mechanobiology, Volume 8, Number 4, August 2009
Abstract
In previous work, a new assay was realized for determining soft-tissue mechanical
properties. The method, named the model-gel-tissue (MGT) assay, couples material
testing with a finite element model built from a micro-CT image acquisition of a gel-
embedded tissue specimen to determine its mechanical properties. Given recent reports
demonstrating that increased stromal collagen promotes mammary tumor initiation and
proliferation, in this paper, the MGT assay is used to evaluate the modulus of murine
mammary tumors and is subsequently correlated quantitatively to type I collagen content.
In addition, preliminary testing of the assay sensitivity with respect to gel-volume to
tissue-mass ratio is reported here. The results demonstrate a strong linear correlation
between tumor mechanical properties and collagen content (R2 = 0.9462). This result is
important because mechanical stiffness as provided by the MGT assay is very similar to
parameters under clinical investigation using elastographic imaging techniques. The

66
sensitivity tests indicated that an approximate gel-volume to tissue-mass ratio threshold
of 16.5mlg−1
is needed for successful analysis. This is an important result in that it
presents guideline constraints for conducting this analysis.
Introduction
Assessment of tissue stiffness often plays an integral role in research and clinical
diagnostics since it has been identified as an indicator of a variety of pathological
conditions, including hepatic fibrosis, arterial disease, myocardial infarction, breast
cancer, prostatic cancer, thyroid disease, and skin cancer, among others [7-21]. In
addition, recently developed medical imaging modalities are attempting to render non-
invasive measurements of these properties for disease screening (commonly cancer
screening) and therapeutic applications [22, 24, 27, 86-91]. However, direct mechanical
measurement of tissue for modulus assessment and method validation has proven
difficult due to the inherent irregular tissue shape and the challenge of preparing them for
traditional mechanical testing methods. However, some material testing methods have
been developed that are applicable to a specific tissue configuration; for example,
indentation testing for layered slab tissues. While a very common approach, the
determination of elastic properties from this data is often based on certain geometric
shapes, and boundary conditions. In the case of tissue resection and biopsy specimens,
which are generally the gold-standard pathological sampling techniques, these tissue
samples would routinely violate many of these assumptions. Thus, the development of a
mechanical property assessment technique that can be adaptable to the uncertainty of

67
tissue size and shape and yet be quantitative would be an important contribution towards
understanding biomarkers associated with tissue structure.
With respect to the macroscopic determination of mechanical properties, the two
primary protein components that define mechanical stability of soft tissue are collagen
and elastin. These proteins directly influence the structural integrity of tissue, and an
assessment of the amount of collagen in a sample is a measure that reflects the load-
bearing nature of tissue, and hence its stiffness. Changes to tissue health can lead to
altered distributions of these particular proteins within soft tissue [5]. For example, in
recent reports increased stromal collagen has been shown to increase tumor formation
and proliferation in murine mammary tissue by threefold and has resulted in a more
invasive phenotype with increased metastasis [92]. The possibility to use an assessment
of collagen to predict tumorigenic behavior is intriguing but the interaction and change to
the relationship between cellular structure and modulus in the diseased state is to some
degree uncertain; and, it‟s relationship at clinically relevant diagnostic length scales is
equally uncertain. The standard method used for collagen assessment is histological
analysis; however, at best histological processing provides an indirect relationship to
collagen‟s functional mechanical role, and it is this functional role that is critical in many
ways to the use of mechanical properties as a biomarker. For example, breast cancer and
liver fibrosis are often detected by palpation [93-96]. Other areas of study such as
fracture repair and wound healing are also characterized by mechanical performance [97-
101]. While these are important areas, it would also be interesting to extrapolate the role
that mechanical properties or the monitoring of tissue architecture could play in cancer
evaluation.

68
In this work, an ex vivo mechanical testing assay that was previously reported is
used within the context of measuring mechanical properties of arbitrarily shaped tissue
volumes from a murine mammary tumor model. The assay involves suspending freshly
excised tissue volumes within a rapidly congealing gel, imaging the sample, evaluating
mechanical performance using standard material testing equipment, and then
implementing a model-fitting process for modulus assessment. The assay is called the
model-gel-tissue (MGT) assay, and is used here to demonstrate the link between tissue
mechanical properties and collagen content for mammary tumors. Preliminary work
utilizing the assay within a liver fibrosis murine model has been reported [102]. In the
work presented here, the utility of the assay to evaluate various tissue types is
demonstrated, as a shift is made from fibrotic liver to mammary tumor tissue. This
expansion of the assay analysis to other tissue types, in particular cancer-based, begins to
provide a more quantitative understanding of the stiffness biomarker that is commonly
used to detect breast cancer. In addition, the work presented here is concerned with the
specific task of linking structural load bearing changes to a histological assessment of a
murine breast cancer system. In doing so, a critical quantitative correlation to cellular
microstructural content, which had not been realized in the previous work, is
demonstrated. In addition to this considerable advance, the tissue specimen volume has
been reduced by one order of magnitude such that it is now biopsy-relevant and a
preliminary sensitivity study regarding gel-volume to tissue-mass ratios is explored.
69
Methods
The work reported herein concerns the analysis of the modulus of elasticity of
nine murine mammary tumors as measured by the MGT assay previously reported. The
mouse model was prepared with murine breast cancer 1x10⁶ cells derived from mouse
mammary tumor virus polyomavirus middle T transgenic lines (PyV-mT; maintained in
DMEM, 10% FCS, 5.0 ng ml-1
17-β estradiol, 1 g ml-1
progesterone) and were
implanted contralaterally in FVB/nJ host mice in the 4th
mammary fat pad. Tumor tissues
were collected after 30–40 days, which allotted growth to approximately 1 cm3, and
sectioned for analysis. The largest section was utilized for modulus evaluation in the
MGT assay. Collagen content of the tumors was determined from the acid-hydrolyzed
homogenate of a separate tumor segment. Amino-acid analysis of the derivatized
hydrolysate yielded hydroxyproline and other amino acids to estimate both total and
relative collagen content [5]. This value was then used as a comparison for the MGT
assay evaluation of the tissue modulus. These tests were prepared in a blinded fashion
from the MGT assay and were only available post MGT assay conclusion. In addition, a
histological analysis was performed on tissue samples in order to ensure that the collagen
present was predominantly type I. Tissue samples underwent standard
immunohistological analysis, using rabbit anti-collagen I (abcam, Cambridge, MA),
which has shown 100% specificity to collagen type I and less than 1% reactivity to other
collagen types. The Dako Envision+ System, DAB/Peroxidase (DakoCytomation) was
used to produce localized, visible staining of the collagen. For comparison purposes,
adjacent sections of tumor were stained with Masson's Trichrome to visualize
extracellular collagen deposition.

70
The MGT assay used to measure mechanical properties utilizes a gel-embedded
tissue sample and combines finite element modeling of the gel-tissue composite with
direct mechanical testing to evaluate the mechanical properties of the tissue sample. An
outline of the assay is depicted below (Fig. 11).
Implementation of the MGT system required production of a uniform gel with
embedded tissue sample as well as rigorously defined material testing protocols. The gel
that proved most amenable to the demands of the system was a rapidly congealing
polyacrylamide (PA) gel. The components of such a gel were 1 molar Tris buffer, 10%
Figure 11. Assay outline.

71
ammonium persulfate (APS) solution, and 30% acrylamide/polyacrylamide (BioRad
Laboratories). Since multiple samples could be generated during the course of one
experiment, an initial solution was generated for use in all gel generation. For this
research, a 4.5% polyacrylamide gel, which had a modulus of approximately 2.5 kPa, was
utilized. It is necessary for the MGT assay that the modulus of the gel be similar to that
expected for the tissue; if the gel is too stiff, the incremental effect of the tissue modulus
on the composite system is undetectable. In addition, the ratio of gel-volume to tissue-
mass proved pivotal in the effectiveness of the assay. In an attempt to compensate for the
varying tumor tissue volumes across samples, we gradually varied the gel volume,
resulting in gel-volume to tissue-mass ratios ranging from 4.43 to 32.68. The success of
the assay appears to be linked to this ratio (Table 5). Based on this preliminary analysis,
a volume of 1.4 mL of solution was generally used; however, this amount could be varied
dependent on the tissue mass if necessary. With respect to setup, the diameter of the gel
cylinder could be varied to accommodate different tissue shapes, but it was necessary that
the gel completely envelop the tissue for the assay evaluation. In the mammary tumor
case, well plates with a diameter of 16 mm proved sufficient for the extracted tissue size.
To generate the gels, the desired volume of buffer/APS/PA solution was added to one of
the wells. In addition, to provide a distinguishable boundary between the tissue and the
gel in CT scans for the purpose of extracting the geometric shape for modeling (i.e.
image segmentation), Optiray (Mallinckrodt Inc), a CT contrast agent, was added to the
mixture. The tissue was then suspended in the liquid using forceps while the
polymerization initiator, TEMED, was added to the well. Solidification of the gel was
complete in approximately two minutes. In addition to the embedded tissue gels, a

72
homogeneous gel was generated at the same time for the purpose of estimating the
mechanical properties of the gel itself. The homogenous gel was created following the
same guidelines previously described, without suspension of the tissue. If multiple gel
volumes were used in the experimentation, a homogeneous gel was generated for each
volume instance.
After gel generation, the gel-tissue sample was imaged using the Imtek microCAT
II scanner (Concord/CTI). Image segmentation of the CT images was performed using
AnalyzeAVW (Mayo Foundation for Medical Education and Research). Upon
completion of the segmentation, a surface description was generated and used as a
bounding description for a custom-built tetrahedral mesh generator [54]. After imaging,
the gel-tissue specimen was subjected to compression testing using the Enduratec
Electroforce 3100 material tester (Bose, Enduratec Systems Group) with both force and
displacement being acquired. Due to the small size of the samples, a 50-gram force
transducer was utilized. The mechanical test consisted of a series of incremental
unconfined step compressions to specified displacement levels, from 0.35 to 0.65 mm in
0.05 mm increments, followed by a 60 second dwell period which was implemented to
dissipate the majority of the viscoelastic behavior of the tissue and gel. The compression
testing was repeated twice for each gel sample. The unconfined nature of the
compression was achieved experimentally by applying a lubricant to both the top and
bottom surfaces of the gel.
After imaging and material testing was completed, the MGT assay modulus
evaluation process took place in two steps. First, the homogenous gel sample was
evaluated to determine its modulus. The finite element model generated for the

73
homogeneous gel was subjected to boundary conditions that matched the unconfined
mechanical compression of the physical gel. Specifically, the top surface was subjected
to a fixed normal displacement (Dirichlet boundary conditions) while being allowed to
slip laterally (Neumann boundary conditions). The bottom surface of the gel experienced
similar boundary conditions, with the difference being that the normal displacement was
maintained at a constant zero value. Approximately ten nodes in the center of both the
top and the bottom surfaces were confined laterally in order to ensure uniqueness of the
computational solution. A modulus value was assumed for the gel in the model, and a
forward evaluation of the displacements was calculated. From the displacement field,
equivalent surface stress due to the specified compression level could be reconstructed.
The resulting model stress was then converted to a force value based on the surface area
of the specific gel and compared to the acquired force from the mechanical tester; the
input gel modulus was varied until the model-calculated force value matched the
measured force value, at which point the reference gel modulus was recorded. This value
was then assumed to be the gel modulus in the gel-tissue sample evaluation. The method
of tissue modulus estimation, as in the homogeneous case, was compressed according to
the same mechanical testing conditions. The modeled and measured mechanical forces
were compared, and the model‟s tissue modulus was adjusted until the two forces were
equivalent, at which point the tissue modulus was assigned.
Results
The results of the volume regulation testing are presented below (Table 5),
wherein the ratio of tumor gel-volume to tissue-mass is correlated to whether the MGT

74
assay was able to successfully analyze the tissue modulus. A successful analysis was
achieved in the case where a modulus value could be evaluated for the tissue. An
unsuccessful analysis was defined by an inability to differentiate the specimen from the
background gel due to undetectable differential force resolution experienced when
adjusting the tissue modulus. In cases where the gel-to-tissue ratio is approximately 16.5
or less the assay is able to successfully evaluate the tissue modulus. According to the
available data, the maximum value at which the assay is no longer able to evaluate the
tissue modulus is 18.92.
The results from the murine tumor tissue assay analysis are compiled below
(Table 6). The first column is the tumor number given for identification purposes. The
Table 5. Gel-to-tissue volume ratio.
Mammary
Tumor Mass (g)
Gel Volume
(mL)
Gel-to-Tissue
Ratio (mL/g)
Positive
Analysis?
0.3819 2 5.24 Yes
0.3580 2 5.59 Yes
0.4519 2 4.43 Yes
0.1057 2 18.92 No
0.0684 2 29.24 No
0.0912 1.5 16.45 Yes
0.0950 1.5 15.79 Yes
0.0459 1.5 32.68 No
0.1011 1.4 13.85 Yes
0.2221 1.4 6.30 Yes
0.1335 1.4 10.47 Yes
0.2554 1.4 5.48 Yes

75
second column of the table is the modulus value as calculated by the MGT assay, and the
third column is the collagen percentage as evaluated by acid-hydrolyzed homogenate
analysis. A pictorial depiction of the data from Table 6 follows, wherein collagen
percentage of the tumors is plotted versus the MGT assay modulus assessment for each
tumor (Fig. 12). A linear regression was performed on the data, resulting in a correlation
coefficient that demonstrates a strong linear correlation between the two variables
(R2=0.9462). In addition, two sets of predictive intervals (90% and 95%) are shown.
These predictive intervals indicate the range of obtainable collagen percentage values
correlating to a specific modulus value in future evaluations [103, 104]. In other words,
these intervals depict the specificity of the assay in evaluating a correlation between the
model modulus value and the analysis of collagen percentage.
Table 6. Assay and acid-hydrolyzed homogenate results
Tumor
Number
Modulus
(Pa)
Collagen
Percentage
1 750 7.93
2 970 9.00
3 3840 33.48
4 2430 16.64
5 1050 11.76
6 2730 20.11
7 1840 16.37
8 890 7.07
9 650 4.49

76
Results from the histological analysis of the mammary tumor tissue are shown in
figures 13 and 14 below. Representative images at 10x and 20x magnification are shown
for both the immunohistological analysis for collagen type I (Fig. 13) and the Masson‟s
trichrome staining of adjacent slices (Fig. 14). In figure 13, the slides were lightly
counterstained with Mayer's hematoxylin to tag collagen I with a slight brown color. In
figure 14, the light pink areas are cellular cytoplasm, while the darker pink/brown areas
are the nuclear component. Blues areas in figure 14 are extracellular collagen.
Comparison of the brown-stained collagen type I (Fig. 13) to the blue-stained ECM
Figure 12. Collagen percentage as a function of tumor modulus for PyV-mT tumors.
The black line is the linear regression to the data set, while the red line is the 90%
confidence interval, and the blue line is the 95% confidence interval.

77
collagen (Fig. 14) indicates that most, if not all, of the collagen present in the tumor
tissue is type I.
Figure 13. Representative slice from immunohistological analysis of murine mammary
tumor tissue. The two images are the same slice, with the left being at 10x
magnification and the right at 20x magnification.
Figure 14. Representative slice from Masson‟s Trichrome staining of murine mammary
tumor tissue. The two images are the same slice, with the left being at 10x
magnification and the right at 20x magnification.
78
Discussion
One of the aims of this work was to demonstrate that the analytic capability of the
MGT assay was not limited to a specific tissue type. To this avail, murine mammary
tumor tissue was used, which, by dictation of the system, is a much smaller tissue volume
than the murine liver. Thus, while we were able to show the applicability of the assay to
other tissue types, this work also provided insight to the required assay parameters for
tissue assessment using the MGT assay; namely, the required control of the gel-volume to
tissue-mass ratio. In practice, the gel must completely surround the tissue. However, if
the gel volume exceeds the tissue mass by too large a ratio, the gel mechanics will
overwhelm the changes to the composite mechanics and the assay will be less sensitive to
contributions from the soft-tissue. The realization of this volume regulation is evident
from the data (Table 5). From this data, a threshold of the ratio is observed, above which
the assay is not able to identify the tissue among the gel, which is important to recognize
in order to ensure the fidelity of the assay. In cases where the gel-to-tissue ratio is
approximately 16.5 or less the assay is able to successfully evaluate the tissue modulus.
The implications are that since the tissue mass can only be minimally controlled (e.g.
volume of the biopsy), control of the assay must be performed by modifying the gel
recipe based on the measured mass of the resected tissue, i.e. the gel volume is dependent
on the individual tissue samples.
With respect to cancer screening, a common clinical presentation is a change in
the mechanical stiffness of tissue in a focal region such that it becomes more rigid (e.g.
breast cancer). While for conditions such as liver fibrosis, the mechanism for altered
mechanical properties is well understood, this process in cancer is mechanistically

79
unclear. As more information is uncovered regarding microstructural effects relating to
tumorigenesis, such as that relating increased stromal collagen content to tumor
formation and proliferation [92], the need to understand the underlying structure-function
link is enhanced. This work demonstrates a distinct tracking of mechanical properties
with respect to collagen content within this particular cancer model (Fig. 12). In
addition, the immunohistological analysis performed indicates that the collagen content
evaluated by the acid-hydrolyzed homogenate is representative of collagen type I. It is
unclear if the apparent linear relationship will translate to other tumors or whether
various cellular and molecular challenges will change this correlation. From a
methodological standpoint, the breakthrough that the MGT assay makes is the ability to
analyze mechanical properties of small animal tissue immediately post-mortem while
allowing the sample size to be arbitrarily shaped and very small in volume. From the
clinical standpoint, the breakthrough is twofold: (1) human biopsies are generally small
and arbitrarily shaped, and hence the assay could presumably be utilized in biopsy
evaluation, and (2) it is clear that the MGT assay combined with other cellular assays
allows more detailed understanding of the elasticity signal commonly collected by
clinical elastographic imaging methods, i.e. it illuminates the relationship between the
cellular biomarker of collagen presentation and the mechanical abnormalities of the
tumor at the macroscopic scale.
While the general behavior reported can be intuited, the contribution is in the
absolute quantification – a definable metric to relate function to histological presence. In
addition, it is interesting to begin to speculate how this type of analysis can be furthered.
For example, the force-displacement data for this assay was fit to a linearly elastic

80
homogeneous computer model of the tumor. Time-varying changes were factored from
the experiment by allowing sufficient time lapses to allow for a quasi-steady state force-
displacement response. The reality is that these temporal behaviors have information
regarding soft-tissue interstitial fluid dynamics and cell-to-cell mechanics. With more
sophisticated models, and more sophisticated fitting procedures, other information
regarding structure and function could possibly be determined. In addition to generating
models to correlate the slow-varying transients, other altered material testing profiles
could be utilized. For example, viscoelastic properties are often illuminated by testing
specimens with cyclic loading; it would be interesting to put a mechanical excitation
spectrum though the specimen and correlate the findings with very complex models.
Another area that awaits further investigation is the enhancement of the imaging aspect to
this experiment. Here, microCT was used to essentially capture the shape of the tissue
specimen. One could envision using high-field MR techniques to get at the more fine
structural heterogeneity; or perhaps, diffusion imaging could be used to highlight regions
of the tumor that do not permit the traffic of interstitial fluid as readily. The ultimate
triumvirate for relating structure to assessable modulus would be to combine structure-
enhancing imaging sequences, sophisticated testing regimens, and detailed cell and
molecular assays. The MGT assay is a first move in this direction.

81
CHAPTER V
EX VIVO TUMOR STUDY #2
Introduction and Contribution of Study
The study presented in this paper served to investigate a prognostic aspect of soft
tissue modulus evaluation. In this work, the potential of early determination of
responsiveness of a tumor to treatment by means of elastic modulus evaluation was
considered. However, in the small cohort of tumors studied, a connection between the
two could not be established. Subsequently, this work presented a second opportunity to
consider the modulus as an indicator of microstructure, as the assay derived modulus
values were evaluated relative to collagen content of the tissues. As in the previous
study, a correlation was observed between sample collagen content and the elastic
modulus. The rationale for this work pertained to the potential of a non-invasive
evaluation of tissue modulus as an early prognostic indicator of tumor responsiveness to
treatment. While current, invasive biochemical evaluations of tumor tissues can
determine tumor classification and point to the indicated treatment, some tumors that are
expected to respond to a given treatment unforeseeably will not. The literature indicates
that work has been done to investigate genetically identifiable indicators of resistance,
but these are not pertinent in all cases. Hence, in many cases, resistance cannot be
determined prior to treatment. While almost all of the literature regarding resistance to
treatment investigates resistance evaluation via genetic or cellular means, this work aims

82
to investigate mechanical differences as an indicator of resistance. This work will be
submitted for publication.
Experimental Study
INVESTIGATION OF A MODULUS DEPENDENCE ON TREATMENT
RESPONSIVENESS USING A MURINE MODEL OF HER2+ BREAST CANCER
To be submitted, 2011
Abstract
Screening and treatment for breast cancer has improved, thus increasing survival
among patients. Additionally, genetic analysis of tumors can indicate preferential
treatment regiments based on tumor class. However, even with knowledge of the tumor
subtype and the associated treatment, patients do not respond equivalently to the same
treatment. Methods for determining which patients are responsive and which are
resistant to a specific treatment prior to treatment are not currently available, but would
prove valuable in treatment planning. In this work, an association between the modulus
of the tumor tissue and the responsiveness of the tumor to a specified treatment was
investigated. The MGT assay was utilized to evaluate the modulus of Herceptin-
responsive and Herceptin-resistant lines of a murine model of HER2+ breast cancer.
Four responsive and four resistant tumors were evaluated; in this cohort of samples, a
correlation between responsiveness of the tumor and tissue modulus could not be defined.
The collagen content of the tissue was subsequently evaluated via histological staining
and quantification using the Ariol SL-50 platform (Genetix). In regards to collagen
content, a correlation between modulus and tissue collagen content was established, with

83
the exception of one of the samples, which was statistically identified as an outlier.
Though a modulus/responsiveness relationship could not be elicited, the work serves to
further validate the use of the MGT assay as a modulus evaluation technique.
Additionally, it indicates the relationship between the microstructure (collagen content)
and macroscopic parameter (modulus) of the tissue.
Introduction
Breast cancer is an extremely prevalent form of cancer in the United States, and is
the second-leading cause of cancer-related death in women [105]. Though breast cancer
is an inherently heterogeneous disease dependent on a plethora of factors, breast cancer
subtypes have been identified based on gene expression. Of particular interest for
therapeutic reasons are the subclasses of cancer that involve cellular receptors which are
targets for therapy; specifically, estrogen receptor (ER), progesterone receptor (PR), and
human epidermal growth factor receptor 2 (HER2). Tumors are classified as either
positive or negative for overexpression of the protein or gene amplification in these cases.
HER2, a member of the ErbB protein family, is a cell surface receptor tyrosine kinase
and has been shown to be involved in pathways affecting cell growth and differentiation.
Overexpression of HER2, or an amplification of the HER2/neu oncogene, occurs in
approximately 25% of human breast cancers. A HER2+ tumor demonstrates increased
cell growth and proliferation, and is generally indicated by a poor prognosis as it is
correlated to a shorter time to relapse as well as a shorter overall survival [106].
Specifically, the signaling pathways implicated in HER2+ tumors have effects on cell
division, migration, adhesion, differentiation, and apoptosis [107]. Trastuzumab

84
(Herceptin®, Genentech Inc., San Francisco, CA) is a monoclonal antibody that, through
mechanisms that are currently not fully understood, targets the HER2 protein on the cell
surface, elucidating an immune response as well as affecting the intracellular signaling
[108]. While Herceptin has proven successful as a treatment in some HER2+ cases of
breast cancer, a portion of HER2+ patients do not respond to the treatment. The
mechanism for resistance is not well understood; while some cases can be described by a
genetic signature, others are not identifiable. Currently, no clinically relevant biomarkers
exist that can predict resistance to Herceptin, and hence it is not possible to discern
between patients who will and will not respond to treatment prior to the treatment.
Though the mechanisms of resistance to Herceptin treatment are as of yet not
understood, recent studies have resulted in speculated potential pathways. It has been
observed that Herceptin binding to the HER2 extracellular domain does not prevent
ligand-induced generation of HER2/HER3 and HER2/HER1 (or EGFR) heterodimers;
these heterodimers can continue signaling via the mitrogen-activated protein kinase
(MAPK) and phosphatidylinositol 3-kinase (PI3K) proliferative survival pathways, and
thus, although Herceptin affects HER2 signaling, it may not affect signaling from the
HER receptor family members, which may have an implication in conferring resistance
to the drug [109, 110]. The PI3K and the MAPK pathways have also been indicated in
Herceptin resistance due to activation by the insulin-like growth factor 1 receptor
(IGF1R). Based on this observation, overexpression of IGF1R has been identified as a
potential mechanism for Herceptin resistance [111-113]. Mutations in the PI3K pathway
have also been investigated as potential mechanisms of Herceptin resistance. Specific
mutations in the catalytic and kinase domains of the p110α subunit of PI3K activate

85
signaling and have been indicated in Herceptin resistance [114, 115]. Additionally, a
decrease in, or loss of, the phosphatase and tensin homolog (PTEN), a tumor suppressor
which acts to inhibit PI3K signaling, has also been indicated in conferring Herceptin
resistance [115, 116]. However, even with this knowledge of molecular and cellular
effects, the mechanism for resistance is incompletely defined and may potentially vary
among patients. This lack of a priori knowledge unfortunately results in patients
spending valuable time undergoing ineffective treatments. For this reason, differences
between the responsive and the non-responsive (or resistant) cancers that can be
illuminated prior to devising a treatment plan would prove invaluable.
It has been well established in many pathological conditions that the modulus of
the affected tissue is perceivably different than the normal tissue; specifically, in many
cases, disease affects the microstructure in such a way that it produces a lesion that is
stiffer than the healthy tissue [7-21]. This discernable change in condition is the central
concept behind physical palpation as a method of breast tumor detection. Though in
many cases the mechanisms that impart resistance have not been identified or are not well
understood, it is conceivable that these same mechanisms may also have an effect on the
modulus of the tumor. This is especially prevalent when considering the literature
regarding the role of tensional homeostasis on the progression of the tumor as well as the
propensity to affect the remodeling of the extracellular matrix associated with tumor
aggressiveness and invasiveness [32,51-54]. To examine the potential prognostic value
of modulus assessment, the MGT assay was utilized to investigate the modulus of a
Herceptin-responsive and a Herceptin-resistant strain of the BT-474 xenograft mouse
model of breast cancer. BT-474 is a human-derived cell line originating from an invasive

86
ductal carcinoma that is HER2+ and conducive to growth in the murine environment.
With the attempted development of imaging-based noninvasive modulus assessment
techniques, a recognizable difference in stiffness between the resistant and the responsive
tumor types could prove to be useful as a preliminary indicator of treatment success [24,
25, 27, 86, 87, 89-91, 117].
Methods
The Herceptin-responsive and Herceptin-resistant cell lines utilized in this work
had been previously established by the Arteaga laboratory at Vanderbilt, and the methods
described here were adapted from their protocol [118]. To generate the Herceptin-
responsive line, BT-474 cells were obtained from the American Type Culture Collection
and maintained in improved minimal essential medium (IMEM, Life Technologies Inc.)
supplemented with 10% FCS at 37°C in a humidified, 5% CO2 incubator. To devise the
Herceptin-resistant line, 2x10⁷ BT-474 cells suspended in growth factor-reduced Matrigel
were injected subcutaneously into the right flank of five week old BALB/c athymic nude
mice (Harlan Sprague-Dawley) 24 hours after they had been implanted with 0.72 mg, 60
day release 17β-estradiol pellets (Innovative Research). The tumors were allowed to
grow until they reached a volume of approximately 300 mm3, at which point the mice
were treated with Herceptin in a biweekly regiment. Tumors that responded completely
to the treatment and then reoccurred with continuous treatment were harvested and
processed to generate the Herceptin-resistant cell line. For this work, cells from each
established line were obtained from the Arteaga laboratory. To develop the tumors
utilized here, five week old BALB/c athymic nude mice were implanted with an estradiol
pellet, and then, 24 hours later, were injected in the right flank with 1x10⁷ cells from the

87
appropriate cell line suspended in a 1:10 matrigel to media solution. Five mice were
injected with Herceptin-responsive cells specifically for this work, while the mice
implanted with the Herceptin-resistant strain were utilized in collaboration with another
investigator. The tumors were allowed to grow until they reached approximately 200-
250 mm3, at which point the mice were euthanized and the tumors were resected for
evaluation. A portion of the tumor was reserved for histology. The other portion of the
tumor was immediately embedded in a 4.8% polyacrylamide gel and analyzed via the
MGT assay protocol [1,2]. Four responsive mice and four resistant mice grew tumors of
sufficient volume and were used in the evaluation.
Histological analysis was performed on a portion of the tissue from each tumor
sample in order to quantify collagen content of the samples. Following resection, the
tissue samples were placed in 10% formalin for 24 hours, after which the tissue was
moved to 70% ethanol where it was kept until histological analysis was performed. To
establish consistency among the staining, histological analysis was performed on all of
the samples at the same time. Once all of the samples had been collected, they were
paraffin-embedded and sliced at a thickness of 5 microns. Three slides were obtained
from each tissue sample, one taken from each edge of the tissue volume and one taken
from the core of the sample, in order to provide a representative sampling of the entire
available volume. The slides were stained using Gomori‟s Trichrome and analysis of the
slides was performed using the Ariol SL-50 platform (Genetix, New Milton, UK). The
Ariol system obtains high resolution images of the slides in an automated manner that is
specific to the individual tissue sample. The system is trained on one of the obtained
images to identify the colors of interest (based on the staining procedure and tissue

88
components of interest), as dictated by hue, intensity, and saturation. After training, the
system evaluates each of the slices by means of thresholding based on the previously
established limits, generating data for the number of pixels in the sample for each
indicated color. For this evaluation, the system was trained to identify two colors: the
blue stain, indicating collagen, and the set of all colors, indicating the total tissue area.
The amount of collagen in each histological sample was then quantified as the sum of the
blue pixels in the sample. The percent collagen in each sample slice was calculated by
dividing the total number of collagen pixels by the number of pixels of all colors, thus
allowing for a calculation of the collagen in the sample normalized to the area of the
tissue sample.
Results
The results for the breast tumor responsiveness testing are shown in Figures 15,
16, and 17. Figure 15 shows the assay evaluated modulus for the four responsive (BT)
and the four resistant (HR) tumors. For the small sample size investigated here, there
was no observed difference in stiffness between the Herceptin-responsive and the
Herceptin-resistant samples; a t-test for the difference in means between the two groups
indicated that there is no significant difference in the two means. Figure 16 depicts the
tumor modulus value versus the percent collagen as calculated by the Ariol analysis.
Figure 17 again shows the modulus versus percent collagen with a linear regression of the
data, but excludes sample HR6-1. A Grubb‟s outlier test was performed on the data to
determine if sample HR6-1 qualified as on outlier in the data set. The test indicated with
a significance of 0.01 that the point was an outlier, and thus the data point was excluded

89
from the linear regression. The resulting correlation coefficient for the regression (R) is
0.89. Table 7 provides the percent collagen calculations for each of the three slides from
each tumor sample as assessed by the Ariol system, as well as the average percent for the
three slides. The evaluated percent collagen is consistent across the three slides, with an
average standard deviation of 1.9%, except in the case of HR6-1. The highest slide for
this sample registered at 30.82% collagen while the lowest equivocated to 8.44%. This
spread caused a large standard deviation for the sample at 11.58%. Figure 18 shows the
three histological images from sample HR6-1 corresponding to the three calculations in
Table 7. Figure 19 contains the three images from sample HR6-3. The data point for
sample HR6-3 was not considered an outlier, but as can be seen in Figure 17, it has one
of the larger deviations from the correlation curve.
Figure 15. Modulus values for the Herceptin-responsive (BT) and Herceptin-resistant
(HR) tumors.
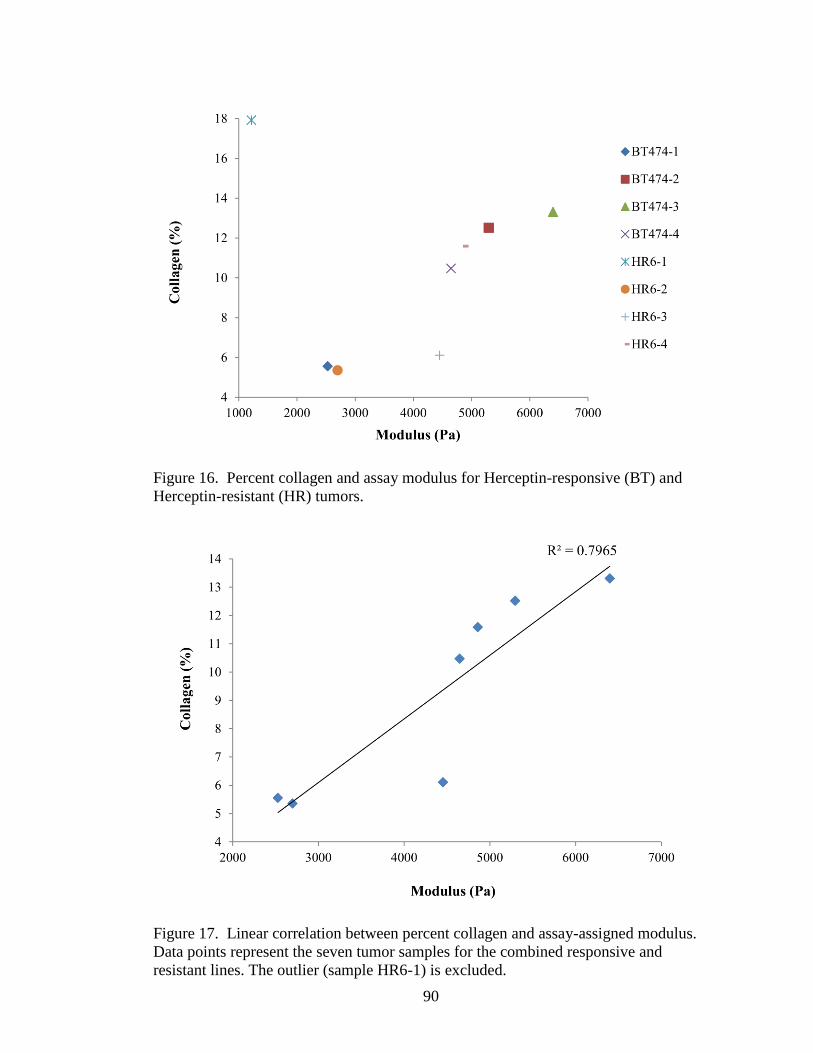
90
Figure 16. Percent collagen and assay modulus for Herceptin-responsive (BT) and
Herceptin-resistant (HR) tumors.
Figure 17. Linear correlation between percent collagen and assay-assigned modulus.
Data points represent the seven tumor samples for the combined responsive and
resistant lines. The outlier (sample HR6-1) is excluded.

91
Table 7. Ariol data for percent collagen in each of the three slides from each tumor
sample. % Collagen
Slide 1 Slide 2 Slide 3 Average
BT474-1 5.53 6.67 4.47 5.56
BT474-2 10.31 13.70 13.54 12.52
BT474-3 13.94 12.23 13.77 13.31
BT474-4 8.64 9.72 13.04 10.47
HR6-1 30.82 14.50 8.44 17.92
HR6-2 7.53 4.65 3.91 5.36
HR6-3 8.37 5.51 4.45 6.11
HR6-4 13.96 12.74 8.07 11.59
Figure 18. Ariol images of histology slices from tumor sample HR6-1. The actual
image set obtained by the Ariol system is significantly higher resolution than the images
presented here; the image data had to be down-sampled to be contained in this document.

92
Discussion
During conception of the responsive versus resistant tumor modulus evaluation
study, it was believed that possible cellular and microstructural differences that
contributed to the resistant nature of the Herceptin-resistant tumor line would result in
perceivable differences in modulus between the tumor lines. However, in the modest
population of four tumors of each type presented here, there was not a significant
Figure 19. Ariol images of histology slices from tumor sample HR6-3. The actual
image set obtained by the Ariol system is significantly higher resolution than the images
presented here; the image data had to be down-sampled to be contained in this
document.

93
difference between the responsive and the resistant tumor types. The average modulus
for the four responsive samples was slightly higher (4718 Pa) than the average modulus
of the resistant tumors (3307 Pa), but a t-test for the difference in means indicated that
this was not a significant result. Thus, for this sample set, a difference in modulus
between the responsive and resistant tumor types could not be established.
Histological analysis was performed on the tumor tissues in order to probe
whether a relationship existed between the collagen content of the tissues and the assay-
derived modulus, as was the case in previous work [2]. As indicated in Figure 17, there
was an apparent correlation between collagen content and tissue modulus, though the
correlation indicated in this work is not as strong as the correlation previously established
in the PyV-mT tissue case. One reason for this may be the difference in collagen
quantification methods. In the previous work, collagen content was assessed
biochemically by hydroxyproline content. In the work presented here, the collagen
quantification was performed by means of trichrome staining and image analysis
techniques. The image analysis method of collagen quantification is less specific than the
hydroxyproline content analysis, as it is susceptible to errant staining and pixel
misclassification. Even though the correlation is not as strong as previously experienced,
the data still establishes a collagen-modulus correlation in a distinct tissue type and
serves as another observation of the link between a microstructural component of the
tissue and the clinically relevant macroscopic measurement.
In considering the collagen content to modulus data, there are two data points that
elicit specific discussion. As previously stated, sample HR6-1 was verified as an outlier
in the data set. The collagen content of this sample was very high relative to the expected

94
value based on the modulus of the sample. The stained histology slices from this sample
are shown in Figure 18. In consideration of these slices, the first slice appears brighter
and tonally bluer than the other slices. This may indicate some difference in preparation
of this slide, which cannot be verified since the staining was performed by an outside
source. Another point of interest is the significant difference in shape of the first slice
from the other two slices. Though the intent was to capture a representative slice from
the core and each of the ends of the tissue volume, the difference in shape may indicate
that the slice was obtained from a section too far toward the end of the tissue volume,
which could skew the collagen content. Another issue arose in the second slice of sample
HR6-1, wherein a dense blue section is present. This area likely biased the pixel count in
the slice, artificially inflating the value. The second sample requiring consideration,
sample HR6-3, dissents slightly from the general trend in Figure 17; in this case, the
collagen content was lower than the modulus value would imply. The histology slices
from this sample (Figure 19) do not immediately point to any obvious reason for the
difference. However, it does appear that the cell density of the tissue from sample HR6-3
is high relative to the other samples, which could have an effect on the interstitial
collagen. Additionally, it was noted when collecting the tissue that HR6-3 appeared to
have a necrotic core. If during sectioning the core was not evenly divided between
histological sample and assay sample, the differences in sample composition would skew
the data. This could attribute to the observed inconsistency of the HR6-3 data point on
the collagen-modulus curve (Figure 17). An interesting observation is that both of these
contradictory data points are from the Herceptin-resistant line. Considering the extensive
processing to generate the resistant line, wherein the cells survive increased unfavorable

95
conditions relative to the responsive cells, it is not surprising that aberrant behavior
would be present.
Conclusions
The intent of this work was to investigate tumor modulus as a predictor of
responsiveness to treatment. In the sample set presented here and using the current
protocol, a relationship between the two parameters could not be established. However,
it is possible that a more complicated interpretation of responsiveness exists which could
not be elicited in this particular investigation. Particularly, a more detailed examination
of the heterogeneity of the tissue may prove insightful regarding the modulus as a
prognostic indicator. It is possible that the responsiveness of the tumor is indicated by
heterogeneity in the tissue which cannot be visualized with CT and which is not assessed
via the current assignment of a single modulus to the tumor tissue. In the current state,
the MGT assay assigns a single modulus to the entire tumor volume. Additionally, the
CT scan does not provide contrast between soft tissues and thus does not allow for
identification of the internal structure of the tumor, further limiting the evaluation to only
one average modulus assessment. Assessment of tissue heterogeneity may provide
further insight into the potential of modulus evaluation as a correlative to disease state.
While this investigation could not determine an observable inherent difference in
modulus between Herceptin-responsive and Herceptin-resistant tumors pre-treatment, this
does not exclude modulus evaluation as a potential biomarker for responsiveness. All of
the tumors contained in this study were grown, resected, and tested, without receiving
any treatment via Herceptin. Thus, both sets of tumors (responsive and resistant) were

96
overexpressing HER2 and experiencing the downstream effects of this signaling in a
similar manner. This similarity in condition is reflected in the result that the two groups
were not differentiable in modulus value as assessed by the MGT assay. The difference
between the two tumor sets lies in their response to Herceptin treatment, wherein the
responsive set loses the signaling associated with HER2, while the responsive set eludes
the treatment and continues downstream signaling. The signaling associated with
HER2+ tumors has effects in cell division, migration, adhesion, differentiation, and
apoptosis, and treatment with Herceptin results in cell cycle arrest and subsequent cell
death. It is therefore reasonable to conceive that, after (preliminary) treatment,
differences between the cellular states of the tumors would alter the tension within the
tumor and, subsequently, the stiffness of the stroma. Thus it is possible that, although
pre-treatment differences were not detectable, early changes in the tumor due to the effect
of Herceptin treatment may be identifiable via modulus evaluation before they are
noticeable through the clinical manifestation of treatment response, which is a
measurable change in the physical tumor size.

97
CHAPTER VI
OTHER STUDIES
Introduction
It has been well established in research that understanding the mechanical
properties of soft tissue is a challenging endeavor. The inherent irregularity of shape of
tissue samples and the relative difficulty in creating a normalized shape is one main
source of difficulty in evaluating soft tissue properties. However, in many cases, disease
development and progression have been shown to result in changes in the stiffness of the
tissue and thus methods of soft tissue modulus evaluation are highly desired [7-21]. In
previous work, the MGT assay was developed and utilized [102, 119]. The system was
conceived as a union of mechanical testing and modeling with a gel submersion system to
allow for uniformity and controllability of the testing shape. To test the feasibility of the
system, the MGT assay was initially validated relative to the traditionally accepted
method of direct indentation testing [102]. This was accomplished using fibrotic murine
liver tissue, and the results demonstrated a correlation between the MGT assay modulus
and the modulus calculated from indentation testing. However, the magnitude of the
modulus differed between the two techniques, which was attributed to the nature of the
testing protocols; i.e. indentation testing manipulates only a small portion of the surface
of the tissue, while the MGT assay technique is a whole-volume interrogation of the
tissue modulus. After confirming the aptitude of the assay, the technique was utilized to
evaluate the modulus of murine mammary tumor tissue relative to the collagen content of

98
the tissue [119]. This work provided an initial examination of the microstructural
contribution of the tissue to the bulk Young‟s modulus, and the results demonstrated a
positive correlation between collagen content and the assay derived modulus.
While the aforementioned work was successful in demonstrating the ability of the
MGT assay, a thorough sensitivity study of the MGT Assay had yet to be performed, and
hence its capabilities and limitations remained unknown. Previous work has shown a
dependency on the tissue volume to gel volume relative ratio for the success of the assay
in evaluating the tissue modulus [119]. This observation solidifies the idea that the assay
inherently possesses limitations and boundaries attributed to the various components of
the assay. These limitations will need to be identified and accounted for in order to
successfully utilize the MGT assay as a reliable modulus evaluation technique. Thus, the
purpose of the work presented herein was to characterize the MGT assay in order to
ensure and validate its rigorousness as a repeatable modulus evaluation technique.
The gel generation process is of main concern to the work presented here
regarding assay characterization. The protocol described in Chapter II was utilized for all
gel generation in this work. Specifically, the buffer solution was generated using 19.1
mL of deionized water, 0.65 mL of 1 molar Tris buffer, and 0.25 mL of 10% ammonium
persulfate (BioRad Laboratories, Hercules, CA). Then, a volume of the buffer solution
was combined with 30% Acrylamide/Bis-acrylamide (BioRad Laboratories, Hercules,
CA), in a proportion which was dependent on the desired final polyacrylamide
percentage, to yield a total combined volume of 16 mL of the bulk solution. The
individual gels were created by transferring 1.4 mL of the bulk solution to an individual
well in a 24 well cell culture plate (Corning Inc., Corning, NY). The wells were

99
cylindrical in shape and had a diameter of 16 mm, thus creating a standardized shape
among samples. After solution allocation, 0.16 mL of the contrast agent Optiray
(Mallinckrodt Inc., Hazelwood, MO) was added to the wells, unless otherwise stated. At
this point, if a heterogeneous gel was being created, the object to be embedded was
suspended by means of forceps in the gel solution. Finally, 0.02 mL of TEMED, the
initiating agent, was added and the sample was pipette-mixed for approximately one
minute as the solution solidified in order to promote a uniform mixture.
Gel Selection
Methods
In the heterogeneous gel-tissue sample, the gel modulus is used as the elastic
reference for the embedded tissue property assessment. Thus, the initial gel selection was
of considerable importance. In considering the role of the gel in the MGT assay, two key
characteristics of the gel were required: (1) the gel modulus had to be variable and
relatively simple to control, and (2) gel properties needed to be relatively static over time,
i.e. shifts due to small protocol variations in testing time and ambient temperature needed
to be minimized, and viscoelastic effects need to subside quickly. Two materials are
commonly mentioned in literature as being utilized for phantom generation and
submersion techniques: agarose (Research Products International Corp, Mt. Prospect, IL)
and polyacrylamide (BioRad Laboratories, Hercules, CA). In relation to the
aforementioned requirements, both agarose and polyacrylamide materials have the
advantage that the stiffness of the gel can be modified by altering the percentage (by
weight) of agarose or polyacrylamide in the gel, respectively. However, the

100
controllability of the resultant modulus was unknown. Additionally, the dynamic
behavior of the gel properties relative to the time scale of the MGT evaluation required
investigation. Hence, an initial assessment of the agarose and polyacrylamide gels was
performed in order to facilitate gel selection. In order to assess the achievable modulus
range and controllability for each gel, an array of gels of differing compositions was
created. For the agarose samples, eight gels were generated, with agarose percentages of
0.3, 0.4, 0.5, 0.6, 0.75, 1.0 and 1.25. In the polyacrylamide case, six gel samples were
tested, ranging from 3 to 6 percent polyacrylamide in 0.5 percent increments. All gels
were created in Petri dishes that measured 10 cm in diameter and 1.1 cm deep. The
testing protocol consisted of the application of a 5 percent precompression. Step
compressions were applied in 0.5 percent increments for a total of 5 percent additional
strain, with a 60 second dwell after each compression. The force values were collected at
the end of each dwell period, and were utilized with the corresponding compression
values to generate stress and strain data for the gels. A linear regression was performed
on the stress-strain data to approximate the modulus for each gel sample. The same
material testing protocol was implemented to assess the thermal-dependence of the gel
moduli. Two samples were manufactured for each gel type. The gels were tested
immediately after generation, and then at each subsequent hour for four hours. The
modulus values for the samples were calculated as previously described.
Results
The results from the gel selection testing indicated that both were readily
controllable in terms of the resultant modulus by regulating the percent of the constitutive

101
components. In regards to thermal sensitivity, the results showed that agarose was very
sensitive to thermal effects; particularly, the modulus of the agarose samples decreased
by 15.5% over the first hour and 44.8% over the full four hours of the test.
Polyacrylamide, on the other hand, did not demonstrate the same extremity of thermal
effects as agarose. The polyacrylamide results showed a decrease in modulus of only
4.8% in the first hour, and a total of 12.6% over the four hours of experimentation.
Discussion
The initial gel testing for the comparison between agarose and polyacrylamide gel
proved deterministic in the gel selection. Both gels were able to be controlled for
modulus based on the percentage of agarose or polyacrylamide, and could be adapted to
generate the desired modulus, so either gel was appropriate in this regard. However, the
thermal testing results proved the most decisive. In considering the experimental
procedures of the MGT assay, the gel would be exposed to room temperature for
prolonged periods of time during imaging and material testing, and thus thermal stability
was necessary. Agarose is a hydrogel, and the gel is solidified by cooling the
components on ice. As it is exposed to room temperature for prolonged periods of time,
the gel liquefies and changes properties, and this was reflected in the material testing
results. Polyacrylamide solidifies by way of a polymerization reaction, which limits the
thermal dependence. The polyacrylamide gel was thus chosen as the gel matrix based on
its insensitivity to thermal fluctuations, rapid congealing properties, and stability.
Appendix A contains specifics regarding the chemistry and structure of polyacrylamide.

102
Gel Generation Reliability Test
Methods
In considering the reliability of the MGT assay, a main component for
investigation is the background modulus of the heterogeneous gel. The background
modulus utilized for the heterogeneous optimization is defined using a homogeneous
reference gel which is generated at the same time and in the same manner as the
heterogeneous tissue-containing gels. The homogeneous gel is tested and imaged
following the same method described for the assay evaluation, and an optimized modulus
value is obtained, which is then assumed to be the modulus of the background gel in the
heterogeneous tissue-gel sample. In using the homogeneous gel modulus in the
heterogeneous optimization, it is assumed that the gel modulus is consistent from sample
to sample, and that the same modulus value can be obtained in a repeatable manner. To
validate this assumption, five sets of three homogenous gels were tested. On each
occasion, one bulk solution was mixed as previously described, from which each set of
homogeneous gels was created. Sets 1 and 2 were created using 4.5 percent
polyacrylamide while sets 3 and 4 were generated with 4.8 percent polyacrylamide. Set 5
was also produced with 4.8 percent polyacrylamide, but the CT contrast agent (Optiray)
was withheld from the gels. Table 8 gives the required volumes of both the buffer
solution and the polyacrylamide for each percent polyacrylamide used for this
experiment.

103
Results
The results for the gel generation reliability tests are shown in Table 9 below.
The optimized modulus values for each of the three samples in the five sets are tabulated.
The table also includes the average and the standard deviation of each set of samples.
The last row of the table gives the standard deviation as a percentage of the average
modulus for each set. The average of this value over the five sets is 1%. The largest
standard deviation as a percent of the average occurs in set 1, at 1.40%.
Table 8. Components of the bulk solution for the gel generation reliability testing.
%PA of Solution
4.5 4.8
Buffer Solution (mL) 13.6 13.44
30% Acrylamide/Bis-
acrylamide (mL) 2.4 2.56
Table 9. Gel generation reliability test modulus results.
Modulus Values (Pa)
Set 1 Set 2 Set 3 Set 4 Set5
911 993 1303 1282 1810
936 1001 1294 1279 1778
918 1003 1277 1258 1801
Average (Pa) 922 999 1291 1273 1796
Std Deviation (Pa) 12.9 5.3 12.3 13.1 16.5
Std Dev % of Avg 1.40% 0.53% 0.95% 1.03% 0.92%

104
Discussion
In the gel generation reliability testing, the difference in modulus value between
individual gels generated from the same bulk solution was minimal when considering the
number in isolation. As previously stated, the average standard deviation as a percent of
the mean modulus value over the five sets was 1%. The high repeatability was
anticipated since the majority of the components that constitute the gel mixture, and thus
the majority of the sources for variance among gel modulus values, are placed into the
bulk solution, instituting uniformity among the gels. The contrast agent and the initiator
(TEMED) are added separately to the gels after they have been proportioned to the
individual well plates, and thus are both possible sources of the constituent differences
that result in different gel modulus values. The contrast agent is added by means of
syringe, and though every effort is made to keep the amount uniform, very slight
differences in volume are not only possible but likely. Since the contrast agent adds to
the volume of the gel and thus in essence dilutes the polyacrylamide percentage of the
volume, differences in the contrast agent volume will create slight differences in the
modulus values of the individual gels. In considering the reference gel sets, the first four
sets contained a contrast agent, but set 5 did not. Even without the contrast agent, the
modulus values of set 5 still vary among the three samples, resulting in a standard
deviation as a percent of the average modulus of 0.92%. Since the potential error due to
the addition of the contrast agent has been eliminated in this case, other sources must be
responsible for the differences. The addition of the initiator, TEMED, though added to
the individual gel is not a likely source of error. Previous experiments have shown that
the amount of initiator affects the final modulus of the gel, so if the amount added to each

105
gel were not constant, then it is possible that the TEMED would have an effect. However,
the TEMED measurement is highly controlled by means of a micropipette and thus
should be invariant. Other possible sources of the disparity in modulus values outside of
the gel generation process include the material testing and the segmentation of the CT
images. These aspects of the assay are highly controlled and automated in all possible
cases in order to minimize induced error. However, the material testing and
segmentation are still user-controlled and hence have the potential to generate error.
Effect of Gel Generation Reliability on Modulus Reconstruction
Methods
After evaluating the repeatability of the gel generation, the progression of tests led
to an evaluation of the extent of the effect of the background modulus on the optimized
embedded tissue modulus. Since the model calculated surface stress (and hence force) is
dependent on both the background modulus and the embedded modulus, a change in the
background modulus will consequently have an effect on the optimized embedded
modulus. To investigate this effect, nine heterogeneous meshes from a previous study
were utilized. These meshes were from the second evaluation of the MGT assay wherein
the modulus values of murine mammary tumors derived from mouse mammary tumor
virus polyomavirus middle T (PyV-mT) transgenic lines were compared to the collagen
content of the tissue. In evaluating the tissues via the MGT assay, heterogeneous meshes
were created for each sample with a corresponding assigned background modulus and an
optimized tissue modulus. The background modulus and the optimized tissue modulus
values from the previous study were utilized as the baseline for the background modulus

106
dependency interrogation presented here. In the previous study, the nine tumor samples
were evaluated in three different groups at various times, so there were three groups of
baseline background modulus values: 4164, 2346, and 989. The baseline background
modulus values and baseline tissue modulus values are shown in Table 10. The
respective background modulus was altered both above and below the baseline value by a
percentage consistent with the results from the gel generation reliability test, or 1%. The
optimization process was initiated with the altered background modulus and the resultant
tissue modulus was recorded and compared to the value obtained in the baseline case.
Results
The results are shown in Tables 11 and 12 and Figures 20 and 21 below. In
Table 11, the percent change is given for each of the 9 tumor samples. The percent
change is calculated as:
Table 10. Tumor data for effect of gel generation reliability on modulus reconstruction
analysis.
Tumor
Number
Background Modulus
(Pa)
Tissue Modulus
(Pa)
1 4164 746
2 4164 974
3 4164 3841
4 2346 2427
5 2346 1049
6 989 2728
7 989 1840
8 989 886
9 989 650

107
( ) (
)
(22)
where is the optimized tissue modulus value when the background modulus is
decreased by 1%, is the optimized tissue modulus value when the background
modulus is increased by 1%, and is the baseline tissue modulus. For a 1%
alteration in the background modulus, the average change over all nine samples was
0.144, or approximately 14 percent. The maximum value over the samples was 0.300
and the minimum value was 0.050. Other parameters of interest for the nine samples,
including baseline background modulus, baseline tissue modulus, tissue volume, gel
volume, and tissue-gel volume ratio are also tabulated (Table 12). Figures 20 and 21
depict the data for the 1% range in graphical form. Figure 20 shows the normalized
optimized tissue modulus as a function of the normalized background modulus (or
percent change in background modulus) for each incremental background modulus
evaluation. Figure 21 shows the normalized average tissue modulus change as a function
of the tissue to gel volume ratio. The nine samples are grouped by baseline background
modulus, as indicated by the marker style.

108
Table 11. Effect of gel generation on modulus reconstruction results – 1% range.
Tumor Number Percent Change
1 11.7%
2 11.0%
3 5.0%
4 21.9%
5 30.0%
6 13.5%
7 8.6%
8 16.8%
9 10.8%
Average 14.4%
Table 12. Tumor data for effect of gel generation on modulus reconstruction analysis.
Tumor
Number
Background
Modulus
(Pa)
Tissue
Modulus
(Pa)
Tissue
Volume
(mm3)
Gel
Volume
(mm3)
Tissue-Gel
Volume Ratio
1 4164 746 303.4 2000 0.152
2 4164 974 284.3 2000 0.142
3 4164 3841 329.5 2000 0.165
4 2346 2427 63.3 1500 0.042
5 2346 1049 65.9 1500 0.044
6 989 2728 66.9 1400 0.048
7 989 1840 134.6 1400 0.096
8 989 886 88.6 1400 0.063
9 989 650 158.7 1400 0.113

109
Figure 20. Normalized tissue modulus as a function of percent background modulus
noise for each of the nine PyV-mT tumor samples in the effect of gel generation on
modulus reconstruction analysis.
Figure 21. Normalized modulus average range as a function of tissue to gel volume ratio
in the effect of gel generation on modulus reconstruction analysis. The different markers
indicate the three original background modulus values. The red square indicates an
original value of 2346 Pa, the green triangle was originally 989 Pa, and the blue diamond
was 4164 Pa.

110
Discussion
From the previous results, the average standard deviation of the reference sets as a
percent of the mean modulus was 1%. This is thus the largest difference between an
optimized reference gel modulus utilized as the assumed background modulus and the
actual heterogeneous background modulus that would be expected. From this
assumption, a ±1% range of the altered background modulus was evaluated. Though the
percent change in the background modulus was uniform, the effect on the optimized
tissue modulus varied. Figure 20 shows the normalized tissue modulus (optimized
modulus divided by baseline modulus) as a function of normalized background modulus
(altered modulus divided by baseline modulus). From this figure, it is apparent that the
extent of the effect of the background modulus is not a simple relationship, but rather is a
complicated dependency on parameters such as the tissue-volume-to-gel-volume-ratio,
the tissue modulus, the ratio between the tissue modulus and background modulus, and
the boundary between the tissue and gel. Many options were considered in trying to find
a universal relationship between the altered background modulus and the optimized tissue
modulus for all of the samples, but the relationship is inherently complicated and relies
on a complex combination of the parameters that could not be elicited. Figure 21 shows
the average 1% range divided by the baseline tissue modulus as a function of tissue
volume to gel volume ratio. This figure implies a slight relationship between these two
parameters, with a general increase in the range as the tissue volume to gel volume ratio
decreases; however, it is clear that they do not completely describe the relationship. Even
without a clear descriptive relationship, the normalized average range is insightful. This
value spans from 0.050 to 0.300, with an average value of 0.141. This means that, in the

111
worst case, a 1% change in the background modulus results in a 30% change in the
optimized tissue modulus, and on average it results in a 14% change in the modulus.
These results emphasize that the optimized embedded modulus is highly sensitive to the
background modulus. Unfortunately, the gel creation process is susceptible to slight
differences that cannot be controlled beyond the repeatability demonstrated by the gel
generation repeatability testing. An option that had been considered to address this issue
was eliminating the homogeneous gel for background modulus assignment and rather
performing a dual optimization of both the background modulus and the embedded
modulus. This would allow the background modulus to vary for each sample, and thus
could account for the slight differences in background modulus. However,
implementation of the dual optimization has proven difficult due to the range of modulus
combinations that can produce the same error. In the single optimization case, where the
background modulus is assigned, a minimum error is associated with one single
embedded modulus value. In the dual optimization case, a basin of minimum error
values occurs wherein various combinations of modulus values produce the same error.
This is due to a lack of information relative to the input parameters (ie force,
displacement). Based on the work presented here, it may be beneficial and even
necessary to further consider ways to restrict the dual optimization process so that the
error due to the assigned background modulus could potentially be eliminated.

112
Reliability and Repeatability of Modulus Reconstruction
Methods
The assumption in utilizing the MGT assay for embedded tissue modulus
evaluation is that the assay can accurately evaluate the modulus of the embedded item.
The feasibility of this assumption has been previously checked in a secondary nature by
comparing the results of the assay to the traditionally accepted soft tissue evaluation
method of indentation testing. However, in order to concisely evaluate the assay, it was
opted to directly check the accuracy and repeatability of the embedded modulus
evaluation. It has been previously established that a gel-volume-to-tissue-mass ratio
dependency exists for the assay, and a limiting ratio was suggested based on the data
available from previous work [119]. Due to this realization, a volume-modulus-ratio
(VMR) evaluation was produced which consisted of embedding multiple objects with the
same modulus value but different volumes. The VMR evaluation was conceived to serve
three purposes: (1) test the ability of the assay to repeatedly assign the „correct‟ modulus
to the embedded component, (2) analyze whether a relationship existed between the ratio
of embedded volume to overall gel volume and the evaluated embedded modulus, and (3)
investigate the dependency of a successful reconstruction on the ratio between embedded
modulus and background modulus. In order to achieve these objectives, it was necessary
to ensure uniformity among the embedded pieces. To this avail, a gel-in-gel system was
devised wherein polyacrylamide gel phantoms were used to represent the embedded soft
tissue sample, and were subsequently embedded in the traditional polyacrylamide
background. Each VMR evaluation consisted 11 total gels: a reference gel, a sample of
the embedded gel compatible for material testing, and three sets of three heterogeneous

113
gels, with small, medium, and large embedded pieces. The sample preparation process
for this experiment occurred in two parts. First, the gels for embedding were generated; a
5.5% bulk solution was created as previously detailed. In this experiment, barium sulfate
was used in place of Optiray to provide both CT and visual contrast. The consistency of
the barium sulfate made it difficult to measure volumes small enough to add to the
individual gels, so 0.16 mL of barium sulfate was added to the bulk solution to ensure
consistency among gel samples. From the bulk solution, three gels were generated: one
which was utilized as the sample of the embedded gel, providing a measure of the
expected reconstructed embedded modulus, and the other two which were cut into pieces
to create the embedded samples. Nine embedded segments were utilized, with three each
of a large mass, a medium mass, and a small mass. Each large embedded gel weighed
approximately 150 mg, the medium embedded gels weighed around 120 mg, and the
small embedded gels weighed 90 mg. The second portion of the sample preparation
process consisted of generating the background gel and embedding the gel segments. As
in all gel generation cases, the bulk solution was generated with the desired percent
polyacrylamide, from which the homogenous gel and nine heterogeneous gels were
created. The nine heterogeneous gels, the reference gel, and the sample of the embedded
gel were evaluated using the MGT assay protocol, and the optimized modulus from the
sample of the embedded gel was used to assess the fidelity of the embedded modulus
evaluations. Three distinct sets of the VMR analysis were evaluated; the difference
between the three sets existed in the percent polyacrylamide, and hence the modulus, of
the background gels. The percent polyacrylamide of the embedded gel remained constant
at 5.5% in all cases, while the background gel percent polyacrylamide was varied

114
between 4%, 4.5%, and 5% PA. The component volumes for the polyacrylamide
percentages used in this portion of the experimentation are given in Table 13. The
combinations of background %PA and embedded %PA for each set are given in Table
14, and examples of the homogeneous embedded and background gels as well as the
heterogeneous gel are shown in Figure 22.
Table 13. Components of the bulk solution for the VMR analysis.
% PA of Solution
4 4.5 5 5.5
Buffer Solution (mL) 13.87 13.6 13.33 13.07
30% Acrylamide/Bis-
acrylamide (mL) 2.13 2.4 2.67 2.93
Table 14. Percent polyacrylamide for VMR analysis.
Set Number
1 2 3
Background % PA 4.5 5 4
Embedded % PA 5.5 5.5 5.5
Figure 22. (a) Sample of embedded modulus gel with barium sulfate (left) and
background reference gel (right). (b) Heterogeneous gel with embedded
polyacrylamide sample from the VMR analysis.
a b

115
Results
The results for the VMR analysis are presented in Table 15. Table 15 consists of
the homogeneous gel modulus value for each set as well as the modulus of the sample of
the embedded gel for each set. Additionally, it gives the optimized modulus values for
each of the nine embedded gel segments in each of the three sets. Figures 23 and 24
below show the force values from the material testing protocol as a function of the
displacement for each sample in sets 1 and 2 of the VMR analysis. The dashed curves
indicate the unsuccessful modulus reconstructions from each set, while the other samples
in the set are represented by the solid lines. Tables 16 and 17 provide the slope of the
force-displacement curves for each sample in VMR set 1 and 2, respectively. The
highlighted slopes correspond to the dashed force-displacement curves from Figures 23
and 24.

116
Table 15. Results for the reliability and repeatability of modulus reconstruction (VMR)
analysis.
Modulus (Pa)
Set 1 Set 2 Set 3
Reference 1327 2890 941
Sample of Embedded Gel 4453 5137 4478
Sample 1 4620 5821 94
Sample 2 2946 2293 322
Sample 3 4503 5217 562
Sample 4 4316 1324 138
Sample 5 4720 2686 1583
Sample 6 4063 5137 644
Sample 7 1667 5314 559
Sample 8 4340 4779 444
Sample 9 4486 5308 403

117
Figure 23. Force values as a function of displacement for VMR set #1.
Table 16. Slope of force versus displacement curve for VMR set #1.
Sample Number
Slope (force vs disp)
Absolute Difference from
Average
1 3.98 1.98%
2 3.37 13.70%
3 4.00 2.53%
4 3.78 3.09%
5 3.96 1.36%
6 3.85 1.21%
7 3.37 13.55%
8 3.91 0.11%
9 3.84 1.67%
Average 3.90

118
Figure 24. Force values as a function of displacement for VMR set #2.
Table 17. Slope of force versus displacement curve for VMR set #2.
Sample Number
Slope (force vs disp)
Absolute Difference from
Average
1 7.71 0.90%
2 6.76 13.14%
3 7.78 0.01%
4 6.83 12.28%
5 6.98 10.32%
6 7.87 1.08%
7 7.68 1.39%
8 7.97 2.33%
9 7.70 1.12%
Average 7.78

119
Discussion
The results of the reliability and repeatability of modulus reconstruction proved
very interesting. Based on the previous realization of the importance of the gel-volume-
to-tissue-volume ratio, it was expected that there would be a trend concerning embedded
volume. Specifically, it was hypothesized that embedded volume would affect the
accuracy of the reconstructed modulus of the embedded specimen; for the samples that
succeeded in reconstructing, this trend was not observed. The average difference
between the optimized embedded modulus and the sample embedded gel did not depend
on the volume of the embedded segment. In the first set, the average absolute difference
was 109 Pa for the large samples, 264 for the medium samples, and 73 for the small
samples (excluding those that did not test appropriately, i.e. „large 2‟ and „small 1‟). In
the second set, the average difference values were 67 for the large samples and 235 for
the small samples (excluding „large 2‟). Of the three medium samples in the second set,
only 1 tested appropriately, and that sample had an error of zero. These values comprise
a very limited sampling due to the failure of the modulus optimization in some of the
cases. However, as an initial estimation, it is implied that there is no correlation between
modulus optimization error and embedded volume. This statement is tempered, though,
by the fact that the sensitivity of the transducer must be sufficient to quantify the force
differences achieved based on gel-volume-to-tissue-mass-ratio.
The notable result from the VMR evaluation is the behavior of „large 2‟ and
„small 1‟ from set 1, „large 2‟, „medium 1‟, and „medium 2‟ from set 2, and the entirety of
set 3. These samples produced very large embedded modulus evaluation errors, in some
cases to the extent where the evaluation does not sense the embedded volume. After

120
viewing these results, it was hypothesized that the reason for this behavior is that the gel-
in-gel configuration lacked the bonding at the interface that the tissue-in-gel system
possesses. In other words, it appears that as the heterogeneous gel-in-gel sample is
compressed, the background gel is decoupled from the embedded gel due to a weak
interface bond and hence the assay cannot accurately evaluate the embedded gel. Though
this does not happen in all cases, the faltered evaluations indicate that the interface is
unreliable. Figures 23 and 24 show the force values as a function of the step
displacements for sets 1 and 2, respectively. In these figures, the samples which did not
test appropriately are indicated by the dashed line, whereas those which had successful
reconstructions are indicated by the solid lines. From this depiction, it is obvious that the
force values are lower for all of the samples which failed to reconstruct appropriately.
This observation is further confirmed by Tables 16 and 17, which present the slopes of
the force-displacement curves. Here again the unsuccessful samples are distinct in that
the slopes are noticeably lower than the successful samples. These would seem to
support the hypothesis that the background gel and embedded gel decoupled. Without a
bond between the two surfaces, as the top surface of the background gel is compressed,
the internal motion of the gel will not be coupled to the embedded gel, and instead will
deform around the embedded gel. Since the background gel modulus is lower than the
embedded gel modulus in all cases, a lack of strain transfer to the embedded gel would
result in a lower force experienced by the material tester as compared to the coupled case.
In considering the third set, all nine of the samples evaluated to very low (near zero)
embedded modulus values. This is most likely due to the high contrast between the
embedded and background modulus values, which exasperated the inadequate bond and

121
caused all of the samples to fail. Due to the modulus evaluation failure in some of the
sample cases, the VMR analysis did not prove successful in its intended three-fold
purpose. However, it did manage to highlight the previously understated importance of
the bond between the embedded tissue and the polyacrylamide gel.
The gel-in-gel approach to the VMR analysis proved to be ineffective due to the
presumed interface issues; however, the bonding in the tissue-in-gel case had not
previously presented an issue. The reason for this was hypothesized to be the surface
texture and porosity of the tissue that is not mimicked in the embedded gel case.
Previous experiments with murine liver and murine breast tumor tissue have displayed
effective bonding between the gel and the tissue, with no outward signs of inadequacy as
in the gel-in-gel case. If interface issues had occurred in these cases, then the optimized
tissue modulus would be lower than the actual tissue modulus, which would not be
identifiable based on modulus value alone. It is not likely that this occurred in either of
the soft tissue cases, though, due to the experimental protocol. In the murine liver case,
indentation testing was performed to validate the assay-derived modulus. In the non-
diseased case, the two measures were almost identical. In the diseased case, the
magnitude of the measures differed, but a correlation existed between the two. A similar
correlation was found in the mammary tumor work, wherein the modulus of the tissue
correlated tightly to tissue collagen content. If the gel-tissue interface were decoupling in
either of these evaluations, random noise would have effectively been added to the
optimized tissue values and such strong correlations to other measures would not have
been observed.

122
Soft Tissue Boundary Effect
Methods
The gel-in-gel approach to the assay evaluation process was conceptualized as a
baseline evaluation system due to the controllable nature of the embedded gel size and
modulus. Additionally, embedded gels produced from the same bulk gel provided a
uniform modulus across samples, allowing for a separate calculation of the expected
embedded modulus by means of the sample of the embedded gel, and providing a
standard for calculation of the assay modulus optimization error. However, the gel
analysis did not prove entirely successful. It was hypothesized that the problem with the
gel-in-gel analysis could be attributed to the gel-gel interface, which was potentially not
indicative of the bond experienced in the soft tissue case. Based on this hypothesis, the
VMR analysis was extended in a more representative manner using soft tissue, the result
of which was an experiment involving chicken liver samples. The experimental protocol
was similar to the gel-in-gel VMR analysis previously described. A single lobe of a
chicken liver purchased from the grocery store was sectioned into 10 samples, nine of
which were used for embedding for assay analysis, and one of which was underwent
indentation testing for modulus confirmation. The nine samples for embedding were
divided into three groups of three samples – named large, medium, and small – based on
the sample mass. The large tissue samples weighed an average of 245 mg, the medium
samples registered an average of 197 mg, and the small samples weighed an average of
144 mg. A 4.8% polyacrylamide bulk solution was produced and utilized for the
background gel, from which the homogeneous gel and the heterogeneous chicken liver
gels were created. After solidification, the gels were tested, imaged, and evaluated as

123
previously described. For corroboration of the assay-evaluated modulus values,
indentation testing was performed on the final liver sample. The indentation protocol
was the same as that described in the murine liver paper [1]. Briefly, a spherical indenter
tip with a radius of 1.5 mm was used to indent the tissue a distance of 0.4 mm. The
indentation was held for a 60 second dwell and then released for 60 seconds; this was
repeated three times for each test. The indentation test was repeated twice – once before
the gels were tested and the second time after half of the gel testing had been performed.
Analysis of the data for modulus extraction was performed in the manner previously
described, using the correlation model suggested by Stevanocić et al. [60].
Results
The results for the soft tissue boundary effect analysis are given in Table 18.
Presented here are the optimized modulus values for each of the nine embedded samples
as well as the resulting modulus from the indentation testing of the liver segment. The
average modulus value assessed by the MGT assay was 547 Pa with a standard deviation
of 22.7 Pa. Also given in Table 18 are the absolute differences between the optimized
modulus and the indentation-based modulus. The maximum difference between the
indentation-derived modulus and the assay-assigned modulus occurs in sample „M2‟ with
a magnitude of 44 Pa, which equates to an 8.2% error. The average absolute difference
over all nine samples is 17.8 Pa, or 3.31%.

124
Discussion
To verify the suspected inferiority of the gel-gel system, a soft tissue test utilizing
chicken liver was implemented. This test was performed in the same manner as the VMR
analysis, except soft tissue (specifically chicken liver) was substituted for the embedded
gel. As shown in Table 18, the results for this experiment indicate a successful
evaluation of the embedded liver tissue. All nine samples optimized successfully with an
average modulus of 547 Pa and a standard deviation of 22.6 Pa. Additionally, the assay
derived modulus values for the nine embedded samples mirrored the separately evaluated
indentation modulus, with a maximum error of 44 Pa, or 8.18%, and an average error of
17.8 Pa, or 3.31%. This strong correspondence between the indentation testing and the
assay assessment parallels the initial experiments with murine liver which demonstrated a
Table 18. Optimized modulus values for chicken liver tests.
Modulus (Pa) Absolute
Difference from Indentation (Pa)
Indentation 538
Sample 1 531 7.2
Sample 2 526 12.4
Sample 3 540 2
Sample 4 572 33.5
Sample 5 582 44
Sample 6 543 4.5
Sample 7 528 10.4
Sample 8 529 9
Sample 9 575 37.3

125
very high correlation between the assay modulus and the indentation modulus in the non-
diseased case. In the evaluation performed here, some spread of the modulus was
expected due to the nature of the soft tissue. Liver tissue was chosen due to its relative
homogeneity, though heterogeneity inherently still exists which could account for some
of the spread in the data. Additionally, the previously established dependency on
background modulus could account for some of the modulus spread experienced in the
chicken liver evaluation. Overall, the values presented here provide a secondary
confirmation of the ability of the assay to evaluate a modulus that corresponds to a
traditionally accepted soft tissue modulus evaluation technique. Additionally, these
results speak to the repeatability of the MGT in assessing the „correct‟ modulus value to
the embedded tissue. Finally, this data makes a strong argument toward validating the
assumption that the issues in the gel-in-gel case were not a function of the MGT assay
protocol, but could be attributed to the interaction between the embedded gel and the
background gel.

126
CHAPTER VII
SUMMARY AND RECOMENDATIONS
The work described here has been a collection of evaluations and trials of the
newly developed soft tissue modulus evaluation technique termed the MGT assay. The
assay has been utilized for a variety of tissue evaluations, including fibrotic murine liver
and murine mammary tumor tissue. Additionally, it has been validated relative to a
standard mechanical testing technique in the murine liver case, and the results of the
assay have been correlated to microstructural composition by comparison to collagen
content in the PyV-mT murine mammary tumor case. These investigations provided the
utility and initial validation of the MGT assay. In the latest work, the assay was utilized
to evaluate the modulus difference between responsive and resistant lines of the BT-474
tumor tissue. Though mechanical properties did not prove to provide a statistically
significant biomarker between the lines, a correlation between modulus and collagen
content of the samples was established. Finally, an investigation of the limitations and
capabilities of the MGT assay was conducted to ensure its aptitude and reliability as a
modulus evaluation technique. This analysis brought to light some aspects of the assay
that need to be further considered or adapted as well as some areas which had previously
been undervalued.
Investigations utilizing the MGT assay have not reached their pinnacle, as there
are other aspects of the assay to investigate, and ways to further the analysis paradigm.
For example, it is intuitive to think that the segmentation of the CT scans and the

127
resulting gel and embedded volumes would affect the modulus optimization. This has, in
fact, proven to be the case in previous work, where, purely for the sake of observation,
the segmented volumes of a sample were manipulated to survey the effect on the modulus
evaluation. To present the effect in an organized manner, a theoretical example of the
dependency is shown in Figure 25 and Tables 19 and 20 below. A simulation was
created which consisted of an ellipsoid embedded in a cylindrical volume with a
paraboloid top to mimic a tissue sample embedded in the polyacrylamide gel. A modulus
was assigned to the background and to the embedded volume, and a forward evaluation
of the forces was performed. The embedded volume was then varied from the baseline
state, both by increasing and decreasing the volume, and the resulting system was utilized
with the previously established force values to obtain an optimized embedded modulus.
This analysis was performed with two different baseline embedded volumes; one was 140
mm3, which corresponds to the average tumor volume in previous studies, and one was
102 mm3, to consider the case of smaller embedded volumes. As expected, the changing
embedded volume, representing the changing segmentation volume, has an effect of the
reconstructed modulus. This can be visualized in Figure 25. The effect appears fairly
linear in this case, but that is most likely due to the smooth surfaces and lack of noise in
the simulation. It would be expected that the relationship would be more complex in the
tissue case. In all evaluations utilizing the MGT assay, segmented gel volumes and
segmented embedded volumes have been recorded. However, data for actual volume of
the tissue and gel have not been collected due to the difficulty associated with obtaining it
as well as the possible destructive effects on the samples. In all cases, masses were
recorded, but since the density value of the samples is unknown, the mass only provides a

128
broad idea of where the segmented volume should fall. The correlation between
segmented volume and optimized modulus should be further evaluated and consideration
should be given as to how to assess the segmented volume for accuracy.
Figure 25. Effect of Embedded Volume on Optimized Modulus.

129
Table 19. Effect of Embedded Modulus Segmented Volume on Modulus,
embedded volume =140 mm3.
Embedded Volume = 140 mm3
Optimized Modulus
Percent Volume change
Difference Difference Percent
of Actual
1.8757 0% 0.0007 0.04%
1.8681 1% -0.0069 -0.37%
1.8608 2% -0.0142 -0.76%
1.8528 3% -0.0222 -1.18%
1.8462 4% -0.0288 -1.54%
1.8394 5% -0.0356 -1.90%
1.8227 7.5% -0.0523 -2.79%
1.8075 10% -0.0675 -3.60%
1.8828 -1% 0.0078 0.42%
1.8906 -2% 0.0156 0.83%
1.8996 -3% 0.0246 1.31%
1.9074 -4% 0.0324 1.73%
1.9161 -5% 0.0411 2.19%
1.9387 -7.5% 0.0637 3.40%
1.9619 -10% 0.0869 4.63%
Table 20. Effect of Embedded Modulus Segmented Volume on Modulus,
embedded volume =102 mm3.
Embedded Volume = 102 mm3
Optimized Modulus
Percent Volume change
Difference Difference Percent
of Actual
1.8755 0% 0.0005 0.03%
1.8681 1% -0.0069 -0.37%
1.8609 2% -0.0141 -0.75%
1.8533 3% -0.0217 -1.16%
1.8466 4% -0.0284 -1.51%
1.8392 5% -0.0358 -1.91%
1.8228 7.5% -0.0522 -2.78%
1.807 10% -0.068 -3.63%
1.8828 -1% 0.0078 0.42%
1.8911 -2% 0.0161 0.86%
1.8992 -3% 0.0242 1.29%
1.9074 -4% 0.0324 1.73%
1.917 -5% 0.042 2.24%
1.9392 -7.5% 0.0642 3.42%
1.963 -10% 0.088 4.69%
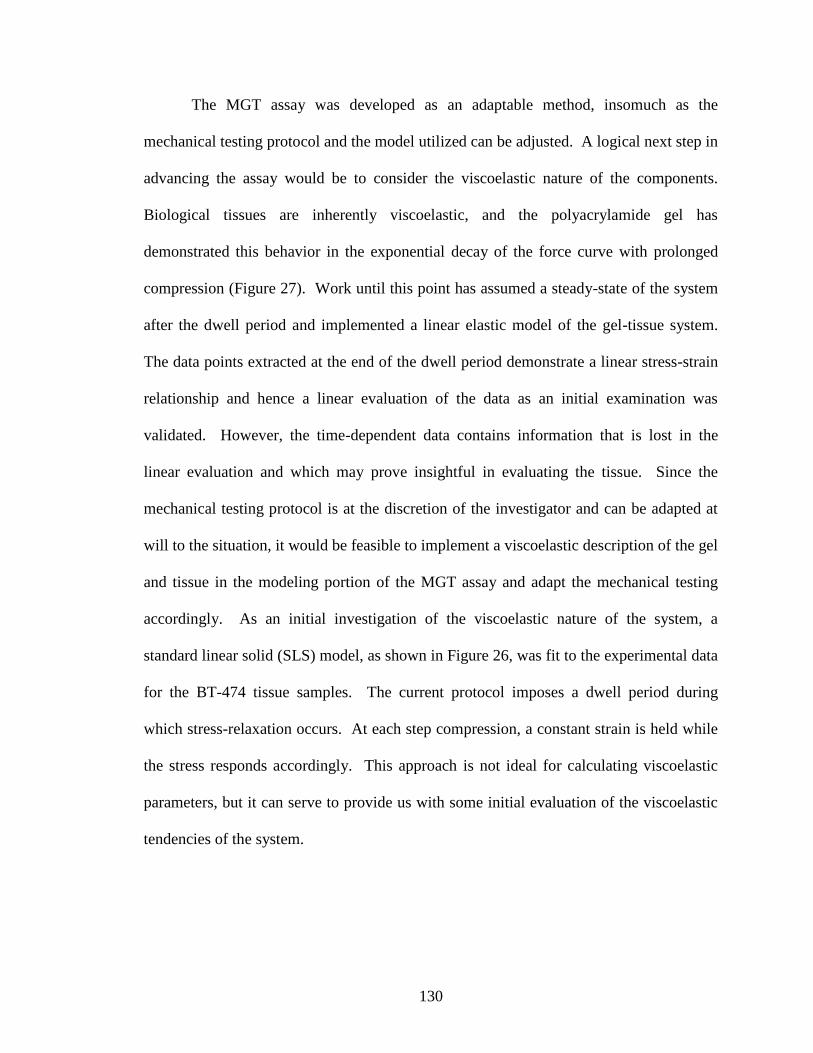
130
The MGT assay was developed as an adaptable method, insomuch as the
mechanical testing protocol and the model utilized can be adjusted. A logical next step in
advancing the assay would be to consider the viscoelastic nature of the components.
Biological tissues are inherently viscoelastic, and the polyacrylamide gel has
demonstrated this behavior in the exponential decay of the force curve with prolonged
compression (Figure 27). Work until this point has assumed a steady-state of the system
after the dwell period and implemented a linear elastic model of the gel-tissue system.
The data points extracted at the end of the dwell period demonstrate a linear stress-strain
relationship and hence a linear evaluation of the data as an initial examination was
validated. However, the time-dependent data contains information that is lost in the
linear evaluation and which may prove insightful in evaluating the tissue. Since the
mechanical testing protocol is at the discretion of the investigator and can be adapted at
will to the situation, it would be feasible to implement a viscoelastic description of the gel
and tissue in the modeling portion of the MGT assay and adapt the mechanical testing
accordingly. As an initial investigation of the viscoelastic nature of the system, a
standard linear solid (SLS) model, as shown in Figure 26, was fit to the experimental data
for the BT-474 tissue samples. The current protocol imposes a dwell period during
which stress-relaxation occurs. At each step compression, a constant strain is held while
the stress responds accordingly. This approach is not ideal for calculating viscoelastic
parameters, but it can serve to provide us with some initial evaluation of the viscoelastic
tendencies of the system.
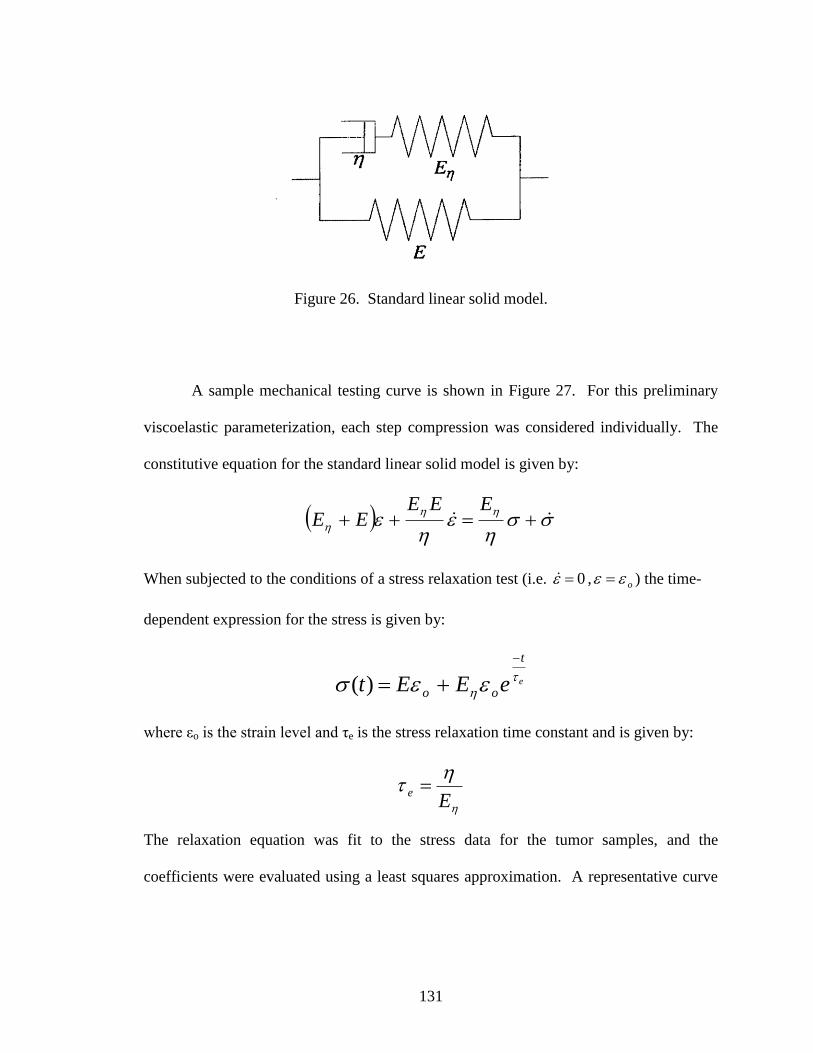
131
A sample mechanical testing curve is shown in Figure 27. For this preliminary
viscoelastic parameterization, each step compression was considered individually. The
constitutive equation for the standard linear solid model is given by:
EEEEE
When subjected to the conditions of a stress relaxation test (i.e. 0 , o ) the time-
dependent expression for the stress is given by:
e
t
oo eEEt
)(
where εo is the strain level and τe is the stress relaxation time constant and is given by:
Ee
The relaxation equation was fit to the stress data for the tumor samples, and the
coefficients were evaluated using a least squares approximation. A representative curve
Figure 26. Standard linear solid model.

132
fit is presented in Figure 28; the blue line is the testing data and the green line is the SLS
fit. The average relaxation time constants for the samples are shown in Table 21.
Figure 27. Sample material testing curve.
Figure 28. Representative fitting of the SLS model to the experimental data.

133
From Figure 28, it is obvious that this model is insufficient to describe the data.
The main shortcoming is in the initial response, where the model cannot accurately
represent the immediate elastic deformation experienced in the mechanical testing. A
more detailed model is necessary to fully describe the data, but this simplified model is a
suitable first approximation to probe a viscoelastic consideration of the mechanical
testing data. Given the data in Table 21, it is interesting to note that in almost all cases
the addition of the biological specimen increases the relaxation time of the model fit.
This indicates that the tissue is higher in viscosity than the gel and prolongs relaxation of
the system. Using dynamic data to assess the tissues as opposed to the static information
currently implemented in the MGT assay would allow for further parameterization of the
tissue which could provide insight regarding differences among the samples that are lost
in the static evaluation.
In regards to the potential for the MGT assay as a component of elastographic
techniques, two preliminary evaluations have been performed. Both evaluations were
performed using the fibrotic liver samples that were evaluated in Chapter III. The first
Table 21. Stress relaxation time constants for reference gels and heterogeneous gels.
Reference Gel Average Specimen Average
Ref1 20.97 BT474-1 23.18
Ref2 21.84 HR6-1 25.13
Ref3 18.63 BT474-2 18.6
BT474-3 21.27
Ref4 18.82 HR6-2 21.88
HR6-3 22.72
Ref5 16.76 BT474-4 17.27
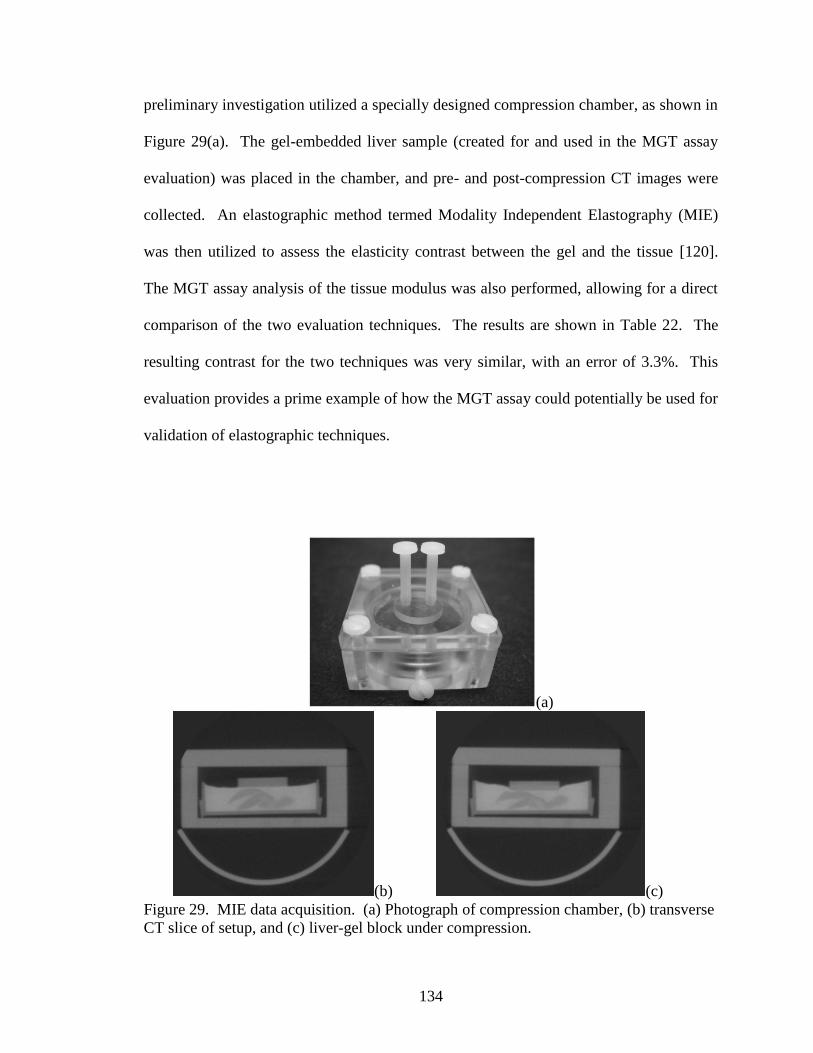
134
preliminary investigation utilized a specially designed compression chamber, as shown in
Figure 29(a). The gel-embedded liver sample (created for and used in the MGT assay
evaluation) was placed in the chamber, and pre- and post-compression CT images were
collected. An elastographic method termed Modality Independent Elastography (MIE)
was then utilized to assess the elasticity contrast between the gel and the tissue [120].
The MGT assay analysis of the tissue modulus was also performed, allowing for a direct
comparison of the two evaluation techniques. The results are shown in Table 22. The
resulting contrast for the two techniques was very similar, with an error of 3.3%. This
evaluation provides a prime example of how the MGT assay could potentially be used for
validation of elastographic techniques.
(a)
(b) (c)
Figure 29. MIE data acquisition. (a) Photograph of compression chamber, (b) transverse
CT slice of setup, and (c) liver-gel block under compression.

135
Table 22. Elasticity contrast ratios obtained by different material property analyses.
Elasticity contrast (gel:liver)
MGT Assay 4.23:1
MIE 4.09:1
The second preliminary elastographic evaluation of the MGT system was in the
form of ultrasound elastography. As previously mentioned, the gel-tissue heterogeneous
system was initially devised in order to provide a sample which was conducive to both
ultrasound evaluation and mechanical testing. To this avail, ultrasound images were
obtained of one of the gel-embedded fibrotic murine livers. A sample ultrasound image
is provided in Figure 30. The resultant strain image is shown in Figure 31. Using the
two regions of interest delineated in Figure 31, an average contrast ratio between the gel
and the liver was calculated as 2.71. Though the corresponding MGT assay evaluation of
the data is not available, this preliminary data set serves to further demonstrate the
feasibility of using the gel-embedded tissue system in elastographic techniques, which
can then be directly validated using the MGT assay.

136
Figure 30. B-mode ultrasound image of gel-liver interface.
Figure 31. Strain image of gel-liver interface.

137
Protection of Research Subjects and Societal Implications
In performing any research detailed in this manuscript, all necessary precautions
were taken to protect the animals involved. Mice were used frequently in the work
presented herein, and their use was always preceded by the appropriate protocol approved
by the Institutional Animal Care and Use Committee and following the guidelines for
humane care as set forth by the institution. Precautions were taken to minimize pain and
ensure quality of life, and the animals were closely monitored to ensure that they were
not suffering at any point during their use in the studies.
The utility of the MGT assay lies mainly in research regarding the correlation of
disease and tissue modulus. The assay can serve as a stand-alone soft tissue evaluation
technique, but it was conceived as a method for validating non-invasive imaging
techniques for modulus assessment, and that is most likely how it would find its use in a
broad spectrum. It is conceivable that the assay be used in other applications where an
evaluation of soft tissue mechanical properties is desired, such as a biopsy evaluation
method. However, these methods would be clinical or research-based and hence ethical
concerns would be expected to be minimal.

138
Appendix A: Polyacrylamide
Polyacrylamide gels are formed by the copolymerization of acrylamide monomers
and a bifunctional crosslinker, which is typically bisacrylamide (N,N‟-methylene-bis-
acrylamide). The resulting structure is a three-dimensional network of acrylamide
chains, crosslinked by the bisacrylamide. The reaction that produces polyacrylamide is a
vinyl addition polymerization initiated by a free radical-producing catalyst (Chramback
1985). The most common catalytic initiator is ammonium persulfate coupled with
tetramethylethlenediamine (TEMED). In the presence of TEMED, ammonium persulfate
produces free oxygen radicals at an accelerated rate. These free radicals then act as
catalysts for the polymerization reaction by converting acrylamide monomers to free
radicals. The newly formed acrylamide monomer free radicals then react with
unactivated monomers, beginning the polymerization reaction. The concentration of the
initiators affects both the rate of polymerization and the properties of the resulting gel; an
increase in the concentration of the initiators causes a decrease in the gel elasticity and
the average polymer chain length. The polyacylamide polymerization reaction is
depicted in Figure 32 [121].

139
Figure 32. Polyacrylamide gel polymerization reaction and resulting polyacylamide
matrix [121].

140
REFERENCES
1. Kim, J., et al., Virtual surgery simulation for medical training using multi-
resolution organ models. International Journal of Medical Robotics and Computer
Assisted Surgery, 2007. 3(2): p. 149-158.
2. Basdogan, C., et al., VR-based simulators for training in minimally invasive
surgery. Ieee Computer Graphics and Applications, 2007. 27(2): p. 54-66.
3. Delingette, H., Toward realistic soft-tissue modeling in medical simulation.
Proceedings of the Ieee, 1998. 86(3): p. 512-523.
4. Szekely, G., et al., Virtual reality-based simulation of endoscopic surgery.
Presence-Teleoperators and Virtual Environments, 2000. 9(3): p. 310-333.
5. Buckley, A., K.E. Hill, and J.M. Davidson, Collagen metabolism. Methods in
Enzymology, 1988(163): p. 674-694.
6. Samani, A., J. Zubovits, and D. Plewes, Elastic modulus of normal and
pathological human breast tissues: an inversion-technique-based investigation of
169 samples. Phys Med Biol, 2007. 52: p. 1565-1576.
7. Krouskop, T.A., et al., Elastic moduli of breast and prostate tissues under
compression. Ultrason Imaging, 1998. 20(4): p. 260-74.
8. Anderson, W., Synopsis of pathology. 1980, St. Louis: Mosby.
9. Levy, M., H. Bass, and R. Stren, Handbook of Elastic Properties of Solids,
Liquids, and Gases. 2001, San Diego: Academic Press.
10. Yeh, W.C., et al., Elastic modulus measurements of human liver and correlation
with pathology. Ultrasound Med Biol, 2002. 28(4): p. 467-74.
11. de Ledinghen, V., et al., Diagnosis of hepatic fibrosis and cirrhosis by transient
elastography in HIV/hepatitis C virus-coinfected patients. J Acquir Immune Defic
Syndr, 2006. 41(2): p. 175-9.
12. Ziol, M., et al., Noninvasive assessment of liver fibrosis by measurement of
stiffness in patients with chronic hepatitis C. Hepatology, 2005. 41(1): p. 48-54.
13. Tilleman, T.R., M.M. Tilleman, and M.H.A. Neumann, The elastic properties of
cancerous skin: poisson's ratio and young's modulus. Israel Medical Association
Journal, 2004. 6(12): p. 753-755.
14. Herrington, D.M., et al., Relationship Between Arterial Stiffness and Subclinical
Aortic Atherosclerosis. Circulation, 2004. 110(4): p. 432-437.
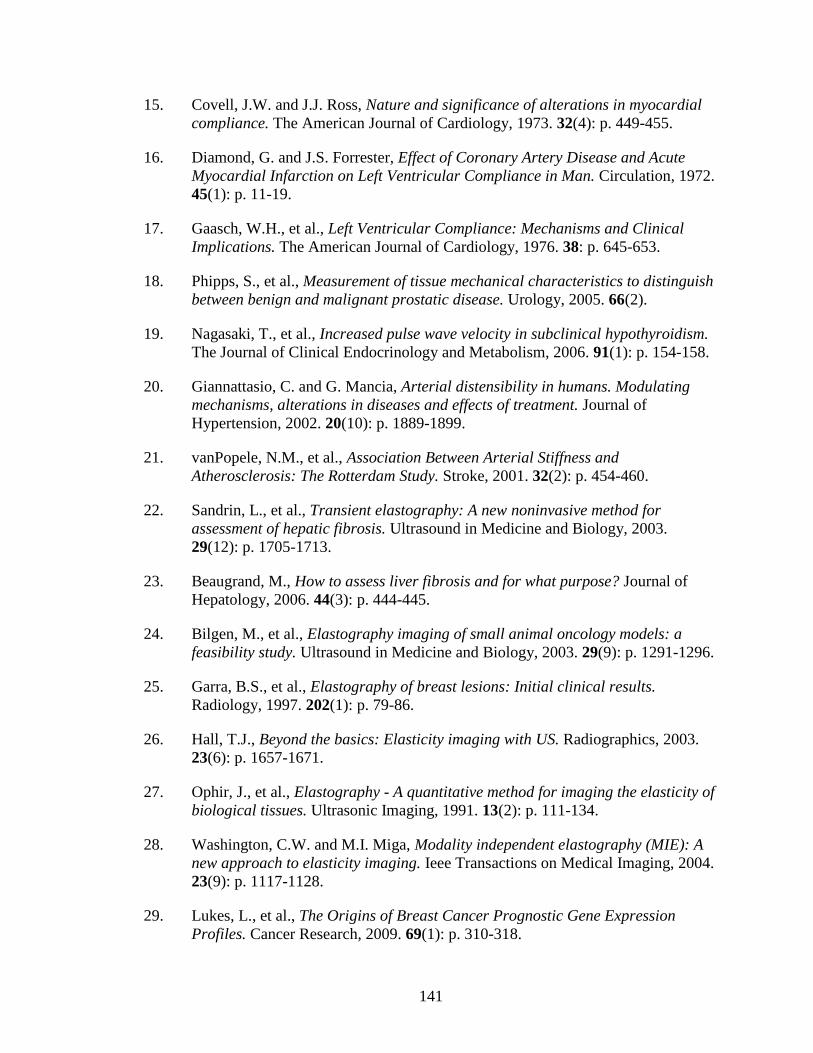
141
15. Covell, J.W. and J.J. Ross, Nature and significance of alterations in myocardial
compliance. The American Journal of Cardiology, 1973. 32(4): p. 449-455.
16. Diamond, G. and J.S. Forrester, Effect of Coronary Artery Disease and Acute
Myocardial Infarction on Left Ventricular Compliance in Man. Circulation, 1972.
45(1): p. 11-19.
17. Gaasch, W.H., et al., Left Ventricular Compliance: Mechanisms and Clinical
Implications. The American Journal of Cardiology, 1976. 38: p. 645-653.
18. Phipps, S., et al., Measurement of tissue mechanical characteristics to distinguish
between benign and malignant prostatic disease. Urology, 2005. 66(2).
19. Nagasaki, T., et al., Increased pulse wave velocity in subclinical hypothyroidism.
The Journal of Clinical Endocrinology and Metabolism, 2006. 91(1): p. 154-158.
20. Giannattasio, C. and G. Mancia, Arterial distensibility in humans. Modulating
mechanisms, alterations in diseases and effects of treatment. Journal of
Hypertension, 2002. 20(10): p. 1889-1899.
21. vanPopele, N.M., et al., Association Between Arterial Stiffness and
Atherosclerosis: The Rotterdam Study. Stroke, 2001. 32(2): p. 454-460.
22. Sandrin, L., et al., Transient elastography: A new noninvasive method for
assessment of hepatic fibrosis. Ultrasound in Medicine and Biology, 2003.
29(12): p. 1705-1713.
23. Beaugrand, M., How to assess liver fibrosis and for what purpose? Journal of
Hepatology, 2006. 44(3): p. 444-445.
24. Bilgen, M., et al., Elastography imaging of small animal oncology models: a
feasibility study. Ultrasound in Medicine and Biology, 2003. 29(9): p. 1291-1296.
25. Garra, B.S., et al., Elastography of breast lesions: Initial clinical results.
Radiology, 1997. 202(1): p. 79-86.
26. Hall, T.J., Beyond the basics: Elasticity imaging with US. Radiographics, 2003.
23(6): p. 1657-1671.
27. Ophir, J., et al., Elastography - A quantitative method for imaging the elasticity of
biological tissues. Ultrasonic Imaging, 1991. 13(2): p. 111-134.
28. Washington, C.W. and M.I. Miga, Modality independent elastography (MIE): A
new approach to elasticity imaging. Ieee Transactions on Medical Imaging, 2004.
23(9): p. 1117-1128.
29. Lukes, L., et al., The Origins of Breast Cancer Prognostic Gene Expression
Profiles. Cancer Research, 2009. 69(1): p. 310-318.

142
30. Paik, S., et al., A multigene assay to predict recurrence of tamoxifen-treated,
node-negative breast cancer. New England Journal of Medicine, 2004. 351(27):
p. 2817-2826.
31. Ramaswamy, S., et al., A molecular signature of metastasis in primary solid
tumors. Nature Genetics, 2003. 33(1): p. 49-54.
32. van de Vijver, M.J., et al., A gene-expression signature as a predictor of survival
in breast cancer. New England Journal of Medicine, 2002. 347(25): p. 1999-
2009.
33. Eckhardt, B.L., et al., Genomic analysis of a spontaneous model of breast cancer
metastasis to bone reveals a role for the extracellular matrix. Molecular Cancer
Research, 2005. 3(1): p. 1-13.
34. Stamenkovic, I., Matrix metalloproteinases in tumor invasion and metastasis.
Seminars in Cancer Biology, 2000. 10(6): p. 415-433.
35. Duffy, M.J., et al., Metalloproteinases: role in breast carcinogenesis, invasion
and metastasis. Breast Cancer Research, 2000. 2(4): p. 252-257.
36. Wang, W.G., et al., Single cell behavior in metastatic primary mammary tumors
correlated with gene expression patterns revealed by molecular profiling. Cancer
Research, 2002. 62(21): p. 6278-6288.
37. Somasundaram, R. and D. Schuppan, Type I, II, III, IV, V, and VI collagens serve
as extracellular ligands for the isoforms of platelet-derived growth factor (AA,
BB, and AB). Journal of Biological Chemistry, 1996. 271(43): p. 26884-26891.
38. Kuo, C.J., et al., Oligomerization-dependent regulation of motility and
morphogenesis by the collagen XVIII NC1/endostatin domain. Journal of Cell
Biology, 2001. 152(6): p. 1233-1246.
39. Daniels, K.J., et al., Expression of type VI collagen in uveal melanoma: Its role in
pattern formation and tumor progression. Laboratory Investigation, 1996. 75(1):
p. 55-66.
40. Colpaert, C., et al., The presence of a fibrotic focus is an independent predictor of
early metastasis in lymph node-negative breast cancer patients. American Journal
of Surgical Pathology, 2001. 25(12): p. 1557-1558.
41. Hasebe, T., et al., New prognostic histological parameter of invasive ductal
carcinoma of the breast: Clinicopathological significance of fibrotic focus.
Pathology International, 2000. 50(4): p. 263-272.
42. Chen, E.J., et al., Young's modulus measurements of soft tissues with application
to elasticity imaging. Ieee Transactions on Ultrasonics Ferroelectrics and
Frequency Control, 1996. 43(1): p. 191-194.

143
43. Hoyt, K., et al., Tissue elasticity properties as biomarkers for prostate cancer.
Cancer Biomarkers, 2008. 4(4-5): p. 213-225.
44. Kiss, M.Z., T. Varghese, and T.J. Hall, Viscoelastic characterization of in vitro
canine tissue. Physics in Medicine and Biology, 2004. 49(18): p. DOI
10.1088/0031-9155/49/18/002|PII S0031-9155(04)75297-5.
45. Kallel, F., et al., Elastographic imaging of low-contrast elastic modulus
distributions in tissue. Ultrasound in Medicine and Biology, 1998. 24(3): p. 409-
425.
46. Erkamp, R.Q., et al., Measuring the Elastic Modulus of Small Tissue Samples.
Ultrasonic Imaging, 1998. 20: p. 17-28.
47. Carter, F.J., et al., Measurements and modelling of the compliance of human and
porcine organs. Med Image Anal, 2001. 5(4): p. 231-6.
48. Samani, A., et al., Measuring the elastic modulus of ex vivo small tissue samples.
Phys Med Biol, 2003. 48: p. 2183-2198.
49. Samani, A. and D. Plewes, An inverse problem solution for measuring the elastic
modulus of intact ex vivo breast tissue tumours. Phys Med Biol, 2007. 52: p.
1247-1260.
50. Paszek, M. and V. Weaver, The tension mounts: mechanics meets morphogenesis
and malignancy. Journal of Mammary Gland Biology and Neoplasia, 2004. 9(4):
p. 325-342.
51. Butcher, D., T. Alliston, and V. Weaver, A tense situation: forcing tumour
progression. Nature Reviews Cancer, 2009. 9.
52. Levental, K., et al., Matrix crosslinking forces tumor progression by enhancing
integrin signaling. Cell, 2009. 139: p. 891-906.
53. Lo, C., et al., Cell movement is guided by the rigidity of the substrate. Biophysical
Journal, 2000. 79: p. 144-152.
54. Sullivan, J.M., G. Charron, and K.D. Paulsen, A three-dimensional mesh
generator for arbitrary multiple material domains. Finite Elements in Analysis
and Design, 1997. 25(3-4): p. 219-241.
55. Joachimowicz, N., C. Pichot, and J.P. Hugonin, Inverse scattering - an interative
numerical-method for electromagnetic imaging. Ieee Transactions on Antennas
and Propagation, 1991. 39(12): p. 1742-1752.
56. Wells, R.G., The role of matrix stiffness in hepatic stellate cell activation and
liver fibrosis. Journal of Clinical Gastroenterology, 2005. 39(4): p. S158-S161.

144
57. Yeh, W.C., et al., Elastic modulus measurements of human liver and correlation
with pathology. Ultrasound in Medicine and Biology, 2002. 28(4): p. 467-474.
58. Sandrin, L., et al., Transient elastography: A new noninvasive method for
assessment of hepatic fibrosis. Ultrasound in Medicine and Biology, 2003.
29(12): p. 1705-1713.
59. Gomez-Dominguez, E., et al., Transient elastography: a valid alternative to
biopsy in patients with chronic liver disease. Alimentary Pharmacology &
Therapeutics, 2006. 24(3): p. 513-518.
60. Klatt, D., et al., In vivo determination of hepatic stiffness using steady-state free
precession magnetic resonance elastography. Investigative Radiology, 2006.
41(12): p. 841-848.
61. Kruse, S.A., et al., Tissue characterization using magnetic resonance
elastography: preliminary results. Physics in Medicine and Biology, 2000. 45(6):
p. 1579-1590.
62. Bamber, J.C., et al., Quantitative-Evaluation of Real-Time Ultrasound Features of
the Breast. Ultrasound in Medicine and Biology, 1988. 14: p. 81-87.
63. Cespedes, I. and J. Ophir, Reduction of Image Noise in Elastography. Ultrasonic
Imaging, 1993. 15(2): p. 89-102.
64. Nightingale, K.R., et al., A finite element model of remote palpation of breast
lesions using radiation force: Factors affecting tissue displacement. Ultrasonic
Imaging, 2000. 22(1): p. 35-54.
65. Steinberg, B.D., D.C. Sullivan, and D.L. Carlson, Disparity mapping applied to
sonography of the breast: Technical note. Radiology, 1998. 207(2): p. 545-550.
66. Sumi, C., K. Nakayama, and M. Kubota, An effective ultrasonic strain
measurement-based shear modulus reconstruction technique for superficial
tissues - demonstration on in vitro pork ribs and in vivo human breast tissues.
Physics in Medicine and Biology, 2000. 45(6): p. 1511-1520.
67. Lorenz, A., et al., Ultrasound elastography of the prostate: An innovative
technique for tumour-detection. Ultraschall in Der Medizin, 2000. 21(1): p. 8-15.
68. Kallel, F., et al., Elastographic imaging of the normal canine prostate in vitro.
Ultrasonic Imaging, 1999. 21(3): p. 201-215.
69. Lyshchik, A., et al., Thyroid gland tumor diagnosis at US elastography.
Radiology, 2005. 237(1): p. 202-211.

145
70. de Korte, C.L., et al., Characterization of plaque components and vulnerability
with intravascular ultrasound elastography. Physics in Medicine and Biology,
2000. 45(6): p. 1465-1475.
71. Bom, N., et al., Quantification of plaque volume, shear stress on the endothelium,
and mechanical properties of the arterial wall with intravascular ultrasound
imaging. Zeitschrift Fur Kardiologie, 2000. 89: p. 105-111.
72. Cao, L., et al., Compressive properties of mouse articular cartilage determined in
a novel micro-indentation test method and biphasic finite element model. J
Biomech Eng, 2006. 128(5): p. 766-71.
73. Delalleau, A., et al., Characterization of the mechanical properties of skin by
inverse analysis combined with the indentation test. Journal of Biomechanics,
2006. 39: p. 1603-1610.
74. Klaesner, J.W., et al., Accuracy and reliability testing of a portable soft tissue
indentor. IEEE Trans Neural Syst Rehabil Eng, 2001. 9(2): p. 232-40.
75. Ishak, K., et al., Histological grading and staging of chronic hepatitis. Journal of
Hepatology, 1995. 22: p. 696-699.
76. Stevanovic, M., M. Yovanovich, and J.R. Culham, Modeling contact between
rigid sphere and elastic layer bonded to rigid substrate. IEEE Trans on
Components and Package Technologies, 2001. 24(2): p. 207-212.
77. Chen, W.T. and P.A. Engel, Impact and contact stress analysis in multilayer
media. International Journal of Solids and Structures, 1972. 8: p. 1257-1281.
78. Cash, D.M., et al., Image-guided liver surgery: Concepts and initial clinical
experiences. Journal of Gastrointestinal Surgery, 2006. (in press).
79. Cash, D.M., et al., Compensating for intraoperative soft-tissue deformations using
incomplete surface data and finite elements. Ieee Transactions on Medical
Imaging, 2005. 24(11): p. 1479-1491.
80. Miga, M.I., et al., In vivo quantification of a homogeneous brain deformation
model for updating preoperative images during surgery. IEEE Transactions on
Biomedical Engineering, 2000. 47(2): p. 266-273.
81. Miga, M.I., et al., Model-updated image guidance: Initial clinical experiences
with gravity-induced brain deformation. IEEE Transactions on Medical Imaging,
1999. 18(10): p. 866-874.
82. Bramley, R. and X. Wang. SPLIB: A library of iterative methods for sparse linear
system. [Technical Report] 1995.

146
83. Sheskin, D.J., Handbook of Parametric and Nonparametric Statistical Procedure.
2nd ed. 2000, New York: Chapman & Hall/CRC.
84. Wang, B., et al., An experimental study on biomechanical properties of hepatic
tissue using a new measuring method Biomed Mat Eng, 1992. 2(3): p. 133-138.
85. Miga, M.I., et al., Model-updated image guidance: Initial clinical experiences
with gravity-induced brain deformation. IEEE Transactions on Medical Imaging,
1999. 18: p. 866-874.
86. Sinkus, R., et al., Potential of MRI and ultrasound radiation force in
elastography: applications to diagnosis and therapy. Proceeding of the IEEE,
2008. 96: p. 490-499.
87. Souchon, R., et al., Visualization of HIFU lesions using elastography of the
human prostate in vivo: preliminary results. Ultrasound in Medicine and Biology,
2003. 29(7): p. 1007-1015.
88. Garra, B.S., et al., Elastography of breast lesions: intial clinical results.
Radiology, 1997. 202(1): p. 79-86.
89. Venkatesh, S.K., et al., MR elastography of liver tumors: preliminary results.
American Journal of Roentgenology, 2008. 190(6): p. 1534-1540.
90. Fahey, B.J., et al., In vivo visualization of abdominal malignancies with acoustic
radiation force elastography. Physics in Medicine & Biology, 2008. 53: p. 279-
293.
91. Muthupillai, R., et al., Magnetic-resonance elastography by direct visualization of
propagating acoustic strain waves. Science, 1995. 269: p. 1854-1857.
92. Provenzano, P.P., et al., Collagen density promotes mammary tumor initiation
and progression. BMC Medicine, 2008. 6(11).
93. Naylor, C., The rational clinical examination: physical examination of the liver.
Journal of the American Medical Association, 1994. 271(23): p. 1859-1865.
94. Mahoney, L. and A. Csima, Efficiency of palpation in clinical detection of breast
cancer. Canadian Medical Association Journal, 1982. 127(8): p. 729-730.
95. Ghany, M. and E. Doo, Assessment of liver fibrosis: palpate, poke, or pulse?
Hepatology, 2005. 42(4): p. 759-761.
96. McCormick, P. and N. Nolan, Palpable epigastric liver as a physical sign of
cirrhosis: a prospective study. European Journal of Gastroenterology &
Hepatology, 2004. 16(12): p. 1331-1334.

147
97. Delos, D., et al., The effects of RANKL inhibition on fracture healing and bone
strength in a mouse model of osteogenesis imperfecta. Journal of Orthopaedic
Research, 2008. 26: p. 153-164.
98. Shefelbine, S.J., et al., Prediction of fracture callus mechanical properties using
micro-CT images and voxel-based finite element analysis. Bone, 2005. 36: p. 480-
488.
99. Huddleston, P.M., et al., Ciprofloxacin Inhibition of Experimental Fracture-
Healing. The Journal of Bone & Joint Surgery, 2000. 82: p. 161-173.
100. Campos, A.C., A.K. Groth, and A.B. Branco, Assessment and nutritional aspects
of wound healing. Current Opinion in Clinical Nutrition & Metabolic Care, 2008.
11(3): p. 281-288.
101. Gal, P., et al., Early changes in the tensile strength and morphology of primary
sutured skin wounds in rats. Folia Biologica, 2006. 52(4): p. 109-115.
102. Barnes, S.L., et al., Development of a mechanical testing assay for fibrotic murine
liver. Medical Physics, 2007. 34(11): p. 4439-4450.
103. Hines, W.W. and D.C. Montgomery, Probability and Statistics in Engineering
and Management Science. Third ed. 1990, New York: John Wiley & Sons, Inc.
104. Montgomery, D.C. and G.C. Runger, Applied Statistics and Probability for
Engineers. 2003, New York: John Wiley & Sons, Inc.
105. Group, U.S.C.S.W. United States Cancer Statistics: 1999-2006 Incidence and
Mortality Web-based Report. 2010; Available from: http://www.cdc.gov/uscs.
<http://apps.nccd.cdc.gov/uscs/>.
106. Slamon, D., et al., Studies of the HER-2/neu Proto-oncogene in Human Breast
and Ovarian Cancer. Science, 1989. 244(4905): p. 707-712.
107. Yarden, Y. and M.X. Sliwkowski, Untangling the ErbB signaling network. Nature
Reviews Molecular Cell Biology, 2001. 2(2): p. 127-137.
108. Chang, H.R., Trastuzumab-based neoadjuvant therapy in patients with HER2-
positive breast cancer. Cancer, 2010. 116(12): p. 2856–2867.
109. Cho, H.S., M. K., and K.X. Ramyar, Structure of the extracellular region of
HER2 alone and in complex with the herceptin fab. Nature, 2003. 421: p. 756-60.
110. Angus, D.B., R.W. Akita, and W.D. Fox, Targeting ligand activated ErbB2
signaling inhibits breast and prostate tumor growth. Cancer Cell, 2002. 2: p. 127-
137.

148
111. Lu, Y., et al., Insulin-like growth factor-I receptor signaling and resistance to
trastuzumab (herceptin). Journal of the National Cancer Institute, 2001. 93: p.
1852-1857.
112. Nahta, R., et al., Insulin-like growth factor-I receptor/human epidermal growth
factor receptor 2 heterodimerization contributes to trastuzumab resistance of
breast cancer cells. Cancer Research, 2005. 65: p. 11118-11128.
113. Jerome, L., N. Alami, and S. Belanger, Recombinant human insulin-like growth
factor binding protein 3 inhibits growth of human epidermal grwoth factor
receptor-2-overexpressing breast tumors and potentiates herceptin activity in
vivo. Cancer Research, 2006. 66: p. 7245-7252.
114. Isakoff, S.J., E. J.A., and H.Y. Irie, Breast cancer-associated PIK3CA mutatoins
are oncogenic in mammary epithelial cells. Cancer Research, 2005. 65(10992-
11000).
115. Berns, K., H.M. Horlings, and B.T. Hennessy, A functional genetic approach
identifies the PI3K pathway as a major determinant of trastuzumab resistance in
breast cancer. Cancer Cell, 2007. 12: p. 395-402.
116. Nagata, Y., K.H. Lan, and X. Zhou, PTEN activation contributes to tumor
inhibition by trastuzumab, and loss of PTEN predicts trastuzumab resistance in
patients. Cancer Cell, 2004. 6(117-127).
117. Sandrin, L., et al., Transient elastography: a new noninvasive method for
assessment of hepatic fibrosis. Ultrasound Med Biol, 2003. 29(12): p. 1705-13.
118. Ritter, C.A., et al., Human breast cancer cells selected for resistance to
trastuzumab in vivo overexpress epidermal growth factor receptor and ErbB
Ligands and remain dependent on the ErbB receptor network. Clinical Cancer
Research, 2007. 13(16): p. 4909-4919.
119. Barnes, S., P. Young, and M. Miga, A novel model-gel-tissue assay analysis for
comparing tumor elastic properties to collagen content. Biomechanics and
Modeling in Mechanobiology, 2009. 8(4): p. 337-343.
120. Ou, J., Development of modality-independent elastography as a method of breast
cancer detection, in Biomedical Engineering. 2007, Vanderbilt University:
Nashville. p. 165.
121. The Polyacrylamide Matrix. 2010; Available from:
http://www.nationaldiagnostics.com/article_info.php/articles_id/6.