evaluating!the!effects!of!certificationon!smallholders ......! i!...
TRANSCRIPT
i
Evaluating the Effects of Certification on Smallholders’ Net Incomes, with a Focus on Cacao Farmers in Cooperatives in Côte d’Ivoire
By
MELISSA ANNE SCHWEISGUTH
M.S. (University of California, Davis) B.S. (University of Delaware)
THESIS
Submitted in partial satisfaction of the requirements for the degree of
MASTER OF SCIENCE
in
International Agricultural Development
in the
OFFICE OF GRADUATE STUDIES
of the
UNIVERSITY OF CALIFORNIA
DAVIS
Approved:
__________________________________________________________________
Richard Sexton, Chair
___________________________________________________________________
James Chalfant
____________________________________________________________________
Lovell Jarvis
Committee in Charge
2015
ii
Melissa Anne Schweisguth March 2015
International Agricultural Development
Evaluating the Effects of Certification on Smallholders’ Net Incomes, with a Focus on Cacao Farmers in Cooperatives in Côte d’Ivoire
Abstract
This thesis evaluates the direct effects of the Fairtrade International (Fairtrade), Rainforest Alliance (RA) and
UTZ Certified (UTZ) certifications on smallholders’ net incomes (profit), using three modes of inquiry: a
theoretical evaluation of each certifier’s standards and activities, a literature review, and econometric
analyses of primary data from cacao producers in Côte d’Ivoire. It seeks to inform efforts to scale up these
certifications, particularly in the West African cacao sector, the primary source of mass-‐market cacao, and
ensure that certification benefits producers.
In recent years, commodity certifications such as Fairtrade, RA and UTZ have shown robust growth
in the agricultural sector, and cacao in particular. Certifiers, brand owners and others have asserted that
certification improves farm-‐level profit, via factors such as higher prices, and better farm management that
increases yield and reduces expenditure. However, little independent research has explored such claims,
particularly for cacao. This thesis seeks to fill gaps in understanding using a comprehensive, rigorous
approach, including regressions using primary data from certified and non-‐certified Ivorian cacao farmers.
The theoretical evaluation, literature review and analyses of primary data indicate that certified
producers’ profits may be higher than, lower than or equal to non-‐certified farmers, depending on the
context. Certification seems to impact profit largely by enabling farmers to command premiums for certified
sales, which increase average farm gate price for total output sold. Such price increases may be small, as with
the Ivorian sample. The theoretical evaluation and literature review indicate that certification is associated
with varied outcomes for yield and expenditures. Regressions using the primary data show that certification
has a strong effect in reducing expenditures, while its effect on yield ranges from negative to positive.
If certifiers and their partners wish to improve certified producers’ profits, they can take numerous
steps to address factors that affect farmers’ average prices, yields and expenditures, and certification costs. In
some cases, this will require broadening the scope of certification training, standards, producer services, or
implementation partners to address development constraints that lie beyond the scope of certifiers’ current
requirements, activities and capabilities.
iii
Table of Contents, Tables and Figures
Abstract ……………………………………….………………………………………………………….……………………………ii Acknowledgments …………………………………………………………………………………….…………………..………v Acronyms and Abbreviations…………………………………………………………………….…………………………vii
Chapter 1. Introduction ...................................................................................................................... 1
Chapter 2. Certification and its Potential Effects on Smallholders’ Net Incomes ........... 5 2.1 Certification Scope ................................................................................................................................... 5 2.2 Certification Standards and Processes for Smallholder Groups .............................................. 8 2.3 Theoretical Effects: Pricing, Output and Expenditures ............................................................. 11 2.3.1 Theoretical Effects: Pricing ............................................................................................................................ 11 2.3.2 Theoretical Effects: Output Produced and Sold as Certified ........................................................... 16 2.3.3 Theoretical Effects: Costs and Expenditures ......................................................................................... 19
2.4 Conclusion ................................................................................................................................................ 22 Chapter 3. Literature Review ......................................................................................................... 24 3.1 Literature Scope ..................................................................................................................................... 24 3.2 Design and Methods .............................................................................................................................. 26 3.3 Findings From Prior Research ........................................................................................................... 30 3.4 Conclusion ................................................................................................................................................ 34
Chapter 4. Côte d’Ivoire and the Cacao Sector .......................................................................... 36 4.1 Côte d’Ivoire ............................................................................................................................................. 36 4.2 Cacao Value Chain ................................................................................................................................. 37 4.3 Cacao Production and Processing .................................................................................................... 38 4.4 Cacao Price Determination ................................................................................................................. 40 4.5 Market Power .......................................................................................................................................... 41 4.6 Supply and Demand .............................................................................................................................. 42 4.7 Production Constraints ........................................................................................................................ 44 4.8 Cacao Development Projects .............................................................................................................. 45 4.9 Conclusion ................................................................................................................................................ 48
Chapter 5. Field Research ................................................................................................................ 49 5.1 Design and Sample ................................................................................................................................. 49 5.2 Data Collection and Survey Instruments ....................................................................................... 52 5.3 Data Analyses .......................................................................................................................................... 53 5.3.1 Differences in Means, and Certification Effects on Price .................................................................. 53 5.3.2 Yield and Variable Cash Expenditure Regressions .............................................................................. 54
5.4 Results ....................................................................................................................................................... 56 5.4.1 Differences in Means, and Certification Effects on Price .................................................................. 58 5.4.2 Yield Regressions ............................................................................................................................................... 64 5.4.3: Variable Expenditure Regressions ............................................................................................................ 69
5.5 Conclusion ................................................................................................................................................ 72 Chapter 6. Conclusions ..................................................................................................................... 74 6.1 Effects and Limits of Certification .................................................................................................... 74 6.2 Recommendations for Improving Certification Outcomes ...................................................... 77
References ........................................................................................................................................................... 80 Appendix A: Survey Instruments ................................................................................................................. 88
A1. Producer Survey .................................................................................................................................................... 88 A2. Co-‐op Management Interview: Certified Co-‐ops ..................................................................................... 96
iv
A3. Co-‐op Management Interview: Non-‐Certified Co-‐ops ........................................................................... 98 Appendix B: Additional Data ......................................................................................................................... 99 Tables Table 2.1: Certifications: Key Attributes for Cacao ..................................................................................................... 8 Table 2.2: Possible Effects of Certification on Producer Prices .......................................................................... 11 Table 2.3: Possible Effects of Certification on Output and Certified Sales Volume .................................... 16 Table 2.4: Possible Effects of Certification on Producer Costs and Expenditures ...................................... 19 Table 3.1: Literature Reviewed ........................................................................................................................................ 25 Table 3.2: Certification Literature Scope ...................................................................................................................... 26 Table 3.3: Study Design and Methods ............................................................................................................................ 27 Table 3.4: Findings on Relationships Between Certification, and Net Income and Its Components d 31 Table 4.1: Côte d’Ivoire Country Statistics, 2012 ...................................................................................................... 37 Table 5.1: Sample Distribution ......................................................................................................................................... 50 Table 5.2: Producer Summary Statistics, Full Sample, 2012-‐13 Cacao Season ........................................... 57 Table 5.3: Differences in Means Between Certified Farmers and Controls, Regression Variables and
Economic Outcomes, 2012-‐13 Cacao Season .................................................................................................... 59 Table 5.4: Differences in Means Between Certified Farmers and Controls By Certification Type,
Economic Outcomes, 2012-‐13 Cacao Season .................................................................................................... 60 Table 5.5: Summary Statistics for Certified and Control Co-‐ops, 2012-‐13 Cacao Season ....................... 61 Table 5.6: Yield Regression Models ................................................................................................................................ 65 Table 5.7: Total Intercept Shift for Certification Dummies, Yield Regressions ........................................... 66 Table 5.8: Estimated Total Effect of Certification on Yield, Total Intercept Shift, and Difference in
Means ................................................................................................................................................................................. 67 Table 5.9: Variable Cash Expenditure Regression Models .................................................................................... 69 Table 5.10: Total Intercept Shift for Certification Dummies, Expenditure .................................................... 70 Table 5.11: Estimated Total Effect of Certification on Expenditure, All Models ......................................... 70
Table B1: Summary Statistics, Certified Producers & Controls, 2012-‐13 Cacao Season ......................... 99 Table B2: Means For Certified Farmers and Controls By Region, Agronomic Inputs and Economic Outcomes .................................................................................................................................................................................. 101 Table B3: Differences in Means Between Certified Farmers and Controls, 2012-‐13 Season ............. 103 Table B4: Means For Certified Farmers and Controls By Certification Type .............................................. 105 Table B5: Significant Differences Between Certified Farmers and Controls By Certification Type, Economic Outcomes and Agronomic Inputs ............................................................................................................. 107 Figures Figure 2.4: Demand Curves for Differentiated (Certified) and Conventional Goods ................................ 12 Figure 2.5: Fairtrade Cacao Price with Premium, and World Price, 1993 to 2014 ................................... 15 Figure 4.1: Cacao Value Chain for Côte d’Ivoire Smallholders ............................................................................ 38 Figure 4.2: World Cacao Prices, Yearly Average, 1993 to 2014 ......................................................................... 41 Figure 4.3: Global Cacao Production and Grindings, 2005 to 2014 .................................................................. 43 Figure 5.1 Research Sites .................................................................................................................................................... 51
v
Acknowledgments Many individuals contributed to this thesis, and to them I am indebted. I extend my deepest
gratitude to Rich Sexton, my thesis chair. He offered extensive, invaluable and multi-‐faceted support
in all phases of this work, from ideation through completion. Despite his many commitments, he
was extremely generous in sharing his time to review and discuss multiple iterations of funding
proposals, survey instruments, data analyses and thesis chapters; and also contributed funding for
fieldwork. Rich provided thorough, thoughtful, laser-‐sharp and candid feedback, and set high
standards, driving me to think more deeply and improve my work. He also offered moral support
and inspiration just when I needed it, and was patient through my learning process. I could not
have asked for a better chair.
I also thank my other committee members, Jim Chalfant and Tu Jarvis, for giving their time
to review and advise on multiple rounds of data analyses, and provide incredibly helpful,
comprehensive comments on draft chapters. Jim is a fantastic econometrician, and his input greatly
advanced the regression analyses in particular. Tu is a seasoned developmental economist whose
insightful exchanges helped me evaluate and articulate many concepts much better. He also
suggested alternate yield regression models to explore regional effects. Along with Rich, they were
an exceptional team.
Much appreciation goes to the World Agroforestry Center (ICRAF) in Côte d’Ivoire,
particularly Christophe Kouame, Amos Gyau, Yao Eric, Colombe Loba and Jean-‐Noël. ICRAF hosted
me as a research fellow and I simply could not have done my fieldwork without them. Christophe
and Amos helped refine the design and survey instruments, and championed the work throughout
my time in country. Yao Eric, Colombe and Jean-‐Noël helped with logistics, playing key roles to keep
things moving under a tight schedule. ICRAF also contributed significant in-‐kind support, including
a field coordinator, transportation, and surveyors for one region, greatly improving the smoothness
and success of fieldwork.

vi
The field research team deserves special commendation for their tremendous work. Niava
Landry, the field coordinator, has extensive expertise in cacao surveys, and was an incredible asset
in budgeting, scheduling surveys and managing the enumerators. The enumerators, Abié Cynthia
Elodie, Aka Mel Roland, Anzan Komenan Yaya, Assetou Zitkoum, Kouassi Sainte Sebastienne Aya
and Niava Eric, are well-‐experienced and terrific to work with. I am extremely grateful to have had
such a trustworthy, skilled team. They maintained a positive attitude and delivered high-‐quality
work through the rigors of fieldwork.
Additionally, I thank the representatives of certifiers and industry members who took time
out of their busy schedules for interviews, providing essential background on certification and the
dynamic, complex context in which it operates. IAD alumna Kaity Smoot was a vital source of
information as I was formulating my thesis, and connected me to ICRAF, helping me obtain the
research fellowship. Despite being based in Côte ‘Ivoire, and facing sizeable research and work
commitments, Kaity was always quick to provide detailed information. Having such a
knowledgeable on-‐the-‐ground informant was invaluable.
The University of California, Davis provided funding for fieldwork via a Jastro Research
Grant. Without this grant, the fieldwork would have been cost prohibitive. Thanks to Theresa Costa
and Mary Lieth for facilitating the funding process. Thanks and hugs to family and friends who
encouraged me along the way; and to my parents for cultivating a dedication to education, curiosity,
critical inquiry, hard work and a job well done.
Last but not least, a deep merci to the farmers and co-‐op representatives who took time
away from their farms and work to participate in surveys and interviews, and for the hard work
they do in order to provide the world with cacao. They welcomed the research team into their
offices, villages and farms, patiently answered many questions, and provided meals on occasion. I
hope to be able to repay their generosity through work that fosters lasting livelihoods
improvements for cacao smallholders, which was the motivation for this thesis.

vii
Acronyms and Abbreviations
ANADER Ivorian national agricultural extension
CCC Le Conseil du Café-‐Cacao (Côte d’Ivoire coffee and cocoa board)
COSA Committee on Sustainability Assessment
Fairtrade Fairtrade International certification
FLO Fairtrade International, Fairtrade-‐only certification
FTO Fairtrade and Organic dual certified
HDI Human Development Index
ICCO International Cocoa Organization
ICRAF World Agroforestry Center
IDH IDH, The Sustainable Trade Initiative
IITA International Institute of Tropical Agriculture
IPM Integrated Pest Management
PSM Propensity Score Matching
SAN Sustainable Agriculture Network
SPO Small Producer Organization (in Fairtrade)
STCP Sustainable Tree Crops Program
RA Rainforest Alliance
TCC Tropical Commodity Coalition
UN United Nations
UNDP United Nations Development Program
UTZ UTZ Certified

1
Chapter 1. Introduction
This thesis evaluates the direct effects of the Fairtrade International (Fairtrade), Rainforest Alliance
(RA) and UTZ Certified (UTZ) certifications on smallholders’ net incomes (profit). It considers this
question using three methods: a theoretical evaluation of each certifier’s standards and activities, a
literature review, and econometric analyses of primary data from cacao producers in Côte d’Ivoire.
It aims to inform efforts to scale up these certifications, particularly in the West African cacao
sector, the primary source of mass-‐market cacao, and ensure that certification benefits producers.
This thesis does not seek to analyze the economic impacts of certification that result from producer
group management training, premium investments at the producer group and community levels, or
farm management practices that protect and restore natural resources. As such, it does not evaluate
the indirect effects that farmers may realize, or total welfare more broadly.
In recent years, sustainable commodity certifications such as Fairtrade, RA and UTZ have
shown robust growth in the agricultural sector, and cacao in particular (Potts et al. 2014). Such
labels have moved from the niche to the mainstream and appear to be on a continued growth
trajectory in cacao, as major chocolate companies such as The Hershey Company, Mars and Ferrero
Rocher have committed to sourcing 100% certified sustainable cacao (Tropical Commodity
Coalition 2012). As of 2013, UTZ (2014a) estimated that 22 percent of global cacao supply bore at
least one such certification.
Certifiers, brand owners and others have asserted that certification helps improve
producers’ profits via factors such as higher prices, better agricultural practices that boost yield,
and more efficient farm management that reduces expenditure. However, little independent
research has explored these claims, particularly with respect to cacao. Moreover there is no single
international third-‐party agency that oversees certifiers, who have developed their standards and
gained credibility by engaging various civil society, industry, consumer and government

2
stakeholders. Given that certification involves added costs for producers and buyers, and often
consumers, and that entities across the value chain invest in certification efforts on the basis of its
purported benefits, it is imperative to undertake a careful, independent evaluation of how cacao
certification affects farmers’ net incomes.
To fill this gap, this thesis evaluates the effects of the Fairtrade, RA and UTZ certifications
(“target certifications”) on producers’ net incomes, on a broad level, and with specific reference to
Ivorian cacao farmers in cooperatives, by:1
• Undertaking a theoretical evaluation of how certifiers’ standards and producer engagement
activities could affect net income (profit) and its components: output, price and expenditures
• Synthesizing empirical research that has focused on how certification modulates net income
and its components among smallholders, across diverse crops and countries
• Comparing farm-‐level outcomes for net income and its components, across certified and non-‐
certified cacao producers in Côte d’Ivoire, to determine whether certification is associated with
improved outcomes
• Comparing performance across certified and non-‐certified Ivorian cacao farmers in factors that
may affect net income and its components (e.g., input use, farm management practices), to
understand how groups differ for such explanatory variables
• Using regressions to determine how certification and other factors contribute to differences in
yield and expenditures among Ivorian cacao farmers, while controlling for selection bias related
to certification
This thesis uses Cote d'Ivoire as a case study because it is the world's number one cacao
producer, providing about 36% of the world's supply (ICCO 2014b), and has seen a steady increase
in cacao certification. The country has about 900,000 cacao farms, predominantly smallholdings
1 Fair Trade USA, an independent Fair Trade certifier, was a member of FLO through 12/31/11 then became independent. It is not included here because it was still using FLO’s standards and had not certified any new producers in Côte d’Ivoire when fieldwork was completed.
3
averaging 3 hectares (ICCO undated). Cacao is the main source of income for about 75 percent of
the rural population and provides employment for over four million people (Hatløy et. al 2012).
Approximately 43 percent of the population lives below the poverty line. Given the significance of
cacao for rural welfare, and the extent of poverty, there is value in evaluating the effects of
certification on cacao farmers’ net incomes.
The target certifications could affect producers’ prices, output produced and sold as
certified, and expenditures in different ways, making it difficult to predict the direction or
magnitude of net income effects. For most commodities, Fairtrade has mandatory minimum prices
that include above-‐market premiums (Fairtrade International 2011b). In the absence of price
guarantees, certified commodities are differentiated goods that can command a premium when the
market places added value on their attributes. The target certifications require crop management
practices that can improve yields, such as soil fertility management, but also mandate ecosystem
conservation measures that could reduce planted area (e.g., buffers for pesticide application and
riparian areas), and thus total output.
On the expenditure side, certification involves expenses for audits, management systems
and record keeping at the group level, while individual producers may need to increase farm-‐level
spending and/or family labor time to comply with certification requirements (e.g., more labor for
pruning). However, producers also may realize expenditure reductions through more efficient farm
management (e.g., pesticide application) as a result of certification training. This thesis explores
how certification modulates each component of net income separately, enabling more informed
predictions about its net effects.
This research is novel in undertaking an independent evaluation of how different
certifications affect net income and its components, combining a theoretical evaluation, a broad-‐
based literature review, and econometric analyses of primary data from certified farmers and
comparable controls. Much of the initial field research in this area was initiated by certifiers,
4
focused on gross revenue or prices rather than cost-‐benefit measures such as net income, and often
lacked controls (see Arnould et. al. 2009, CEval 2012). Independent studies with controls have since
increased, generally utilizing basic statistical methods such as ANOVAS and t-‐tests to compare
price, yield, revenue and net income across certified and non-‐certified producers (Valkila and
Nygren 2008, Giovannucci and Potts 2010, Ruben and Zúñiga 2011).
A few studies have used higher-‐level statistical approaches to control for selection bias, and
quantify the effects of certification and other attributes on net income, in order to attain more valid
conclusions. Such methods include propensity score matching (Ruben and Fort 2012) and two-‐
stage regressions using the Heckman correction (Becchetti and Costantino 2008). Overall, prior
work has found that certified producers’ relative outcomes vary within and across certifications,
crops and regions, indicating the need for further inquiry. Finally, most research has focused on
Fairtrade coffee in the Latin American specialty sector (Chan and Pound 2009). This thesis fills gaps
in geographic, crop and market coverage by assessing the Fairtrade, RA and UTZ certifications in
the mainstream cacao sector in Côte d'Ivoire. It uses regressions to estimate the effects of
certification and other variables on yield and expenditure, while controlling for selection bias.
Chapter 2 introduces the target certifications and undertakes a broad theoretical evaluation
of their potential effects on the components of smallholders’ net incomes, irrespective of crop or
region. Chapter 3 presents a review of relevant literature, characterizing the scope, methodologies,
findings, strengths and limitations of prior research, and implications for further studies. Chapter 4
offers background on cacao production and trade with a focus on Côte d’Ivoire, providing a solid
grounding in the fieldwork context. Chapter 5 presents the results of fieldwork in Côte d’Ivoire.
Chapter 6 summarizes conclusions across each mode of inquiry, and offers recommendations for
ways that certifiers and others can improve economic outcomes among certified farmers.

5
Chapter 2. Certification and its Potential Effects on Smallholders’ Net Incomes
The analysis of the effects of certification on smallholders’ net incomes begins with a comparison of
their scopes, standards and certification processes; and a theoretical evaluation of their potential
impacts for all applicable commodities and regions, with cacao used as an illustrative example. This
discussion focuses on smallholders who are organized in groups because they predominate in cacao
and were the focus of my fieldwork. Section 2.1 outlines each certification’s scope, and identifies
ways in which they overlap and differ. Section 2.2 presents a broad view of each certification’s
requirements and the processes that producers face to become certified, providing background for
a discussion of specific criteria. Section 2.3 identifies specific certification requirements and
certifier activities (e.g., training) that could affect the components of net income: farm gate price,
output produced and sold as certified, and farm-‐level expenditures, and discusses possible effects.
As a point of clarification, for cacao, this thesis defines smallholders as family farms that
rely primarily on family labor. Additionally, the terms producers and farmers refer to individual
smallholders, while producer group refers to a collective marketing entity that sells members’
aggregated production, such as a cooperative, association or contract production scheme. The
terms yield and productivity are used interchangeably, and denote crop volume per land unit, while
output refers to a farm’s total production.
2.1 Certification Scope
Fairtrade International (FLO) is focused on improving producer livelihoods, with a mission “to
connect disadvantaged producers and consumers, promote fairer trading conditions; and empower
producers to combat poverty, strengthen their position and take more control over their lives” (FLO
2011b). Following from its mission, its theory of change asserts that its floor prices, premiums,
required pre-‐financing from buyers, group governance criteria, and efforts to increase Fairtrade
market access and demand, are the means by which it improves farmers’ incomes (FLO 2013c).
6
The Fairtrade label (Figure 2.1) applies to multiple commodities
including bananas, cacao, coffee, cotton, fruit, fruit juices, honey, sugar,
vegetables, gold, and sports balls (FLO 2011a). Democratically run
smallholder groups, contract production schemes and hired labor
operations can become “certified producer organizations,” with
certification limited to smallholder groups for cacao, coffee, sugar
and tea.2 FLO supports producers with credit via its “Fair Trade Access Fund,” and provides
technical assistance through its regional producer networks (FLO 2014b).
According to FLO’s 2013-‐14 Annual Report, Fairtrade certification involves 1,210 certified
producer organizations that represent over 1,400,000 farmers and workers in 74 countries (FLO
2014b). Fairtrade certified its first cacao producer group in Côte d’Ivoire in 2004 (Fair Trade USA
2010). As of 2012, Fairtrade cacao production involved 166,900 farmers from 122 producer groups
in 19 countries, with 52 groups in Côte d’Ivoire (FLO 2013a). That year, Fairtrade cacao production
totaled 175,900 metric tons (MT), representing 4.3 percent of global supply. Buyers purchased
68,300 MT of Fairtrade certified cacao, amounting to 39 percent of certified output, through
Fairtrade contracts. This represents a 47 percent increase in Fairtrade cacao sales over 2011.3
Rainforest Alliance (RA) seeks to foster market-‐driven
conservation, with a mission “to conserve biodiversity and ensure
sustainable livelihoods by transforming land-‐use practices, business
practices and consumer behavior” (RA 2014c). The Rainforest Alliance
CertifiedTM label (Figure 2.2) applies to over 100 agricultural
commodities including bananas, cattle, coffee, cacao, flowers, palm oil
2 For cacao and other crops categorized as “less labor intensive” (coffee, herbs, honey and spices), FLO defines smallholders as those who rely primarily on family labor and do not hire labor year round. FLO does not use farm size to determine whether producers of such crops are smallholders (FLO 2012). 3 Output that producers do not sell as Fairtrade may be sold under other certifications or contracts, or on the conventional market.
Figure 2.1: Fairtrade Label Source: fairtrade.net
Figure 2.2: RA Label Source: rainforest-‐
alliance.org
7
and tea (RA 2014a). Individual farms and groups of various forms (e.g., cooperative, association,
contract production schemes) can become certified (RA 2014b). RA assists certified producers by
connecting them with lenders, offering guidance on business and financial management, and
providing technical assistance. As of 2013, 900,000 farms were RA certified (RA 2013b). That year,
RA-‐certified farms produced 14.5 percent of the world’s cacao, 14 percent of tea and 5.2 percent of
coffee. In 2013, RA-‐certified cacao production was 571,695 MT, with 48 percent sold on RA terms
(Nieberg 2014).
UTZ Certified’s (UTZ) mission is “to create a world where sustainable farming is the norm”
(UTZ 2014a). Its theory of change posits that its certification criteria on
farm management, and its marketing efforts for UTZ-‐certified goods, lead
to improved farm yields, revenues and profits (UTZ 2014c). Its label
(Figure 2.3) applies to cacao, coffee, hazelnuts, tea and rooibos (UTZ
2014b), from large, individual farms (hired labor) and various types of
producer groups. UTZ offers technical assistance to help producers meet
specific goals, such as reducing greenhouse gas emissions and conserving water.
UTZ launched its cacao certification in 2007, and certified its first Ivorian cacao co-‐ops in
2009. As of 2013, there were 1,800 UTZ-‐certified entities representing over 500,000 farms (UTZ
2014c). In 2013, over 17.5 percent of global cacao supply was certified to UTZ standards, coming
from 336,351 smallholders and 40 estates in 16 countries. Buyers purchased 295,084 MT of cacao
under UTZ certified contracts that year, representing 42 percent of UTZ production, and a 149
percent increase in certified sales over 2012 (Nieberg 2014, UTZ 2014c).
Table 2.1 summarizes key attributes of each label’s scope with respect to cacao. While
certification criteria overlap in many ways, Fairtrade focuses on producer empowerment and price
in particular, RA prioritizes market-‐driven conservation, and UTZ emphasizes farmer and group
Figure 2.3: UTZ Certified label
Source: utzcertified.org

8
Table 2.1: Certifications: Key Attributes for Cacao
Fairtrade (2012)
Rainforest Alliance (2013)
UTZ Certified (2013)
Primary focus Improve farmer and group empowerment, ensure “fair” prices
Foster environmental conservation and sustainable livelihoods
Mainstream sustainable farming, professionalize farm and group mgmt.
Producers 166,900 N/R 336,351 Production (MT) 176,000 571,695 691,491 Percent traded as certified
39%
48% 42%
Percent of Global Supply
4.3% 14.5% 17.5%
Certified entities Democratic smallholder groups; contract production schemes in SE Asia
Smallholder groups of various forms (association, co-‐op, contract production scheme, multi-‐farm operation, communal lands), large farms
Smallholder groups of various forms, large farms
Required Price $2,000 floor price and $200 premium per MT
No No
Premiums Paid to Certified Org’s a
$11.8 mil total, Avg. $71/producer
Not reported ~ $49.9 mil total, Avg. $150/producer
a FLO’s reported 9,433,900 euros, and UTZ’s reported 13,000,000 euros, converted to USD at xe.com using 5/28/12 exchange rate (middle of cacao season). Sources: FLO 2013a, FLO 2014b, ICCO 2014b, RA 2013, Nieberg 2014, SAN 2011b, UTZ 2014b, UTZ 2014c professionalization. UTZ has the most producers and output, and Fairtrade has the least. Overall,
certified producers sell less than half of their output at certified terms, with RA farmers having the
highest rate of certified sales. Fairtrade is the only certifier that sets prices and limits certification
to democratic smallholder groups for the most part, while RA and UTZ certify more diverse entities.
Due to the fact that many farms hold more than one certification, total supply of cacao produced
under at least one of the target certifications is estimated to be 22 percent of global output (UTZ
2014a).
2.2 Certification Standards and Processes for Smallholder Groups
The standards documents identified here were used to characterize certification requirements, and
identify criteria with material effects on net income. Certification content overlaps quite a bit at a

9
broad level, though specific requirements differ, as seen in Section 2.3. Fairtrade smallholders must
comply with the Small Producer Organizations (SPO) Standard (FLO 2011c), which defines
requirements for groups and farmers in the areas of labor, safety, farm management,
environmental protection, group governance, and compliance management; and crop-‐specific
standards such as the Fairtrade Standard for Cocoa for SPOs (FLO 2013b).4 RA producers must
adhere to the Sustainable Agriculture Network’s (SAN) Sustainable Agriculture Standard (SAN
2010), which states farm-‐level requirements for labor, safety, crop management, environmental
protection and community relations; the Group Certification Standard (2011a), which dictates the
group administrator’s responsibilities for training, capacity building, risk assessment and
compliance management; and applicable crop-‐specific modules.
As of 2014, UTZ-‐certified producers must adhere to a Code of Conduct (UTZ 2014d) that
covers all crops and organizational forms; and commodity-‐specific modules such as the Cocoa
Module (UTZ 2014e). Prior to 2014, UTZ used a self-‐contained Code of Conduct for each commodity
and organizational form (e.g., group, plantation), such as the Cocoa Code for smallholder groups
(UTZ 2009).5 The theoretical analysis considers both the prior and current Codes, in order to
provide a means for interpreting prior research and the data collected for this thesis, and posit
theoretical effects moving forward. The Cocoa Code and the Core Code of Conduct combine
requirements for producers and the “certificate holder” (group administrator), and cover labor,
safety, crop production, environment, compliance management, and community engagement. The
Cocoa Module addresses farm maintenance and post-‐harvest processing. All certifications identify
4 To qualify as an SPO, at least half of the group’s traded volume must come from smallholders, and smallholders must comprise at least half of the group’s membership (FLO 2011c). 5 For some crops, SAN also has developed additional modules specific to a given crop in a given country, such as cacao in Ghana.
10
prohibited agrochemicals, following from international conventions banning the most toxic
substances.6
The certification process is largely similar across certifications. Auditors conduct annual
audits of group operations and records, and a subset of farms.7 Fairtrade grants certification to
groups as a whole only, while RA and UTZ allow groups to certify only a subset of members (Buyo
2013, Laan and Guilhuis 2014). Thus, RA and UTZ producers are able to align certified supply with
demand, and avoid paying certification fees on crop they will sell as conventional, while Fairtrade
producers are unable to do so. For RA and UTZ, the certificate holder must inspect all certified
farms before an external audit (SAN 2011a, UTZ 2014d). RA and UTZ allow third parties such as
buyers to hold and manage the certificate.
Each certification has a set of minimum criteria needed to attain certification, and increases
the number of criteria needed to maintain certification over time. This indicates that related cost
increases may be spread out over several years, and thus may be more manageable than a single
up-‐front increase. Fairtrade producers must meet all “core” requirements for a given year, and
attain a minimum score for “development” requirements (FLO 2012). The number of requirements
increases through the first six years. RA producers must meet all “critical” criteria, 50 percent of the
criteria under each principle, and 80 percent of total criteria in year one (SAN 2010, SAN 2011a).8
They must satisfy at least 85 percent and 90 percent of total criteria in the second and third years,
respectively (SAN 2010, SAN 2011a). UTZ producers must satisfy all “mandatory” criteria and a
6 Prohibited agrochemicals includes those that are banned or severely restricted by the U.S. Environmental Protection Agency or the European Union, banned per the Stockholm Convention on Persistent Organic Pollutants, included in the Rotterdam Convention on Prior Informed Consent Annex II, listed on the Pesticide Action Network Dirty Dozen list, or not registered in the production country. 7 FLO uses FLOCERT, an independent subsidiary of FLO (FLO 2011c), RA uses accredited auditors that may be SAN members (RA-‐Cert 2012), and UTZ uses independent auditors. Thus, auditor independence varies across certifications. 8 An exception to this is that, in groups with more than 17 members, the group can pass the audit if at least 80 percent of farms meet 80 percent of total criteria and the remaining farms meet 70 to 80 percent (SAN 2011a).

11
minimum number of “additional” criteria in year one. Many criteria that are initially additional
become mandatory over the first four years.
2.3 Theoretical Effects: Pricing, Output and Expenditures
Table 2.2 summarizes the ways in which each certifier’s standards and activities could theoretically
affect producer prices. Each is detailed below.
Table 2.2: Possible Effects of Certification on Producer Prices
Fairtrade Rainforest Alliance
UTZ 2009 and 2014
Differentiates product as higher quality along social and environmental attributes
Yes Yes Yes
Differentiates product as higher physical quality
Possibly, by encouraging or requiring premium use for quality
No Possibly, via post-‐harvest processing criteria
Sets prices Minimum price and premium for producer groups
No requirements No requirements
2.3.1 Theoretical Effects: Pricing
Certifications can affect producer prices by differentiating products based on attributes that are
perceived as enhancing quality and result in a higher willingness to pay. As such, certification
enables vertical differentiation because consumers would rank-‐order the relevant qualities the
same way, and agree they add value over conventional goods (see Saitone and Sexton 2010).
Consumers differ in the actual value they place on these qualities, however. Thus, willingness to pay
is highest among those who value the relevant qualities the most, and average willingness to pay
decreases as we include consumers who value them less. Figure 2.4 illustrates a simple set of
demand curves for certified (differentiated) and conventional commodities, assuming that the
premium that buyers are willing to pay decreases as the quantity demanded increases. This figure

12
indicates that one would expect premiums for certified cacao to be lower as certification moves
from the niche to the mainstream, as it has for cacao.
Figure 2.4: Demand Curves for Differentiated (Certified) and Conventional Goods
Per Saitone and Sexton (2010), buyers define quality using diverse traits, from physical
characteristics to worker treatment and environmental impacts. Certifications can indicate two
types of quality: social responsibility attributes, and physical attributes that affect flavor and
processing efficiency. The target certifications identify commodities as being more socially and
environmentally responsible than conventional goods, in ways that align with consumer
preferences. Cone Communications/ECHO (2013) surveyed 10,287 consumers in ten countries,
who ranked the environment, poverty and human rights as three of the four most important issues
companies should address. Each certification prohibits the worst forms of child labor, and requires
practices that reduce negative environmental impacts, such as establishing buffer zones to protect
waterways. Additionally, Fairtrade requires buyers to pay prices that include above-‐market
premiums (FLO 2012).
Conventional Price
Differentiated Price
Quantity demanded
13
Market research indicates that goods that are seen as being more socially responsible may
be able to command price premiums. The Nielsen Company (2014) polled 30,000 consumers from
60 countries, and found that 55 percent would pay more for products from socially and
environmentally responsible companies. Additionally, 52 percent look at packaging for indicators
that the product has positive social and environmental impacts, such as self-‐stated claims or third-‐
party labels. Companies with products that meet a certifier’s labeling requirements can put that
label on applicable products, providing third-‐party verification of relevant marketing claims.
Certifiers seek to increase demand through consumer marketing campaigns and industry outreach
(see FLO 2014b, RA 2014b). This shifts the demand curve out to increase prices for producers.
The target certifications seem to have a limited effect on differentiating goods as being of
higher physical quality. None of the certifications specifies physical quality requirements, though
FLO and UTZ have criteria that could boost physical quality. The Fairtrade Cocoa standard states
that groups must consider whether investing their premium in physical quality improvement
would enhance producer incomes, and encourages groups to invest “at least” 25 percent of the
premium on physical quality and productivity (FLO 2011a).9 This is not binding, so its effects are
uncertain.
UTZ specifies criteria that would help producers meet market requirements, reducing the
amount of substandard beans that are rejected or sold for discounted prices. The Core Code (UTZ
2014d) requires farmers to harvest their crop at the correct time and use post-‐harvest processing
methods that “optimize” quality. The Cocoa Module (UTZ 2014e) and the Cocoa Code (UTZ 2009)
require farmers to use the “appropriate” method for fermentation, dry and store beans away from
flavor contaminants (e.g., smoke and fuel), dry beans to an “appropriate” moisture level, meet
national/buyer physical quality requirements, and sort out foreign matter and “defective” beans.
9 FLO requires coffee producers to allocate 25 percent of their premium toward yield and quality improvement, but does not mandate a minimum percentage they must spend on quality. Thus, producers could invest solely on productivity, leaving quality unaffected (FLO 2011a).

14
Such criteria would drive meaningful change if market failures exist, such that producers
are not aware of physical quality standards, do not know how to meet them, or do not have
adequate cost-‐benefit information to feel confident that market prices will sufficiently compensate
them for the required effort. Insufficient training, technical skills and financial literacy, are widely
cited problems in agricultural development (Jessop et al. 2012). Certification criteria and training
address the former two issues, but do not improve financial knowledge or analysis skills.
Knowing that certification differentiates commodities in ways that are associated with a
higher willingness to pay, we must also consider how certifiers seek to affect price. None of the
target certifications mandates a floor price for individual smallholders. RA (2014a) and UTZ
(2014d) do not dictate prices at the group level either. Thus, for these certifications, the market’s
willingness to pay for differentiated goods determines group prices. In contrast, for most products,
FLO (2011b) requires buyers to pay producer organizations a Fairtrade price, consisting of a floor
price (market or Fairtrade minimum, whichever is higher) and an additional premium, if the buyer
wishes to market the commodity as certified. FLO prohibits groups from giving members the entire
premium as income (FLO 2012). It audits buyers and producers to ensure compliance.
The magnitude of Fairtrade’s impact on producer group prices depends on the differential
between the Fairtrade floor price and the market price, which varies across commodities and time.
Thus, we cannot predict the exact price differential across Fairtrade and conventional groups. As an
example, Figure 2.5 shows the Fairtrade cacao price (teal line) and minimum price (green line)
relative to the world price (blue line), from 1993 to 2014. Through 2006, the world price fell below
the Fairtrade floor, giving certified producer groups a differential over market prices, equal to the
difference between the world market and the Fairtrade floor, plus the premium. Since 2007, the
world price has exceeded the Fairtrade floor, making the premium the minimum guaranteed price
differential that certified organizations receive, above world prices.

15
Figure 2.5: Fairtrade Cacao Price with Premium, and World Price, 1993 to 2014 a
a From 1994-‐2011, the Fairtrade price was $1,750/MT. In 2011, Fairtrade price was raised to $2,200/MT. Data sources: FLO Undated, ICCO 2014a
Regarding how pricing at the group level translates to farmer prices, FLO reports that,
across commodities, farmers receive 20 percent of the premium as a direct payment, while cacao
farmers receive 21 percent of the premium directly. This indicates that Fairtrade sales return
above-‐market prices to farmers. Among certifications without set prices, RA (2014a) asserts that
farmers typically receive above-‐market prices but does not publicize prices or premiums. Thus, it is
not possible to validate the magnitude of the effect of RA certification on producer prices. UTZ does
not disclose farmer prices. It reported that groups received premiums equating to $0.043 per lb. for
coffee, $159 per MT for cacao and $26 to $77 per MT for tea per producer, in 2013 (UTZ 2014c),
which represent averages of total group premiums across all producers.10 It seems reasonable to
assume that RA-‐ and UTZ-‐certified groups will return some portion of above-‐market prices to 10 UTZ premium figures were converted from 122, 20 and 59 euros respectively, as reported by UTZ (2013c), using May 30, 2013 (middle of cacao season) exchange rate at xe.com.
$0
$500
$1,000
$1,500
$2,000
$2,500
$3,000
$3,500 1993
1994
1995
1996
1997
1998
1999
2000
2001
2002
2003
2004
2005
2006
2007
2008
2009
2010
2011
2012
2013
2014
ICCO Price
Fairtrade min. price
Fairtrade price (wloor + premium)
16
farmers, as at least some of these groups are democratically run by farmers, and all groups must
compete with Fairtrade producer organizations that are clearly paying above-‐market prices.
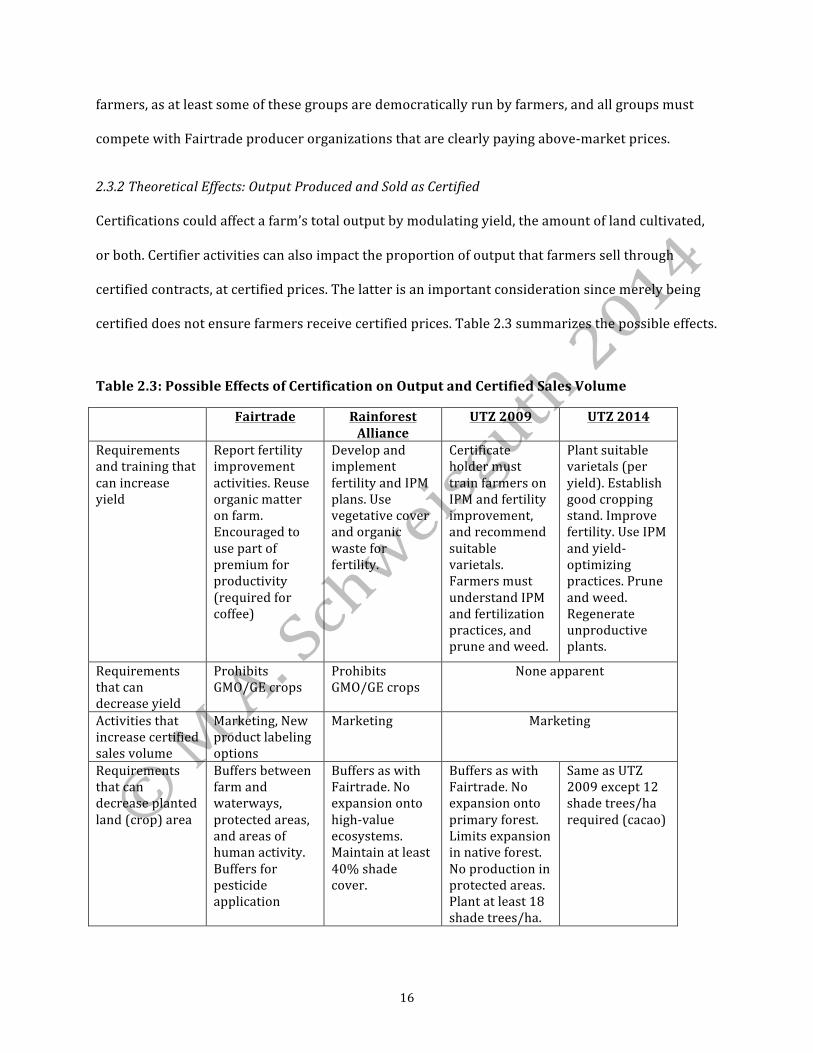
2.3.2 Theoretical Effects: Output Produced and Sold as Certified
Certifications could affect a farm’s total output by modulating yield, the amount of land cultivated,
or both. Certifier activities can also impact the proportion of output that farmers sell through
certified contracts, at certified prices. The latter is an important consideration since merely being
certified does not ensure farmers receive certified prices. Table 2.3 summarizes the possible effects.
Table 2.3: Possible Effects of Certification on Output and Certified Sales Volume
Fairtrade Rainforest Alliance
UTZ 2009 UTZ 2014
Requirements and training that can increase yield
Report fertility improvement activities. Reuse organic matter on farm. Encouraged to use part of premium for productivity (required for coffee)
Develop and implement fertility and IPM plans. Use vegetative cover and organic waste for fertility.
Certificate holder must train farmers on IPM and fertility improvement, and recommend suitable varietals. Farmers must understand IPM and fertilization practices, and prune and weed.
Plant suitable varietals (per yield). Establish good cropping stand. Improve fertility. Use IPM and yield-‐optimizing practices. Prune and weed. Regenerate unproductive plants.
Requirements that can decrease yield
Prohibits GMO/GE crops
Prohibits GMO/GE crops
None apparent
Activities that increase certified sales volume
Marketing, New product labeling options
Marketing Marketing
Requirements that can decrease planted land (crop) area
Buffers between farm and waterways, protected areas, and areas of human activity. Buffers for pesticide application
Buffers as with Fairtrade. No expansion onto high-‐value ecosystems. Maintain at least 40% shade cover.
Buffers as with Fairtrade. No expansion onto primary forest. Limits expansion in native forest. No production in protected areas. Plant at least 18 shade trees/ha.
Same as UTZ 2009 except 12 shade trees/ha required (cacao)
17
All of the target certifications have criteria that could boost yields to differing degrees (FLO
2012, SAN 2010, UTZ 2009, UTZ 2014d, UTZ 2014e). Each requires producers to improve soil
fertility and reuse organic waste on the farm. Fairtrade organizations must evaluate the benefits of
spending some of their premiums on yield improvement, and FLO encourages groups to use at least
25 percent of the premium to boost yield and physical quality (coffee groups must do so; FLO
2013b). This criterion lacks a mandate, so its effects are questionable. RA and UTZ farmers must
implement an integrated pest management (IPM) program, while Fairtrade requires IPM training.
This is not a critical requirement for RA, so it is not certain that RA producers will implement it.
UTZ (2014d) goes further in mandating that producers select varietals with consideration
to yield, control weeds (to maximize nutrient uptake), regenerate unproductive plants, and develop
and implement a yield optimization plan.11 The prior Cocoa Code (UTZ 2009) requires the same
practices except for a yield improvement plan, and does not explicitly reference yield enhancement
to the same degree. As with physical quality, such criteria will have a tangible impact if market
failures exist, such that producers lack training on yield-‐boosting practices, lack information to
determine if they are profitable, or face financial constraints that leave them unable to implement
them. Insufficient training, technical skills, financial literacy and access to credit are prevalent
constraints farmers face (Jessop et al. 2012). Certification criteria rectify the two former issues. FLO
and RA help groups access affordable credit. However, gaps in farm-‐level credit and financial
management limit producers’ abilities and motivations to invest at levels that may be optimal.
Regarding output, certifiers’ marketing efforts can increase demand for certified products,
which would help producers increase the proportion of output they sell under certified contracts,
or increase the price they receive. Given that supply continues to increase, and that none of the
certifiers requires producers to have a buyer who commits to purchasing a minimum volume at
certified terms, the net effect of certifier marketing efforts cannot be determined.
11 The stated UTZ criteria become mandatory incrementally over four years.
18
FLO also has worked to increase purchasing through a new
“Fairtrade Sourcing Program” labeling option (Figure 2.6) for cacao,
sugar and cotton (FLO 2014b). Brand owners can use the “Program”
label on products that contain several ingredients that are produced
by Fairtrade organizations if they source only one of these ingredients as Fairtrade (e.g., use
Fairtrade cacao and conventional sugar in chocolate). This provides a lower-‐cost option for
marketing products as Fairtrade, as companies must source all applicable ingredients as Fairtrade
to use the regular Fairtrade label (e.g., both cacao and sugar in a chocolate bar must be Fairtrade).
Ten chocolate companies have signed on to source Fairtrade through the program, including Mars
and Ferrero.
Concerning negative effects on yield and output, Fairtrade and RA both prohibit the use of
genetically modified (GM/GMO) and genetically engineered (GE) planting material, a criterion
whose effect varies geographically. This would prevent producers from attaining maximum
possible yields if GE/GMO options have a higher yield potential than non-‐GMO varieties, and are
approved for use. GE varieties are not currently available for cacao, so this requirement does not
affect cacao farmers. All of the target certifications require producers to establish buffer zones
around waterways, protected areas, areas of human activity, and pesticide application sites, and
prohibit farmers from expanding onto protected ecosystems (FLO 2012, SAN 2010, UTZ 2009, UTZ
2014d, UTZ 2014e). RA and UTZ are more stringent, also prohibiting expansion onto primary
forest, or native forest that is not used for timber production, and requiring producers to maintain a
shade canopy (12 trees her ha for UTZ, and a 40% shade cover for RA). These requirements, which
seek to control negative externalities, could reduce planted or pesticide-‐treated area, and thus total
output. Their impacts depend on local regulations for buffer zones and ecosystem protection, and
local norms for shade cover.
Figure 2.6: Fairtrade Cocoa Sourcing Program Label. Source: fairtrade.net
19
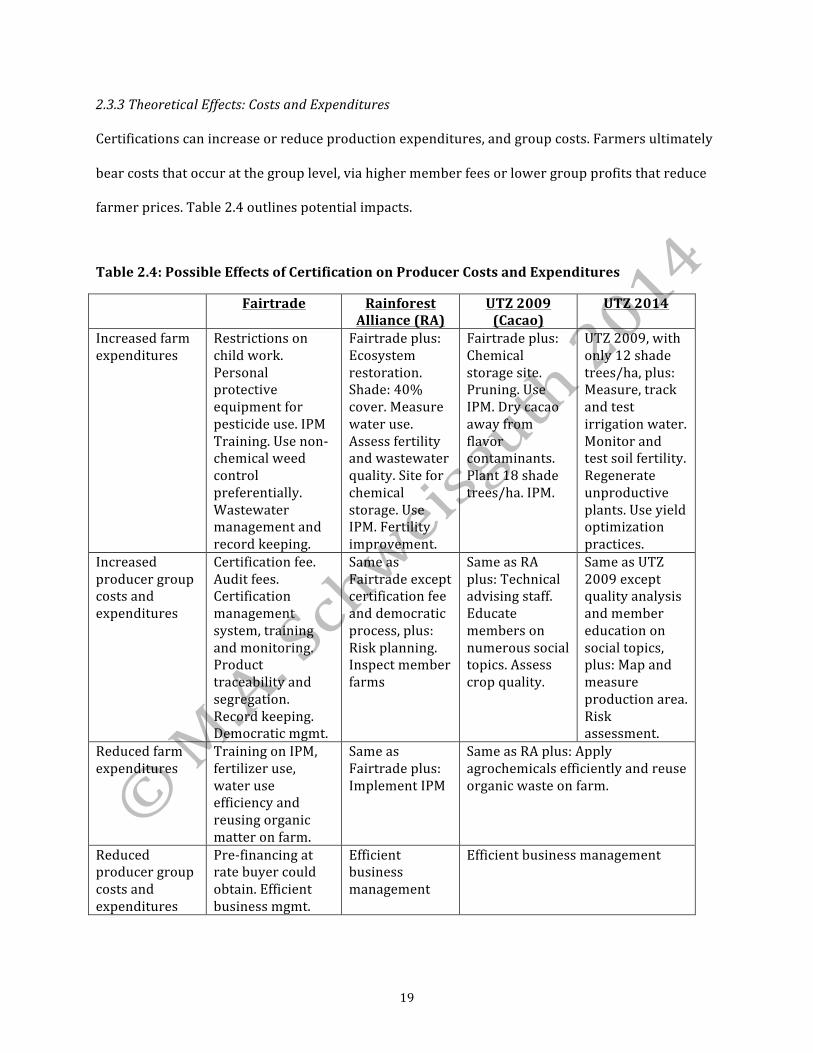
2.3.3 Theoretical Effects: Costs and Expenditures
Certifications can increase or reduce production expenditures, and group costs. Farmers ultimately
bear costs that occur at the group level, via higher member fees or lower group profits that reduce
farmer prices. Table 2.4 outlines potential impacts.
Table 2.4: Possible Effects of Certification on Producer Costs and Expenditures
Fairtrade Rainforest Alliance (RA)
UTZ 2009 (Cacao)
UTZ 2014
Increased farm expenditures
Restrictions on child work. Personal protective equipment for pesticide use. IPM Training. Use non-‐chemical weed control preferentially. Wastewater management and record keeping.
Fairtrade plus: Ecosystem restoration. Shade: 40% cover. Measure water use. Assess fertility and wastewater quality. Site for chemical storage. Use IPM. Fertility improvement.
Fairtrade plus: Chemical storage site. Pruning. Use IPM. Dry cacao away from flavor contaminants. Plant 18 shade trees/ha. IPM.
UTZ 2009, with only 12 shade trees/ha, plus: Measure, track and test irrigation water. Monitor and test soil fertility. Regenerate unproductive plants. Use yield optimization practices.
Increased producer group costs and expenditures
Certification fee. Audit fees. Certification management system, training and monitoring. Product traceability and segregation. Record keeping. Democratic mgmt.
Same as Fairtrade except certification fee and democratic process, plus: Risk planning. Inspect member farms
Same as RA plus: Technical advising staff. Educate members on numerous social topics. Assess crop quality.
Same as UTZ 2009 except quality analysis and member education on social topics, plus: Map and measure production area. Risk assessment.
Reduced farm expenditures
Training on IPM, fertilizer use, water use efficiency and reusing organic matter on farm.
Same as Fairtrade plus: Implement IPM
Same as RA plus: Apply agrochemicals efficiently and reuse organic waste on farm.
Reduced producer group costs and expenditures
Pre-‐financing at rate buyer could obtain. Efficient business mgmt.
Efficient business management
Efficient business management
20
The target certifications could affect farm-‐level expenditures in numerous ways (FLO 2012,
SAN 2010, UTZ 2009, UTZ 2014d, UTZ 2014e). All of the certifications prohibit the Worst Forms of
Child Labor as defined by ILO Convention 182, such as having children under the age of 18 handle
pesticides and sharp implements, engage in other unsafe tasks or work long hours. Additionally,
each requires wastewater management, and the use of personal protective equipment when
spraying pesticides. RA and UTZ producers also must keep farm records, establish secure
agrochemical storage, maintain a minimum shade cover, analyze and improve soil fertility, and
measure and track irrigation water.
Beyond these criteria, RA requires farmers to restore damaged high-‐value ecosystems,
inventory wildlife habitat, treat wastewater, and test wastewater quality, while UTZ producers
must establish crop drying and storage sites away from flavor contaminants, prune and regenerate
crops, test irrigation water, and implement yield optimization practices. The current UTZ Codes
require all of these practices while the prior Codes do not. These criteria could all increase labor
requirements and cash expenditures, depending on producers’ current practices and the crop.
Many also seem likely to boost yield or physical quality, improving revenue. Certification addresses
gaps in technical training on such practices, but does not necessarily convey information about
their profitability to motivate adoption.
On the expenditure reduction side, all certifications require training on water efficiency.
Additionally, Fairtrade and RA mandate training on reusing organic farm waste, and UTZ requires
farmers to apply agrochemicals efficiently and reuse organic waste on the farm. These criteria could
help producers reduce purchased input expenditures, depending on pre-‐certification practices.
Additionally, FLO (2014a) reports that producers receive approximately eight percent of the
premium in kind, as tools and inputs, representing an expenditure reduction in cases where
producers would have purchased the items themselves. The effects of weed and pest control
criteria are not clear. All certifications require producers to use non-‐chemical weed control

21
preferentially. RA and UTZ and mandate IPM use, and Fairtrade producer groups must train
members on this. Both approaches involve replacing agrochemicals with labor, and using less toxic
agrochemicals when they are needed. Farmers may reduce input expenditures while increasing
labor, with the net result depending on relative costs and amounts used.
Certification involves numerous costs at the group level (UTZ 2009, SAN 2011a, FLO 2012,
UTZ 2014d, UTZ 2014e). Producers must pay audit fees for each certification, and an additional
registration fee for Fairtrade (FLOCERT 2014). RA and UTZ allow groups to certify only a subset of
members, and thus avoid paying to certify output they don’t expect to sell as certified, while FLO
does not. For all certifications, groups also must implement a compliance program, train members
on requirements, monitor member performance, track and segregate certified commodities from
the farm to the first buyer, and report on soil fertility improvement efforts.12 Fairtrade and UTZ
groups must track and report premium usage. RA and UTZ require groups to inspect member farms
prior to external audits, manage compliance agreements with members, and develop a compliance
risk management plan. UTZ adds demands on top of this, such as mapping and measuring certified
crop area, and analyzing a crop’s physical quality.
All of these requirements increase human resources demands, and many require higher-‐
level record keeping, planning and management skills. Groups will bear these costs through staff
salaries or payments to external entities that they must contract to fill gaps in management
capacity. Fairtrade also requires democratic group management, including assemblies to vote on
group matters, which can add time and costs.
Certified groups may realize expenditure reductions by establishing more efficient group
management, product handling and financial record-‐keeping systems, as a result of improving
relevant processes to meet certification requirements. Fairtrade also requires buyers to provide
producer groups with pre-‐financing for contracted sales, amounting to up to 60% of the contract
12 FLO allows producers to commingle certified and non-‐certified crops if the buyer is approved to do so, under FLO’s “mass balance” system (FLO 2012).
22
value (FLO 2011d). The interest rate must not exceed the rate that the buyer could obtain if they
took out a loan for the requested amount. A buyer might be expected to receive a lower rate than a
producer group. Groups would face reduced loan costs in such cases
2.4 Conclusion
A review of certifiers’ standards and activities indicates that certification could affect the
components of net income in numerous ways, and that the direction and magnitude of such effects
for a specific producer group cannot be predicted on a purely theoretical basis. As such, the positive
outcomes posited in certifiers’ theories of change and other communications are not guaranteed.
Given that certifiers’ requirements and activities are similar in some ways, and differ in others, we
would expect each certification to have different sets of partially overlapping effects.
Certification seems most likely to have a positive effect through prices, by differentiating
commodities in terms of social and environmental qualities that have added valued in the market.
Producers will receive applicable higher prices only for quantities that buyers wish to market as
certified, however. Each certification includes requirements that could boost yields, particularly
UTZ. However, each also involves land use restrictions that could reduce output, particularly RA.
There is evidence that certifiers are working to build demand that would help producers sell larger
volumes at certified terms, and altering labeling requirements to achieve the same end in the case
of Fairtrade. However, it is not clear if and how any of the certifiers are working to manage supply
and demand growth to prevent a surplus of certified output, which would constrain average
producer prices and certified sales volumes for a given group.
On the cost and expenditure side, each certification entails more intensive farm
management practices that could increase the cost of production, but also involves training that
could reduce expenditures through efficient input use. UTZ seems to have the most criteria relevant
to this area, followed by RA. Certified groups would face increased costs and expenditures to

23
manage and implement certification requirements, with potential savings coming from efficiencies
realized through improved management, and, for Fairtrade, pre-‐finance.
Given uncertainties about how each certification would affect the components of net
income, and thus net income overall, field-‐based research across certifications, crops and countries
is needed to make informed predictions. The following chapter will discuss relevant research to
date, identify remaining knowledge gaps, and note design and analyses methods that are required
for a sound assessment of certification impacts.

24
Chapter 3. Literature Review
The literature review characterizes the scope, methods, designs, and findings of research that has
evaluated the relationship between certification and smallholders’ net incomes. It identifies gaps
warranting further inquiry, and methodological best practices, which informed the fieldwork for
this thesis. It focuses on independent research that used primary data to evaluate the relationship
between at least one of the target certifications, and price, output, yield, crop expenditure, gross
crop revenue, net crop revenue and/or household income. It excludes papers that used only
secondary data, are purely theoretical or that certifiers produced (e.g., impact assessments,
monitoring and evaluation reports).
The literature review comprises 39 publications, indicated in Table 3.1. Of these, 24 are
independent studies by academic researchers and research institutes, or peer-‐reviewed articles
based on work that certifiers or partners commissioned from such entities. The remaining 15 are
non-‐peer-‐reviewed, quantitative studies commissioned by certifiers, partners (e.g., NGO) or others.
Independent and commissioned papers are evaluated separately, as the latter may be subject to
more bias. Section 3.1 discusses the literature scope, section 3.2 characterizes methods and design,
section 3.3 summarizes and evaluates findings, and Section 3.4 concludes. Overall, research has
focused on Latin American Fairtrade coffee and prices, used mostly cross-‐section designs and
methods of varied strength, and reached mixed conclusions on certification’s economic impacts.
3.1 Literature Scope
Table 3.2 summarizes the literature coverage by certification, crop and region. Papers may cover
more than one item in these categories. Thus, category totals may exceed the number of studies.
Researchers have focused predominantly on Fairtrade certification, coffee and Latin America,
particularly targeting specialty coffee producers. Thus, much of our current understanding of
certification outcomes is based on data from farmers that grow a single certified commodity for
niche markets. Certifier-‐commissioned works are more balanced in scope than independent

25
Table 3.1: Literature Reviewed
Independent Academic and Research Inst. Studies
Certifier/Partner Commissioned Studies
Afari-‐Sefa et al. (2010) Bennett et al. (2013) Arnould, Plastina and Ball (2009) Ceval (2014) Barham and Weber (2011) COSA (2014) Bassett (2012) Fort and Ruben (2008a) Becchetti and Constantino (2008) Fort and Ruben (2008b) Beuchelt and Zeller (2011) Giovannucci and Potts (2008) Blowfield and Dolan (2010) Ingram et al. (2014) Chiputwa, Spielman and Qaim (2014) Jaffee (2008) de Janvry, McIntosh and Sadoulet (2014) KPMG (2012) Deppeler, Fromm and Aidoo (2014) RA (2012) Fromm and Dubón (2006) Riisgard et al. (2009) Jena et al. (2012) Ruben et al. (2008) Kamau et al. (2012) Smith (2010) Lazaro, Makindara and Kilima (2008) Waarts et al. (2012) Melo and Hollander (2013) Zúñiga-‐Arias and Sáenz Segura (2008) Méndez et al. (2010)
Pinto et al. (2014) Ruben and Fort (2011) Ruben, Fort and Zúñiga-‐Arias (2009) Ruben and Zúñiga (2010) Rueda and Lambin (2013) Utting-‐Chamorro (2005) Valkila (2009) Valkila and Nygren (2008)
research. Numerous studies evaluate multiple certifications, though few consider different crops
and regions.
Of the studies evaluating Fairtrade, 58 percent include farmers who are dually certified as
Fairtrade and organic (FTO). Twelve of these papers include both Fairtrade-‐only (FLO) and FTO
groups, while six include only FTO (Becchetti and Constantino 2008, Fort and Ruben 2008a, Jaffee
2008, Barham and Weber 2011, Beuchelt and Zeller 2011, Jena et al. 2012). For the latter six, one
cannot separate the effects of Fairtrade from organic, limiting the strength of any conclusions.
Overall, there is a knowledge gap regarding the economic outcomes associated with FLO, RA and
UTZ for African cacao producers who grow a mass-‐market varietal and hold only one certification.

26
Table 3.2: Certification Literature Scope
Independent Academic and Research Inst. Studies
Certifier/Partner Commissioned Studies
Total 24 15
N % of Total N % of Total Certifications Covered a Fairtrade (FLO) 15 63 10 67 FLO + Organic multi-‐certified (FTO) 14 58 4 27 RA 7 29 6 40 UTZ 4 17 5 33 UTZ + Organic multi-‐certified 1 4 0 0 FLO, RA and/or UTZ multi-‐certified 2 8 2 13 Other: Organic, Starbucks Café, SMBC Bird Friendly
8 33 5 33
Evaluates multiple certifications 15 63 9 60
Crops Covered Banana 1 4 5 33 Cacao 3 13 6 40 Coffee 18 75 6 40 Cotton 1 4 1 7 Flowers 0 0 1 7 Fruit 1 4 0 0 Tea 1 4 3 20 Evaluates multiple crops 1 4 3 20
Geographic Regions Africa 9 38 8 53 Asia 0 0 2 13 Latin America 15 63 9 60
Evaluates multiple regions 0 0 3 20 a Some studies cover multiple crops, certifications and/or regions.
3.2 Design and Methods
Table 3.3 indicates design and methods from the literature. Totals for each sub-‐header may not
equal the number of papers due to missing information, and/or the use of multiple designs or
methods. The overwhelming majority of studies used a cross-‐section design, comprising 83 percent

27
of independent research and 71 percent of commissioned works. Only five used a panel, with four
of these being commissioned. Three papers, all independent case studies, used time-‐series data
(Barham and Weber 2011, de Janvry, McIntosh and Sadoulet 2014, Melo and Hollender 2013).
Table 3.3: Study Design and Methods
Independent Academic and Research Inst. Studies
Certifier/Partner Commissioned Studies
Total 24 15 N % of Total N % of Total Design Cross section 20 83 11 73 Panel 1 4 4 27 Case Study 4 (3 time series) 17 0 0
Controls Used non-‐certified controls 15 63 11 73 Certified and controls in same organizational form a
7 47 1 7
Sample Diversity b One group per type (e.g., certification, crop, country)
9 38 8 53
Two groups per type 2 8 1 7 Three or more groups per type 11 46 2 13
Analysis Methods Descriptive Statistics Only 5 21 2 13 Correlations 1 4 0 0 Compare unmatched means (t-‐tests, ANOVA)
9 35 13 87
Compare means via Propensity Score Matching
5 21 5 33
Difference-‐in-‐Difference 0 0 3 20 Regression 3 13 2 13 Qualitative 7 29 3 20 Cost-‐Benefit Analysis 1 4 1 7 a This is the percentage of studies with controls. Some studies did not state organizational form for controls. b The number of groups per type is not stated in all studies.
The validity of cross-‐sectional findings, and our ability to generalize them, rests on the
diversity of the sample, and the use of appropriate controls. Here, sample diversity is defined as the

28
number of distinct groups per certification status that a study included, across producers and/or
locations. Among independent studies, almost half used three or more groups per certification
status (e.g., four certified and four non-‐certified groups), while about 40 percent used only one (e.g.,
one certified and one non-‐certified group, or one certified group in a time-‐series study). Certifier-‐
commissioned studies have much lower sample diversity, with most using only one group. As such,
the results of most studies cannot be generalized beyond the sampling context with confidence.
Using a counterfactual enables us to draw valid conclusions about how certification differs
from conventional systems, and generalize conclusions to comparable populations outside the
sample. While the majority of studies used non-‐certified controls, one third did not. In the absence
of controls, researchers have evaluated a single certification using time-‐series data (Barham and
Weber 2011, Melo and Hollender 2013, de Janvry et al. 2014) or producer recall (Ceval 2012), or
compared performance across certifications (Utting-‐Chamorro 2005, Fort and Ruben 2008c).
Among studies using time-‐series or recall data, only Barham and Weber (2011) include pre-‐
certification data, which are needed to determine if obtaining certification is better than doing
nothing. Additionally, recall can be faulty. Other papers without controls compare certified farmers’
outcomes to sector averages (Utting-‐Chamorro 2005, Valkila and Nygren 2008, Blowfield and Dolan
2010, Bassett 2012, Pinto et al. 2014). Such averages are not suitable control data since they
represent certified and non-‐certified farmers’ outcomes, and may not be geographically applicable.
Where studies employ controls, the majority either fail to state organizational form (Fromm
and Dubón 2006, RA 2012, Waarts et al. 2012, Bennett et al. 2013, Rueda and Lambin 2013,
Deppeler, Fromm and Aidoo 2014) or do not control for it because they use certified producers
from co-‐ops, and independent controls (Becchetti and Constantino 2008, Jaffee 2008, Ruben, Fort
and Zúñiga-‐ Arias 2009, Riisgard et al. 2009, Ruben and Zúñiga 2010, Chiputwa, Speilman and Qaim
2014). Given that producer organizations have greater market power than individual smallholders,
may provide goods and services to members (FLO 2014a) and may receive training and support
29
that buyers offer to groups only (Barry Callebaut 2014), group affiliation can affect economic
outcomes apart from certification. When researchers do not state or control for organizational
form, and use only simple analyses such as unmatched group means, one cannot attribute reported
differences across certified and non-‐certified producers to certification alone.
Selection bias is a concern in evaluating certification impacts, as certification has not
involved random selection to date. Producers may choose to become certified, or buyers and others
may initiate the process. Certifier and trader interviews confirm that traders approach co-‐ops to
become certified in Côte d’Ivoire, and have selection criteria such as group size and management
capabilities (Buyo 2013, Sendjou 2014). Larger group size reduces the number of transactions
traders must manage, and makes certification cost-‐efficient for producers (Pinto et al. 2014).
Farmers with better knowledge, yields, physical quality and incomes, and co-‐ops with better
management, could also find it easier to meet requirements and costs, and be more likely to seek
certification. Alternately, impoverished, poorly performing farmers may pursue certification, or be
chosen preferentially for certification by others, as a way to improve their knowledge and incomes.
Some of the reviewed studies have employed data analysis methods to address selection
bias. Five independent and five commissioned works utilized propensity score matching (PSM) to
compare group means. In PSM, certified and non-‐certified producers are matched based on a
propensity score from a probit regression that predicts the likelihood of being certified. Probit
models include household, farmer and farm attributes such as household size, farmer’s age and
cropping area (see Ruben and Fort 2011, Bennett et al. 2012). Three such studies do not specify the
probit, making it difficult to evaluate the validity of subsequent tests (Ruben, Fort and Zúñiga-‐Arias
2009, Kamau et al. 2010, COSA 2014). Some probits include variables that may be affected by
certification and thus may not reflect the pre-‐certification state, such as current cropping area
(Ruben and Zúñiga 2010, Ruben and Fort 2011, Bennett et al. 2013). Chiputwa et al. (2014) use
past cropping area per farmer recall, providing a pre-‐certification measure but risking recall error.
30
Three papers, all commissioned, utilized a difference-‐in-‐difference (DiD) analysis with panel
data to compare change over time across certified and non-‐certified groups (RA 2012, Waarts et al.
2013, Bennett et al. 2013). This is said to be a stronger method of analyzing how certification may
affect outcomes, with the difference in change over time between groups defined as the potential
treatment effect. However, analyses that compare means across groups only, including DiD, PSM
and unmatched t-‐tests, cannot prove that certification has caused observed differences. Such
methods also do not quantify certification’s effects relative to other relevant variables. Regression
analyses serve this role. Only four studies, two independent and two commissioned, used
regressions to estimate the effect of certification on net income and/or its components. The
regressions focused on coffee price (de Janvry et al. 2014), total coffee output (Arnould et al. 2009),
coffee profit (Riisgard et al. 2009), and cacao yield and profit (Ingram et al. 2014). All four studies
found that certification, and other demographic, economic and agronomic variables, had significant
positive effects. However, Ingram et al. (2014) found that the coefficient for certification was
significant for yield and not profit. Ingram et al. (2014) also considered the effects of buyer
affiliation and participation in other training programs, the only study to do so.
3.3 Findings From Prior Research
Table 3.4 summarizes the results of existing research on the relationship between certification, and
net income and its components. It includes only statistically significant findings, with an exception
for descriptive statistics on price premiums from seven studies (Utting-‐Chamorro 2005, Lazaro
et al. 2008, Valkila and Nygren 2008, Valkila 2009, Bassett 2012, KPMG 2012, Melo and Hollander
2013). The percentages for each finding (e.g., higher, lower) are based on the number of studies
evaluating each outcome. Overall, research indicates mixed outcomes, with some results dependent
on time, crop and geography, or partially driven by factors such as farm size. Findings vary within
each crop, certification and region, such that no single commodity, certification or location is
associated with purely positive or negative outcomes.

31
Table 3.4: Findings on Relationships Between Certification, and Net Income and Its Components a
Independent Academic and Research Inst. Studies
Certifier/Partner Commissioned Studies
Total 24 15 N % of Relevant Total N % of Relevant Total Price Number of Relevant Studies 19 79 8 53 Certified Higher 15 79 5 62.5 Certified Lower 0 0 0 0 No Significant Difference 2 10.5 2 25 Mixed Results 2 10.5 1 12.5
Total Output Number of Relevant Studies 4 17 5 33 Certified Higher 1 25 4 80 Certified Lower 0 0 0 0 No Significant Difference 1 25 0 0 Mixed Results 2 50 1 20
Yield Number of Relevant Studies 8 33 9 60 Certified Higher 1 13 4 45 Certified Lower 3 37 1 11 No Significant Difference 0 0 2 22 Mixed Results 4 50 2 22
Gross Crop Revenue Number of Relevant Studies 6 25 5 33 Certified Higher 3 50 2 40 Certified Lower 0 0 1 20 No Significant Difference 1 17 1 40 Mixed Results 2 33 1 20
Total Production Expenditure Number of Relevant Studies 1 4 2 13 Certified Lower 0 0 1 50 Certified Higher 0 0 0 0 No Significant Difference 1 100 1 50 Mixed Results 0 0 0 0
Net Crop Revenue (Profit) Number of Relevant Studies 5 21 12 80 Certified Higher 0 0 5 42 Certified Lower 1 20 1 8

32
No Significant Difference 2 40 3 25 Mixed Results 2 40 3 25
Household Income Number of Relevant Studies 6 25 5 33 Certified Higher 0 0 3 60 Certified Lower 1 17 1 20 No Significant Difference 1 17 0 0 Mixed Results 4 66 1 20 a The percentages for each finding are out of studies evaluating relevant outcome.
Price is the most widely analyzed outcome, with most studies measuring the certified
contract price or premium, and few reporting average price across total volume sold. Certification
was associated with higher prices, relative to controls and conventional channels (market prices),
in 79 percent of independent research papers and 62.5 percent of commissioned works. Studies
reporting mixed results (positive, negative and no significant difference) used time-‐series or recall
data (Valkila 2008 and Nygren), or evaluated multiple crops and geographies (COSA 2014), where
more variance is expected. Those reporting no significant difference focused on certifications that
do not set prices (Blowfield and Dolan 2010, RA 2012) or used PSM to compare means (Fort and
Ruben 2008a, Ruben and Fort 2011). While there is strong evidence that certified sales involve
above-‐market prices, there is little data on how certified contract prices vary across time or
producers, or the magnitude at which average price across total output differs across certified and
non-‐certified groups.
Fewer studies, nine in all, assessed total crop output. Independent research reported mostly
mixed or equal outcomes under certification, while commissioned papers largely found that
certified farmers had higher output than controls. In four cases, differences in mean crop area
across certified producers and controls explain differences in output (Fort and Ruben 2008a,
Arnould et al. 2009, Riisgard et al. 2009, Kamau et al. 2010). Arnould et al. (2009) controlled for
crop area by using a regression with crop area and certification as explanatory variables, while Fort
33
and Ruben (2008a) used PSM with a probit that included crop land. However, Riisgard et al. (2009)
did not control for land, while Kamau et al. (2010) used PSM but did not state the probit, making it
uncertain if they accounted for land. Thus, the validity of these studies is uncertain. Beyond this,
given that certification could affect crop area, and that output is not a normalized measure that
enables an even comparison across different farms, it is not an ideal metric for cross-‐section data.
Yield is a better measure, and was the focus of about 44 percent of studies. Only one
independent study found that certification was correlated with higher yields (Pinto et al. 2014),
while three reported that it was associated with lower yields (Ruben and Zúñiga 2010, Beuchelt
and Zeller 2011, Jena et al. 2012). Commissioned studies have found more positive results. Across
all papers evaluating yield, about half found mixed or equal outcomes. Thus, there is little evidence
that certification is associated with higher yields.
Eleven studies evaluated crop revenue, with most using total farm income rather than a per
hectare measure. Three independent (Fromm and Dubón 2006, Arnould et al. 2009, Méndez et al.
2009) and two commissioned papers (Fort and Ruben 2008a, Riisgard et al. 2011) reported higher
revenue among certified producers than controls. One found that certification was associated with
lower revenue (Fort and Ruben 2008c), and the remainder reported mixed or equivalent outcomes
across groups. In eight studies of revenue, average farm size differed significantly across certified
producers and controls, or the nature of this difference was not reported. Three of these did not
control for farm size (Fromm and Dubón 2006, Riisgard et al. 2009, Méndez et al. 2010), while
Kamau et al. (2010) used PSM without specifying the probit, making it unclear if they accounted for
it. Given that farm size is a determinant of output, which drives total revenue, one cannot
confidently attribute observed differences to certification in these four studies. Overall, findings on
revenue have mixed conclusions and some limitations on validity.
Only three studies evaluated the relationship between certification and total farm
expenditure, with one reporting lower spending among certified producers than controls (Ingram
34
et al. 2014) and two finding mixed results (Beuchelt and Zeller 2011, Bennett et al. 2013). Seven
papers assessed individual expenditures such as labor or fertilizer, but such piecemeal findings
cannot be extrapolated to total spending.
Researchers have assessed net income using both crop-‐specific and household income.
Approximately 20 percent of independent and 80 percent of commissioned studies evaluated net
crop revenue, with independent works finding that certification was associated with negative,
mixed or equal outcomes relative to controls. Commissioned papers indicate that certified
producers had higher net incomes than controls 42 percent of the time, and mixed or equivalent
outcomes in all but one of the remaining cases. Household income was addressed in 25 percent of
independent and 33 percent of commissioned research, with the overall pattern of results being
similar to findings on net crop revenue. Most studies do not report the percentage of household
income that comes from certified crops, so it is not possible to determine the degree to which
certification status might modulate household income.
3.4 Conclusion
Overall, the literature review indicates that, for economic outcomes other than price, relative
differences between certified and non-‐certified farmers vary across time and geography. The
majority of studies found that certification was associated with higher prices, higher or equal total
output and revenue, lower or equal farm expenditure, and mixed outcomes for yield and profit.
Most research has focused on evaluating price, Fairtrade, and Latin American coffee farmers who
sell through specialty channels, particularly independent studies. Thus, there is a need for further
research in areas with less coverage, such as the RA and UTZ certifications, Africa, cacao, mass-‐
market trade, and economic measures beyond price. This thesis seeks to fill these gaps and
complement prior work by evaluating price, yield, revenue, farm expenditure and net income
among Ivorian farmers who produce bulk cacao under the FLO, RA and/or UTZ certifications.

35
An analysis of methodologies indicates that some results may be artifacts of designs and
analyses that had limited sampling diversity, used only multi-‐certified producers (e.g., FTO), did not
address selection bias, or did not control for factors such as organizational form or crop area. The
latter two issues are largely due to the fact that most studies used only unmatched comparisons of
group means, rather than PSM or regressions. This limits the validity and generalizability of the
findings. Additionally, many studies evaluating price also considered only the certified contract
price and not average price across total sales volume, such that results represent the potential of
certification rather than actual outcomes. Only one study (Ingram et al. 2014) considered the effect
of certification relative to buyer affiliation and participation in other training programs. Given that
both can affect agronomic and economic outcomes, one cannot confidently attribute observed
differences solely to certification, in analyses that do not consider such factors.
This thesis seeks to adopt methodological best practices from prior research by using
certified producers and controls that are both from co-‐ops only, gathering data from farmers in 35
co-‐ops in three regions, and using regressions to control for other relevant variables and selection
bias. Regressions also provide estimates of certification’s effects, enabling stronger conclusions
than the group means comparisons used in much of the existing literature. To permit comparisons
across producers of different farm sizes, this thesis uses normalized measures such as yield, and
revenue, expenditure and profit per hectare. It considers both average price across sales volume,
and certified contract prices, to understand current performance and best case outcomes.
36
Chapter 4. Côte d’Ivoire and the Cacao Sector
This chapter characterizes the context in which cacao farmers, buyers and certifiers operate, with a
focus on Côte d’Ivoire. It serves to establish an understanding of how certification might affect
cacao producers’ profits in general, and in Côte d’Ivoire, where fieldwork took place. Section 4.1
provides background on Côte d’Ivoire, with respect to factors that affect cacao smallholders’
agronomic and economic outcomes. Section 4.2 outlines value chain structure, and Section 4.3
characterizes cacao production and processing. Sections 4.4 through 4.6 discuss pricing, market
power, and supply and demand respectively. Sections 4.7 and 4.8 cover production constraints and
development efforts, and Section 4.9 presents conclusions. The contextual overview indicates that
certification operates in a dynamic environment with diverse elements that may constrain or
enhance producers’ outcomes. This provides insights into the potential of certification to impact
farmers’ profits in the Ivorian cacao sector, and identifies multiple factors that may explain relative
differences in economic outcomes between certified and non-‐certified producers.
4.1 Côte d’Ivoire
Côte d’Ivoire is located in West Africa, with Ghana to the east, Guinea and Liberia to the west, and
Mali and Burkina Faso to the north. It faces formidable economic, social and agricultural challenges
that constrain producers. Table 4.1 presents key socioeconomic and agricultural statistics.
Approximately 43 percent of its population lives below the poverty line (Hatløy et al. 2012). Its
Human Development Index (HDI) ranking is low, at 168 out of 187 countries (United Nations
Development Program 2013). Since 1980, Gross National Income (GNI) has decreased 36 percent,
though its HDI score, which is based on income, educational attainment and life expectancy, has
improved due to increases in the latter two components. Mean education is 4.2 years, at the
primary school level. Cacao is the top export crop, comprising 20 percent of GDP (Agritrade 2012).
It is the main source of income for about 75 percent of the rural population (Hatløy et. al 2012).
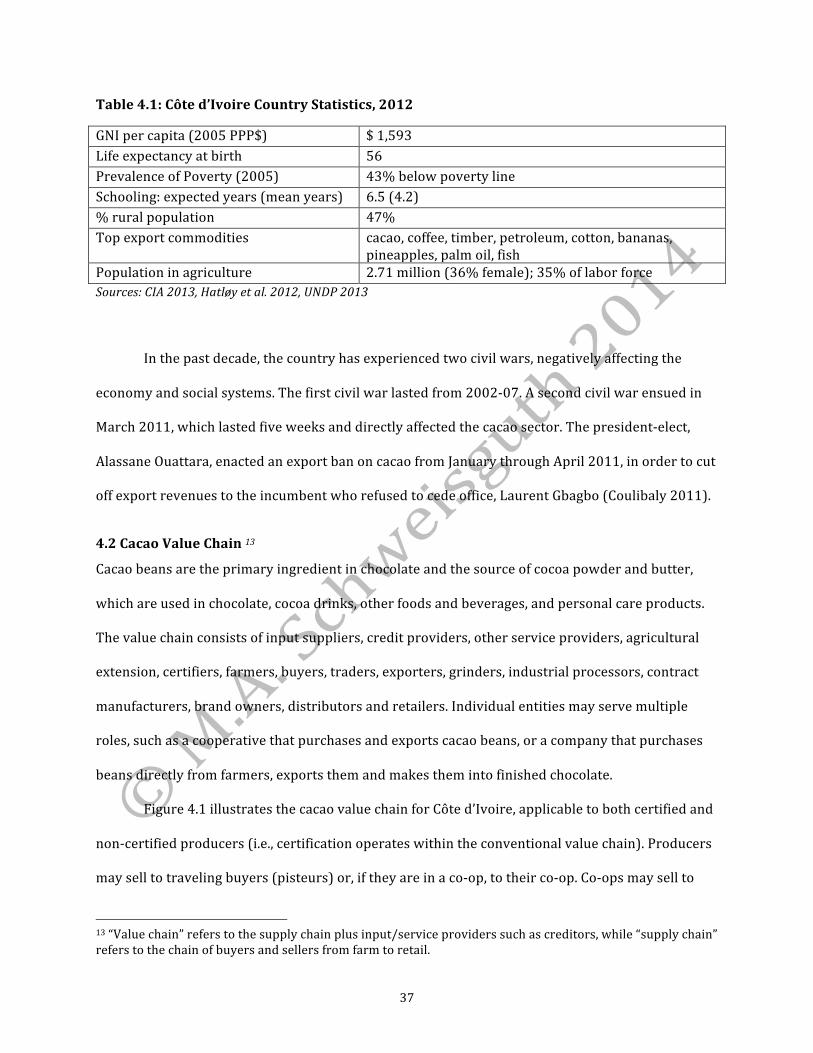
37
Table 4.1: Côte d’Ivoire Country Statistics, 2012
GNI per capita (2005 PPP$) $ 1,593 Life expectancy at birth 56 Prevalence of Poverty (2005) 43% below poverty line Schooling: expected years (mean years) 6.5 (4.2) % rural population 47% Top export commodities cacao, coffee, timber, petroleum, cotton, bananas,
pineapples, palm oil, fish Population in agriculture 2.71 million (36% female); 35% of labor force Sources: CIA 2013, Hatløy et al. 2012, UNDP 2013
In the past decade, the country has experienced two civil wars, negatively affecting the
economy and social systems. The first civil war lasted from 2002-‐07. A second civil war ensued in
March 2011, which lasted five weeks and directly affected the cacao sector. The president-‐elect,
Alassane Ouattara, enacted an export ban on cacao from January through April 2011, in order to cut
off export revenues to the incumbent who refused to cede office, Laurent Gbagbo (Coulibaly 2011).
4.2 Cacao Value Chain 13
Cacao beans are the primary ingredient in chocolate and the source of cocoa powder and butter,
which are used in chocolate, cocoa drinks, other foods and beverages, and personal care products.
The value chain consists of input suppliers, credit providers, other service providers, agricultural
extension, certifiers, farmers, buyers, traders, exporters, grinders, industrial processors, contract
manufacturers, brand owners, distributors and retailers. Individual entities may serve multiple
roles, such as a cooperative that purchases and exports cacao beans, or a company that purchases
beans directly from farmers, exports them and makes them into finished chocolate.
Figure 4.1 illustrates the cacao value chain for Côte d’Ivoire, applicable to both certified and
non-‐certified producers (i.e., certification operates within the conventional value chain). Producers
may sell to traveling buyers (pisteurs) or, if they are in a co-‐op, to their co-‐op. Co-‐ops may sell to
13 “Value chain” refers to the supply chain plus input/service providers such as creditors, while “supply chain” refers to the chain of buyers and sellers from farm to retail.

38
regional buyers (traitants), traders, exporters, grinders or brand owners. From that point, cacao
moves through the rest of the value chain to consumers. Certifiers work with producers, and
industry members from traders through brand owners, to provide certification, licensing and
related services.
Figure 4.1: Cacao Value Chain for Côte d’Ivoire Smallholders
Sources: Field surveys, Hatløy et al. 2012, TCC 2012
4.3 Cacao Production and Processing
Cacao beans grow in pods on the theobroma cacao tree, which grows within 10 degrees north and
south of the equator. There are three main types of cacao: criollo, forastero and trinitario (a cross of
the other two). Forastero, the lowest-‐valued type, predominates in West Africa. Trees reach peak
production around their tenth year, maintain this productivity level for about ten years, then
decline in yields (World Cocoa Foundation 2013).
39
The path from bean to bar, baked good or beauty product includes crop production, post-‐
harvest processing, crop marketing, roasting, grinding, semi-‐finished ingredients manufacturing,
finished goods production, brand marketing and retailing (UNCTAD 2008). The World Cocoa
Foundation (2013) estimates that there are five million cacao producers globally. The Tropical
Commodity Coalition (TCC 2012) reports that about 98% of farms are five hectares or less, with
these farms producing about 90% of global supply. The International Cocoa Organization (ICCO
Undated) estimates that Côte d’Ivoire has about 900,000 cacao producers, who are primarily
smallholders. Many farmers lack sufficient training on production and post-‐harvest processing, face
difficulties accessing inputs and credit, and have aging, low-‐yield trees, all of which constrain
economic outcomes (World Cocoa Foundation 2013).
Opoku-‐Ameyaw et al. (2010) characterize West African production. Farmers primarily grow
traditional varietals that require shade, though some cultivate higher-‐yielding sun-‐grown hybrids.
Farmers should prune, weed and fertilize trees to maximize yield. They must manage pests that can
cause crop losses of up to 30 percent, particularly Black Pod, a fungus, mirids, an insect, and cocoa
swollen shoot virus. The main harvest lasts from October to March, with a smaller harvest from
May to August. Fresh cacao beans may be fermented then dried, or washed and dried without
fermentation. Producers may ferment and dry beans, or sell wet beans or pods to buyers.
Saltini, Akkerman and Frosch (2013) characterize post-‐harvest processing. Fermentation is
one of the key determinants of flavor and must be done carefully. Beans, and the pulp surrounding
them, are placed in a pile or container, covered, and turned every day or two to ensure an even
fermentation. Natural yeasts digest sugars in the pulp, causing chemical reactions that turn the
bitter, purple beans into brown, chocolate flavored ones in about three to five days. Producers dry
beans for up to 12 days, ideally to 7.5 percent or less moisture. Sun drying is preferred for flavor,
but rainy weather may necessitate wood-‐ or gas-‐fired driers, which can mar flavor. Buyers evaluate
physical quality to determine whether to reject any beans, and what price they will pay. They
40
inspect wet beans for germinated beans and foreign matter, and cut dry beans to determine the
percentage of properly fermented (if applicable) and defective beans (Opoku-‐Ameyaw et al. 2010).
The ICCO (Undated) outlines processing. Beans are cleaned, roasted, cracked, and
winnowed to separate the nibs (cacao bean pieces) and shell. Processors then grind the nibs into
liquor. Cacao liquor may be pressed into cacao butter and powder, or refined and conched (mixed)
to make couverture (industrial chocolate), which is tempered and formed into eating chocolate.
Most processing, and almost all finished goods manufacturing, is done by multinationals in
consuming countries (UNCTAD 2008). However, Côte d’Ivoire is the world’s second largest grinder,
grinding 35 percent of its production and representing 11.4% of global grindings (ICCO 2014b).
4.4 Cacao Price Determination
World prices for the “bulk” cacao that predominates in West Africa are based on two futures
markets, in New York (ICE) and London (NYSE Liffe) (World Cocoa Foundation 2014a). Figure 4.2
charts nominal world prices for bulk, fermented cacao from 2002-‐2014, which are marked by
cyclical increases and decreases of varied magnitudes. Physical quality and varietal determine the
actual export prices that a producer or country can command. For example, Ghana earns a higher
premium over world prices than Côte d’Ivoire due to higher physical quality standards (Agritrade
2012). In cases where export prices are lower than the world price, certifications that set prices,
such as Fairtrade, would help groups garner above-‐market prices for output sold at certified terms.
Farm gate prices and margins vary within and across countries. According to the ICCO
(2012), from 2002-‐11, among West African producers, Ghana received the highest percentage of
the world price, followed by Cameroon and Côte d’Ivoire. Côte d’Ivoire sets farm gate price floors
through its cacao and coffee board, Le Conseil du Café-‐Cacao (CCC) (Agritrade 2012). This is rare in
the sector and a recent development. The CCC was formed in 2012 as part of cacao sector reform
enacted to satisfy the terms of IMF debt relief. The country had a cacao board with price controls
from 1960 to 1999, when it scuttled it as part of liberalization and structural adjustment. To date,

41
farm gate floor prices have amounted to 60 percent of the export prices that the CCC negotiates.
Côte d’Ivoire also taxes cacao exports, placing an added economic burden on producers. It has
Figure 4.2: World Cacao Prices, Yearly Average, 1993 to 2014
Data source: ICCO 2014a
agreed to reduce and cap these taxes as part of its cacao sector reform (Hatløy et. al 2012). Ghana
also sets floor prices, a longstanding practice, as it did not eliminate its cacao board or pricing
regulations when it went through structural adjustment (Agritrade 2012).
4.5 Market Power
Within countries, there is little consolidation among farmers. Hatløy, et al. (2012) report that about
15 percent of Ivorian producers are in formal organizations such as co-‐ops. Fortson, Murray and
Velyvis (2011) found that co-‐op membership was 17 percent in Côte d’Ivoire, 14 percent in Ghana,
21 percent in Nigeria and 33 percent in Cameroon. At the country level, the top three producers,
Côte d’Ivoire, Ghana and Indonesia, represented 69 percent of global production in 2012-‐13 (ICCO
0
500
1000
1500
2000
2500
3000
3500
Average Monthy ICCO Cacao Price
42
2014b). West Africa dominates as a region, with Côte d’Ivoire, Ghana, Nigeria and Cameroon
providing 70 percent of supply in 2012-‐13. Côte d’Ivoire accounted for 36 percent of global output
and Ghana provided 21 percent. Both countries have export monopolies, making them oligopolists.
At the level of traders, three multinationals—Cargill, ADM and Olam—and one local trader,
Ghana’s state-‐owned Produce Buying Company, held 45 percent of the West African market in the
2011-‐12 season (George 2012). Consolidation is greater in Côte d’Ivoire, with the top three traders,
Cargill, ADM and Barry Callebaut, controlling 50% of the market. The largest Ivoirian exporter is
Saf-‐Cacao with a 7 percent share. Ecom acquired Armajaro’s commodity trading business in 2013,
making Ecom the third largest trader in West Africa and the fourth largest in Côte d’Ivoire, per
2011-‐12 figures (ICCO 2012, Almeida 2013).
Processing is similarly consolidated, with Barry Callebaut, Cargill and ADM controlling
approximately 46 percent of grindings; and Barry Callebaut, Cargill and Blommer representing
about 68 percent of industrial chocolate (UNCTAD 2008, Barry Callebaut 2012). In September
2014, Cargill announced its acquisition of ADM’s chocolate business, consolidating the market
further (Bunge & Josephs 2014). Concentration among brand owners is less intense. As of 2012, the
top five brand owners, Kraft, Mars, Nestlé, Ferrero and the Hershey Company, controlled 35% of
the market, with the top three holding 27% (George 2012). Thus, producers face oligopsonies in
trading and processing, which have intensified over time due to acquisitions among major firms.
4.6 Supply and Demand
The International Cocoa Organization (ICCO 2014b) estimates 2013-‐14 crop production at 4.35
million MT, and grindings at 4.26 million MT. Figure 4.3 illustrates production and grindings from
2005 through 2014 (ICCO 2014b). Over the past decade, production and grindings have increased
overall, with production showing more volatility than grindings. Grindings have fallen below crop
output during five of the last ten years, requiring the industry to draw on stocks.
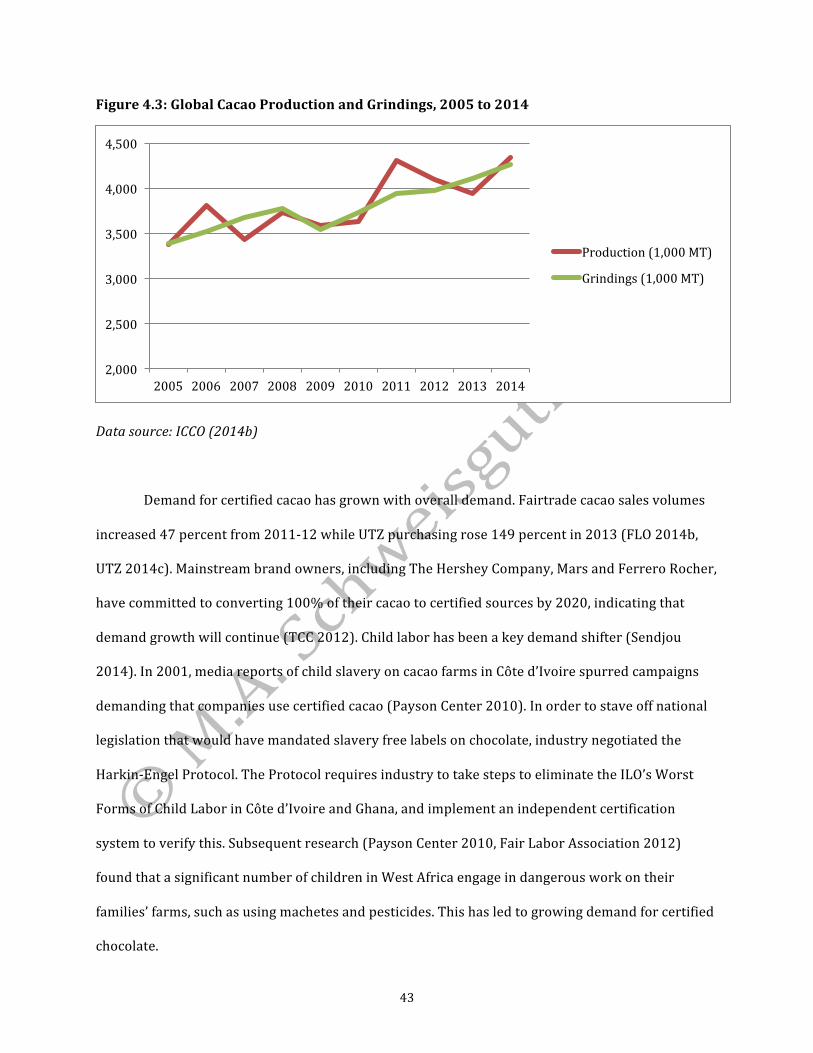
43
Figure 4.3: Global Cacao Production and Grindings, 2005 to 2014
Data source: ICCO (2014b)
Demand for certified cacao has grown with overall demand. Fairtrade cacao sales volumes
increased 47 percent from 2011-‐12 while UTZ purchasing rose 149 percent in 2013 (FLO 2014b,
UTZ 2014c). Mainstream brand owners, including The Hershey Company, Mars and Ferrero Rocher,
have committed to converting 100% of their cacao to certified sources by 2020, indicating that
demand growth will continue (TCC 2012). Child labor has been a key demand shifter (Sendjou
2014). In 2001, media reports of child slavery on cacao farms in Côte d’Ivoire spurred campaigns
demanding that companies use certified cacao (Payson Center 2010). In order to stave off national
legislation that would have mandated slavery free labels on chocolate, industry negotiated the
Harkin-‐Engel Protocol. The Protocol requires industry to take steps to eliminate the ILO’s Worst
Forms of Child Labor in Côte d’Ivoire and Ghana, and implement an independent certification
system to verify this. Subsequent research (Payson Center 2010, Fair Labor Association 2012)
found that a significant number of children in West Africa engage in dangerous work on their
families’ farms, such as using machetes and pesticides. This has led to growing demand for certified
chocolate.
2,000
2,500
3,000
3,500
4,000
4,500
2005 2006 2007 2008 2009 2010 2011 2012 2013 2014
Production (1,000 MT)
Grindings (1,000 MT)

44
At the same time, consumers have shown increasing concerns about the environmental
impacts of products they purchase, and the incomes of farmers and workers in supply chains,
boosting demand for goods with the target certifications (Nielsen 2014). The sector has come to see
certification as a way to improve farmer livelihoods and address the projected supply deficit, by
training farmers on yield-‐enhancing practices, providing higher prices that incent farmers to
implement these, and monitoring farm management and outcomes (TCC 2012, Major 2014). More
stringent food safety regulations have increased the appeal of the traceability, which certification
provides. Thus, certification has moved from a niche concept to a mainstream business strategy.
4.7 Production Constraints
Producers face diverse challenges, many of which go beyond issues that certification addresses. It is
important to consider these, as they stand to limit the potential of certification to affect producer
profits. Hatløy et al. (2012) consulted a broad range of stakeholders to identify key production and
marketing constraints in the Ivorian cacao sector. These include subsistence incomes, lack of access
to affordable credit, low physical quality and poor yields. Average yields in Côte d’Ivoire range from
200 to 500 kg per hectare (ha), far below the yields of one to two MT per ha seen in Indonesia.
Hatløy et al. (2012) attributed low yields to aging tree stock, poor soil fertility and insufficient pest
control, which result from high input costs, insufficient credit, and lack of training (World Cocoa
Foundation 2013). Per Fortson et al. (2011), input use is particularly low in Côte d’Ivoire. They
found that 11 percent of Ivorian farmers used fertilizer and 54 percent used pesticide (insecticide
and fungicide). In contrast, 44 percent of farmers in Ghana used fertilizer, while 77 to 89 percent of
producers in Cameroon, Ghana and Nigeria used pesticide.
Hatløy et al. (2012) also note that the low prevalence of cooperatives makes service
provision costly, and leaves producers with little bargaining power. Where co-‐ops exist, they may
have poor management and governance, which effectively reduce member returns. They also may
pay members on a delayed schedule, leaving farmers to sell their cacao to intermediaries at a lower

45
price if they need immediate payment. All of the target certifications fill gaps in training on IPM and
fertility improvement. UTZ also addresses productivity and physical quality improvement, while
Fairtrade requires buyers to provide pre-‐financing that helps co-‐ops purchase members’ output.
However, none of the certifications addresses input costs or farm-‐level credit access.
Hatløy et al. (2012) also identified social issues that can constrain farm outcomes, including
lack of access to water, education and sanitation; poor roads, malaria, and HIV/AIDS. Ill health can
reduce labor capacity, while poor roads add transport costs. Low levels of education leave farmers
without the skills to manage farm finances, use market information and ensure that buyers are not
cheating them (e.g., with faulty scales, or calculations). Certification involves financial auditing that
addresses some forms of cheating. It does not address water, sanitation, public education,
infrastructure, health or input costs, leaving constraints that may dampen certification impacts.
4.8 Cacao Development Projects
In order to address the constraints that affect cacao farmers and the sector, governments, NGOs,
and industry have implemented diverse development initiatives. Where certification and
development efforts co-‐occur, both shape producer outcomes. Thus, these efforts must be
considered when evaluating the effects of certification. Table 4.2 outlines programs implemented
in Côte d’Ivoire from 2004, when certification began, through 2013, when fieldwork occurred. It
identifies activities that overlap with certification, or that affect price, yield or expenditure.
There are several similarities across the initiatives. Apart from Côte d’Ivoire’s extension
(Hatløy 2012), all are led by industry, or by NGOs with industry support. All are diversified in scope,
except for the IDH Fertilizer Initiative (IDH, Undated). Most programs reach only a small proportion
of Côte d’Ivoire’s farmers, though the World Cocoa Foundation (WCF 2014b) and Mars (Undated)
seek to engage over 10 percent, while IDH aims to reach more than 20 percent. Cargill (2014) and
Nestlé (Undated) provide free improved planting material, and Cargill also provides inputs, which
could reduce expenditures and boost yields.
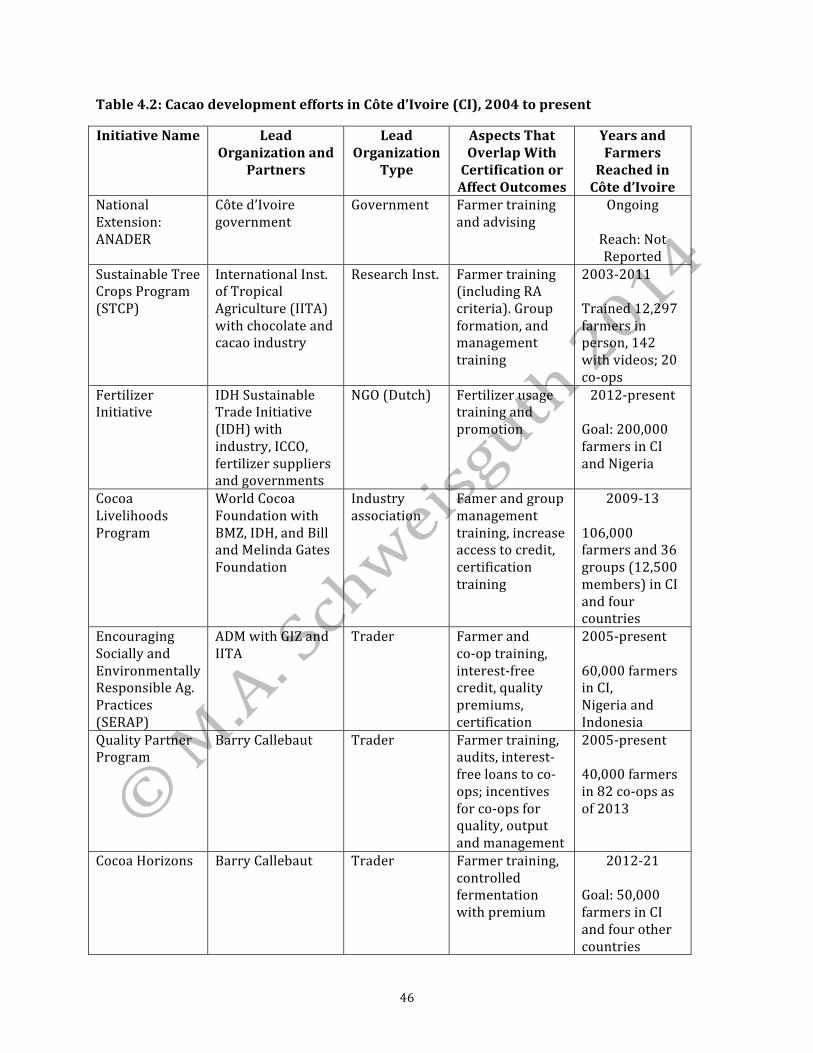
46
Table 4.2: Cacao development efforts in Côte d’Ivoire (CI), 2004 to present
Initiative Name Lead Organization and
Partners
Lead Organization
Type
Aspects That Overlap With Certification or Affect Outcomes
Years and Farmers Reached in Côte d’Ivoire
National Extension: ANADER
Côte d’Ivoire government
Government Farmer training and advising
Ongoing
Reach: Not Reported
Sustainable Tree Crops Program (STCP)
International Inst. of Tropical Agriculture (IITA) with chocolate and cacao industry
Research Inst. Farmer training (including RA criteria). Group formation, and management training
2003-‐2011 Trained 12,297 farmers in person, 142 with videos; 20 co-‐ops
Fertilizer Initiative
IDH Sustainable Trade Initiative (IDH) with industry, ICCO, fertilizer suppliers and governments
NGO (Dutch) Fertilizer usage training and promotion
2012-‐present Goal: 200,000 farmers in CI and Nigeria
Cocoa Livelihoods Program
World Cocoa Foundation with BMZ, IDH, and Bill and Melinda Gates Foundation
Industry association
Famer and group management training, increase access to credit, certification training
2009-‐13 106,000 farmers and 36 groups (12,500 members) in CI and four countries
Encouraging Socially and Environmentally Responsible Ag. Practices (SERAP)
ADM with GIZ and IITA
Trader Farmer and co-‐op training, interest-‐free credit, quality premiums, certification
2005-‐present 60,000 farmers in CI, Nigeria and Indonesia
Quality Partner Program
Barry Callebaut Trader Farmer training, audits, interest-‐free loans to co-‐ops; incentives for co-‐ops for quality, output and management
2005-‐present 40,000 farmers in 82 co-‐ops as of 2013
Cocoa Horizons Barry Callebaut Trader Farmer training, controlled fermentation with premium
2012-‐21 Goal: 50,000 farmers in CI and four other countries

47
Cocoa Promise, Co-‐op Academy
Cargill with CCC, IDH, CARE
Trader Farmer and extension training, input and seedling provision, co-‐op capacity building, certification
2012-‐present 50,395 farmers trained and certified; supporting 240 farmer groups
iMPACT (Mars Partnership for African Cocoa Communities of Tomorrow)
Mars with Africare, GIZ, IFESH, IITA, RA, Int. Cocoa Initiative
Brand owner Farmer training, group capacity building
2007-‐11 Reached 40,000 people in CI & Ghana
Vision for Change
Mars with ICRAF Brand owner Farmer training, farm rehabilitation, certification
2010-‐20 Goal: 150,000 farmers
Market-‐Oriented Promotion of Sustainable Certified Cocoa Production
Mondelez with RA, GIZ, USAID, IITA, Armajaro, ANADER
Brand owner Co-‐op capacity building; RA certification training
2005-‐09 2,039 farmers in 32 co-‐ops
Cocoa Plan Nestlé Brand owner Farmer training, seedling provision, Fairtrade & UTZ certification, computers and bikes for co-‐ops
28,000 from 60 co-‐ops
Sources: See text, and GIZ 2011
Most programs include a strong focus on training farmers to use good agricultural practices
that improve yield and physical quality, filling the gap in extension and farmer training. Producer
group formation and capacity building, such as record keeping and management training, are
included in efforts implemented by the IITA (2009), Barry Callebaut (2014), Cargill (2014),
Mondelez (GTZ 2008) and Nestlé (Undated). ADM (2011) and Barry Callebaut also provide
premiums for physical quality and volume. All of these activities overlap with certification.
Certification is also a component of initiatives run by the World Cocoa Foundation (WCF 2014b),
IITA, ADM, Cargill, Mars, Mondelez and Nestlé. Most programs also include social development
activities that are not stated in Table 4.2, as they do not overlap with certification or affect

48
economic outcomes directly. However, by addressing constraints in the enabling environment, such
efforts indirectly affect producers’ outcomes, and thus modulate the potential impacts of
certification.
4.9 Conclusion
A review of the cacao sector, and Côte d’Ivoire’s industry in particular, indicates that producers and
certifiers operate in a complex environment that is marked by heterogeneity across producers and
time. Farmers face diverse economic, agronomic and social challenges that can limit the potential
effects of certification. They may market independently and/or through co-‐ops, and co-‐ops sell to
different sets of buyers, resulting in price variation. Over time, market prices have shown volatility,
and market power and supply/demand balance have shifted. The Ivorian government regulates
internal markets, limiting our ability to generalize research findings on certification outcomes in
other countries that do not set prices.
Certified demand has grown over time but so, too, has supply, making it uncertain what
percentage of output a given group would sell under certified terms. Farmers may be involved in
various cacao development initiatives that seek to rectify the same constraints that certification
targets, making it difficult to determine the relative effects of certification. Such efforts also aim to
improve social problems that constrain outcomes, modulating the enabling environment.
In order to evaluate the effects of certification in a given context, it is essential to undertake
field research using non-‐certified controls that are otherwise comparable to certified producers,
and analyze the data using techniques that address selection bias and account for the effects of
other relevant variables. The next chapter will present the results of producer surveys conducted in
Côte d’Ivoire, designed to fill this need.

49
Chapter 5. Field Research
Given that the theoretical evaluation and the literature review both indicate that the effects of
certification on smallholders’ net incomes vary, I undertook fieldwork on in Côte d’Ivoire to explore
this question with respect to mass-‐market cacao. Sections 5.1 through 5.3 outline the design,
fieldwork, and data analyses respectively. Section 5.4 presents the results and Section 5.5 discusses
overall conclusions.
5.1 Design and Sample
The study used a cross-‐section design with 301 cacao farmers in 35 co-‐ops in Côte d’Ivoire. Table
5.1 shows the sample distribution. Farmers include 76 controls and 225 certified producers (125
single-‐certified, 75 dual-‐certified, and 25 triple-‐certified). Among co-‐ops, 12 are controls and 23 are
certified (15 single-‐certified, seven dual-‐certified and one triple-‐certified). Using only single-‐
certified farmers would have been ideal. However, due to the prevalence of multi-‐certified co-‐ops,
and the small number of Fairtrade (FLO) co-‐ops in the target regions, it was not possible to recruit
any producers with only FLO, or only Rainforest Alliance (RA) in one region.
The World Agroforestry Center partnered on fieldwork and advised on sampling locations.
We excluded border areas for security, and the southeast, where Stemler (2012) found the soils to
be highly acidic (pH < 5.5) in contrast to other cacao regions. High acidity limits phosphorous
uptake, reducing yield. We chose three departments (regions): Soubré in the west, Divo in the
center, and Adzopé in the east. In each department, fieldwork took place in four geographically
dispersed sous-‐preféts, selected based on the presence of certified co-‐ops. Figure 5.1 shows the
location of each region and select sous-‐preféts.
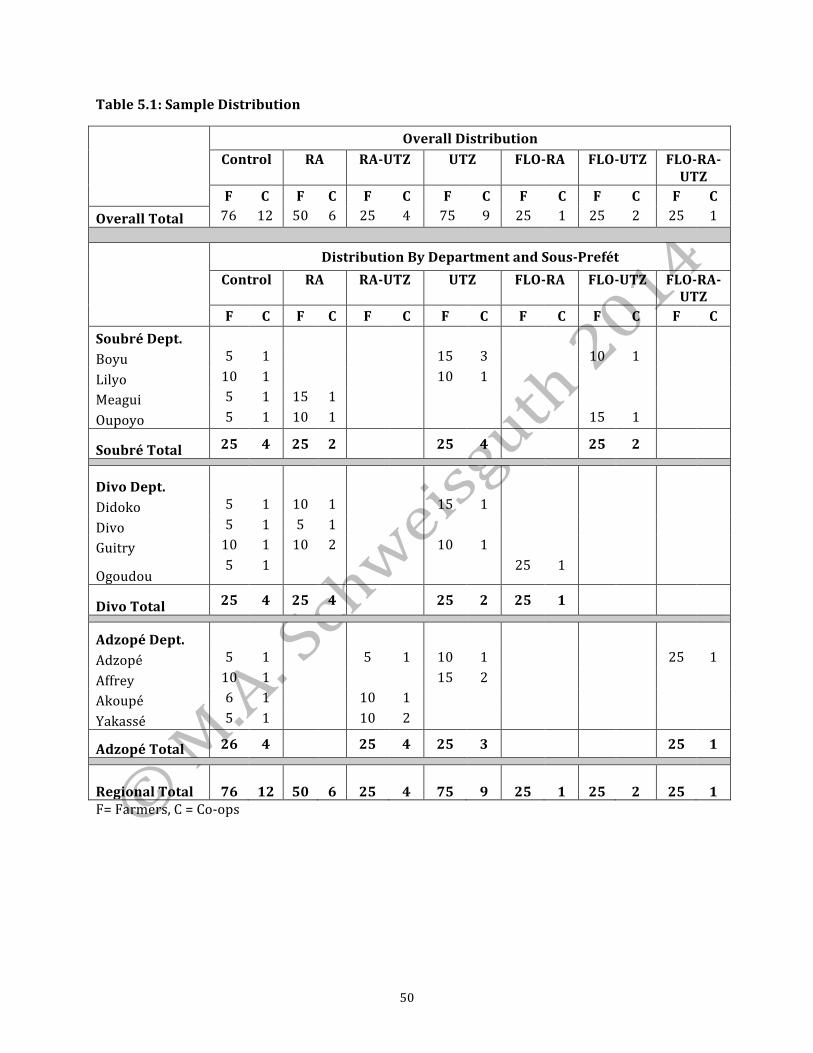
50
Table 5.1: Sample Distribution
Overall Distribution Control RA RA-‐UTZ UTZ FLO-‐RA FLO-‐UTZ FLO-‐RA-‐
UTZ F C F C F C F C F C F C F C
Overall Total 76 12 50 6 25 4 75 9 25 1 25 2 25 1
Distribution By Department and Sous-‐Prefét Control RA RA-‐UTZ UTZ FLO-‐RA FLO-‐UTZ FLO-‐RA-‐
UTZ F C F C F C F C F C F C F C Soubré Dept. Boyu 5 1 15 3 10 1 Lilyo 10 1 10 1 Meagui 5 1 15 1 Oupoyo 5 1 10 1 15 1
Soubré Total 25 4 25 2 25 4 25 2
Divo Dept.
Didoko 5 1 10 1 15 1 Divo 5 1 5 1 Guitry 10 1 10 2 10 1
Ogoudou 5 1 25 1
Divo Total 25 4 25 4 25 2 25 1
Adzopé Dept.
Adzopé 5 1 5 1 10 1 25 1 Affrey 10 1 15 2 Akoupé 6 1 10 1 Yakassé 5 1 10 2
Adzopé Total 26 4 25 4 25 3 25 1
Regional Total 76 12 50 6 25 4 75 9 25 1 25 2 25 1 F= Farmers, C = Co-‐ops

51
Figure 5.1 Research Sites
Source: Created in Google Earth with data from GPS watch.
Lists from certifiers, and ANADER and the CCC, served to identify certified and control
co-‐ops respectively. I randomly selected co-‐ops for recruitment using Microsoft Excel to randomize
co-‐ops in each sous-‐prefét. Each sous-‐prefét had at least one certified and one control co-‐op. Due to
the geographic distribution of certified co-‐ops it was not possible to recruit a co-‐op with each
certification in each sous-‐prefét. Additionally, each multi-‐certified type (FLO-‐RA, FLO-‐UTZ,
FLO-‐RA-‐UTZ, and RA-‐UTZ) is in only one department, and there are only one or two FLO co-‐ops per
type. As such, multi-‐certification is confounded with location for all multi-‐certifications, and co-‐op
for FLO types.

52
5.2 Data Collection and Survey Instruments
Fieldwork took place in August and September 2013. It consisted of structured farmer surveys and
semi-‐structured co-‐op management interviews covering the 2012-‐13 cacao season (October to
September). Six enumerators, and the field coordinator in a few cases, conducted the surveys and
interviews. They randomly selected farmers to survey at each village or co-‐op facility. Training and
pilots preceded data collection. I also interviewed representatives from certifiers, traders and
brand owners to obtain background information.
Survey and interview instruments are in Appendix A. Producer surveys covered socioeconomic
and farm characteristics, cacao farming experience, farm management practices, training,
extension, markets, certified crop volume sold, certified crop revenue, price premiums received,
family labor, farm expenditures, co-‐op membership payments, perceptions on livelihoods factors,
and what farmers expected and received from certification. Questions on farm management, sales
volume and revenue, expenditures, and livelihoods perceptions also asked about change over the
past four years, and since certification. Co-‐op interviews covered membership size, founding, prices
and premiums received and paid to members, volumes sold at a premium, projects funded with
buyer funds and premiums, and member fees. Certified co-‐ops were also asked to state when and
why they became certified, certification costs and certified sales.
Certifier interviews addressed the certification process and costs, training and support that
certifiers provide to farmers, premium amounts and usage, certified sales volumes, and what
outcomes certifiers measure and observe. Trader and brand owner interviews covered reasons for
purchasing certified cacao, expected and observed outcomes, if and how they select producers and
groups for certification, challenges in certifying farmers, support they give farmers and groups, key
needs certification doesn’t address, and premium payments and allocation.
53
5.3 Data Analyses
Data were entered into Excel, double-‐checked for accuracy, screened for outliers, and analyzed in
Stata. Two outliers were removed, one each for extremely high or low average prices. Another
subject did not report cacao growing area, limiting their useable data. This left 298 subjects in all
analyses, and 299 for most group means tests. Analyses focused on evaluating differences between
certified producers and controls, and characterizing the effects of certification on farm gate price,
yield, and variable cash expenditure per hectare (ha).
Farm gate price is defined as average price across volume sold, calculated as total revenue
divided by total volume sold. Yield is calculated as total output divided by bearing cacao area, which
contains trees aged four or more years.14 Variable expenditure includes hired labor, agrochemicals,
planting material, pesticide sprayer rental, and fuel for machinery and cacao transport. It excludes
family labor opportunity cost. It is calculated as total variable expenditure divided by total cacao ha.
5.3.1 Differences in Means, and Certification Effects on Price
T-‐tests served to evaluate differences between certified and control group means for
socioeconomic, agronomic and economic measures. Analyses compared differences between
controls and certified producers as a group, and by certification type, for the overall sample and
within each region. T-‐tests for equal or unequal variance were used as appropriate, per variance
ratio tests. T-‐tests were sufficient to assess the effects of certification on farm gate price, as this
requires a simple comparison of prices across producers who sell any portion of their crop via
certified channels and those who do not.
14 Bearing cacao area was determined per survey data on cacao areas of different ages. I chose a four-‐year age cutoff per data on the use of improved varietals (which can bear at age three) versus traditional varietals (which can bear at age four). Only two producers with trees aged three years used improved varietals, but it is uncertain whether they used them exclusively. To be conservative, I treated them as nonbearing. Bearing area differed from total cacao area for 26 producers.
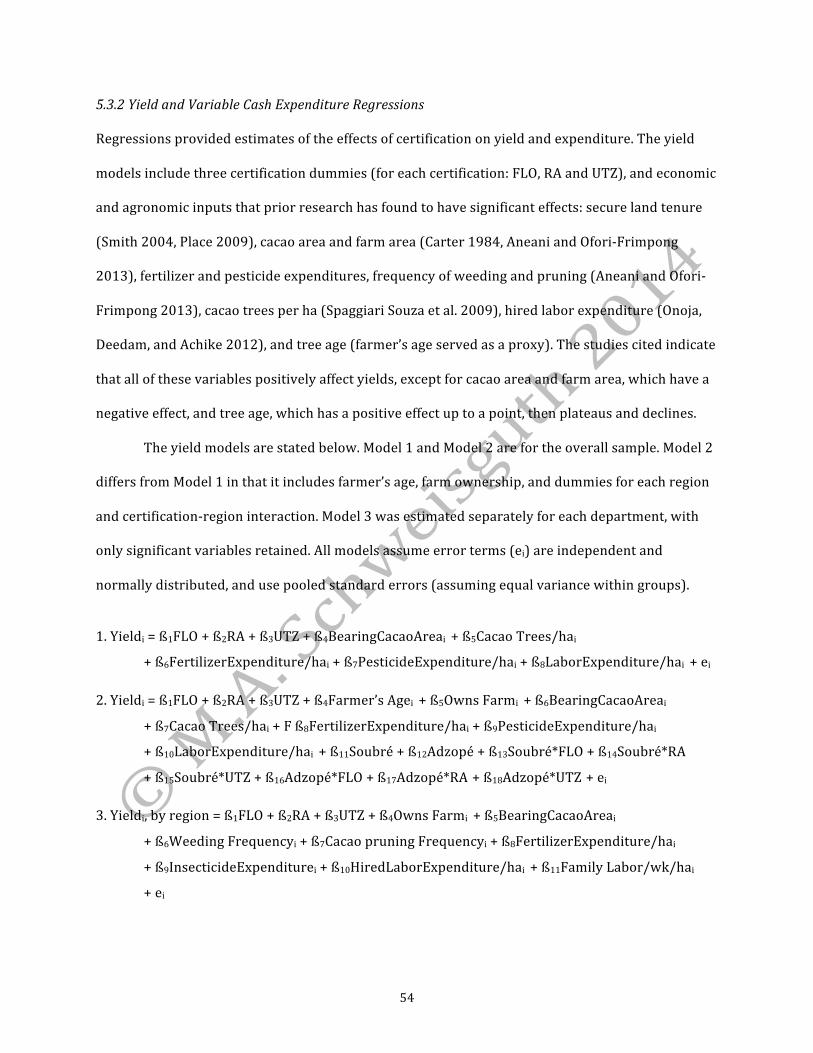
54
5.3.2 Yield and Variable Cash Expenditure Regressions
Regressions provided estimates of the effects of certification on yield and expenditure. The yield
models include three certification dummies (for each certification: FLO, RA and UTZ), and economic
and agronomic inputs that prior research has found to have significant effects: secure land tenure
(Smith 2004, Place 2009), cacao area and farm area (Carter 1984, Aneani and Ofori-‐Frimpong
2013), fertilizer and pesticide expenditures, frequency of weeding and pruning (Aneani and Ofori-‐
Frimpong 2013), cacao trees per ha (Spaggiari Souza et al. 2009), hired labor expenditure (Onoja,
Deedam, and Achike 2012), and tree age (farmer’s age served as a proxy). The studies cited indicate
that all of these variables positively affect yields, except for cacao area and farm area, which have a
negative effect, and tree age, which has a positive effect up to a point, then plateaus and declines.
The yield models are stated below. Model 1 and Model 2 are for the overall sample. Model 2
differs from Model 1 in that it includes farmer’s age, farm ownership, and dummies for each region
and certification-‐region interaction. Model 3 was estimated separately for each department, with
only significant variables retained. All models assume error terms (ei) are independent and
normally distributed, and use pooled standard errors (assuming equal variance within groups).
1. Yieldi = ß1FLO + ß2RA + ß3UTZ + ß4BearingCacaoAreai + ß5Cacao Trees/hai
+ ß6FertilizerExpenditure/hai + ß7PesticideExpenditure/hai + ß8LaborExpenditure/hai + ei 2. Yieldi = ß1FLO + ß2RA + ß3UTZ + ß4Farmer’s Agei + ß5Owns Farmi + ß6BearingCacaoAreai
+ ß7Cacao Trees/hai + F ß8FertilizerExpenditure/hai + ß9PesticideExpenditure/hai
+ ß10LaborExpenditure/hai + ß11Soubré + ß12Adzopé + ß13Soubré*FLO + ß14Soubré*RA
+ ß15Soubré*UTZ + ß16Adzopé*FLO + ß17Adzopé*RA + ß18Adzopé*UTZ + ei 3. Yieldi, by region = ß1FLO + ß2RA + ß3UTZ + ß4Owns Farmi + ß5BearingCacaoAreai
+ ß6Weeding Frequencyi + ß7Cacao pruning Frequencyi + ß8FertilizerExpenditure/hai
+ ß9InsecticideExpenditurei + ß10HiredLaborExpenditure/hai + ß11Family Labor/wk/hai
+ ei

55
Two measures quantified the effect of certification on yield:
1. Total intercept shift. This represents the effect of certification without considering other
variables that affect yield, and that might also be impacted by certification. It reflects the
assumption that we would not attribute group differences on other explanatory variables to
certification. It is the sum of dummies for each certification type. For example, for FLO-‐UTZ, the
total intercept shift is: ß1+ ß3.
2. Total effect of certification: This estimates how certification may affect yields through both the
intercept shift and the other explanatory variables. It assumes that certification explains the entire
difference between certified producers and controls, for every explanatory variable. Formally, this
is known as the Oaxaca decomposition (O’Donnell et al 2007). It is the sum of certification dummies
for each certification type, and the coefficient for each additional explanatory variable multiplied by
the difference in certified and control means for that variable. For example, for FLO-‐UTZ, the total
effect of certification is: ß1+ ß3 + ∑j=1..N [ßj * (certified meanFLO-‐UTZ – control mean)]
The variable expenditure regression models include three certification dummies (FLO, RA
and UTZ); and economic and agronomic variables that prior research has found to affect
expenditure: household assets, family labor supply, farming knowledge and farm size (Marenya and
Barrett 2007, Adimassu, Kessler and Hengsdijk 2012, Danso-‐Abbeam, Setsoafia and Ansah 2014).15
They also include cacao trees per ha and frequency of input applications, which would logically
increase labor and input demands; and family labor, as this was not included in the expenditure
variable and must be accounted for. As with yield, analyses included models with regional
dummies, and calculations of the total intercept shift, and total effect of certification.
15 The studies cited used household size or adults in the household to represent labor supply. Secure land tenure has also been found to have a significant effect (Smith 2004, Fenske 2011), though it was not significant in my models.

56
The expenditure models are below. Models 1A and 1B use Total Farm Size, where Models
2A and 2B use household size. The “A” models do not include family labor, while the “B” models do.
All models assume errors (ei) are independent and normally distributed, and use pooled standard
errors (assuming equal variance within groups).
1A. Variable Cash Expenditure/cacao hai = ß1FLO + ß2RA + ß3UTZ + ß4TotalFarmSizei
+ ß5Cacao Trees/hai + ß6Training Sessions/yri + ß7FertilizerApplications/yri
+ ß8FungicideApplications/yri + ei
1B. Variable Cash Expenditure/cacao hai = ß1FLO + ß2RA + ß3UTZ + ß4TotalFarmSizei
+ ß5Cacao Trees/hai + ß6Training Sessions/yri + ß7FertilizerApplications/yri
+ ß8FungicideApplications/yri + ß9Family Labor/wk/hai + ei
2A. Variable Cash Expenditure/cacao hai = ß1FLO + ß2RA + ß3UTZ + ß4HouseholdSizei
+ ß5Cacao Trees/hai + ß6Training Sessions/yri + ß7FertilizerApplications/yri
+ ß8FungicideApplications/yri + ei
2B. Variable Cash Expenditure/cacao ha = ß1FLO + ß2RA + ß3UTZ + ß4HouseholdSizei + ß5Cacao
Trees/ha i + ß6Training Sessions/yri + ß7FertilizerApplications/yri +
ß8FungicideApplications/yri + ß9Family Labor/wk/hai + ei
5.4 Results
Table 5.2 presents overall descriptive statistics. Most variables have wide variation. Some have
particularly large ranges that might be taken as signs of outliers or errors, such as pruning and
input expenditures. However, the upper bounds for fertilizer and pesticide are not aberrations and
represent the recommended quantities: nine bags of fertilizer and two liters of insecticide per ha
(ICRAF 2013, survey data). For pruning, the upper bound applies to over ten percent of the sample,
and represents less efficient pruning (e.g., pruning is done each time the producer visits the farm).
The means align with sector data (Fortson et al. 2011, Hatløy et al. 2012), indicating that the
sample is typical of Ivorian producers. Farmers are almost all male with a mean age of 46. On
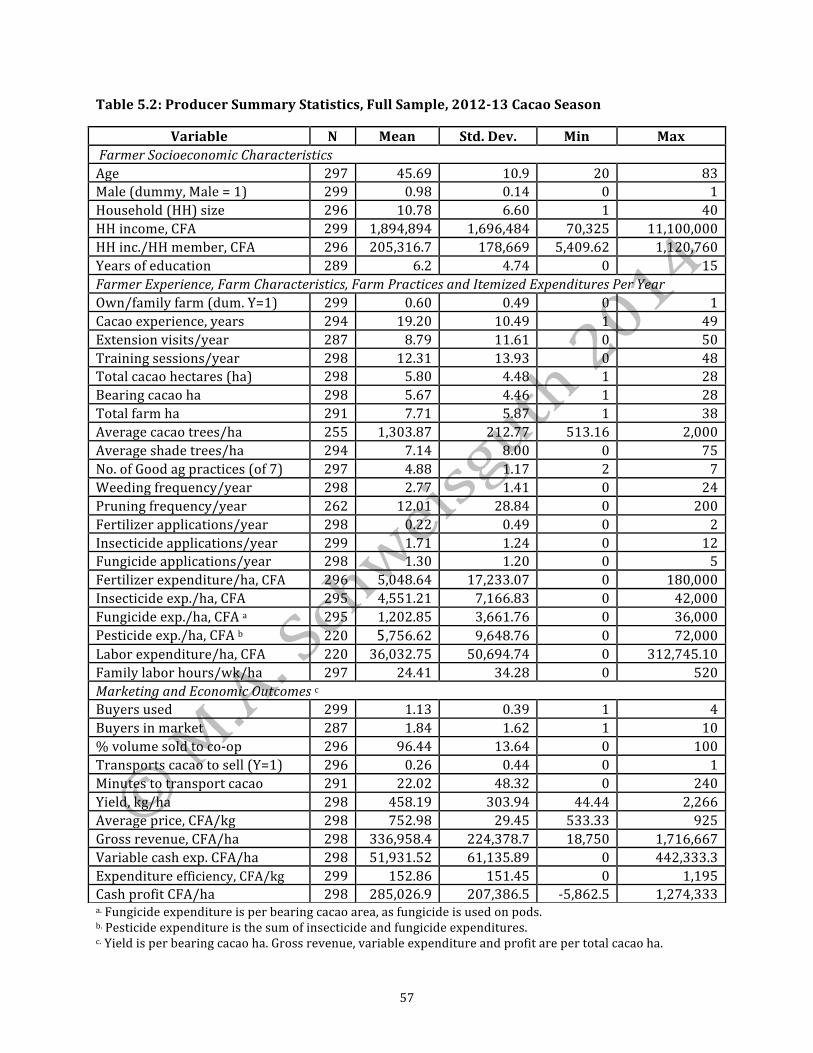
57
Table 5.2: Producer Summary Statistics, Full Sample, 2012-‐13 Cacao Season
a. Fungicide expenditure is per bearing cacao area, as fungicide is used on pods. b. Pesticide expenditure is the sum of insecticide and fungicide expenditures. c. Yield is per bearing cacao ha. Gross revenue, variable expenditure and profit are per total cacao ha.
Variable N Mean Std. Dev. Min Max Farmer Socioeconomic Characteristics Age 297 45.69 10.9 20 83 Male (dummy, Male = 1) 299 0.98 0.14 0 1 Household (HH) size 296 10.78 6.60 1 40 HH income, CFA 299 1,894,894 1,696,484 70,325 11,100,000 HH inc./HH member, CFA 296 205,316.7 178,669 5,409.62 1,120,760 Years of education 289 6.2 4.74 0 15 Farmer Experience, Farm Characteristics, Farm Practices and Itemized Expenditures Per Year Own/family farm (dum. Y=1) 299 0.60 0.49 0 1 Cacao experience, years 294 19.20 10.49 1 49 Extension visits/year 287 8.79 11.61 0 50 Training sessions/year 298 12.31 13.93 0 48 Total cacao hectares (ha) 298 5.80 4.48 1 28 Bearing cacao ha 298 5.67 4.46 1 28 Total farm ha 291 7.71 5.87 1 38 Average cacao trees/ha 255 1,303.87 212.77 513.16 2,000 Average shade trees/ha 294 7.14 8.00 0 75 No. of Good ag practices (of 7) 297 4.88 1.17 2 7 Weeding frequency/year 298 2.77 1.41 0 24 Pruning frequency/year 262 12.01 28.84 0 200 Fertilizer applications/year 298 0.22 0.49 0 2 Insecticide applications/year 299 1.71 1.24 0 12 Fungicide applications/year 298 1.30 1.20 0 5 Fertilizer expenditure/ha, CFA 296 5,048.64 17,233.07 0 180,000 Insecticide exp./ha, CFA 295 4,551.21 7,166.83 0 42,000 Fungicide exp./ha, CFA a 295 1,202.85 3,661.76 0 36,000 Pesticide exp./ha, CFA b 220 5,756.62 9,648.76 0 72,000 Labor expenditure/ha, CFA 220 36,032.75 50,694.74 0 312,745.10 Family labor hours/wk/ha 297 24.41 34.28 0 520 Marketing and Economic Outcomes c Buyers used 299 1.13 0.39 1 4 Buyers in market 287 1.84 1.62 1 10 % volume sold to co-‐op 296 96.44 13.64 0 100 Transports cacao to sell (Y=1) 296 0.26 0.44 0 1 Minutes to transport cacao 291 22.02 48.32 0 240 Yield, kg/ha 298 458.19 303.94 44.44 2,266 Average price, CFA/kg 298 752.98 29.45 533.33 925 Gross revenue, CFA/ha 298 336,958.4 224,378.7 18,750 1,716,667 Variable cash exp. CFA/ha 298 51,931.52 61,135.89 0 442,333.3 Expenditure efficiency, CFA/kg 299 152.86 151.45 0 1,195 Cash profit CFA/ha 298 285,026.9 207,386.5 -‐5,862.5 1,274,333
58
average, they have grown cacao for 19 years and have 5.8 ha of cacao. Input use is low, with mean
expenditures representing one-‐quarter of a bag of fertilizer and one-‐half liter of insecticide per ha.
Mean yield is 456 kg/ha and mean price is 753 CFA/kg.
Farmers receive extension visits less than monthly, attend trainings 12 times annually and
use almost five of seven good agricultural practices.16 On average, farms make positive variable
profits, though some realize a loss. Farmers sell over 96 percent of their crop to their co-‐ops,
showing high loyalty. On average, they have less than two accessible buyers, suggesting that buyers
have market power. Certified farmers sell an average of 88 percent of their output at certified
terms, with certified sales ranging from 11 to 100 percent across producers. If this figure is
adjusted to account for multi-‐certification, by dividing the percentage of output each farmer sells as
certified by the number of certifications covering their farm, the mean is 68 percent. The difference
between the two could be thought of as representing the unrecovered costs of multi-‐certification.
Both figures are well above sector averages of 48 percent or less, as reported in Chapter 4.
5.4.1 Differences in Means, and Certification Effects on Price
Table 5.3 presents differences in means between certified farmers and controls, for regression
variables and economic outcomes, overall and by region. Appendix B has tables with overall group
means for all variables (Table B1) regional group means for agronomic and economic variables
(Table B2), and significant differences by region for all variables (Table B3). Overall, compared to
controls, certified farmers have significantly higher prices, lower variable expenditures per ha and
per kg of cacao sold, higher profits per ha, more extension visits and training sessions, higher
weeding and pruning frequencies, fewer insecticide applications, and lower insecticide and
pesticide expenditures per ha. These overall significant differences hold in all regions for price,
extension and training only. Some group means differ significantly only in one region. Certified
16 Good agricultural practices are weeding, structural pruning, sanitary pruning, fertilizing, applying insecticide and fungicide, and pruning shade trees.
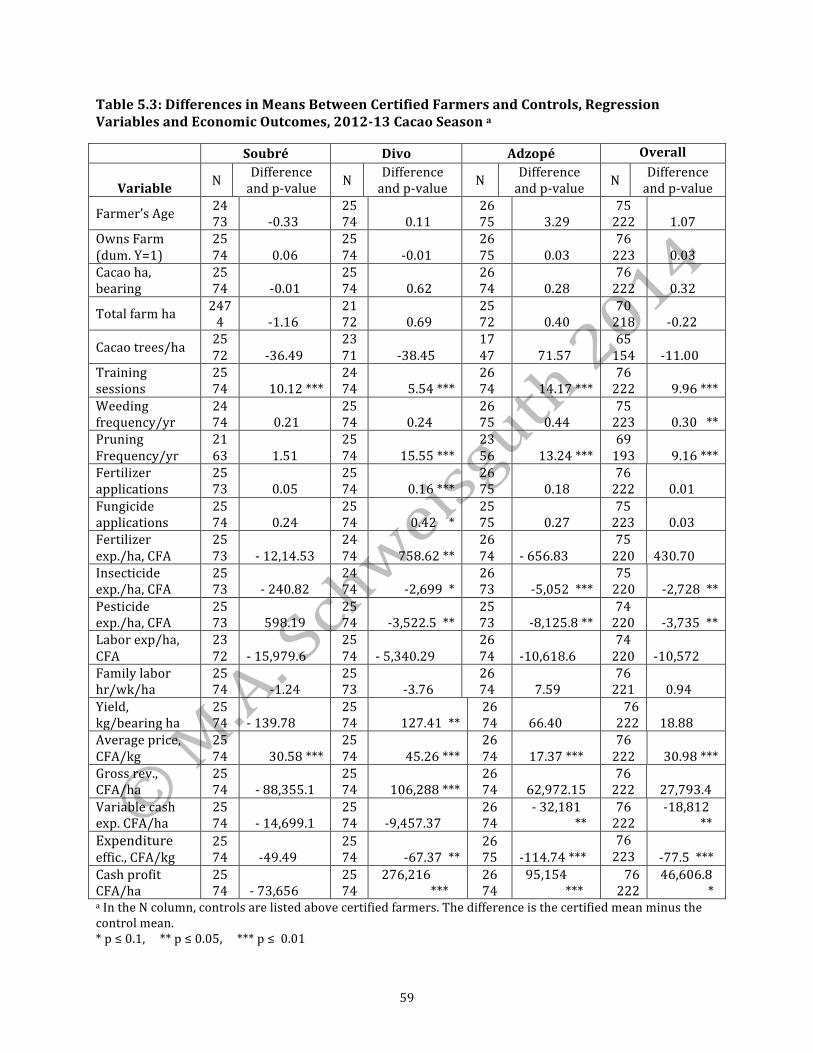
59
Table 5.3: Differences in Means Between Certified Farmers and Controls, Regression Variables and Economic Outcomes, 2012-‐13 Cacao Season a
Soubré Divo Adzopé Overall
Variable N Difference and p-‐value N Difference
and p-‐value N Difference and p-‐value N Difference
and p-‐value
Farmer’s Age 24 73 -‐0.33
25 74 0.11
26 75 3.29
75 222 1.07
Owns Farm (dum. Y=1)
25 74 0.06
25 74 -‐0.01
26 75 0.03
76 223 0.03
Cacao ha, bearing
25 74 -‐0.01
25 74 0.62
26 74 0.28
76 222 0.32
Total farm ha 2474 -‐1.16
2172 0.69
25 72 0.40
70 218 -‐0.22
Cacao trees/ha 25 72 -‐36.49
2371 -‐38.45
17 47 71.57
65 154 -‐11.00
Training sessions
25 74 10.12 ***
24 74 5.54 ***
26 74 14.17 ***
76 222 9.96 ***
Weeding frequency/yr
24 74 0.21
25 74 0.24
26 75 0.44
75 223 0.30 **
Pruning Frequency/yr
21 63 1.51
25 74 15.55 ***
23 56 13.24 ***
69 193 9.16 ***
Fertilizer applications
25 73 0.05
25 74 0.16 ***
26 75 0.18
76 222 0.01
Fungicide applications
25 74 0.24
25 74 0.42 *
25 75 0.27
75 223 0.03
Fertilizer exp./ha, CFA
25 73 -‐ 12,14.53
24 74 758.62 **
26 74 -‐ 656.83
75 220 430.70
Insecticide exp./ha, CFA
25 73 -‐ 240.82
24 74 -‐2,699 *
26 73 -‐5,052 ***
75 220 -‐2,728 **
Pesticide exp./ha, CFA
25 73 598.19
25 74 -‐3,522.5 **
25 73 -‐8,125.8 **
74 220 -‐3,735 **
Labor exp/ha, CFA
23 72 -‐ 15,979.6
25 74 -‐ 5,340.29
26 74 -‐10,618.6
74 220 -‐10,572
Family labor hr/wk/ha
25 74 -‐1.24
25 73 -‐3.76
26 74 7.59
76 221 0.94
Yield, kg/bearing ha
25 74 -‐ 139.78
25 74 127.41 **
26 74 66.40
76 222 18.88
Average price, CFA/kg
25 74 30.58 ***
25 74 45.26 ***
26 74 17.37 ***
76 222 30.98 ***
Gross rev., CFA/ha
25 74 -‐ 88,355.1
25 74 106,288 ***
26 74 62,972.15
76 222 27,793.4
Variable cash exp. CFA/ha
25 74 -‐ 14,699.1
25 74 -‐9,457.37
26 74
-‐ 32,181 **
76 222
-‐18,812 **
Expenditure effic., CFA/kg
25 74 -‐49.49
25 74 -‐67.37 **
26 75 -‐114.74 ***
76 223 -‐77.5 ***
Cash profit CFA/ha
25 74 -‐ 73,656
25 74
276,216 ***
26 74
95,154 ***
76 222
46,606.8 *
a In the N column, controls are listed above certified farmers. The difference is the certified mean minus the control mean. * p ≤ 0.1, ** p ≤ 0.05, *** p ≤ 0.01

60
farmers have significantly higher fertilization frequencies, fertilizer expenditures, yields and
revenues per ha in Divo only; and lower fungicide expenditures in Adzopé only.
Table 5.4 states differences in means for economic outcomes between each certification type and
controls in the same regions. Regional differences are stated where they are significant, but overall
differences are not. Corresponding tables with means for agronomic and economic
Table 5.4: Differences in Means Between Certified Farmers and Controls By Certification Type, Economic Outcomes, 2012-‐13 Cacao Season a
FLO-‐UTZ (Soubré, 2 co-‐ops)
FLO-‐RA (Divo, 1 co-‐op)
FLO-‐RA-‐UTZ (Adzopé, 1 co-‐op)
N 25 certified 25 controls N 25 certified
25 controls N 24 certified 26 controls
Variable Difference and p-‐value
Difference and p-‐value
Difference and p-‐value
Yield, kg/bearing ha -‐ 208.81 ** 110.11 * 41.61 Average price, CFA/kg 25.28 *** 47.55 *** 0.77 Gross revenue, CFA/ha -‐ 142,936 ** 89,329.01 * 48,420.46 Variable exp. CFA/ha -‐ 32,585.44 * -‐8,639.05 -‐65,440.98 *** Profit CFA/ha -‐ 110,350.60 * 97,968.06 ** 113,861.40 **
RA
(Soubré and Divo) RA-‐UTZ
(Adzopé, 4 co-‐ops) UTZ
(All Departments)
N 48 certified 50 controls N 25 certified
26 controls N 75 certified 76 controls
Variable Difference and p-‐value
Difference and p-‐value
Difference and p-‐value
Yield, kg/bearing ha
Overall 22.59 Divo 102.71 * 62.00
Overall 38.64 Divo 168.41 *
Average price, CFA/kg 38.97 *** 24.90 *** 34.11 *** Gross revenue, CFA/ha
Overall 33,278 Divo 90,404.62 * 63493.58
Overall 40,564.31 Divo 138,494.9 **
Variable exp. CFA/ha -‐ 2,913 -‐1,950.44 -‐ 18,422.67 **
Profit CFA/ha Overall 36,191.01 Divo 95,827.46 ** 65,444.02
Overall 58,986.98 Divo 152,643.7 ** Adzopé 106,903 **
a The difference is the certified mean minus the control mean * p ≤ 0.1, ** p ≤ 0.05, *** p ≤ 0.01
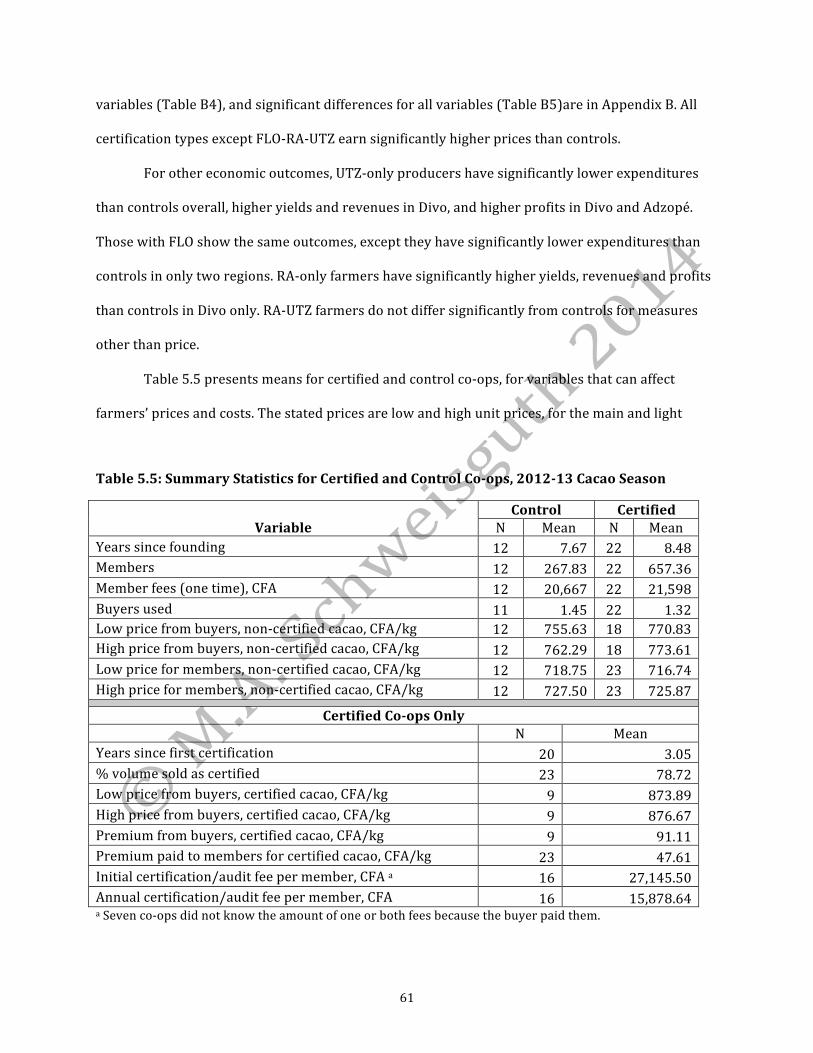
61
variables (Table B4), and significant differences for all variables (Table B5)are in Appendix B. All
certification types except FLO-‐RA-‐UTZ earn significantly higher prices than controls.
For other economic outcomes, UTZ-‐only producers have significantly lower expenditures
than controls overall, higher yields and revenues in Divo, and higher profits in Divo and Adzopé.
Those with FLO show the same outcomes, except they have significantly lower expenditures than
controls in only two regions. RA-‐only farmers have significantly higher yields, revenues and profits
than controls in Divo only. RA-‐UTZ farmers do not differ significantly from controls for measures
other than price.
Table 5.5 presents means for certified and control co-‐ops, for variables that can affect
farmers’ prices and costs. The stated prices are low and high unit prices, for the main and light
Table 5.5: Summary Statistics for Certified and Control Co-‐ops, 2012-‐13 Cacao Season
Variable Control Certified
N Mean N Mean Years since founding 12 7.67 22 8.48 Members 12 267.83 22 657.36 Member fees (one time), CFA 12 20,667 22 21,598 Buyers used 11 1.45 22 1.32 Low price from buyers, non-‐certified cacao, CFA/kg 12 755.63 18 770.83 High price from buyers, non-‐certified cacao, CFA/kg 12 762.29 18 773.61 Low price for members, non-‐certified cacao, CFA/kg 12 718.75 23 716.74 High price for members, non-‐certified cacao, CFA/kg 12 727.50 23 725.87
Certified Co-‐ops Only N Mean Years since first certification 20 3.05 % volume sold as certified 23 78.72 Low price from buyers, certified cacao, CFA/kg 9 873.89 High price from buyers, certified cacao, CFA/kg 9 876.67 Premium from buyers, certified cacao, CFA/kg 9 91.11 Premium paid to members for certified cacao, CFA/kg 23 47.61 Initial certification/audit fee per member, CFA a 16 27,145.50 Annual certification/audit fee per member, CFA 16 15,878.64 a Seven co-‐ops did not know the amount of one or both fees because the buyer paid them.

62
crops respectively, and include applicable premiums. All co-‐ops indicated that they received the
government’s set prices. Non-‐certified prices include premiums of five to 30 CFA/kg, for quantity,
physical quality and controlled fermentation.
Overall, co-‐ops are similar, except certified co-‐ops are larger and receive slightly higher
prices from buyers, while control co-‐ops use more buyers. On average, certified co-‐ops sell 78.72
percent of their output at certified terms, well above sector averages. They receive an average
premium of 93.3 CFA/kg for certified cacao, and pay members about half of this, 47.6 CFA/kg.17
Certification and audit fees per member are illustrative only, as co-‐ops did not report charging
these directly to members. Certifier and co-‐op interviews indicate that certified co-‐ops allocate
premiums to certification costs, so farmers bear them via lower potential price premiums.
The analyses of certified and control means align with the theoretical analysis in indicating
that a) certification is most strongly associated with higher prices, and less strongly associated with
higher yields, revenues or profits, or lower expenditures; and b) certified producers’ practices and
outcomes vary across regions and certifications.
Price is the only economic outcome for which certified producers fare significantly better
than controls overall, in every region, and for each certification except FLO-‐RA-‐UTZ. FLO-‐RA-‐UTZ
farmers are in one co-‐op, and 16 of the 25 surveyed had not yet received premiums for certified
sales, explaining the non-‐significant difference. Co-‐op data confirm that certification drives certified
farmers’ higher prices, as other premiums are much smaller. Thus, we can conclude that
certification has a positive effect on farm gate price. The effect is small, equating to a 4.25 percent
price differential (see means in Table B1).
Certified farmers have significantly lower average expenditures and higher average variable
profits than controls overall, though not for every region and certification type. Certified farmers’
expenditures per ha are 28.5 percent lower than controls, while their variable profits per ha are
17 Every certified co-‐op reported that the total premium for certified cacao was 100 CFA/kg. Two co-‐ops said a buyer retains 30 CFA/kg of this to recover certification fees the buyer paid.

63
18.62 percent higher. Certified producers do not have significantly higher mean yields or revenues
than controls overall, only in Divo. These figures indicate that certification is associated with a non-‐
trivial increase in profits, which appears to be linked to lower expenditures more than higher prices
or yields.
Certified producers’ lower expenditures may be due to lower spending on pesticides, rather
than substituting family labor for hired labor and/or pesticide use. Insecticide and total pesticide
expenditures are significantly lower among certified producers than controls, but the groups do not
differ significantly for either labor measure. This could indicate that certification improves input
efficiency, as identified in the theoretical analysis, but could also reflect financial constraints, raising
a question for further investigation.
Outcomes clearly differ regionally. Divo is the only department where certified farmers
have significantly higher yields, revenues and profits than controls. This may be due to the fact that
no controls in Divo use fertilizer while certified farmers do, and that the certified price differential
is largest in the region, amounting to a 6.2 percent difference over controls. In Adzopé, certified
farmers differ significantly from controls only in having lower expenditures and higher profits.
Certified producers in Soubré do not differ significantly from controls for yields, revenues,
expenditures and profits, but all are lower. Though certification seems to be associated with
negative outcomes in Soubré, certified farmers’ yields, revenues and profits are not significantly
lower in Soubré than other regions. Rather, controls have higher yields there than other regions
(see Table B4) while certified producers do not. This may be due to the fact that controls spend
much more on fertilizer per ha than certified farmers in Soubré. It would be beneficial to validate
whether this result holds for a larger sample, and why, if so, to improve certification outcomes.
We cannot make generalized conclusions about outcomes across certification types, or
regarding multi-‐certification, due to differences in sample sizes, and regional specificity. While it
seems that UTZ-‐only and FLO producers fare best, RA and RA-‐UTZ have smaller sample sizes than

64
UTZ, which could explain the lower prevalence of significant t-‐test results. Each FLO type, and
RA-‐UTZ, is in only one region, so region overlaps with multi-‐certification type.
5.4.2 Yield Regressions
Table 5.6 presents the yield regressions. Overall, the results of the yield models align with the
theoretical evaluation, in that the effects of certification on yield are weak, and vary across regions
and certification types. Certification coefficients are significant only in models that account for
region-‐specific differences: Model 2 and regional models. UTZ is significant in all of these models.
RA is significant in Model 2 and Divo only. FLO is not significant in any model, unless weeding is
added to the Adzopé model. In that case, FLO becomes significant, though weeding is not significant.
Thus, the Adzopé model can be considered to be fragile with respect to the significance of FLO.
Table 5.7 indicates total intercept shift by certification type for each model. Model 2
intercept shifts include region-‐certification interactions. All intercept shifts are positive in Model 1,
and the Divo and Adzopé models, and negative in the Soubré model. In Model 2, intercept shifts are
negative for RA-‐UTZ, and all certifications in Soubré, but positive otherwise. These results signify
the presence of regional differences, as with group means.
UTZ seems to have the largest positive intercept shift, alone and with other certifications.
This concurs with the theoretical evaluation, which found that UTZ has most yield-‐enhancing
criteria. When regional dummies are used (Model 2), UTZ-‐only and FLO multi-‐certification both
have positive, significant total intercept shifts in Divo and Adzopé while this holds for RA in Divo
only. In single-‐region models, total intercept shift for UTZ is significant and positive in two regions,
and significant and negative in one (Soubré), while FLO and RA certification types are significant
and positive in only one region.

65
Table 5.6: Yield Regression Models
1 2 3a: Soubre 3b: Divo 3c: Adzopé Coeff.
(Std. Err.) Coeff.
(Std. Err.) Coeff.
(Std. Err.) Coeff.
(Std. Err.) Coeff.
(Std. Err.)
FLO dummy
15.65 (42.93)
-‐19.04 (77.08)
32.96 (87.82)
-‐76.17 (73.46)
125.61 (82.48)
RA dummy 5.51
(39.35) 150.74 (78.47) *
-‐24.75 (81.50)
156.66 (71.70) **
-‐92.64 (77.79)
UTZ dummy 34.36 (37.66)
235.99 (78.74)***
-‐158.39 (86.18) *
192.04 (70.73) ***
183.13 (78.66) **
Farmer’s age -‐3.20 (1.68) *
Own farm or family’s farm
113.48 (42.17) ***
179.85 (55.61) **
Bearing cacao ha -‐17.43
(3.99) *** -‐16.69
(3.96) *** -‐17.15
(5.90) *** -‐11.79 (5.52) **
Average cacao trees/ha 0.19
(0.08) ** 0.17
(0.08) **
Weeding frequency/yr 120.21
(47.59) ***
Pruning frequency/yr 15.88
(6.19) ***
Fertilizer expenditure, 1,000’s of CFA
0.03 (0.01) ***
0.03 (0.01) ***
0.03 (0.01) ***
Insecticide exp., 1,000’s of CFA
0.15 (0.05)***
Pesticide expenditure, 1,000’s of CFA
0.04 (0.02) *
0.06 (0.02) ***
Hired labor expenditure, 1,000’s of CFA
1.44 (0.38) ***
1.52 (0.38) ***
2.47 (0.83)***
1.23 (0.48)***
1.95 (0.56)***
Family Labor/week/ha 2.39
(1.37) *
Soubré regional dummy 154.35
(81.46) *
Adzopé regional dummy -‐56.82
(88.42)
FLO*Soubré dummy 16.37
(108.44)
RA*Soubré dummy -‐231.04
(112.60) **
UTZ*Soubré dummy -‐351.78
(110.17) ***
FLO*Adzopé dummy 301.37
(123.29) **
RA*Adzopé dummy -‐396.77
(123.19) ***
UTZ*Adzopé dummy
-‐15.41 (123.16)

66
Constant
202.16 (114.28) *
226.39 (142.25)
116.89 (153.82)
296.21 (65.95) ***
197.77 (64.63) ***
N 247 246 81 99 99 R2 0.240 0.330 0.524 0.228 0.230 * p ≤ 0.1, ** p ≤ 0.05, *** p ≤ 0.01
Table 5.7: Total Intercept Shift for Certification Dummies, Yield Regressions
Certification Type Region Model 1 Model 2 Regional Modelsa FLO-‐UTZ Soubré 50.01 -‐118.45 -‐125.43 FLO-‐RA Divo 21.16 131.71 * 80.49 FLO-‐RA-‐UTZ Adzopé 55.52 256.89 *** 216.10 ** RA Soubré and Divo 5.51 RA Soubré -‐80.29 -‐24.75 RA Divo 150.74 * 156.66 ** RA-‐UTZ Adzopé 39.87 -‐25.45 90.49 UTZ All regions 34.36 UTZ Soubré -‐115.70 -‐158.39 * UTZ Divo 235.99 *** 192.04 *** UTZ Adzopé 220.58 ** 183.13 ** a Number is the sum of relevant certification dummies in model corresponding to “Region” column” * p ≤ 0.1, ** p ≤ 0.05, *** p ≤ 0.01
The non-‐certification variables that are significant differ across models.18 Across Models 1
and 2, farmer’s age and farm ownership and are significant only in Model 2. In Model 2, one
department dummy and four department-‐certification dummies are significant. In both models, all
non-‐dummy variables have a positive effect on yield, except bearing cacao area, which has a
negative effect. Across single-‐regional models, the number and nature of significant variables differ.
The Soubré model has six significant non-‐certification variables (cacao area, weeding, pruning,
fertilizer expenditure, hired labor expenditure, and family labor), Divo has only three (farm
ownership, cacao area and hired labor expenditure), and Adzopé has only two (insecticide and
hired labor expenditures). In all models, hired labor has the highest coefficient among expenditures.
18 Insecticide expenditure is significant if used to replace pesticide expenditure in Models 1 and 2. Models with pesticide expenditure have a slightly higher R2. Age squared is significant in Model 2 if used to replace age. If both are used, neither is significant. The advanced age of trees explains this.

67
Overall, the yield regression results align with prior research, and what one would expect
from an agronomic perspective and economic theory. Cacao area; and expenditures on hired labor,
fertilizer and pesticides; have a particularly robust effect, as they are significant in overall and
regional models. Other variables, such as land ownership and cacao trees/ha, are significant only in
models that account for region-‐specific differences. The regional models concur with the theoretical
evaluation in confirming geographic variation in the factors that influence yield, and the effect of
certification. It is not fully clear from the data why certain variables affect yield in one region but
not another. The significance of expenditures on fertilizer in Soubré, and insecticide in Adzopé, may
be explained by large differences in regional group means for these variables. It seems beneficial to
conduct further research to confirm which factors most affect yield in a given context, and thus
identify areas that certifiers, industry and others should target to optimize certification outcomes.
Table 5.8 presents the estimated total effects of certification for Model 1, with total
intercept shifts and differences between group means for comparison. The estimated total effects
are negative for all certifications except RA-‐UTZ, contrasting the positive polarity of intercept shifts
in Model 1, and none are significant.19 Total effect of certification matches the polarity of the total
intercept shift for RA-‐UTZ only, and the difference between group means for FLO-‐UTZ and FLO-‐RA-‐
UTZ only. The magnitudes of the three measures diverge in almost all cases, except for total
Table 5.8: Estimated Total Effect of Certification on Yield, Total Intercept Shift, and Difference in Means
Total Effect of Certification, Model 1
P-‐value Total Intercept Shift, Model 1
Difference in Means: Certified Minus All
Controls FLO-‐RA -‐21.98 (48.49) 0.65 50.01 13.08 FLO-‐UTZ -‐11.57 (50.89) 0.82 21.16 -‐43.55 FLO-‐RA-‐UTZ -‐21.7 (62.27) 0.72 55.52 -‐23.99 RA -‐19.36 (39.89) 0.63 5.51 56.71 RA-‐UTZ 43.65 (61.14) 0.48 39.87 -‐3.60 UTZ -‐7.53 (37.63) 0.84 34.36 38.65 19 Significance is from Stata’s lincom command, used to calculate total certification effect.

68
certification effect and total intercept shift for RA-‐UTZ, and total intercept and difference between
group means for UTZ.
It is not surprising that total effect of certification does not match the difference between
group means, since the latter is a simple descriptive measure of an outcome, while the former
estimates the effects of certification on that outcome. This is the reason that higher-‐level
econometrics are essential in evaluating the effects of certification. We would also expect total
effect of certification and total intercept shift to differ, given that multiple variables affect yield, and
that there is variation within and between groups for these variables. Total intercept shift
disregards explanatory variables besides the certification dummies, while total effect of
certification represents an adjustment to the total intercept shift per group differences for all other
variables that affect yield. The measures would be equal only if groups were identical for all non-‐
certification variables.
Total intercept shift and total effect of certification can be thought of as the boundaries of
the potential effect of certification on yield, for this sample. On the end of the range estimated by
total intercept shift, certification can be expected to have a positive effect. However, on the other
end of the range, represented by total effect of certification, certification would be expected to be
associated with a negative effect. In the absence of baseline data indicating how groups differed on
each explanatory variable prior to certification, we cannot be certain if and how certification caused
observed group differences in each the variables that affected yield. Without an exhaustive list of
specific selection criteria, we also cannot specify regression models that would fully address
selection bias, such as a Heckman two-‐stage model. Due to these issues, we cannot determine a
point estimate for the effect of certification. We can conclude only that it lies between the total
intercept shift and total effect of certification.

69
5.4.3 Variable Cash Expenditure Regressions
Table 5.9 presents the variable expenditure regressions. Among certification dummies, FLO and
UTZ are significant and negative in all models, while RA is non-‐significant and positive in each.
Table 5.10 indicates total intercept shifts by model. All FLO types, UTZ and RA-‐UTZ are negative in
all models, while RA is positive. FLO-‐UTZ, FLO-‐RA-‐UTZ and UTZ are significant in all models.
Table 5.9: Variable Cash Expenditure Regression Models
Model 1A Model 1B Model 2A Model 2B Coef.
Std. Err. Coef.
Std. Err. Coef.
Std. Err. Coef.
Std. Err.
FLO
-‐17,613.56 (8,816.44)
**
-‐17,958.10 (8,847.57)
**
-‐16,532.70 (8,874.01)
*
-‐16,782.69 (8,919.66)
*
RA 2,095.32 (8,262.46)
3,137.34 (8,339.72)
2,853.30 (8,130.22)
32,40.47 (8,208.1)
UTZ
-‐17,721.84 (8,233.94)
**
-‐17,396.60 (8,268.50)
**
-‐15,502.85 (8,092.82)
*
-‐15,554.86 (8,129.42)
* Total farm size, ha (cacao and other crops)
1,155.95 (645.31)
*
1,324.51 (675.86)
**
Household Size
1,096.38 (534.83)
**
1,086.68 (538.01)
**
Cacao trees/ha
44.33 (17.45) ***
47.99 (17.84) ***
43.09 (16.57) ***
44.33 (16.92) ***
Training Sessions/yr
-‐501.99 (271.76)
*
-‐541.22 (275.24)
**
-‐541.18 (268.43)
**
-‐550.185 (273.17)
**
Fertilizer applications/yr
27,044.72 (7,097.84)
***
27,064.93 (7,116.47)
***
28,825.57 (7,064.71)
***
28,739.46 (7097.72)
***
Fungicide applications/yr
7,198.21 (3,242.95)
**
6,763.73 (3,289.13)
**
7,828.65 (3,207.74)
**
7,819.827 (3235.43)
** Family Labor/wk/ha
174.33 (201.21)
17.24 (192.43)
Constant -‐12,192.45 (24,441.65)
-‐21,517.12 (26,242.14)
-‐16,300.58 (23,900.91)
-‐18,012.86 (24,941.64)
N 246 245 250 249 R2 0.195 0.199 0.196 0.197
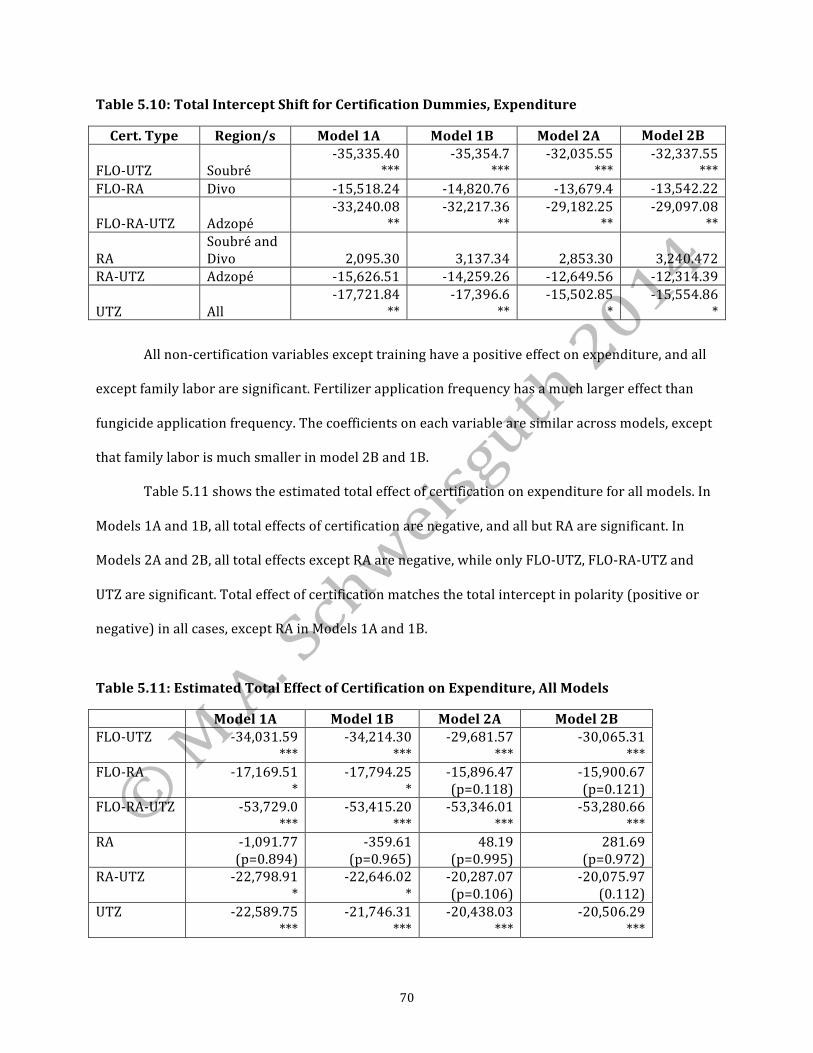
70
Table 5.10: Total Intercept Shift for Certification Dummies, Expenditure
Cert. Type Region/s Model 1A Model 1B Model 2A Model 2B
FLO-‐UTZ Soubré -‐35,335.40
*** -‐35,354.7
*** -‐32,035.55
*** -‐32,337.55
*** FLO-‐RA Divo -‐15,518.24 -‐14,820.76 -‐13,679.4 -‐13,542.22
FLO-‐RA-‐UTZ Adzopé -‐33,240.08
** -‐32,217.36
** -‐29,182.25
** -‐29,097.08
**
RA Soubré and Divo 2,095.30 3,137.34 2,853.30 3,240.472
RA-‐UTZ Adzopé -‐15,626.51 -‐14,259.26 -‐12,649.56 -‐12,314.39
UTZ All -‐17,721.84
** -‐17,396.6
** -‐15,502.85
* -‐15,554.86
*
All non-‐certification variables except training have a positive effect on expenditure, and all
except family labor are significant. Fertilizer application frequency has a much larger effect than
fungicide application frequency. The coefficients on each variable are similar across models, except
that family labor is much smaller in model 2B and 1B.
Table 5.11 shows the estimated total effect of certification on expenditure for all models. In
Models 1A and 1B, all total effects of certification are negative, and all but RA are significant. In
Models 2A and 2B, all total effects except RA are negative, while only FLO-‐UTZ, FLO-‐RA-‐UTZ and
UTZ are significant. Total effect of certification matches the total intercept in polarity (positive or
negative) in all cases, except RA in Models 1A and 1B.
Table 5.11: Estimated Total Effect of Certification on Expenditure, All Models
Model 1A Model 1B Model 2A Model 2B FLO-‐UTZ -‐34,031.59
*** -‐34,214.30
*** -‐29,681.57
*** -‐30,065.31
*** FLO-‐RA -‐17,169.51
* -‐17,794.25
* -‐15,896.47 (p=0.118)
-‐15,900.67 (p=0.121)
FLO-‐RA-‐UTZ -‐53,729.0 ***
-‐53,415.20 ***
-‐53,346.01 ***
-‐53,280.66 ***
RA -‐1,091.77 (p=0.894)
-‐359.61 (p=0.965)
48.19 (p=0.995)
281.69 (p=0.972)
RA-‐UTZ -‐22,798.91 *
-‐22,646.02 *
-‐20,287.07 (p=0.106)
-‐20,075.97 (0.112)
UTZ -‐22,589.75 ***
-‐21,746.31 ***
-‐20,438.03 ***
-‐20,506.29 ***

71
Overall, the expenditure regressions indicate that certification has a robust negative effect
on expenditure, except in the case of RA-‐only farmers. As with yield, the total intercept shift and the
total effect of certification represent the boundaries of this effect. Total intercept shift and total
effect of certification are significant and negative for producers with UTZ only, and with both FLO
and UTZ, in all models. Both measures are negative for producers with FLO-‐RA and RA-‐UTZ, though
significant in only some models. RA-‐only producers have positive, non-‐significant values for both
measures, except for negative, non-‐significant total effects in Model 1A and 1B. The theoretical
evaluation of certification does not indicate why RA would increase expenditures, while FLO and
UTZ would reduce expenditures. RA and UTZ have the most criteria that could potentially increase
or decrease different expenditures, and these criteria are similar in number and nature. However,
UTZ seems to have a few more criteria that could reduce expenditures than RA.
These results may indicate that producers with UTZ and FLO may be realizing economic
efficiencies as a result of certification requirements, such as training on efficient, appropriate
pesticide use.20 Alternately, it may be that farmers who were more cost efficient prior to
certification were more likely to seek certification, or be selected for certification by others.
Without pre-‐certification baseline data or known selection criteria, we cannot conclude which
scenario holds. Thus, as with yield, we can conclude only that the effect of certification on total
expenditure lies between the total intercept shift and the total effect of certification. We cannot
pinpoint the magnitude of the effect.
The non-‐certification variables that are significant make sense. Total farm size and
household size appear to be interchangeable, suggesting that both may represent assets. Land can
serve as collateral (if titled), non-‐cacao farm area can be used to produce other market or food
crops, and household members represent labor that can generate off-‐farm income. A higher number
20 Certified and control farmers indicated that they received free insecticide and/or fungicide from their co-‐ops, but they were not asked to report quantities. Therefore, expenditures do not represent total quantities used. The proportion of producers reporting free inputs did not differ significantly across groups, so it is assumed free inputs would not explain certified producers’ lower expenditures.
72
of cacao trees per ha increases the total costs associated with pruning, pesticide application and
harvesting. Increased training can help farmers realize efficiencies, particularly in pesticide use (see
Ingram et al. 2014). Higher frequencies of fertilizer and fungicide use would logically increase
expenditure. The data indicate that producers do not all use the same amount per application, so
this effect would not be expected to be identical across producers.
5.5 Conclusion
Piecing together the comparison of average prices across certified and control producers, and the
regressions on yield and expenditure, we can conclude that certification is associated with
significantly higher prices, though the relative difference is rather small, has a significant negative
effect on expenditure, and has varied effects on yield that range from negative to positive. Thus, we
would conclude that its effect on farm-‐level profit is variable in direction and magnitude. So long as
certification does not lead to decreased yields relative to non-‐certified farmers, certified producers
would earn higher profits than those who are not certified. However, if certification affects yields
negatively, or fails to improve pre-‐certification yield that were poor, the differences in profits
across certified and non-‐certified farmers will depend on the magnitude of the price increases and
expenditure reductions associated with certification, and the difference in yields between groups.
It is noteworthy that certification is associated with lower spending on pesticides
(insecticide and fungicide), while expenditures on these items have a positive effect on yield. Thus,
certified producers’ lower spending may be one factor that explains why the total effect of
certification on yield is negative. However, reduced pesticide expenditures could reflect the use of
better cultural practices that reduce the need for these chemicals, or more efficient, appropriate
application practices. Further research is needed to determine why certified producers spend less
on pesticides, and if they are applying sufficient amounts. If they are not applying sufficient
amounts, then it is important to determine whether this is due to certification requirements, or
financial constraints, and gauge the net benefit of addressing the identified causes.
73
The fieldwork findings cannot be generalized beyond cacao farmers who are in producer-‐
run groups such as co-‐ops, which represent about 15 percent of farmers, as noted in the cacao
sector overview. Additionally, they cannot be generalized without qualifications beyond those who
sell bulk cacao (as opposed to fine flavor) through government-‐controlled markets, as both factors
have effects on price apart from certification. Given that producer organization formation is part of
many development initiatives, per the cacao sector overview, the present study can be expected to
be relevant to more producers over time.
The comparison of group means tests and regression results indicates the importance of
using higher-‐level econometric methods to evaluate certification effects. If we looked only at t-‐test
results for yield, expenditure and profits, we would conclude that certification is associated with
higher yields, though not significantly so; significantly lower expenditures, and significantly higher
profits. The regressions do not allow us to make these same conclusions for yield and profit for any
certification type, or for expenditures in the case of RA-‐only producers.
The regression models also indicate the importance of estimating the effects of certification
in isolation, and along with other variables that affect producers’ outcomes. In the case of yield, if
we use only the total intercept shift to evaluate certification effects in isolation, we would conclude
that it generally results in yields that are higher than controls (or that higher yield increases the
likelihood of certification), excepting one region where controls fare significantly better. If we look
only at the total effect of certification, we would conclude that certification is more likely to reduce
yield (or that producers with poor yields are more likely to seek certification). By considering both
measures, we can estimate the range of the effect that certification may have, and make more
accurate conclusions about expected outcomes. This is particularly important when we do not have
baseline data or known selection criteria, and must estimate effects as a range rather than a point to
account for both pre-‐ and post-‐certification differences in explanatory variables.

74
Chapter 6. Conclusions
This thesis has evaluated the direct effects of the FLO, RA and UTZ certifications on smallholders’
net incomes, through generalized and specific lenses, using primary and secondary data. It began
with a theoretical evaluation of the potential effects of certification, irrespective of crop or location,
proceeded to a literature review, and ended with an analysis of primary data from cacao farmers in
co-‐ops in Côte d’Ivoire. These three modes of inquiry lead to similar conclusions about the effects of
certification on net income and its components, and identify several ways in which certifiers and
partners can improve certified farmers’ profits. Sections 6.1 and 6.2 cover these topics respectively.
6.1 Effects and Limits of Certification
Overall, the direct effect of certification on farm-‐level net income varies within and across crops and
locations, and appears to be more positive or null than negative. Regarding the components of net
income, certification seems to have the most robust and positive impact on farm gate price. The
literature review and primary data support the theoretical supposition that certification raises
prices by differentiating commodities in ways that are associated with a higher willingness to pay.
Certified producers are likely to sell only a portion of their crop through certified channels, while
marketing the rest conventionally. Thus, average price across total output will lie between
conventional and certified prices in the local market. The literature review and cacao sector
overview indicate that the price differential can be expected to vary across time, commodities and
locations. It proved to be rather small for the Côte d’Ivoire producers surveyed, about 4.25 percent.
Effects on yield and total output are much less certain. The theoretical evaluation identified
numerous ways in which the target certifications could increase or decrease yield, or reduce
planted area and thus total output. The literature review found that certification has been
associated with higher, lower and equal yields relative to non-‐certified controls, in different cases.
However, most studies evaluated only group means, which describe outcomes but do not quantify
how certification has shaped them. Among the few studies that used regressions, the estimated
75
effect of certification ranged from negative to positive. The yield regressions using primary data
from Côte d’Ivoire similarly show mixed results when certification effects are characterized as a
range bounded by total intercept shift and total effect of certification. Total intercept shift, which
represent the isolated effects of certification, is largely positive across certification types. Total
effect of certification, which accounts for all variables that affect yield, is generally negative.
For variable cash expenditure, both the theoretical evaluation and the literature review
indicate that certification may be associated with an increase, decrease, or no change relative to
non-‐certified producers. The actual difference depends, to a large degree, on farmers’ pre-‐
certification farming practices and knowledge, such as whether they have been trained on efficient
pesticide application, the input quantities they use, and how much they weed and prune. It also
rests on factors outside the farm household and the scope of certification, such as access to credit,
which was identified as a pervasive constraint in the cacao sector overview.
Among the Ivorian farmers surveyed, certification appears to have a significant and large
negative effect on expenditure for FLO and UTZ, but a small positive effect for RA. It is possible that
groups differed in expenditures before certification, in which case we would interpret the results as
meaning that producers with lower expenditures seek FLO and UTZ, while those who spend more
obtain RA. In any case, regression results align with theory and secondary data in showing mixed
outcomes. It is not clear why RA is linked to increased expenditures, while the other certifications
are associated with reduced expenditures.
Looking across the components of net income, we can conclude that certification has a
robust effect on raising average farm gate price across crops and locations, while the ways in which
it modulates expenditure and yield vary across contexts. Thus, one cannot make general predictions
about how any of the target certifications would shift net income. Among the Ivorian cacao farmers
in the fieldwork, we can conclude that certification seems likely to increase profits more often than
not, via higher prices and lower expenditures, rather than increased yields. As noted, the fieldwork
76
findings cannot be generalized beyond cacao producers who are in co-‐ops, and possibly not past
those who sell bulk cacao through government-‐controlled markets. The theoretical evaluation and
literature review afford conclusions that can be applied more broadly.
Per the total evidence base we can conclude that, overall, certification has had a limited
effect on raising farmers’ net incomes. It does not seem that we can fault certification for this
entirely, given the complex challenges that exist in development contexts, and the complementary
roles that certifiers and other entities play in addressing these. When we consider the broader
context, it is apparent that we should not expect certification alone to guarantee significantly higher
profits for farmers in every situation, nor should we believe marketing statements that promise or
claim otherwise. Certification also involves benefits that lie outside the scope of this thesis,
including those realized at the level of producer organizations, communities, and the environment.
Thus, conclusions about its effects on farm-‐level profits cannot be extrapolated to total welfare.
Per their missions, the target certifications seem to exist primarily to recognize producers
who uphold better social and environmental practices, and incent such practices with above-‐
market prices (though UTZ also seeks to improve farm management, and FLO works to strengthen
producer organizations). The evidence base shows that they have achieved this end, as producers
receive above-‐market prices for certified sales. However, the overall effect of such price
differentials is small because demand for certified commodities lies below supply, and thus certified
producers sell the majority of their output through conventional channels. Certifiers can and do
undertake marketing to boost demand, but they cannot unilaterally shift the market toward higher
certified purchasing. Certifiers also cannot affect input costs, limiting their potential impacts on
expenditure to improving cost efficiency at the group and farm levels via certification requirements,
and finding ways to reduce certification costs.
Additionally, certifiers are not agricultural development organizations that are focused
primarily on improving technical agronomic practices and yields, though each certification has

77
criteria in these areas, particularly UTZ. Certifiers and development programs also operate within a
dynamic context marked by diverse constraints. The overview of the cacao sector and Côte d’Ivoire
identified factors such as limited national extension and R&D capacities, aged trees, low-‐yielding
genetic stock, gaps in input supply, lack of access to affordable credit, and poor infrastructure.
Jessop et al. (2012) indicate that these issues exist across crops and geographies. No single entity
can be expected to solve all these problems. Realizing this, certifiers have collaborated with other
entities to address issues beyond their scope, as the cacao sector overview found.
6.2 Recommendations for Improving Certification Outcomes
It is clear that farm-‐level economic outcomes could be better for certified producers. Certifiers,
partners such as traders and brand owners, ad others can take numerous steps to address factors
that affect producers’ prices, yields and expenditures. In some cases, this will require broadening
the scope of certification training, standards, producer services, or implementation partners to
address constraints that lie beyond certifiers’ current requirements, activities and capabilities.
Certifiers, brand owners and advocacy groups can help raise producer prices through
marketing that builds demand for certified goods. Certifiers and buyers can also train producer
group management on efficient administration of processes such as product traceability, financial
accounting and record keeping, helping groups increase profits and pay higher prices to members.
Additionally, certifiers can work to reduce duplicate costs incurred by multi-‐certified groups, which
would raise farm gate prices indirectly. Numerous groups hold multiple certifications that cover the
same farms. Such groups pay multiple certification costs for output that will bring them a premium
for only one label. Certifiers can reduce duplicate costs, such as audit fees, by training auditors on
each standard and accepting a common audit. One such example is the Certification Capacity
Enhancement Project implemented in West Africa from 2010-‐13, which included joint auditor
training (IDH, Undated). Finally, RA and UTZ, which allow groups to certify only a subset of farms,
can confer with buyers to estimate demand for each certification, and help groups determine how
78
many farms to certify to fulfill that amount. This will optimize the cost efficiency of certification,
and increase the resulting farm gate price.
Regarding yield, the literature review and fieldwork suggest that certifiers and partners
have great potential to enhance producers’ economic outcomes by supporting productivity
improvement. The cacao sector overview revealed that industry, governments, NGOs and others are
already incorporating relevant activities into development initiatives, having recognized this. In the
Ivorian sample, when certified producers have higher yields than controls, their productivity is still
well below the yield potentials stated in the cacao sector overview. Many farmers have aged trees
with declining yields, unimproved low-‐yield varietals and very low fertilizer use. There is also wide
variation in the use of good agricultural practices, and pesticides use. UTZ is the only standard with
requirements related to crop regeneration, and selecting planting material with consideration for
yield potential. It would be beneficial for other certifiers, and other entities in the sector, to
disseminate information on improved planting material and yield-‐enhancing practices.
Certifiers and partners would need to complement education with efforts to increase the
availability of high-‐quality genetic stock. This is not a simple or quick task, as it requires R&D
capacities and time to develop varietals, government approval for their use, and capacity building
for production and distribution. Relevant efforts are under way in Côte d’Ivoire, such as Mars’
(Undated) Vision for Change and the Nestlé (Undated) Cocoa Plan, which include R&D and
distribution of planting material, in coordination with CNRA, the Ivorian cacao research agency.
The use of yield-‐enhancing good agricultural practices and inputs has been tied to
knowledge, skills, and access to sufficient inputs, labor and finance (Hatløy et al. 2012, World Cocoa
Foundation 2012). Economic theory indicates that farmers must also believe that implementation
will be profitable. All certifications require training on integrated pest management and fertility
management. RA and UTZ mandate training on additional good agricultural practices, with UTZ
having the most comprehensive coverage. Numerous buyers also provide such training.
79
Certifiers and partners who wish to support yield enhancement should determine if
producers are receiving training on good agricultural practices that are not covered under
certification standards, and train farmers on additional practices as needed. Per industry interviews
(Major 2014, Sendjou 2014), certification requirements and good agricultural practices are already
being combined into a single training program, in some cases. It seems beneficial for such training
to include cost-‐benefit information that would help farmers determine how changing their
practices will affect their profits. Demonstration plots also help farmers see the results of various
management regimes, and evaluate their potential benefits. Development initiatives such as Mars’
(Undated) Vision for Change incorporate these.
Low fertilizer use has largely been tied to financial constraints (Hatløy et al. 2012), as well
as lack of local suppliers (World Cocoa Foundation 2013, IDH Undated). FLO provides credit
through its Fairtrade Access Fund, but it has largely limited this to financing group purchases of
member crops, leaving farmers’ pre-‐season finance needs unaddressed (FLO 2014b). RA connects
groups with credit providers, but does not offer credit (RA 2014b). Per the cacao sector overview,
several buyers extend pre-‐season and pre-‐purchase credit to co-‐ops. Access to affordable farm-‐level
credit remains a widespread challenge in agricultural development, and addressing it requires
cross-‐sector collaboration. Easing credit constraints will not only enable farmers to purchase more
inputs, drawing more suppliers, but would help finance suppliers’ operations.
Through principled producer engagement that is tailored to each group’s needs, and
concerted collaboration that addresses challenges beyond the scope of certification, certifiers, and
others who look to certification as a way to increase producers’ profits, can increase the likelihood
that such improvements will occur. This would help certification live up to its potential, and
promises, and advance the livelihoods of smallholders.
80
References
Adimassu, Z., A. Kessler and H. Hengsdijk. 2012. Exploring Determinants of Farmers’ Investments in
Land Management in the Central Rift Valley of Ethiopia. Applied Geography 35: 191-‐198. ADM. 2011. “Our Commitment to Sustainable Cocoa.” Retrieved on 10/13/14 from adm.com. Afari-‐Sefa, V., J. Gockowski, N. Agyeman and A. Dziwornu. “Economic Cost-‐Benefit Analysis Of Certified
Sustainable Cocoa Production in Ghana.” Paper to African Association of Agricultural Economists and Agricultural Economists Association of South Africa Conference, September 2010.
Agritrade. 2012. “Special Report—December 2012. Côte d’Ivoire’s Cocoa Sector Reforms 2011–2012.”
Retrieved on 3/9/13 from agritrade.ca.int. Almeida, I. 2013. “Armajaro Trading Sold to Ecom After Loss of $7.6 Million.” Bloomberg News,
11/11/13. Accessed at bloomberg.com. Alvarez, G. and O. von Hagen. 2011. “The Impacts of Private Standards on Producers in Developing
Countries: Literature Review Series on the Impacts of Private Standards -‐ Part II.” International Trade Centre Technical Paper. Available at http://ssrn.com/abstract=2184273.
Aneani, F. and K.Ofori-‐Frimpong 2013. “An Analysis of Yield Gap and Some Factors of Cocoa (Theobroma
cacao) Yields in Ghana.” Sustainable Agriculture Research 4: 117-‐127. Arnould, E., A. Plastina and D. Ball. 2009. “Does Fair Trade Deliver on Its Core Value Proposition? Effects
on Income, Educational Attainment, and Health in Three Countries.” Journal of Public Policy & Marketing 28 (2): 186-‐201.
Barham, B. and J. Weber. 2011. “The Economic Sustainability of Certified Coffee: Recent Evidence from
Mexico and Peru.” World Development 40 (6): 1269-‐1279. Barry Callebaut. 2014. “Cocoa Sustainability Report 2013/14.” Retrieved on 10/21/14 from barry-‐
callebaut.com. Barry Callebaut. 2012. “Acquisition of Petra Foods' Cocoa Ingredients Division. Presentation to
Investors, Analysts and Media Conference Call. 12/12/12.” Accessed on 6/3/13 at barry-‐callebaut.com.
Bassett, T. 2010. “Slim pickings: Fairtrade Cotton in West Africa.” Geoforum 41 (1): 44-‐55. Becchetti, L. and M. Costantino. 2008. “The Effects of Fair Trade on Affiliated Producers: An Impact
Analysis on Kenyan Farmers.” World Development 36 (5): 823-‐842. Bennett, M., D. Giovannucci, C. Rue, H. Ayerakwa and A. Agyei-‐ Holmes. 2013. “Cocoa Farms in Ghana: An
Evaluation of the Impact of UTZ Certification on the Sustainability of Smallholders Supported by the Solidaridad Cocoa Programme (2010-‐2012).” Committee on Sustainability Assessment. Retrieved on 9/26/14 from utzcertified.com.
Beuchelt, T.D. and Zeller, M. 2011. “Profits and Poverty: Certification’s Troubled Link for Nicaragua’s
Organic and Fairtrade Coffee Producers.” Ecological Economics 70: 1316–1324.
81
Bisseleua, H., D. Fotio, Yede, A. Missoup and S. Vidal. “Shade Tree Diversity, Cocoa Pest Damage, Yield Compensating Inputs and Farmers’ Net Returns in West Africa.” PLoS One 8 (3): e56115.
Blackman, A. and J. Rivera. 2011. “Producer-‐level Benefits of Sustainability Certification.” Conservation
Biology 25 (6): 1176-‐1185. Blackman, A. and J. Rivera. 2010. “The Evidence Base for Environmental and Socioeconomic Impacts of
“Sustainable” Certification.” Resources for the Future Discussion Paper EfD 10-‐10. Blowfield, M. and C. Dolan. 2011. “Fairtrade Facts and Fancies: What Kenyan Fairtrade Tea Tells Us
about Business’ Role as a Development Agent.” Journal of Business Ethics 93: 143-‐162. Bunge, J. and L. Josephs. 2014. “Cargill to Buy ADM's Chocolate Business for $440 Million.” Wall Street
Journal, 9/2/14. Accessed on 10/20/14 at wsj.com. Buyo, M. 2013. Manager, CEFCA. Personal interview with author. 22 August 2013. Cargill. 2014. “A thriving cocoa sector for generations to come: The 2014 Global Cargill Cocoa Promise
report.” Retrieved on 10/21/14 from cargillcocoachocolate.com. Carter, M. R. 1984. "Identification of the Inverse Relationship Between Farm Size and Productivity: An
Empirical Analysis of Peasant Agricultural Production.” Oxford Economic Papers 36: 131-‐145. CEval. 2012. “Assessing the Impact of Fairtrade on Poverty Reduction through Rural Development.”
Retrieved on 1/3/13 from www.ceval.de. Chan, M. and B. Pound. 2009. “Final Report: Literature Review of Sustainability Standards and Their
Poverty Impact.” Department for International Development and Natural Resources Institute. Retrieved on 3/25/13 from nri.org.
Chavez, A. 2014. Cocoa Sustainability Manager, Certification, Mars, Inc. Personal Interview with the
author. 29 September 2014. Chiputwa, B., D. Spielman and M. Qaim. 2014. “Food Standards, Certification, and Poverty among Coffee
Farmers in Uganda” World Development 66: 400-‐412. Cone Communications/ECHO. 2013. “Global CSR Study.” Cone Communications. Retrieved on 10/17/14
from conecomm.com. The Committee on Sustainability Assessment (COSA). 2014. “The COSA Measuring Sustainability Report:
Coffee and Cocoa in 12 Countries.” Philadelphia, PA: The Committee on Sustainability Assessment. Retrieved 1/30/14 from thecosa.org.
Coulibaly, L. 2011. “Ivory Coast lifts ban on cocoa exports, taxes.” Reuters, 4/14/11. Accessed at
reuters.com. Danso-‐Abbeam, G., E. Setsoafia and I. Ansah. 2014. “Modelling Farmers’ Investment in Agrochemicals:
The Experience of Smallholder Cocoa Farmers in Ghana.” Research in Applied Economics 6 (4): 12-‐27. de Janvry, A., C. McIntosh and E. Sadoulet. 2014. “Fair Trade and Free Entry: Can a Disequilibrium
Market Serve as a Development Tool?” Forthcoming in Review of Economics and Statistics. Retrieved from http://are.berkeley.edu/~esadoulet.
82
Deppeler, A., I. Fromm and R. Aidoo. 2014. “The Unmaking of the Cocoa Farmer: Analysis of Benefits and Challenges of Third-‐party audited Certification Schemes for Cocoa Producers and Laborers in Ghana.” Paper presented at the IFAMA and CCA Agribusiness & Food World Forum, June 2014.
Deutsche Gesellschaft für Technische Zusammenarbeit (GTZ). 2008. “Realise the Difference: Impacts of
the Public Private Partnership Project PPDC.” Retrieved on 10/13/14 from www2.gtz.de. Fair Labor Association. 2012. “Sustainable Management of Nestlé’s Cocoa Supply Chain in the Ivory
Coast—Focus on Labor Standards.” Retrieved on 1/20/13 from fairlabor.org. Fair Trade USA. 2010. “Fair Trade CertifiedTM Cocoa Review.” Retrieved on 9/11/14 from
fairtradeusa.org. [FLO Undated] Fairtrade International. Undated. “The Cocoa Market 1994-‐2013: Comparison of
Fairtrade & New York Prices.” Retrieved on 10/21/14 from fairtrade.net. [FLO 2014a] Fairtrade International. 2014a. “Fairtrade Cocoa in West Africa.” Retrieved on 6/14/14
from fairtrade.net. [FLO 2014b] Fairtrade International. 2014b. “Strong Producers, Strong Future: 2013-‐14 Annual Report.”
Retrieved on 9/2/14 from fairtrade.net. [FLO 2013a] Fairtrade International. 2013a. “Monitoring the Scope and Benefits of Fairtrade, 5th
Edition.” Retrieved on 1/14/14 from fairtrade.net. [FLO 2013b] Fairtrade International. 2013b. “Fairtrade Standard for Cocoa for Small Producer
Organizations (Current Version 01.05.2011 v1.2).” Retrieved on 6/14/14 from fairtrade.net. [FLO 2013c] Fairtrade International. 2013c. “Fairtrade Theory of Change.” Retrieved on 5/24/14 from
fairtrade.net. [FLO 2012] Fairtrade International. 2012. “Fairtrade Standard for Small Producer Organizations
(Current Version 01.05.2011 v1.1).” Retrieved on 5/28/14 from fairtrade.net. [FLO 2011a] Fairtrade International. 2011a. “Products” website section. Accessed on 9/3/14 at
fairtrade.net. [FLO 2011b] Fairtrade International. 2011b. “About Us” website section. Accessed on 9/3/14 at
fairtrade.net. [FLO 2011c] Fairtrade International. 2011c. “Standards” website section. Accessed on 9/14/14 at
fairtrade.net. [FLO 2011d] Fairtrade International. 2011d. “Generic Fairtrade Trade Standard (Current Version
01.05.2011).” Retrieved on 10/21/11 from fairtrade.net. Fenske, J. 2011. Land Tenure and Investment Incentives: Evidence from West Africa. Journal of
Development Economics 95: 137-‐156. FLOCERT. 2014. “Fee System Small Producer Organizations.“ Retrieved on from fairtrade.net.
83
Fort, R., and R. Ruben. 2008a. “The impact of Fair Trade on Banana Producers in Northern Peru.” In R. Ruben, editor. The Impact of Fair Trade. Wageningen Academic Publishers, Wageningen, the Netherlands: 49-‐73.
Fort, R., and R. Ruben. 2008b. “Assessment of the Effect of Fair Trade on Smallholder Producers in Costa
Rica: A Comparative Study in the Coffee Sector.” In R. Ruben, editor. The Impact of Fair Trade. Wageningen Academic Publishers, Wageningen, the Netherlands: 75-‐98.
Fortson, J., N. Murray and K. Velyvis. 2011. “Cocoa Livelihoods Program (CLP) Baseline Memo.”
Mathematica Policy Research, Inc. Fromm, I. and J. Dubón. 2006. “Upgrading and the Value Chain Analysis: The Case of Small-‐scale Coffee
Farmers in Honduras.” Presented at Tropentag 2006, a Conference on International Agricultural Research for Development, Bonn, Germany, October 2006.
GIZ. 2011 “Mars Partnership for African Cocoa-‐Communities of Tomorrow (iMPACT).” Retrieved on
10/13/14 from giz.de. George, E. 2012. “Structure & Competition in West Africa’s Cocoa Trade,” 11/21/12. Ecobank. Retrieved
on 6/25/14 from ecobank.com. Giovannucci, D. and J. Potts. 2010. “Seeking Sustainability: COSA Preliminary Analysis of Sustainability
Initiatives in the Coffee Sector.” Committee on Sustainability Assessment. Retrieved on 3/21/12 from from thecosa.org.
Hatløy, A., T. Kebede, P. Adeba and C. Elvis. 2012. “Towards Côte d’Ivoire Sustainable Cocoa Initiative.”
Fafo. Retrieved on 9/27/14 from nhomatogdrikke.no. ICRAF/World Agroforestry Center 2013. “Grafting and Replanting Plan.” (From K. Smoot.) IDH Sustainable Trade Initiative. Undated. “Cocoa Program” website section. Accessed on 9/30/14 at
idhsustainabletrade.com. Ingram, V., Y. Waarts, L. Ge, S. van Vugt, L. Wegner, L. Puister-‐Jansen, F. Ruf and R. Tanoh. 2014. “Impact
of UTZ Certification of Cocoa in Ivory Coast: Assessment Framework and Baseline.” LEI Wageningen UR. Retrieved on 10/24/14 from utzcertified.org.
[ICCO 2014a] International Cocoa Organization. 2014a. “Monthly Average of World Cocoa Prices.”
Accessed October 2014 from icco.org. [ICCO 2014b] International Cocoa Organization. 2014b. Quarterly Bulletin of Cocoa Statistics: Cocoa year
2013/2014, XL (3), 9/5/14. ICCO. Accessed on 9/9/14 at icco.org. [ICCO 2014c] International Cocoa Organization. 2014c. “The World Cocoa Economy: Current Status,
Challenges and Prospects.” Retrieved on 9/13/14 from unctad.org. [ICCO 2014d] International Cocoa Organization. 2102. “The World Cocoa Economy: Past and Present.”
Retrieved on 9/13/14 from icco.org. [ICCO Undated] International Cocoa Organization. Undated. “About Cocoa” website section. Accessed on
9/7/14 at www.icco.org.

84
Jaffee, D. 2008. “Better, But Not Great’: The Social and Environmental Benefits and Limitations of Fair Trade for Indigenous Coffee Producers in Oaxaca, Mexico.” In R. Ruben, editor. The Impact of Fair Trade. Wageningen Academic Publishers, Wageningen, the Netherlands.
Jena, P. R., B. Chichaibelub, T. Stellmachera and U. Grote. 2012. “The Impact of Coffee Certification on
Small-‐scale Producers’ Livelihoods: A Case Study From the Jimma Zone, Ethiopia.” Agricultural Economics 43: 429–440
Jessop, R., B. Diallo, M. Duursma, A. Mallek, J, Harms and B. van Manen. 2012. “Creating Access to
Agricultural Finance: Based on a horizontal study of Cambodia, Mali, Senegal, Tanzania, Thailand and Tunisia. Agencie Francias Developpement.” Retrieved on 7/20/14 from afd.fr.
Kamau, M., L. Mose, R. Fort, and R. Ruben. 2012. “The Impact of Certification on Smallholder Coffee
Farmers in Kenya: The case of ‘UTZ’ Certification Program.” Paper presented at the Joint 3rd African Association of Agricultural Economists and 48th Agricultural Economists Association of South Africa Conference, Cape Town, South Africa, September 2010.
KPMG. 2012. “Cocoa Certification: Study of the Costs, Advantages and Disadvantage of Cocoa
Certification, Commissioned by the International Cocoa Organization.” Retrieved on 11/22/12 from icco.org.
Laan, T. and H. Guilhuis. 2014. M&E Officer, UTZ Certified. Personal communication with the author,
September 2014. Lazaro, A., J. Makindara, and T. Kilma. 2008. “Sustainability Standards and Coffee Exports from
Tanzania.” Working paper No 2008/1. Danish Institute for International Studies, Copenhagen. Major, R. 2014. Senior Manager, Sustainability Initiatives, The Hershey Company. Personal
communication with the author. 29 October 2014. Marenya, P. and C. Barrett. 2007. “Household-‐level Determinants of Adoption of Improved Natural
Resources Management Practices Among Smallholder Farmers in Western Kenya.” Food Policy 32: 515-‐536.
Mars, Inc. Undated. “Vision for Change.” Retrieved on 3/11/13 at mars.com. Melo, C. and G. Hollander. 2013. “Unsustainable Development: Alternative Food Networks and the
Ecuadorian Federation of Cocoa Producers, 1995-‐2010.” Journal of Rural Studies 32: 251-‐263. Méndez, V.E., C. M. Bacon, M. Olson, S. Petchers, D. Herrador, C. Carranza, L. Trujillo, C. Guadarrama-‐
Zugasti, A. Cordón and A. Mendoza. 2010. “Effects of Fair Trade and Organic Certifications on Small-‐scale Coffee Farmer Households in Central America and Mexico.” Renewable Agriculture and Food Systems 25 (3): 236–251
Nelson, V & B. Pound. 2009. “A Review of the Impact of Fairtrade over the Last Ten Years.” Fairtrade
Foundation. Retrieved on 3/27/13 from fairtrade.net. Nestlé. Undated. “Nestlé and Sustainable Cocoa: ‘The Cocoa Plan’.” Retrieved on 10/13/14 at nestle.com. Nieberg, O. 2014. “Over half of certified cocoa may be sold as conventional cocoa.” Confectionery
News.com, 8/27/14. Accessed at confectionerynews.com.

85
Nielsen Company, The. 2014. “Doing Well By Doing Good.” Retrieved on 10/17/14 at nielsen.com. Onoja, A., N. Deedam, and A. Achike. 2012. “Profitability and Yield Determinants in Nigerian Cocoa
Farms: Evidence from Ondo State.” Journal of Sustainable Development in Africa 14 (4): 172-‐182. Opoku-‐Ameyaw, K., F. Baah, E. Gyedu-‐Akoto, V. Anchirinah, H. K. Dzahini-‐Obiatey, A. R. Cudjoe, S. Aquaye
and S. Y. Opoku. 2010. Cocoa Manual. Cocoa Research Institute of Ghana. Payson Center for International Development and Technology Transfer, Tulane University. 2010.
“Fourth Annual Report: Oversight of Public and Private Initiatives to Eliminate the Worst Forms of Child Labor in the Cocoa Sector in Côte d’Ivoire and Ghana.” Retrieved on 9/30/10 from cocoainitiative.org
Pinto, L., T. Gardner, C.McDermott and K. Ayub. 2014. “Group Certification Supports an Increase in the
Diversity of Sustainable Agriculture Network–Rainforest Alliance Certified Coffee Producers in Brazil.” Ecological Economics 107: 59–64
Place, F. 2009. “Land Tenure and Agricultural Productivity in Africa: A Comparative Analysis of the
Economics Literature and Recent Policy Strategies and Reforms.” World Development 37 (8): 1326–1336.
Potts, J., M. Lynch, A. Wilkings, G. Huppé, M. Cunningham and V. Voora. 2014. “State of Sustainability
Initiatives.” International Institute for Sustainable Development and the International Institute for Environment and Development. Retrieved on 4/4/14 from iisd.org.
RA-‐Cert. 2012. “Rainforest Alliance Certification Manual, Sustainable Agriculture.” Retrieved on 9/15/14
from rainforest-‐alliance.org. [RA 2014a] Rainforest Alliance. 2014a. “Our Work.” Accessed on 9/4/14 at rainforest-‐alliance.org. [RA 2014b] Rainforest Alliance. 2014b. “Engage Your Business” website section. Accessed on 9/15/14 at
rainforest-‐alliance.org. [RA 2014c] Rainforest Alliance. 2014c. “About Us” website section. Accessed on 9/4/14 at rainforest-‐
alliance.org. [RA 2013a] Rainforest Alliance. 2013a. “Connections: Rainforest Alliance Annual Report 2013.”
Retrieved on 9/4/14 from rainforest-‐alliance.org. [RA 2013b] Rainforest Alliance. 2013b. “2013 Highlights: The Rainforest Alliance’s Global Sustainability
Efforts.” Retrieved on 8/13/14 from rainforest-‐alliance.org. Riisgaard, L., G. Michuki, P. Gibbon, S. Bolwig, N. Warring and L. Rantz. 2009. “The Performance of
Voluntary Standard Schemes from the Perspective of Small Producers in East Africa.” Copenhagen: Danish Institute for International Studies, Copenhagen.
Ruben, R. and R. Fort 2011. “The Impact of Fair Trade Certification for Coffee Farmers in Peru.” World
Development 40 (3): 570-‐582. Ruben, Fort and Zúñiga-‐Arias. 2009. “Measuring the Impact of Fair Trade on Development.” Development
in Practice, 19 (6): 777-‐788.

86
Ruben, R., L. Clercx, D. Cepeda, and T. de Hopp. 2008. “Fair Trade Impact of Banana Production in El Guabo Association, Ecuador: a Production Function Analysis.” In R. Ruben, editor. The Impact of Fair Trade. Wageningen Academic Publishers, Wageningen, the Netherlands: 155-‐167.
Ruben, R. and G. Zuniga. (2011). “How Standards Compete: Comparative Impact of Coffee Certification
Schemes in Northern Nicaragua.” Supply Chain Management: An International Journal 16 (2): 98-‐109.
Rueda, X. and E. Lambin. 2013. “Responding to Globalization: Impacts of Certification on Colombian Small-‐Scale Coffee Growers.” Ecology and Society 18 (3): 21
Saitone, T. and R. Sexton. 2010. “Product Differentiation and Quality in Food Markets: Industrial Organization Implications.” Annual Review of Resource Economics 2: 341–68. Saltini, R., R. Akkerman and S. Frosch. 2013. “Optimizing Chocolate Production Through Traceability: A
Review of the Influence of Farming Practices on Cocoa Bean Quality.” Food Control 29: 167-‐187. Sendjou, G. 2014. Sustainability Manager, Archer Daniels Midland. Personal Interview with the author. 4
November 2014. Smith, R. 2004. Land Tenure, Fixed Investment, and Farm Productivity: Evidence from Zambia’s
Southern Province. World Development 32 (10): 1641–1661. Smith, S. 2010. “Fairtrade Bananas: A Global Assessment of Impact.” Institute of Development Studies,
University of Sussex. Retrieved on 8/4/14 from fairtrade.net. Spaggiari Souza, C., L. dos Santos Dias, M. Galeas Aguilar, S Sonegheti, J. Oliveira and J. Andrade Costa.
2009. “Cacao Yield in Different Planting Densities.” Brazilian Archives of Biology and Technology 52: 1313-‐1320.
Stemler, C. 2012. “Analysis of On-‐farm Fertilizer Trials in Côte d’Ivoire and Implications for Fertilizer
Distribution Strategies.” IDH Sustainable Trade Initiative. Retrieved on 8/3/14 from idhsustainabletrade.com.
[SAN 2014] Sustainable Agriculture Network. 2014. “General Interpretation Guide -‐ Sustainable
Agriculture Standard.” Retrieved on from san.ag. [SAN 2011a] Sustainable Agriculture Network. 2011a. “Group Certification Standard, March 2011 (v. 2).”
Retrieved on 3/7/12 from san.ag. [SAN 2011b] Sustainable Agriculture Network. 2011b. “Group Certification Policy, March 2011 (v. 2).”
Retrieved on 3/7/12 from san.ag. [SAN 2010] Sustainable Agriculture Network. 2010. “Sustainable Agriculture Standard, July 2010 (v. 2).”
Retrieved 3/7/12 on from san.ag. Sustainable Tree Crops Program. 2009. “Sustainable Tree Crops Program—Côte d’Ivoire.” Retrieved on
10/13/14 at iita.org. [TCC 2012] Tropical Commodity Coalition. 2012. “2012 Cocoa Barometer.“ Retrieved on 12/3/12 from
cocoabarometer.org.

87
[UNDP 2013] United Nations Development Program. 2013. “Human Development Report 2013: The Rise of the South: Human Progress in a Diverse World.” Available at hdr.undp.org.
[UNCTAD 2008] United Nations Conference on Trade and Development. 2008. “Cocoa Study: Industry
Structures and Competition.” Retrieved on 10/20/11 from unctad.org. Utting-‐Chamorro, K. 2005. “Does Fair Trade Make a Difference? The Case of Small Coffee Producers in Nicaragua.” Development in Practice 153: 584-‐99. [UTZ 2014a] UTZ Certified. 2014a. “About UTZ Certified” website section. Accessed on 9/4/14 at
www.utzcertified.org. [UTZ 2014b] UTZ Certified. 2014b. “Annual Report 2013.“ Retrieved on 9/5/14 from utzcertified.org. [UTZ 2014c] UTZ Certified. 2014c. “UTZ Certified Impact Report 2014.” Retrieved on 1/21/14 from
utzcertified.org. [UTZ 2014d] UTZ Certified. 2014d. “Core Code of Conduct, Version 1.0: For individual and multi-‐site
certification.” Retrieved on 9/3/14 from utzcertified.org. [UTZ 2014e] UTZ Certified. 2014e. “Code of Conduct, Cocoa Module, Version 1.0.” Retrieved on 9/2/14
from utzcertified.org. [UTZ 2009] UTZ Certified. 2009. “Good Inside Code of Conduct for Cocoa.” Retrieved on 6/13/10 from
utzcertified.org. Vagneron, I. and S. Roquigny. 2010. “What Do We Really Know About the Impact of Fair Trade?” CIRAD.
Retrieved on 8/10/14 from commercequitable.org. Valkila, J. 2009. “Fair Trade Organic Coffee Production in Nicaragua — Sustainable Development or a
Poverty Trap?” Ecological Economics 68 (12): 3018-‐3025. Valkila, J. and A. Nygren. 2008. “Impacts of Fair Trade-‐certification on Coffee Farmers, Cooperatives, and
Laborers in Nicaragua.” Paper presented at the 3rd Fair Trade International Symposium, May 2008. Waarts, Y., L. Ge, G. Ton and D. Jansen. 2012. “Sustainable Tea Production in Kenya: Impact Assessment
of Rainforest Alliance and Farmer Field School Training.” LEI Wageningen UR. Retrieved on 10/11/14 from rainforest-‐alliance.org.
World Cocoa Foundation. 2014a. “Cocoa Market Update, April, 2014.” Retrieved on 9/11/14 from
worldcocoa.org. [WCF 2014b] World Cocoa Foundation. 2014b. “Programs” website section. Accessed on 10/12/14 at
worldcocoa.org. World Cocoa Foundation. 2013. “Committed to Cocoa-‐Growing Communities.” Retrieved on 9/11/14
from worldcocoa.org. Zúniga-‐Arias, G., and F. Sáenz Segura. 2008. The Impact of Fair Trade in Banana Production of Costa Rica.
In R. Ruben, editor. The Impact of Fair Trade. Wageningen Academic Publishers, Wageningen, the Netherlands: 99-‐116.

88
Appendix A: Survey Instruments
A1: Producer Survey
Harvest Year For Survey: October 2012-‐September 2013 * Emphasize to farmer that questions refer to this period – where it says the "last cocoa year" unless specified *
i. Survey Number: ____________________________ Date:________________ ii. Surveyor's name: _______________________________ iii. Initial for YES: Farmer provided consent_______ Met Screening Questions ______ iv. Farmer's Name: _________________________________________________ v. Farm Location: Sub-‐Prefecture ___________________ Village ________________ vi. Farmer's Cooperative: ______________________________Year Joined ________ vii. Certification/s (if applicable): Fairtrade Rainforest Alliance Utz Year Obtained _____ vii. How did producer get into certification (circle): a) Co-‐op chose to get certified
b) Third party (specify) asked Co-‐op asked to get certified:_____________________ c) Producer chose to join co-‐op that was already certified
Socioeconomic Characteristics 1. What is your age? ____________ OR what year were you born __________ 2. What is the primary farmer's gender? M F 3. What is your ethnicity? _________________ Nationality? _______________ 4. What level of schooling have you completed: __________ 5. How many family members live in your home? Under 18 _____ Over 18 _____ 6. What was your household's total income last year? ____________________ Farm Characteristics 7. How many years have you been working as a cacao farmer? _______________
8. What is the arrangement for the land you farm on (circle)? Own Family Land, Sharecropper
Rent Work on land for another person Other If other, what is the arrangement? __________________________________ 9. How many hectares are planted in cacao, what age are the trees and how many trees do you have per hectare? (Fill in total if farmer knows. Use chart only if they can report only separate plots.) TOTAL i) Hectares _____________ ii) Age of trees ____________ iii) Cacao trees/ha _____________
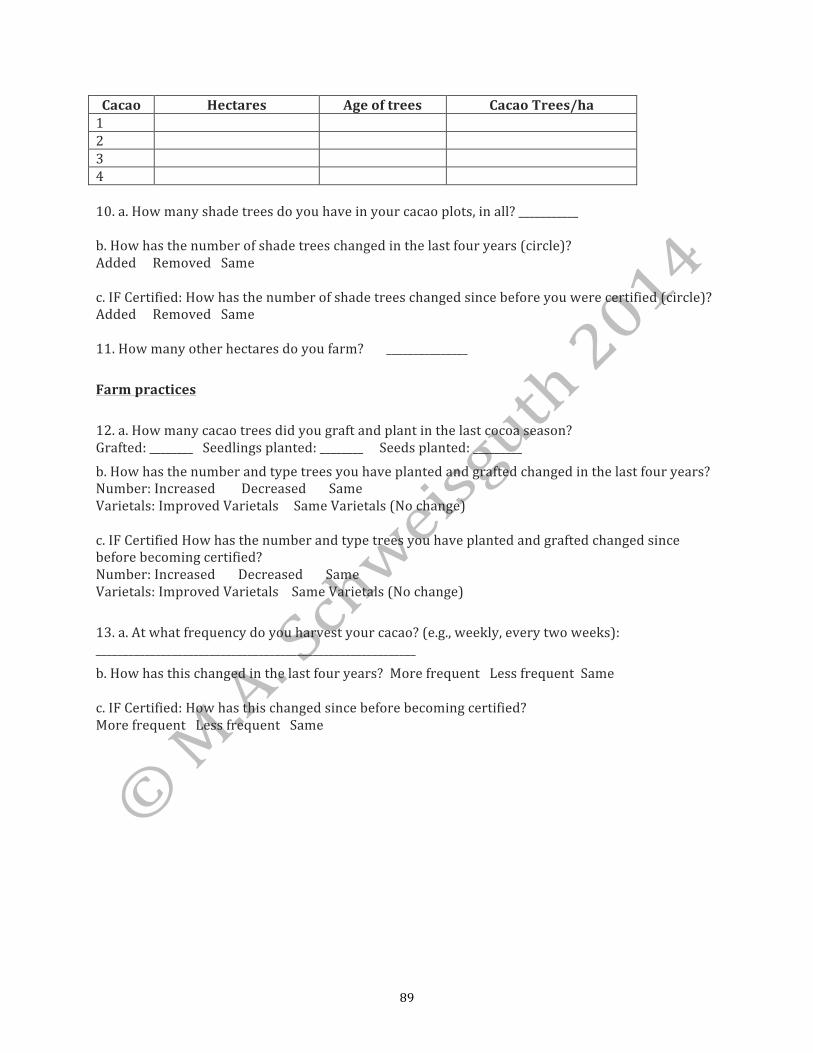
89
Cacao Hectares Age of trees Cacao Trees/ha 1 2 3 4 10. a. How many shade trees do you have in your cacao plots, in all? ___________ b. How has the number of shade trees changed in the last four years (circle)? Added Removed Same
c. IF Certified: How has the number of shade trees changed since before you were certified (circle)? Added Removed Same 11. How many other hectares do you farm? _______________ Farm practices 12. a. How many cacao trees did you graft and plant in the last cocoa season? Grafted: ________ Seedlings planted: ________ Seeds planted: _________ b. How has the number and type trees you have planted and grafted changed in the last four years? Number: Increased Decreased Same Varietals: Improved Varietals Same Varietals (No change)
c. IF Certified How has the number and type trees you have planted and grafted changed since before becoming certified? Number: Increased Decreased Same Varietals: Improved Varietals Same Varietals (No change) 13. a. At what frequency do you harvest your cacao? (e.g., weekly, every two weeks): ___________________________________________________________ b. How has this changed in the last four years? More frequent Less frequent Same
c. IF Certified: How has this changed since before becoming certified? More frequent Less frequent Same
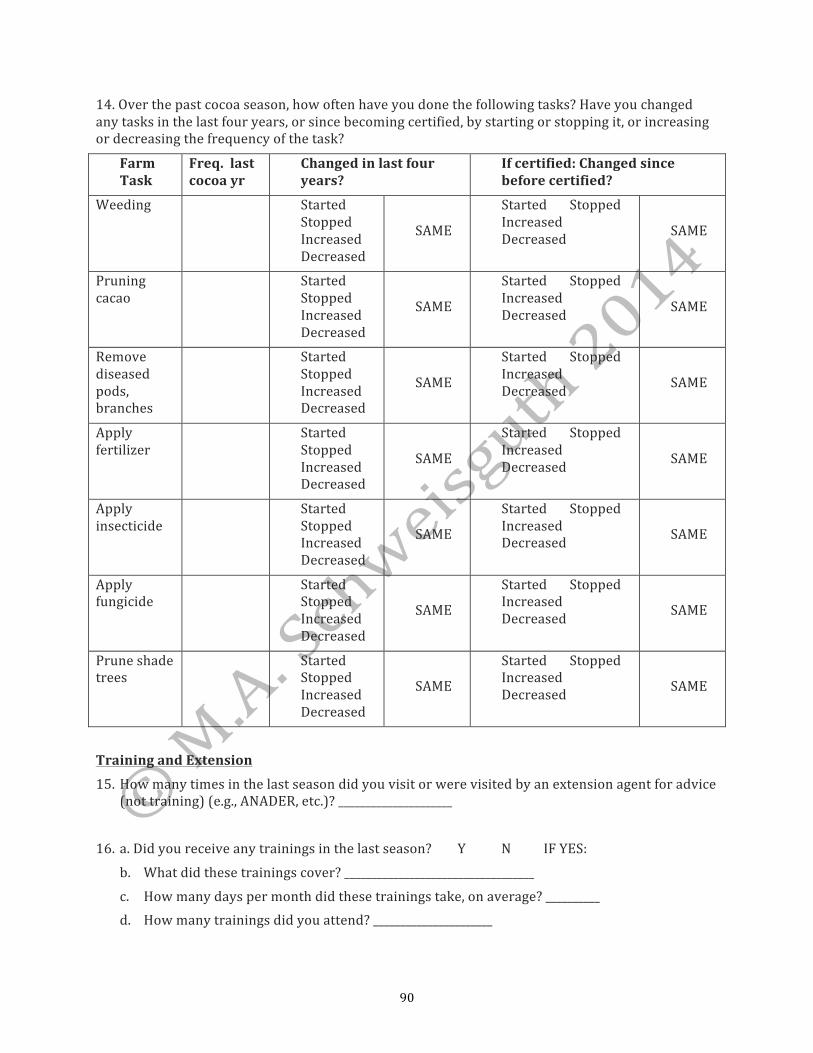
90
14. Over the past cocoa season, how often have you done the following tasks? Have you changed any tasks in the last four years, or since becoming certified, by starting or stopping it, or increasing or decreasing the frequency of the task?
Farm Task
Freq. last cocoa yr
Changed in last four years?
If certified: Changed since before certified?
Weeding Started Stopped Increased Decreased
SAME
Started Stopped Increased Decreased SAME
Pruning cacao
Started Stopped Increased Decreased
SAME
Started Stopped Increased Decreased SAME
Remove diseased pods, branches
Started Stopped Increased Decreased
SAME
Started Stopped Increased Decreased SAME
Apply fertilizer
Started Stopped Increased Decreased
SAME
Started Stopped Increased Decreased SAME
Apply insecticide
Started Stopped Increased Decreased
SAME
Started Stopped Increased Decreased SAME
Apply fungicide
Started Stopped Increased Decreased
SAME
Started Stopped Increased Decreased SAME
Prune shade trees
Started Stopped Increased Decreased
SAME
Started Stopped Increased Decreased SAME
Training and Extension 15. How many times in the last season did you visit or were visited by an extension agent for advice
(not training) (e.g., ANADER, etc.)? _____________________ 16. a. Did you receive any trainings in the last season? Y N IF YES:
b. What did these trainings cover? ___________________________________ c. How many days per month did these trainings take, on average? __________ d. How many trainings did you attend? ______________________
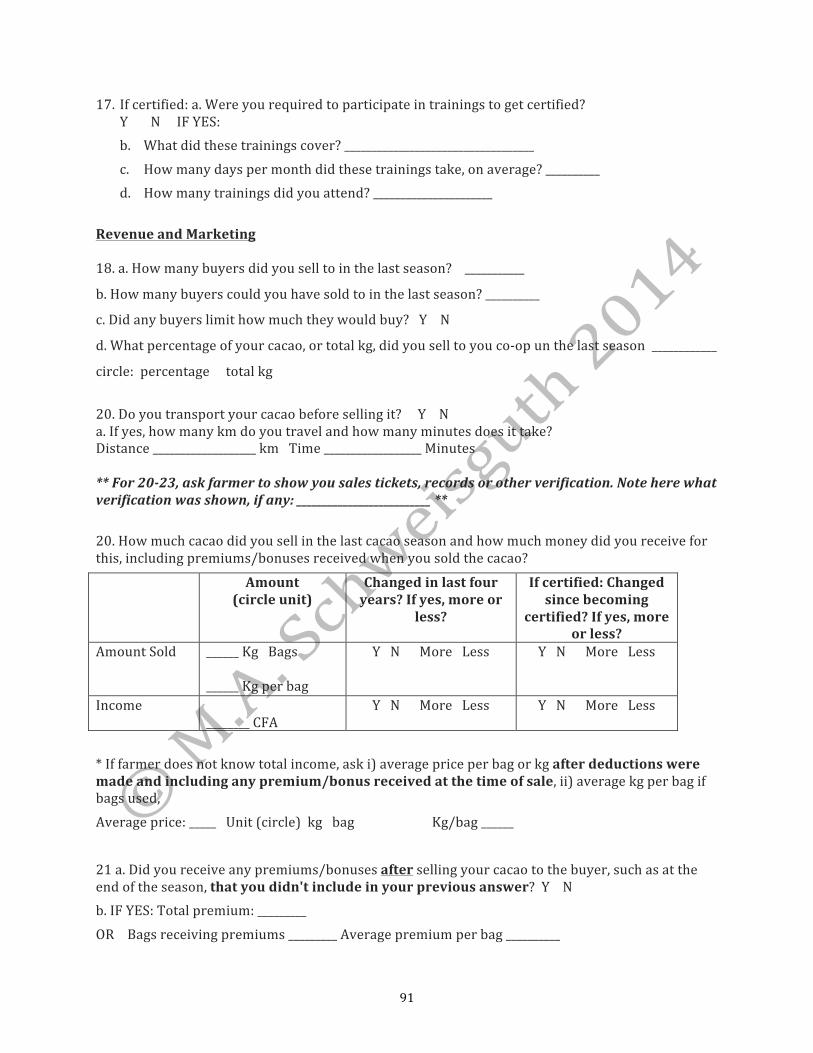
91
17. If certified: a. Were you required to participate in trainings to get certified? Y N IF YES: b. What did these trainings cover? ___________________________________ c. How many days per month did these trainings take, on average? __________ d. How many trainings did you attend? ______________________
Revenue and Marketing 18. a. How many buyers did you sell to in the last season? ___________
b. How many buyers could you have sold to in the last season? __________
c. Did any buyers limit how much they would buy? Y N
d. What percentage of your cacao, or total kg, did you sell to you co-‐op un the last season ____________
circle: percentage total kg
20. Do you transport your cacao before selling it? Y N a. If yes, how many km do you travel and how many minutes does it take? Distance ___________________ km Time __________________ Minutes ** For 20-‐23, ask farmer to show you sales tickets, records or other verification. Note here what verification was shown, if any: __________________________ ** 20. How much cacao did you sell in the last cacao season and how much money did you receive for this, including premiums/bonuses received when you sold the cacao?
Amount (circle unit)
Changed in last four years? If yes, more or
less?
If certified: Changed since becoming
certified? If yes, more or less?
Amount Sold ______ Kg Bags ______ Kg per bag
Y N More Less Y N More Less
Income ________ CFA
Y N More Less Y N More Less
* If farmer does not know total income, ask i) average price per bag or kg after deductions were made and including any premium/bonus received at the time of sale, ii) average kg per bag if bags used, Average price: _____ Unit (circle) kg bag Kg/bag ______ 21 a. Did you receive any premiums/bonuses after selling your cacao to the buyer, such as at the end of the season, that you didn't include in your previous answer? Y N b. IF YES: Total premium: _________ OR Bags receiving premiums _________ Average premium per bag __________

92
22. IF farmer reported premiums above: Do you know how much of a premium you received for quality, certification and other premiums.
Type of Premium Premium Received
Amount of Premium
Unit Premium Applied To
Quality Y N Kg Bag Other (state) Certified cacao (if certified)
Y N Kg Bag Other (state)
Other (state) Y N Kg Bag Other (state) 23. If certified: How many kg of cacao did you sell under certified terms (designated as certified at the "certified" price/premium) in the last cacao year? ___________ Expenditures 24. How much time did family members work on the cacao farm year last season? Age range Hours
worked per day
Days worked per week
Changed in last four
years? If yes, more or less?
If certified: Changed since becoming certified? If yes, more or less?
Adults age 18+ Y N More Less
Y N More Less
Youth < age 18 Y N More Less
Y N More Less
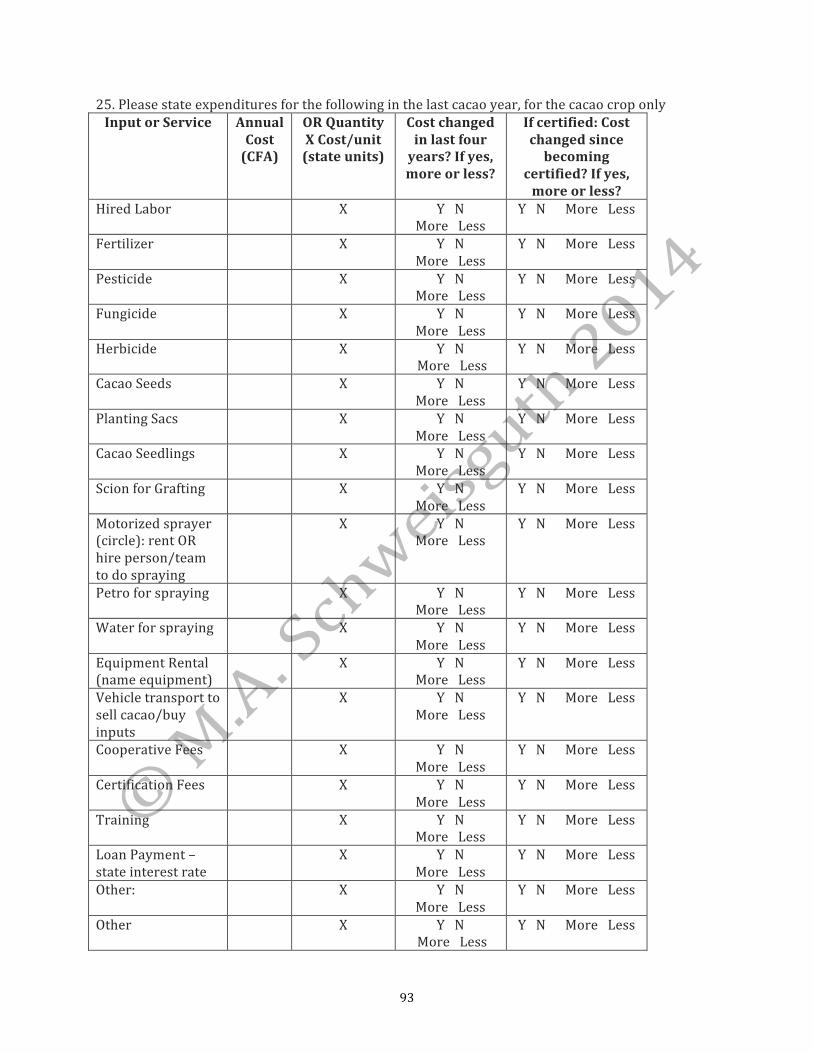
93
25. Please state expenditures for the following in the last cacao year, for the cacao crop only Input or Service Annual
Cost (CFA)
OR Quantity X Cost/unit (state units)
Cost changed in last four years? If yes, more or less?
If certified: Cost changed since becoming
certified? If yes, more or less?
Hired Labor X Y N More Less
Y N More Less
Fertilizer X Y N More Less
Y N More Less
Pesticide X Y N More Less
Y N More Less
Fungicide
X Y N More Less
Y N More Less
Herbicide X Y N More Less
Y N More Less
Cacao Seeds X Y N More Less
Y N More Less
Planting Sacs X Y N More Less
Y N More Less
Cacao Seedlings X Y N More Less
Y N More Less
Scion for Grafting X Y N More Less
Y N More Less
Motorized sprayer (circle): rent OR hire person/team to do spraying
X Y N More Less
Y N More Less
Petro for spraying X Y N More Less
Y N More Less
Water for spraying X Y N More Less
Y N More Less
Equipment Rental (name equipment)
X Y N More Less
Y N More Less
Vehicle transport to sell cacao/buy inputs
X Y N More Less
Y N More Less
Cooperative Fees X Y N More Less
Y N More Less
Certification Fees X Y N More Less
Y N More Less
Training X Y N More Less
Y N More Less
Loan Payment – state interest rate
X Y N More Less
Y N More Less
Other: X Y N More Less
Y N More Less
Other X Y N More Less
Y N More Less
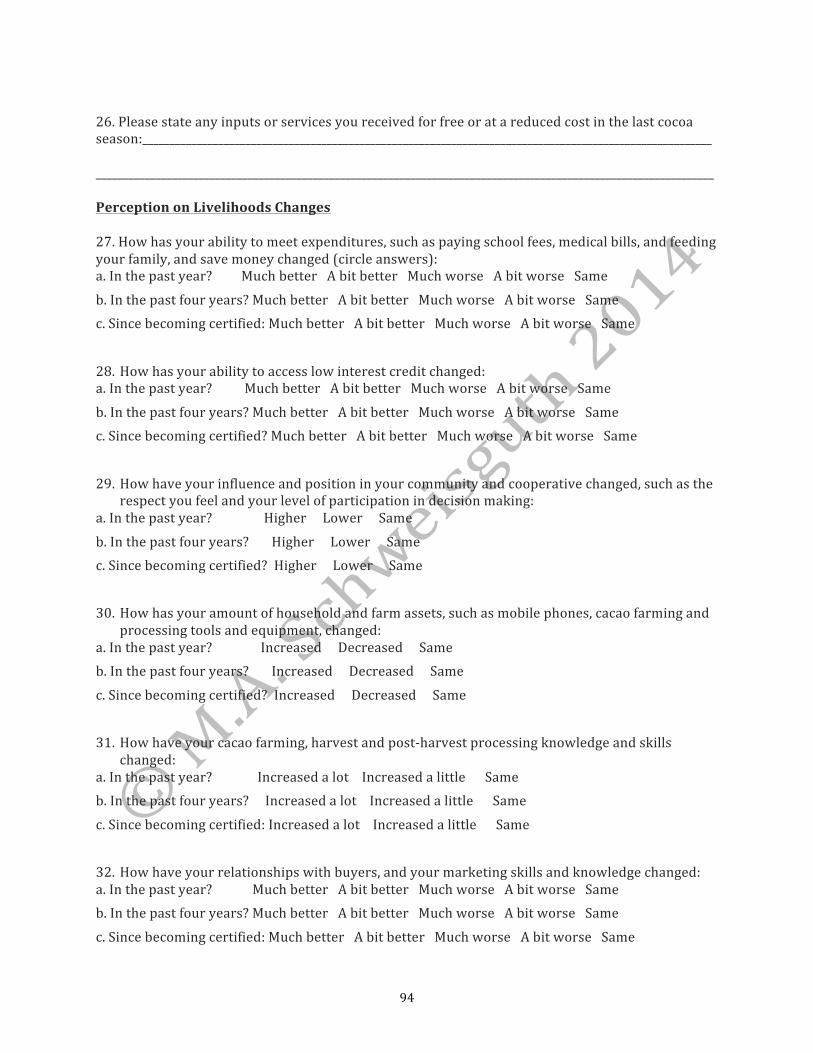
94
26. Please state any inputs or services you received for free or at a reduced cost in the last cocoa season:_________________________________________________________________________________________________________ __________________________________________________________________________________________________________________ Perception on Livelihoods Changes 27. How has your ability to meet expenditures, such as paying school fees, medical bills, and feeding your family, and save money changed (circle answers): a. In the past year? Much better A bit better Much worse A bit worse Same b. In the past four years? Much better A bit better Much worse A bit worse Same c. Since becoming certified: Much better A bit better Much worse A bit worse Same 28. How has your ability to access low interest credit changed: a. In the past year? Much better A bit better Much worse A bit worse Same b. In the past four years? Much better A bit better Much worse A bit worse Same c. Since becoming certified? Much better A bit better Much worse A bit worse Same 29. How have your influence and position in your community and cooperative changed, such as the
respect you feel and your level of participation in decision making: a. In the past year? Higher Lower Same b. In the past four years? Higher Lower Same c. Since becoming certified? Higher Lower Same 30. How has your amount of household and farm assets, such as mobile phones, cacao farming and
processing tools and equipment, changed: a. In the past year? Increased Decreased Same b. In the past four years? Increased Decreased Same c. Since becoming certified? Increased Decreased Same 31. How have your cacao farming, harvest and post-‐harvest processing knowledge and skills
changed: a. In the past year? Increased a lot Increased a little Same b. In the past four years? Increased a lot Increased a little Same c. Since becoming certified: Increased a lot Increased a little Same 32. How have your relationships with buyers, and your marketing skills and knowledge changed: a. In the past year? Much better A bit better Much worse A bit worse Same b. In the past four years? Much better A bit better Much worse A bit worse Same c. Since becoming certified: Much better A bit better Much worse A bit worse Same

95
33. If Certified: What were you promised, that you would get from certification, and what did you expect to get from it? Which of these have you received?
Promised Expected Received Better prices Y N Y N Y N Better income Y N Y N Y N More timely payments Y N Y N Y N Better access to markets and buyers
Y N Y N Y N
Better relationship with buyers Y N Y N Y N Better farming and processing skills
Y N Y N Y N
Higher yields Y N Y N Y N Better quality cacao Y N Y N Y N More training Y N Y N Y N Better inputs – planting material, chemicals
Y N Y N Y N
Cheaper inputs Y N Y N Y N Cheaper services Y N Y N Y N Pre-‐financing from your buyer/s Y N Y N Y N Better access to credit, besides buyer pre-‐financing
Y N Y N Y N
Cheaper loan rates Y N Y N Y N Other (specify): Y N Y N Y N

96
A2. Co-‐op Management Interview: Certified Co-‐ops Surveyor ______________________________________Date ___________________________
Co-‐op name____________________________________________________________________
Year founded ___________________________ Number of members _____________________
Sub-‐Prefect________________________________ Village______________________________
Nam and title of person interviewed _________________________________________________
1. What certification/s does your co-‐op have, and what year were these obtained? Certification ______________________________ Year Obtained ________________ Certification ______________________________ Year Obtained ________________ Certification ______________________________ Year Obtained ________________ IF co-‐op has multiple certifications, complete a separate survey for each and state certification the below questions relate to: _________________________________________
2. Why did the co-‐op decide to get certified? Also, did you approach the certifier or were you
approached? 3. How much did the co-‐op spend to obtain this certification, including direct costs such as farm
inspections and indirect costs like hiring extra staff to track sales? ______________________ 4. How much does the co-‐op spend yearly to maintain this certification, including direct costs like
farm inspections and indirect costs like hiring extra staff to track sales? ______________
5. What was the price/kg the co-‐op received for cacao under this certification in the 2012013 season? _______________
6. What was the premium/bonus farmers received from the buyer under this certification in the
2012-‐13 season? _____________ CIRCLE unit premium applies to: kg bag annual flat rate
7. What percentage of the co-‐op's cacao is sold under this certification? __________________
8. What was the average price/kg the co-‐op received for non-‐certified cacao in the 2012013
season? _______________

97
9. In the last cacao season, what were the amounts of any premiums/bonuses given to the co-‐op, and/or invested directly by your buyer/s, for co-‐op and community development projects? a. Premium given to co-‐op by certified buyer/s, for projects selected by co-‐op ___________________ b. Direct investment by certified buyer/s, for projects identified by buyer ________________________
c. Funds given to co-‐op by non-‐certified buyer/s, for projects selected by co-‐op ___________________ d. Direct investment by non-‐certified buyer/s, for projects identified by buyer ____________________
10. What projects were funded in the last three years from the following funds?
a. Premium given to co-‐op by certified buyer/s, for projects selected by co-‐op (with or without buyer input)
b. Direct investment by certified buyer/s for projects identified by buyer (with or without co-‐op input) c. Funds given to co-‐op by non-‐certified buyer/s, for projects selected by co-‐op
d. Direct investment by non-‐certified buyer/s, for projects identified by buyer
11. Overall, how do you feel certification has impacted the co-‐op and its members financially?
12. What price per kg did the co-‐op pay its members in the 2012-‐13 season? ________________ 13. What fees do co-‐op members pay the co-‐op at present:
a. Annual dues _______________________
b. Mandatory services, and fees including cost share for certification fees, not covered under
annual dues (specify service with fee and term—annual, per use, etc.
c. Voluntary services and fees (specify service with fee and term)

98
A3. Co-‐op Management Interview: Non-‐Certified Co-‐ops Surveyor ______________________________________Date ___________________________
Co-‐op name____________________________________________________________________
Year founded ___________________________ Number of members _____________________
Sub-‐Prefect________________________________ Village______________________________
Nam and title of person interviewed _________________________________________________
1. What is the average price/kg the co-‐op receives for its cacao? _______________ 2. What is the average premium farmers receive from the co-‐op's buyers if any? _____________
CIRCLE unit premium applies to: kg bag annual flat rate
3. What percentage of the co-‐op's cacao receives any price premium? ___________________
4. In the last cacao season, what were the amounts of any payments or bonus given to the co-‐op,
and/or investments made by buyer, for co-‐op, farm and community development projects? a. Payments given to co-‐op, for projects selected by co-‐op _______________________
b. Direct investment by buyer, for projects identified by buyer __________________
5. What projects were funded in the last three years from the following funds?
a. Payments given to co-‐op, for projects selected by co-‐op (with or without buyer input)
b. Direct investment by buyer for projects identified by buyer (with or without co-‐op input)
6. What price per kg does the co-‐op pay its members? ________________ 7. What fees do co-‐op members pay the co-‐op:
a. Annual dues _______________________
b. Mandatory services, and fees, not covered under annual dues (specify service with fee
and term—annual, per use, etc.)
c. Voluntary services and fees (specify service with fee and term)

99
Appendix B: Additional Data
Table B1: Summary Statistics, Certified Producers & Controls, 2012-‐13 Cacao Season
Controls Certified Farmers Sig.
Diff. Variable N Mean Std. Dev. N Mean Std. Dev. Farmer Socioeconomic Traits Age 75 44.89 10.24 222 45.96 11.13 Male 76 1 0 223 0.97 0.16 Household (HH) size 76 10.92 4.92 220 10.73 7.08 HH income, CFA 76 1,809,500 1,465,820 223 1,923,996 1,770,340 HH income/HH member, CFA 76 185,654.50 153,523.7 220 212,109.1 186,502.2
Years of education 74 5.92 4.60 215 6.32 4.79
Farmer and Farm Characteristics Years in co-‐op 75 6.91 5 220 7.42 4.8 Years growing cacao 75 19.80 10.55 219 19 10.49 Extension visits/yr 72 3.79 7.27 215 10.46 12.31 *** Training sessions/yr 72 4.89 9.33 222 1485 14.35 *** Total cacao ha 76 5.69 4.17 222 5.84 4.59 Mature cacao ha 76 5.44 4.08 222 5.75 4.59 Total farm ha 71 7.88 5.48 220 7.66 6 Avg. cacao trees/ha 65 1,312.07 238.88 190 1,31.07 203.68 Shade trees/ha 74 5.88 6.55 220 7.56 8.40 *
Farm Practices and Itemized Expenditures Good ag prac. (of 7) 76 4.87 1.11 221 4.89 1.2
Weeding frequency/yr 75 2.55 0.64 223 2.85 1.58 ** Pruning frequency/yr 69 5.26 8.30 193 14.42 32.92 *** Fertilizer apps/yr 76 0.21 0.51 222 0.22 0.5 Insecticide apps/yr 76 1.91 1.11 223 1.64 1.27 Fungicide applications 75 1.32 1.22 223 1.29 1.2 Fertilizer exp./ha, CFA 75 5,370.20 18,919.92 221 4,939.51 6,711.15 Insecticide exp/ha, CFA 75 6,518.84 8,203.04 220 3,857.54 6,671.44 *** Fungicide exp/ha, CFA 75 1,918.33 5,261.12 220 958.93 2,900.61 Pesticide exp./ha, CFA 74 8,551.68 11,799.58 220 4,816.47 8,638.22 ** Labor exp./ha, CFA 74 43,943.46 49,077.78 220 33,371.87 51,060.84 Family labor hr/wk/ha 76 23.71 20.73 221 24.67 37.88
Marketing Buyers used 76 1.33 0.60 223 1.07 0.25 *** Buyers in market 74 2.22 1.75 213 1.70 1.55 ** Co-‐op members 76 256.74 120.53 223 678.64 45.82 *** % cacao sold to co-‐op 75 92.47 18.98 221 97.81 10.99 **

100
% cacao sold as certified 76 N/A N/A 219 88.36 20.73
Number of certs. 76 N/A N/A 229 1.56 0.69
Yrs. since 1st cert. 76 N/A N/A 201 3.01 0.99 Transports cacao to market (dum, Y=1) 75 0.25 0.44 221 0.26 0.44
Time to transport cacao to market, min 75 19.88 45.93 215 22.76 49.22
Economic Outcomes Yield, kg/mature ha 76 444.12 299.69 222 463.01 305.91 Avg. price, CFA/kg 76 729.82 22.04 222 760.81 27.4 *** Gross rev., CFA/ha 76 316,252.6 220,944.2 222 344,046.9 225,598.6 Variable cash expenditure CFA/ha 76 65,946.11 60,191.11 222 47,133.73 60,850.18
**
Expenditure Efficiency CFA/kg 76 223
***
Cash profit CFA/ha 76 250,306.4 210,656.2 222 296,913.2 205,386.1 * p-‐values for certified versus controls in each region: * p ≤ 0.1 ** p ≤ 0.05 *** p ≤ 0.01

101
Table B2: Means For Certified Farmers and Controls By Region, Agronomic Inputs and Economic Outcomes
Soubré Divo Adzopé
N 74 certified 25 controls N 74 certified
25 controls N 74 certified 26 controls
Variable Difference and p-‐value
Difference and p-‐value
Difference and p-‐value
Weeding frequency Certified 2.80 2.84 2.90 Controls 2.58 2.60 2.46 Pruning frequency Certified 4.15 18.27 *** 20.89 *** Controls 5.67 2.72 7.65 Fertilizer expenditure/ha, CFA Certified 13,100.36 758.62 ** 1,069.82 Controls 14,314.89 0.00 1,726.65 Insecticide expenditure/ha, CFA Certified 8,164.83 1,714.88 * 1,722.24 *** Controls 8,405.65 4,414.19 6,841.08 Fungicide expenditure/ mature ha, CFA Certified 1,846.37 364.30 674.28 * Controls 1,007.36 1,140.00 3607.62 Pesticide expenditure/ha, CFA Certified 10,011.20 2,079.18 ** 2,396.52 ** Controls 9,413.01 5,601.69 10,522.35 Labor expenditure/ha, CFA Certified 25,744.28 45,720.23 28,444.95 Controls 41,723.89 51,060.52 39,063.61 Family labor hours/wk/ha Certified 28.87 16.82 28.15 Controls 30.10 20.50 20.56 Yield, kg/bearing ha Certified 469.61 474.5 ** 444.93 Controls 609.38 347.09 378.52 Average price, CFA/kg Certified 761.74*** 766.97*** 753.71*** Controls 731.15 721.72 736.34 Gross revenue, CFA/ha Certified 358,170.0 356,698.6 *** 317,272.1 Controls 446,525.1 250,410.7 254,300.0
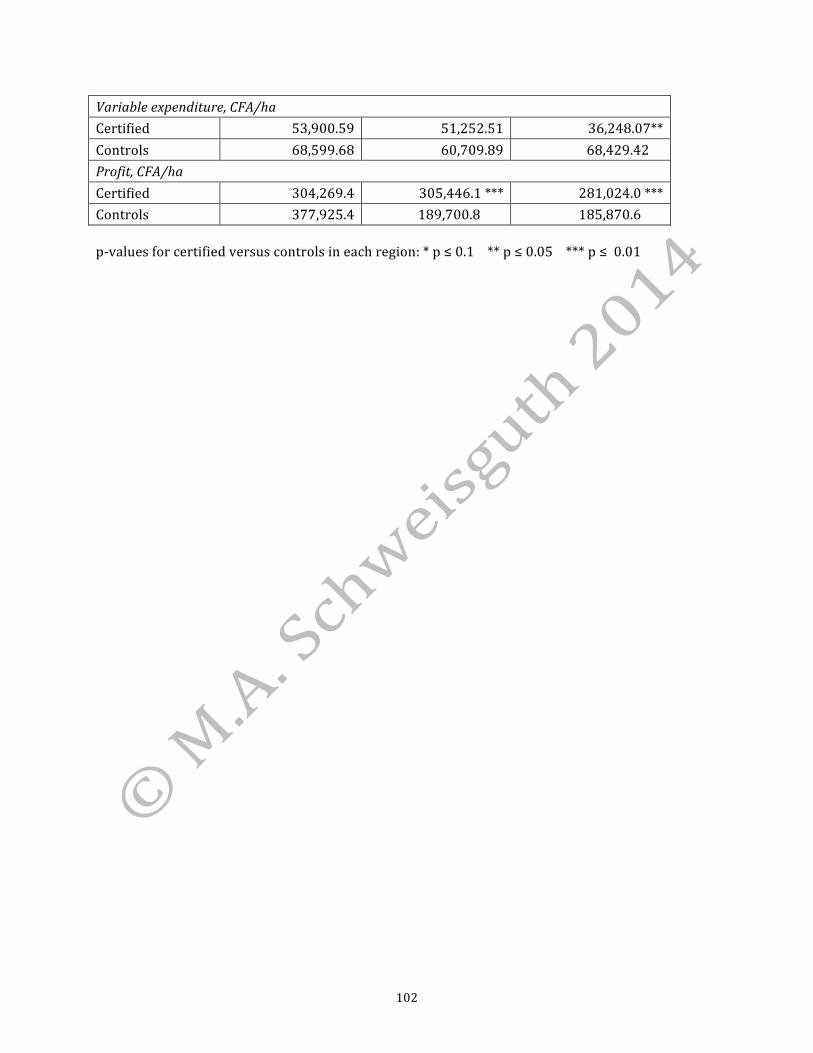
102
Variable expenditure, CFA/ha Certified 53,900.59 51,252.51 36,248.07** Controls 68,599.68 60,709.89 68,429.42 Profit, CFA/ha Certified 304,269.4 305,446.1 *** 281,024.0 *** Controls 377,925.4 189,700.8 185,870.6 p-‐values for certified versus controls in each region: * p ≤ 0.1 ** p ≤ 0.05 *** p ≤ 0.01

103
Table B3: Differences in Means Between Certified Farmers and Controls, 2012-‐13 Season a
Soubré Divo Adzopé Overall
Variable N Difference and p-‐value N Difference
and p-‐value N Difference and p-‐value N Difference
and p-‐value Farm and Farmer Characteristics; Farm Practices and Itemized Expenditures
Farmer’s age 24 73 -‐0.33
25 74 0.11
26 75 3.29
75 222 1.07
Years of education
25 71 0.94
24 72 1.68
25 72 -‐1.40 *
74 215 0.40
Owns Farm (dummy Y=1)
25 74 0.06
25 74 -‐0.01
26 75 0.03
76 223 0.03
Bearing cacao ha
25 74 -‐0.01
25 74 0.62
26 74 0.28
76 222 0.32
Total farm ha 2474 -‐1.16
2172 0.69
25 72 0.40
70 218 -‐0.22
Cacao trees/ha 25 72 -‐36.49
2371 -‐38.45
17 47 71.57
65 154 -‐11.00
Extension visits 25 74 7.25 ***
22 74 4.47 ***
25 71 9.97
72 215 6.67 ***
Training sessions
25 74 10.12 ***
24 74 5.54 ***
26 74 14.17 ***
76 222 9.96 ***
Shade trees/ha 25 74 0.68
24 74 0.78
25 72 3.38 ***
74 220 1.69 *
Weeding frequency/yr
24 74 0.21
25 74 0.24
26 75 0.44
75 223 0.30 **
Pruning Frequency/yr
21 63 1.51
25 74 15.55 ***
23 56 13.24 ***
69 193 9.16 ***
Fertilizer applications
25 73 0.05
25 74 0.16 ***
26 75 0.18
76 222 0.01
Insecticide applications
25 74 0.02
25 74 0.19
26 75 -‐0.97 ***
76 223 -‐0.27 *
Fungicide applications
25 74 0.24
25 74 0.42 *
25 75 0.27
75 223 0.03
Fertilizer exp./ha, CFA
25 73 -‐ 12,14.53
24 74 758.62 **
26 74 -‐656.83
75 220 430.70
Insecticide exp./ha, CFA
25 73 -‐ 240.82
24 74 -‐2,699 *
26 73 -‐5,052 ***
75 220
-‐2,728 **
Fungicide exp./ha, CFA
25 73 839.00
25 74 -‐775.70
25 73 -‐2,933.3 *
75 220 -‐1,202.9
Pesticide exp./ha, CFA
25 73
598.19 25 74
-‐3,522.51 **
25 73
-‐8,125.8 **
74 220
-‐3,735.2 **
Labor exp.ha, CFA
23 72
-‐ 15,979.6 25 74 -‐5,340.29
26 74 -‐10,618.6
74 220 -‐ 10,572
Family labor hr/wk/ha
25 74
-‐1.24 25 73 -‐3.76
26 74 7.59
76 221 0.94
Marketing and Economic Outcomes
Buyers used 25 74 -‐0.26 **
25 74 -‐0.23 **
26 75 -‐0.29 **
76 223 -‐0.26 ***
Buyers in market
25 74 -‐0.54 *
25 67 0.17
24 72 -‐0.75
74 213 -‐0.51 **
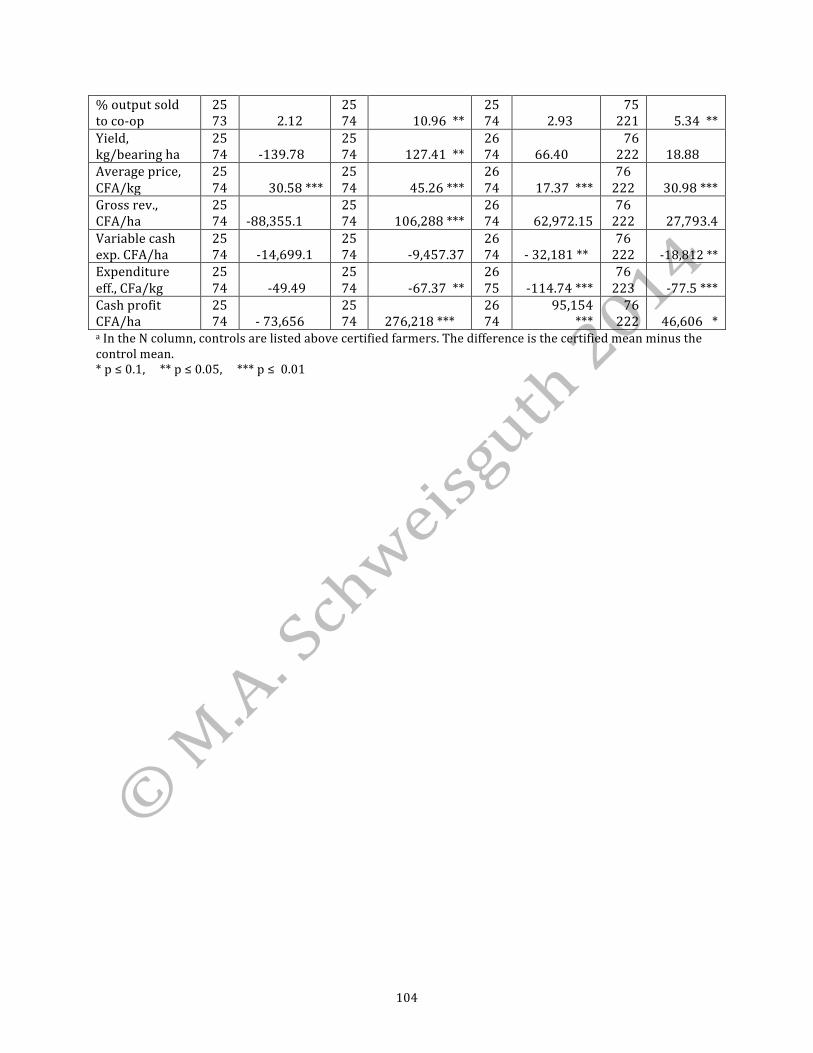
104
% output sold to co-‐op
25 73 2.12
25 74 10.96 **
25 74 2.93
75 221 5.34 **
Yield, kg/bearing ha
25 74 -‐139.78
25 74 127.41 **
26 74 66.40
76 222 18.88
Average price, CFA/kg
25 74 30.58 ***
25 74 45.26 ***
26 74 17.37 ***
76 222 30.98 ***
Gross rev., CFA/ha
25 74 -‐88,355.1
25 74 106,288 ***
26 74 62,972.15
76 222 27,793.4
Variable cash exp. CFA/ha
25 74 -‐14,699.1
25 74 -‐9,457.37
26 74 -‐ 32,181 **
76 222 -‐18,812 **
Expenditure eff., CFa/kg
25 74 -‐49.49
25 74 -‐67.37 **
26 75 -‐114.74 ***
76 223 -‐77.5 ***
Cash profit CFA/ha
25 74 -‐ 73,656
25 74 276,218 ***
26 74
95,154 ***
76 222 46,606 *
a In the N column, controls are listed above certified farmers. The difference is the certified mean minus the control mean. * p ≤ 0.1, ** p ≤ 0.05, *** p ≤ 0.01
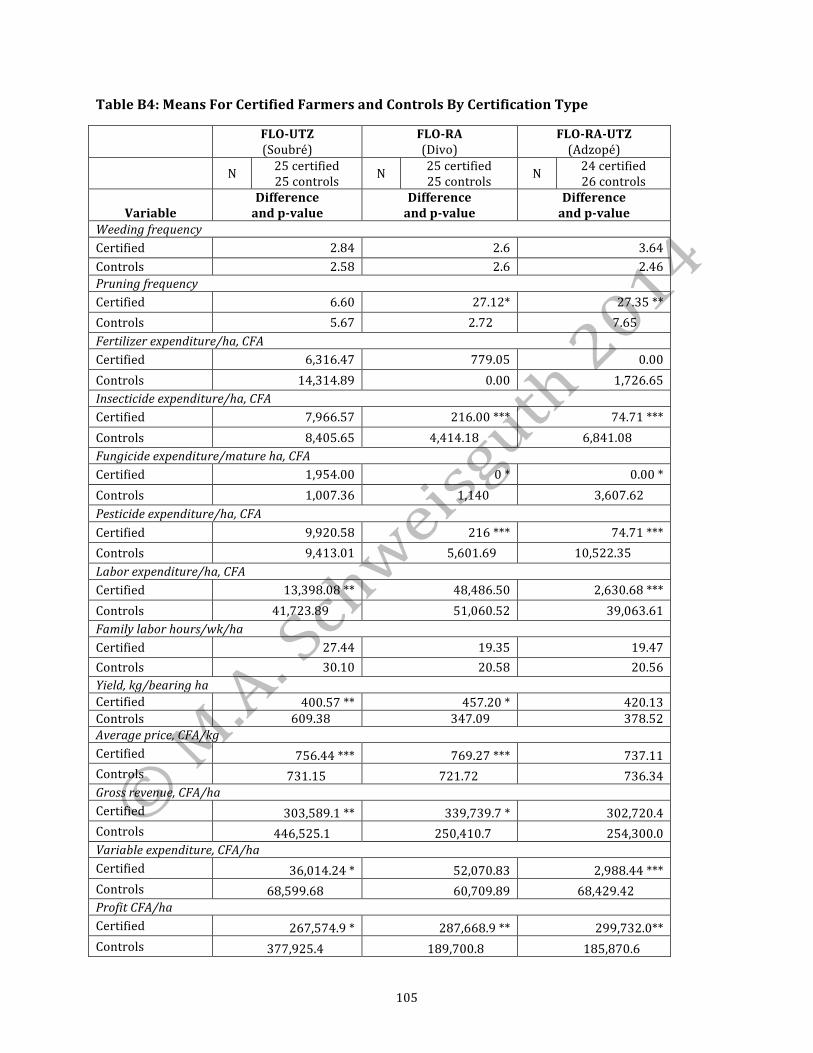
105
Table B4: Means For Certified Farmers and Controls By Certification Type
FLO-‐UTZ (Soubré)
FLO-‐RA (Divo)
FLO-‐RA-‐UTZ (Adzopé)
N 25 certified 25 controls N 25 certified
25 controls N 24 certified 26 controls
Variable Difference and p-‐value
Difference and p-‐value
Difference and p-‐value
Weeding frequency Certified 2.84 2.6 3.64 Controls 2.58 2.6 2.46 Pruning frequency Certified 6.60 27.12* 27.35 ** Controls 5.67 2.72 7.65 Fertilizer expenditure/ha, CFA Certified 6,316.47 779.05 0.00 Controls 14,314.89 0.00 1,726.65 Insecticide expenditure/ha, CFA Certified 7,966.57 216.00 *** 74.71 *** Controls 8,405.65 4,414.18 6,841.08 Fungicide expenditure/mature ha, CFA Certified 1,954.00 0 * 0.00 * Controls 1,007.36 1,140 3,607.62 Pesticide expenditure/ha, CFA Certified 9,920.58 216 *** 74.71 *** Controls 9,413.01 5,601.69 10,522.35 Labor expenditure/ha, CFA Certified 13,398.08 ** 48,486.50 2,630.68 *** Controls 41,723.89 51,060.52 39,063.61 Family labor hours/wk/ha Certified 27.44 19.35 19.47 Controls 30.10 20.58 20.56 Yield, kg/bearing ha Certified 400.57 ** 457.20 * 420.13 Controls 609.38 347.09 378.52 Average price, CFA/kg Certified 756.44 *** 769.27 *** 737.11 Controls 731.15 721.72 736.34 Gross revenue, CFA/ha Certified 303,589.1 ** 339,739.7 * 302,720.4 Controls 446,525.1 250,410.7 254,300.0 Variable expenditure, CFA/ha Certified 36,014.24 * 52,070.83 2,988.44 *** Controls 68,599.68 60,709.89 68,429.42 Profit CFA/ha Certified 267,574.9 * 287,668.9 ** 299,732.0** Controls 377,925.4 189,700.8 185,870.6

106
RA (Soubré and Divo)
RA-‐UTZ (Adzopé)
UTZ (All Departments)
N 48 certified 50 controls N 25 certified
26 controls N 74 certified 76 controls
Variable Difference and p-‐value
Difference and p-‐value
Difference and p-‐value
Weeding frequency Certified 2.56 2.6 2.93 *** Controls 2.59 2.46 2.55 Pruning frequency Certified 13.23 25.42** 6.11 Controls 4.07 7.65 5.26 Fertilizer expenditure/ha, CFA Certified 10,236.11 2,100.00 5,023.02 Controls 7,303.52 1,726.65 5,370.20 Insecticide expenditure/ha, CFA Certified 5,437.76 2,752.82 ** 4309.15 * Controls 6,450.65 6,841.08 6586.00 Fungicide expenditure/ha, CFA Certified 1,279.63 1,958.33 741.96 * Controls 1,073.68 3,607.62 1,918.33 Pesticide expenditure/ha, CFA Certified 6,717.39 4,711.15 5,051.12 ** Controls 7,546.24 10,522.35 8,551.68 Labor expenditure/ha, CFA Certified 40,514.47 52,518.57 33,704.19 Controls 46,586.72 39,063.61 43,943.46 Family labor hours/wk/ha Certified 23.21 19.55 29.74 Controls 25.34 20.56 23.71 Yield, kg/bearing ha Certified 500.83 440.52 482.77 Controls 478.24 378.52 444.12 Average price, CFA/kg Certified 765.40 *** 761.24 *** 763.94 *** Controls 726.44 736.34 729.82 Gross revenue, CFA/ha Certified 381,745.9 317,793.6 356,816.9 Controls 348,467.9 254,300.0 316,252.6 Variable expenditure, CFA/ha Certified 61,741.78 66,478.98 47,523.44 ** Controls 64,654.78 68,429.42 65,946.11 Profit CFA/ha Certified 320,004.1 251,314.6 309,293.4 Controls 283,813.1 185,870.6 250,306.4

107
Table B5: Significant Differences Between Certified Farmers and Controls By Certification Type, Economic Outcomes and Agronomic Inputs
FLO-‐UTZ (Soubré)
FLO-‐RA (Divo)
FLO-‐RA-‐UTZ (Adzopé)
N 25 certified 25 controls N 25 certified
25 controls N 24 certified 26 controls
Variable Difference and p-‐value
Difference and p-‐value
Difference and p-‐value
Yield, kg/bearing ha -‐ 208.81 ** 110.11 * 41.61 Average price, CFA/kg 25.28 *** 47.55 *** 0.77 Gross revenue, CFA/ha -‐ 142,936 ** 89,329.01 * 48,420.46 Variable exp. CFA/ha -‐ 32,585.44 * -‐8,639.05 -‐65,440.98 *** Profit CFA/ha -‐ 110,350.6 * 97,968.06 ** 113,861.40 ** Other significant differences
Higher: Extension (**) Training (**) Lower: Farm buyers (*)
Higher: Extension (*) Training (***) Good ag. prac. (***) Pruning freq. (*) Fertilizer app. (*) Fungicide app. (***) % sold to co-‐op (**) Lower: Education (***) Insecticide exp. (***) Fungicide exp. (***) Farm buyers (**), Transport dummy and minutes (*)
Higher: Years in co-‐op (**) Extension (*) Training (***) Shade trees/ha (*) Pruning freq. (**) Lower: HH Inc (*) Insect exp. (**) Farm and market buyers (**)
RA (Soubré and Divo)
RA-‐UTZ (Adzopé)
UTZ (All Departments)
N 48 certified 50 controls N 25 certified
26 controls N 75 certified 76 controls
Variable Difference and p-‐value
Difference and p-‐value
Difference and p-‐value
Yield, kg/bearing ha
Overall 22.59 Divo 102.71 * 62.00
Overall 38.64 Divo 168.41 *
Average price, CFA/kg 38.97 *** 24.90 *** 34.11 *** Gross revenue, CFA/ha
Overall 33,278 Divo 90,404.62 * 63493.58
Overall 40,564.31 Divo 138,494.9 **
Variable exp. CFA/ha -‐ 2,913 -‐ 1,950.44 -‐ 18,422.67 **
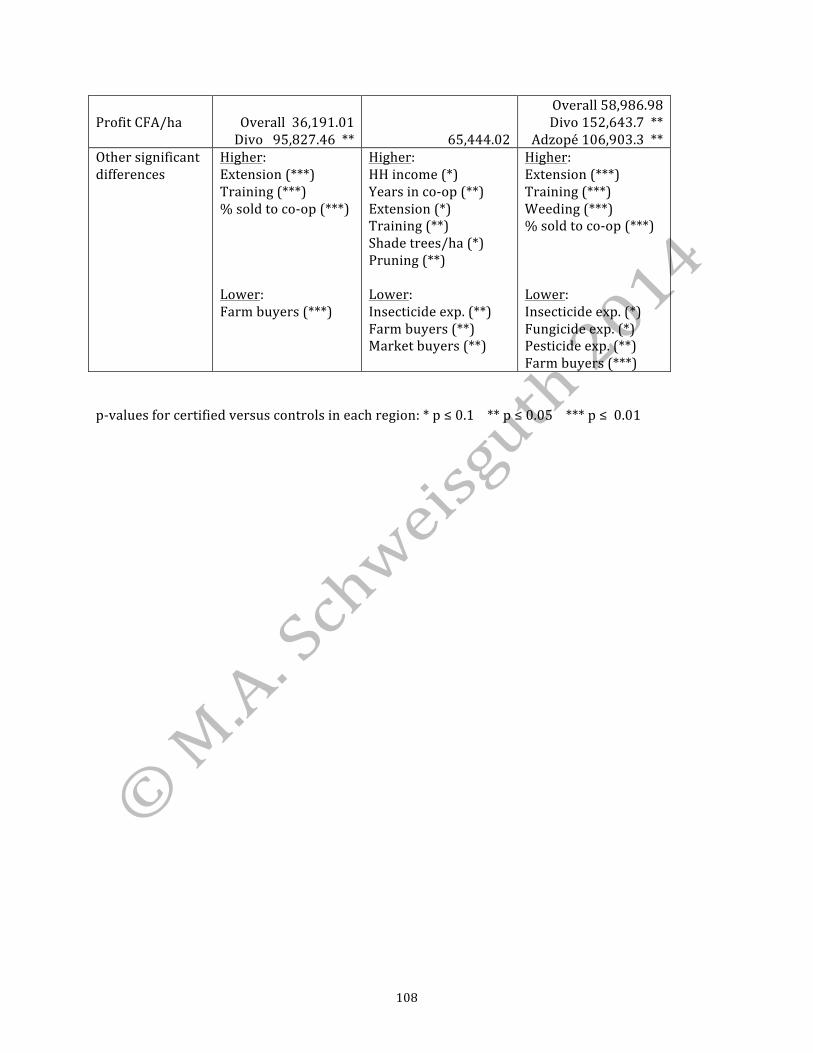
108
Profit CFA/ha Overall 36,191.01 Divo 95,827.46 ** 65,444.02
Overall 58,986.98 Divo 152,643.7 **
Adzopé 106,903.3 ** Other significant differences
Higher: Extension (***) Training (***) % sold to co-‐op (***) Lower: Farm buyers (***)
Higher: HH income (*) Years in co-‐op (**) Extension (*) Training (**) Shade trees/ha (*) Pruning (**) Lower: Insecticide exp. (**) Farm buyers (**) Market buyers (**)
Higher: Extension (***) Training (***) Weeding (***) % sold to co-‐op (***) Lower: Insecticide exp. (*) Fungicide exp. (*) Pesticide exp. (**) Farm buyers (***)
p-‐values for certified versus controls in each region: * p ≤ 0.1 ** p ≤ 0.05 *** p ≤ 0.01