evaluating wsp’s rural sanitation and hygiene campaign
TRANSCRIPT
Evaluating WSP’s Rural Sanitation and Hygiene Campaign Programs
Measuring health outcomes: Early lessons
Global Impact Evaluation TeamMarch 2011

WSP’s Rural Sanitation and Handwashing programs
Outcome Measures
Challenges (1): underreporting of symptoms
Challenges (2): attrition
In-focus: Appropriate recall periods for diarrhea and other caregiver-reported symptoms
Agenda
2

WSP’s Rural Sanitation Program
• East Java, Indonesia (29 districts)• Madhya Pradesh, India• Tanzania (10 districts)
3

WSP’s Hand Washing Program
• Perú• Senegal (4 regions)• Vietnam (3 provinces)• Tanzania (10 districts)
4

Outcome Measures (I)Health and Welfare Impacts
What Does the Evaluation
Measure?
How Is It Being Measured? Measuring Instrument
Diarrhea prevalence Caregiver reported symptoms collected
in a 14-day health calendar
Household questionnaire
Child growth Anthropometric measures:
- Weight
- Height
- Arm and head circumference
In-household collection of
anthropometric measures
Child developmental and
social-emotional screening
Composite measures Ages and stages questionnaires
adapted
Anemia Hemoglobin concentration (< 110g/L
per international standards)
In household collection and
analysis of capillary blood using
the HemoCue photometer
5

Outcome Measures (II)Health and Welfare Impacts
What Does the Evaluation
Measure?
How Is It Being Measured? Measuring Instrument
Parasite prevalence Egg counting of stool preserved samples
with modified Kato Katz method; ELISA
for protozoan
In-house collection of stool from
children (0-24 mo) at baseline
Environmental contamination (selected countries & measures)
• sentinel objects• drinking water (hh level)• hand-rinse • water source contamination
• Membrane filtration for prevalence of E.coli; total coliforms
In-house collection of water
samples, rinse of sentinel
objects and hands, water source
samples
Economic • productivity and time savings–caretakers
• facilities and implements (e.g. soap) costing - capital cost and maintenance
• opportunity costs
Household questionnaire
Education School enrollment and attendance Household questionnaire
6
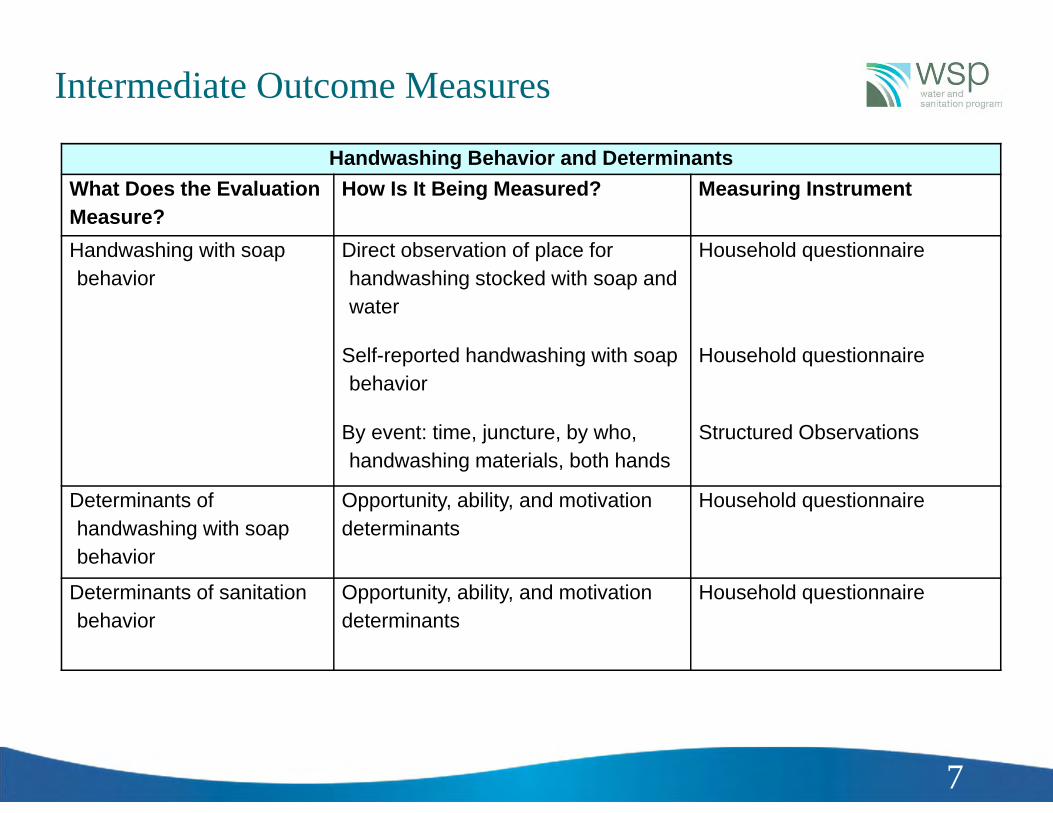
Intermediate Outcome Measures
Handwashing Behavior and DeterminantsWhat Does the Evaluation Measure?
How Is It Being Measured? Measuring Instrument
Handwashing with soap behavior
Direct observation of place for handwashing stocked with soap and water
Self-reported handwashing with soap behavior
By event: time, juncture, by who, handwashing materials, both hands
Household questionnaire
Household questionnaire
Structured Observations
Determinants of handwashing with soap behavior
Opportunity, ability, and motivation determinants
Household questionnaire
Determinants of sanitation behavior
Opportunity, ability, and motivation determinants
Household questionnaire
7
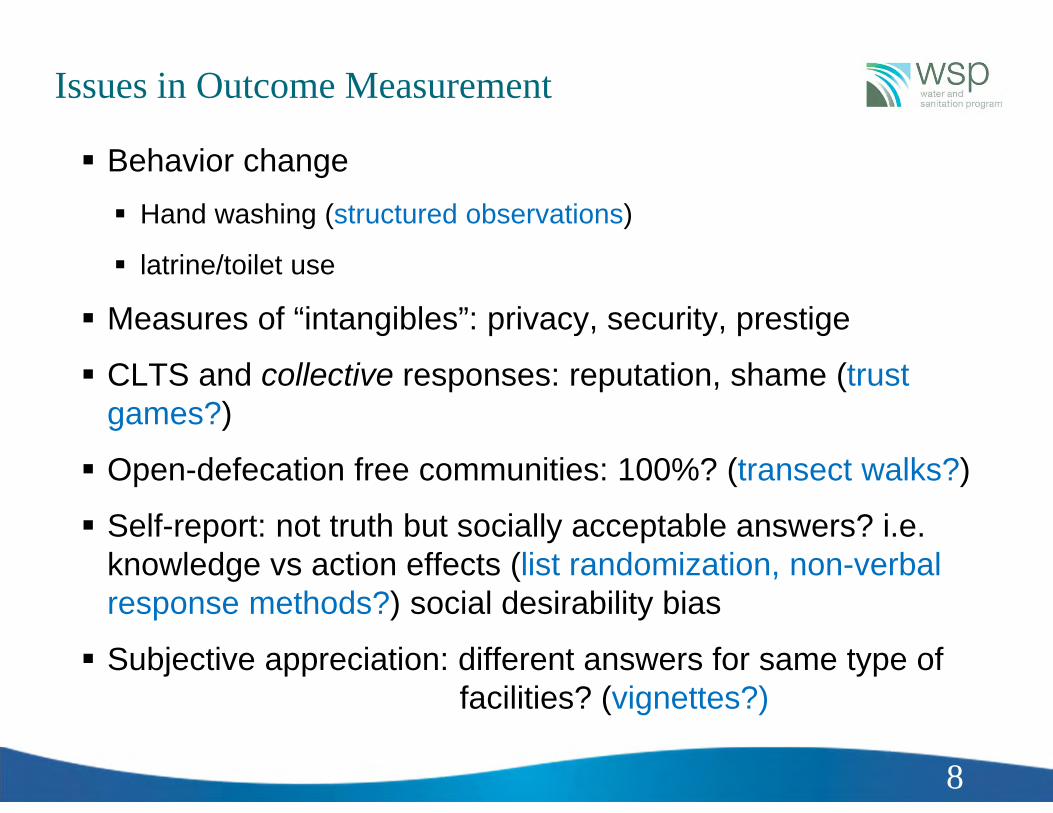
Behavior change Hand washing (structured observations)
latrine/toilet use
Measures of “intangibles”: privacy, security, prestige
CLTS and collective responses: reputation, shame (trust games?)
Open-defecation free communities: 100%? (transect walks?)
Self-report: not truth but socially acceptable answers? i.e. knowledge vs action effects (list randomization, non-verbal response methods?) social desirability bias
Subjective appreciation: different answers for same type of facilities? (vignettes?)
Issues in Outcome Measurement
8

WSP’s Impact Evaluations –Sample Summary
ARMS (T,C) clusters/arm
HH samplesize
Stool samplesize
Water (hh)
Community Survey
HW structural
obs.
BL EL BL EL BL EL BL EL BL EL
INDONESIA 2 80 2,090 2,500 0 1,120 0 800 160 160 NA NA
MP, INDIA 2 40 2,000 3,000 260 1,200 1,000 800 80 80 NA NA
PERU* 3 (T), 2 (C) 40 3,500 3,500 160 1000 160 1000 120 120 160 600
VIETNAM 2 140 (T), 70 3,150 3,150 0 0 0 0 210 210 0 600
SENEGAL 2 54, 56 1,550 1,550 110 0 0 0 110 110 110 250TANZANIA* 3 (T), 1 (C) 47(3), 48 1,700 4,500 NA 2,000 0 0 NA 181 0 375
9
PERU* : T1 = mass media treatment at the provincial levelT2 = social mobilization treatment at the district levelT2‐schools = promotion of handwashing behavior in primary schoolsC‐schools= children who attend similar primary school where HW promotion not offered
TANZANIA* : T1 = handwashingT2 = handwashing and rural sanitation T3 = rural sanitation

Large declines in both diarrhea and non intervention or season related symptoms :
Underreporting due to health cadres collection effect?
Halted repeated rounds
Challenges (1): Symptom underreporting
10

Some countries showed a decline in sample size in first and subsequent rounds
Long questionnaires effect ? (country-particular)
Child not present
Supervision problems?
Challenges (2): Attrition
11
Large attrition: Perú and Senegal

Supplement samples (original replacement rules)
Eligible households: Living in the cluster at time of baseline (not moved in)
Age eligibility projected forward
Supervision problems? Cash prize for enumerator team with lowest rate of attrition
Adherence to replacement rules- if hh not found, workload is not reduced
Some strategies: Repeated measurements and attrition
12

IN FOCUS: What is the appropriate recall period to ask about diarrhea symptoms?
Numerous studies have looked into recall bias in caregiver-reported symptoms and diarrhea(Alam 1989, Boerma 1991, Byass 1994, Ramakrishnan 1999, Melo 2007, Feikin 2010, Zafar 2010)
It is presumed that reporting closer to the interview is more accurate (Ross 1986)
Recall up to 2-3 days is the least biased Recall beyond 7 days is very poor Recommendation has been to ask about diarrhea in the
past 2-3 days to minimize bias. Our recommendation differs from this – we will explain
why.
13

In the WSP baseline, diarrhea reporting declines after day 3 and falls precipitously after day 7
14 Diarrhea Daily Point Prevalence

When used to estimate treatment effects (RR or RD), poor symptom recall creates a bias-variance tradeoff
Unbiased and highly precise estimators are desired but often unavailable.
It is often better to use a slightly biased/precise estimator than an unbiased/noisy estimator.
With symptom recall, we face a tradeoff: Short recall (2 days) = minimal bias Longer recall = more information (lower variance) Where is the “optimal” recall window?
15
>Biased/precise Unbiased/noisy

The Mean Squared Error (MSE) is a function that combines bias and variance:
Estimators with lowest MSE optimize the bias-variance tradeoff (Geman 1992)
In simulations from WSP data, bias dominates the MSE.
But, bias is small (0.1 – 0.2 %) with up to 7 days of recall
Diarrhea RecallThe MSE helps us chart the bias-variance tradeoff
16
India MP Cohort, Risk Difference
2),ˆ()ˆ()ˆ( BiasVarMSE

A 7 day recall window minimizes the MSE for the risk difference in diarrhea in 4 of the 5 WSP cohorts
17
Root MSE v. Recall Window

Diarrhea Recall: Use of 2 day versus 7 day recall requires larger samples
18
Cohort PeriodPrevalence
PointPrevalence
Senegal 1.52 1.20Indonesia 1.77 1.27India MP 1.73 1.40India HP 1.89 1.51Peru 1.92 1.52
Relative Sample Size Required2 day vs. 7 day Recall
Note: Period prevalence = any diarrhea in the last X days?Point prevalence = number of days ill / days of observation
18

Diarrhea Recall: Summary
19
Use a 7 day recall with daily symptom records
Recall windows beyond 3 days are biased, but the bias is very small in RR and RD estimators
Recall beyond 7 days is very unreliable
7 day recall optimizes the bias-variance tradeoff
Reducing the recall window from 7 days to 2 days would require an increase in sample size in the WSP cohorts of 20 – 92%

Contacts and references
Bertha Briceno [email protected] Arnold [email protected]
WSP Impact Evaluation Baseline Reports:
• Orsola-Vidal, A and Galiani, S. Scaling up Hand washing behavior: Findings from the Impact Evaluation Baseline Survey in Peru. Washington DC: Water and Sanitation Program, The World Bank; 2010.
• Chase, C. and Do Q-T. Scaling up Hand washing behavior: Findings from the Impact Evaluation Baseline Survey in Vietnam. Washington DC: Water and Sanitation Program, The World Bank; 2010.
• Cameron, L and Shah, M. Scaling up Rural Sanitation : Findings from the Impact Evaluation Baseline Survey in Indonesia. Washington DC: Water and Sanitation Program, The World Bank; 2010.
• Patil, S and Salvatore, A. Scaling up Rural Sanitation : Findings from the Impact Evaluation Baseline Survey in Madhya Pradesh, India. Washington DC: Water and Sanitation Program, The World Bank; 2011.
http://www.wsp.org/

Alam, N.; Henry, F. J. & Rahaman, M. M. Reporting errors in one-week diarrhoea recall surveys: experience from a prospective study in rural Bangladesh. Int J Epidemiol, 1989, 18, 697-700.
Boerma, J. T.; Black, R. E.; Sommerfelt, A. E.; Rutstein, S. O. & Bicego, G. T. Accuracy and Completeness of Mothers' Recall of Diarrhoea Occurrence in Pre-School Children in Demographic and Health Surveys. Int J Epidemiol, 1991, 20, 1073-1080.
Feikin, D. R.; Audi, A.; Olack, B.; Bigogo, G. M.; Polyak, C.; Burke, H.; Williamson, J. & Breiman, R. F. Evaluation of the optimal recall period for disease symptoms in home-based morbidity surveillance in rural and urban Kenya. Int J Epidemiol, 2010, 39, 450-458.
Geman, S.; Bienenstock, E. & Doursat, R. Neural Networks and the Bias/Variance Dilemma. Neural Computation, 1992, 4, 1-58
de Melo, M. C. N.; de A C Taddei, J. A.; Diniz-Santos, D. R.; May, D. S.; Carneiro, N. B. & Silva, L. R. Incidence of diarrhea: poor parental recall ability. Braz J Infect Dis, 2007, 11, 571-579.
Ross, D. A. & Vaughan, J. P. Health interview surveys in developing countries: a methodological review.. Stud FamPlann, 1986, 17, 78-94
Schmidt, W.-P.; Luby, S. P.; Genser, B.; Barreto, M. L. & Clasen, T. Estimating the longitudinal prevalence of diarrhea and other episodic diseases: continuous versus intermittent surveillance. Epidemiology, 2007, 18, 537-543.
Schmidt, W.-P.; Genser, B. & Chalabi, Z. A simulation model for diarrhoea and other common recurrent infections: a tool for exploring epidemiological methods. Epidemiol Infect, 2009, 137, 644-653.
Schmidt, W.-P.; Genser, B.; Barreto, M.; Clasen, T.; Luby, S.; Cairncross, S. & Chalabi, Z. Sampling strategies to measure the prevalence of common recurrent infections in longitudinal studies. Emerging Themes in Epidemiology, 2010, 7, 5-
Ramakrishnan, R.; Venkatarao, T.; Koya, P. K. & Kamaraj, P. Influence of recall period on estimates of diarrhoeamorbidity in infants in rural Tamilnadu. Indian J Public Health, 1999, 43, 136-139.
Zafar, S. N.; Luby, S. P. & Mendoza, C. Recall errors in a weekly survey of diarrhoea in Guatemala: determining the optimal length of recall. Epidemiol Infect, 2010, 138, 264-269.
Additional References

Auxiliary Slide:Diarrhea Recall Simulation Analyses
Simulated cohorts with and without recall bias using a validated model for recurrent infections (Schmidt 2007, 2009, 2010) with parameters from WSP
Relative risk estimators with 7 day recall have little bias (< 0.1%)
Risk difference estimators with 7 day recall also have very little bias: 0.1 – 0.2 percentage points.
A typical profile from the India MP cohort:
22
True Risk Difference (RD) -1.18%
RD at 7 days with error -1.07%
Bias in the RD -0.11%