evaluating training programs: development and … training programs: development and correlates of...
TRANSCRIPT
Evaluating training programs:development and correlates of
the Questionnaire for ProfessionalTraining Evaluation
Anna Grohmann and Simone Kauffeld
Psychometrically sound evaluation measures are vital forexamining the contribution of professional training to organi-zational success in a reliable manner. As training evaluationstend to be both time-consuming and labor-intensive, there is anincreasing demand for economic evaluation inventories. Simul-taneously, evaluation measures have to meet psychometricstandards. The present paper develops a time-efficient trainingevaluation questionnaire that (1) has psychometrically soundproperties; (2) measures more than the participants’ reactions;and (3) is widely applicable across different training contents,thus allowing for comparisons of training programs withinand between organizations. The Questionnaire for ProfessionalTraining Evaluation is primarily developed for use in practicebut is also applicable to field research and covers short-term aswell as long-term training outcomes. Analyses based on a totalof n = 1134 employees show the stability of the factor structureand hint at the questionnaire’s differential and discriminantvalidity. Theoretical and practical implications are discussed.
IntroductionProfessional training is costly for contemporary organizations (e.g. Grossman & Salas,2011). In 2010, for example, US organizations invested a total of approximately
❒ Anna Grohmann, Research Associate, Department of Industrial/Organizational and SocialPsychology, TU Braunschweig, Germany. Email: [email protected]. Simone Kauffeld,Professor, Department of Industrial/Organizational and Social Psychology, TU Braunschweig,Germany. Email: [email protected] earlier version of this article was presented at the 2009 conference of the Work, Organizational, andBusiness Psychology section of the German Psychological Society at Vienna, Austria. We would like tothank Anja Heine for her efforts collecting data for study 1, Jessica Nitschke for her efforts collectingdata for study 2, and Wiebke Brune for her efforts collecting data for study 3. We would also like tothank the editor and two anonymous reviewers for their helpful comments on an earlier draft of thisarticle.
bs_bs_banner
International Journal of Training and Development 17:2ISSN 1360-3736doi: 10.1111/ijtd.12005
© 2013 Blackwell Publishing Ltd.
Development and correlates of the Q4TE 135
US$171.5 billion in human resource development (HRD) and professional trainingcourses (Green & McGill, 2011). However, researchers and practitioners agree thatthese investments are necessary for attracting and retaining qualified employees, forkeeping up with modern technological requirements and for gaining competitiveadvantages (Aguinis & Kraiger, 2009; Martin, 2010; Reed, 2001, p. 59). Professionaltraining is critical to organizational success (Giangreco et al., 2010; Grossman & Salas,2011), and it is associated with organizational performance and innovation (Aguinis &Kraiger, 2009). For employees, participation in high-quality training is expected toenhance opportunities for advancement, skill development and professional growth(Combs et al., 2006). For trainers, effective training can showcase their work and servefor marketing purposes (cf. Kraiger, 2002).
In times of financial crisis, on the other hand, organizations often tend to cut or reducetraining budgets because ‘training employees in new skills and competences is seen asan unaffordable luxury’ (Roche et al., 2011, p. 47). Taking into account the costs as well asthe potential advantages of training and HRD, there is still uncertainty in organizationsabout the actual benefits of professional training (Blume et al., 2010). Organizations wantto know if the training benefits justify the financial investments made and if theknowledge and skills acquired in a training course are indeed used at work (Kauffeldet al., 2008). There is a large gap between learning outcomes and the actual trainingtransfer, i.e. the degree to which training contents are applied to practice (Aguinis &Kraiger, 2009; Broad, 1997; Grossman & Salas, 2011). The majority of training contents isnot transferred to the job (for an overview, see Grossman & Salas, 2011). However, a lackof training transfer can result in high financial costs and can be highly time-consuming(e.g. Laker & Powell, 2011). To identify promising trainings with, for example, a highamount of transfer, it is vital for organizations and human resource professionals toevaluate and document training benefits (Aguinis & Kraiger, 2009).
In many organizations, training evaluation is based solely on the participants’ reac-tion assessed immediately after a training course (Nickols, 2005). However, for deter-mining the actual training benefits it is important to evaluate not only short-termoutcomes (e.g. reactions at the end of the training), but also participants’ long-termoutcomes back at work (e.g. transfer to practice; Wang & Wilcox, 2006). Moreover, arecent German Delphi study on the future of HRD has pointed out that the pressure onHRD departments will increase further (Schermuly et al., 2012). HRD professionals willhave to evaluate the benefits of trainings systematically because the aims and benefitsof training programs will continuously be questioned in future (Schermuly et al., 2012).
For practitioners, evaluation measures need to be feasible and meet practicaldemands (e.g. Giangreco et al., 2010). In terms of usability, questionnaires have tobe well accepted by respondents and easily applicable to a wide variety of trainingcourses. In addition, time-efficient and economic training evaluation measures are ofgrowing significance in today’s fast-moving business environment (Aguinis & Kraiger,2009). For researchers, on the other hand, economic evaluation measures are importantfor examining comprehensive models on training transfer (e.g. Holton, 2005), in whichtraining benefits are only a minor part of the investigation. Beyond the requirement forshort measures, researchers have to establish the psychometric properties of a ques-tionnaire (e.g. Aiken & Groth-Marnat, 2006). Although theoretical frameworks fortraining evaluation are numerous, the development and psychometric investigation ofnew evaluation inventories is scarce (Aguinis & Kraiger, 2009).
The present paper contributes new insights for economic training evaluation. Weaddress the following requirements: the evaluation questionnaire has to (1) cover notonly short-term, but also long-term training outcomes (e.g. Wang & Wilcox, 2006); (2)meet practical demands such as time efficiency (Aguinis & Kraiger, 2009); and (3) showsound psychometric properties (cf. Aguinis & Kraiger, 2009; see also Aiken & Groth-Marnat, 2006). First, we develop the Questionnaire for Professional Training Evaluation(Q4TE) as a tool well-adapted to practical needs that covers short-term (e.g. reactions)and long-term training outcomes (e.g. transfer; Wang & Wilcox, 2006). Second, wedesign the Q4TE in an economic, time-efficient manner which ensures the organiza-tions’, participants’ as well as trainers’ acceptance of standard evaluation procedures
136 International Journal of Training and Development© 2013 Blackwell Publishing Ltd.
and offers the possibility of integrating the Q4TE in larger surveys. In doing so, westrive for a general wording nonspecific to the training content, thus permittingapplicability across different training contents and settings. Finally, we examine thequestionnaire’s reliability and underlying factor structure based on the data of threeonline studies. Moreover, our analyses provide first hints at the differential and discri-minant validity of the Q4TE.
Benefits of training evaluation
For organizations, there are several arguments for training evaluation. It can justify thefinancial input made, serve for quality management purposes, provide feedback tohuman resource departments and trainers for improving training courses, and help tomake more accurate decisions about the continuation of training courses (Kaufmanet al., 1996; Kirkpatrick & Kirkpatrick, 2006, p. 17; Kraiger, 2002). Moreover, trainingevaluation results can be used as a marketing tool for human resource departments andtraining institutes to attract potential job candidates and retain qualified employeesin an increasingly competitive job market (Kraiger, 2002). Organizations and fieldresearchers facing the benefits of training evaluation and striving for evaluating train-ing programs are challenged to meet the following requirements for evaluation meas-ures. Questionnaires have to show a high usability in terms of time efficiency (Aguinis& Kraiger, 2009). In organizations often broader evaluation issues, such as exploringdeterminants of successful training transfer, have to be addressed in order to optimizefuture training courses (e.g. Bates, 2004). Furthermore, training courses often have to beevaluated with standard evaluation measures in addition to training-specific measuresto determine reference values for different trainings. Both of these situations can end uphaving to use lengthy surveys. Therefore, it is all the more important to use short andconcise standard evaluation measures to increase the respondents’ acceptance of thesesurveys. In addition to high usability, training evaluation demands psychometricallysound and theoretically grounded measures (Aguinis & Kraiger, 2009; Pershing &Pershing, 2001).
Models of training evaluation
There exist several theoretical models and frameworks for summative training evalu-ation (for an overview, see Aguinis & Kraiger, 2009; Salas & Cannon-Bowers, 2001),which aims at making ‘judgments about a program’s effectiveness or worth’ (Kraiger,2002, p. 336). For example, Wang and Wilcox (2006) distinguish between short- andlong-term evaluation. The former aims at measuring the learner’s reactions (e.g. with anattitudinal questionnaire) and learning outcomes (e.g. knowledge tests; Wang &Wilcox, 2006). The latter refers to the assessment of behavior change (e.g. behaviorratings) as well as to organizational results (e.g. ratings of service quality) and return oninvestment (Wang & Wilcox, 2006).
Wang and Wilcox (2006) draw upon Kirkpatrick’s four-level framework (seeKirkpatrick, 1967; Kirkpatrick & Kirkpatrick, 2006). The Kirkpatrick scheme is a verypopular and widely applied framework for summative evaluation (Blau et al., 2012),which also can be found in many other evaluation approaches (e.g. Alliger et al., 1997;Nickols, 2005; for an overview, see Alvarez et al., 2004). Within Kirkpatrick’sframework, the following four levels are distinguished: (1) reaction, i.e. participants’emotional reactions to the training; (2) learning, i.e. acquisition of methodological,procedural and expert knowledge as well as attitude change through training;(3) behavior, i.e. application of training contents (e.g. methodologies) at work; and(4) results, in terms of a training’s organizational impact, for example concerning timeand costs (Kirkpatrick, 1967; Kirkpatrick & Kirkpatrick, 2006). All four levels are impor-tant for training evaluation (Kirkpatrick & Kirkpatrick, 2006): Organizations can use thereaction level as an indicator of customer satisfaction, and the learning level is assumedto be a requirement for behavior change. Behavior level results demonstrate howtraining contents are actually applied to the job and thereby if they are organizationally
Development and correlates of the Q4TE 137© 2013 Blackwell Publishing Ltd.
usable. Finally, the results level shows how the training contributes to organizationalsuccess (Kirkpatrick & Kirkpatrick, 2006). Ideally, all four levels should be evaluatedwith independent measures, which, however, becomes more time-consuming withincreasing levels, i.e. from level 1 to level 4 (Kirkpatrick & Kirkpatrick, 2006, p. 21).Although it is implicitly assumed that each level influences the next (Kirkpatrick &Kirkpatrick, 2006, p. 21), empirical studies have shown varying interrelationshipsbetween the four levels ranging from close to zero to moderate values (Alliger et al.,1997). For example, affective reactions are less predictive of learning or trainingtransfer than utility reactions (Alliger et al., 1997). Notwithstanding various criticism(e.g. about the assumption of growing significance from the first to the last level,the oversimplification of relevant influences on training success and the unclearcause–effect relations between the four levels; Bates, 2004), Kirkpatrick’s modelremains an important evaluation framework, which is applied worldwide in practice aswell as in research (e.g. Alvarez et al., 2004; Nickols, 2005; Salas & Cannon-Bowers,2001).
Researchers have to fill in concrete measures within Wang and Wilcox’s (2006) orKirkpatrick’s evaluation scheme because both are frameworks and not diagnostic tools(cf. Nickols, 2005; Wang & Wilcox, 2006). For example, the learning level can beassessed with knowledge tests and the behavior level with direct behavioral observa-tions (e.g. Wang & Wilcox, 2006). This has to be realized in the context of a specifictraining; for example, a knowledge test has to cover the specific content learned in atraining course. However, as Grossman and Salas (2011) have pointed out for transfer-related factors, ‘organizations cannot feasibly incorporate every factor that hasbeen linked to transfer into their training programs’ (p. 117). To account for practicaldemands, organizations and researchers have to focus on a limited number of evalua-tion aspects (Grossman & Salas, 2011). A similar picture emerges when consideringsummative evaluation. Although practitioners are aware of the need for evaluation, dueto time constraints they are faced with the difficulty of deciding which of the Kirk-patrick levels is the most important for the respective training. Overall, many organi-zations are deterred from conducting training-specific evaluations because they oftendo not have enough time or professional resources for developing psychometricallysound evaluation measures for each specific training course and each single level ofKirkpatrick’s framework (cf. Aguinis & Kraiger, 2009). Moreover, there is no timeregularly to adapt evaluation questionnaires to the respective training purpose. Thus,oftentimes only the reaction level is measured (Nickols, 2005) because reaction data arecollected most easily (Alliger et al., 1997). However, as pointed out, not only the reac-tion level but all four levels of Kirkpatrick’s model may be vital to evaluate trainingbenefits (Kirkpatrick & Kirkpatrick, 2006).
Training evaluation surveys
Training evaluation surveys offer an economic way to gather information on specifictraining outcomes (e.g. reaction or learning) because they can easily be applied to alarge group of respondents (Stoughton et al., 2011). Many evaluation surveys focus onthe reaction level (Arthur et al., 2003; Brown, 2005). For example, Tracey et al. (2001)successfully examined a model that divides trainee reactions in perceived trainingutility and affective reactions, using a 15-item measure by Mathieu et al. (1992). Morganand Casper (2000) examined the underlying factor structure of reaction items in dif-ferent training courses and found six latent factors (e.g. satisfaction with the instructorand perceived training utility). Lim and Morris (2006) measured the first three Kirk-patrick levels using questionnaires. Among others, they applied a training satisfactionsurvey consisting of 10 items, a training-specific learning measure covering the respec-tive learning objectives with 13 items and a training-specific transfer survey assessingthe perceived applicability of the learning objectives with 13 items. Based on twodifferent previous transfer measures, Devos et al. (2007) assessed transfer directly, i.e.the application of the training to the job with three items, and transfer indirectly, i.e. theconsequences of applying the training to the job with four items. Overall, the impact of
138 International Journal of Training and Development© 2013 Blackwell Publishing Ltd.

Kirkpatrick’s organizational level seems to be most difficult for trainees to assess (Wang& Wilcox, 2006). To our knowledge, there is no questionnaire that covers all four levelsof Kirkpatrick’s evaluation framework in a time-efficient manner while being applica-ble to a wide variety of trainings contents and psychometrically examined.
In the present paper, we address this issue by developing the Q4TE, a time-efficientand widely applicable self-report measure especially for practitioners. The Q4TE coversall four levels of Kirkpatrick’s evaluation framework (see Figure 1). Level 1, reaction, isassumed to be multidimensional and often divided into affective responses and utilityjudgments (Alliger et al., 1997; Tracey et al., 2001). Therefore, the first level of the Q4TEis divided into global satisfaction with the training and perceived training utility. Level2, learning, refers to the skills and knowledge acquired in a training (e.g. Wang &Wilcox, 2006). In the Q4TE, we focus on knowledge, which refers to participants’perceived knowledge acquisition. Level 3, behavior, refers to changes in behavior as aconsequence of training participation (Kirkpatrick & Kirkpatrick, 2006, p. 22). In theQ4TE, we measure application to practice, which refers to the extent to which thetraining contents are applied at work (Aguinis & Kraiger, 2009). Level 4, organizationalresults, is kept rather unspecified in the Kirkpatrick model (Alliger et al., 1997). Toclarify this, the Q4TE takes into account that there are three main aspects relevant forevaluating organizational results: qualitative, temporal and financial impact of trainingparticipation (Wang & Wilcox, 2006). As the costs or financial impact is difficult to assesswith self-report items, level 4 of the Q4TE aims at covering especially the qualitative,but also the temporal impact. In line with the multifoci perspective (e.g. concerningorganizational citizenship behavior; Lavelle et al., 2007), the Q4TE differs betweenindividual and global organizational results. We thereby account for the fact thattraining may have an effect on the organization, which is, in turn, reflected on the singleemployee (individual organizational results) and on the whole organization (globalorganizational results). It is important to note that the Q4TE scales knowledge, appli-cation to practice, individual, and global organizational results measure the perceivedtraining benefits. For simplification purposes, however, they are henceforth referred towithout this specification.
Current research questions
The present paper aims at examining the underlying factor structure, the differentialand the discriminant validity of the Q4TE, which differentiates between the sixscales satisfaction, utility, knowledge, application to practice, individual organizationalresults and global organizational results.
Underlying factor structureMeta-analytic findings by Alliger et al. (1997) show the highest intercorrelationsbetween different scales (e.g. affective and utility reactions) of the same Kirkpatrick
Short-term
evaluation
Long-term
evaluation
Reaction
Learning
Behavior
Organizational
results
SAT: Satisfaction
UT: Utility
KNOW: Knowledge
APP: Application to practice
I-OR: Individual organizational results
G-OR: Global organizational results
Figure 1: Scales of the Q4TE (framework following Wang & Wilcox, 2006; Kirkpatrick &Kirkpatrick, 2006).
Development and correlates of the Q4TE 139© 2013 Blackwell Publishing Ltd.

level. However, they also found differential effects for different scales of the samelevel. For example, utility reactions showed stronger relationships with transferthan affective reactions (Alliger et al., 1997). We therefore treat the individual Q4TEscales (satisfaction, utility, knowledge, application to practice, individual organiza-tional results and global organizational results; see also Figure 1) separately during thescale development process. Moreover, the Q4TE covers the participants’ reaction,learning, transfer and organizational outcomes (Kirkpatrick & Kirkpatrick, 2006), andaddresses both short- and long-term evaluation of training courses (Wang & Wilcox,2006). Drawing upon different theoretical frameworks (Alliger et al., 1997; Kirkpatrick& Kirkpatrick, 2006; Wang & Wilcox, 2006), our first research question is to explorewhether the six first-order factors (satisfaction, utility, knowledge, application to prac-tice, individual organizational results and global organizational results) can be groupedinto two second-order factors (short- and long-term evaluation).
Differential and discriminant validityTransfer of training to the job is a crucial variable in training evaluation because itindicates if training contents are indeed applied to practice (Aguinis & Kraiger, 2009;Saks & Burke, 2012). Concerning the differential validity of the Q4TE, our secondresearch question is to explore differences in Q4TE scales between participants whoreport having managed to transfer training contents and participants who report nothaving done so. Concerning the discriminant validity of the Q4TE, our third researchquestion is to explore the relationship between the Q4TE scales and transfer quantity,i.e. the number of training contents applied at work (Kauffeld et al., 2008, 2009;Kauffeld & Lehmann-Willenbrock, 2010).
Study overviewTo investigate the psychometric properties of the Q4TE, we use three studies with atotal of n = 1134 employees. In study 1, the Q4TE is developed. In study 2, we addressthe first research question and examine the underlying factor structure of the Q4TE.Finally, in study 3, we address the second and third research questions and explore therelationship between the Q4TE scales and transfer to practice.
Study 1 – questionnaire development
MethodProcedure and participants. A final sample of n = 408 employees from different branches(e.g. information technology, service sector and automobile industry) was recruitedwith an online survey. We included only employees who stated that they had answeredthe survey seriously. Moreover, we included only those professional training coursesthat dated back between 4 weeks and 2 years. A minimum time lag of 4 weeks was usedto permit knowledge transfer into practice (e.g. May & Kahnweiler, 2000). Moreover, a6-year study on memory of daily events revealed that less than 1 percent of the eventswere forgotten during the first year, whereas after then this rate increased by around5 percent to 6 percent annually (Linton, 1982). Assuming an error rate of about 5percent, considering trainings that date back at most 2 years seemed appropriate forour study. The final data set covered a diverse set of contents (e.g. foreign languagecourses and information technology trainings). Using a 3-point answering scale,respondents could specify the type of training content ranging from closed to openskills (see Blume et al., 2010). The majority of training courses focused on closed (39.7percent) and open skills (36.3 percent), respectively, whereas 24.0 percent dealt withboth open and closed skills. Participants’ age ranged from 21 to 61 years (36.4 years onaverage; 2.2 percent not specified). The sample had a balanced gender distribution (54.7percent male, 44.1 percent female, 1.2 percent not specified). Average organizationaltenure was 6.2 years (6.4 percent not specified).
140 International Journal of Training and Development© 2013 Blackwell Publishing Ltd.
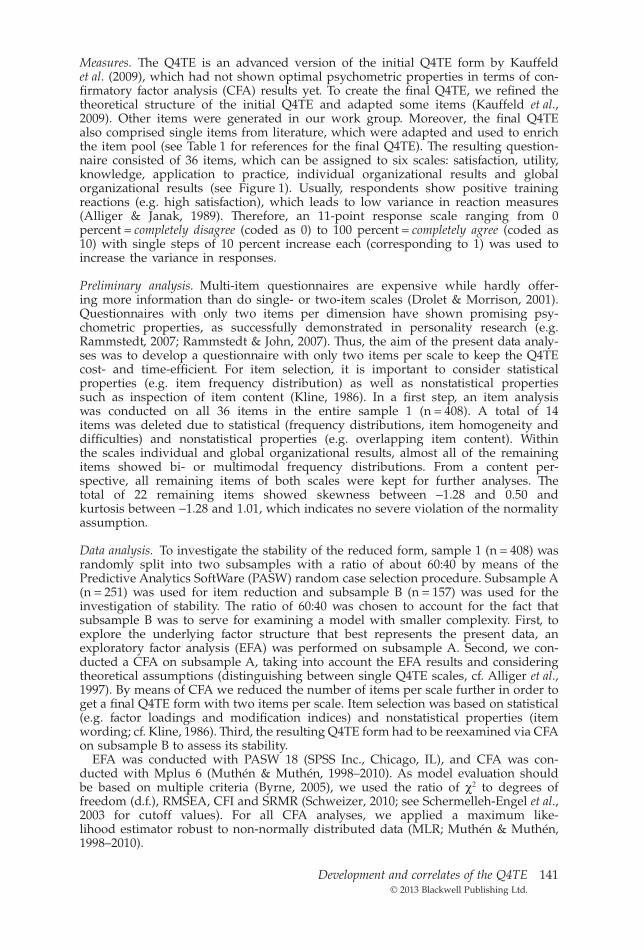
Measures. The Q4TE is an advanced version of the initial Q4TE form by Kauffeldet al. (2009), which had not shown optimal psychometric properties in terms of con-firmatory factor analysis (CFA) results yet. To create the final Q4TE, we refined thetheoretical structure of the initial Q4TE and adapted some items (Kauffeld et al.,2009). Other items were generated in our work group. Moreover, the final Q4TEalso comprised single items from literature, which were adapted and used to enrichthe item pool (see Table 1 for references for the final Q4TE). The resulting question-naire consisted of 36 items, which can be assigned to six scales: satisfaction, utility,knowledge, application to practice, individual organizational results and globalorganizational results (see Figure 1). Usually, respondents show positive trainingreactions (e.g. high satisfaction), which leads to low variance in reaction measures(Alliger & Janak, 1989). Therefore, an 11-point response scale ranging from 0percent = completely disagree (coded as 0) to 100 percent = completely agree (coded as10) with single steps of 10 percent increase each (corresponding to 1) was used toincrease the variance in responses.
Preliminary analysis. Multi-item questionnaires are expensive while hardly offer-ing more information than do single- or two-item scales (Drolet & Morrison, 2001).Questionnaires with only two items per dimension have shown promising psy-chometric properties, as successfully demonstrated in personality research (e.g.Rammstedt, 2007; Rammstedt & John, 2007). Thus, the aim of the present data analy-ses was to develop a questionnaire with only two items per scale to keep the Q4TEcost- and time-efficient. For item selection, it is important to consider statisticalproperties (e.g. item frequency distribution) as well as nonstatistical propertiessuch as inspection of item content (Kline, 1986). In a first step, an item analysiswas conducted on all 36 items in the entire sample 1 (n = 408). A total of 14items was deleted due to statistical (frequency distributions, item homogeneity anddifficulties) and nonstatistical properties (e.g. overlapping item content). Withinthe scales individual and global organizational results, almost all of the remainingitems showed bi- or multimodal frequency distributions. From a content per-spective, all remaining items of both scales were kept for further analyses. Thetotal of 22 remaining items showed skewness between -1.28 and 0.50 andkurtosis between -1.28 and 1.01, which indicates no severe violation of the normalityassumption.
Data analysis. To investigate the stability of the reduced form, sample 1 (n = 408) wasrandomly split into two subsamples with a ratio of about 60:40 by means of thePredictive Analytics SoftWare (PASW) random case selection procedure. Subsample A(n = 251) was used for item reduction and subsample B (n = 157) was used for theinvestigation of stability. The ratio of 60:40 was chosen to account for the fact thatsubsample B was to serve for examining a model with smaller complexity. First, toexplore the underlying factor structure that best represents the present data, anexploratory factor analysis (EFA) was performed on subsample A. Second, we con-ducted a CFA on subsample A, taking into account the EFA results and consideringtheoretical assumptions (distinguishing between single Q4TE scales, cf. Alliger et al.,1997). By means of CFA we reduced the number of items per scale further in order toget a final Q4TE form with two items per scale. Item selection was based on statistical(e.g. factor loadings and modification indices) and nonstatistical properties (itemwording; cf. Kline, 1986). Third, the resulting Q4TE form had to be reexamined via CFAon subsample B to assess its stability.
EFA was conducted with PASW 18 (SPSS Inc., Chicago, IL), and CFA was con-ducted with Mplus 6 (Muthén & Muthén, 1998–2010). As model evaluation shouldbe based on multiple criteria (Byrne, 2005), we used the ratio of c2 to degrees offreedom (d.f.), RMSEA, CFI and SRMR (Schweizer, 2010; see Schermelleh-Engel et al.,2003 for cutoff values). For all CFA analyses, we applied a maximum like-lihood estimator robust to non-normally distributed data (MLR; Muthén & Muthén,1998–2010).
Development and correlates of the Q4TE 141© 2013 Blackwell Publishing Ltd.

Table 1: Q4TE items and English translation
Scalea Item wording References
Reaction Satisfaction Ich werde das Training in guter Erinnerungbehalten.
I will keep the training in good memory.
Adaptation from Bihler(2006, p. 200)
Das Training hat mir sehr viel Spaß gemacht.I enjoyed the training very much.
Additional itemdeveloped in ourwork group (see alsoBrown, 2005)
Utility Das Training bringt mir für meine Arbeit sehrviel.b
The training is very beneficial to my work.b
Additional itemdeveloped in ourwork group (see alsoMathieu et al., 1992)
Die Teilnahme am Training ist äußerstnützlich für meine Arbeit.
Participation in this kind of training is veryuseful for my job.
Adaptation of theinitial Q4TE form byKauffeld et al. (2009)
Learning Knowledge Ich weiß jetzt viel mehr als vorher über dieTrainingsinhalte.
After the training, I know substantiallymore about the training contents thanbefore.
Adaptation fromDeschler et al. (2005,p. 34)
In dem Training habe ich sehr viel Neuesgelernt.
I learned a lot of new things in thetraining.
Following the initialQ4TE form byKauffeld et al. (2009)
Behavior Applicationto practice
Die im Training erworbenen Kenntnisse nutzeich häufig in meiner täglichen Arbeit.
In my everyday work, I often use theknowledge I gained in the training.
Adaptation of theinitial Q4TE form byKauffeld et al. (2009)
Es gelingt mir sehr gut, die erlerntenTrainingsinhalte in meiner täglichen Arbeitanzuwenden.
I successfully manage to apply the trainingcontents in my everyday work.
Following Gnefkow(2008, p. 263)
Organizationalresults
Individual Seit dem Training bin ich mit meiner Arbeitzufriedener.
Since the training, I have been morecontent with my work.
Additional itemdeveloped in ourwork group (see alsoIronson et al., 1989)
Durch die Anwendung der Trainingsinhaltehat sich meine Arbeitsleistung verbessert.
My job performance has improved throughthe application of the training contents.
Following Ong et al.(2004)
Global Durch die Anwendung der Trainingsinhaltekonnten Arbeitsabläufe im Unternehmenvereinfacht werden.
Overall, it seems to me that the applicationof the training contents has facilitated thework flow in my company.
Adaptation of theinitial Q4TE form byKauffeld et al. (2009)
Durch das Training hat sich dasUnternehmensklima verbessert.
Overall, it seems to me that theorganizational climate has improved dueto the training.
Adaptation of theinitial Q4TE form byKauffeld et al. (2009)
Note: Adaptation means a maximum of three words of the original item wording was changed (e.g. toadapt the item to the training field). Following means item content of the original item was used as basisfor item development.a If required for research purposes, researchers can additionally use the scale self-efficacy (not depictedhere). This scale was part of the initial Q4TE and contains two items which are adapted from Schyns andvon Collani (2002).b The tense of this item was adapted for our retrospective study.
142 International Journal of Training and Development© 2013 Blackwell Publishing Ltd.

Results and discussionUnderlying factor structure. In a first step, we examined the underlying factor structurein subsample A (n = 251) by computing an EFA with principal axis factoring andoblique rotation (direct oblimin). Both Bartlett’s test of sphericity and Kaiser–Meyer–Olkin indicated sampling adequacy. The number of eigenvalues greater than 1and an examination of the scree plot suggested that two factors were interpretable. Thetwo-factor solution accounted for a total of 74.61 percent of the variance.
As indicated by the pattern matrix, all items showed significant loadings (> 0.50) onone factor and no substantial double-loadings (> 0.40) on the other factor except for twoitems, which were excluded from further analyses. Investigation of the pattern matrixshowed that factor 1 can be interpreted as short-term evaluation and factor 2 as long-term evaluation. This result indicates that the distinction between short- and long-termevaluation (Wang & Wilcox, 2006) is appropriate.
Scale development. For ML estimation, a minimum ratio of at least five cases per freeparameter estimated is recommended (Bentler & Chou, 1987). Therefore, a model basedon the remaining 20 items (CFA on subsample A) and a model based on the reducedform (CFA on subsample B), respectively, would not have been sufficient. Due to thisconstraint, we specified two separate CFAs (covering short- and long-term outcomes,respectively) for each subsample (see Figure 2 for subsample A analysis).
Short-term evaluation. We specified a model with three latent, intercorrelated factors(satisfaction, utility and knowledge; see Figure 2a). CFA results indicated a lack ofmodel fit because only the SRMR value was good (see Table 2). In a stepwise procedure,the full set of 12 items was reduced to six items based on modification indices andresidual variances in combination with inspection of item wording. The reduced modelwith two items per scale obtained a good fit to subsample A (see Table 2). Investigationof the stability of this solution in subsample B also provided good model fit(see Table 2).
Long-term evaluation. A model with three latent, intercorrelated factors (application topractice, individual organizational results and global organizational results) was speci-fied based on subsample A (see Figure 2b). SRMR value was good, and CFI value wasacceptable, but neither c2/d.f. nor RMSEA were sufficient. In a stepwise procedure, we
s1
s2
SAT
u2
u3
UT
k1
k2KNOW
a b
i1
i2
G-ORg1
g2
I-OR
APP
a1
a2
a3
i3
s3
s4
s5
u1
k3
k4
Figure 2: Specified CFA model for (a) short-term evaluation and (b) long-term evaluation insubsample A (n = 251) of study 1 (error terms are not depicted). SAT = satisfaction,UT = utility, KNOW = knowledge, APP = application to practice, I-OR = individual
organizational results, G-OR = global organizational results.
Development and correlates of the Q4TE 143© 2013 Blackwell Publishing Ltd.
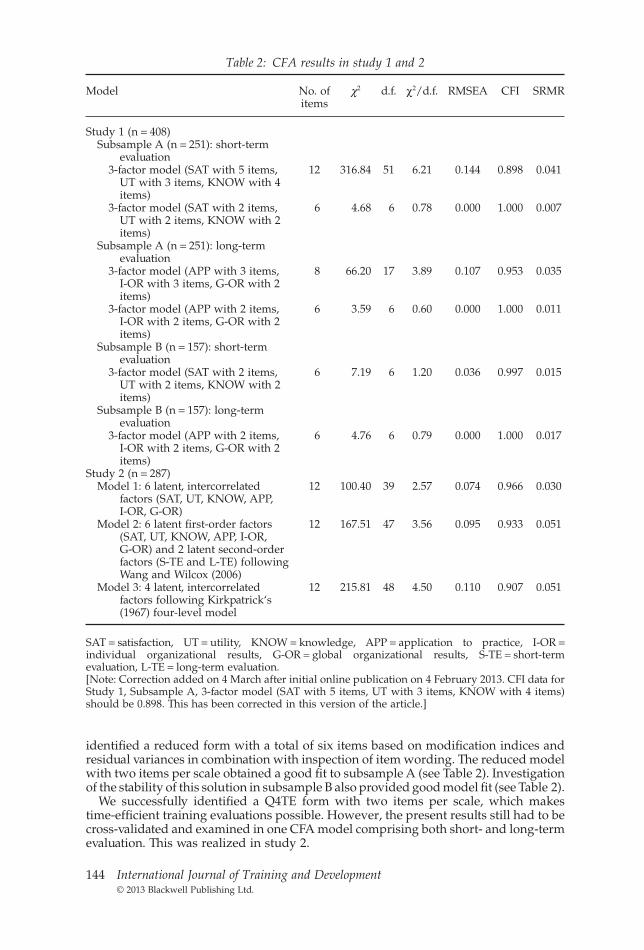
identified a reduced form with a total of six items based on modification indices andresidual variances in combination with inspection of item wording. The reduced modelwith two items per scale obtained a good fit to subsample A (see Table 2). Investigationof the stability of this solution in subsample B also provided good model fit (see Table 2).
We successfully identified a Q4TE form with two items per scale, which makestime-efficient training evaluations possible. However, the present results still had to becross-validated and examined in one CFA model comprising both short- and long-termevaluation. This was realized in study 2.
Table 2: CFA results in study 1 and 2
Model No. ofitems
c2 d.f. c2/d.f. RMSEA CFI SRMR
Study 1 (n = 408)Subsample A (n = 251): short-term
evaluation3-factor model (SAT with 5 items,
UT with 3 items, KNOW with 4items)
12 316.84 51 6.21 0.144 0.898 0.041
3-factor model (SAT with 2 items,UT with 2 items, KNOW with 2items)
6 4.68 6 0.78 0.000 1.000 0.007
Subsample A (n = 251): long-termevaluation
3-factor model (APP with 3 items,I-OR with 3 items, G-OR with 2items)
8 66.20 17 3.89 0.107 0.953 0.035
3-factor model (APP with 2 items,I-OR with 2 items, G-OR with 2items)
6 3.59 6 0.60 0.000 1.000 0.011
Subsample B (n = 157): short-termevaluation
3-factor model (SAT with 2 items,UT with 2 items, KNOW with 2items)
6 7.19 6 1.20 0.036 0.997 0.015
Subsample B (n = 157): long-termevaluation
3-factor model (APP with 2 items,I-OR with 2 items, G-OR with 2items)
6 4.76 6 0.79 0.000 1.000 0.017
Study 2 (n = 287)Model 1: 6 latent, intercorrelated
factors (SAT, UT, KNOW, APP,I-OR, G-OR)
12 100.40 39 2.57 0.074 0.966 0.030
Model 2: 6 latent first-order factors(SAT, UT, KNOW, APP, I-OR,G-OR) and 2 latent second-orderfactors (S-TE and L-TE) followingWang and Wilcox (2006)
12 167.51 47 3.56 0.095 0.933 0.051
Model 3: 4 latent, intercorrelatedfactors following Kirkpatrick‘s(1967) four-level model
12 215.81 48 4.50 0.110 0.907 0.051
SAT = satisfaction, UT = utility, KNOW = knowledge, APP = application to practice, I-OR =individual organizational results, G-OR = global organizational results, S-TE = short-termevaluation, L-TE = long-term evaluation.[Note: Correction added on 4 March after initial online publication on 4 February 2013. CFI data forStudy 1, Subsample A, 3-factor model (SAT with 5 items, UT with 3 items, KNOW with 4 items)should be 0.898. This has been corrected in this version of the article.]
144 International Journal of Training and Development© 2013 Blackwell Publishing Ltd.

Study 2 – cross-validation of the underlying factor structure
MethodProcedure and participants. Using an online survey, a final sample of n = 287 employeesfrom different branches (e.g. public sector, education system and health care) wasrecruited. In the final sample, we included only those employees who stated that theyhad answered seriously. Moreover, we included only training courses that dated backbetween 4 weeks and 2 years (see study 1). The final data set covered a large variety oftraining contents. The majority of trainings focused on closed skills (51.9 percent).About one third (30.0 percent) dealt with both open and closed skills, whereas theremaining 18.1 percent focused on open skills. Respondents’ age ranged from 19 to 75years with an average of 34.1 years (1.0 percent not specified). About one third of theparticipants were male (32.8 percent), and two thirds were female (66.9 percent, 0.3percent not specified). Average organizational tenure was 5.3 years (5.6 percent notspecified).
Measures. The Q4TE was measured with the two items per scale identified in study 1with an 11-point answering scale (see study 1).
Data analysis. CFA using the MLR-estimator in Mplus 6 (Muthén & Muthén, 1998–2010) was applied to investigate the stability of the underlying factor structure.
Results and discussionModel 1 (see Figure 3) with six latent, intercorrelated factors, each measured by twoitems, was specified. SRMR value indicated good model fit, CFI, c2/d.f. and RMSEAvalue indicated acceptable model fit (see Table 2). The six latent, intercorrelated factorsare satisfaction, utility, knowledge, application to practice, individual organizationalresults and global organizational results. We found moderate to high relationshipsbetween all Q4TE scales. Intercorrelations between the six latent factors rangedbetween 0.43 (between knowledge and global organizational results) and 0.91 (betweenindividual and global organizational results).
As a consequence of the high intercorrelations and two modification indices greaterthan 10, we investigated a second-order factor model (see model 2, Figure 3) in linewith Wang and Wilcox (2006) and a four-factor model (see model 3, Figure 3) based on
s1
s2SAT
u1
u2UT
k1
k2KNOW
i1
i2
G-ORg1
g2
I-OR
APP
a1
a2
Model 1
s1
s2SAT
u1
u2UT
k1
k2KNOW
i1
i2
G-ORg1
g2
I-OR
APP
a1
a2
Model 2
Short-TE
Long-TE
s1
s2
Level 1u1
u2
k1
k2
Level 2
i1
i2
g1
g2
Level 4
Level 3
a1
a2
Model 3
Figure 3: CFA models for investigating the underlying factor structure in study 2(n = 287). Error terms are not depicted. SAT = satisfaction, UT = utility,
KNOW = knowledge, APP = application to practice, I-OR = individual organizationalresults, G-OR = global organizational results, Short-TE = short-term evaluation,
Long-TE = long-term evaluation.
Development and correlates of the Q4TE 145© 2013 Blackwell Publishing Ltd.

the assumptions by Kirkpatrick (1967). For these two competing models, CFA resultsindicated insufficient model fit indices except for an acceptable SRMR value (seeTable 2). Model 1 with six latent, intercorrelated factors fits the study 2 data best(see Table 2). Addressing research question 1, these results lend further support to theunderlying factor structure of the Q4TE: the six latent, intercorrelated factors underly-ing the Q4TE correspond to satisfaction, utility, knowledge, application to practice,individual organizational results and global organizational results. The CFA results donot support two latent second-order factors, which may be interpreted as short- andlong-term evaluation (cf. Wang & Wilcox, 2006), or a four-level model (cf. Kirkpatrick,1967), compared with the six-factor model.
Study 3 – differential and discriminant validity of the Q4TE
MethodProcedure and participants. Using an online survey, we recruited a final sample ofn = 439 employees from different branches (e.g. health care, public service and retailsector) who, according to their own statement, answered seriously. We included onlytraining courses that dated back between 4 weeks and 2 years (see study 1). The finaldata set comprised diverse training contents. The majority of trainings (47.8 percent)focused on closed skills, 32.8 percent dealt with open skills and 18.7 percent focusedon both open as well as closed skills (0.7 percent not specified). Participants’ ageranged from 20 to 66 years with an average of 37.6 years (1.1 percent not specified).The gender ratio was nearly balanced (44.2 percent male, 55.4 percent female, 0.4percent not specified). Organizational tenure was 7.9 years on average (6.8 percentnot specified).
Measures. The Q4TE was measured with the two items per scale identified in study1 and cross-validated in study 2, with an 11-point answering scale (see study 1).Transfer to practice was measured with the item ‘Have you been able to transfertraining contents to practice?’, which had to be rated with yes or no (an adaptation ofKauffeld et al., 2008, 2009). Moreover, we measured transfer quantity as the numberof steps transferred to practice (Kauffeld et al., 2008, 2009; Kauffeld & Lehmann-Willenbrock, 2010) and used it as a more elaborated measure of transfer. The par-ticipants were asked to write down up to 10 training contents they had been able totransfer to practice.
Data analysis. We investigated group differences between employees who could trans-fer training contents to practice and those who could not by means of two separatemultivariate analysis of covariance (MANCOVA) analyses in PASW (covering short-and long-term outcomes, respectively). To investigate the relationship between theQ4TE scales and transfer quantity, we conducted a multiple regression analysis inPASW.
Results and discussionMeans, standard deviations, intercorrelations and internal consistency values aredepicted in Table 3. Internal consistency values ranged between 0.79 and 0.96. Prior tothe analyses, we investigated the influence of age, gender, organizational tenure, timelag between training and survey, course duration as well as type of training content onour study variables (for intercorrelations, see Table 3). There were no gender effects. Aswe found some significant correlations between the short-term outcomes (utility andknowledge) and organizational tenure, time lag between training and survey, courseduration as well as type of training content, we included these variables as covariates inour MANCOVA analysis of the short-term outcomes. Moreover, results showed somesignificant correlations between our long-term outcomes (application to practice, indi-vidual and global organizational results) and organizational tenure, course duration aswell as type of training content. Thus, we included these three variables as covariates
146 International Journal of Training and Development© 2013 Blackwell Publishing Ltd.

Tab
le3:
Mea
ns,s
tand
ard
devi
atio
ns,i
nter
corr
elat
ions
and
relia
bilit
y(i
nter
nalc
onsi
sten
cy)
valu
esin
stud
y3
Scal
esM
SDSA
TU
TK
NO
WA
PPI-
OR
G-O
RT
TQ
Sati
sfac
tion
(SA
T)
7.99
2.31
(0.9
1)U
tilit
y(U
T)
7.03
2.79
0.67
**(0
.96)
Kno
wle
dge
(KN
OW
)7.
402.
490.
72**
0.73
**(0
.91)
App
licat
ion
topr
act.
(APP
)5.
722.
900.
50**
0.79
**0.
58**
(0.9
0)In
div
idua
lorg
.res
ults
(I-O
R)
4.46
3.13
0.44
**0.
66**
0.53
**0.
78**
(0.8
6)G
loba
lorg
.res
ults
(G-O
R)
3.11
2.92
0.28
**0.
47**
0.38
**0.
61**
0.74
**(0
.79)
Tran
sfer
(T)b
0.75
0.43
0.35
**0.
44**
0.38
**0.
51**
0.40
**0.
32**
a
Tran
sfer
quan
tity
(TQ
)2.
182.
170.
30**
0.37
**0.
33**
0.42
**0.
38**
0.29
**0.
59**
a
Age
37.5
910
.49
0.03
0.06
0.01
0.09
0.04
0.03
0.09
0.15
**G
end
erc
1.44
0.50
-0.0
70.
01-0
.03
0.04
-0.0
30.
030.
040.
00O
rgan
izat
iona
lten
ure
7.88
8.90
0.04
0.10
*0.
080.
15**
0.09
0.04
0.07
0.14
**Ti
me
lag
betw
een
trai
ning
and
surv
ey(m
onth
s)7.
426.
29-0
.04
-0.1
0*-0
.03
-0.0
7-0
.05
-0.0
4-0
.01
0.07
Cou
rse
dura
tion
(hou
rs)
90.3
644
6.89
0.04
0.10
*0.
10*
0.12
*0.
15**
0.14
**0.
050.
15**
Type
oftr
aini
ngco
nten
td,e
1.85
0.89
0.08
-0.1
0*-0
.01
-0.0
9*-0
.03
-0.0
20.
040.
05
Not
e:In
tern
alco
nsis
tenc
yva
lues
calc
ulat
edw
ith
Cro
nbac
h’s
aar
epr
esen
ted
dia
gona
llyin
pare
nthe
ses.
*p
<0.
05,*
*p
<0.
01(2
-sid
edsi
gnifi
canc
e).
aN
oin
tern
alco
nsis
tenc
yva
lue
was
calc
ulat
edfo
rtr
ansf
eran
dtr
ansf
erqu
anti
ty(o
neit
emea
ch).
bTr
ansf
er:1
=ye
s,0
=no
.c
Gen
der
:1=
fem
ale,
2=
mal
e.d
1=
clos
edsk
ills,
2=
both
(ope
nan
dcl
osed
skill
s)an
d3
=op
ensk
ills.
eK
enda
ll‘s
tco
rrel
atio
nsar
ed
epic
ted
beca
use
type
oftr
aini
ngco
nten
tis
anor
din
alva
riab
le.
M=
mea
n,SD
=st
anda
rdd
evia
tion
.
Development and correlates of the Q4TE 147© 2013 Blackwell Publishing Ltd.
in our MANCOVA analysis of the long-term outcomes. In our regression analysis,we included age, organizational tenure and course duration as covariates becausewe found significant correlations with our dependent variable transfer quantity (seeTable 3).
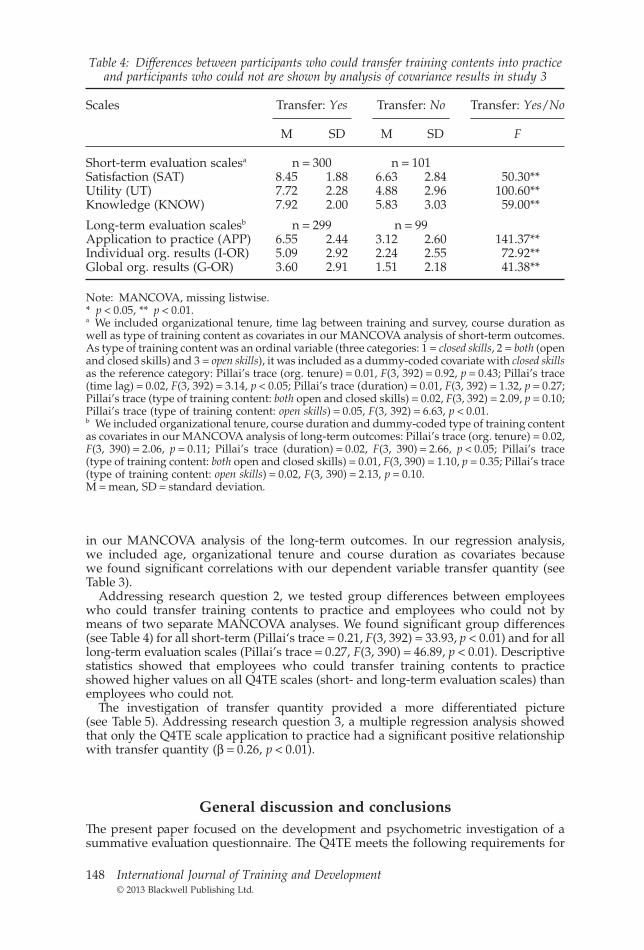
Addressing research question 2, we tested group differences between employeeswho could transfer training contents to practice and employees who could not bymeans of two separate MANCOVA analyses. We found significant group differences(see Table 4) for all short-term (Pillai‘s trace = 0.21, F(3, 392) = 33.93, p < 0.01) and for alllong-term evaluation scales (Pillai’s trace = 0.27, F(3, 390) = 46.89, p < 0.01). Descriptivestatistics showed that employees who could transfer training contents to practiceshowed higher values on all Q4TE scales (short- and long-term evaluation scales) thanemployees who could not.
The investigation of transfer quantity provided a more differentiated picture(see Table 5). Addressing research question 3, a multiple regression analysis showedthat only the Q4TE scale application to practice had a significant positive relationshipwith transfer quantity (b = 0.26, p < 0.01).
General discussion and conclusionsThe present paper focused on the development and psychometric investigation of asummative evaluation questionnaire. The Q4TE meets the following requirements for
Table 4: Differences between participants who could transfer training contents into practiceand participants who could not are shown by analysis of covariance results in study 3
Scales Transfer: Yes Transfer: No Transfer: Yes/No
M SD M SD F
Short-term evaluation scalesa n = 300 n = 101Satisfaction (SAT) 8.45 1.88 6.63 2.84 50.30**Utility (UT) 7.72 2.28 4.88 2.96 100.60**Knowledge (KNOW) 7.92 2.00 5.83 3.03 59.00**
Long-term evaluation scalesb n = 299 n = 99Application to practice (APP) 6.55 2.44 3.12 2.60 141.37**Individual org. results (I-OR) 5.09 2.92 2.24 2.55 72.92**Global org. results (G-OR) 3.60 2.91 1.51 2.18 41.38**
Note: MANCOVA, missing listwise.* p < 0.05, ** p < 0.01.a We included organizational tenure, time lag between training and survey, course duration aswell as type of training content as covariates in our MANCOVA analysis of short-term outcomes.As type of training content was an ordinal variable (three categories: 1 = closed skills, 2 = both (openand closed skills) and 3 = open skills), it was included as a dummy-coded covariate with closed skillsas the reference category: Pillai’s trace (org. tenure) = 0.01, F(3, 392) = 0.92, p = 0.43; Pillai’s trace(time lag) = 0.02, F(3, 392) = 3.14, p < 0.05; Pillai’s trace (duration) = 0.01, F(3, 392) = 1.32, p = 0.27;Pillai’s trace (type of training content: both open and closed skills) = 0.02, F(3, 392) = 2.09, p = 0.10;Pillai’s trace (type of training content: open skills) = 0.05, F(3, 392) = 6.63, p < 0.01.b We included organizational tenure, course duration and dummy-coded type of training contentas covariates in our MANCOVA analysis of long-term outcomes: Pillai’s trace (org. tenure) = 0.02,F(3, 390) = 2.06, p = 0.11; Pillai’s trace (duration) = 0.02, F(3, 390) = 2.66, p < 0.05; Pillai’s trace(type of training content: both open and closed skills) = 0.01, F(3, 390) = 1.10, p = 0.35; Pillai’s trace(type of training content: open skills) = 0.02, F(3, 390) = 2.13, p = 0.10.M = mean, SD = standard deviation.
148 International Journal of Training and Development© 2013 Blackwell Publishing Ltd.

professional training evaluation measures: it covers short- and long-term training out-comes (cf. Wang & Wilcox, 2006) and provides high usability in terms of time efficiency(cf. Aguinis & Kraiger, 2009). Moreover, it shows promising psychometric properties(cf. Aiken & Groth-Marnat, 2006).
Our analyses yielded a time-efficient measure for summative training evaluationthat is generalizable to diverse training contents and contexts. We established soundpsychometric properties and demonstrated good or at least satisfactory internal con-sistency values for all Q4TE scales (Nunnally & Bernstein, 1994, p. 265). In study 1,the final Q4TE form was successfully identified by means of EFA and CFA. In study2, CFA results clearly support a model with six latent factors (satisfaction, utility,knowledge, application to practice, individual organizational results and globalorganizational results) over two competing models (following either Wang & Wilcox,2006 or Kirkpatrick & Kirkpatrick, 2006). Addressing our first research question,study 2 results underscore the importance of distinguishing single trainingoutcomes (e.g. satisfaction and utility). However, if one has to aggregate evaluationdata on a higher level in future studies (e.g. if a model is otherwise too complex),EFA results in study 1 clearly indicate that the distinction between short- and long-term evaluation following Wang and Wilcox (2006) is appropriate for aggregation. Bycontrast, study 2 results revealed no sufficient fit for a model in line with Wang andWilcox (2006). Moreover, we found no sufficient fit for a model following Kirkpatrickand Kirkpatrick (2006), except for an acceptable SRMR value for both models. Yet, thedetailed investigation of the CFA results showed slight model improvements for themodel in line with Wang and Wilcox (2006) compared with Kirkpatrick‘s (1967)framework. In sum, our analyses clearly support a six-factor solution (satisfaction,utility, knowledge, application to practice, individual organizational results andglobal organizational results) and hint at the appropriateness of distinguishingbetween short- and long-term outcomes (cf. Wang & Wilcox, 2006) if aggregatingevaluation data is necessary.
Table 5: Results of multiple regression analysis in study 3
Transfer quantity (TQ)
Step 1 Step 2b b
CovariatesAge 0.13 0.13*Organizational tenure 0.06 0.00Course duration 0.08 0.03
Correlates (independent variables)Satisfaction (SAT) – 0.12Utility (UT) – -0.05Knowledge (KNOW) – 0.05Application to practice (APP) – 0.26**Individual org. results (I-OR) – 0.11Global org. results (G-OR) – 0.03
R2 0.04 0.22R2
adj 0.03 0.20F 4.88** 11.63**
Note: Multiple regression analysis using the enter method (n = 391), missing listwise.b = standardized regression coefficient. We included age, organizational tenure, and course dura-tion as covariates in step 1, and all Q4TE variables in step 2.* p < 0.05, ** p < 0.01 (2-sided significance).
Development and correlates of the Q4TE 149© 2013 Blackwell Publishing Ltd.

Addressing our second research question, we found significant differences betweenparticipants who could transfer training contents to practice and those who could not.Participants who report having managed to transfer training contents showed highervalues on all Q4TE scales compared with participants who report not to have done so.These findings provide first hints at the differential validity of the Q4TE and show thatthe Q4TE successfully differentiates between persons who transfer and those who donot. Addressing our third research question, we established a relationship between theQ4TE scale application to practice and transfer quantity. This finding lends support tothe discriminant validity of the Q4TE because only the application to practice scale waslinked to transfer quantity. This is in line with previous theorizing, as both are assumedto measure transfer, which refers to behavior change back at work (e.g. Aguinis &Kraiger, 2009; Kauffeld et al., 2008). In sum, our analyses hint at the construct validityof the Q4TE.
The Q4TE heeds the call for more efficient tools for training evaluation in a fast-moving business environment (Aguinis & Kraiger, 2009). It allows for summativetraining evaluation in a time-efficient and psychometrically sound manner. Unliketraining-specific evaluation measures (for examples, see Salas & Cannon-Bowers,2001), the Q4TE permits comparisons of training courses within and between organi-zations. While being applicable to a wide variety of training courses, the Q4TE offersvaluable information beyond the reaction level by addressing short- and long-termoutcomes (Wang & Wilcox, 2006) and covering participants’ reactions, learning, trans-fer and organizational outcomes (Kirkpatrick & Kirkpatrick, 2006). In line with previ-ous theorizing (e.g. Alliger et al., 1997), our results underscore the distinction betweensingle scales (e.g. satisfaction and utility). Moreover, the present results provide firsthints at the differential and discriminant validity of the Q4TE.
Limitations
The present study has several limitations. First, the psychometric examination of theQ4TE relied entirely on computer-based, cross-sectional, retrospective samples. As allscales were measured at the same level of specificity and at the same time, higherintercorrelations between the Q4TE scales are observed in contrast to values reportedin several meta-analyses based on Kirkpatrick’s four-level framework (see Alliger et al.,1997). To reduce the potential bias inherent in the present research design, futureresearch should include a time lag between the short-term (e.g. satisfaction) and long-term evaluation scales (e.g. application to practice; see Podsakoff et al., 2012). However,the retrospective online samples used in the three studies offered the opportunity toobtain three diverse data sets from different organizations and training programs,while avoiding missing data. These design characteristics were important for ourresearch aim of developing an inventory that is not training-specific, but widely appli-cable to professional training evaluation.
Second, the Q4TE consists of self-report items only, which can be a source of commonmethod bias (e.g. Podsakoff et al., 2012). One possibility to deal with common methodbias is to apply subsequent statistical procedures (for an overview, see Podsakoff et al.,2012). However, to date, there is still a scientific debate on whether and how to applystatistical procedures for dealing with common method bias (e.g. Conway & Lance,2010). As Conway and Lance (2010) pointed out, ‘[n]o post hoc statistical correctionprocedure can be recommended until additional research evaluates the relative effec-tiveness of those that have been proposed’ (p. 332). Furthermore, assessing level 3(behavior) and level 4 (organizational results) by means of self-reports runs contraryto some recommendations, e.g. to use behavioral observations to measure level 3(e.g. Wang & Wilcox, 2006). However, using self-report measures seems appropriatebecause the participant himself or herself is widely regarded as a valid data source formany psychological constructs (Spector, 2006). For example, several studies haveshown that self-report measures reflect specific learning outcomes appropriately (foran overview, see Kraiger et al., 1993). Furthermore, using standardized self-reportquestionnaires is the only possibility to get a quick overview over organization-wide
150 International Journal of Training and Development© 2013 Blackwell Publishing Ltd.

training evaluation. However, future studies should combine the Q4TE with analysesof return on investment data, training-specific tests or peer ratings of training benefitsto allow for more in-depth evaluation.
Third, each of the Q4TE scales comprises two items only. Some researchers haveproposed that questionnaires should generally comprise scales with four to six itemseach (e.g. Hinkin, 1998). Moreover, Credé et al. (2012) have pointed out disadvantagesof short questionnaires, for example, that short measures cannot reflect constructs thatare complex and cover a wide range of contents (see also Loo, 2002). However, shortmeasures also provide key benefits, especially for practitioners. For example, they areeasy to apply and provide a time-efficient method for collecting data in large samples(Loo, 2002). Especially for practice but also for field research, there often is only thechoice between applying a short measure and not collecting data due to time con-straints (as detailed for personality measures in Credé et al., 2012). Moreover, previousempirical studies have underscored that short measures can be an appropriate tool formeasuring psychological variables (e.g. Bergkvist & Rossiter, 2007). When examiningthe psychometric properties of single- and two-item measures, the latter could clearlyoutperform the first (Credé et al., 2012). Thus, our somewhat minimalistic approachwith only two items per scale served our goal of developing a time-efficient and widelyapplicable questionnaire well. Furthermore, internal consistency values of the Q4TEare comparable to the initial Q4TE form reported by Kauffeld et al. (2009), which isnoteworthy with respect to the small number of items per scale.
Fourth, all analyses were based on German samples. However, our psychometricinvestigations were based on diverse samples from different organizations to allow formore general conclusions. Future studies should explore whether the present findingscould be generalized to other cultural backgrounds.
Implications for practice and future research
To gather comparable results of summative evaluation, the easiest and most time-efficient way is to implement a standard evaluation questionnaire. Grounding on amodel widely used in practice (cf. Kirkpatrick & Kirkpatrick, 2006; Wang & Wilcox,2006), the Q4TE readily addresses the factual needs of practitioners who are facing hightime constraints while showing good psychometric properties. For example, if anorganization implements spaced (i.e. time intervals between training sessions) andmassed trainings (i.e. no time interval between training sessions; see, e.g. Hesketh,1997), the Q4TE can reveal important differences between both training types. Partici-pants of the massed training might report higher learning outcomes at first but show alower amount of transfer to practice. By contrast, participants of the spaced trainingmight report lower learning outcomes at first, but show a higher amount of transferbecause they had time to practice. In this situation, the Q4TE can provide hints at whichtraining shows a higher amount of transfer and is thereby more beneficial for theorganization (for a recent field study on massed vs. spaced trainings, see Kauffeld &Lehmann-Willenbrock, 2010). In our example, training professionals can reveal the lackof transfer in massed training using the Q4TE and can integrate transfer-enhancingtechniques (e.g. include more job-related exercises; cf. Kauffeld et al., 2008) or adapt thetraining design (e.g. include intervals between training sessions) to improve trainingtransfer.
Although developed for practical demands, the Q4TE may also be a valuable tool forfield researchers facing time constraints. The brevity of the Q4TE facilitates largerstudies on training transfer models in which training outcomes are only a minorpart of the investigation. Models incorporating both summative evaluation andtransfer-related factors allow determining whether and why a training program works(e.g. Holton, 2005). Combining the Q4TE with measures of transfer-related variables(e.g. Learning Transfer System Inventory; Holton et al., 2000) will enable field research-ers to examine more elaborated transfer models (e.g. Baldwin & Ford, 1988; Holton,2005). The brevity of the Q4TE facilitates the investigation of possible moderators(e.g. training content or participant features like hierarchical position) and mediators
Development and correlates of the Q4TE 151© 2013 Blackwell Publishing Ltd.

(e.g. motivation to transfer) in order to get a more thorough understanding of deter-minants of successful training transfer (e.g. Blume et al., 2010; Giangreco et al., 2010;Grossman & Salas, 2011; Kauffeld et al., 2008). Moreover, training courses may becompared within and between organizations using the Q4TE in future studies. Indoing so, researchers can take the multilevel structure of data into account to revealpotential organization-level or training-level effects.
The Q4TE provides valuable information for comparing benefits of training coursesin a time-efficient manner. However, to provide information for individual assessment(e.g. concerning the individual participant), we strongly recommend combining theQ4TE with other evaluation measures. For example, the learning level may be com-bined with knowledge tests (e.g. Wang & Wilcox, 2006). The assessment of trainingtransfer can be enhanced by behavioral ratings on the job (for examples, see Salas &Cannon-Bowers, 2001), and the organizational level may be extended by return oninvestment analysis (e.g. Phillips, 1997).
In sum, the Q4TE is a widely applicable training evaluation questionnaire withsound psychometric properties, that addresses both short- and long-term evaluationoutcomes (cf. Wang & Wilcox, 2006). Due to its brevity, the Q4TE provides valuable andstandardized information for evaluating training benefits while being easy to imple-ment in organizational practice.
ReferencesAguinis, H. and Kraiger, K. (2009), ‘Benefits of training and development for individuals and
teams, organizations, and society’, Annual Review of Psychology, 60, 451–74.Aiken, L. R. and Groth-Marnat, G. (2006), Psychological Testing and Assessment, 12th edn (Boston,
MA: Pearson Education).Alliger, G. M. and Janak, E. A. (1989), ‘Kirkpatrick’s levels of training criteria: thirty years later’,
Personnel Psychology, 42, 331–42.Alliger, G. M., Tannenbaum, S. I., Bennett, W. Jr, Traver, H. and Shotland, A. (1997), ‘A meta-
analysis of the relations among training criteria’, Personnel Psychology, 50, 341–58.Alvarez, K., Salas, E. and Garofano, C. M. (2004), ‘An integrated model of training evaluation and
effectiveness’, Human Resource Development Review, 3, 385–416.Arthur, W. Jr, Bennett, W. Jr, Edens, P. S. and Bell, S. T. (2003), ‘Effectiveness of training in
organizations: a meta-analysis of design and evaluation features’, Journal of Applied Psychology,88, 234–45.
Baldwin, T. T. and Ford, J. K. (1988), ‘Transfer of training: a review and directions for futureresearch’, Personnel Psychology, 41, 63–105.
Bates, R. A. (2004), ‘A critical analysis of evaluation practice: the Kirkpatrick model and theprinciple of beneficence’, Evaluation and Program Planning, 27, 341–7.
Bentler, P. M. and Chou, C.-P. (1987), ‘Practical issues in structural modeling’, Sociological Methods& Research, 16, 78–117.
Bergkvist, L. and Rossiter, J. R. (2007), ‘The predictive validity of multiple-item versus single-itemmeasures of the same constructs’, Journal of Marketing Research, 44, 175–84.
Bihler, W. (2006), Weiterbildungserfolg in betrieblichen Lehrveranstaltungen: Messung und Einflussfak-toren im Bereich Finance & Controlling [Success of Advanced Training in Operating Courses:Measurement and Determinants in Finance and Controlling] (Wiesbaden: Dt. Univ.-Verlag).
Blau, G., Gibson, G., Bentley, M. and Chapman, S. (2012), ‘Testing the impact of job-relatedvariables on a utility judgment training criterion beyond background and affective reactionvariables’, International Journal of Training and Development, 16, 54–66.
Blume, B. D., Ford, J. K., Baldwin, T. T. and Huang, J. L. (2010), ‘Transfer of training: a meta-analytic review’, Journal of Management, 36, 1065–105.
Broad, M. L. (1997), ‘Overview of transfer of training: from learning to performance’, PerformanceImprovement Quarterly, 10, 2, 7–21.
Brown, K. G. (2005), ‘An examination of the structure and nomological network of traineereactions: a closer look at “smile sheets” ’, Journal of Applied Psychology, 90, 991–1001.
Byrne, B. M. (2005), ‘Factor analytic models: viewing the structure of an assessment instrumentfrom three perspectives’, Journal of Personality Assessment, 85, 17–32.
Combs, J., Liu, Y., Hall, A. and Ketchen, D. (2006), ‘How much do high-performance workpractices matter? A meta-analysis of their effects on organizational performance’, PersonnelPsychology, 59, 501–28.
152 International Journal of Training and Development© 2013 Blackwell Publishing Ltd.

Conway, J. M. and Lance, C. E. (2010), ‘What reviewers should expect from authors regardingcommon method bias in organizational research’, Journal of Business and Psychology, 25, 325–34.
Credé, M., Harms, P. D., Niehorster, S. and Gaye-Valentine, A. (2012), ‘An evaluation of theconsequences of using short measures of the Big Five personality traits’, Journal of Personalityand Social Psychology, 102, 874–88.
Deschler, S., Mandl, H. and Winkler, K. (2005), Konzeption, Entwicklung und Evaluation einervideo- und textbasierten virtuellen Lernumgebung für eine Bundesbehörde [Conceptualiza-tion, development and evaluation of a video- and text-based virtual learning environment fora governmental organization]. Practice report no. 31 (LMU München: Institut für PädagogischePsychologie). Available at http://epub.ub.uni-muenchen.de/690/1/Praxisbericht31.pdf(accessed 20 September 2012).
Devos, C., Dumay, X., Bonami, M., Bates, R. A. and Holton, E. F. III (2007), ‘The Learning TransferSystem Inventory (LTSI) translated into French: internal structure and predictive validity’,International Journal of Training and Development, 11, 181–99.
Drolet, A. L. and Morrison, D. G. (2001), ‘Do we really need multiple-item measures in serviceresearch?’, Journal of Service Research, 3, 196–204.
Giangreco, A., Carugati, A. and Sebastiano, A. (2010), ‘Are we doing the right thing? Food forthought on training evaluation and its context’, Personnel Review, 39, 162–77.
Gnefkow, T. (2008), Lerntransfer in der betrieblichen Weiterbildung: Determinanten für denErfolg externer betrieblicher Weiterbildungen im Lern- und Funktionsfeld aus Teilnehmerper-spektive [Learning transfer in operative training: Determinants for the success of externaladvanced training in the learning and function field from the participants’ perspective].Unpublished doctoral dissertation, Bielefeld University. Available at http://d-nb.info/989349004/34 (accessed 20 September 2012).
Green, M. and McGill, E. (2011), State of the Industry, 2011 (Alexandria, VA: American Society forTraining and Development), Available at http://www.astd.org/Publications/Research-Reports/2011/2011-State-of-the-Industry-Report (accessed 20 September 2012).
Grossman, R. and Salas, E. (2011), ‘The transfer of training: what really matters’, InternationalJournal of Training and Development, 15, 103–20.
Hesketh, B. (1997), ‘Dilemmas in training for transfer and retention’, Applied Psychology: AnInternational Review, 46, 317–39.
Hinkin, T. R. (1998), ‘A brief tutorial on the development of measures for use in surveyquestionnaires’, Organizational Research Methods, 1, 104–21.
Holton, E. F. III (2005), ‘Holton’s evaluation model: new evidence and construct elaborations’,Advances in Developing Human Resources, 7, 37–54.
Holton, E. F. III, Bates, R. A. and Ruona, W. E. A. (2000), ‘Development of a generalized learningtransfer system inventory’, Human Resource Development Quarterly, 11, 333–60.
Ironson, G. H., Smith, P. C., Brannick, M. T., Gibson, W. M. and Paul, K. B. (1989), ‘Constructionof a job in general scale: a comparison of global, composite, and specific measures’, Journal ofApplied Psychology, 74, 193–200.
Kauffeld, S., Bates, R. A., Holton, E. F. III and Müller, A. C. (2008), ‘Das deutsche Lerntransfer-System-Inventar (GLTSI): Psychometrische Überprüfung der deutschsprachigen Version [TheGerman version of the Learning Transfer System Inventory (GLTSI): psychometric validation]’,Zeitschrift Für Personalpsychologie, 7, 50–69.
Kauffeld, S., Brennecke, J. and Strack, M. (2009), ‘Erfolge sichtbar machen: Das Maßnahmen-Erfolgs-Inventar (MEI) zur Bewertung von Trainings [Visualizing Training Outcomes: The MEIfor Training Evaluations]’, in S. Kauffeld, S. Grote and E. Frieling (eds), HandbuchKompetenzentwicklung (Stuttgart: Schäffer-Poeschel), pp. 55–78.
Kauffeld, S. and Lehmann-Willenbrock, N. (2010), ‘Sales training: effects of spaced practice ontraining transfer’, Journal of European Industrial Training, 34, 23–37.
Kaufman, R., Keller, J. and Watkins, R. (1996), ‘What works and what doesn’t: evaluation beyondKirkpatrick’, Performance and Instruction, 35, 2, 8–12.
Kirkpatrick, D. L. (1967), ‘Evaluation of Training’, in R. L. Craig and L. R. Bittel (eds), Trainingand Development Handbook: A Guide to Human Resource Development (New York: McGraw-Hill),pp. 87–112.
Kirkpatrick, D. L. and Kirkpatrick, J. D. (2006), Evaluating Training Programs: The Four Levels, 3rdedn (San Francisco, CA: Berrett-Koehler).
Kline, P. (1986), A Handbook of Test Construction: Introduction to Psychometric Design (London:Methuen).
Kraiger, K. (2002), ‘Decision-based Evaluation’, in K. Kraiger (ed.), Creating, Implementing, andManaging Effective Training and Development: State-of-the-Art Lessons for Practice (San Francisco,CA: Jossey-Bass), pp. 331–75.
Development and correlates of the Q4TE 153© 2013 Blackwell Publishing Ltd.

Kraiger, K., Ford, J. K. and Salas, E. (1993), ‘Application of cognitive, skill-based, and affectivetheories of learning outcomes to new methods of training evaluation’, Journal of AppliedPsychology, 78, 311–28.
Laker, D. R. and Powell, J. L. (2011), ‘The differences between hard and soft skills and theirrelative impact on training transfer’, Human Resource Development Quarterly, 22, 111–22.
Lavelle, J. J., Rupp, D. E. and Brockner, J. (2007), ‘Taking a multifoci approach to the studyof justice, social exchange, and citizenship behavior: the target similarity model’, Journal ofManagement, 33, 841–66.
Lim, D. H. and Morris, M. L. (2006), ‘Influence of trainee characteristics, instructional satisfaction,and organizational climate on perceived learning and training transfer’, Human Resource Devel-opment Quarterly, 17, 85–115.
Linton, M. (1982), ‘Transformations of Memory in Everyday Life’, in U. Neisser (ed.), MemoryObserved: Remembering in Natural Contexts (San Francisco, CA: Freeman), pp. 77–91.
Loo, R. (2002), ‘A caveat on using single-item versus multiple-item scales’, Journal of ManagerialPsychology, 17, 68–75.
Martin, H. J. (2010), ‘Workplace climate and peer support as determinants of training transfer’,Human Resource Development Quarterly, 21, 87–104.
Mathieu, J. E., Tannenbaum, S. I. and Salas, E. (1992), ‘Influences of individual and situationalcharacteristics on measures of training effectiveness’, Academy of Management Journal, 35, 828–47.
May, G. L. and Kahnweiler, W. M. (2000), ‘The effect of a mastery practice design on learning andtransfer in behavior modeling training’, Personnel Psychology, 53, 353–73.
Morgan, R. B. and Casper, W. J. (2000), ‘Examining the factor structure of participant reactionsto training: a multidimensional approach’, Human Resource Development Quarterly, 11, 301–17.
Muthén, L. K. and Muthén, B. O. (1998–2010), Mplus User’s Guide, 6th edn (Los Angeles, CA:Muthén & Muthén).
Nickols, F. W. (2005), ‘Why a stakeholder approach to evaluating training’, Advances in DevelopingHuman Resources, 7, 121–34.
Nunnally, J. C. and Bernstein, I. H. (1994), Psychometric Theory, 3rd edn (New York: McGraw-Hill).Ong, C.-S., Lai, J.-Y. and Wang, Y.-S. (2004), ‘Factors affecting engineers’ acceptance of asynchro-
nous e-learning systems in high-tech companies’, Information & Management, 41, 795–804.Pershing, J. A. and Pershing, J. L. (2001), ‘Ineffective reaction evaluation’, Human Resource Devel-
opment Quarterly, 12, 73–90.Phillips, J. J. (1997), Return on Investment in Training and Performance Improvement Programs (Houston,
TX: Gulf Publishing).Podsakoff, P. M., MacKenzie, S. B. and Podsakoff, N. P. (2012), ‘Sources of method bias in social
science research and recommendations on how to control it’, Annual Review of Psychology, 63,539–69.
Rammstedt, B. (2007), ‘The 10-item Big Five Inventory (BFI-10): norm values and investigation ofsocio-demographic effects based on a German population representative sample’, EuropeanJournal of Psychological Assessment, 23, 193–201.
Rammstedt, B. and John, O. P. (2007), ‘Measuring personality in one minute or less: a 10-itemshort version of the Big Five Inventory in English and German’, Journal of Research inPersonality, 41, 203–12.
Reed, A. (2001), Innovation in Human Resource Management: Tooling up for the Talent Wars (London:CIPD).
Roche, W. K., Teague, P., Coughlan, A. and Fahy, M. (2011), Human Resources in the Recession:Managing and Representing People at Work in Ireland (Dublin: Government Publications), Availableat http://www.ucd.ie/t4cms/Human%20Resources%20in%20the%20Recession%20Book%20Manuscript.pdf (accessed 20 September 2012).
Saks, A. M. and Burke, L. A. (2012), ‘An investigation into the relationship between trainingevaluation and the transfer of training’, International Journal of Training and Development, 16,118–27.
Salas, E. and Cannon-Bowers, J. A. (2001), ‘The science of training: a decade of progress’, AnnualReview of Psychology, 52, 471–99.
Schermelleh-Engel, K., Moosbrugger, H. and Müller, H. (2003), ‘Evaluating the fit of structuralequation models: tests of significance and descriptive goodness-of-fit measures’, Methodsof Psychological Research Online, 8, 2, 23–74.
Schermuly, C. C., Schröder, T., Nachtwei, J., Kauffeld, S. and Gläs, K. (2012), ‘Die Zukunft derPersonalentwicklung. Eine Delphi-Studie [The future of human resource development – aDelphi study]’, Zeitschrift für Arbeits- und Organisationspsychologie, 56, 111–22.
154 International Journal of Training and Development© 2013 Blackwell Publishing Ltd.

Schweizer, K. (2010), ‘Some guidelines concerning the modeling of traits and abilities in testconstruction’, European Journal of Psychological Assessment, 26, 1–2.
Schyns, B. and von Collani, G. (2002), ‘A new occupational self-efficacy scale and its relation topersonality constructs and organizational variables’, European Journal of Work and OrganizationalPsychology, 11, 219–41.
Spector, P. E. (2006), ‘Method variance in organizational research: truth or urban legend?’,Organizational Research Methods, 9, 221–32.
Stoughton, J. W., Gissel, A., Clark, A. P. and Whelan, T. J. (2011), ‘Measurement invariance intraining evaluation: old question, new context’, Computers in Human Behavior, 27, 2005–10.
Tracey, J. B., Hinkin, T. R., Tannenbaum, S. and Mathieu, J. E. (2001), ‘The influence of individualcharacteristics and the work environment on varying levels of training outcomes’, HumanResource Development Quarterly, 12, 5–23.
Wang, G. G. and Wilcox, D. (2006), ‘Training evaluation: knowing more than is practiced’,Advances in Developing Human Resources, 8, 528–39.
Development and correlates of the Q4TE 155© 2013 Blackwell Publishing Ltd.