evaluating the utilisation of climate-smart agriculture
TRANSCRIPT

122
Evaluating the utilisation of Climate-Smart Agriculture (CSA) technologies and practices among smallholder farmers in The Lawra, Jirapa and Nandom districts of Ghana K.O. SAM*, V.A. BOTCHWAY, N. KARBO, G.O. ESSEGBEY, D. K. NUTSUKPO & R.B. ZOUGMORÉ(K. O. S, V. A. B. & N. K.: CSIR-Animal Research Institute, P. O. Box AH 20, Achimota, Accra, Ghana; G. O. E.: CSIR-Science Technology Policy Research Institute, Accra, Ghana; D. K. N.: Ministry of Food and Agriculture (MOFA), Volta Region, Ho, Ghana & R. B. Z.: International Crops Research Institute for the Semi-Arid Tropics (ICRISAT), Bamako, Mali) *Corresponding author’s email: [email protected]
ABSTRACTClimate change is posing threat to agriculture in sub-Saharan Africa including Ghana. Climate-Smart Agriculture (CSA) is proposed to solve climate change impacts on agriculture. Smallholder farmers are adopting various strategies to be resilient to climate change effects. Empirical research is required to evaluate CSA utilisation in Ghana. Lawra, Jirapa and Nandom districts in the climate-risk areas of Guinea Savannah agro-ecological zone were chosen and Participatory Rapid Appraisal (PRA) tools were used. Farm budget analysis and market price methods were employed; key financial decision-making tools were net returns, profit margins and benefit-cost ratio. Soft systems content analysis, frequencies, means, ranking and data aggregation were employed to generate results. CSA use in the study districts was smallholder driven and male dominated. CSA was mainly used for staples including cereals and legumes and small ruminants under livestock. Crop-livestock integration and crop rotation were the common CSA practices with the highest costs (GH¢6,370.00) and highest revenues (GH¢9,460.00) respectively. Utilisation of CSA in the districts is beneficial and investments are profitable and financially viable. All actors and stakeholders must join forces to promote CSA in the districts. Rigorous promotional campaigns, capacity building and funding at all levels are crucial for CSA adoption in Ghana.
Keywords: Climate-Smart Agriculture; Smallholder Farmers; Food Security; Livelihood; Lawra, Jirapa and Nandom DistrictsOriginal scientific paper. Received 13 Oct 2020; revised 14 Dec 2020
Introduction Climate change continues to pose a major threat to economic growth and development globally. This threat to sub-Saharan Africa, especially West Africa, is compounded by their weak economies and high dependence on agriculture
as a major driver of economic growth and development. Ghana is equally threatened because agriculture is deeply dependent on climatic elements such as rainfall, temperature, wind speed and sunshine. Ghana’s agricultural sector continues to play a vital role in the
Ghana Jnl Agric. Sci. 55 (2), 122 – 144GJAS is an Open Access Journal and distributed under the terms of the Creative Commons (CC) License [CC BY 4.0]
https://dx.doi.org/10.4314/gjas.v55i2.10

123
national development by way of employment, income, food and nutrition, and inputs or raw materials and therefore has a great impact on poverty reduction. Though currently declining, the sector’s contribution to national gross domestic product (GDP) is very phenomenal. It recorded GDP decline from 19.7% in 2018 to 18.5% in 2019 (GSS, 2020). Climate change in the form of increased temperatures and unpredictable rainfall patterns impacts negatively on Ghana’s agriculture and the people’s livelihoods. Such impacts include increase in crop yield gaps, increase in post-harvest losses of agricultural commodities, decline in the availability and quality of forage and high mortality and morbidity of livestock (Essegbey et al., 2020). Some major crops in Ghana; example cassava, maize, sorghum, rice and yam are currently experiencing yield gaps. Though experiencing low yields, productivity of these crops is expected to further decline due to climate change (Issahaku et al., 2014). Cassava yields are expected to reduce by 3%, 13.5% and 53% in the years 2020, 2050 and 2080 respectively (Asante & Amuakwa-Mensah, 2015). Freduah et al. (2019) also projected reduction in maize yields in the interior savannah of Ghana. Groundnut productions are however projected to increase due mainly to carbon dioxide fertilization (Adiku et al., 2015; De Pinto et al., 2012). For livestock systems in the country, Thornton et al. (2015) indicated that Aboveground Net Primary Productivity (ANPP) in rangelands, which is a good proxy for livestock productivity, is projected to decrease by 47.9% in Ghana by 2050. Ghana has since 2010 undertaken several initiatives towards the development of comprehensive programmes (strategies) as part of processes leading to enhancing national
adaptation to climate change (GCCAFS, 2014; Sam et al., 2015). A National Climate Change Policy (NCCP) has been developed focusing on achieving a climate-resilient and climate-compatible economy while achieving sustainable development (MESTI, 2013). Consequently, a National Climate-Smart Agriculture Action Plan has been developed to operationalize the agriculture sector of the NCCP (MoFA, 2015). Indisputably, the ever-increasing human population in sub-Saharan Africa including Ghana tends to fuel food requirements; and food production needs to increase logically. The impacts of climate change are expected to further reduce agricultural productivity and food systems. To address the challenges of climate change impacts on agriculture and the food system, Climate Smart Agriculture (CSA) concept is increasingly being promoted. The recent global and national drive for Climate-Smart Agriculture seems to present a scenario that CSA is the best option and remedy for climate change impacts on agriculture (CIAT, 2016). CSA integrates the three dimensions of sustainable development (economic, social and environmental) by jointly addressing food security and climate challenges. It is built on three main pillars namely: (1) sustainably increasing agricultural productivity and incomes; (2) adapting and building resilience to climate change and (3) reducing and/or removing greenhouse gas emissions, where possible (FAO, 2013). FAO (2015) affirmed that CSA is an approach to developing the technical, policy and investment conditions to achieve sustainable agricultural development for food security under climate change. Anuga et al. (2019) also asserted that CSA provides adaptation strategies that can help avoid or ameliorate the negative
Evaluating the utilisation of Climate-Smart Agriculture...

124
impacts of climate change on production, incomes and well-being of smallholder farmers. In this vein CSA, as an approach, is assumed to facilitate farmers to operate along its three pillars. Nonetheless, farmers are doing their own thing to stay in business; employing various adaptation strategies intended to be resilient to climate change. Meanwhile, there is a great paucity of CSA information at the local level, particularly the technical (practices) and the investment (finance) aspects. Andrieu et al. (2017) asserted that a major challenge for policymakers to operationalize CSA is the identification, valuation (cost-benefit), and subsequent prioritization of climate-smart options and portfolios (groups of CSA options) for investment. FAO (2013) also documented that smallholder farmers, including livestock keepers, fishers and foresters, especially women and indigenous people, are the most vulnerable to climate change. Business-as-usual strategies therefore may not yield the needed livelihood support for the smallholder farm families. Rather could increase their risk and vulnerability to climate change shocks and stresses. Key issues considered include the level of CSA utilisation among farmers, the costs and benefits, constraints and challenges, contributions of CSA use to livelihood improvement and the support systems required to promote CSA in the study districts. The study mainly intended to evaluate the utilisation of CSA technologies and practices among smallholder farmers in the Lawra, Jirapa and Nandom districts of Ghana. Focusing on this, the study specifically sought to: • Assess the utilization levels of CSA
technologies and practices in the Lawra, Jirapa and Nandom districts.
• Estimate the costs and benefits associated with the use of the CSA technologies and practices in the study area.
• Assess the contribution of the CSA use to livelihood improvement of the users.
• Identify key challenges associated with the use of CSA technologies and practices in the study area. Highlight the support systems required to promote CSA adoption in the study area.
In 2014, the Ghana Science-Policy Dialogue Platform on Climate Change, Agriculture and Food Security (CCAFS) profiled the CSA technologies and practices in the Guinea Savannah zone of Ghana. As CSA is known to be location-specific (FAO, 2015), making available empirical evidence from the district level is worthwhile to support effective CSA policy and investment decision-making and actions. CSA actors will find the document very useful; particularly agricultural extension agents, NGOs and farmer-based organisations could use the findings for education, planning and as capacity building instruments. As a guide, the study will capacitate farmers with knowledge and skills towards resilience building and farm-level investment decision-making. It contributes to information gap filling and adds up to the existing scanty body of knowledge on CSA in Ghana.
Materials and MethodsMultifaceted approaches and methods were employed to conduct the study. The process issues have been summarised to capture the
K. O. Sam et al., (2020) Ghana Jnl. Agric. Sci. 55 (2), 122 – 144

125
main activities and strategies, selection of study area, data collection, and data analysis.
Planning and consultative meetingsSeries of planning meetings were held
to design and implement the study. A multi-disciplinary team of researchers with expertise in agricultural economics, agribusiness, climate science, agronomy, animal husbandry, range ecology, policy and development economics as well as monitoring, evaluation and learning was deployed for the purpose.
Selection of study area In 2014, the Ghana CCAFS Science-Policy Platform profiled over 50 CSA technologies and practices in the Guinea Savannah agro-ecological zone of Ghana (Karbo et al., 2016). The prevalence of the CSA technologies and practices was highlighted during the CSA profiling exercise in the zone. This guided the selection of the study districts as some communities emerged as more CSA-practicing areas. Attention was given to the prevalence of CSA technologies and practices within a locality as most people practice more than one CSA technology or practice. Proximity and accessibility were considered vis-à-vis the resources available (time and finance). In general, the study prioritised geographical areas with ongoing CSA technologies and practices. MoFA office in the Upper West region was contacted to assist in the selection
process. The agricultural extension zones and major CSA practicing communities within the selected districts were considered in the study.
Three districts within the Guinea Savannah agro-ecological zone were purposefully selected; namely Lawra, Jirapa and Nandom districts located in the Upper West region of Ghana. Lawra and Jirapa are known CCAFS project districts (Sijmons et al., 2013) with ongoing CSA technologies and practices, which made it easy to work with the existing structures. Nandom district was selected based on proximity, accessibility, language similarities and convenience. Besides, the rippling effects in CSA use and the long-standing history and ties with the two CCAFS districts influenced Nandom’s inclusion.
Profile of the Lawra, Jirapa and Nandom districts
The Lawra, Jirapa and Nandom districts form part of the 11 districts in the Upper West region of Ghana and lie in the north-western part of the region. They are adjacent districts within the Guinea Savannah agro-ecological zone of Ghana. The climate involves high temperatures, uni-modal rainfall patterns and long periods of dry conditions. Soils are generally poor within the districts. There are dominant rural population and are described as agrarian districts. Table 1 presents a summary profile of study area districts.
Evaluating the utilisation of Climate-Smart Agriculture...

126
TABLE 1 Profile of the Lawra, Jirapa and Nandom Districts
Feature Lawra District Jirapa District Nandom DistrictLocation and size
Between Longitude 2°25′W and 2°45′W and Latitude 10°20′N and 11°00′N with area of 1051.2km2. Is made up of 98 communities with 95% living in rural areas.
Between Longitudes 2°20′W and 2°50′W and Latitudes 10°25′N and 11°00′N with area of 1188.6km2. Is made up of 137 communities with 95% living in rural areas.
Between Longitude 2°25′W and 2°45′W and Latitude 10°20′N and 11°00′S with area of 567.6km2. Is made up of 88 communities with 86% living in rural areas.
Capital. Lawra. Jirapa. Nandom.Climatic zone. Guinea Savannah zone
with tropical continental climate.
Guinea Savannah zone with tropical continental climate.
Guinea Savannah zone with tropical continental climate.
Temperature Mean annual temperature ranging between 27°C to 36°C.
Mean annual temperature ranging between 28°C and 31°C
Mean annual temperature ranging between 27°C to 36°C.
Rainfall Uni-modal rainfall pattern Single maximum rainfall. Rainy season is from May to October. Mean annual rainfall is 1016mm-1270mm.
Uni-modal rainfall pattern. Single maximum rainfall. Rainy season is from May to October. Mean annual rainfall is 1000mm-1100mm.
Uni-modal rainfall pattern. Single maximum rainfall. Rainy season is from May to October. Mean annual rainfall is 916mm-1246mm.
Vegetation Guinea Savanna short grasses and few woody plants. Common trees are drought and fire resistant trees (baobab, dawadawa, Shea trees and acacia).
Guinea Savanna woodland with light undergrowth and scattered medium-sized trees, shrubs and grasses. Common trees are dawadawa, Shea, baobab, neem.
Guinea Savanna grasses with scattered fire resistant trees such as the Shea and baobab trees. Mango and cashew trees are also found in the district.
Relief and Drainage
Gently rolling with a few hills (180m-300m) above sea level. Main river is the Black Volta with several tributaries.
Generally flat and low-lying with average height of 300m above sea level. Few plateau surfaces ranging between 1000 – 1150 feet. Major rivers are White Volta and tributaries of the Black Volta
Gently undulating. Located about 180m above sea level with a few isolated hills. Poorly endowed with water bodies, but few interconnected streams flow into the Black Volta, which cuts through the district.
Soils Mainly of laterite soils. There are strips of alluvial soils along the flood plains of the Black Volta and sandy loams along some of its tributaries.
Mainly sandy loam with underlying hard iron pans. There are narrow strips of alluvial soils along the numerous dry valleys of the tributaries of the Black Volta.
Mainly sandstone, gravel, mudstone, alluvium, granite and shale weathered into different soil grades. Erosion is resulting into sand, clay and laterite ochroslols soils.
K. O. Sam et al., (2020) Ghana Jnl. Agric. Sci. 55 (2), 122 – 144

127
Feature Lawra District Jirapa District Nandom DistrictPopulation Estimated population for
2020 is 67,886 comprising 32,998 (49%) males and 34,888 (51%) females. Population density is about 65 persons/km2. Rural population is 86%.
Estimated population for 2020 is 109,308 comprising 52,093 (48%) males and 57,215 (52%) females. Population density stands at 92 persons/km2. Rural population is 86%
Estimated population for 2020 is 56,947 comprising 27,924 (49%) males and 29,023 (51%) females. Population density is 100 persons/km2. Rural population is 86%.
Main Economic Activity
Agriculture is the main economic activity and accounts for 80% of the District economy. Commerce /Service and industry account for about 18.2% and 0.8% respectively. Industrial activities are mainly processing of agricultural produce, are agro-based and small in size.
Agriculture is the main economic activity. About 71% of the working population are into agriculture and related activities.
Dominant industries are small-scale manufacturing and agro-processing. Commerce is chiefly buying and selling of agricultural produce, consumer goods and second-hand items.
Agriculture is the main economic activity and accounts for about 85% of the labour force. Commerce/ service is 14% and industry is 1%. A lot of industries are agro-based and small in size. Activities include local brewing, commercial food preparation, Shea butter and groundnut oil extraction, rice processing, weaving, etc.
Agriculture Major crops include maize, millet, rice, sorghum, yam, groundnut, cowpea, soya beans, and vegetables. Shea nut and dawadawa trees are main cash crops. Livestock are goats, sheep, cattle, poultry (local) and pigs, rabbit, grass-cutter and beehives.
Major crops include maize, sorghum, millet, rice, groundnuts, cowpea, soya beans and yam. Cashew and mango as main cash crops cultivated. Tree crops like dawadawa and Shea are naturally grown on farms. Major livestock are poultry (local), goats, pigs, sheep and cattle.
Major crops include rice, sorghum, millet, maize, soybean, cowpea, groundnut, bambara groundnut, yam and sweet potato and vegetables. Main cash crops include cotton, pepper and economic trees (Shea, dawadawa and baobab). Livestock are cattle goat, rabbit, sheep, poultry (local) and pigs.
Markets Main markets Lawra and Babile. Other small markets are Eremon, Boo, Baseble, Tuopare, Domwine, and Zambo.
Major markets are Jirapa, Tizza, Sabuli, Hain and Ullo. There are other minor markets across the communities.
Main markets are Kuturu (Baseble), Ko and Nandom. Hamile market near Burkina is noted for informal cross border agricultural trade.
Financial Institutions
Two functional banks serving as main financial institutions are namely: Ghana Commercial Bank, Lawra Area Rural Bank and First National Bank.
Main financial institutions are Sonzele Rural Bank Ltd with an agency in Han, Sinapi Aba Trust Ltd, GN Bank and the St. Joseph’s Credit Union also situated in Jirapa.
Main financial institutions are Nandom Rural Bank and GN Bank in Nandom.
Several groups exist, which have adopted the Village Savings and Loans Schemes.
Institution supporting Agriculture
Department of agriculture, CCAFS West Africa, District CSA Platforms, CIKOD, etc.
Department of agriculture, CCAFS West Africa, District CSA Platforms, etc.
Department of agriculture, CCAFS West Africa, District CSA Platforms, NANDIRDEP, etc.
Source: Authors’ Compilation from Jirapa District (2014), Lawra District (2014), Nandom District (2014), Jirapa Municipal Assembly (2018), Lawra Municipal Assembly (2018), Nandom District Assembly (2018) and https://statsghana.gov.gh/
Evaluating the utilisation of Climate-Smart Agriculture...

128
Data collection Research instruments and protocols were developed and pre-tested by the team. Both qualitative and quantitative data were collected in order to gather and generate adequate information. Participatory CSA Rapid Appraisal (PRA) tools were used to collect field data. These include key informant interviews, focus group discussions, community group meetings and interviews, critical observations, proportional piling, scoring and ranking. Before the actual fieldwork, adequate community entry processes were followed to sensitize and create awareness to gain acceptance. A total of 45 respondents from the districts were purposefully selected and interviewed for cogeneration of information. The selection covered all the agricultural zones and CSA practicing communities. The participants were CSA practitioners in the respective districts who have adequate knowledge and information on the subject. They include the policy and decision makers from the assemblies, selected workers of government departments and agencies, agricultural extension agents, traditional leaders, NGOs and FBOs workers and individual farmers. The survey was conducted between October and November 2015. Participants were interviewed on the farm operations using a checklist and interview guide with selected crops and livestock.
At the community meetings and interviews, each district was made to select the CSA technologies and practices utilized in the district from the existing list profiled by the Ghana CCAFS Science-Policy platform (Karbo et al., 2016). This was done based on the fact that CSA is location, area and site-specific (FAO, 2013; MoFA, 2015). The districts were subsequently guided to prioritize the most suitable and commonly used CSA technologies
and practices using the Participatory CSA Profiling Manual (Sam et al., 2015). The manual has CSA scoring matrix, which contains sieves of criteria with corresponding weights according to the Likert’s scale. Each selected CSA technology or practice was evaluated and scored using the weighted criteria. CSA technologies and practices that score highest was highly prioritized or ranked followed by the next in that order. Top five CSA technologies and practices were selected as the most highly prioritised and superior for each district. Detailed primary data were collected on use of CSA technologies and practices, which include general information about the study sites, level and scale of CSA use, gender issues in CSA use, anticipated costs and benefits, productivity associated with the CSA practices, input and output market prices, challenges and constraints, among others. Community group meetings and interviews were used to determine the magnitudes of CSA Utilization, prioritize the CSA technologies and practices, identify the main cost items and the major farm commodities involved. Data on the use of CSA technologies and practices by scale and by gender and the contributions of CSA use to livelihood improvement were collected through proportional piling. Challenges and constraints associated with the use of CSA technologies and practices were identified using the proportional piling and simple or pair-wise ranking tools. The experts or key informants' interviews and community meetings also enumerated some support systems necessary to promote CSA within the districts.
Most data were generated in focus group discussions (FGDs) setting. The FGDs comprising 12 participants and in-depth interviews with three key informants were
K. O. Sam et al., (2020) Ghana Jnl. Agric. Sci. 55 (2), 122 – 144

129
conducted in each study district. Separate FGDs were conducted for farmers and the other CSA actors in each district. The repeated FGDs helped in the verification and correction of data gaps as well as build consensus on conflicting data. The interviews with the selected experts provided further data for the study. Data on costs and benefits (revenues) was derived from primary data collected from key resource farmers, experts’ opinions and from published work or reports. The data from the literature review was used to fill in the data gaps generated by the primary data collection.
Data processing and presentation of resultsData generated from the fieldwork were
adequately discussed in various meetings and subjected to soft systems of analysis based on consensus building. Adequate content analysis techniques were employed to analyse the data collected in the focus group discussions and expert interviews. Voice recordings obtained were transcribed and manually synthesised to retrieve information to complement the data. Frequency distributions, arithmetic means, scoring, ranking and relevant data compilation and aggregation were used to generate useful results. Net return or worth, profit margins and benefit-cost ratios were employed as key financial decision-making tools to assess CSA investment decisions among the farmers. Farm budget analysis and market price methods were used to compute the costs and revenues and the related total costs and total revenues associated with the use of the top five CSA technologies and practices in each district. These were in turn used to compute the net financial returns or worth, profit margin and benefit-cost ratio regarding the utilization of the selected CSA technologies and practices. All costs and benefits were computed on per acre
basis and every CSA technology or practice was considered separately. Three major farm produce or commodities were used for each selected CSA technology or practice. Micro-Soft Excel Version 16 was used to capture and analyse the data.
Theoretical framework on the financial analysisThe financial analysis is based on
two economic theories namely the theory of production and cost theory. Under the theory of production, the goal of the firm is profit maximization and the prices of the output and inputs are given. In the cost theory, the total cost is split into total fixed cost and total variable cost. Fixed costs are costs that do not change (vary) with the level of output. Variable costs are costs that change directly with output (Koutsoyiannis, 1979; Dyson, 1997; Boake-Yiadom, 2004; Nwokoye & Ilechukwu, 2018). In this study, fixed costs include tools and equipment, animal pens and land acquisition/rent. Variable costs include planting materials, animal breeds, animal feed, labour, transportation and training.
Assumptions made for the financial analysisThe following assumptions were made in the estimation of financial costs and benefits.
• CSA users are smallholder farmers operating land sizes of at most 5 hectares
• CSA users are in business and are rationally aiming at profit maximisation
• Only one season’s output is used for the selected farm commodities
• Time was considered as a constant due to one season period
• Farm gate prices were used to compute costs and benefits
Evaluating the utilisation of Climate-Smart Agriculture...

130
• Monetary values were not discounted, considering one season and timeless operation, hence zero year period
Estimation of costsIn the cost estimation approach, cost is
explained as the monetary value of the goods and services purchased or utilized. Thus monetary valuation of all efforts, materials, resources, time and utilities consumed, risk incurred and opportunities forgone in production and delivery of goods and services (Nwokoye & Ilechukwu 2018). In this regard cost is the product of price and quantity of the cost item used. Total cost describes the summation of all the costs that are incurred to produce something or to utilize services (LaRock, 2019 and Ghawate, 2020). Simply put, total cost is the sum of the costs of all of the various factors or cost items involved. To compute the total cost (TC) associated with the use of a particular CSA technology or practice various cost items under the use of that CSA technology or practice were identi-fied. Also, the unit prices for each cost item were collected from the commodity budget of the Department of Agriculture in the districts. Knowing the physical quantities of each cost item used, the cost (C) of using a particular in-put was computed. The process was repeated for all the inputs (in both variable and fixed costs) associated with that CSA technology or practice. The resultant costs were aggregated to obtain the total cost (TC) associated with the use of that particular CSA technology or prac-tice. This process is expressed mathematically in the following equations.
C = Pc · Qc ……..............................[1]
where Pc and Qc are the respective price and quantity of a specific cost item associated with the use of that CSA technology or practice.
Total Variable Cost (TVC): is the summation of the various variable cost components of the economic activities. This is given as:
TVC = Cv1 + Cv2 + ……… + CvJ ……....... [2]where Cv1, Cv2, ………, CvJ are the various variable cost elements associated with the use of that CSA technology or practice.
Total Fixed Cost (TFC): is the summation of the various fixed cost elements. This can be represented as:
TFC = Cf1 + Cf2 + ……… + CfJ ............… [3]where Cf1, Cf2, …..…, CfJ are the various fixed cost items associated with the use of that CSA technology or practice. Rewriting equations 2 and 3 in general terms give equations 4 and 5 respectively.
TVCt = Pvkt · Qvkt …........................… [4]
TFCt = Pfkt · Qfkt ….......................… [5]
Total Cost (TC) is shown as in equation 6.
TCt = Pvkt · Qvkt + Pfkt · Qfkt …….[6]
where k is the number of various cost items in the respective variable costs and fixed costs and takes the values of k=1, 2, ……., K. t denotes the time period in years (one season and timeless implies zero years). These processes were repeated for the other prioritised CSA technologies and practices.
K. O. Sam et al., (2020) Ghana Jnl. Agric. Sci. 55 (2), 122 – 144

131
Estimation of benefits (revenues)In estimating the benefits derived from
the use of CSA technologies or practices, revenues were used as proxy indicators. Revenue (R) is the payment received from selling a good or performing a service, hence revenue is a product of price and quantity (Koutsoyiannis1979) as shown in equation 7.
R = Ps · Qs …...........................................… [7]where Ps and Qs are the respective price and quantity of a specific farm commodity produced using a particular CSA technology or practice.
Total Revenue (TR) is therefore the summation of various revenues generated from the respective farm produce or commodities as shown in equation 8. TR = R1 + R2 + ………… + Rn ….........….[8]
where R1, R2, ……….., Rn are the revenues generated from various farm commodities produced from using that CSA technology or practice.Rewriting equation 8 in general terms gives equation 9.
TRt = Ppzt · Qpzt........................……….[9]
where z is the number of farm commodities and takes the values of z = 1, 2, ……., Z. t denotes the time period in years (one season and timeless implies zero years). These processes were repeated for the other prioritised CSA technologies and practices.
Net financial returns or worth, profit margin and benefit-cost ratio
The Net Return or Worth (Π), Profit Margin (PM) and Benefit-Cost Ration (BCR)
were used to estimate the profitability of the various prioritized technologies. Net return or worth, which shows the difference between the expected benefits (revenues) and the associated costs (Gittinger, 1982 and Boakye-Yiadom, 2004), is as shown in equation 10. Profit Margin is shown in equation 11, while Benefit-Cost Ratio is shown in equation 12.
Π = TRt – TCt ………….[10]PM = Π / TRt = (TRt – TCt) / TRt.…… [11]BCR = TRt / TCt …..........................…… [12]Where TR, TC and t maintain their usual meaning.
The Net Return or Worth (Π) indicates if there is a gain or loss from the investment into a particular CSA technology or practice. A positive net return or worth (Π > 0) indicates a gain and a negative net return or worth (Π < 0) indicates a loss from investment into a particular CSA technology or practice. The Profit Margin (PM) shows if an investment is profitable or not. An investment into a particular CSA technology or practice is profitable when the profit margin is greater than zero but less than or equal to one (0 < PM ≤ 1) and not gainful when the profit margin is less than or equal zero (PM ≤ 0).
The Benefit-Cost-Ratio (BCR) confirms if an investment is financially viable or not. An investment into a particular CSA technology or practice is financially viable when the benefit-cost ratio is greater than one (BCR > 1) and not financially viable when the benefit-cost ratio is less than one (BCR < 1).
Results and DiscussionThis section focuses on the empirical results and findings, which are presented in accordance with the study districts.
Evaluating the utilisation of Climate-Smart Agriculture...

132
Utilization levels of CSA technologies and practices.
Magnitudes of CSA utilization A total of 28, 30 and 38 CSA technologies and practices were identified in the Lawra, Jirapa and Nandom districts respectively (Table 2). These districts were found using in common 22 CSA technologies and practices, which may be due largely to the rippling effects in CSA use since they are
adjacent districts. The main differences were that, Jirapa was using fodder banking, farmer-managed natural regeneration, mulching, half-moon and Zai technology and beekeeping. Lawra was not using guinea fowl ethno-veterinary health management, drip irrigation, talking book, Essoko Ignitia Ltd information dissemination and contour ploughing/farming. Only Nandom was using all the identified CSA technologies and practices including crop insurance and cage fish farming.
TABLE 2CSA Technologies and Practices Used in Lawra, Jirapa and Nandom Districts
No. Name of CSA technology/practice Lawra Jirapa Nandom1 Agro-forestry √ √ √2 Mixed farming √ √ √3 Crop rotation √ √ √4 Mixed cropping √ √ √5 Cover cropping √ √ √6 Stone lining (bonding) √ √ √7 Earth Bonding √ √ √8 Tie ridging √ √ √9 Ridge contouring √ √ √10 Community-led bushfire control √ √ √11 Crop livestock integration √ √ √12 Crop diversification √ √ √13 Planting climate resilient crop varieties √ √ √14 Drought and striga tolerant maize varieties √ √ √15 Minimum tillage √ √ √16 Chemical fertiliser √ √ √17 Organic fertilizer √ √ √18 Manure application √ √ √19 Composting √ √ √20 Cross breeding/ Breed improvement/ selection √ √ √21 Supplementary feeding √ √ √22 Rotational grazing √ √ √23 Fodder banking √ - √24 Farmer-managed Natural Regeneration √ - √25 Mulching √ - √26 Beekeeping √ - √27 Half-moon and Zai √ - √28 Intensive small holder pig farming √ - √29 Guinea Fowl Ethno-veterinary health management - √ √30 Combine mineral and organic nutrient management - √ √31 Drip irrigation - √ √32 Talking book - √ √33 Essoko Ignitia Ltd Information Dissemination - √ √34 Contour ploughing/farming - √ √35 Proper storage - √ √36 Inter/alley-cropping - √ √37 Crop insurance - - √38 Cage fish farming - - √Source: Compilation from Field Data
K. O. Sam et al., (2020) Ghana Jnl. Agric. Sci. 55 (2), 122 – 144

133
It was observed that the communities where these CSA technologies and practices were mostly used followed the order:
1. Lawra district: “Kanpuoh > Babile/Kalsagri > Dikpe > Bewong > Oribilli > Lawra > Eremon = Tanchara/Kunyukuo
2. Jirapa district: Doggoh > Konzokalah > Baazu/Tampaala > Tuggoh > Tizza/Douri > Hain > Chepuri > Jirapa
3. Nandom district: Guo > Goziir = Betaglu > Walateng > Bullegaun = Nandomkpee > Zedung > Brutu/Ko
Kanpuoh, Doggoh and Guo in Lawra, Jirapa and Nandom districts respectively were observed as communities that use more CSA technologies and practices. This was highly expected because Bompare and Doggoh are CCAFS climate-smart villages (CSVs) promoting tried and tested CSA technologies and practices. Similarly, Kanpuoh and Guo are well-demarcated demonstration sites regulated by the traditional authorities and followed best practices such as non-burning, no tree felling and no charcoal burning. They also practice farmer-managed natural regeneration of vegetation.
Prioritization of CSA technologies and practices
The respondents were made to prioritise five best-bet from the long list of CSA technologies and practices identified using the CSA profiling manual (Sam et al., 2015). Table
3 presents the results from the prioritisation process and summarized as:
1. Lawra district (28): Crop-livestock integration >Community-led bushfire control > Stone lining (bonding) or ridging> Composting > Crop rotation.
2. Jirapa district (30): Crop-livestock integration > Chemical fertilizer > Mixed cropping > Crop rotation > Stone lining (bonding) or ridging
3. Nandom district (38): Community-led bushfire control > Crop-livestock integration > Mixed cropping> Agroforestry > Crop rotation
It is evident that crop-livestock integration and crop rotation were commonly used in all three districts. The crop-livestock integration is highly practiced in the Lawra and Jirapa districts indicating that the farmers are engaged in both livestock and crop farming. Again, Lawra and Nandom districts are promoting community-led bushfire control confirming the earlier finding that Kanpuoh and Guo are noted for that practice. These results suggest preferences in CSA use vary for the select districts, affirming the established fact that CSA is location, area and site-specific (FAO, 2013; MoFA, 2015). This may therefore serve as a guide to the type of CSA technologies and practices to be promoted for various locations within the Guinea Savannah agro-ecological zone.
Evaluating the utilisation of Climate-Smart Agriculture...

134
TABLE 3 Prioritised CSA technologies and practices in the study districts
No. Name of technology/ practice Lawra Jirapa Nandom1 Crop-livestock integration 1st 1st 2nd
2 Community-led bushfire control 2nd 1st
3 Stone lining (bonding) or ridging 3rd 5th
4 Composting 4th
5 Crop rotation 5th 4th 5th
6 Mixed cropping 3rd 3rd
7 Chemical fertilizer 2nd
8 Agroforestry 4th
Source: Compilation from Field Data
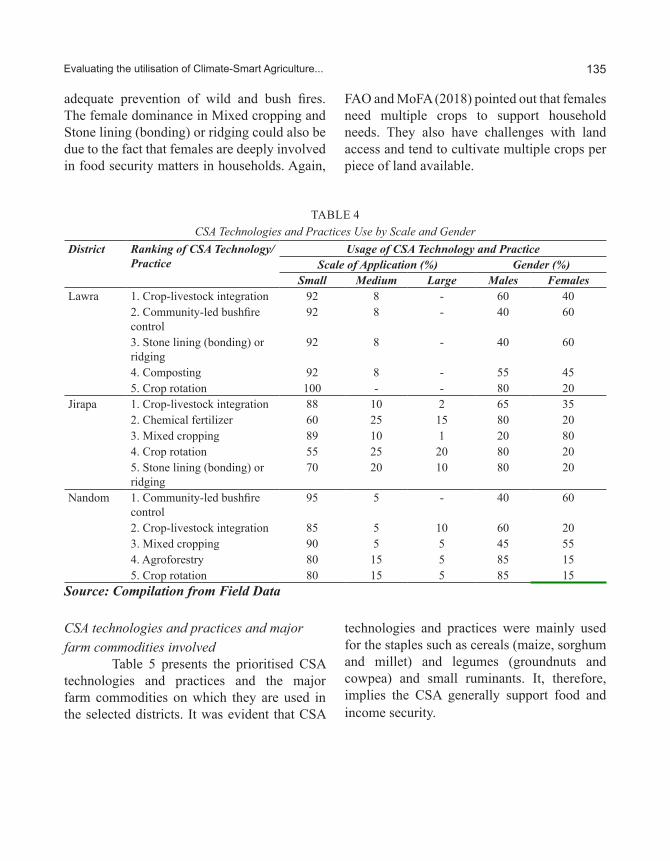
Use of CSA technologies and practices by scale and by gender The study discovered that CSA use in three districts followed the order of small scale > medium scale > large scale (Table 4). Medium and large-scale farming systems least applied the prioritized CSA technologies and practices at the time of the study. Community-led bushfire control was not used at large-scale farming levels in the Nandom District. Similarly, none of the prioritized CSA technologies and practices was applied at large-scale farming levels in the Lawra District. It implies therefore that smallholder farmers dominated in the use of the prioritised CSA technologies and practices in the districts. This confirms the national situation that farming in Ghana is smallholder dominated (MoFA, 2017) and the fact that farming in the study area is done on small scale where farmers engage in subsistence production systems to ensure sustenance and food security (Jirapa Municipal Assembly, 2018; Lawra Municipal, 2018; Nandom District Assembly, 2018). Results in Table 4 further revealed that there is no restriction among the gender regarding the use of the prioritized CSA technologies and practices. Both males and females have equal opportunities to use CSA
in the districts. This confirms the finding from Botchway et al. (2015) that all the CSA technologies and practices were patronised by both men and women in the study districts. The males dominated in the use of most CSA technologies and practices. Specific cases are crop-livestock integration and crop rotation, which commonly cut across all study districts. The observed male dominance could largely be attributed to financial implications and ownership of land and livestock, which the females may be disadvantaged. According to the key informants, all females do not own land in Nandom district but the male youth do and it happens mostly in the form of “ownership by inheritance”. It is a cultural belief that the females will marry and join their hushands who own lands. Also, the labor-intensive nature of most CSA technologies and practices could be another reason as affirmed in FAO and MoFA (2018) that the laborious nature in the use of some of the CSA practices restricts their usage by females.
On the other hand, females dominated in the use of community-led bushfire control, mixed cropping and Stone lining (bonding) or ridging. For Community-led bushfire control, the female dominance could be ascribed to their reluctance in taking risk and tend to undertake
K. O. Sam et al., (2020) Ghana Jnl. Agric. Sci. 55 (2), 122 – 144
135
adequate prevention of wild and bush fires. The female dominance in Mixed cropping and Stone lining (bonding) or ridging could also be due to the fact that females are deeply involved in food security matters in households. Again,
FAO and MoFA (2018) pointed out that females need multiple crops to support household needs. They also have challenges with land access and tend to cultivate multiple crops per piece of land available.
TABLE 4 CSA Technologies and Practices Use by Scale and Gender
District Ranking of CSA Technology/Practice
Usage of CSA Technology and PracticeScale of Application (%) Gender (%)
Small Medium Large Males FemalesLawra 1. Crop-livestock integration 92 8 - 60 40
2. Community-led bushfire control
92 8 - 40 60
3. Stone lining (bonding) or ridging
92 8 - 40 60
4. Composting 92 8 - 55 455. Crop rotation 100 - - 80 20
Jirapa 1. Crop-livestock integration 88 10 2 65 352. Chemical fertilizer 60 25 15 80 203. Mixed cropping 89 10 1 20 804. Crop rotation 55 25 20 80 205. Stone lining (bonding) or ridging
70 20 10 80 20
Nandom 1. Community-led bushfire control
95 5 - 40 60
2. Crop-livestock integration 85 5 10 60 203. Mixed cropping 90 5 5 45 554. Agroforestry 80 15 5 85 155. Crop rotation 80 15 5 85 15
Source: Compilation from Field Data
CSA technologies and practices and major farm commodities involved Table 5 presents the prioritised CSA technologies and practices and the major farm commodities on which they are used in the selected districts. It was evident that CSA
technologies and practices were mainly used for the staples such as cereals (maize, sorghum and millet) and legumes (groundnuts and cowpea) and small ruminants. It, therefore, implies the CSA generally support food and income security.
Evaluating the utilisation of Climate-Smart Agriculture...

136
TABLE 5 CSA Technologies and Practices, andFarm Commodities
No. CSA technology/ practice Major Farm Commodities Involved1 Crop-livestock integration Maize, Sorghum, Millet, Groundnut, Cowpea, Soya beans, Bambara
beans, Sheep, Goats, Cattle, Poultry.2 Community-led bushfire control Maize, Sorghum, Millet, Groundnut, Yam, Sheep, Goats, Poultry.3 Stone lining (bonding) or
Ridging
Maize, Sorghum, Millet, Groundnut, Cowpea, Soya beans
4 Composting Maize, Sorghum, Millet, Sheep, Goats, Cattle, Poultry.5 Crop rotation Maize, Millet, Sorghum, Groundnut, Cowpea, Soya beans.6 Mixed cropping Maize, Sorghum, Millet, Groundnuts, Cowpea, Yam, Rice, Soya
beans, Bambara beans.7 Chemical fertilizer Maize, Sorghum, Millet, Rice, Soya beans.8 Agroforestry Leuceana, Cashew, Moringa, Mango, Maize, Sorghum, Millet,
Groundnuts, Cowpea, Soya beans.Source: Compilation from Field Data
Costs and benefits associated with the use of CSA technologies and practices From the results in Table 6, Crop-live-stock integration had the highest cost of application in all the districts; Lawra = GH¢6,370.00, Jirapa = GH¢1,370.00, Nandom = GH¢5,450.00. The high cost involved in the crop-livestock integration system is partly due to the cost of acquiring and maintaining the animals, the cost of collecting and transporting manure and the cost of bringing crop residues to animals after harvesting. Similarly, crop ro-tation had the highest revenues in the Jirapa and Nandom districts but followed crop-live-stock integration and community-led bushfire control in the Lawra District. Crop rotation is mostly done with mono-cropping systems and often for commercial purposes.
The benefits derived in the form of revenue generation were higher than the associated costs of using the CSA technologies and practices apart from composting. It implies therefore that, holding other things constant
adoption of CSA technologies increased revenue of farmers in the Lawra, Jirapa and Nandom districts.
Net returns or worth, profit margins and bene-fit-cost ratio of using the CSA In Table 6, the results established that crop-livestock integration had the lowest profit margins and benefit-cost ratio in all the three districts. On the other hand, crop rotation had the highest net return, profit margin and bene-fit-cost ratio in the Jirapa and Nandom districts but followed community-led bushfire control in the Lawra District. Composting showed a devi-ation in the observed trend with negative net return, negative profit margin (PM < 0) and the lowest benefit-cost ratio, less than one (0.83). This implies the compost used in the Lawra district is not profitable and the investment is not financially viable.
The study further discovered that all the prioritised CSA technologies and practices had positive net returns or worth; only composting
K. O. Sam et al., (2020) Ghana Jnl. Agric. Sci. 55 (2), 122 – 144

137
recorded negative net returns (-GH¢680.00). This means that there are gains from using CSA technologies and practices except composting. Both the profit margins and benefit-cost ratios confirmed the validity of the above finding. Almost all the prioritised CSA technologies and practices recorded profit margins greater than zero but less than one. Similarly, almost all the prioritised CSA technologies and practices recorded benefit-cost ratios greater one. Again, only composting (Lawra district) showed a deviation in the observed trends in the financial analysis. These results conform with the findings from Andrieu et al. (2017), where the cost-benefit analysis showed that all the CSA practices generate economic benefits, except compost. To them, compost resulted in a negative net return and limited economic benefits, due to productivity or yield response
lag. The choice of compost was largely due to its higher adaptation and mitigation potential (Andrieu et al., 2017) as well as the organic farm commodities it produces. It could therefore be inferred that ceteris paribus, using the CSA technologies and practices in the three districts has net gains; the investments are profitable and deemed financially viable. Even though crop-livestock integration recorded the lowest profit margin and benefit-cost ratio making its investment least profitable and financially viable, it was the most highly prioritized practice among the CSA users within the study districts. This implies that the use of the crop-livestock integration system was not based only on monetary value but on other factors such as food security and socio-cultural considerations like funerals, festivals, dowry or bride price, traditional sacrifices and insurance against crop failure.
Evaluating the utilisation of Climate-Smart Agriculture...

138
Contribution of the CSA technologies and practices to livelihood improvement Aside from revenue generation, the use of CSA technologies and practices also provided other forms of benefits through contribution to livelihood improvement in the study area. These contributions were grouped into broad themes as improved farm yield, improved food security, improved living standard and improved soil fertility.
TABLE 6 Analysis of Costs and Benefits Associated with using Top
CSA Technologies and Practices in the Study Area
District Name of CSA Technology/Practice
Estimated Cost (GH¢)
Estimated Revenue (GH¢)
Net Returns (GH¢)
Profit Margins
Benefit-Cost Ratio
Lawra
1. Crop-livestock integration 6,370.00 6,920.00 550.00 0.0795 1.0863
2. Community-led bushfire control 2,400.00 6,920.00 4,520.00 0.6532 2.8833
3. Stone lining (bonding) or ridging 1,100.00 2,620.00 1,520.00 0.5802 2.3818
4. Composting 4,000.00 3,320.00 - 0680.00 - 0.2048 0.83005. Crop rotation 2,380.00 6,220.00 3,840.00 0.6174 2.6134
Jirapa
1. Crop-livestock integration 1,430.00 3,640.00 2,210.00 0.6071 2.5455
2. Chemical fertilizer 900.00 3,600.00 2,700.00 0.7500 4.00003. Mixed cropping 435.00 2,240.00 1,805.00 0.8058 5.14944. Crop rotation 715.00 4,480.00 3,765.00 0.8404 6.26575. Stone lining (bonding) or ridging 475.00 2,960.00 2,410.00 0.8142 5.3818
Nandom
1. Community-led bushfire control 3,400.00 5,990.00 2,590.00 0.4324 1.7618
2. Crop-livestock integration 5,450.00 8,900.00 3,450.00 0.3876 1.6330
3. Mixed cropping 3,300.00 9,200.00 5,900.00 0.6413 2.78794. Agroforestry 3,050.00 7,890.00 4,840.00 0.6134 2.58695. Crop rotation 1,500.00 9,460.00 7,960.00 0.8414 6.3067
Source: Compilation from Field Data
In general, using the CSA technologies and practices resulted in improvement in the farm yields followed by improvement in food security (Table 7). This is partly so because the farmers were largely smallholders using CSA in small-scale farming systems. Their priority is to ensure sustenance and food security, hence engage in subsistence production systems.
K. O. Sam et al., (2020) Ghana Jnl. Agric. Sci. 55 (2), 122 – 144

139
TABLE 7 Ranked order of Contribution of-CSA Technologies and Practices to Livelihood Improvement
District Name of CSA Technology / Practice Contribution by rank to livelihood improvementImproved farm yield
Improved food
security
Improved living
standard
Improved soil
fertilityLawra 1. Crop-livestock integration 1st 3rd 2nd 4th
2. Community-led bushfire control 3rd 2nd 1st 4th 3. Stone lining (bonding) or ridging 1st 2nd 4th 3rd 4. Composting 2nd 3rd 4th 1st
5. Crop rotation 1st 2nd 3rd 4th Jirapa 1. Crop-livestock integration 2nd 3rd 4th 1st
2. Chemical fertilizer 1st 3rd 2nd 4th 3. Mixed cropping 1st 2nd 4th 3rd
4. Crop rotation 1st 3rd 4th 2nd 5. Stone lining (bonding) or ridging 2nd 1st 2nd 1st
Nandom 1. Community-led bushfire control 4th 3rd 1st 2nd 2. Crop-livestock integration 4th 1st 2nd 3rd
3. Mixed cropping 3rd 1st 2nd
4. Agroforestry 4th 1st 3rd 2nd
5. Crop rotation 1st 3rd 2nd 2nd
Source: Compilation from Field Data
Challenges associated with the utilization of CSA technologies and practices
The respondents mentioned and ranked numerous challenges associated with using the CSA technologies and practices in the districts. Among the key challenges encountered in the respective districts are the following:
1. Lawra district key challenges include: Poor and erratic rainfall pattern > Cross border bushfires from the neighbourhood > inappropriate tools and materials.
2. Jirapa district key challenges include: inadequate farmlands > high capital investment > increased acidity and alkalinity.
3. Nandom district key challenges include: Inadequate technical know-how > Poor and erratic rainfall pattern > inappropriate tools and materials
Poor and erratic rainfall patterns, inadequate technical knowledge and inappropriate tools and materials appeared to hinder the smooth implementation of CSA in the study districts.
Some identified support systems required to promote CSA within the study area
The study identified some support systems necessary to promote CSA adoption within the study area. Table 8 presents details of some local level policy recommendations made by the respondents in support of CSA promotion within the districts. In general, there was the need to develop, implement and enforce community bye-laws on bushfires, deforestation and animal confinement at the community-level. Both the district and national levels need to strengthen extension and advisory service delivery systems through promotional education and training campaigns. The national level also needs to ensure adequate
Evaluating the utilisation of Climate-Smart Agriculture...

140
research into improved crop varieties and animal breeds, provide input supply subsidies and ensure effective policy implementation,
law enforcement and adequate funding for CSA.
TABLE 8 Local Level Policy Recommendations made by Respondents in Support of CSA
No. CSA Practice Community Level District Level National Level
1 Crop-livestock integration.
Develop and implement bye-laws on bushfires, tree felling, animal confinement.
Promote non-burning of crop residues.
Maintain water bodies.
Build farmers' capacity.
Enact, gazette and enforce bye-laws.
Increase extension education and training.
Upscale the livestock in-kind intervention to several communities.
Implement policies and enforce laws.
Strengthen extension and advisory service systems.
Initiate alternative livelihood schemes aside crop production.
Supply adequate funding.2 Community-led
bushfire controlDevelop and implement bye-laws on bushfires and deforestation.
Enact, gazette and enforce bye-laws on bushfires and deforestation.
Strengthen the district assemblies to enforce environmental laws.
3 Stone lining (bonding) or Ridging
Community stone lining on most affected areas. Compulsory use of the practice for increase yield.
Promote farming as business.
Promote the practice for improved yield.
Support district assemblies to promote the practice for maximum yield.
4 Composting Build farmers' capacities in the use of the practice.
Increase extension education and training.
Strengthen extension and advisory service systems.
Implement policies and enforce laws.
5 Crop rotation Develop and implement bye-laws on bushfires Cultivate approved crop varieties
Enact/gazette and enforce bye-laws on bushfires and deforestation
Make crop varieties available for all year round cultivation
Strengthen extension and advisory service systems.
Make improved crop varieties available and affordable.
Supply adequate funding6 Mixed cropping Use of improved crop
varietiesIncrease extension education and training
Link farmers to improved crop varieties
Research to improve the technology.
Strengthen extension and advisory service systems.
Make improved varieties available and affordable.
7 Chemical fertilizers Farmer education on proper use of chemical fertilizers.
Implement environmental safety policies.
Regulate prices and control smuggling.
Provide education for input dealers.
Implement policies and enforce laws.
Need for environmental safety policies and implementation.
Provide inputs subsidies.
K. O. Sam et al., (2020) Ghana Jnl. Agric. Sci. 55 (2), 122 – 144

141
8 Agroforestry Practice non-burning.
Develop and implement bye-laws on bushfires and deforestation.
Support community-based bushfire control.
Enact/gazette and enforce bye-laws on bushfires and deforestation.
Strengthen extension and advisory service systems.
Adequate input supply.
Support district assemblies to enact laws against environmental degradation.
Source: Compilation from Field Data
Conclusion and RecommendationThe study has demonstrated that the utilisation of CSA technologies and practices in the Lawra, Jirapa and Nandom districts of Ghana is cost-effective and beneficial. CSA use in these districts is largely smallholder-driven and both males and females have equal opportunity to use. Males dominated in most CSA technologies and practices partly due to financial implications, ownership of land and livestock and the intensive labour requirement. Females dominated in few due partly to their involvement in household food security matters and reluctance in taking risk leading to taking adequate wild and bush fires preventive measures. There are gains from using prioritised CSA technologies and practices. CSA investments are profitable and financially viable indicating that CSA users are better of than otherwise. Aside the financial gains, CSA use, in general, leads to livelihood improvement; however, the incidence of bush or wild fires, inadequate technical knowledge, inter alia tend to constrain CSA adoption in the study districts.
It is recommended that the District assemblies and the Departments of agriculture must join forces to promote CSA use within the districts. Adequate research is required to make tried and tested CSA technologies and practices available for promotion. CSA use by both males and females in the districts presents added opportunity to embark on rigorous promotional
campaigns for effective CSA adoption. This could begin with the local media and through the agricultural extension agents. Capacity building at all levels of CSA discourse is very crucial. Community-level people must develop, implement and enforce bye-laws on bushfires, deforestation and animal confinement. Both the district and national levels must strengthen extension and advisory service delivery systems through promotional education and training campaigns. The government must support adequate research into improved crop varieties and animal breeds, supply input subsidies, ensure effective policy implementation and law enforcement and provide adequate funding for CSA actions. Measures must therefore be put in place to ensure that these trickle down to the districts and the communities where CSA actions are implemented.
AcknowledgementWe are grateful to the CGIAR Research Programme on Climate Change Agriculture and Food Security (CCAFS) in the West Africa Region hosted by the International Crops Research Institute for the Semi-Arid Tropics (ICRISAT), Bamako, Mali for the financial and technical support. We also appreciate the numerous supportive services of Ghana CCAFS Platform. The District Level Platforms in the Lawra, Jirapa and Nandom Districts are duly acknowledged for assisting in the data collection.
Evaluating the utilisation of Climate-Smart Agriculture...
142
REFERENCESAdiku, S. G. K., MacCarthy, D. S., Haithie,
I., Diancoumba, M., Freduah, B. S., Amikuzuno, J., Traore, P. C. S., Traore, S., Koomson, E., Agali, A., Lizaso, J. I., Fatondji, D., Adams, M., Tigana, L., Diarra, D. Z., N’diaye, O. & Valdiva, R. O. (2015) Climate Change Impacts on West African Agriculture: An Integrated Regional Assessment. In (eds) Rosenzweig C. and Hillel D. Handbook of Climate Change and Agroecosystems: The Agricultural Model Intercomparison and Improvement Project (AgMIP) Integrated Crop and Economic Assessments – Joint Publication with the American Society of Agronomy, Crop Science Society of America, and Soil Science Society of America.. Imperial College Press, London, 25 − 73.
Andrieu, N., Sogoba, B., Zougmore, R., Howland, F., Samake, O., Bonilla-Findji O., Lizarazo, M., Nowak, A., Dembele, C. & Corner-Dolloff C. (2017) Prioritizing investments for climate-smart agriculture: Lessons learned from Mali. Agricultural Systems. Elsevier B.V. journal homepage: www.elsevier.com/locate/agsy
Anuga S. W., Gordon, C., Boon, E. & Surugu, J. M-I. (2019) Ghana Journal of Geography 11 (1), 124 – 139 DOI: https://dx.doi.org/10.4314/gjg.v11i1.8
Asante, F. A. & Amuakwa-Mensah F. (2015) Climate Change and Variability in Ghana: Stocktaking. Climate 3, 78 − 99; doi:10.3390/cli3010078.
Awosi, P. (2017) The Effects of Drought on the Livelihood of Rural Households in the Nandom District of the Upper West Region, Ghana. Thesis for Master of Philosophy Degree. University for Development Studies. Ghana.
Botchway, V. A., Karbo, N., Sam, K. O., Nutsukpo, D. K. & Zougmore, R. (2015) Profile of Climate Smart Agricultural Technologies
in the Guinea Savannah and Forest Agro-Ecological Zones in Ghana. Ghana Society of Animal Production. 19th Biennial Conference 5th-8th August, 2015. Cape Coats, Ghana
CIAT: BFS/USAID. (2016) Climate-Smart Agriculture in Senegal. CSA Country Profiles for Africa Series. International Center for Tropical Agriculture (CIAT); Bureau for Food Security, United States Agency for International Development (BFS/USAID), Washington, D.C. p. 20.
De Pinto, A., Demirag, U., Haruna, A., Koo, J. & Asamoah, M. (2012) Climate change, agriculture, and foodcrop production in Ghana (Policy Note 3). Retrieved from International Food Policy Research Institute website: http://www.ifpri.org/publication/climatechange agriculture-and-foodcrop-production-ghana.
Dyson, J. R. (1997) Accounting for Non-Accounting Students, 4th Edition. Department of Accountancy and Finance, Heriot-Watt University, Edinburgh. Financial Time. Prentice Hall. An Imprint of Pearson Education Ltd., Harlow, England, London.
Essegbey, G. O. & MacCarthy, D.S. (2020) Situational Analysis Study for the Agriculture Sector in Ghana. Technical Reports. CGIAR Research Programme on Climate Change, Agriculture and Food Security (CCAFS) West Africa, Bamako, Mali.
Food and Agriculture Organization (FAO) of United Nations (2013) Climate-Smart Agriculture Sourcebook. United Nations FAO.
Food and Agriculture Organization (FAO) of United Nations (2015) Sourcebook on Climate-Smart Agriculture, Forestry and Fisheries.http://www.fao.org/climate-smart-agriculture/72611/en/.Climate-Smart Agriculture, 2015.
Food and Agriculture Organization (FAO) of United Nations and Ministry of Food and Agriculture (MoFA) (2018) Investment
K. O. Sam et al., (2020) Ghana Jnl. Agric. Sci. 55 (2), 122 – 144

143
Framework for Mobilisation of Resources into Climate Smart Agriculture (CSA) in Ghana.
Freduah, B. S., MacCarthy, D. S., Adam, M., Ly, M., Ruane, A. C., Timpong-Jones, E. C., Traore, P. S., Boote, K. J., Porter, C. & Adiku, S. G. K. (2019) Sensitivity of Maize Yield in Smallholder Systems to Climate Scenarios in Semi-Arid Regions of West Africa: Accounting for Variability in Farm Management Practices. Agronomy 9 (10), p. 639.http://doi.org/10.3390/agronomy9100639
Ghana Climate Change, Agriculture and Food Security – GCCAFS (2014) GCCAFS Platform Review 1 (2), October – December 2014.
Ghana Statistical Service - GSS (2020) Rebased 2013 – 2019 Annual Gross Domestic Product, GSS, Accra, Ghana. www.statsghana.gov.gh
Ghawate, N. P. (2020) Micro Economics: Production Function, Types of Cost and Revenue Concept. PowerPoint Presentation. University of Pune, C. T. Bora College shirur Department of Economics.
Gittinger, J. P. (1982) Economic Analysis of Agricultural Projects, 2nd Edition. Published for the Economic Development Institute of the World Bank. The John Hopkins University Press, Baltimore and London.
Issahaku, Z. A. & Maharjan, K. L. (2014) Crop substitution behavior among food crop farmers in Ghana: an efficient adaptation to climate change or costly stagnation in traditional agricultural production system? Agricultural and Food Economics 2 (1), p. 16.
Jirapa District (2014) Population and Housing Census for 2010. District Analytical Report. Ghana Statistical Service, October 2014.
Jirapa Municipal Assembly (2018) District Medium Term Development Plan. 2018 – 2021.
Karbo, N., Botchway, V. A., Essegbey, G. O., Sam, K. O., Nutsukpo, D. K., Zougmoré, R. & Akuffobea, M. (2016) Climate-Smart Agriculture Practices and Technologies in Ghana. Ghana National Climate Change Science-Policy Dialogue Platform.
Koutsoyiannis, A. (1979) Modern Microeconomics. Second Edition, Printed in Hong Kong, Macmillan Publishers Limited, London, U. K.
LaRock, H. (2019) How to Calculate Total Cost in Economics. Updated May 14, 2019. https://www.theclassroom.com/how-to-calculate-total-cost-in-economics-13645626.html-Tuesday 7th July 2020, 17:10.
Lawra District (2014) Population and Housing Census for 2010. District Analytical Report. Ghana Statistical Service, October 2014.
Lawra Municipal Assembly (2018) District Medium Term Development Plan. 2018 – 2021.
Ministry of Environment, Science, Technology and Innovation – MESTI (2013) Ghana National Climate Change Policy. Republic of Ghana.
Ministry of Food and Agriculture – MOFA (2015) National Climate-Smart Agriculture Action Plan (2016-2020). Ministry of Food and Agriculture. Republic of Ghana. Website – www.mofa.gov.gh
Ministry of Food and Agriculture – MOFA (2017) Agricultural Sector Progress Report. Ministry of Food and Agriculture. Republic of Ghana.
Nandom District (2014) Population and Housing Census for 2010. District Analytical Report. Ghana Statistical Service, October 2014.
Nandom District Assembly (2018) District Medium Term Development Plan. 2018 – 2021.
Evaluating the utilisation of Climate-Smart Agriculture...

144
Nwokoye, E. S. & Ilechukwu, N. I. (2018) Principles of Economics 1 Chapter Five, Theory of Costs. August, 2018. https://www.researchgate.net/publication/326841533_CHAPTER_FIVE_THEORY_OF_COSTS . Tuesday 7th July 2020, 17:10.
Sam, K. O., Botchway, V. A. & Karbo N. (2015) Technologies and Practices for Climate-Smart Agriculture (CSA): A Participatory Profiling Manual. Ghana CCAFS Science-Policy Dialogue Platform, Accra.
Sijmons, K., Kiplimo, J., Forch, W., Thornton P. K., Moussa, A. S. & Zougmoré, R. (2013) CCAFS Site Atlas – Lawra-Jirapa/Lawra. CCAFS site atlas series. The CGIAR Research Program on Climate Change, Agriculture and Food Security (CCAFS). Copenhagen, Denmark. Available online at: www.ccafs.cgiar.org www.elsevier.com/locate/agsy
Thornton P. K., Boone R. B. & Ramirez-Villegas, J. (2015) Climate change impacts on livestock. CCAFS Working Paper no. 120. CGIAR Research Program on Climate Change, Agriculture and Food Security (CCAFS). Copenhagen, Denmark. Available online at: www.ccafs.cgiar.org
K. O. Same et al., (2020) Ghana Jnl. Agric. Sci. 55 (2), 122 – 144