evaluating the potential of worldview-3 data to classify
TRANSCRIPT

Article
Evaluating the Potential of WorldView-3 Data toClassify Different Shoot Damage Ratios ofPinus yunnanensis
Linfeng Yu 1, Zhongyi Zhan 1, Lili Ren 1, Shixiang Zong 1, Youqing Luo 1,* andHuaguo Huang 2,*
1 Beijing Key Laboratory for Forest Pest Control, College for Forestry, Beijing Forestry University, Beijing100083, China; [email protected] (L.Y.); [email protected] (Z.Z.); [email protected] (L.R.);[email protected] (S.Z.)
2 Key Laboratory for Silviculture and Conservation of Ministry of Education, Beijing Forestry University,Beijing 100083, China
* Correspondence: [email protected] (Y.L.); [email protected] (H.H.);Tel.: +86-10-62336840 (Y.L.); +86-10-62338133 (H.H.)
Received: 2 March 2020; Accepted: 7 April 2020; Published: 8 April 2020�����������������
Abstract: Tomicus yunnanensis Kirkendall and Faccoli and Tomicus minor Hartig have caused seriousshoot damage in Yunnan pine (Pinus yunnanensis Faranch) forests in the Yunnan province of China.However, very few remote sensing studies have been conducted to detect the different shoot damageratios of individual trees. The aim of the study was to evaluate the suitability of eight-bandWorldView-3 satellite image for detecting different shoot damage ratios (e.g., “healthy”, “slightly”,“moderately”, and “severely”). An object-based supervised classification method was used in thisstudy. The tree crowns were delineated on a 0.3 m pan-sharpened worldview-3 image as referencedata. Besides the original eight bands, normalized two-band indices were derived as spectral variables.For classifying individual trees, three classifiers—multinomial logistic regression (MLR), a stepwiselinear discriminant analysis (SDA), and random forest (RF)—were evaluated and compared in thisstudy. Results showed that SDA classifier based on all spectral variables had the highest classificationaccuracy (78.33%, Kappa = 0.712). Compared to original eight bands of Worldview-3, normalizedtwo-band indices could improve the overall accuracy. Furthermore, the shoot damage ratio was agood indicator for detecting different levels of individual damaged trees. We concluded that theWorldview-3 satellite data were suitable to classify different levels of damaged trees; therefore, the bestmapping results of damaged trees was predicted based on the best classification model which isvery useful for forest managers to take the appropriate measures to decrease shoot beetle damage inYunnan pine forests.
Keywords: Worldview-3; Tomicus yunnanensis; Tomicus minor; shoot damage ratio; classification;damaged levels
1. Introduction
Tomicus spp. are the main cause of tree mortality in the Yunnan pine forests in Southwest China.Over the past 20 years, 1.5 million hectares of Yunnan pine forests have been infested [1–4]. In the lastfew years, the damage rate of Yunnan pine in Dali Yunnan has rapidly increased.
In the Yunnan province, the life cycle of Tomicus yunnanensis Kirkendall and Faccoli and Tomicusminor Hartig can be roughly divided into two stages—the shoot damage stage and the trunk damagestage. In the shoot damage stage, shoot beetles attack the fresh shoots of Yunnan pines from May toNovember. The color of attacked shoot needles gradually changes from green to yellow and red. The
Forests 2020, 11, 417; doi:10.3390/f11040417 www.mdpi.com/journal/forests

Forests 2020, 11, 417 2 of 14
chlorophyll content and leaf moisture of damaged shoot needles change during the shoot damagestage. In the trunk damage stage, the shoot beetles begin to transfer from the shoots to the trunks forreproduction since December. New emerging adults attack the shoots from May of the next year [5–10].In view of the increasing beetle damage, it is urgent to develop an effective approach to monitorTomicus spp.
Traditional monitoring methods require foresters to investigate the infested trees in the forests,which are too expensive and unsuitable for monitoring large scale areas. Compared to traditionalmonitoring methods, remote sensing techniques are considered as useful approaches for detectinginfested pines. Several studies have used multiple remote sensing data to detect insect disturbance,most of them focused on the detection of mountain pine beetles (Dendroctonus ponderosae, Hopkins),especially at the “red-attack” stage and “grey-attack” stage [11–18].
Aerial photography is being used operationally for red attack surveys in British Columbia’sstrategic beetle management plan (British Columbia Ministry of Forests, 2003b) and the United StatesForest Service (USDA 2012a), which was always used as reference data for lower spatial resolutionimages at large areas [19–22]. In addition, aerial photography with high spatial resolution has theability to detect damage at the single tree level [23,24]. With the improvement of remote sensing imageresolution, the detection of beetle damage has been successfully identified by using multiple satelliteimageries. Coops et al. [25] used Quickbird multi-imagery to detect red attack damage caused bymountain pine beetle in British Columbia and found that red to green reflectance (RGI) was the mostsuccessful spectral index to separate nonattack crowns from red attack crowns. White et al. [26] usedan IKONOS imagery to detect red attack damage at low and medium levels; the results indicated thatthe detection of red attack was most effective for larger tree crowns (diameter > 1.5 m) which werelocated less than 11 m from other red attack trees. Despite Quickbird and IKONOS images which thespatial resolution was less than 5 × 5 m per pixel had an increased ability to detect red-attack stage, itwas difficult to detect individual tree damage with limited spatial resolution. In recent years, satelliteimagery with higher spatial resolution, such as Worldview-2 imagery (0.5 m for the panchromaticband and 2 m for the multispectral bands) has been confirmed to have the potential for detecting anindividual damaged tree. Furthermore, Worldview-2 imagery also has a red edge band, which wasuseful for early detection of beetle damage [27–35]. Immitzer et al. [36] used WorldView-2 satelliteimages to detect bark beetle infestations and found an overall accuracy of about 70% to separategreen-attack trees from “healthy” trees. Mullen [37] used WorldView-2 satellite imagery to detectthe early stage of mountain pine beetles (MPB) damage with an overall accuracy of about 75% indistinguishing green-attack trees from nonattack trees.
Although most studies have detected tree mortality and green attack trees caused by trunkdamage, these were not sufficient to define the shoot damage stage. To our knowledge, there havebeen no previous studies using high-resolution optical satellite data to detect shoot damage ratio (SDR)at the individual tree level. To address this gap, the aim of this study was to evaluate the suitability ofWorldView-3 (WV-3) imagery for detecting four different levels of damaged trees in a P. yunnanensisforest: healthy tree (0% ≤ SDR < 5%), slightly infested tree (5% ≤ SDR < 20%), moderately infested tree(20 ≤ SDR ≤ 50%), and severely infested tree (50% < SDR<80%). Therefore, we explored the following:(1) the use of the eight bands of WV-3 image; (2) the use of the normalized two-band indices fromthe WV-3 image; (3) the classification accuracy and kappa of three classifiers (multinomial logisticregression, stepwise linear discriminant analysis, and random forest). (4) the output of different shootdamage maps.
2. Materials and Methods
2.1. Study Area
The Yunnan pine forest in Pupeng town (25◦18′N, 100◦18′E) of Dali City in the Yunnan Provincewas selected as the study area, covering 5248 ha (Figure 1). The selection of study area was based on

Forests 2020, 11, 417 3 of 14
previous study mapping different SDRs in the area [38]. T. yunnanensis and T. minor have caused severedamage to Yunnan pine since 2013 in this area. The elevation ranges from 1720 m (Yunlichang Valley)to 2745 m (Yingge Mountains). The mean average precipitation is 783.7 mm per year, and the averageannual temperature is 14.7 ◦C. The average monthly maximum and minimum temperatures are 27 and7.6 ◦C, respectively.
Forests 2019, 10, x FOR PEER REVIEW 3 of 14
Figure 1. (a) Yunnan province in China, (b) study area location in Xiangyun County, (c) the reference
data area located in the WV-3 imagery.
2.2. Remote Sensing Data
High-spatial-resolution digital imagery was acquired on 6 April 2017 from a WV-3 satellite. The
WV-3 satellite provides very high spatial resolution data with eight spectral bands. The details about
the sensors are shown in Table 1.
Table 1. Technical specifications of the WV-3 imagery.
Data acquisition Study area: 6 April 2017 04:18:10
Spectral Resolution (nm)
Panchromatic: 450–800
Coastal: 400–450
Blue: 450–510
Green: 510–580
Yellow: 585–625
Red: 630–690
Red Edge: 705–745
NIR1: 770–895
NIR2: 860–1040
Spatial Resolution 0.3 m panchromatic band and 1.2 m multispectral bands
Radiometric Resolution 16 bits per pixel
The calibration and atmospheric correction models (FLAASH in ENVI 5.3) were applied to the
multispectral images to convert digital number (DN) values into values for sensor radiance and
reflectance. The FLAASH settings: Atmospheric Model: Mid-Latitude Summer, Aerosol Model:
Rural, Initial Visibility: 60 km. The multispectral image was pan-sharpened by a panchromatic band
using Gram-Schmidt Pan Sharpening. Finally, the 0.3 m pan-sharpened multispectral image was
orthorectified using a 5 m digital terrain model (DTM). Studies have proven that pan-sharpened
images are highly correlated with the original multispectral image [39]. In addition, fusing the coarse
spatial resolution data with the higher spatial resolution data to enhance the spatial resolution of the
eight multispectral bands was beneficial for selecting the tree crown. In our study, the pan-sharpened
WV-3 image was used for analysis and classification.
Figure 1. (a) Yunnan province in China, (b) study area location in Xiangyun County, (c) the referencedata area located in the WV-3 imagery.
2.2. Remote Sensing Data
High-spatial-resolution digital imagery was acquired on 6 April 2017 from a WV-3 satellite. TheWV-3 satellite provides very high spatial resolution data with eight spectral bands. The details aboutthe sensors are shown in Table 1.
Table 1. Technical specifications of the WV-3 imagery.
Data Acquisition Study Area: 6 April 2017 04:18:10
Spectral Resolution (nm)
Panchromatic: 450–800Coastal: 400–450
Blue: 450–510Green: 510–580Yellow: 585–625
Red: 630–690Red Edge: 705–745
NIR1: 770–895NIR2: 860–1040
Spatial Resolution 0.3 m panchromatic band and 1.2 m multispectral bandsRadiometric Resolution 16 bits per pixel
The calibration and atmospheric correction models (FLAASH in ENVI 5.3) were applied to themultispectral images to convert digital number (DN) values into values for sensor radiance andreflectance. The FLAASH settings: Atmospheric Model: Mid-Latitude Summer, Aerosol Model:Rural, Initial Visibility: 60 km. The multispectral image was pan-sharpened by a panchromatic bandusing Gram-Schmidt Pan Sharpening. Finally, the 0.3 m pan-sharpened multispectral image wasorthorectified using a 5 m digital terrain model (DTM). Studies have proven that pan-sharpened imagesare highly correlated with the original multispectral image [39]. In addition, fusing the coarse spatialresolution data with the higher spatial resolution data to enhance the spatial resolution of the eight

Forests 2020, 11, 417 4 of 14
multispectral bands was beneficial for selecting the tree crown. In our study, the pan-sharpened WV-3image was used for analysis and classification.
2.3. Reference Data
Based on the classification standard (Standard of Forest Pests Occurrence and Disaster LY/T1681–2006) and ground survey, we divided the damage Yunnan pines into four damage levels (Figure 2,Table 2).
SDR = ni/Ni× 100% (1)
where SDR is the single tree damage ratio, ni is the number of damaged shoots, and Ni is the numberof total shoots.
Forests 2019, 10, x FOR PEER REVIEW 4 of 14
2.3. Reference Data
Based on the classification standard (Standard of Forest Pests Occurrence and Disaster LY/T
1681–2006) and ground survey, we divided the damage Yunnan pines into four damage levels (Figure
2, Table 2).
𝑆𝐷𝑅 = 𝑛𝑖 𝑁𝑖⁄ × 100% (1)
where SDR is the single tree damage ratio, ni is the number of damaged shoots, and Ni is the number
of total shoots.
Figure 2. Example of different levels of damage trees. (a) Healthy tree. (b) Slightly infested tree. (c)
Moderately infested tree. (d) Severely infested tree. (e) Damaged shoots.
Table 2. Levels 1–4 of damaged Yunnan pines based on the tree shoot damage ratio (SDR).
Damage Level Characteristics SDRs (%)
1 healthy <5
2 slightly infested 5 to 20
3 moderately infested 20 to 50
4 severely infested 50 to 80
Field investigations were conducted from March to April 2017. WV-3 0.3 m pan-sharpened
multispectral image (false color composite image) was brought to the field to locate tree crowns. The
SDRs of sample trees were calculated based on Equation (1). Within the study, several damage shoots
were selected to look for the beetles inside or invasion holes which confirmed that shoot damage was
caused by bark beetles (T. yunnanensis and T. minor). In this study, the tree crowns of 193 healthy
trees, 183 slightly infested trees, 175 moderately infested trees, and 186 severely infested trees were
delineated on the WV-3 0.3 m pan-sharpened multispectral image and converted to a polygon vector
file (Figure 3).
Figure 3. Example of delineated tree damage (levels 1–4) using WV-3 pan-sharpened multispectral
image (R: NIR 1; G: Red; B: Green). (a) Healthy tree. (b) Slightly infested tree. (c) Moderately infested
tree. (d) Severely infested tree.
(a) (b) (c) (d)
Figure 2. Example of different levels of damage trees. (a) Healthy tree. (b) Slightly infested tree.(c) Moderately infested tree. (d) Severely infested tree. (e) Damaged shoots.
Table 2. Levels 1–4 of damaged Yunnan pines based on the tree shoot damage ratio (SDR).
Damage Level Characteristics SDRs (%)
1 healthy <52 slightly infested 5 to 203 moderately infested 20 to 504 severely infested 50 to 80
Field investigations were conducted from March to April 2017. WV-3 0.3 m pan-sharpenedmultispectral image (false color composite image) was brought to the field to locate tree crowns. TheSDRs of sample trees were calculated based on Equation (1). Within the study, several damage shootswere selected to look for the beetles inside or invasion holes which confirmed that shoot damage wascaused by bark beetles (T. yunnanensis and T. minor). In this study, the tree crowns of 193 healthytrees, 183 slightly infested trees, 175 moderately infested trees, and 186 severely infested trees weredelineated on the WV-3 0.3 m pan-sharpened multispectral image and converted to a polygon vectorfile (Figure 3).
Forests 2019, 10, x FOR PEER REVIEW 4 of 14
2.3. Reference Data
Based on the classification standard (Standard of Forest Pests Occurrence and Disaster LY/T
1681–2006) and ground survey, we divided the damage Yunnan pines into four damage levels (Figure
2, Table 2).
𝑆𝐷𝑅 = 𝑛𝑖 𝑁𝑖⁄ × 100% (1)
where SDR is the single tree damage ratio, ni is the number of damaged shoots, and Ni is the number
of total shoots.
Figure 2. Example of different levels of damage trees. (a) Healthy tree. (b) Slightly infested tree. (c)
Moderately infested tree. (d) Severely infested tree. (e) Damaged shoots.
Table 2. Levels 1–4 of damaged Yunnan pines based on the tree shoot damage ratio (SDR).
Damage Level Characteristics SDRs (%)
1 healthy <5
2 slightly infested 5 to 20
3 moderately infested 20 to 50
4 severely infested 50 to 80
Field investigations were conducted from March to April 2017. WV-3 0.3 m pan-sharpened
multispectral image (false color composite image) was brought to the field to locate tree crowns. The
SDRs of sample trees were calculated based on Equation (1). Within the study, several damage shoots
were selected to look for the beetles inside or invasion holes which confirmed that shoot damage was
caused by bark beetles (T. yunnanensis and T. minor). In this study, the tree crowns of 193 healthy
trees, 183 slightly infested trees, 175 moderately infested trees, and 186 severely infested trees were
delineated on the WV-3 0.3 m pan-sharpened multispectral image and converted to a polygon vector
file (Figure 3).
Figure 3. Example of delineated tree damage (levels 1–4) using WV-3 pan-sharpened multispectral
image (R: NIR 1; G: Red; B: Green). (a) Healthy tree. (b) Slightly infested tree. (c) Moderately infested
tree. (d) Severely infested tree.
(a) (b) (c) (d)
Figure 3. Example of delineated tree damage (levels 1–4) using WV-3 pan-sharpened multispectralimage (R: NIR 1; G: Red; B: Green). (a) Healthy tree. (b) Slightly infested tree. (c) Moderately infestedtree. (d) Severely infested tree.

Forests 2020, 11, 417 5 of 14
2.4. Tree Crown Extraction
We used the pan-sharpened WV-3 images to compare their accuracies in detecting different levelsof shoot damage trees based on the object method (Figure 4). The pan-sharpened WV-3 image wassubdivided into image objects through multiresolution segmentation using the eCognition Developer9.0 software [40,41]. The best segmentation parameters were evaluated on the tree crown polygons ofthe reference data. In order to keep the tree crowns consistent with the segment polygon, several levelsof detail of segmentation were iteratively used to adapt the shape and compactness parameters. Thefinal scale parameter was 30, homogeneity criterions of 0.7 and 0.7 for shape and compactness.
Forests 2019, 10, x FOR PEER REVIEW 5 of 14
2.4. Tree Crown Extraction
We used the pan-sharpened WV-3 images to compare their accuracies in detecting different
levels of shoot damage trees based on the object method (Figure 4). The pan-sharpened WV-3 image
was subdivided into image objects through multiresolution segmentation using the eCognition
Developer 9.0 software [40,41]. The best segmentation parameters were evaluated on the tree crown
Figure 4. Flowchart of shoot damage classification approach.
Shadowed image polygons were removed to ensure that only sunlit tree crowns were used in
the classification approaches. The sunlit areas were separated using intensity values I(RGB) from a
hue, saturation and intensity (HIS) transformation of the RGB bands (5-3-2), where values smaller
than 0.0055 were assigned to shadows. The threshold was determined based on visual inspection to
separate shadowed and sunlit areas. Next, vegetation was extracted from the nonshadow area with
a NDVI threshold. The threshold was determined with a stepwise approximation method. Objects
with NDVI value greater than 0.55 were masked out as vegetation. The polygon vector file of tree
crowns was transformed to the WV-3 segmentation image.
2.5. Spectral Variables
Reflectance values were extracted for all eight WV-3 spectral bands based on tree crown segment
objects. The mean values for each crown object were calculated and used for further analysis. The
eight bands of the pan-sharpened WV-3 image were used as the basic spectral variables. In addition,
normalized two-band indices were also used as spectral variables. Normalized two-band indices
were calculated using all possible permutations with the following equation:
Figure 4. Flowchart of shoot damage classification approach.
Shadowed image polygons were removed to ensure that only sunlit tree crowns were used inthe classification approaches. The sunlit areas were separated using intensity values I(RGB) from ahue, saturation and intensity (HIS) transformation of the RGB bands (5-3-2), where values smallerthan 0.0055 were assigned to shadows. The threshold was determined based on visual inspection toseparate shadowed and sunlit areas. Next, vegetation was extracted from the nonshadow area with aNDVI threshold. The threshold was determined with a stepwise approximation method. Objects withNDVI value greater than 0.55 were masked out as vegetation. The polygon vector file of tree crownswas transformed to the WV-3 segmentation image.
2.5. Spectral Variables
Reflectance values were extracted for all eight WV-3 spectral bands based on tree crown segmentobjects. The mean values for each crown object were calculated and used for further analysis. Theeight bands of the pan-sharpened WV-3 image were used as the basic spectral variables. In addition,normalized two-band indices were also used as spectral variables. Normalized two-band indices werecalculated using all possible permutations with the following equation:

Forests 2020, 11, 417 6 of 14
(Ry − Rx)/(Ry + Rx) (2)
where Ry is the reflectance of band y and Rx is the reflectance of band x. In our study, the eight spectralbands plus normalized two-band indices gave a total of 36 spectral variables.
2.6. Variable Selection and Data Mining
In this study, three statistical approaches were used to compare the spectral responses of the level1–4 tree crowns. In the first approach, multinomial logistic regression (MLR) was chosen to selectvariables because the MLR model can be built with several spectral variables, but can also be builtwith a single variable. MLR is an extension of binomial logistic regression, which has been successfullyapplied in many studies [42–47]. MLR allows more than two categories of the response variable, suchas the four damage levels in our study. In this study, a stepwise MLR method was used to minimizethe models based on Akaike’s information criterion (AIC).
In order to reduce variable space dimensions and intercorrelation among the variables, a stepwiselinear discriminant analysis (SDA) was used. In the SDA model, variables were input step by step toselect or remove variables based on minimizing the Wilks’ Lambda according to the importance of thevariables. The optimal discriminant variables are selected until there are no unimportant variables inthe discriminant that need to be removed. The SDA model has been successfully applied in manystudies [37,48–51].
Lastly, the random forest classifier was frequently used for tree classification using remote sensingdata [52–56]. Random forest (RF) can deal with both discrete data and continuous data, using integratedbootstrapping to estimate the classification accuracy. It provided a rank of variable importance basedon the mean decrease in accuracy (MDA). A higher MDA indicated greater importance of a spectralvariable in the RF classification
2.7. Classification and Validation
In this study, each different level of damage trees was randomly split into 50% training and50% evaluation data sets. This random split of training/evaluation data was repeated ten times toclassify and evaluate the different levels of damage trees. The accuracies in classifying different levelsof damage trees were evaluated based on the models’ confusion matrices included user’s accuracy,producer’s accuracy, overall accuracy, and Cohen’s kappa coefficient. The values in the final confusionmatrix for each model are the means of ten confusion metrics. In this study, MLR was completedusing R 3.5.1 (RStudio, Inc., Boston, Massachusetts, USA) with R package “nnet” and RF using R 3.5.1with R package “Randomforest”, while stepwise linear discriminant analysis and one-way analysis ofvariance (ANOVA) were done in SPSS® v. 24 (SPSS Inc., Chicago, IL, USA).
3. Results
3.1. Spectral Signatures
The spectral signatures of the Levels 1–4 of damaged Yunnan pines based on the WV-3 image areshown in Figure 5. In the visible bands, with an increase in the SDRs, the spectral values showed evidentchanges, such as an increase in the red band reflectance and a drop in green band reflectance. Thelargest distinctions between the four damage levels appeared in the red Edge, NIR1, and NIR2 bands.The class “healthy” and “slightly” showed higher reflectance values than the classes “moderately”and “severely” in the three bands. The differences of NIR1 and NIR2 bands between the classes“healthy” and “slightly” were smaller, the same as the differences between the classes “moderately”and “severely”. However, the standard deviations of red Edge, NIR1, and NIR2 were larger than thoseof the visible bands.
Forests 2020, 11, 417 7 of 14Forests 2019, 10, x FOR PEER REVIEW 7 of 14
Figure 5. Reflectance values of the four damage levels “healthy”, “slightly”, “moderately”, and
“severely” based on the WV-3 image.
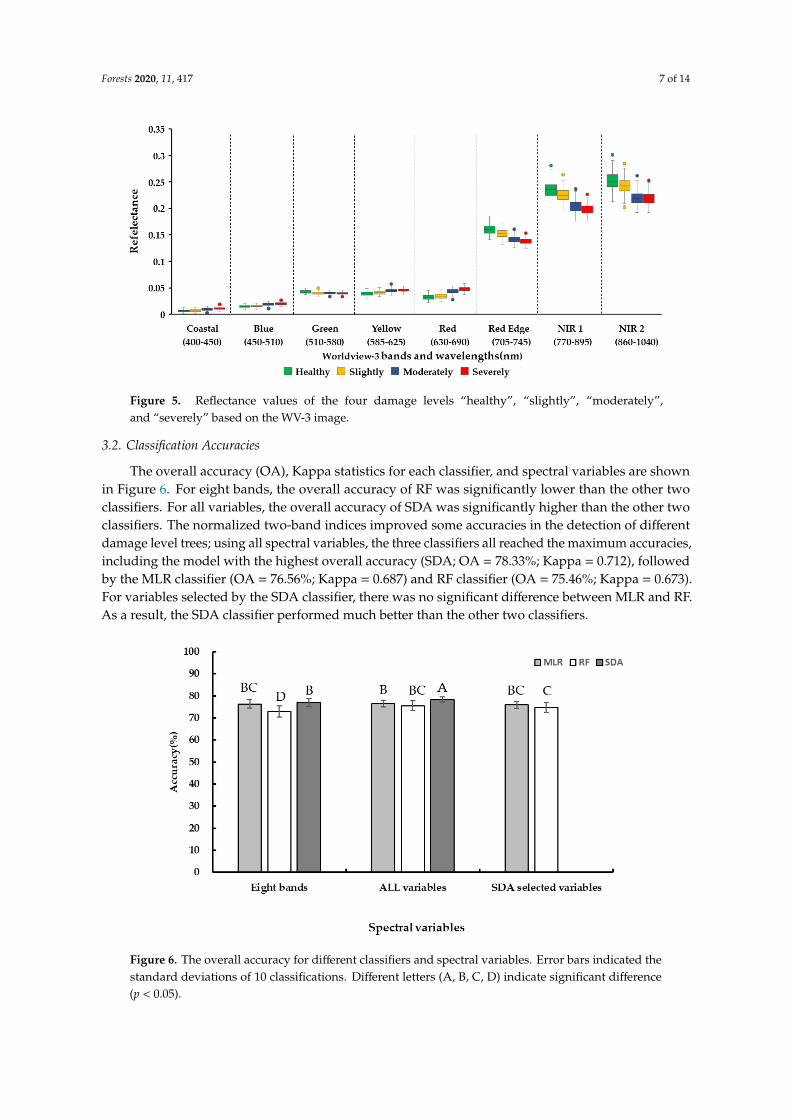
3.2. Classification Accuracies
The overall accuracy (OA), Kappa statistics for each classifier, and spectral variables are shown
in Figure 6. For eight bands, the overall accuracy of RF was significantly lower than the other two
classifiers. For all variables, the overall accuracy of SDA was significantly higher than the other two
classifiers. The normalized two-band indices improved some accuracies in the detection of different
damage level trees; using all spectral variables, the three classifiers all reached the maximum
accuracies, including the model with the highest overall accuracy (SDA; OA = 78.33%; Kappa = 0.712),
followed by the MLR classifier (OA = 76.56%; Kappa = 0.687) and RF classifier (OA = 75.46%; Kappa
= 0.673). For variables selected by the SDA classifier, there was no significant difference between MLR
and RF. As a result, the SDA classifier performed much better than the other two classifiers.
Figure 6. The overall accuracy for different classifiers and spectral variables. Error bars indicated the
standard deviations of 10 classifications. Different letters (A, B, C, D) indicate significant difference (p
< 0.05).
Figure 5. Reflectance values of the four damage levels “healthy”, “slightly”, “moderately”,and “severely” based on the WV-3 image.
3.2. Classification Accuracies
The overall accuracy (OA), Kappa statistics for each classifier, and spectral variables are shownin Figure 6. For eight bands, the overall accuracy of RF was significantly lower than the other twoclassifiers. For all variables, the overall accuracy of SDA was significantly higher than the other twoclassifiers. The normalized two-band indices improved some accuracies in the detection of differentdamage level trees; using all spectral variables, the three classifiers all reached the maximum accuracies,including the model with the highest overall accuracy (SDA; OA = 78.33%; Kappa = 0.712), followedby the MLR classifier (OA = 76.56%; Kappa = 0.687) and RF classifier (OA = 75.46%; Kappa = 0.673).For variables selected by the SDA classifier, there was no significant difference between MLR and RF.As a result, the SDA classifier performed much better than the other two classifiers.
Forests 2019, 10, x FOR PEER REVIEW 7 of 14
Figure 5. Reflectance values of the four damage levels “healthy”, “slightly”, “moderately”, and
“severely” based on the WV-3 image.
3.2. Classification Accuracies
The overall accuracy (OA), Kappa statistics for each classifier, and spectral variables are shown
in Figure 6. For eight bands, the overall accuracy of RF was significantly lower than the other two
classifiers. For all variables, the overall accuracy of SDA was significantly higher than the other two
classifiers. The normalized two-band indices improved some accuracies in the detection of different
damage level trees; using all spectral variables, the three classifiers all reached the maximum
accuracies, including the model with the highest overall accuracy (SDA; OA = 78.33%; Kappa = 0.712),
followed by the MLR classifier (OA = 76.56%; Kappa = 0.687) and RF classifier (OA = 75.46%; Kappa
= 0.673). For variables selected by the SDA classifier, there was no significant difference between MLR
and RF. As a result, the SDA classifier performed much better than the other two classifiers.
Figure 6. The overall accuracy for different classifiers and spectral variables. Error bars indicated the
standard deviations of 10 classifications. Different letters (A, B, C, D) indicate significant difference (p
< 0.05).
Figure 6. The overall accuracy for different classifiers and spectral variables. Error bars indicated thestandard deviations of 10 classifications. Different letters (A, B, C, D) indicate significant difference(p < 0.05).

Forests 2020, 11, 417 8 of 14
The confusion matrix in Table 3 summarizes the best results for classifying damage levels 1–4 oftrees using the SDA models based on all spectral variables. The best agreements were obtained fordamage level 4 (87.5%), followed by level 1 (79.5%) and level 3 (75.4%). Level 2 (71.0%) had the loweragreement as it was mostly confused with the adjacent damage levels. The greatest confusion existedbetween healthy trees and slightly damage trees. The omission error of misclassification betweenhealthy and slightly damage trees was almost 20%. Therefore, the omission error that misclassifiedslightly damage trees to moderately damage trees was almost 10%.
Table 3. Confusion matrix for level 1–4 classification with the overall accuracy, kappa, producer’s anduser’s accuracy based on the stepwise linear discriminant analysis (SDA) classifier with all spectralvariables. All values presented are means of a cross-validation of ten classifications.
Reference Data Classified as
Shoot Damage Level 1 (<5%) 2 (<20%) 3 (<50%) 4 (<80%) Σ Prod.’s AC (%)
1 (<5%) 77.1 (79.5) 19.1 (19.7) 0.8 (0.8) 0.0 (0.0) 97 79.52 (<20%) 17.9 (19.5) 65.3 (71.0) 8.4 (9.1) 0.4 (0.4) 92 71.03 (<50%) 0.4 (0.5) 8.5 (9.8) 65.6 (75.4) 12.4 (14.3) 87 75.44 (<80%) 0.0 (0) 0.3 (0.3) 11.4 (12.2) 81.3 (87.5) 93 87.5
Σ 95.5 93.2 86.2 94.2User’s AC (%) 80.7 70.1 76.1 86.4
OA (%) 78.3Kappa 0.712
3.3. Predictive Mapping
The best mapping results of shoot damage trees is shown in Figure 7. The SDA classifier using allspectral variables was used for the SDR mapping. In this study, we selected a moderately infestedforest for SDR mapping. Figure 7a shows the 0.3 m WV-3 pan-sharpened false color image. Figure 7bshows the result of different SDR mapping using the SDA classifier.
Forests 2019, 10, x FOR PEER REVIEW 8 of 14
The confusion matrix in Table 3 summarizes the best results for classifying damage levels 1–4 of
trees using the SDA models based on all spectral variables. The best agreements were obtained for
damage level 4 (87.5%), followed by level 1 (79.5%) and level 3 (75.4%). Level 2 (71.0%) had the lower
agreement as it was mostly confused with the adjacent damage levels. The greatest confusion existed
between healthy trees and slightly damage trees. The omission error of misclassification between
healthy and slightly damage trees was almost 20%. Therefore, the omission error that misclassified
slightly damage trees to moderately damage trees was almost 10%.
Table 3. Confusion matrix for level 1–4 classification with the overall accuracy, kappa, producer’s
and user’s accuracy based on the stepwise linear discriminant analysis (SDA) classifier with all
spectral variables. All values presented are means of a cross-validation of ten classifications.
Reference Data Classified as
Shoot Damage Level 1 (<5%) 2 (<20%) 3 (<50%) 4 (<80%) Σ Prod.’s AC (%)
1 (<5%) 77.1 (79.5) 19.1 (19.7) 0.8 (0.8) 0.0 (0.0) 97 79.5
2 (<20%) 17.9 (19.5) 65.3 (71.0) 8.4 (9.1) 0.4 (0.4) 92 71.0
3 (<50%) 0.4 (0.5) 8.5 (9.8) 65.6 (75.4) 12.4 (14.3) 87 75.4
4 (<80%) 0.0 (0) 0.3 (0.3) 11.4 (12.2) 81.3 (87.5) 93 87.5
Σ 95.5 93.2 86.2 94.2
User’s AC (%) 80.7 70.1 76.1 86.4
OA (%) 78.3
Kappa 0.712
3.3. Predictive Mapping
The best mapping results of shoot damage trees is shown in Figure 7. The SDA classifier using
all spectral variables was used for the SDR mapping. In this study, we selected a moderately infested
forest for SDR mapping. Figure 7a shows the 0.3 m WV-3 pan-sharpened false color image. Figure 7b
shows the result of different SDR mapping using the SDA classifier.
(a) (b)
Figure 7. Detailed example of the SDR mapping of Yunnan pine forest. (a) 0.3 m WV-3 pan-sharpened
false color image (R: NIR1; G: Red; B: Green); (b) Shoot damage trees mapping based on SDA
classifier.
4. Discussion
4.1. Reference Data
Previous studies have mostly focused on MPB, which attacks only the trunks of pine. After the
MPB attack, changes in foliage are classified into three stages [57–62]. The first stage is the green
attack (GA); in this stage, the moisture content of the foliage decreases but there is no visible color
damage to the tree crown. The second stage is the green–yellow–red attack; with the change of green
Figure 7. Detailed example of the SDR mapping of Yunnan pine forest. (a) 0.3 m WV-3 pan-sharpenedfalse color image (R: NIR1; G: Red; B: Green); (b) Shoot damage trees mapping based on SDA classifier.
4. Discussion
4.1. Reference Data
Previous studies have mostly focused on MPB, which attacks only the trunks of pine. After theMPB attack, changes in foliage are classified into three stages [57–62]. The first stage is the green attack(GA); in this stage, the moisture content of the foliage decreases but there is no visible color damage tothe tree crown. The second stage is the green–yellow–red attack; with the change of green chlorophyllpigments, yellow carotenes, and red anthocyanin pigment, the canopy color changes from green toyellow and red. The third stage is the gray attack; in this stage, the needles fall from the canopy until

Forests 2020, 11, 417 9 of 14
the damaged trees are completely defoliated. In initial studies, researchers focused on the red attack,while in recent years, the early detection of bark beetle damage (GA) has become a focus for research.Compared to MPB, Tomicus spp. have the shoot damage stage. In this stage, the needles of attackedshoots gradually change from green to yellow and red. In the canopy level, the ratios of damagedshoots increase during the shoot damage stages. Unlike MPB, Yunnan pine damaged by Tomicus spp.does not have a green attack stage, the initial damage stage is shoot damage, and the visible change ofthe tree crown is the color change of the damaged shoots. In our study, the damage stages of Tomicusspp. were classified into four stages based on SDR (healthy, slightly infested, moderately infested,and severely infested). As a result, based on the life cycle of Tomicus spp. and the color changes of thecanopy, we chose SDR as an indicator to reflect the different levels of individual tree damage.
In this study, an object-based supervised classification method was used to detect different levelsof damage trees. The tree crowns were automatically segmented by software. However, the treecrowns manually delineated from the WV-3 0.3 m pan-sharpened multispectral image were not alwaysconsistent with the segment objects. The tree crown segment objects were often larger than the manuallydelineated crown polygons. Despite the high spatial resolution of WV-3 imagery, the crown borer ofsegment objects inevitably mixed with other pixels, including bare soil, falling leaves, and other treecrowns, which would affect the classification accuracy of different levels of damaged trees. In futureexperiments, more advanced techniques for extracting tree crowns should be used to improve theclassification accuracy.
4.2. Classification Accuracies and Variable Importance
In our study, the different levels of damaged trees were assigned to the classes “healthy”,“slightly infested”, “moderately infested”, and “severely infested” by three classification models, withoverall accuracy ranging from 75%–80%. The best model was obtained with SDA using all spectralvariables—an overall accuracy of 78.33% was achieved. The overall accuracy was not very high inrelation to damage level 2—which was often misclassified as adjacent damage levels—which was asimilar result to that reported in the research of Lars W et al. [63]. Numerous studies have indicated thatvegetation indices can be better indicators of tree stress compared to single-band reflectance becausethey combine information from multiple bands [36,37]. In our study, with the increasing damage levels,the reflectance of the green band was decreased. However, the red band reflectance was increased,so the combination of two bands with different change directions, for example, the green–red index,emphasized the differences between damage levels. Furthermore, a set of completely uncorrelatedvariables selected by SDA was input to the MLR and RF classifiers, and the results indicated that theaccuracies using all variables or variables selected by SDA were not significantly different betweenMLR and RF. In the future, other approaches that could reduce variable spatial dimensions andintercorrelation could be used to find the important variables for detecting different SDRs. As a result,the classifiers using all spectral variables had a higher overall accuracy than those using WV-3 bandsin this study.
Then, we classified the damaged trees into four damage levels. However, previous studies mostlyfocused on the differences between healthy trees and red attack trees or gray attack trees. Marx andAlexander [64] used multitemporal Rapid Eye imagery to separate the reddish-colored deterioratingor dead tree groups with a high overall accuracy of 97%. Garrity et al. [65] used QuickBird andWorldView-2 images to classify live and dead classes and found overall accuracies above 95%. Meddenset al., [20] using 2.4 m aggregated aerial imagery to classify three different levels of tree mortality(green, red, and gray trees), herbaceous, and bare soil, found the highest accuracy was 90%. As a result,if the damaged trees were not separated into different levels, overall accuracies were usually higher.
In recent years, the emphasis of several studies has been on the early detection of bark beetles,which focused on the difference between green attack trees and healthy trees. Because of the smallspectral differences between the two damage levels, the overall accuracies are always not high. Forexample, Immtizer and Atzberger [36] and Mullen K.E. [37] used WV-2 images to detect the green

Forests 2020, 11, 417 10 of 14
attack stage of bark beetles, classifying GA damage from healthy trees with overall accuracies around75%. In our study, the accuracy was not higher than the above research when classifying the slightlyinfested class from the healthy class. The reasons might be that the changes of chlorophyll and moistureof the whole canopy were small when the number of damaged shoots was fewer. The correspondingchanges in the spectrum were also not obvious. In future research, subdivision of the shoot damageratios should be considered to determine the threshold, especially for the slightly infested trees that arerelatively simple to separate from the healthy trees.
In general, although we could not truly detect slightly infested trees, our methods indicated theusefulness of WV-3 imagery for detecting severely infested trees, which are more useful for evaluatingthe SDRs of Yunnan pine forests.
4.3. The Performance of Worldview-3 Imagery
The WV-3 satellite data were suitable for classifying different levels of damaged trees, having ahigh accuracy and Kappa in our study. WV-3 is a commercial satellite providing data with a very highspatial resolution (0.3 m for the panchromatic band and 1.2 m for the multispectral bands (eight bands)).The high spatial resolution and spectral resolution contain more information to map individual trees.Furthermore, the red edge band might play an important role in dividing different levels of damagedtrees. Another issue was the selection of satellite image dates. In our study, we used the WV-3 imagefrom 6 April—at this time, the needles of the damaged shoots had all turned red after the shoot damageof the previous year. This largely influences the spectral reflectance, facilitating detection by RS data.In other words, regarding the visual effects, it is relatively easy to distinguish the different levelsof damaged trees. Lin et al. [66] used UAV-based hyperspectral imagery and Lidar to detect shootdamage in pine forests. They investigated the SDRs in September, during the shoot damage stage. Inthis time period, some damaged shoots had already been invaded, but the color had not turned red,which reduces the differences between damage levels. The tree crown SDR, which was greater than30%, was underestimated in the hyperspectral approach. Although several beetles still damaged theshoots from December to April of the next year, the majority of the shoots were damaged from Mayto November—the SDRs reached an approximate maximum in November to December. To addressthis issue, in future work, data from prior to the detection time should be included so that the forestdepartment can take measurements earlier.
5. Conclusions
In our study, we evaluated the potential of WV-3 satellite data to classify different levels ofdamaged trees based on WV-3 original bands and normalized two-band indices. We concluded fourmajor points:
(1) Normalized two-band indices can improve some accuracies in the detection of different levelsof damaged trees.
(2) The SDA classifier performed well in classifying different levels of damaged trees. The bestmodel was the SDA classifier based on all spectral variables.
(3) The WV-3 satellite data were suitable for classifying different levels of damaged trees.(4) SDR was a good indicator for detecting different levels of individual damaged trees.These results, especially the output of SDR mapping, are important for understanding the spatial
distribution of damaged trees. In further study, forest structure, topography, landscape context, regionvariables (precipitation, temperature, etc.), and other variables should be combined to explore thespatial and temporal characterization of the spread pattern of Tomicus. spp., which is useful for forestmanagers who can implement forestry operations that can effectively reduce the probability of beetleoutbreak and reduce economic loss induced by beetle attacks.

Forests 2020, 11, 417 11 of 14
Author Contributions: Conceptualization, Y.L. and H.H.; Investigation, L.Y., Z.Z., S.Z. and H.H.; Methodology,L.Y., Z.Z. and H.H.; Project administration, Y.L.; Software, L.Y. and Z.Z.; Supervision, S.Z., Y.L. and H.H.;Writing—original draft, L.Y.; Writing—review & editing, L.Y., L.R., S.Z., Y.L. and H.H. All authors have read andagreed to the published version of the manuscript.
Funding: This research was funded by the National Key Research and Development Program of China(2018YFD0600200) and Beijing’s Science and Technology Planning Project (Z191100008519004).
Conflicts of Interest: The authors declare no conflict of interest.
References
1. Ye, H. On the bionomy of Tomicus piniperda (L.) (Col., Scolytidae) in the Kunming region of China.J. Appl. Entomol. 1991, 112, 366–369. [CrossRef]
2. Lieutier, F.; Ye, H.; Yart, A. Shoot damage by tomicus sp. (coleoptera: Scolytidae) and effect on Pinusyunnanensis resistance to subsequent reproductive attacks in the stem. Agric. For. Entomol. 2015, 5, 227–233.[CrossRef]
3. Duan, Y. Genetic Structuration and Host Tree Preference of T. piniperda Populations in Southwestern China,with Comparison to the French Population from Scots Pine. Ph.D. Thesis, Yunnan University, Kunming,China, 2003.
4. Ji, M.; Dong, X.Q.; Liu, H.P.; Li, L.S.; Xu, H.; Yang, X.P.; Li, H.R.; Ze, S.Z. Preliminary study on remotesensing detection of yunnan pine forest damaged by Tomicus piniperda. J. West China For. Sci. 2007, 36, 87–90.[CrossRef]
5. Långström, B.; Li, L.S.; Liu, H.P.; Cao, P.; Liu, H.R.; Hellqvist, C.; Lieutier, F. Shoot feeding ecology of Tomicuspiniperda, and T. minor, (col. scolytidae) in southern china. J. Appl. Entomol. 2002, 126, 333–342. [CrossRef]
6. Li, L.S.; Wang, H.L.; Chai, X.S.; Wang, Y.X.; Shu, N.B.; Yang, D.S. Study on the biological characteristics ofTomicus piniperda and its damage. Yunnan For. Technol. 1993, 6, 14–20. [CrossRef]
7. Ye, H.; Li, L.S. The distribution of Tomicus piniperda (L.) population in the crown of Yunnan pine during theshoot feeding period. Acta Entomol. Sin. 1994, 37, 311–316. [CrossRef]
8. Ye, H. Studies on the biology of Tomicus piniperda (Col., Scolytidae) in the shoot-feeding period. Acta Entomol.Sin. 1996, 39, 58–62. [CrossRef]
9. Ye, H. Mass attack by Tomicus piniperda L. (Col., Scolytidae) on Pinus yunnanensis tree in the Kunmingregion, Southwestern China. In Proceedings of the Integrating Cultural Tactics into the Management of Bark Beetlesand Reforestation Pests, Vallombrosa, Italy, 1–3 September 1996; Gregoire, J.C., Liebhold, F.M., Stephen, F.M.,Day, K.R., Salom, S.M., Eds.; USDA Forest Service, General Technical Report NE-236; USDA: Washington,DC, USA, 1997; pp. 225–227.
10. Hui, Y.C.; Lieutier, F. Shoot aggregation by Tomicus piniperda L. (Coleoptera: Scolytidae). SouthwesternChina. Ann. Sci. For. 1997, 54, 635–641. [CrossRef]
11. Assal, T.J.; Sibold, J.; Reich, R. Modeling a historical mountain pine beetle outbreak using landsat mss andmultiple lines of evidence. Remote Sens. Environ. 2014, 155, 275–288. [CrossRef]
12. Walter, J.A.; Platt, R.V. Multi-temporal analysis reveals that predictors of mountain pine beetle infestationchange during outbreak cycles. For. Ecol. Manag. 2013, 302, 308–318. [CrossRef]
13. West, D.R.; Briggs, J.S.; Jacobi, W.R.; Negrón, J.F. Mountain pine beetle-caused mortality over eight yearsin two pine hosts in mixed-conifer stands of the southern rocky mountains. For. Ecol. Manag. 2014, 334,321–330. [CrossRef]
14. Duncan, J.P.; Powell, J.A.; Gordillo, L.F.; Eason, J. A model for mountain pine beetle outbreaks in anage-structured forest: Predicting severity and outbreak-recovery cycle period. Bull. Math. Biol. 2015, 77,1256–1284. [CrossRef] [PubMed]
15. Wulder, M.A.; White, J.C.; Bentz, B.; Alvarez, M.F.; Coops, N.C. Estimating the probability of mountain pinebeetle red-attack damage. Remote Sens. Environ. 2006, 101, 150–166. [CrossRef]
16. Meigs, G.W.; Kennedy, R.E.; Cohen, W.B. A landsat time series approach to characterize bark beetle anddefoliator impacts on tree mortality and surface fuels in conifer forests. Remote Sens. Environ. 2011, 115,3707–3718. [CrossRef]
17. Wulder, M.A.; Dymond, C.C.; White, J.C.; Leckie, D.G.; Carroll, A.L. Surveying mountain pine beetle damageof forests: A review of remote sensing opportunities. For. Ecol. Manag. 2006, 221, 27–41. [CrossRef]

Forests 2020, 11, 417 12 of 14
18. Meddens, A.J.H.; Hicke, J.A.; Vierling, L.A.; Hudak, A.T. Evaluating methods to detect bark beetle-causedtree mortality using single-date and multi-date landsat imagery. Remote Sens. Environ. 2013, 132, 49–58.[CrossRef]
19. Havasova, M.; Bucha, T.; Ferencik, J.; Jakus, R. Applicability of a vegetation indices-based method to mapbark beetle outbreaks in the high tatra mountains. Ann. For. Res. 2015, 58. [CrossRef]
20. Meddens, A.J.H.; Hicke, J.A.; Vierling, L.A. Evaluating the potential of multispectral imagery to map multiplestages of tree mortality. Remote Sens. Environ. 2011, 115, 1632–1642. [CrossRef]
21. Meddens, A.J.H.; Hicke, J.A. Spatial and temporal patterns of landsat-based detection of tree mortalitycaused by a mountain pine beetle outbreak in Colorado, USA. For. Ecol. Manag. 2014, 322, 78–88. [CrossRef]
22. Franklin, S.E.; Wulder, M.A.; Skakun, R.S.; Carroll, A.L. Mountain pine beetle red-attack forest damageclassification using stratified landsat tm data in British Columbia, Canada. Photogramm. Eng. Remote Sens.2003, 69, 283–288. [CrossRef]
23. Gartner, M.H.; Veblen, T.T.; Leyk, S.; Wessman, C.A. Detection of mountain pine beetle-killed ponderosa pinein a heterogeneous landscape using high-resolution aerial imagery. Int. J. Remote Sens. 2015, 36, 5353–5372.[CrossRef]
24. Wulder, M.A.; White, J.C.; Coggins, S.; Ortlepp, S.M.; Coops, N.C.; Heath, J.; Mora, B. Digital high spatialresolution aerial imagery to support forest health monitoring: The mountain pine beetle context. J. Appl.Remote Sens. 2012, 6, 325–336. [CrossRef]
25. Coops, N.C.; Johnson, M.; Wulder, M.A.; White, J.C. Assessment of QuickBird high spatial resolution imageryto detect red attack damage due to mountain pine beetle infestation. Remote Sens. Environ. 2006, 103, 67–80.[CrossRef]
26. White, J.C.; Wulder, M.A.; Brooks, D.; Reich, R.; Wheate, R.D. Detection of red attack stage mountain pinebeetle infestation with high spatial resolution satellite imagery. Remote Sens. Environ. 2005, 96, 340–351.[CrossRef]
27. Chappelle, E.W.; Kim, M.S.; Mcmurtrey, J.E. The Red Edge Shift: An Explanation of Its Relationship to Stressand the Concentration of Chlorophyll A. In Proceedings of the 11th Annual International Geoscience and RemoteSensing Symposium, Espoo, Finland, 3–6 June 1991; Institute of Eectrical and Electronics Engineers, Inc.: NewYork, NY, USA, 1991; pp. 2287–2290. [CrossRef]
28. Filella, I.; Penuelas, J. The red edge position and shape as indicators of plant chlorophyll content, biomassand hydric status. Int. J. Remote Sens. 1994, 15, 1459–1470. [CrossRef]
29. Gitelson, A.A.; Merzlyak, M.N.; Lichtenthaler, H.K. Detection of red edge position and chlorophyll contentby reflectance measurements near 700 nm. J. Plant Physiol. 1996, 148, 501–508. [CrossRef]
30. Ahern, F.J. The effects of bark beetle stress on the foliar spectral reflectance of lodgepole pine. Int. J.Remote Sens. 1988, 9, 1451–1468. [CrossRef]
31. Eitel, J.U.H.; Vierling, L.A.; Litvak, M.E.; Long, D.S.; Schulthess, U.S.; Ager, A.A.; Krofcheck, D.J.; Stoscheck, L.Broadband, red-edge information from satellites improves early stress detection in a New Mexico coniferwoodland. Remote Sens. Environ. 2011, 115, 3640–3646. [CrossRef]
32. Nink, S.; Hill, J.; Buddenbaum, H.; Stoffels, J.; Sachtleber, T.; Langshausen, J. Assessing the Suitability ofFuture Multi- and Hyperspectral Satellite Systems for Mapping the Spatial Distribution of Norway SpruceTimber Volume. Remote Sens. 2015, 7, 12009–12040. [CrossRef]
33. Oumar, Z.; Mutanga, O. Integrating environmental variables and WorldView-2 image data to improve theprediction and mapping of Thaumastocoris peregrinus (bronze bug) damage in plantation forests. ISPRS J.Photogramm. Remote Sens. 2014, 87, 39–46. [CrossRef]
34. Adamczyk, J.; Osberger, A. Red-edge vegetation indices for detecting and assessing disturbances in Norwayspruce dominated mountain forests. Int. J. Appl. Earth Obs. Geoinf. 2015, 37, 90–99. [CrossRef]
35. Fassnacht, F.E.; Latifi, H.; Ghosh, A.; Joshi, P.K.; Koch, B. Assessing the potential of hyperspectral imagery tomap bark beetle-induced tree mortality. Remote Sens. Environ. 2014, 140, 533–548. [CrossRef]
36. Immitzer, M.; Atzberger, C. Early Detection of Bark Beetle Infestation in Norway Spruce (Picea abies, L.) usingWorldView-2 Data. Photogramm.-Fernerkundung-Geoinf. 2014, 5, 351–367. [CrossRef]
37. Mullen, K.E. Early Detection of Mountain Pine Beetle Damage in Ponderosa Pine Forests of the Black HillsUsing Hyperspectral and WorldView-2 Data. Master’s Thesis, Minnesota State University, Mankato, MN,USA, 2016.

Forests 2020, 11, 417 13 of 14
38. Yu, L.F.; Huang, J.X.; Zong, S.X.; Huang, H.G.; Luo, Y.Q. Detect shoot-beetle damages of Yunnan Pine usingLandsat time-series data. Forests 2018, 9, 39. [CrossRef]
39. Cho, M.A.; Malahlela, O.; Ramoelo, A. Assessing the utility WorldView-2 imagery for tree species mappingin South African subtropical humid forest and the conservation implications: Dukuduku forest patch as casestudy. Int. J. Appl. Earth Obs. Geoinf. 2015, 38, 349–357. [CrossRef]
40. Multiresolution Segmentation—An Optimization Approach for High Quality Multi-Scale ImageSegmentation. Available online: http://www.isprs.org/proceedings/xxxviii/4-c7/pdf/Happ_143.pdf (accessedon 20 August 2019).
41. Benz, U.; Hofmann, P.; Willhauck, G.; Lingenfelder, I.; Heynen, M. Multi-Resolution, object-oriented fuzzyanalysis of remote sensing data for GIS-ready information. ISPRS J. Photogramm. Remote Sens. 2004, 58,239–258. [CrossRef]
42. Li, J.; Bioucas-Dias, J.M.; Plaza, A. Spectral–spatial hyperspectral image segmentation using subspacemultinomial logistic regression and markov random fields. IEEE Trans. Geosci. Remote Sens. 2012, 50, 809–823.[CrossRef]
43. Hais, M.; Wild, J.; Berec, L.; Bruna, J.; Kennedy, R.; Braaten, J.; Brož, Z. Landsat Imagery SpectralTrajectories—Important Variables for Spatially Predicting the Risks of Bark Beetle Disturbance. Remote Sens.2016, 8, 687. [CrossRef]
44. Negrón, J.F.; Mcmillin, J.D.; Anhold, J.A.; Coulson, D. Bark beetle-caused mortality in a drought-affectedponderosa pine landscape in arizona, usa. For. Ecol. Manag. 2009, 257, 1353–1362. [CrossRef]
45. Breece, C.R.; Kolb, T.E.; Dickson, B.G.; Mcmillin, J.D.; Clancy, K.M. Prescribed fire effects on bark beetleactivity and tree mortality in southwestern ponderosa pine forests. For. Ecol. Manag. 2008, 255, 119–128.[CrossRef]
46. Negrón, J.F.; Allen, K.; Cook, B.; Withrow, J.R., Jr. Susceptibility of ponderosa pine, Pinus ponderosa (dougl.ex laws.), to mountain pine beetle, Dendroctonus ponderosae hopkins, attack in uneven-aged stands in theblack hills of South Dakota and Wyoming USA. For. Ecol. Manag. 2007, 254, 327–334. [CrossRef]
47. Bockino, N.K.; Tinker, D.B. Interactions of white pine blister rust and mountain pine beetle in whitebark pineecosystems in the southern greater yellowstone area. Nat. Areas J. 2012, 32, 31–40. [CrossRef]
48. Thenkabail, P.S.; Enclona, E.A.; Ashton, M.S.; Meer, B.V.D. Accuracy assessments of hyperspectral wavebandperformance for vegetation analysis applications. Remote Sens. Environ. 2004, 91, 354–376. [CrossRef]
49. Feldesman, M.R. Classification trees as an alternative to linear discriminant analysis. Am. J. Phys. Anthropol.2010, 119, 257–275. [CrossRef] [PubMed]
50. Pu, R.; Landry, S. A comparative analysis of high spatial resolution IKONOS and WorldView-2 imagery formapping urban tree species. Remote Sens. Environ. 2012, 124, 516–533. [CrossRef]
51. Immitzer, M.; Atzberger, C.; Koukal, T. Suitability of WorldView-2 data for tree species classification withspecial emphasis on the four new spectral bands. Photogramm.-Fernerkundung-Geoinf. 2012, 5, 573–588.[CrossRef]
52. Pal, M. Random forest classifier for remote sensing classification. Int. J. Remote Sens. 2005, 26, 217–222.[CrossRef]
53. Lawrence, R.L.; Wood, S.D.; Sheley, R.L. Mapping invasive plants using hyperspectral imagery and BreimanCutler classifications (RandomForest). Remote Sens. Environ. 2006, 100, 356–362. [CrossRef]
54. Stumpf, A.; Kerle, N. Object-oriented mapping of landslides using Random Forests. Remote Sens. Environ.2011, 115, 2564–2577. [CrossRef]
55. Immitzer, M.; Atzberger, C.; Koukal, T. Tree species classification with random forest using very high spatialresolution 8-Band WorldView-2 satellite data. Remote Sens. 2012, 4, 2661–2693. [CrossRef]
56. Dalponte, M.; Bruzzone, L.; Gianelle, D. Tree species classification in the Southern Alps based on the fusion ofvery high geometrical resolution multispectral/hyperspectral images and LiDAR data. Remote Sens. Environ.2012, 123, 258–270. [CrossRef]
57. Amman, G.D. The Mountain Pine Beetle—Identification, Biology, Causes of Outbreaks, and EntomologicalResearch Needs. In Proceedings of the Joint Canada/USA Workshop on Mountain Pine Beetle Related Problemsin Western North America, Fairmont Hot Springs, BC, Canada, 3–4 November 1981; Shrimpton, D.M., Ed.;Information Report BC-X-230; Environment Canada, Canadian Forestry Service, Pacific Forest ResearchCentre: Victoria, BC, Canada, 1982; pp. 7–12. ISBN 0705-3274.

Forests 2020, 11, 417 14 of 14
58. Reid, R.W. Moisture changes in lodgepole pine before and after attack by the mountain pine beetle. For. Chron.1961, 37, 368–375. [CrossRef]
59. Safranyik, L.; Shrimpton, D.M.; Whitney, H.S. Management of Lodgepole Pine to Reduce Losses from the MountainPine Beetle; Forestry Technical Report 1; Government of Canada, Department of the Environment, CanadianForest Service, Pacific Forest Research Centre: Victoria, BC, Canada, 1974.
60. Sharma, R. Using Multispectral and Hyperspectral Satellite Data for the Early Detection of Mountain PineBeetle Damage. Ph.D. Thesis, The University of British Columbia, Vancouver, BC, Canada, 2007.
61. Page, W.G.; Jenkins, M.J.; Alexander, M.E. Foliar moisture content variations in lodgepole pine over thediurnal cycle during the red stage of mountain pine beetle attack. Environ. Model. Softw. 2013, 49, 98–102.[CrossRef]
62. Hilker, T.; Coops, N.C.; Coggins, S.B.; Wulder, M.A.; Brownc, M.; Black, T.A.; Nesic, Z.; Lessard, D.Detection of foliage conditions and disturbance from multi-angular high spectral resolution remote sensing.Remote Sens. Environ. 2009, 113, 421–434. [CrossRef]
63. Lars, W.; Meinrad, K.; Kai, J.; Theresia, S. Evaluating the potential of worldview-2 data to classify tree speciesand different levels of ash mortality. Remote Sens. 2014, 6, 4515–4545. [CrossRef]
64. Marx, A. Detection and classification of bark beetle infestation in pure norway spruce stands withmulti-temporal rapid eye imagery and data mining techniques. Photogramm.-Fernerkundung-Geoinf. 2010, 4,243–252. [CrossRef]
65. Garrity, S.R.; Allen, C.D.; Brumby, S.P.; Gangodagamage, C.; McDowell, N.G.; Cai, D.M. Quantifyingtree mortality in a mixed species woodland using multitemporal high spatial resolution satellite imagery.Remote Sens. Environ. 2013, 129, 54–65. [CrossRef]
66. Lin, Q.N.; Huang, H.G.; Wang, J.X.; Huang, K.; Liu, Y.Y. Detection of Pine Shoot Beetle (PSB) Stress on PineForests at Individual Tree Level using UAV-Based Hyperspectral Imagery and Lidar. Remote Sens. 2019,11, 2540. [CrossRef]
© 2020 by the authors. Licensee MDPI, Basel, Switzerland. This article is an open accessarticle distributed under the terms and conditions of the Creative Commons Attribution(CC BY) license (http://creativecommons.org/licenses/by/4.0/).