evaluating the performance of public enterprises in … · evaluating the performance of public...
TRANSCRIPT

Policy, Planning, and Research
WORKING' PAPERS
Public Sector Managementand Private Sector Developmnt
Country Economics DepartmentThe World Bank
March 1989WPS 160
Evaluating the Performanceof Public Enterprises
in Pakistan
Mary M. Shirley
Even managers critical of Pakistan's new performance evalua-tion system consider its targeting and bonus system a powerfulincentive to improve efficiency.
The Policy, Planning, and Research Cornplex distributes PPR Working Papers i idiaseminate the findings of work in progness and toencourage the exchange of ideas among Bank staff and all others interested in development issues. These papers carry the names ofthe authors, reflect enly their views, and should be used and cited accordingly. The fundings. interpretations, and conclusions are theauthors' own.They should not be auributed totheWorld Bank, its Board of Directors, its managernent,oranyof its mnembercountres.
Pub
lic D
iscl
osur
e A
utho
rized
Pub
lic D
iscl
osur
e A
utho
rized
Pub
lic D
iscl
osur
e A
utho
rized
Pub
lic D
iscl
osur
e A
utho
rized

Policy, Plannlng, and Research
Public Sector Managementand Private Sector Development
In 1983 Pakistan initiated a performance evalua- To strengthen the system, the author sug-tion, or "signaling:' system for industrial public gests:enterprises (IPEs). The system, which has beenapplied to most of Pakistan's IPEs and is ad- * Adjusting standard profits to exclude itemsministered by a special unit outside the civil that distort results (such as nonoperating incomeservice, involves: and depreciation) and that take administered
prices into account.• Selecting performance evaluation criteria.
Rewarding managers who reduce losses ase Assigning criterion values. well as those who increase profits.
• Negotiating achievement targets for the * Allocating bonuses more selectively - onenterprise. the basis of individual performance. This
requires developing adequate personnel evalua-* Evaluating results. tion systems.
* Providing bonuses based on the evaluation * Increasing competition and managerial(up to three months salary for A grade). autonomy (particularly decisions on personnel
and credit) to cut costs and increase efficiency.The focus is on operating efficiency, not
financial retums, and on motivating manage- * Studying the impact of policy and regula-ment by excluding factors beyond the control of tory decisions on IPEs -for example, the costsmanagers. of social objectives, price controls, and delays
caused by central decisionmaking.
Even managers critical of the system (in-cluding some who did not receive bonuses) cite The paper concludes with suggestions ofthe targeting and bonus system as a powerful ways to simplify and adapt the system for uc t inincentive to improve efficiency. other countries.
This paper is a product of the Public Sector Management and Private SectorDevelopment Division, Country Economics DepartmenL Copies are available freefrom the World Bank, 1818 H Street NW, Washington DC 20433. Please contactRose Malcolm, room N9-053, extension 61708.
The PPR Working Paper Series disseminates the fndings of work under way in the Bank's Policy, Planning, and ResearchComplex. An objective of the series is to get these findings out quickly, even if presentations are less than fulUy polished.The findings, interpretations, and conclusions in these papers do not necessarily represent official policy of the Bank.
Produced at the PPR Dissemination Center

Table of Contents
Page No.
Summary and Conclusions ........................ i-viii
I. INTRODUCTION ........................................... 1
II. BRIEF HISTORY AND DESCRIPTION OF THE SYSTEM .... ........ 1
A. Overview of Industrial Public Enterprises (IPEs)Under the Ministry of Production (MoPO .... .......... 1
B. Description of the Signalling System .... ............ 5Selection of Performance Evaluation Criterion ....... 7Setting Targets ..................................... 11Evaluation .......................................... 12Incentive Systems ................................... 13
III. IMPACT ON PERFORMANCE .................................. 16
A. Methodology ......................................... 16B. Quantitative Evidence ............................... 18
Current Priced Profits .............................. 18Constant Priced Profits ............................. 19Explanation of the Sample's Performance .... ......... 22Changes in Prices ................................... 24Changes in Markets .................................. 26Macroeconomic Changes ............................... 27Changes in Management ............................... 28Conclusion .......................................... 29
C. Qualitative Evidence ................................ 30D. Constraints on the System's Impact .................. 34
Failure to Motivate Efficiency Improvements .... ..... 34Lack of Management Autonomy to Affect Efficiency .... 40Exclusion of PEs from the System .................... 40Macroeconomic Environemnt ........................... 41
E. Perverse Effects on Performance ..................... 41
IV. IMPACT OF THE SYSTEM ON GOVERNMENT POLICY .............. 42A. Impact on the Regulatory Environment and Pricing .... 42B. Impact on Decisions to Close or Sell IPEs .... ....... 45
V. SUGGESTIONS FOR STRENGTHENING THE SYSTEM IN PAKISTAN ... 47
A. Imptoving the Internal Operationsof the System ....................................... 47Targets and Bonuses ................................. 47Improving Targeting ................................. 53Technology Improvement .............................. 54
B. Changes in the Environment for IPEs .... ............. 54

Table of Contents(continued)
?age No0.
VI. APPLYING THE SYSTEM IN OTHER COUNTRIES .... ............. 58
A. Potential Costs and Benefits ........................ 58Costs ............................................... 58Benefits ............................................ 62
B. Prospects for Realizing the Potential Benefits ...... 63Pricing and Market Structure and ItsImplications for Coverage of the System .... ......... 63Supervision of the Sector andManagerial Autonomy ................................ 65Role of the Labor Force ............................. 67
C. Adapting the System to Other Circumstances .... ...... 67Simpler Systems ..................................... 67The Incentive System ................................ 69Amount of Macroeconomic Information .... ............ 70
Annex A: Explanation of the DIVISA Index Used in the Signalling System
VII. STATISTICAL APPENDIX
TABLES IN THE TEXT1. Cor.solidated Background Information on the Corporations
of the Ministry of Production2. Units Under the Incentive System3. Summary of Performance Evaluation 1983-86; Achievement of
Final Grades by Corporation4. Background Information on Sample Enterprises5. Summary of Performance of IPEs in System for Three Years6. Trends in Performance of Sample Units Compared to 1982/83 Levels7. Comparison of Labor Costs and Productivity by Increases for
All IPEs Under the Ministry of Production
GRAPHS IN THE TEXT
Production, Employ.inent, and Productivity of Sample Units1980/81 - 1985/86

SUMMARY AND CONCLUSIONS
This report assesses the performance evaluation system being used
for industrial public enterprises in Pakistan. The assessment aims to
assist the Pakistani government in strengthening the system as needed, and
to inform interested officials in other countries of the costs and benefits
of the system and how it might be adapted for their use.
The Signalling System
Chapter II briefly describes the performance evaluation system,
or "signalling system", which began to operate in Pakistan in 1983. The
signalling system has been applied to most of the industrial public
enterprises (IPEs) under the Ministry of Production (between 41 and 56 IPEs
have been evaluated out of 66 in total). The system involves: (i)
selecting suitable performance evaluation criterion; (ii) assigning
criterion values based on the enterprises's past performance, its
objectives, the operational and financial eoi.straints it is expected to
face, and the like; (iii) setting targets of achievement in negotiation
with the enterprise (five grades from A to E are used in Pakistan); (iv)
evaluating results; and (v) providing a bonus on the basis of the
evaluation (up to three months of salary for the A grade). The system is
administered by the Experts Advisory Cell (EAC), a special unit attached to
the Ministry of Production (MOP) but outside the civil service, -Ihich is
financed by a levy on the state enterprises.

-ii-
The original proposal for the signalling system assumed that the
performance evaluation of public enterprises in Pakistan should differ from
private ones to take into account the different objectives of government,
factors which are beyond the control of a public manager (such as the
quantity and quality of capital employed) and the administered prices faced
by many IPEs. Thus, the focus was on operating efficiency rather than
financial returns and the proposed criterion for evaluation was public
profitability in constant prices.
Public profits differ from private profits as follows: (i) taxes
are added back in since government does not want to motivate managers to
reduce taxes; (ii) depreciation is add,d back to avoid awarding older
plants vis-a-vis newer ones; (iii) interest is added since interest
payments represent transfers rather than changes in efficiency, plus debt
and investment decisions are best handled through a separate control
system; (iv) non-operating income is subtracted since the aim is to measure
operating efficiency; and (v) a charge is included for the opportunity cost
of capital, since IPE managers cannot usually control their capital stock
but they can control their working capital. Public profits are then
divided by fixed operating assets, thus adjusting for changes due to
expansion.
Public profitability would then be converted to constant prices
and IPEs evaluated on the trend in the resulting indicator. The trend in
this indicator in constant prices is a measure of operating efficiency
similar to total factor productivity. It was considered especially

-iii-
appropriate since many IPEs faced administered prices. However, for
reasons described in the text, the Government decided to use standard
private profits as the primary indicator of performance.
Imgact of the System on Performance
Chapter III assesses the impact of the signalling system on IPE
performance using both quantitative and qualitative evidence. In terms of
financial profits some 58 percent of the IPEs under the system showed an
improvement in performance. Some of these profits were due to increases in
prices or windfall gains in non-operating income. To assess the impact on
operational efficiency the report assessed a sample of 12 IPEs in detail.
Seven out of the sample of 12 showed an improvement in operating efficiency
(measured as public profitability in constant prices).
Not surprisingly it was difficult to isolate the signalling
system's impact on efficiency from other influences. Nevertheless, it was
possible to rule out a number of potential explanations for efficiency
gains of the sample IPEs (including changes in the macroeconomy, markets,
liquidity, capacity, technology, etc.; see text). There were, however,
important changes in the supervisory environment and parallel changes in
management that were probably critical to the impact of the signalling
system. For example, the MOP fired some managers for incompetence; access
to subsidies was curbed, etc.
The qualitative evidence (from interviews with managers and
government officials) suggests that the system provided managers with an

-iv- e J
added incentive to respond to these environmental changes and a tool (in
the form of bonuses) to motivate staff. The targeting and bonus system was
cited by all managers consulted, even those critical of the system and
those not receiving bonuses, as a potentially powerful incentive for
efficiency improvements.
This evidence of positive impact is noteworthy since it arises
despite a number of factors which constrain the system's influence. The
most important constraint is limited managerial autonomy to cut costs and
increase efficiency. For example, managers cannot control their labor
costs very effectively (although this may be changing), cannot cut off
service or close plants, have limited flexibility in procurement decisions,
are constrained in their ability to raise capital, and must cope with
government-imposed social welfare objectives. The system's impact is
further limited by the exclusion of loss making IPEs; managers are given no
incentive for reducing losses (this also may be changing).
Impact of the System on Government Policy
The signalling system has not so far had a major impact on
government policy vis-a-vis the IPEs or on decisions to restructure the
sector and close and liquidate firms (Chapter IV). This despite the fact
that the system generates a lot of information that could serve these
purposes. One reason for this is that the EAC was set up for and is most
effective at influencing management. Another is that policy decisions are
not in the hands of the MOP. (The MOP was set up to supervise the IPEs;
industrial policy is handled by another ministry; Finance and other
-V.
ministries are involved in such decisions as pricing, labor policy, or the
allocation of foreign exchange.) Furthermore, the system was set up to
calculate operating efficiency and not allonative efficiency, although the
information it generates could be adapted for that purpose. One risk of
focusing on maximizing performance within the status quo is that the system
might actually reduce the pressures for change and restructuring.
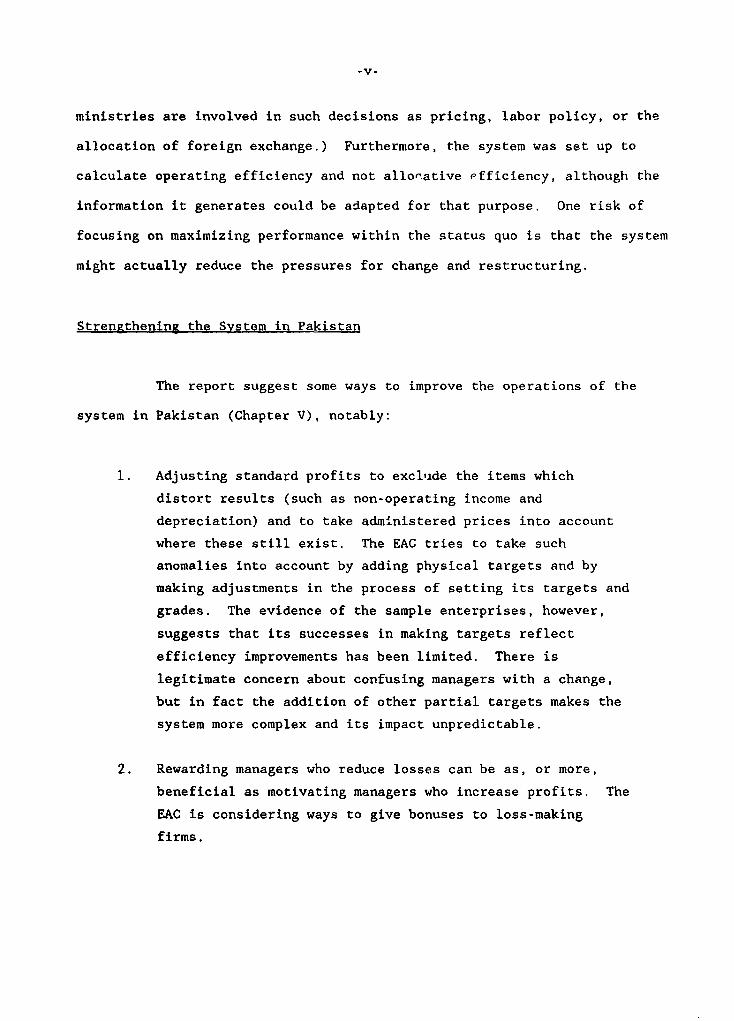
Strengthening the System in Pakistan
The report suggest some ways to improve the operations of the
system in Pakistan (Chapter V), notably:
1. Adjusting standard profits to exclude the items which
distort results (such as non-operating income and
depreciation) and to take administered prices into account
where these still exist. The EAC tries to take such
anomalies into account by adding physical targets and by
making adjustments in the process of setting its targets and
grades. The evidence of the sample enterprises, however,
suggests that its successes in making targets reflect
efficiency improvements has been limited. There is
legitimate concern about confusing managers with a change,
but in fact the addition of other partial targets makes the
system more complex and its impact unpredictable.
2. Rewarding managers who reduce losses can be as, or more,
beneficial as motivating managers who increase profits. The
EAC is considering ways to give bonuses to loss-making
firms.

-vi-
3. Allocating bonuses more selectively among the staff of an
IPE on the basis of individual performance would be highly
desirable and merits developing adequate personnel
evaluation systems in the future.
4. Increasing competition and managerial autonomy to cut costs
and increase efficiency would reduce the need for so many
adjustments to the targets and increase the efficiency
gains. Decisions on personnel and credit seem to merit
particular attention.
5. Studying the impact of policy and regulatory decisions on
the IPEs could multiply the influence of the signalling
system. The EAC has begun to use its information for these
purposes. (For example, they are developing a social
accounting matrix anc studying labor policy). Examples of
potentially useful studies include the costs of social
objectives, of price controls, of delays because of
centralized decision making.
Applying the System in Other Countries
Chapter VI of the report assess the costs versus the benefits of
the signalling system and how it might be adapted to other countries; The
net benefits for another country cannot be determined in the abstract since
there are factors that might raise the costs, as well as ways to increase
the potential benefits. The installation and operation costs of the system
in Pakistan are in fact rather modest, but the system benefitted from
skilled managers in the IPEs and skilled staff in the EAC, as well as the
reliable and timely information already collected by the EAC. Moreover,
the Pakistani system was designed for the 70 or so companies under the MOP,
which include a number of similar firms and some relatively simple

-vii-
processing industries (cement, for example). Other countries may need to
improve the information and skill base considerably and to apply the system
to more, and more diverse, companies. (Egypt, for example, is
contemplating applying a similar system to some 200 public enterprises.)
The benefits from the system could be maximized by increasing
competitive pressures for efficiency wherever possible. This would allow
more enterprises to be judged by public profit targets at current prices.
The signalling system is in a sense a market proxy; it creates pressures
for efficiency that in other circumstances might be supplied (and supplied
more effectively) by the market. Thus it makes sense to free markets where
possible and focus the system on monopolies. Giving managers greawer
autonomy to respond to pressures for efficiency will further increase the
benefits from performance evaluation. Benefits will also depend on the
environment for managers. The general hardening of the managerial
environment was an important factor in the efficiency gains in Pakistan.
Performance evaluation systems are of limited use without strong commitment
from top decision-makers and a demonstrated readiness to fire managers who
do not perform.
Finally, the system can be adapted to circumstances in other
countries in several ways. It could be made much simpler, at least at the
outset, by, for example, shadow pricing a few critical items (such as
electricity, wages, and foreign exchange). It could be applied to only the
10 or 15 public enterprises that are us -' y the key to economic
development (such as the utilities and transport companies, etc.). Public
-viii-
recognition of top performers could be enhanced; it can be as important as
bonuses in some cultures. In addition, the amount of macroeconomic
information generated by the system could be increased and aggregated for
planning and decision-makirg purposes.
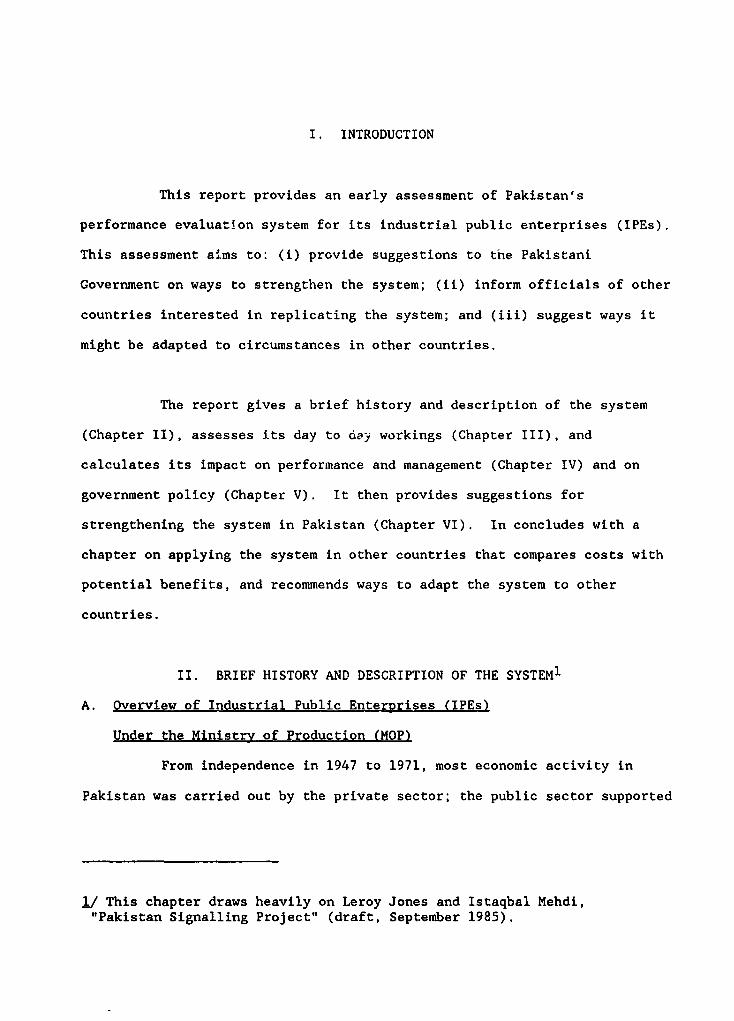
I. INTRODUCTION
This report provides an early assessment of Pakistan's
performance evaluation system for its industrial public enterprises (IPEs).
This assessment aims to: (i) provide suggestions to the Pakistani
Government on ways to strengthen the system; (ii) inform officials of other
countries interested in replicating the system; and (iii) suggest ways it
might be adapted to circumstances in other countries,
The report gives a brief history and description of the system
(Chapter II), assesses its day to oay workings (Chapter III), and
calculates its impact on performance and management (Chapter IV) and on
government policy (Chapter V). It then provides suggestions for
strengthening the system in Pakistan (Chapter VI). In concludes with a
chapter on applying the system in other countries that compares costs with
potential benefits, and recommends ways to adapt the system to other
countries.
II. BRIEF HISTORY AND DESCRIPTION OF THE SYSTEMI
A. Overview of Industrial Public Enterprises (IPEs)
Under the Ministry of Production (MOP)
From independence in 1947 to 1971, most economic activity in
Pakistan was carried out by the private sector; the public sector supported
1/ This chapter draws heavily on Leroy Jones and Istaqbal Mehdi,"Pakistan Signalling Project" (draft, September 1985).

-2-
development largely by providing basic infrastructure. The state's
presence in the manufacturing sector began in 1950 with the establishment
of the Pakintan Industrial Development Corporation (PIDC) to support the
creation of state enterprises in the manufacturing sector which
(presumably) would eventually be transferred to the private sector. From
1972 to 1977, the industrial and financial sectors were progressively
nationalized, and the number of IPEs increased from 22 in 1972 to 55 in
1977. The nationalized industries included iron, steel, basic metals,
heavy engineering, motor vehicles, chemicals and petrochemicals, and
cement.
The post-1977 government adopted a different strategy,
emphasizing the importance of free market forces in economic development.
Sustained growth was to be achieved on the basis of greater private sector
participation and more diversified and export-oriented production. The
government was to provide the basic infrastructure needed to support the
private sector, and public investment was to oe oriented towards the social
sectors in order to improve the country's human resource base and ensure
that a broader sector of the population benefited from economic growth.
In the last ten years, Pakistan has privatized some public
corporations, reestablished fiscal control and acted to restore private
sector confidence. The Sixth Plan (1984 to 1988) aims to create adequate
conditions for private investment and has started programs to encourage
increased private sector participation as well as more efficient investment
and production decisions through: deregulation, appropriate input and
output pricing, and opening up the economy to increased competition from

-3-
abroad. During the first three years of the plan, there has been progress
in a number of areas, for example: (a) liberalization of investment
sanctioning; (b) deregulation of cement, edible oils, and nitrogenous
fertilizer prices; (c) rationalization of natural gas prices for both
producers and consumers; (d) opening up of Basmati rice, edible oil and
fertilizer production to the private sector; and (e) more flexible exchange
rate management to ensure international competitiveness. As a part of this
same effort, the government conducted a review of the public manufacturing
sector, which resulted in two reports (Uqaili and Beg Reports). Based on
the recommendations of these reports, the government reorganized the
industrial public enterprise sector into its present structure.
Today there are 66 IPEs grouped in eight holding companies or
corporations under the MOP (Table 1 provides background information by
holding companies), plus a new steel project. The MOP is an administrative
ministry (a Ministry of Industry sets sector-wide policy) and is
responsible for monitoring the IPEs to ensure that they are managed
efficier.tly. Specifically MOP: (i) formulates long-term policies for
public sector enterprises in consultation with the corporations; (ii) does
long-term planning and coordination among corporations and enterprises;
(iii) sets IPE objectives and evaluates their performance; and
(iv) appoints senior executives and approves the appointment or promotion
of other top managers. A special unit, the Experts Advisory Cell (EAC),
was created in 1980 to assist the Ministry in monitoring performance,
evaluation, and planning. The Cell is financed by a levy on the IPEs and
its staff are not part of the civil service.

TABLE IPMISTAN: CONSOLDATED 8A0(atMW DrTIIIN ON THE CUWPRATIONS OF THE MINISTRY OF FROOUCTION (a)
Number of Production valus at Not Sales Pro-t. Profit Number Eploy.es Salaries ValueCWORAITIII Aconr s nit constan%t price* of 1977-78 I *. in llil. (Lose) R inNill) as*n 30 June of: and Wagma Added
1902/63 Is9/8 1982/83 1985/80 6/ 0s tsj 198F 1905/86 1963 1966 1904/66 105/66 1985/86
Federel Chemicel and FCCCL 13 14 648 120 1301 1679 7 14 6275 7549 239 294 w99
Cern-;e- Corperation
National Fortiliaer WtC 6 6 1528 1602 3614 4391 99 646 5231 5442 226 250 1938Co,roration
Pakiston Automb il PACO I1 12 2914 2742 4636 4709 320 157 8570 7469 386 399 o11Cororstion
Pehistan Industrial PrIC S 10 237 451 426 473 -214 -182 3315 6733 e0 6S 6oO"Glopeent Corporation
Stte* Cmnt Corporation SCCP it 13 1751 2217 3943 4599 460 766 11114 12510 564 64 2254
State byinsering SC 10 10 2025 1951 2252 2217 45 -23 136 14603 447 4" 643
cal Corporation
TeittileNchinory Cor- THC 2 2 0 7 56 36 -14 -26 0 483 13 II 17poration Limited
T T A L: 61 70 11616 13291 25454 26330 1423 1463 50977 sso50 2024 2238 7070
SOURC: EAC Annual Reporta.
(a) Doe. not include Pakitan Steel N;ill Corporation.

-5-
B. Description of the Signalling System
Background
The concept of a public enterprise performance evaluation system
was introduced at a Symposium sponsored by the Government of Pakistan and
the United Nations in Islamabad in November 1981.2
The Government decided to proceed with the system and in December 1981
signed a contract with a consulting firm to implement the system.3
The system is based on the following key assumptions:
(a) Managers can be given a clear perception of theirobjectives;
(b) IPEs in Pakistan can be improved;
(c) Managers can control enterprise performance;
(d) IPE managers will respond to incentives (monetary andnon-monetary);
(e) Managers can be given ready access to information and otherrsources necessary to improve IPE performance.
(d) Performance can be measured objectively and fairly, henceits evaluation will send the right "signals" to managers.
2/ In a paper presented by Leroy Jones, "Towards a PerformanceEvaluation Methodology for Public Enterprises: With SpecialReference to Pakistan."
i/ Jones' consulting firm, Institute for Development Research ofBoston (IDR).

-6-
On the basis of these assumptions, the so-called signalling
system was designed with three components.
(a) A performance evaluation system to specify sociallydesirable performance;
(b) A Public Enterprise Performance Information System (PEPIS)to accurately measure economic performance, and
(c) An incentive system to reward managers and staff on thebasis of actual versus targeted performance.
The EAC was given the main responsibility for developing and implementing
performance evaluation system.
The performance evaluation system consists of four key steps:
the selection of general performance evaluation criteria, the selection of
specific units to measure enterprise performance, the assignment of weights
to evaluation criteria, and the negotiation of criterion values to
differentiate good from bad performance. This provides the basis for
evaluating performance at the end of the year and providing incentives
based on results. The main steps involved in the signalling system are
shown in Table 1 of the Statistical Appendix.
-7-
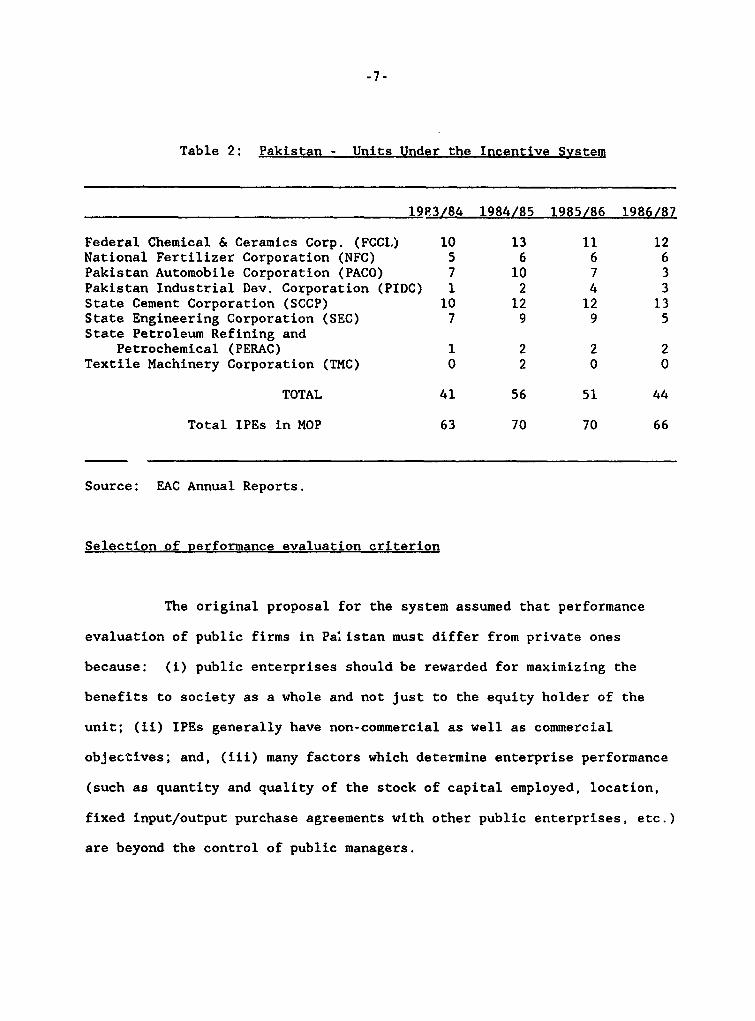
Table 2: Pakistan - Units Under the Incentive System
19P.3/84 1984/85 1985/86 1986/87
Federal Chemical & Ceramics Corp. (FCCI.) 10 13 11 12National Fertilizer Corporation (NFC) 5 6 6 6Pakistan Automobile Corporation (PACO) 7 10 7 3Pakistan Industrial Dev. Corporation (PIDC) 1 2 4 3State Cement Corporation (SCCP) 10 12 12 13State Engineering Corporation (SEC) 7 9 9 5State Petroleum Refining and
Petrochemical (PERAC) 1 2 2 2Textile Machinery Corporation (TMC) 0 2 0 0
TOTAL 41 56 51 44
Total IPEs in MOP 63 70 70 66
Source: EAC Annual Reports.
Selection of performance evaluation criterion
The original proposal for the system assumed that performance
evaluation of public firms in Pa.istan must differ from private ones
because: (i) public enterprises should be rewarded for maximizing the
benefits to society as a whole and not just to the equity holder of the
unit; (ii) IPEs generally have non-commercial as well as commercial
objectives; and, (iii) many factors which determine enterprise performance
(such as quantity and quality of the stock of capital employed, location,
fixed input/output purchase agreements with other public enterprises, etc.)
are beyond the control of public managers.

-8-
Taking this into account, the system was originally designed to
evaluate operational efficiency using public profitability in constant
prices. The designer of the system argued that simple profits as used for
private firms would not be adequate, since they only show the difference
between costs and benefits to the individual firm and do not adequately
reflect the difference in the value to society between what the enterprise
takes out of the economy and what it puts back. Public profit is an
indicator that is intended to increase only when society as a whole is
better off. It also adjusts for accounting anomalies that might distort
the measurement of efficiency.
Public profits are calculated as follows:
Private profits after taxes+ Taxes+ Depreciation+ Interest- Nonoperating income (financial income and rent,capital gains and transfers)
- Opportunity cost of working capital- Public Profits
Taxes are added back in since this is a return from government's point of
view. This avoids giving PE managers a reward for reducing taxes.
Depreciation is added back because including it would: penalize newer
plants vis-a-vis older ones, cause profits and profitability to increase
(assuming no new investment) without any increase in efficiency, and reward
PEs for underdepreciating or changing their accounting practice so as to
reduce depreciation charges. Interest is added back because changes in
interest payments do not reflect changes in efficiency but transfers from

-9-
one part of society to another. The assumption is that enterprise
investment and debt decisions are best handled through separate control
systems designed to assure the most efficient allocation of capital.
Nonoperating income is excluded since it does not reflect operating
efficiency. And, finally, a charge is added for the opportunity cost of
working capital (in 1983/84 figured as 10.5 percent times inventories;
cash, demand deposits, accounts receivables and the like). The IPEs are
charged for fixed capital by i.ncluding fixed operating assets in the
denominator, thus adjusting tor changes due to expansion.
Public profitability would then be converted to constant prices
using a divisa index.4 Since managers of IPEs in most cases cannot change
prices, constant-priced profit attempts to measure factors they can change.
(Since the divisa index relies on constantly changing weights, managers
still have an incentive to seek lower costs or higher profits through price
changes where they have the option.) The trend in public profit in
constant prices is appropriate for performance evaluation but not for
investment evaluation. IPEs would then be evaluated by the trend in public
profitability in constant prices.
The proposal suggested that public profits would be further
adjusted to take into account the costs of any noncommercial, social
)bjectives that might affect performance trends. But since such costs are
likely not to fluctuate much from year to year in constant prices, this was
i/ See Appendix A for an explanation of this index.

-10-
a complication that could be safely ignored, &t least in the start-up
phase. The more common costs stemming from social objectives (besides
price controls) are associated with remote locations (to promote regional
development) or redundant workers (to increase employment), and these
usually do not markedly affect the year-to-year trends in efficiency.
The original design also called for supplemental indicators to
take into account dynamic considerations (i.e., expenditures for research
and development, maintenance, training, introduction of new products. etc.)
Otherwise, the IPE might tend to neglect those items which have a short-
term cost and a long-term benefit. Other qualitative indicators measuring
such factors as project implementation were also proposed. These have not
yet been implemented and there is some evidence that IPEs are sacrificing
the long-term health of the company to short-term profits (see Section
III-E below).
In 1983 the original design of the system was substantially
changed in order to win the Ministry of Finance's (MOF) agreement to the
bonus system. MOF agreed to allow bonuses to be paid only if the basic
performance criterion was private profits after taxes. One reason for this
was MOF's reluctance to permit bonuses to be paid to staff of IPEs showing
private losses but improving public profitability at constant prices.
(This is possible since many of the enterprises face price distortions.)
MOF also worried about the public relations impact (officials envisioned
such headlines as "Public Sector Loses Money; hanagers Rewarded"). Another
concern was that workers in money-losing PEs would have to be paid bonuses

-11-
when their managers got bonuses, but it was unlikely that workers in
profitable IPEs would forgo bonuses even if their managers were not
rewarded; (This could happen if the trend in constant priced profits was
downward). A third reason, which was not explicitly voiced by MOF, may
have been MOF's own interest in the IPE's maximizing their private profits,
since this reduces the pressures on Finance for relief in the forms of
refinancing, higher prices, etc. Finally, there was a concern that non-
economists, including the managers of IPEs, would find public profitability
hard to grasp.
Today, the system is measuring IPEs principally on the basis of
private financial profits after tax in current prices. The EAC has added
some other indicators to measure physical production or energy consumption.
(See Table 2 of the Statistical Appendix for some examples), and it has
tried to adjust profits for companies facing cost plus pricing (see Chapter
III). When more than one criterion is used, the EAC assigns weights chat
rnflect the importance Government assigns to each one.
Setting Targets
Targets are based on budgetary proposals presented by the
enterprises according to a format provided by the EAC. The EAC analyzes
the proposals, taking into account various considerations, such as:
(i) The enterprise's initial objective, designed capacity andbudgeted profit;
(ii) The unit's performance record in recent years;(iii) The different financial and operational constraints the
enterprise is expected to face during the evaluationperiod; and
(iv) The enterprise's macroeconomic environment.

-12-
It also looks at the actual results for the past year and the budgeted and
expected results for the current year.
Based on these considerations, the EAC attempts to set optimum
targets, prepares a draft summary of possible targets, and invites the
individual managing directors to discuss the proposed criteria. For each
proposed criterion the EAC prepares five targets, representing the range of
targets from highest to lowest. The C target, is usually based on the
enterprise's budgeted figure. B is usually 5 percent higher and A is 10
percent above C; D is 5 percent lower and E is anything less than D.
During the negotiations between the EAC and the MDs, the EAC takes into
consideration the general business environment, the parameters within which
tile enterprise is expected to operate (i.e., tariff or exchange rate
changes, price and wage policies, etc.), and trends in the cost of
production. The EAC focuses on how to increase production and sales while
minimizing costs.
Targets are officially agreed in a contract between the EAC and
the MDs, subject to the approval of the Ministry of Production. After
signing the contract, the enterprise management is, :n principle, left on
its own to make all efforts necessary to achieve the t.:rgets.
Evaluation
Once it receives the audited accounts, the EAC calculates a
composite performance score for the enterprise by multiplying the assigned
target weight by the grade obtained and then aggregating the resulting

-13-
scores. At this time or earlier, the MD can try to convince the EAC that
unforseen and uncontrollable circumstances (e.g., power outages) warrant a
change in its targets.
Incentive System
The incentive system consists of bonuses based on the
enterprise's achievement of the targets. Depending on the enterprise's
category, the management and all nonunionized staff receive the following
rewards:
Grade A Excellent 3 months base salaryGrade B Very Good 2 months base salaryGrade C Good 1 month base salaryGrade D Poor 15 days base salaryGrade E Unacceptable Nil
Only profitable IPEs receive a bonus. The original proposal was
to reward managers of loss makers who reduce the losses by a targeted
amount, but MOF worried about having to provide subsidies in order to pay a
bonus. As a result all IPE targets must show profits. Furthermore, the
EAC sets a cut off point for most IPEs equivalent to the C target (which is
usually equivalent to the budget) and IPEs with profits which fall below
that point are not usually rewarded. In addition some chronic money losers
whose viability is questionable have at times been excluded or dropped from
the system.
One measure of the targeting system is the distribution of the
grades. If information were perfect about the technical/engineer potential
of the company, the future environment and the optimal management

-14-
techniques, than the only unknown wot.ld be the degree to which the system
motivated staff to work harder and better. Under such circumstances, we
might expect most enterprises to earn a C grade. It would make sense for
the EAC to set targets so that the achievements fall in a normal
distribution around the C grade. In fact, the distribution was singled
tailed in 1983-84 with over 40% of the IPEs in E grade and roughly equal
shares in the other grades. In 1984-85 and 1985/86, the distributions
become increasingly bi-modal with 35% in A and 40% in E in 1985/86 (see
Table 3).
These results reflect weaknesses in the criterion used as well as
imperfect information. One problem is that loss-making companies are
automatically assigned "E" which inflates the bottom grade.5 Another is
that the negotiations are dominated by EAC generalists who have limited
knowledge of the workings of the IPEs or of industry standards in other
countries.
l/ The distributions are still skewed if loss making companies areexcluded, however, thirty five percent receive "E" in 1983-84, muchlarger than other grades. The next year is bimodal: 34% in E and 27%in A. 1985/86 becomes singletailed toward the top: 46% in "A" versus20 in "C" and 23 in "E".

Toble 3: Pakistan: Suary of PerformWce Evaluation for the Period19U-196igt Achievat of Final gradn byw Corporation
1a03/191e1 m,qaoss aoe/sjae (1)A a C 0 E TOTAL A a C 0 E SL-TOTAL A O C 0 E SUWI-T0
F.deralChe_ical & cor.ace Coro. (Fcc) 2 0 4 0 4 10 0 0 3 1 9 13 3 a 1 a 5 14
NotoalF.rti I ier =ftie; 04FeC) I 0 2 1 a 3 1 1 1 0 o4 1 1 0 0 o .Piata lAtombil; Nea pm) 2 2 1 0 2 7 4 2 0 1 3 10 a 0 2 0 * 4
pa&ioateaIadua9elao n ls.CieM MPOC 0 0 0 I 21 4P - i 1 &Z1 01". . t7Bg) C v § § | | § | *1 4 3 1 a I 0 D
St.o Comea% C -rc i 1 1 k 4 3 10 2 5 0 0 5 12 5 1 2 0 4 1:State Ea ti -tl i oti (601) o a a 2 0 J o a 1 a 0 * Fstate Pe- _ wuiTa. a *p cb.(FM) I 0 0 0 0 1 1 0 0 0 I 2 I 0 0 0 0 OT ati i- 1;bi..Coemt &O- IeC) 0 0 0 0 0 0 0 0 0 0 2 2 0 0 0 0 C
Sl-TOTAL 7 4 0 5 17 41 12 9 t 3 27 5 is 4 7 0 is 4tin; t to be 0rad.d: T O T A L 41 56 5
(1) units wader Incntive Swat": 51Coseidara proIia&aarpy rawuto foe 45 waite. lOits with psadiag doc;u meat 6 (FCCCL: IfL; PACO: lhcb Tlract Millet Trator-. lttioeal Mtors; SEC: Poneer Stol; PEIAC: tPC)Wti lejr.dld: 41
PMISTC: MGJS U OF PVWC£ EVALUATION FOR TIE PFOIM 1963-106;AalEVh1 IT OF FDAL RADES W CarISATZI
-- -(Percentag wth e ct to Total)
_ _ls/1984 164/1965 196511696 (1)
A O C 0 E S8-TOTML A O C D e SUFTOTAL A O C D E 51-TOal
Federal Chemical A Caronic C0p FCOCL) 6.10 0.00) 9.76 0.00 9. 76 24.30 0.00 0.00 1.36 1. 79 16.07 22.21 6.87 2.22 2.22 0.00 11.11 22.2.Stiomal FartslicrCO2OriOS C£) 244 0.00 4.0n 244 2 44 32.20 S.36 1.7. 1.79 1.79 0.00 10.71 S.69 222 222 000 000 133. Ps-a- 4t. 8 4il Cororetio (P) 400 4.00 2.44 0.00 4.00 17.07 7.14 3.S7 0.00 1.79 5.36 17.00 2.22 0.00 4.44 0.00 2.22 6 6Pahiata Zaduestrial a . Cor. 1C) 00 0.00 0.00 0.00 2.44 2.44 0.00 1.79 0.00 0.00 1.79 3.57 2.22 0.00 000 0.00 S. 67 6. 6State Cemeat Coeroa*;. 2.44 2.44 2.44 0.76 7.32 24.39 3.57 6.93 0.00 0.00 S.93 21.43 11.11 2.22 .44 0.00 *.09 26 61stoto EnI ee;Coaeor (5w) 0.00 2.44 0.00 0.00 14.6 17.07 3.57 0.00 1.79 0.00 10.71 16.07 2.22 2.22 2.22 O.OD 11.11 17 7tState P*trolw afi £ Pa tc (UAC) 2.44 0.00 0.00 0.00 0.00 2.44 1.79 0.00 0.00 0.00 1.79 3.57 2.22 0.00 0.00 0.00 0.00 2.ZTeotiIsa bctir Cooet.oa (WE) 0.00 0.00 0.00 0.00 0.00 0.00 0.00 0.00 0.00 0.00 5.57 3.57 0.00 0.00 0.00 0.00 0.00 0.O
Sag-TOTAL 17.07 9.76 19.51 12.20 41.46 100.00 21 43 16.0 6.903 .36 4J.21 100.00 35.56 6.19 15.56 0.00 40.00 100 v
(I) lUitA wader laceat4iv System: 51Considers preliminary results for 45 uaits. thite siti pe.diae documete: 6 (FCCCL. WL; PACO. Mdah Traclue. Millet Tractors. Ibtioal Dtora; SEC: Ponar Steal; PEIAC; PLC)Whte grded: 45
PAKISTAN; 61596 CF Pe(0sSC1 EVALUITISI FIR TlE PUIDD 1963-1906;Ah1IEVO4T OF FIAl. ORAE IOT CWMTION
1963/1964 1064/1905 1905/1966 (1)CRPPATIOI .--------------------- --------------------------------------
A 0 C D E SF-TOTAL . A C 0 E 9-TOAL A a c D E 8-TOTA
Fadra* Chemical A Caresica Corp.(FCCCL) 20.57 0.00 50.00 0.00 23.53 24.29 0.00 0.00 60.00 33.33 33.33 23.21 16 7S 25 00 14.29 0.00 27.75 22 .National Fertiliser Corporaio IFC) 14 29 0.00 25.00 20 00 5.00 12 20 25.00 11.11 20 00 33.33 0.00 10 71 25 00 25 00 34.29 0.00 0.00 13 35PabisteAt Atoaobile CorPoratio. (FACO 20 57 50.00 12.50 0.00 11 76 17 07 33.33 22.22 0 00 33 33 11.11 17 00 6 25 0 00 26.57 0.00 5 S 6 6Phiatarn industrial Develop Corp. (PIOC) 0 00 0 00 0 00 0 00 5 00 2 44 0.00 11 II 0 00 0 00 3.70 3 57 S 25 0 00 0 00 0 00 6.67 6 eState Caet Corporation (SCCP) 14 29 25 00 12 S0 s0 00 17 65 24 39 i6 67 5S 56 0 00 0 00 15 52 21 43 31 25 25 00 28 57 0 00 22.22 26 6Sstate En narrn Corporate.r (SC) 0 00 25 00 0 00 0 00 35 29 17 o0 1i6 7 0 00 20 00 0 00 22 22 16 07 6 25 25 00 14.29 0 00 27.76 1 t,Saa.t,Ola.a "fini a Patroch (FPiAC) 14 29 0 00 a 0o o 00 0 co 2 44 6 33 0 00 0 00 0 00 3 70 357 6 25 0 00 0 00 0.00 0 00 2 2Ta.6.1 nchi c Corporat.o5 (INC) 0 00 0 00 0 00 0 00 0 00 0 00 0 00 0 00 0 00 0 00 7 41 3ST 0O00 0.00 0.00 0 00 0.00 0I D
518-TOTAL0 100 1to00 1O00 10t000 10000 100 00 100.00 100 00 100 00 100.00 100 00 10 00 100.00 100.00 100.00 0 00 10 00 100 0t
(1) LitIe .nd.r Incent-e Ssata. SIConrids,& pral.a.nar, ra;lta for 45 wnale. Unite 0uth pendung doc.aante . 6 (FCCCL: NFL; PACO. Mack Trucks Millet Tractors. Matienal Motora; SEC. P.oneer Steel PWSAC: # C)Unte graded; 45

-16-
III. IMPACT ON PERFORMANCE
A. Methodology
To judge the impact of the system on performance, we looked both
at quantitative measures and qualitative evidence from interviews with
managers and officials. The quantitative assessmiient relies principally on
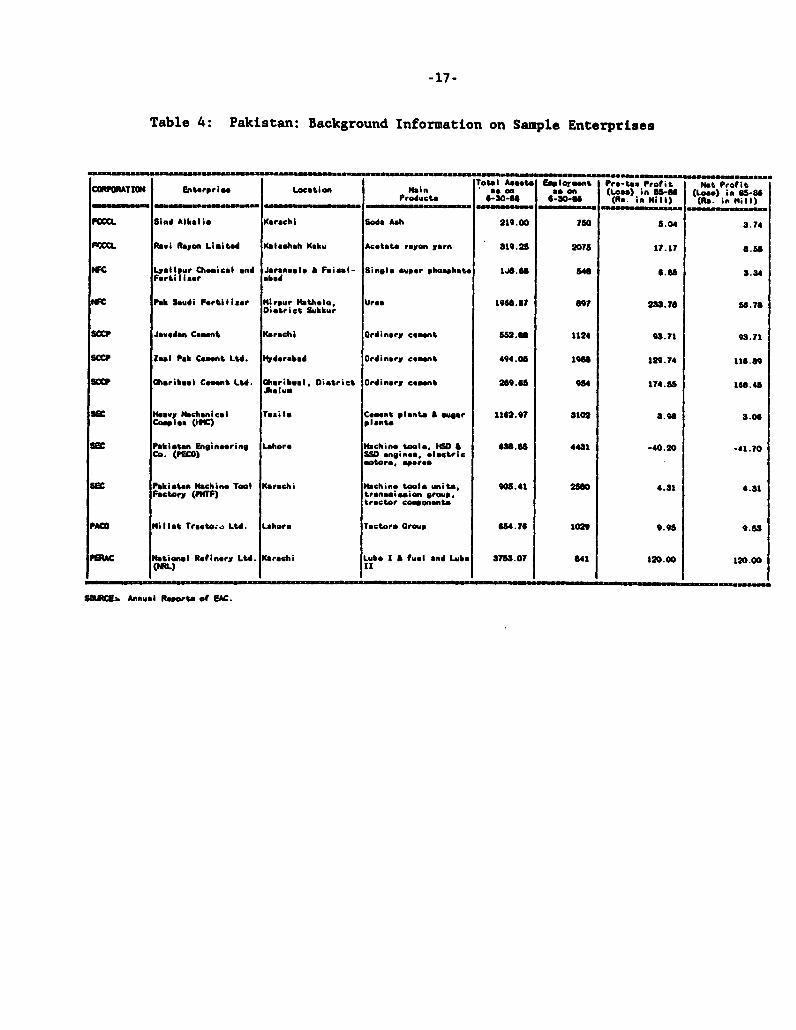
a detailed analysis of a sample of 12 enterprises chosen from the six
larger corporations. (See Table 4 for background information on these
companies). The original intention was to compare enterprises inside and
outside the system. Unfortunately, the IPEs outside the system under the
MOP are smaller and tend to be the worst performers. The mission was
unable to gather sufficient comparable data on private enterprises to
compare their performance with similar IPEs. Without this control group we
were unable effectively to isolate the system's impact from other
influences on IPE behavior. Instead we attempted to examine other
plausable factors which could e%-lain any improvement in performance and to
determine whether these were sufficient to rule out the influence of the
signalling system.
-17-
Table 4: Pakistan: Background Information on Sample Enterprises
Total Aaeta Eulozrnt Pro-tox Profit Not Prof itCOPORATION Eseterpriae Location Main cc6 an sea an (Loa") in WOOU (Loas) in 65-84Products 6-30-41 6-30-64 (Re. in NellI) (me. en NellI)
RXtL Sind Alkali. Karachi Soda Ash 219.00 760 5.04 3.74
FLXM Ravi Rayon Lisited Kaelshch Koku Acetate rayon yarn 319.25 2075 17.17 8 gS
ec aLyllieer ChoCieal and Jaranual. A Faisal- Single aupor phoaphate l.JS" U 4 16oS S4F.tiliaer abad
W#C Pak Saudi Fertiliear u MaUeale, Urea 194S U497 233.S sJ67SOistrict Sulekur
saCa Jvedan C-aent Karachi Ordinaey ceaent 652.0 1124 98.71 93.71
SCCP Zeal Pak Ceeet Ltd. Hdorabad Ordinary cadent 494.05 19" 129.74 1164.9
IICCP (Saribeal Cent Ltd. Gheribaal. Ditrict Ordinary eaent 209.6 94 174.85 168 45Jhalum
SEc thMvy mechanical Taaila Ceent plenta A auger 1162.97 3102 3.9S 3.0JCouple. (IIC) plants
Psakitan Engineering Lahoro machine toals. "eO a 634.08 4431 -40.20 -41.70Co. (PECO) SSW engines. electric
sotora spaces
3C Pakhistan Machine Tool Karachi Machine tool- units. 908.41 2860 4.31 4.31Factory (FiTF) traneo;ision group.
tractor co_onente
PACO Millet Tracto;a Ltd. Lahore Tectore Group 634.74 1029 9.98 9.6S
Few Mational Refinery Ltd. Karachi Lube I A fwel and Lube 3758.07 541 120.00 120 00(Nn L) 11
XSOUCIE; Afnu4nl Reprts of EAC<

-18-
In judging the sample enterprises we looked at their periormance
in terms of the main target indicator -- private profits after tax -- and
in terms of public profits in constant prices. Public profits in constant
prices measures net real benefits -- i.e., efficiency improvements. It is
the equivalent of a quantum index of outputs minus a quantum index of
inputs and gives a trend similar to the trend in total factor productivity.
This enabled us to isolate the influence of pricing on results and to judge
whether there had been any efficiency gain in addition to any financial
improvements. Thus we were trying to answer two questions: did the system
have an impact on private financial profits (its explicit target)? and on
efficiency (its underlying goal)?
B. Quantitative Evidence
Current Priced Profits. Incentives are awarded principally on
the basis of private profits after taxes in current prices. On the basis
of that indicator IPE performance generally has improved. Thirty three
IPEs were in the system for its entire three years of operation, of which
19 (or about 58 percent) improved their private profits after tax, from 100
million Rupees in 1982/83 to 617 million in 1985/86. Fourteen showed a
deterioration from 445 million Rupees to 67 million. Thus the majority of
these IPEs show an improvement in the main indicator being measured by the
targeting system. After 3 years the total profits of the 33 IPEs in the
system was almost twice what it had been before the system began:

-19-
Table 5: Summary of Performance of IPEs in Systemfor Three Years: Profits(Millions of Rupees)
1982/83 1983/84 1984/85 1985/86
33 IPEs in system forthree years. 344.14 467.16 937.81 684.00
19 IPEs with profitimprovements. -100.75 221.08 717.45 616.74
14 IPEs with profitdeterioration. 444.89 246.08 220.36 67.32
Source: Table 3 of the Statistical Appendix.
The sample enterprises show a similar trend. Five of the 12
improved their profits after tax from the system's introduction in 1983/84
to 1984/85 and seven show an improvement to 1985/86 (based on unaudited
data for 1985/86, see Graphs 1-12 of the Statistical Appendix.)6
Moreover, the sample enterprises with passing grades increased from 6 in
1982/83 to 7 in 1984/85 to 9 in 1985/86 (See Table 3 of the Statistical
Appendix).
Constant Priced Profits. Of course, if the aim is to improve
efficiency and if efficiency improvements are defined in terms of increases
in net real benefits, then increases in private profits are not a good
6/ The five IPEs are Lyallpur Chemicals, Javendan Cement, Zeal PakCement, Pak Machine Tool Factory (PMTF), and National Refinery Ltd.(NRL). The seven are these five, plus Sind Alkalis and GharibwalCement.

-20-
measure. Increases in public profits in constant prices come closer to
indicating efficiency gains for most firms and that is used as a measure of
efficiency improvement in this report. Data on public profits in constant
prices are only available for all the sample for 1980/81 to 1984/85, which
covers just the first two years of the system's operation.
In 7 of the 12 sample IPEs, public profitability in constant
prices increased above the 1982/83 level in the first two years of the
system (See Graphs 1-12). These seven include four for which the increase
is also an improvement over past performance (borne out by comparing real
value added for 1983/84-1984/85 with a trend line based on
1978/79-1982/83): Sind Alkalis, Lyallpur Chemicals, PMTF, and NRL. All
four also improved private profits after tax. The other three enterprises
in this group improved efficiency over 1982/83 but were still below their
past trends (Pak Saudi, Javedan Cement and Millat Tractors). One company
(Zeal Pak Cement) shows a sharp deterioration from past efficiency trends
in the first two years of the signalling system. A scorecard on how the
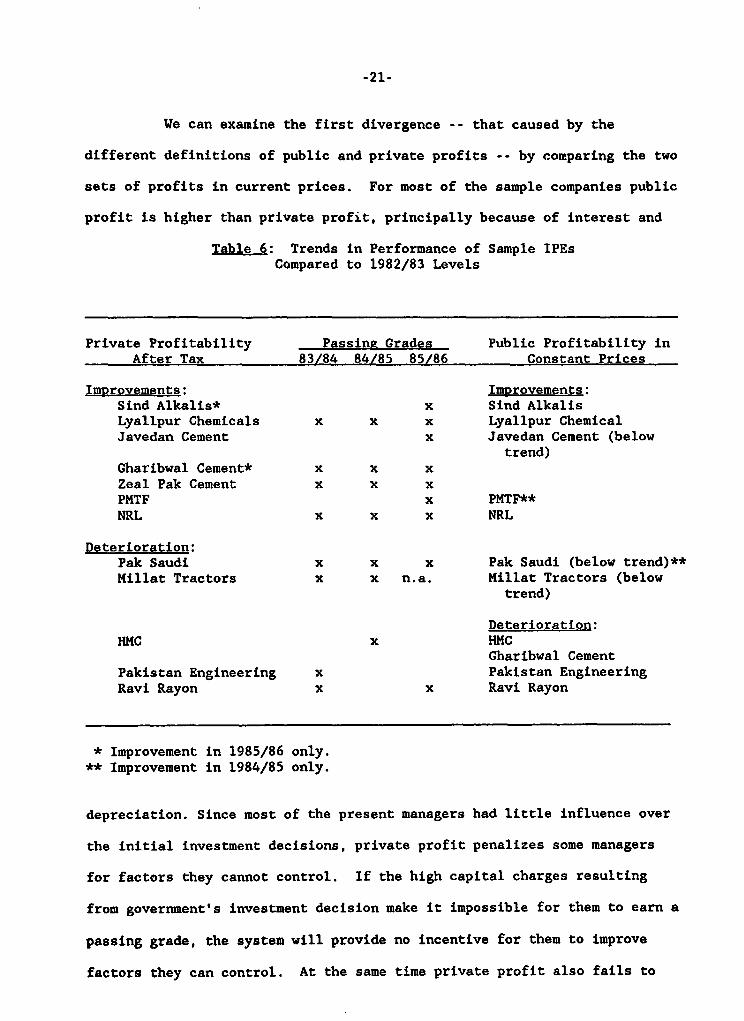
companies performed on the two indicators -- private profitability after
tax and public profitability in constant prices -- is shown in Table 6.
Some of the enterprises in Table 6 show opposite trends in
private profitability and public profitability at constant prices. This
occurs, first, because private profit contains items, such as nonoperating
income, that do not move in parallel with efficiency gains and that are
excluded from public profits, and second, because of administered prices.
-21-
We can examine the first divergence -- that caused by the
different definitions of public and private profits -- by comparing the two
sets of profits in current prices. For most of the sample companies public
profit is higher than private profit, principally because of interest and
Table 6: Trends in Performance of Sample IPEsCompared to 1982/83 Levels
Private Profitability Passing Grades Public Profitability inAfter Tax 83/84 84/85 85/86 Constant Prices
Improvements: Improvements:Sind Alkalis* x Sind AlkalisLyallpur Chemicals x x x Lyallpur ChemicalJavedan Cement x Javedan Cement (below
trend)Gharibwal Cement* x x xZeal Pak Cement x x xPMTF x PMTF**NRL x x x NRL
Deterioration:Pak Saudi x x x Pak Saudi (below trend)**Millat Tractors x x n.a. Millat Tractors (below
trend)
Deterioration:HMC x HMC
Gharibwal CementPakistan Engineering x Pakistan EngineeringRavi Rayon x x Ravi Rayon
* Improvement in 1985/86 only.** Improvement in 1984/85 only.
depreciation. Since most of the present managers had little influence over
the initial investment decisions, private profit penalizes some managers
for factors they cannot control. If the high capital charges resulting
from government's investment decision make it impossible for them to earn a
passing grade, the system will provide no incentive for them to improve
factors they can control. At the same time private profit also fails to

-22-
motivate managers to use wisely factors they can control by not measuring
these items, notably working capital. And the inclusion of non-operating
income allows an enterprise to achieve its targets thanks to windfall
income that has little or nothing to do with efficiency. For example,
three of the 12 sample IPEs had public profits in current prices that were
lower than private profits in 1984/85; in fact public profits were
negative. In two cases (PECO, and PMTF) this was due to the opportunity
cost of working capital, which exceeded profits even when interest payments
and depreciation were added back in. In fact PECO went from E to C grade,
despite a large build up in accounts receivable, thanks to government debt
relief in the form of other financial income. The most extreme example of
the distortions that can be caused by using private profitability as a
target occurred in the case of HMC, which made the A grade in 1984/85 only
because of other income (principally, interest on deferred credits on sales
overseas).
In most of the sample firms, the difference between public and
private profits is in the level of profits not the trend. With the
exception of PECO, the trends in public (current priced) and private
profitability do not dramatically diverge. The trends in current and
constant priced profits do differ sharply for most companies, showing that
prices are the main reason for the differences in the first and last
columns of Table 6 (see below).
Explanation of the Sample's Performance
As mentioned, since it is impossible to establish a clear
causality between the performance changes and the signalling system, we

-23-
tried to consider all other possible explanations of performance to see if
they left room for the system as a factor. The main explanations include:
(i) changes in pri-es; (ii) changes in the macroeconomic environment; (iii)
changes in markets; (iv) changes in IPE liquidity positions; (v) changes in
management due to changes in the supervisory environment of the IPEs and/or
the signalling system. Other possible explanations which were rejected
because they do not fit with the circumstances are: a drop or rise in
labor unrest (no significant change occurred); improvement or deterioration
in the supply of inputs or services such as electricity, water, transport
(IPEs experiencing problems saw little change); technology change (there
were no significant changes in the technology used in the sample
enterprises during this period). Changes in liquidity was another
explanation that was considered and rejected. Levels of liquidity are low
in most of the sample firms and showed little improvement during 1983/84 or
1984/85. (See Table 16 of the Statistical Appendix.).
Additions to capacity were also not significant during this
period: it was government's policy to curb new investment in the IPEs.
Only two IPEs show any major increase in fixed operating assets at constant
prices from 1982/83 to 1984/85: Millat Tractors and NRL. Assets of the
other IPEs rose by only 2.7 percent on average during this period. In the
event, capacity change is corrected for by including fixed operating assets
in the denominator of public profitability. (Millat Tractors and NRL show
a deterioration in public profitability in both current and constant prices
in the years when fixed operating assets increased more than profits).

-24-
Changes in Prices
The prices of four of the corporations under the MOP -- cement,
fertilizer, petroleum and automobiles -- are administered. Moreover, quite
a few of the companies are buying inputs, such as petroleum or electricity,
at prices which do not reflect the true costs of production to society. As
Graphs 1-12 show, the level of public profitability in constant prices
diverges widely from public profitability in current prices for most of the
sample IPEs. In six cases the IPEs show the opposite trend in current
prices from the constant price trend. In two of these the price effect is
positive: increases in administered prices explain why Gharibwal and Zeal
Pak Cement could improve their financial profits while efficiency
deteriorated. Prices had the opposite effect on Pak Saudi Fertilizer and
Millat Tractors, which showed modest improvements in efficiency that were
cancelled by adverse price effects. In 1983/84 HMC also improved its
constant priced profits while its current priced profits declined. In this
case, it was because the company's market for higher priced products (such
as turnkey cement plants) deteriorated and HMC shifted into lower value
items such as galvanized steel structures.
Pricing has clearly affected the extent to which targets reflect
efficiency. For the two years for which constant priced figures are
available (1983/84 and 1984/85) the probable grade of the sample companies
based on public profits in constant prices differed from the actual grade
awarded in 14 (out of 24) cases. For example, Lyallpur Chemicals made a C
in 1983/84 on its private profitability target, but would probably have

-25-
been an A company in constant prices. The following year it was an A
company but would probably have made a C in constant prices.
The EAC has made some effort to adjust its targets for
administered prices. For example, the achievements of two sectors with
administered prices, cement and fertilizer, are calculated on the basis of
the budgeted (the so called retention) price that was used to determine the
original target, even through the actual retention price given to the
company was higher. This, however, only corrects for the pricing problem
on the output side, not the input side. The EAC has also added some
nonprofit targets but these do not appear to have improved the capacity of
the system to measure efficiency. For example, Zeal Pak Cement earned a C
grade in 1983/84 on a combined target of private profitability (40%) and
volume of production (60%); it earned an A grade in 1984/85 on a target of
profitability (60%); production volume (30%) and productivity (10%). In
contrast, Zeal Pak's efficiency (public profitability in constant prices)
fell sharply in 1983/84 (a 3% increase in output was offset by a 60%
increase in inputs in constant prices) and stayed about the same in
1985/86.
In summary, pricing changes explain the trend in financial
profits (both up-and downwards) in six cases, but not the efficiency
changes.

-26-
Changes in Markets
Competition could explain an improvement in profits and
efficiency if the IPEs react to competitive pressures by working harder to
cut costs, expand production, improve quality, etc. in order to retain or
expand their markets. If, in contrast, the IPE cannot or will not respond,
the result will be a deterioration in performance. Competition increased
in Pakistan during the period under review, thanks to trade liberalization,
easier private entry into previously public activities, and the earmarking
of credit for the private sector. And competition has had a favorable
impact on some public firms which are striving hard to improve efficiency
and retain their market. (Petro Carbon, which is not part of the sample,
is an example.) However, competitive pressure does r.3t seem to be the main
explanation for the efficiency improvements in the sample firms. Some of
these firms, such as HMC or PECO, have faced competition since before the
period under examination. Others, such as the fertilizer plants and the
refinery, faced no change in competition but nonetheless showed efficiency
gains. In most cases where IPEs have faced an increase in competition the
result during the short period under examination has been a deterioration
in performance.
An example is cement. Pakland Cement, a private cement plant,
began operations in 1982/83 and immediately established new standards of
quality control, marketing and timely delivery. Pakland's nearest IPE
competitor, Javedan Cement, improved efficiency in the period under review
although it is still below past trends. The other two cement plants in the

-27-
sample, however, showed declines in efficiency. The public cement plants
have a long history of operating in segmented markets and it may take time
for them to react to competition by improving efficiency. Moreover, for
competition to have a positive impact on efficiency the enterprise must
have management with the capacity, autonomy and capital base to respond.
This is often not the case for the IPEs; autonomy in particular may be
insufficient (See Section D.)
In addition, liberalization has shifted demand in ways that make
it difficult or impossible for the IPE to respond. An example of this is
Ravi Rayon, a poor performer in both current and constant prices. Ravi
Rayon has been having trouble for some time competing with polyester and
its problem worsened with liberalized imports of viscose (a direct
substitute for rayon).
In sum, increased competition is not a major factor explaining
the improvements in efficiency but it is a reason for the deterioration in
results in some cases. Since it is the improvement in performance that
most interests us, we must look for other explanations.
Macroeconomic Changes
Changes in the macroeconomic environment could explain some of
the performance trends. The first year of operation of the signalling
system, 1983/84, was not a buoyant one for the economy; GDP grew by 4.4
percent in real terms which is well below the average of about 7 percent in
the 1970s and early 1980s. GDP grew by 8.8 percent in the second year of

-28-
the system, 1984/85. The trend in public profits, however, are not well
correlated with the movement in CDP. Only three (Pak Saudi Fertilizer,
Javedan Cement, and Pak Machine Tools) show a slack growth in constant
priced profits in 1983/84 and an acceleration in 1984/85.
On the other hand, the easing of import restrictions, reflecte'
in a 22 percent real growth in imports in 1983/84 and 7.1 percent in
1984/85 could be a more important explanation. For those IPEs which are
supply, not demand, constrained, greater access to imports could make a
real difference in their output. This explanation does not suffice,
however, because most IPEs lack the capital to take advantage of import
opportunities (see below).
Changes in Management
In several of the sample companies, the improvement in
performance seems to be explained in large part by management changes.
This is especially true for the four companies which show efficiency gains
above their past trends. Probably much of the improvement in the
performance of Sind Alkalis can be attributed to a change in the management
team at the start of the period. In other cases the same managers strove
harder to curb costs and expand output.
For example, Sind Alkalis increased its soda ash capacity
utilization from 38 to 90 percent; productivity improved sharply (see
Graphs 13-25 of the Statistical Appendix); the volume of production went up
140 percent; and gas consumption declined. Lyallpur Chemicals and

-29-
Fertilizer is already above rated capacity and managed to increase
utilization still further while curbing raw material and fuel consumption.
PMTF also improved capacity use somewhat and coped with stagnant demand by
shifting production; it also registered a sharp increase in productivity.
The Refinery, always a good performer, increased its inventory turnover and
kept energy consumption in check.
An important reason for management's greater attention to
efficiency is the general "hardening" of the environment for IPEs during
this period, of which the signalling system is only a component. Top
authorities were reacting to performance indicators (many of which w'ere
being calculated well before the signalling system) with new seriousness
and demanding explanations. Managers we.e being fired for mismanagement.
Subsidies and easy access to credit were curbed. IPE investment funds were
being sharply curtailed. The installation of the signalling system was
itself part of this trend. It is hard to separate these environmental
changes from the performance system in order to judge to what extent the
harder environment by itself was responsible for the efficiency gains. It
does seem likely that the signalling system alone, without these
environmental changes, would not have been sufficient to create the
efficiency improvements.
Conclusion
The argument that the efficiency improvements were partly due to
the system cannot be ruled out since none of ,he other explanations fully
explain the ef iciency improvement. However, it is not fully persuasive

-30-
because the targeting system is not really measuring efficiency and the
system is operating under a number of constraints on its capacity to affect
change. (See Section D below.) Nevertheless, the system may still be
influencing efficiency even though it is not effectively measuring it.
Managers motivated to increase profits, particularly public enterprise
managers, have only so many ways to react. Most of the sample enterprises
are not in a position to change prices or to increase transfers.
Increasing the quantity of output or reducing the quantity of inputs may be
one of the few ways they can react to a profitability target. Such a
reaction seems especially likely in the first years of a performance
evaluation system, before managers become cynical about the flaws in the
indicators or figure out ways to achieve targets without improving
efficiency.
An important feature of the system's impact is the fact that it
was part of the general policy changes mentioned above. The qualitative
evidence described below suggests that the system provided managers with an
added incentive to respond to these changes as well as a tool to rally and
motivate staff. In sum, the system despite its flaws seems to have had a
positive impact on efficiency, an impact that is intimately linked to the
other changes in the IPE managerial environment.
C. Qualitative Evidence
Most managers consulted felt that the system had had a positive
impact on performance, as did government officials. They attributed this

-31-
not only to the targets and bonuses, but also to a number of other,
parallel features of the system: the systematic gathering and processing
of information on performance, the serious discussions of performance in
the negotiations and review meetings, and the resulting better
understanding of the enterprises in the Ministry of Production.
The targeting and bonus system was cited by all managers
consulted, even those critical of the system and those not receiving
bonuses, as a positive development which could be a powerful motivation if
properly handled. Managers of companies which had received the bonus
maintained that their staff was very aware of the target and knew what they
and their department would have to do on a daily and monthly basis to
achieve the A target. SInce the C target is the same as the budget for
most companies and the A and B targets are typically 5 and 10 percent above
that level, it is fairly simple for the IPEs to convert their budgets into
targets. Judging from the enterprises visited, Pakistan's IPEs have
thorough management information systems. Budget achievement and other
indicators are monitored on a quarterly, monthly, weekly and daily basis
for each work unit. Under such circumstances it is plausible that staff
could know what the target means for their unit and where they stand in
achieving the goal during the year.
Even companies which have not achieved the target in the past
seem to be influenced by the signalling system. Petro Carbon, for example,
is attempting to compete against imports of carbon black in a limited
market. It is a small scale, inefficient producer that had accumulated
-32-
R/75 million in losses over seven years. Nevertheless, thanks to
aggressive management and, according to management, motivation to receive
the bonus, the company converted its R/9 million loss in 1984/85 to a R/7.5
million profit in 1985/86, brought down average production costs from
R/16,000/ton to R/9000/ton and expects to earn an A grade.
The MOP has long produced a great deal of information on its
IPEs. The difference introauced by the signa'.ling system is that the
information centers around a few key indicators that are being monitored.
This allows decision makers to focus on achievements plus a few explanatory
variables and helps make sense of a flood of data. Furthermore, it uses on
a weighted comprehensive indicator (private profitability) which reduces
the distortions caused by partial indicators. In addition, information is
now arriving in a more timely fashion. Audited reports used to be received
by MOP one to two years after the end of a fiscal year. Since the
incentive has been linked to receipt of audited reports they arrive on
average within five months, or at most seven. Furthermore, there is more
serious follow up to auditors' comments. If, for example, the auditors'
report states that they were "unable to verify inventories," a team is sent
from the Ministry to investigate and in extreme cases the manager has been
fired. Finally, the kind of assessment that was done in section A above of
the improvement in efficiency and its probable causes would not have been
possible before the signalling system.

-33-
Another important change is that targets are now negotiated
rather than set from above. This plus the fact that the target means
something substantial now -- a bonus -- causes management to treat targets
more seriously. Targeting is more rational and realistic and management
understands the reasons for the target and, with some exceptions, has
agreed to the goal. The main exceptions are the money losing firms that do
not stand a chance of achieving a profit target. Several of these have
refused to sign the agreement.
All enterprises meet regularly (at least twice a year) with the
Secretary of Production, the head of their corporation and the other MDs in
the corporation. The EAC prepares an agenda which is circulated
beforehand. These meetings always begin by following up on any issues
raised during the previous meeting. In particular the Secretary reports on
any commitment he undertook (usually w,th regard to negotiations with other
ministries) and the MDs report on any responsibilities or improvements in
performance that they pledged to achieve in the previous meeting. The
discussions center around a comparison of budgeted and actual performance
provided by the EAC. After the meeting the EAC prepares minutes. Managers
regard being called upon to report on performance before the Secretary and
their fellow managers as effective in motivating them to do better and in
informing the Secretary of their situation and problems. It also helps
them understand their standing vis-a-vis the other IPEs in their
corporation.

-34-
D. Constraints on the System's Impact
Besides the fact the targets are an imperfect reflection of
efficiency, there are a number of factors which could constrain the
system's impact on public enterprise efficiency:
(1) The rewards are not sufficiently large or distributed in
such a way as to motiva.e performance improvements;
(2) Managers lack sufficient autonomy to change performance;
(3) Managers are not competent to respond to rewards with
changes in performance;
4)Some PEs are excluded from the system; and
(5) The macroeconomic environment is not conducive to
performance improvements.
To some extent all of these constraints are operating in Pakistan.
Failure to Motivate Efficiency Improvements
Most managers consulted think that the size of the bonus is
sufficient to motivate their staff. Nonunionized staff have not been
receiving bonuses in recent years and the prospect of a bonus is seen as an
inducement. Not surprisingly, if the firm has once received a bonus, the
motivation to keep or increase the bonus the following year is stronger
than if the firm has never received a bonus. In contrast, a senior staff
member of one money losing firm was not even aware of the existence of the
signalling system. Lower level staff of one IPE that made the A grade only
because of nonoperating income were also not aware of the target.

-35-
The way the bonuses are distributed may reduce the incentive
impact. The bonus is meant to be a management tool that enables managers
to encourage productivity improvements by rewarding better performers. The
way the system is administered in Pakistan has reduced managerial
flexibility. First, all nonunionized staff of an A grade firm receive
three months of salary across the board. Some managers reward lower or no
bonuses to a few individuals that receive a below average merit rating (all
firms consulted have some sort of individual performance evaluation
system); others did not realize that they could reduce the award. But
managers cannot raise the award for an above average individual, nor can
they distinguish between units or departments on the basis of their
performance. It was originally proposed that managers be given complete
discretion in awarding bonuses, but this was dropped in the face of
opposition from MOP, corporations and some managers. Second, unionized
staff receive a bonus (the level is decided by the government) regardless
of whether the firm achieved its target (and with no differentiation among
workers on the basis of merit). Typically the bonus for unionized workers
is a higher multiple (7 to 10 months were cited) than the bonus awarded to
nonunionized staff. (MOP is considering linking workers' bonuses more to
the unit's performance through the collective bargaining process. Third,
the bonus under the system is usually awarded six months after the end of
the fiscal year, which reduces its incentive impact on the following year,
but provides an incentive for firms to submit their audited accounts.
Lack of Management Autonomy to Affect Efficiency
The main constraints on management's capacity to increase
operating efficiency are:
-36-
(i) Inability to lay off labor to cut costs;
ii) Lack of control over compensation decisions;
(iii) Inability to close lines or cut off service to cut
costs;
(iv) Constraints on flexibility in procurement decisions;
(v) Constraints on choice of product mix, markets and
suppliers;
(vi) Lack of flexibility in expenditures requiring credit or
foreign exchange;
(vii) Need to meet government imposed social welfare
objectives; and
(viii) Inherited capital stock.
The first three issues are all related to the power of unionized
labor in Pakistan. The MOP has taken steps to decentralize some personnel
decisions to the corporations and enterprises, such as disciplinary
firings, promotions, and compensation decisions in collective bargaining.
Reductions in force, however, are virtually impossible, so managers cannot
cut costs by laying off workers and closing lines or plants. (The lack of
flexibility in the labor force is illustrated for the sample IPEs in graphs
15 through 36 of the Statistical Appendix.) Managers also have limited
flexibility in controlling compensation. Individual managers can be
faulted for a tendency to give in to labor demands in co'.lective
bargaining, a common trait in public enterprise management where there is
cost plus pricing, easy access to subsidies or cheap credit. But this
tendency is also a reflection of a pervasive attitude throughout the public
sector and a long history of union power in the public enterprises. The
government-enforced bonus system for unionized workers further reduces

-37-
managerial control over labor costs. Because of this, increases in the
wage bill bear little relationship to productivity increases, (as graphs 25
through 36 of the Statistical Appendix show for the sample IPEs). This
situation appears to have gotten worse during the period under review; with
one exception (Sind Alkalis) all the sample enterprises show faster
increases in average labor costs than in productivity during
1983/84-1984/85. In comparison, the majority of the firms show
productivity increasing faster than labor costs from 1980/81-1981/82.
A similar situation seems to pertain throughout the MOP:
Table 7: Comparison of Labor Costs andProductivity Increases; All IPEsUnder the Ministry of Production
(% Change)
82-83/ 83-84/ 84-85/81-82 82-83 83-84
MANPOWER -1.1 10.6 0.2TOTAL LABOR 13.6 19.0 14.2AVERAGE LABOR COSTS 14.8 7.5 13.9PRODUCTION /a 18.6 9.4 5.9PRODUCTIVITY 19.8 -0.1 6.7
a/ At constant 1977/78 prices.Source: EAC
This situation appears to be changing. The MOP has become
concerned about rising labor costs and has begun to stress measures to cut
costs. Managers are now being asked to bargain for reasonable wage level.
and cut costs in overtime, bonuses and the like.

-38-
Procurement procedures also reduce management's flexibility in
cutting costs or seeking new technology. For example, HMC, which produces
heavy equipment, including turnkey sugar and cement plants, must consult
its corporation for all purchases over about $12,000 and if the item is a
capital good it must go for competitive bidding (raw material purchases
over about $118,000 must also go for competitive bidding). This requires
an advertisement, 45 days for placement of bids, and 40 days for study and
selection. The firm is expected to accept the lowest bid. Purchases over
$600,000 must be approved by a ministerial committee and purchases over
about $3 million must be approved by the a high level committee of the
cabinet and approval can take two years. Thus, even if managers feel
motivated to seek out lower cost inputs or to develop new methods of
operation or product lines, they must deal with a sometimes lengthy
bureaucratic procedure that can stifle new initiatives or force the firm to
miss opportunities.
Some of the firms are also constrained in their choice of
markets, products and suppliers. Not surprisingly, import substituting
enterprises (like the Refinery) must satisfy uomestic demand before
exporting. The Pak Suzuki automobile company is required to produce a
certain number of its lowest priced passenger cars and to purchase a
portion of its inputs from another state enterprise. It is hard to judge
if this is a constraint, since most managers are not aggressively seeking
new markets and adapting product mix. Years of operating in a controlled
environment has made them complacent even in the face of rising
competition.

-39-
Government imposed social welfare objectives place another burden
on the IPE that reduces management's flexibility to cut costs. For example
Pak Machine Tools is required to train five people for _-ry one they
intend to hire. Plants located in remote areas at government behest have
to provide education, housing, health services and transportation to
employees as well as bear added transport costs.
The operations of the finanAal system are another constraint on
management. Credit and foreign exchange ceilings are allocated as part of
the budgetary process through negotiations betweeti Lirst, the corporations,
the Ministry of Production and the Ministry of Finance, and then between
the corporations and the companies. There is no reason why thece ceilings
would tend to favor the more efficient firms, especially since price
distortions make it hard to judge efficiency. In other words, the more
efficient enterprise may not be the most profitable one, and a manager
intent on improving efficiency may lack sufficient liquidity or foreign
exchange to make expenditures with high rates of return. A related
constraint is the fact that IPE managers cannot get coverage for their
foreign exchange purchases even though private enterprises have this
facility in Pakistan.
Finally, management is constrained by the inherited capital
stock. Management can still improve operating efficiency within that
constraint, but the task can be considerably harder when the plant is
grossly under or oversized or the equipment is antiquated and worn out.

-40-
Lack of Management ComRetency to Affect Efficiency
A danger in many developing countries is that PE managers lack
the competency to understand the efficiency target or to improve efficiency
in the face of the target. Pakistan is fortunate in having IPE managers
who seem generally skilled and competent. Nevertheless, these managers and
their staff have been accustomed to operate in a protected environment
without the pressures for efficiency that the signalling system is supposed
to provide. If the system were to try to motivate managers on the basis of
public profitability, managers would need to be trained in the rationale of
the profit adjustments. Some may also need training and assistance in
areas that have not been so important in the past, such as in identifying
cost cutting measures, in marketing, and in planning. Deregulation and the
pressureb for efficiency from the EAC have created new incentives for
managers to acquire these skills.
Exclusion of some PEs from the System
In 1985/86 the incentive system was applied to 51 of the MOP's 66
enterprises. The excluded enterprises were mostly small in terms of
assets, employment and revenues (most of the small firms under the Pakistan
Industrial Development Corporation are excluded). In 1987-88 all the MOP
firms are included in the system. But the coverage is in fact not complete
since loss making enterprises are in effect excluded from the system in
Pakistan. Managers of such enterprises tend to become demoralized if they
feel the target is not a realistic one. Some six enterprises made losses

-41-
throughout the three years of the system i A could be considered to be, in
effect, excluded from the system. This would mean that 45 IPEs were
covered by the system in 1985/86, or 64 percent of the total.
Macroeconomic Environment
Finally there may be exogenous factors which constrain efficiency
gains. Depressed demand, shortages of inputs, weaknesses in the
infrastructure, and the like can all make it difficult for managers to
effect changes. These factors certainly operate in Pakistan. For example,
many of the IPEs suffered because of power shortages during this period;
Millat Tractors faced a drop in demand because the Agricultural Development
Bank provided inadequate funds for farmers to buy tractors. PECO suffered
when the Electricity Company cancelled an order for towers. Yet despite
such problems the majority of the sample firms were still able to improve
their efficiency.
E. Perverse Effects on Performance
Performance evaluation systems could motivate short term
improvements in profitability and yet have a perverse effect on long term
performance. The design of the Pakistani system took into account the fact
that if the targets were solely based on short run measures, there would be
a tendency to sacrifice expenditures with short run costs and only long run
benefits. This tendency could be expected to be a problem in Pakistan,
where the average tenure of an IPE manager is estimated to be about three
years. Nevertheless, it was quite rightly decided to begin with a simpler

-42-
system based on short run targets only and to add targets for items like
maintenance or training, and dynamic indicators, such as investment and R
and D, as the system matures and the short-run targeting system is working
well. MOP is also in the process of introducing corporate planning for all
IPEs (and a qualitative measure of corporate planning will be included in
the targets eventually).
There is some evidence that the lack of any longer term target
might already have had an impact on performance. For example, one of the
sample firms (Charibwal Cement) achieved a B grade partly because it did
not carry out its budgeted repair and maintenance program and hence worked
316 instead of 300 days a year. Several managers also worried that their
targets were based at full or more than full capacity operation without
enough provision for more than routine maintenance. EAC makes an effort to
assure that the targets are realistic and allow for preventive maintenance
and also will readjust the target if there is some unforseeable and
unpreventable problem. At the time of the evaluation EAC checks that the
IPE has adhered to the agreed maintenance schedule.
IV. IMPACT OF THE SYSTEM ON GOVERNMENT POLICY
A. Impact on the Regulatory Environment and Pricing
The signalling system gets its name from the notion that it will
signal managers about the behavior that government desires -- and
government about the effects of its policy on performance. Of course the
-43-
first set of signals is the primary purpose of the system, but the second
set could be even more important if government policy is the primary
determinant of performance. In theory the system signals the need for
regulatory reform through the adiustments that have to be made in the
targets to take account of government imposed costs, lack of managerial
autonomy and the like. Proponents of the system maintain that by making
these adjustments explicit the system highlights the cost of distortions,
helping government to make a conscious choice. Furthermore, even if policy
reforms do not ensue, the system motivates managers to operate at greater
efficiency within the degrees of freedom they are given; lack of autonomy
is not accepted as a blanket excuse for inefficiency. Critics of the
system argue that by adjusting for these problems, the signalling system
actually makes it easier for government to ignore tbem. Instead of
promoting reform the system hinders or delays it. The same criticism is
made of price adjustments; by adjusting targets for price distortions the
system reduces the pressure to remove the distortion. But this is only
true in so far as a move to efficiency prices would work in favor of the
manager, a situation that does not appear to pertain to Pakistan. In the
past IPE managers were not held to efficiency targets -- nor were they
lobbyists for reform.
The main constraints on the IPEs mentioned earlier all entail a
cost. Since these costs are typically not directly felt by Government
--they either take the form of foregone taxes or dividends or higher prices
to consumers -- there is a tendency for the trade offs never to be
considered.
-44-
The EAC has not often used its information base to promote
regulatory reform. One exception is a study of labor costs that can be
expected to increase presssures for wage restraint. The EAC adjusts
targets to take into account the constraints on enterprises during the
negotiations, but no formal calculation of the costs implied by these
adjustments is made. For example, the cost to an IPE of not being
permitted by government to make a necessary replacement investment in a
timely fashion would be explicitly calculated for target setting purposes
but would not be analyzed elsewhere. The costs of other constraints, such
as not being able to lay off redundant workers, are treated as a normal
cost of doing business and no adjustment is made to the target. The costs
of meeting government imposed social objectives would not be calculated
unless these change considerably from year to year. Thus, the cost of
training more people every year than an IPE could possibly employ would not
be explicity estimated because such costs don't significantly affect the
trend in operating efficiency. The EAC does produce a diagnostic report at
the end of the year which assess each unit's real performance and can form
the basis for follow-up studies.
Nor has the system been used to illustrate the financial impact
of pricing or other policy changes, either at the enterprise or the
aggregate level. It would be fairly simple to do simulation exercises to
estimate the impact of changas in wages, foreign exchange, electricity
prices, etc. on each public enterprise and on the group.
The EAC was set up for, and is more effective at, influencing
management rather than Government. Further, the decisions about many of

-45-
these policies are not in the hands of the MOP. The Ministry of Industry,
the Ministry of Finance and often the very top levels of Government play a
role in decisions about, for example, industrial policy, the allocation of
foreign exchange or the stance of the public sector vis-a-vis layoffs.
Nonetheless, the EAC could do more to influence the regulatory
environment by making the costs of regulation explicit. It could do studies
of the costs of social objectives, of transporting goods from remote
locations, of delays caused by overcentralized decision making, etc. It
could without too much difficulty estimate the degree to which IPE output
prices are distorted: EAC has calculated the weights of different outputs
and the IPEs are producing tradeables. Determining the subsidy element in
input prices may be more difficult but is also possible; again the weights
are known and studies of efficiency prices for some major nontradeables
(water and electricity) have been done. And it could analyze the impact of
policy changes on individuals and groups of IPEs. In this regard it is
noteworthy that the EAC is developing a Social Accounting Matrix (SAM)
which will show IPE performance and linkages with the rest of the economy
and is expected to be an input into policy formulation.
B. Impact on Decisions to Close or Sell IPEs
The system calculates the operating efficiency (or X-efficiency)
of the enterprises; it is not designed to calculate allocative efficiency
(or whether the investment represents the best alternative use of
resources). In some cases the economic costs of keeping an enterprise
operating -- even at peak efficiency -- may exceed the economic benefits.
-46-
The IPE may be tying up resources in an activity with low, or even
negative, economic returns that could be put to far more productive uses
elsewhere. In some extreme cases where the enterprise has negative value
added at international prices, improving its operations may make matters
worse; society is worse off economically the more the enterprise produces
because the economic value of its output is less than the economic value of
the inputs it consumes. Since prices are distorted in Pakistan the
financial profits of the enterprise do not reflect its true benefits to
society and mask the cost to the economy.
In addition, some of the IPEs appear to have outlived their
original objective or are not able to adapt to the new rules of a more open
market. Managers are in some cases striving to improve the efficiency of
an outmoded plant or one too small or large scale to be efficient. Yet
upgrading the enterprise may yield far lower returns than alternative
investments.
While this is not a problem of the signalling system per se, it
cannot be separated entirely. By focusing on the operations of the IPEs
and not considering the fundamental wisdom of keeping the enterprise alive,
the signalling system may be making matters worse in some cases. The issue
also arises because the EAC seems well placed to assess the net economic
benefits of IPEs. It is staffed with economists and the computer system is
set up to take shadow prices. Without much additional data it could
calculate the financial and economic costs and benefits (taking into
account indirect benefits and externalities) of IPEs that might be
candidates for closure. The EAC's work on corporate planning and the SAM

-47-
are expected to be tools for assessing restructuring requirements within
the sector.
V. SUGGESTIONS FOR STRENGTHENING THE SYSTEM IN PAKISTAN
This review of the system suggests several ways that the
signalling system might be made to work better in Pakistan. First, the
internal operations of the system might be strengthened by changes in the
way the targets are set and bonuses awarded, in the MIS, and in the
technology. Second the system would obviously function better if there
were changes in the environnent of IPEs, including in the autonomy granted
to managers, in the relationship with the labor force, in the decisions
about closures, pricing and competition.
A. ImRroving the Internal Operation of the System
Targets and Bonuses
First, priority should be given to shifting from private to
public profitability and introducing further price liberalization. In
particular the award of bonuses for profits achieved thanks to price
controls or nonoperating i.come seems especially distortionary. Price and
trade liberalization have made profit figures for many IPEs a more
meaningful reflection of efficiency while also increasing competitive
pressures. While this obviates the need to use constant priced profits in
many (not all) cases, consideration should still be given to making some

-48-
of the adjustments to private profits suggested in the original proposal.
Excluding depreciation would eliminate the system's bias in favor of older
companies and the possibility that a manager may be rewarded for purely
accounting changes. Non-operating income should be excluded to avoid
rewarding managers for windfall gains that have no relation to operating
efficiency. Even though taxes have not been an important factor in IPE
profits, the use of pretax profits avoids motivating managers to reduce or
evade taxes or rewarding managers for a change in legislation. Excluding
interest charges assures that the system does not judge managers for a cost
they cannot control; including the cost of working capital judges them for
one they can. Moreover this redefinition of profit following straight
forward accounting practices should be easily grasped by non-economist,
including IPE management, in a way that constant priced profits might not.
Several arguments can be raised against public profitability.
One is that by adding back in taxes, interest rates and depreciation and by
subtracting non-operating income, managers are not motivated to minimize
their charges and maximize their income. While this is an important
argument, the fact is that most public managers cannot control some items
such as interest or age of plant and can manipulate others to hide
inefficiencies (for example, depreciation or non-operating income). Other
indicators of cash flow, liquidity, debt:equity or the like could be
introduced to assure financial solvency while keeping public profitability
as a closer proxy to efficiency. All of these indicators are less likely
to distort the measurement of performance than private profits, and come
closer to measuring what the Ministry of Finance is interested in.

-49-
A second objection to public profits is that using a different
profit concept for public firms makes it harder to compare their
performance with private ones, and hence could impede rather than enhance
competitive pressures for improvement. Yet, rather than hindering
comparison, these sorts of adjustments are often essential to allow
realistic public/private comparisons. Thus, pre-tax profits should be used
to take into account the fact that PEs are exempt from many taxes, while
when they do pay taxes they cannot evade them as easily as private firms.
Similarly, interest charges would need to be added back if public firms
have access to subsidized capital or pay lower interest because of
government guarantees. Depreciation charges would also need to be added
back to avoid penalizing one firm or the other simply because of the age of
its plant and to avoid problems with accounting anomalies. Finally,
nonoperating income is often the home of hidden subsidies in PEs and
subject to windfall gains that have more to do with the PE's privileged
position than its operational efficiency.
Finally, the EAC argues with some justice that the introduction
of a new indicator could confuse management. On the other hand, the EAC
has introduced and changed fairly frequently the partial indicators used in
addition to profits. The analysis of this report indicates that the
benefits of the change may exceed the cost of some initial confusion.
Using unadjusted profits distorted the results and allowed inefficient
firms to make passing grades.
The EAC makes a concerted effort to make up for the deficiencies
of standard profitability by making adjustments in the course of its
-50-
evaluation and by developing partial physical indicators. During the
evaluation the EAC may discount performance because of an increase in
administered prices or a windfall gain in non-operating income. Despite
the fact that these represent realistic and objective adjustments, managers
have protested this "arbitrary" discount and have succeeded in forcing the
EAC to award them their grade on the basis of the original, unadjusted
indicators. The evidence of the sample IPEs indicates that the EAC has had
only limited success in giving grades which reflect efficiency
improvements. A more realistic indicator would avoid this problem and give
a clearer signal to management.
Furthermore, partial indicators of physical efficiency could have
unintended and perhaps even perverse effects. Using these indicators in
combination with profitability double counts certain items and not others.
In some cases this may be intentional (to count energy costs twice as a way
to reinforce the need for conservation). But in other cases the results
seem contrary to the intention: for example, counting the volume of
production plus profitability counts outputs twice and inputs only once and
thus deemphasizes cost control. EAC is aware of this problem. When
recently the Cell was instructed to give explicit targets for four costs
(raw materials, energy, labor, and financial expenses) it chose quite
rightly not to give these an additional weight but to make them constraints
on the profit target. This, however, raises a related problem. Each
additional indicator reduces managements' degrees of freedom; the virtue of
profitability is that it weighs costs versus benefits while leaving
management to judge how best to minimize costs and maximize benefits.
Systems which instruct managers how to minimize costs require a good deal

-51-
more information on the inner workings of the firm and risk reducing
manager's sense of responsibility for the other, unspecified items.
A second recommendation is to explore ways to begin to reward the
managers of firms who reduce losses by improving efficiency or who make
private losses and public profits. One possibility is for government to
assume some of the burden as a payment for costs it has imposed on PEs in
cases where, for example, the PE was undercapitalized. A first step would
be for the EAC to calculate what would have been the costs to (i) reward
bonuses to loss making IPEs that would have made profits under public
profitability in current prices; and (ii) reward bonuses to loss making
IPEs that show a large reduction in public losses, and (iii) to reward
bonuses to loss making IPEs that would have made profits under public
profitability in constant prices. This information is already available
and the EAC has done already a preliminary estimate. For simplicity's sake
this estimate could be done for all IPEs in these categories even through
the actual targeting would exclude a share of these firms. The cost of
giving a bonus to these IPEs is probably small since the number of affected
staff are small and should be easily offset by the increment in efficiency.
It was estimated that if Pakistan's IPEs achieved on average a five percent
improvement in productivity, only about three percent of the increment in
profits would be needed to pay all IPE nonunionized staff one month's
bonus. The MOP is currently considering ways to award bonuses to such
loss-making firms.
Third, bonuses should preferably not be allocated across the
board. While it makes sense to reward or penalize the top management on
the basis of the enterprise's performance, the rest of the staff should
receive a bonus on the basis of their individual and work unit performance.

-52-
The size of the enterprise's bonus pool should be linked to the IPE's
achievement of its target, but not the level of each individual bonus.
There are merit evaluation systems in place in some companies but these
might need to be extended and improved to implement this recommendation.
Fourth, consideration should be given to introducing efficiency
targets especially for those IPEs that face noncompetitive markets, until
competition can be introduced. Managers of the competitive engineering
IPEs are very aware that it is unfair to treat them the same as processing
industries which face a captive market. The solution is not to ease the
target on the engineering firms but to strengthen the target of the process
enterprises. One way to do this is to present the IPE's trend in constant-
priced profitability. Even if this constant-priced profitability is not
acceptable for bonuses, it could still be calculated and reported on as an
efficiency indicator. If possible enterprises should develop targets for
this indicator and their performance should be evaluated as a way of
informing both enterprise and government about the true trends in
efficiency. IPE managers should be informed as to how the efficiency
indicator is calculated for their company as a way of removing any
misunderstanding about public profitability in constant prices. Even if
this is not acceptable the constant price profits could be used by the EAC
as a check on its partial physical indicators.
Also, the kind of analyses done in this report could be carried
out for all IPEs. Divergencies between the efficiency indicator and
current-priced public and private profitability could then be explained in
the EAC reports and begin a revealing discussion of the distortionary
-53-
effects of price controls. This could contribute to the goal of removing
of controls over prices wherever competition is possible and bringing the
prices of tradeables more in line with international prices.
Fifth, an effort should be made to award the bonuses earlier in
order to link performance directly with reward and to increase the impact
on the following year. One way to do this would be not to wait for the
audited accounts, or at least not to wait until the accounts of all
companies in the system are received, before awarding the bonuses. When
the system was instituted, waiting for the audited accounts was an
important way to motivate managers to provide the accounts on time. Now
that accounts are being received regularly and closing year accounts are
similar to the audited figures, it should be possible to use year end
figures. If this is unacceptable, the grade could be annouaced on the
basis of year end figures but part or all or the bonuses only awarded when
the audited accounts are received.
Improving Targeting
The EAC has rightly resisted increasing its size to bring on a
lot of industry specialists just for target negotiations. One way to
improve in depth knowledge of the companies might be to bring in outside
experts from the academic or business communities, as is done in Korea. Or
the EAC might rely more on the technical expertise in the corporations.
There are some problems with these approaches: it could be harder and
slower to reach agreement with a lot of outsiders involved, while the

-54-
corporations have a vested interest in their enterprises earning a good
score. Also the EAC has acquired skills in preparing and negotiating
targets that would be lost if there were separate professionals involved.
Nevertheless, the EAC could use some specialist knowledge, perhaps provided
by a team of advisors brought in on a short-term basis at EAC discretion.
Consideration should be given to expanding the EAC budget for this purpose.
Also the EAC should develop international benchmarks for comparison.
Technology Improvements
The EAC should evaluate the feasibility of replacing the existing
system with one that is more flexible and less costly. For example, a
similar system developed for Venezuela uses microcomputers and a commercial
software package that can be operated by the supervising economists. In
contrast, the present set at EAC uses a minicomputer and requires the EAC
to maintain programmers.
B. CHANGES IN THE ENVIRONMENT FOR IPEs
As noted, environmental changes are an important aspe^t of any
productivity gain. Since the signalling system relies on motivating
managers to increase efficiency, the system is only as effective as the
managers. If management is hemmed in by restrictions or has access to easy
bail outs in the form of government subsidies or guaranteed loans, the
system cannot be effective. Pakistan introduced a number of reforms
parallel with the signalling system which played an important role in any

-55-
efficiency impact it may have had. Ways to further increase the pressures
for efficiency should be sought. First, top priority should be given to
promoting comRetition through further trade liberalization, reducing
barriers to private entry and discrimination against domestic private
producers, and eliminating administrated prices for competitive
enterprises. Second, the decision-making process should be studied to find
ways to increase flexibility as well as accountability by removing the
constraints mentioned earlier. Thus, managers should be given greater
flexibility to cut costs by laying off workers, closing uneconomic lines
and seeking least cost suppliers. Layoffs of redundant workers with
severance pay and redeployment schemes are being successfully pursued in a
number of developing cotlntries. Public companies have also successfully
reduced redundancies by vigorously prosecuting discipline charges and
through early retirement and voluntary severance packages. Similar
measures might work in Pakistan.
In controlling labor costs, managers will need not only greater
autonomy in comgensation decisions, but also Government support for
exercising wage restraint. It makes no economic (as opposed to political)
sense to negotiate an across-the-board bonus for the entire unionized labor
force with no link to performance measures. Obviously, this will be hard
to change, but even linking a relatively small part of the bonus to a merit
system would be an important signal.
The Drocurement rules should be examined for ways to streamline
procedures and increase flexibility. Experience elsewhere has shown that a

-56-
vigorous t 2ost evaluation and auditing systems is more efficient in
controlling abuses than ex ante controls over procurement.
In a similar vein, the constraints on IPE's choice of markets.
products and suppliers should be studied. In some cases, these are
intimately linked to the IPE's privileges. For example, an enterprise
might be required to serve certain markets as the price for its protection
against competition. Such arrangements entail trade offs that are not
always readily apparent. On closer inspection, the net benefits are likely
to be less than expected, or even negative. Where the constraint is
management's own inadequacies to react to competitive markets, the EAC's
efforts to promote more flexible and innovative management should continue.
The administration of credit is another constraint on public and
private efficiency. As mentioned, there is no reason why allocations
should favor the efficient; most probably the reverse is true. As Pakistan
removes distortions and increases the pressures for business efficiency,
the need for a more competitive and flexible multi-banking system will
become more and more apparent.
Third, the Government should consider a hard look at ways to
eliminate some of the social welfare objectives imposed on the firms.
Experience hds shown that PEs are a costly and often ineffective way to
achieve those goals. Furthermore, it is impossible to evaluate the costs,
much less the success or failure, of such welfare programs when they are
buried in the enterprise's accounts instead of funded through the budget.

-57-
For example, it should be questioned whether providing job training by
forcing a PE to train five times the people it needs is the most effective
way to accomplish the goal of increasing productive employment. The
enterprise might be meeting this cost by deferring maintenance or new
product development, which could be very costly for the country in the long
run. Such training is a subsidy to the private sector which would
otherwise have to pay for it, and it is a subsidy that is not being
periodically assessed because of the way it is being funded. It may be
that if the training were not being done for them the private enterprises
would do it themselves. Or it might be done more cheaply through a
training institute. By treating such expenses as nonroutine and weighing
costs against benefits these issues can begin to be addressed.
Fourth, the EAC should do more studies assessing the impact of
maior Rolicy and regulatory decisions on IPEs. Some examples of
potentially useful studies have already been mentioned: the costs of
social objectives, of locating IPEs in remote locations, of delays caused
by centralized clearance procedures and of pricing policies. In
particular, the EAC could develop selected shadow distortions. The EAC
should also consider reporting on the macroeconomic impact of IPEs (their
shares of exports, imports, credit, etc.) and study the financial and
economic viability of troubled enterprises.

-58-
It was beyond the scope of this paper to analyze the corporations
in detail. Interviews with corporate, government and enterprise officials
revealed a weak economic rationale for the corporations. In some cases
they are largely ignored by their enterprises, especially if the IPE is
powerful as is the case with, for example, NRL. In addition, the
corporations have sometimes worked against competition among their
constituent IPEs. For example, the cement companies have not competed
among themselves in the past but have cross-subsidized inefficient
producers. With the recent emergence of private producers, the public
cement firms are acting as a corporate body to be able to compete with the
much smaller independent producers. The role of the corporations needs to
be reviewed in more detail. Either they should become serious actors in
the effort to improve IPE performance -- in which case their own
performance should also be evaluated -- or they should be abolished.
VI. APPLYING THE SYSTEM IN OTHER COUNTRIES
The Pakistan signalling system, for all the flaws discussed here,
represent a major advance in holding managers accountable for performance.
In many developing countries, there is no attempt to develop targets, and
no meaningful reporting on PE results; good managers go unrewarded and bad
managers unsanctioned. As a result, the interest in the Pakistan
signalling system is very strong and a n.umber of countries are considering
introducing something similar, including the Philippines, Egypt and
Venezuela. Korea already has a similar system in place. This assessment
of the experience in Pakistan provides a number of lessons for such
countries about the potential costs and benefits and how to adapt the
system to different circumstances.
-59-
A. Potential Costs and Benefits
Costs
The initial cost of the Pakistan system was US$350,000 to
$400,000. This includes development costs and a mainframe computer system
(with an operational memory of one MB and a fixed disk of 620 MB) with
remote terminals and a tape unit. Table 21 of the Statistical Appendix
presents the organization chart of EAC. Assuming an average salary of
US$300 a month for 17 top level professional staff, the basic operating
cost of the system is approximately $70,000 a year, on $1060 per IPE.
The financial cost of installing and operating the signalling
system in another country may be less than the cost in Pakistan for two
reasons. First, the Pakistani system was the first of its kind and there
is considerable learning embodied in the installation costs. Second, the
system can now be operated entirely on personal computers using easily
available commercial software, which obviates the need for computer
personnel and reduces the equipment costs. The installation costs today
are more likely to be on the order of $75,000 and the principal maintenance
cost would be the salary of one analyst for approximately every ten
companies.
-60-
In addition, since there are no economies of scale -- it is just
as much work to evaluate a small company as a large -- other countries
might be able to reduce costs by focusing on fewer, more important
companies. This was attempted in Pakistan, but because of the bonus
managers objected to being excluded.
Several factors, however, could raise the cost to another
country. First, the Pakistan system was designed to apply to companies
under the MOP: 70 companies maximum. Other countries may aim to include
more PEs; Egypt, for example, is considering eventually extending a similar
system to some 200 industrial public enterprises. This will raise the
initial cost of data gathering and systemization and require additional
staff to operate. Second, the Pakistan system was applied only to
industrial public enterprises. Although the IPEs are diverse, they include
a number of similar firms (for example, ten cement companies, six
fertilizer plants, seven vehicle manufacturers) and many are relatively
simple processing industries with few product lines (cement, petroleum
refining, soda ash). Extending the system to the entire PE sector and
including such diverse enterprises as utilities, transport companies,
agricultural marketing boards, or banks will require additional time and
staff.
Third, and most important, the data on IPEs in Pakistan were good
before the system began. An effort to develop a uniform information system
for the enterprises had begun in 1975/76. By the time the system was
implemented the IPEs had well developed internal MIS; they were already

-61-
being audited by private auditors according to generally accepted
standards; and the EAC was systematically receiving a lot of information.
Notwithstanding this data base, under the signalling system project a good
deal of time and effort went into assuring that accounts were fully
accurate, comparable and received by the EAC in a timely fashion. Each IPE
must prepare cost accounting data according to a uniform system (the
required reports are shown in Table 17 of the Statistical Appendix).
Other countries may need to do a lot more groundwork to improve
the internal accounting and auditing and assure a timely flow of the
necessary data to the monitoring agency. The accounting improvements
required for performance evaluation are also necessary for effective
management and should be pursued in their own right. Of course countries
may also choose to begin with a simpler, less data intensive system than
that installed in Pakistan. This could reduce the start up time for the
information system but it will not obviate the need for reliable internal
accounting. Of course good data are not just a prerequisite for good
monitoring. If a PE's internal control and information systems are not
reliable, then it will be next to impossible for managers to improve
performance, no matter how strongly motivated.
Finally, Pakistan boasts experienced, skilled managers in the
IPEs and well educated and competent economists in the EAC. In recent
years IPE managerial compensation has been competitive with the private
sector and the rate of turnover of skilled staff has been reduced. The
necessary skills are also available in the three countries contemplating

-62-
installing the system. But other, less developed countries will need to
budget more for training and technical assistance. A notable feature of
the Pakistani system is the fact that the EAC staff are not part of the
civil service and their salaries are paid by a levy on the IPEs. This has
been important in enabling the Cell to attract the necessary skills and
could be usefully tried in other countries.
Benefits
The most important potential benefits from the system are:
improvement in the operating efficiency of the enterprises and improvement
in the general contribution of the sector to the economy. How realizable
are these benefits? Not surprisingly, this report has not been able to
provide a definitive answer to that important question. Judging from the
short experience in Pakistan, an improvement in operating efficiency may
result; especially if the performance evaluation system is combined with
other reforms.
The Pakistani system has so far not been utilized to promote the
sort of reforms that would make a broader contribution to macroeconomic
efficiency (which could entail pricing changes, liquidations, deregulation,
etc.), so the premise that the system could contribute to development in
this way is not proven by this case. Nevertheless, the system develops all
the necessary information and analytical tools for such use. There are
indications that it is beginning to be put to this use in Pakistan and in
the long run this could well prove its most powerful contribution.

-63-
B. ProsRects for Realizing the Potential Benefits
The experience in Pakistan offers some guidance on ways to
impr- e the likelihood that the potential benefits can be realized. Among
the factors which influence the prospects for efficiency gains are:
pricing, market structure and the coverage of the system; the supervisory
structure for PEs and the degree of managerial autonomy; and the role of
the labor force.
Pricing and Market Structure and its Implications for Coverage of the
System
There is ample evidence that competition is an important force in
promoting efficiency in any enterprise, public or private. There are many
reasons why competition may not exist in a developing country; absence of
competition is often a reason for creating public enterprises. But in
Pakistan there are instances where the opportunities for competition have
not been fully explored (among public fertilizer or cement plants, for
example).
The signalling system is in a sense a market proxy; it creates
pressures for efficiency that in other circumstances might be supplied by
the market. Of course markets can have many failings, but bureaucracies
may do even worse. And these administrative arrangements prove a weak
substitute for competitive pressures. Moreover, it is the existence of
monopolies and price distortions that complicate the system most and make
it difficult to administer.

-64-
For all these reasons governments will want to consider using
competitive pressures to promote efficiency wherever possible through trade
liberalization, removal of barriers to private entry and discrimination
between public and private enterprise, promotion of exports, etc. In
particular import liberalization is an important way to increase
competition in large scale industries where public enterprises tend to
dominate the domestic market. This will greatly simplify the task of
evaluating competitive PEs, which can be held to a simple profit target at
current prices, and can allow the system to focus more on natural
monopolies such as utilities and railways.1 The latter are usually the
most important in terms of the budget and the rest of the economy;
certainly in Pakistan the inefficiencies of the power authority have had
far more damaging effects on economic growth than that of any IPE.
One consequence of freeing market forces is that some PEs will
not be able to compete. In some cases this may be corrected by changing
management and giving managers the authority to cut costs and seek new
markets or by restructuring the finances and operations of the company.
But in other cases the company may be the wrong size or producing the wrong
1/ Of course competition will still be imperfect and a case could be madefor using constant prices even for fully competitive enterprises. (Forexample, should a manager of an oil company have been rewarded forwindfall profits in the early 1980s?) But in terms of priorities.adjusting the prices of noncompetitive firms is the more important.
-65-
product for present markets. And, as mentioned above, improving operating
efficiency is not enough to insure a net efficiency gain. An important
contribution to the overall efficiency of the sector is to ]iquidate
nonviable companies. This also greatly simplifies the task of monitoring
and evaluation.
Supervision of the Sector and Managerial Autonomy
If governments choose to focus the system more on noncompetitive
PEs, then it might make sense to have a central performance evaluation
system. For one thing, noncompetitive PEs are found along with competitive
ones under the same ministries. For another, many governments lack the
skills or funds to create evaluation units in every oversight ministry.
Furthermore, the Ministry of Production in Pakistan is not a typical
ministry in Pakistan or in other countries. Its role is to supervise the
IPEs under it; a separate Ministry of Industry is responsible for
formulating industrial policy. The typical sector ministry combines these
roles and often does an inadequate job of supervision. Sector ministries
tend to see themselves more as advocates of PEs th&n as their evaluators.
Finally, having a central evaluation unit would help resolve some of the
problems the EAC has in assuming a wider role when that role brings it into
issues that are the domain of other ministries. Thus a central unit might
be better placed to influence the Ministry of Finance to grant competitive
PEs greater autonomy. A central unit could have a broader view of trends
in the public enterprise sector. The Korean experience would be worth
studying in this regard since it covers PEs from all sectors and is
centrally administered.

-66-
A central unit would not necessarily manage the evaluation system
alone; it could draw on expertise of the sector ministries to do the
evaluation. In some large countries it might be appropriate for the
central unit to delegate most of the operation of the system to the sector
ministries or to holding companies if they exist, and to focus on
aggregating information, doing comparisons, maintaining the system,
assuring the quality of the evaluations and conducting periodic checks,
designing improvements, and doing macroanalyses. Smaller, resource scarce
countries are unlikely to have sufficient qualified personnel to staff more
than one or two supervisory units.
An important feature of the Pakistani system is the fact that the
performance evaluation system was not introduced in isolation. The
"hardening" of the managerial environment was an important influence on the
efficiency gains. This implies that the system should be combined with a
sharp cutback in access to funds for investment (at least at the outset),
reductions in subsidies and easy access to credit, decentralization of
authority for personnel decisions and other cost cutting measures, and most
importantly, a demonstrated readiness to fire managers who do not perform.
Strong commitment on the part of top decision makers was an important part
of the Pakistani (and Korean) reforms and is a prerequisite for getting the
system off the ground. The Pakistani experience also shows that the impact
of the system will be constrained by the managers' degrees of freedom.
Autonomy will need to increase parallel with accountability for the
exercise to be meaningful.

-67-
Role of the Labor Force
A critical factor in the operation of the system in Pakistan is
the IPE's inability to lay off workers or effectively keep wage increases
in line with productivity improvements. The IPEs, as public enterprises
everywhere, are not a major source of employment since they tend to be in
capital intensive activities. The cost to the economy is not just the cost
of inflated wages or redundant workers; the wage bill in such capital
intensive activities tends to be a relatively small part of their costs.
More important is the cost of keeping inefficient PEs or unproductive
product lines working to provide employment, and the inefficiencies and
demoralization that bring down productivity in an overstaffed enterprise.
Programs to raise public and worker understanding of the need for reform,
including in some cases plant closures and layoffs, combined with
redeployment and severance pay arrangements will make it easier to
implement a meaningful performance evaluation system.
C. Adapting the System to Other Circumstances
Simpler Systems
The design of the Signalling System is based on some basic and
sensible principles.2 One of these is that targets should be few,
2/ See Leroy Jone, "Performance Evaluation for Public Enterprises",Boston, June 1985.

-68-
comprehensible, and weighted. The reason for this is that the targets are
meant to signal managers as to what government considers desirable behavior
and to allow government to control enterprises on the basis of results, not
their conformity to bureaucratic processes. The targets should therefore
aim to give a clear indication of government's objectives and priorities,
but not second guess management on how to reach these goals. For example,
setting targets for profits and for working capital, inventory levels, and
the like, tells managers not only what to achieve but how to achieve it.
It becomes impossible to then hold management responsible for success or
failure. A second principle of the system is to use indicators that count
all costs and all benefits once and only once. This avoids double counting
and asymmetric counting. Profits have the advantage of being a weighted
indicator of benefits minus costs that meet these principles.
But in couttries where financial data are unreliable, where
profits would need to be calculated in constant or shadow prices to be
meaningful, and where skills are scarce, some simple engineering indicators
coupled with cost per unit of output targets may be a starting point.
These indicators do tend to distort managerial behavior by focusing on only
one aspect of performance (for example, by counting costs and not revenues
you may encourage managers to forego expenditures with high returns). But
the Pakistan case provides some evidence that efficiency could be improved
with a far simpler system. If, as hypothesized, IPE managers responded to
an imperfect target (private profits) with efficiency gains because they
had (or thought they had) no other way to achieve the bonus, then other
imperfect indicators (such as cost per unit of output) might have the same
effect -- at least in the initial years.

-69-
Another way to simplify the system and still give correct signals
to managers is to shadow price a only a few critical items, for example,
electricity, wages, foreign exchange. This simplifies the calculation and
makes it easier to pinpoint and estimate the costs of price distortions and
to identify economically nonviable enterprises. It also gives managers
greater incentive to react to fluctuations in world market prices.
Finally, the system could focus on fewer PEs. The largest
enterprises causing the biggest fiscal drain or with the most linkages with
the rest of the economy would be the logical place to begin. In most
countries no more than 10 to 15 enterprises need be covered. But
Pakistan's experience shows that it may prove hard to restrict the system
to a few PEs, especially if bonuses are given.
The Incentive System
Other countries may wish to give more emphasis to the public
recognition of top performers than Pakistan has. Depending on the cultural
context, the public announcement of grades and the award of medals or other
non-material honors can be more important to top management than the bonus.
Discussions of the achievement of the targets in meetings with permanent
secretaries, ministers and (as in Korea) the head of state has proven very
effective in motivating managers.
-70-
Amount of Macroeconomic Information Generated by the System
Besides performance evaluation, government needs information on
its PEs in order to develop informed macroeconomic policies If the system
is centralized and its scope is broader, then it would be easy to use it
for broader policy purposes. The Pakistani system provides information on
PE production, value added and investment in current and constant prices;
it generates all standard financial ratios and debt information; it gives
volume of production and sales, number of employees, energy consumption,
labor productivity, and the like; and it provides detailed price indices
for items of public production and consumption. Since all of this
information is computerized and standardized, it can be easily aggregated
to provide a complete picture of the trends in a major sector of the
economy for planning and decision making purposes.

- 71 -
AnnexA
EXPLANATION OF TME DIVISA INDEX USED IN THE SIGNALLING SYSTEM
The best way to explain the divisa index is to use a simpleexample of an IPE with two inputs, say coal and oil. Let us assume thatthe price and quantity zonsumed evolve as follows:
YEAR ONE TOEALTWQ YEAR THREEP Q V P Q V P Q V
COAL 1 10 10 2 11 22 2 13 26OIL 2 3 6 2 2 4 3 2 6
16 26 32
P-price, Q-quantity, V-value.
Ignoring year three for the moment, we can determine the trend in thevolune of input consumption with two comon indices, Laspoyres end Paasche,and witb the divisa index. Using the Laspeyros index the base year dataprovides the weights. Thus, if we construct a Laspeyres price index usingyear one as the base year, we are treating oil (P - 2) as twice asimportant as coal (P - 1) and putting a premium on decreasing theconsumption of oil. Applying base year prices to year two would give avalue in constant prices of 15 (1 x 11 + 2 x 2). showing that the quantityof inputs consumed decreased by 6%.
With the Paasche index the last year data provide the weights. Ifyear two is the last year, than we are treating coal and oil as equallyimportant since they have the same price (P - 2). And we show the samevalue in year one as in year two in constant prices (year two price timesyear one quantities of coal and oil. i.e., 2 x 10 + 2 x 3 - 26), showingthat the overall quantity consumed remained the same in years one and two.
A divisa price index uses two year average values as weights. Theweight is thus he value of each item in year one plus its value in yeartwo divided by two. In the example, this would yield:
(V + Vt,l)/2 - WCoal: (18 + 22 )/2 - 16Oil: ( 6 + 4 )/2 - S
Coal in this case is throo times as important as oil. Applying thisweighted average of values to the quantities yields:
YEAR ONE YEAR TWOCoal: 10 x 16 - 160 11 x 16 - 176Oil: 3 x : - 15 2 : 5 - 1j
175 186
showing that overall quantity increased by 6%

72-
If we now add year three the difference between the three indices iseven clearer. The Laspeyres index uses the same base year prices forweights, year one. The Paasche base year changes to year three and we mus;redo our calculations of the prevlous years. Tho dlvisa index uses aweighted average of the last two years and is thus constantly changing.The picture with divisa is now:
Coal - (22 + 26)/2 - 24 and Oil - (4 + 6)/ 2 - 5
YEAR TWO YEAR THREECoal: 11 x 24 - 262 13 x 24 - 312Ol: 2 x 5 - 12 2 x 5 - J0
272 322
showing that the volume of consumptLon increased by 18%. The LAspeyresindex glves an increase of about 6% and the Paasche, 14%.
The advantage of tho Laspeyres ls clearly its simpliclty, but thismust bo welghed against lts dLsadvantage--Lts failure to take account ofchanges in relative prices. The P-asche index corrects for thls, but itsrequires that the series be recalculated with each now end of period and ittends to overstate the importance of price changes. The divisa iscompIicated, but not as burdensome as Paasche, and by using values asweights it takes account of shifts in quantities which mitigate the effectof changes in prices.

- 73 -
PAKISTAN: ASSESSKENT OF THE IDUSTRIAL PUBLIC ENTERPRISEPERFORMANCE EVAlUATION SYSTEN
Statistical Appendix
Tables
1 Chronogram of Activities of the Experts Advisory Cell
2 Comparison of Profits for the Sample Units
3 Profits After Tax and Grades Achieved: IPEs Under MOP
4-15 Profits, Assets, and Profitability of Sample Units
16 Comparison of Business Ratios for the Sample Units
17 Reporting Requirements of the EAC
18 Production Value at Constant Prices of Sample Units
19 Employees of Sample Units
20 Productivity of Sample Units
21 Expert Advisory Cell Organization Chart
Graphs.
1-12 Private Profits After Tax of Sample Enterprises,1°80/81-1984/85
13-25 Production, Employment, and Productivity of Sample,1980/81-1985/86.
25-36 Average Wages Compared to Productivity for SampleEnterprises, 1980/81-1985/86
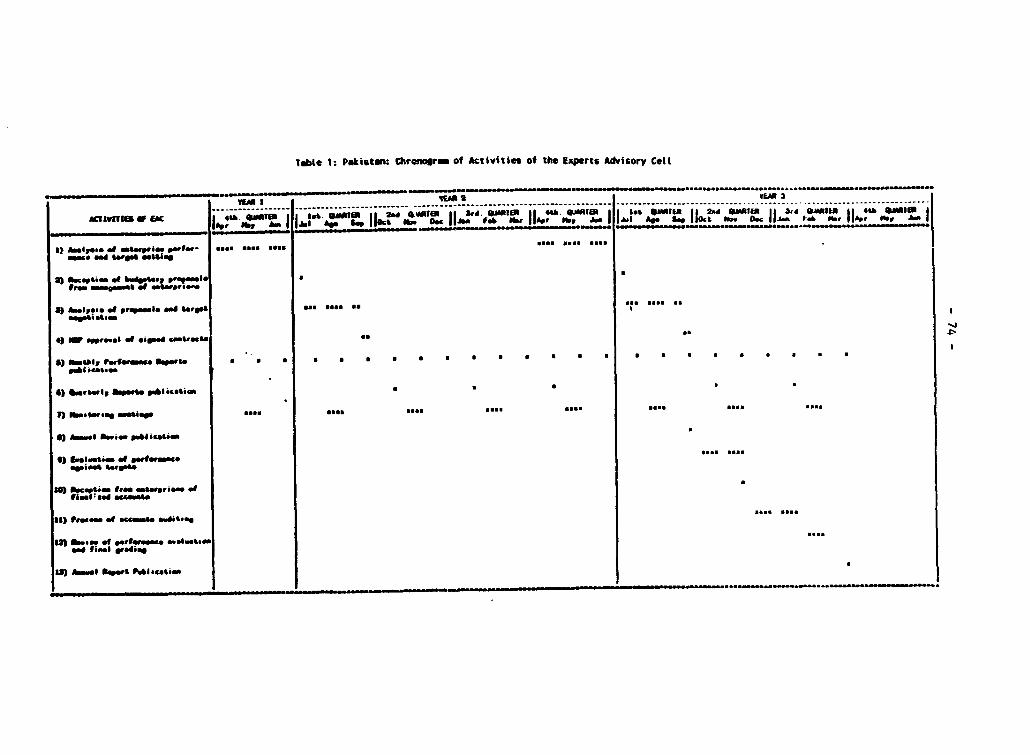
Trte 1: P.kistwn: Chronoarm of Activities of the Experts Advisory Cell
nwuwme e6s ~m~ W l3d 114kS 1.1 S~@'IE V2Rd4 MR!1 '~ .MKI&f l44 l
Zu 8g gl * .....
mac _sa ._I.. .uk..... s.....a.. q-olJ t f_ _W * * ' * * b . . Z . , a 3r. * . g . .Ug I 1*e .AIL .* .WI 3. . LIL .Pm FIs,g, I,.,f i6 " . . . . o
7)_*_@~~~~~~~~~~~~~~~~~~~~~~~~~~s s.... ..... ....... .....
n) |s_ .so So*.ie ,. ad ........sss 5
4) ma mS of "we" 010a503"tIgmepacfaf i ma ad OtI mooa s so I
6) Shmmsewome ,.u eabl..a
103 b.IusI.m of eeufaine a... .....
so A.0 ion aaSa,..i.. of
36 lwPt... Bed scorS.a adlaa..ss
3)aof S.e.eft PI ilAca6 e._lesew of verter i_5 ahade .S

Tabe 2: PakfItan: CorIson of Profits for the Suptl Units(Nhliliofi of E.p.a.)
* ineefls*.aS..5e5 *a. ------ s..aee.se. eene-a.ms. .aesae aa-s.....................see-se..ssee -ee.e.s .e.......newags) 196313564~~le"tte 39411'65 3965/396
,esneesaeeseesc.__-.as. - -------- _.... ..... _*_ ._...... .... a- - -___b_Pringle. Public 95633. Pri.sat Public PublIc Grade Frisate Public PbI.c Creo riat Public Public rad."
13rantan UN!t I Profit. Prtia Prof Frfi to Prfit. Pra; t. Acia.od Prai go Profitse P,of tol Achisad Profl to Prof c. t1Priet Ac,aAft., t* Coaotaat After aet Constant waer Aft. .9 coseut.t eao Alto, at Coestast and"at.a.. C.,:oatk Price. T c.. CorreMt Price* 1acetls Tee.. Current Cries iseaPe te.coot Incatine
(Cwer.f) Pe a;.- (C.rr. P.) P,ice. 0i1m2 Sstom(w) VCur.t ) Price. 01102 Slote(a) (Csrnr.P) Prices 61/12 syst.mat.ee s- _f _* _.5 an _ ___s .es. _ .sse. _ _ ...... sss. ...... _ -e.. _sse sse. a_ _
PC Sed Alblis 03 o1nI .7 0.40 4.56 -. 79 14.6 a 0.0o e.00 427 7a 4 74 A
FCCCL i* Ste. Liatd 1.S5 U8.2 t 8.71 U5.I? 3948 44.33 A 7.72 I2 0. 19.29 E 5.56 A
WC Ltaup.w 4 Ca_. A Petil. 1.97 S.99 la." t o4 sa un.u C 2.0 6.3so sa 92 A S.34 A
Pub usdl P_ rtioiic 202.49 44.U s." 542.18 894.4a 30.26 A 127.41 432.1 412.72 A 30s is C
NW heed.. C*ame S.6 9..s3 36.89 I8.9 61.4s 1.03 a 5.28 77.26 S?.7s a 59.36 s067 71.42 C
17 £6I P" Cannot Ltd. 13.44 S.". -1 1.t0 11.e4 -167.6 C n 8.e 29.5 -154.27 A 17 30 C
SW Motional lest Lfd. 31.45 38.2?7 U.6 10.29 ISU. 56.s7 A 32. is 3.04 s3 94 ea 83 4 30.07 42.64 A
1111C _@ c iSec ee CempS.. 2.09 4.14 49.6? 0." -0.92 403 to 5 36 12 4. 43 709 14 A 4.48
Yc P et.. Geloseriesl Co. 2.63 24.91 132.11 6.1 11 U.48 1n.4 I G." -S." -35.57 C -9 0o E
OKoutfs Seu _b. Too -..t .87 7.90 210." 5 4.79 -43.47 904.04 a S. -27. 72 359 05 E 8 32 C
rmm flit Iroatr., 41.19 47.99 -329.07 418.29 4.20 -210.79 A 40 48 47.82 -221 07 a W.A. -5 e7 I2.2 N.A.
powies Seftfiea 48.61 17.?4 -. U1 46.00 94.49 717.8I A I20.00 1Sd49 .40 o A 320.00 _
OMuM. 1K0.t. for puS3 profil.ts free PE5 varo. Pri.sto efit* 4.t6 (*acept far .2/03) c_rreapee to tb. fl2 4 roe cmeidoer by I_A Icoaati. este yo1(.1 beed -_ disse-d Pei-eto rofit. as Csrrent *e,i.. aft., son.
PUIIStAlM. D.UA1i4i0 C3ImtIA AND 32 AOES IEVW BY TME SMeLE tUITS ,5ee.a 44 eea..se.5. a inese.eeeeasesssa. . eeessa.eeae.easses . ... e..sa...seee.......e.....e..s..........s.e..ss.e.....
36"31396 sea24/1165 * 9513966 310/3611
OUTl goo e ea EraSuet. E. de tes..C ellar Wa.t ntonte WVei Critarie v.hb Crtiteia *;
4cc. 4 ins, e ae Se.... |..e s :ee E* . .s. seaeaeaaa..8 sees.... .e.sea.sa a_ eemrICa. Sied ASlIai. Creg to prafobilltv 3.00 O."0 PrefitAbilltp 040 PrOfit8ailit 0.70PrfdCcllvity 0.3l Ootr0 Sr Comeupiee .0 30 Ptscl Productioe 0.30
FC.I Sesi Rojna Limiled Cheap. la pr.fliteblltg 3.09 Profitability 0.90 Prfitsbi13ty 0.90 PrOfLtobility 1.00Proadcti.e p 0.10 -hrm c.ae mptaem 0.30
C Pu Sed. P.rtlllaa Cheaw In pr fiAbillit 3.00 Preftabill 0.90 Pfditebilitw 0.s0 fretfiili 030r co. eAse1;r& 0.30 E" ri gmauepti 0.20 Physic.Sal psecti. :020
tofc Llallsr be. if Prwt. ca. ia ,.fltreo.he biivtw 1.00 vwftatbiliSw 0 pro,_illty 0.10 PlsgsaicS PO 1lrod"stie;lt 0.3 brw coaOmptieme 0.20 Vtrisbab predckices coa 030
SW .h.de Ci e-b C 3. io pretitabilitg 0.40 Profitability 0.60 Pftalt 0.80o Pre ibltt 060f pr1 .W e. ead eties 0.t feicel rsbl 8 se pedti 0.40 l.icel *reJseUi.e.40
Physicl 0eb 00 :411 Phre netto*C ode 14 tOoiv -a,
Produet&w 0.10 IL", caep- .30
5C_ brlbao Cams" Ltd. Che l. re"tawililt 0.40 preftibititq 0.60 PrefitAilita 060 Profitability 06 gaS-r- oreductia. 0.60 Phlaics Irdct. 030 Pbg3c.S Production 0.40 PSysgicet Prodssctiee 0. 40
PrdAS t 0.30 lcero coaeeepllae 0.30
3C ZaeSnPt bCeasew Led. Osese i. prefitabllme 0.40 ProfitabiSlit 0.10 PraftAbility 060 PtrfitAllitp 0.n0PIpScaS Pre d ion 0.60 Pbr.icef odsctlae 0 30 Phyaell roductlOss 0.30 te<oicel Prdoct;io 0 40
Prodsoct.-tv 0.30 Energ cooauaptls- 0 30
P53 Millet - -acers Chea. i. proile ilOit) 0.90 Profitability 0. 10 N.A. M.A. v A. N.A.Rhmia preductim 0.10 Pts.uei.lrodcctiam 0130
552 ers Ioheasical Camlo.ecag is prof tabilits, 3.00 Profitabllitp 0.9 Profitsbility 3.00 Profimablit hI .410Prods.sbi.ity 0.10
552 Pab.atae Shcbis- Tool ise Profitability 3.00 o rJfltaeility 0.90 ProftabIlty 0.o Pro.fitability 0Prodcti.sity 0310 Energy cesesetlc :. . Prodctisit .10
PK abiatas eseisrioso Co OW..p ia prefitabllity 3.00 Profitobifitv 0 90 Proftatbility 0.90 (C)Producti.i%y 0.10 P.05,9, cosumption a.t0
&A ionel not;lr ChseIs profitability 026 Profitability 025 Profitabili%v 025 Pr@fitability 029Caeit tilleetios 0 6 Plu,aicel Prodoctls 50 60 Pe,ecel Produ.ction 40 Plsriecol productios 0.40CotembI. procaselap ControllMeb procaaoiet Costrollat a processing Cestrollebl. procaesing
*..*ee0of C-4.s 0 3 Par ice of crud* 0.35 CoLon ar, bo~f Crud. 0317 C"%oatr tea of Crud. 03Al-.. , ~~~~~ ~~, ,~~~~. . ~~~~ ~~ #~~~ 3~1 F...,Vr~--.. C V1 . -C.r.c"ato 0 so
55ees.ee~~~. ... fleeesesssseese.ee.ee.se5eee.seses.,..ae.ee*..s~~~~~~~~~. . ~~5ee*** .'. .~~~5Ct**~~ . . . .......... S......e
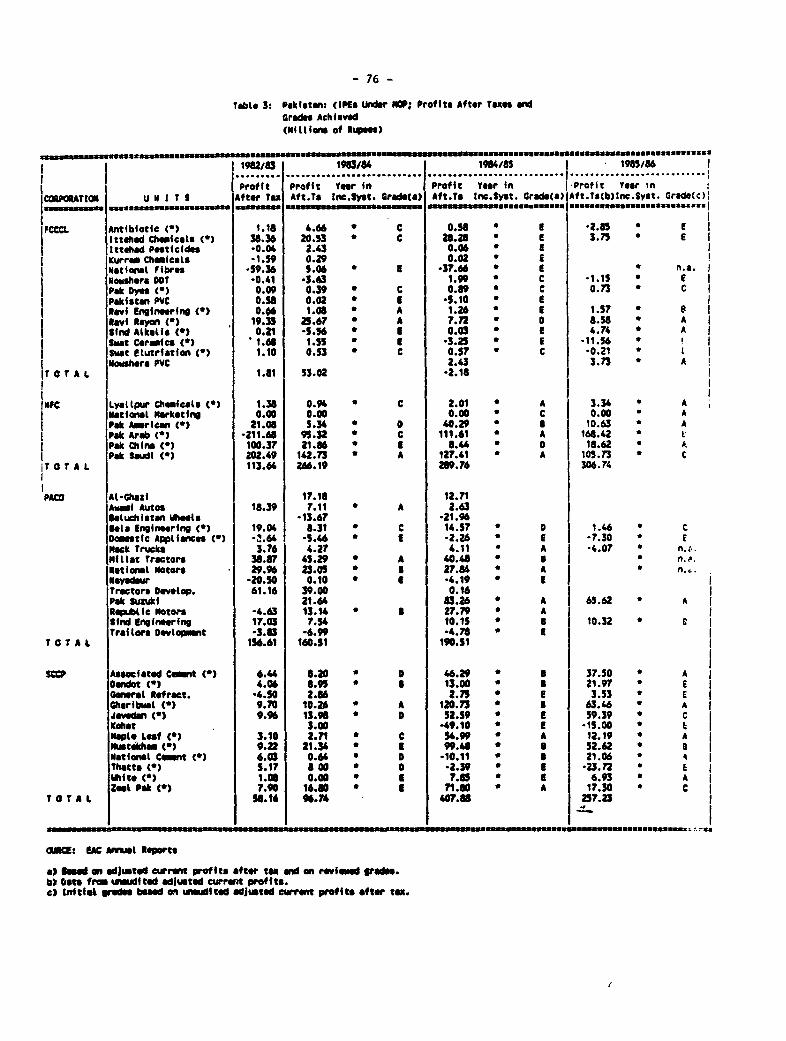
- 76 -
Table 3: Pakiatan: (PEs Under NWP; Profits After Taen andGrade Achieved(Mill§ion of Rupe)
1902/83 1983/84 1984/85 I 1985/85...... ......... ...... ......... ---.......-- ........................... Profit Profit YVer in Profit Year in -Proftit rer inICoRPOtAT ON u N1 I t S After Tax Aft.Ts Inc.3"t. Gradada) Aft.Ts Inc.SySt. Grade(aO Aft.T*cb)lnc.Syst. Grade(e)
IfCCCL Antiblotic (M) 1.18 4.66 * C 0.58 * a *2.85 * IIttehad Chficals C') 38.36 20.53 * C 20.28 * E 3.75 E |Ittehad Pesticide -0.04 2.43 0.06 * aKurron Chlmicals -1.59 0.29 0.02 * INational fIbrez 59.36 5.06 0 -37.66 * a n.a.Nosihera cOt -0.41 *3.43 1.99 * C *1.15 * IPakt " ) 0.09 0.39 * C 0.89 * C 0.73 * cPakistan PVC 0.58 0.02 * I *5.10 * ERavi Enginerfln () 0.06 1.00 A 1.26 * E 1.57 * pv RaZyon M 19.5 25.6rA 7.7 ** 0 8.58 * ASlnid Alktlic M- 0.21 -5.56 * E 0.03a 4.4 A * *St CraM6cs () *1.t 1.55 -3.25 * e 11.56Suat Elutriation M 1.10 0.53 C 0.57 * C0.21Nowhere PVC 2.43 3.n3 * AIT 0 T A L 1.81 53.02 -2.18
INFC Lyallpur Chwicats (t 7 1.38 0.94 * C 2.01 A A 3.34 * AIattalt Marketing 0.00 0.00 0.00 * C 0.00 * APek Amricanf () 21.08 5.34 * a 40.29 * a 10.63 APak Arab () -211. 95.32 * C 111.61 * A 168.42 * tPak China() 100.37 21.8 * E 8.4 * 0 18.62 * AI Pak Saudi () 202.49 142. n A 127.41 * A 10.73 * C;T 0 T A L 113.64 246.19 289.76 306.74
PAW Al-Ghazi 17.18 12.71Awei Autos 18.39 7.11 A A 2.63Ueluchistan Heels -13.67 -21.94Blel Engineering (") 19.04 8.31 * C 14.57 * 0 I 1.46 * CDomstic AWp laces (M) -. 64 -5.46 a -2.26 * e | -7.30 *Mack Trucks 3.76 4.27 4.11 a A I -4.07 0 na..Millat tractors 38.87 45.29 * A 40.48 * *National Notors 29.96 23.05 27.84 * A * f..Nayedgur -20.50 0.10 * -4.19 * ETrwctors DeOvlop. 61.16 39.00 0.16Pak Suzki 21.64 83.25 A 65.62 A AReilic motors -4.63 13.14 0 27.79 A ASlnd Engineering 17.03 7.54 10.15 I 10.32 0 CTraitors Ovtlqmnt -3.83 -6.99 4.8 *8t 0 q A L 156.61 160.51 190.51
SCCP Aocfated C_mt(*) 6.44 8.20 0 O 46.29 * P 37.50 A AOandot (w) 4.06 8.95 0 E 13.00 0 0 21.97 E Enral Refract. -4.50 2.86 2.7 * E 3.53 * Eharibmal () 9.70 10.26 A 120.73 * 63.46 A J nv d -n 9.9f 13.9J 0 52.5rJ a $ 9.39 * C IKIaht 3.00 -49.10 * a -15.00 * 0Maple Laf () 3.10 2.71 c 54.99 * A 12.19 * Abmthmb (a) 9.22 21.34 a 99.48 * 52.62 0 CNatioml Cemnt () 6.03 0.64 * 0 10.11 * R 21.06 *Thatto (*) 5.17 8 00 0 -2.39 * E -23.72 *Whfte o 1.05 0.00 * a 7.85 0 a 6.93 AZol Pak () T."0 16.80 0 71.80 * A 17.30 * ct O t A 58.16 96.74 407. 257.23
aIMC: SAC Alnma Reports
a) lmd an ad|iated currant profits after taxn an reviewed gradsbl Data from Wdited adjusted currant pro Ito.c) lntitA gradea based on wuiited adjusted wrrnt profits after tax.

- 77 -
Tebte 3 cant: Pakistan: IPEc Under NO; Profits After Toxoa
wnd Gradet Achieved(itltions of ftR s)
I I I 19UA I 1983/84 19/85 I t195/6I~~~~~~~~~~~~~~~. . . . . ........................... ...........................
P trofit Profit Veer In Profit Year In Profit Year inICCOP00ATIM U N I VT $ Aftr Ta Aft.Ts InM.Syat. Crade(e) Aft.Ts Inc.Sn t. GroeCa)IAft.Tsaflnc .Sns. :racc(::
I#C _ NP *-6.71 -9.13 .5.42 O 0.03 *I I^C 1-l 0.00 O." * 1 16.73 O I £I Kaureg i Pipe) 7.29 3.50 * a -11469 * a I 2.4 * aI Metrooita Steast (e) 5.21 4.25 * a 11.09 * A 12.55 *I lNorthern Founid. -2.26 0.00 II IPMt (0) 1.01 -4.n . a 3.74 * t I 6.32 * ;I IPIC(o ) 28.61 6.39 * a 5.56 * c I -39.60 * II Pak Swit4her 0.43 0.22 0.6 * U *2.37 * tI Plier steak 1.52 -1.17 * C .0.99 * U . n.o.I Oulity ste 1.51 2.47 * S 3.51 * M 1.15 . -
itO AL 36.91 -1.54 26.22
IPIOC AI-Lib -4.20 -4.47Wm Suar -29.19 -19.36 0.00
Cotton Giming -3.63 0.06 0.25Dir. Forest .43.42 *62.05 I
I * *Nwri Woollen .17.69 24.92 *D2.08 I Irn . teet Pip 2.77 1.70 3.55 * 1.1LwkU &r 29.9 *26.08 -25.10 lt1.25 * owid_ C*) 1.21 1.0 -6 *.52 * 2.17 gW_sot -78.93 -67.84Twta .- 26.34 -30.99
I IrIn 61 Co. 0.00I Karaci as Co. 0.00IT 0 t A L -73.03 -23.3 -216.4
PURA1 lUAU 0.57 0.31 1.06Notiami Petrocarban ~~~~~ ~~~~~~~~~~~~~~~~~~~~~~~~~~~~~~~0.76 0.57 0.73
NI l 3t6r 46.00 * A 120.00 * A .IT 0 t A L 45.02 4.95 121.83
ITtC Textile winding -2.51 -2.01 0.10 * 2I Textite Spiming -13." -10.31 -13.80 * I1T O T A L *16.10 -12.42 .13.70
;lls SA Annal Reprts
a) _am an edjusted eurrent proits after tr end on riewed grads.b) Date frte wtditod adjusted oWrait prof ita.c) Initial grades hO d on H oAdited adjusted wrent protits aftte tax.

TABLE 4SIND ALKALISPROFITABILITY
(Millions of Rupees).............................. ......................................................................... ... ........ ............. .................
1980/81 1981/82 1982/83 1983/84 1984/85................................ ....................................................................... ..... ........ .. . .... ...... ............... ................................ ..... ......... .
1. Profit at Current Prices.........................Private profit after taxes 5.07 6.83 0.21 -5.25 0.03Private profit before taxes 10.57 6.83 0.21 -5.25 0.03Public profit at m*rket prices 13.60 13.71 3.94 -1.83 20.39
2. Profit at constant 1981/1982 prices...................................
Public profit at mrket prices 13.55 13.71 4.79 10.76 34.27
3. Assets
Total assets at Curr. Acw. values 137.23 173.39 197.38 213.91 225.34Net Worth at Curr. Acct. values 48.35 50.06 50.28 44.72 44.75C pital EUp. at Curr. Acct. values 101.69 115.45 105.97 108.18 101.16Fixed Op. Assets at Curr. Acet. values 49.33 74.64 69.47 65.48 139.56Fixed Op. Assets at Curr. Market values 314.77 362.05 398.81 425.40 537.69Fixed Op. Assets at Comstant mrket values 328.39 362.05 364.40 366.64 439.27
4. Profitabitity ^............. ODPrivate: After tax; on total assets 3.69 3.94 0.11 -2.45 0.01Private: After tax; on net worth 10.48 13.65 0.42 -11.73 0.07Private: Before tax; on cap. exp. 10.39 5.92 0.20 -4.85 0.03Public: At curr. kt.Ps on fix.op. assets 4.32 3.79 0.99 -0.43 3.79Public: At cons. ekt.Ps on fix.op. assets 4.13 3.79 1.31 2.93 7.80
tX~~~~uauuUC=gaauua~ 3 DC#Uzm=-- =E * ss====3=-s====333U ==================.

TABLE SRAVI RAYON
PROFITABILITY(Millions of Rupees)
1980/81 191/82 1962/83 1983/84 1964/as
1. Profit at Current Prices.....................
Private profit after taxes 13.07 14.25 19.35 25.67 7.72Private profit before taxes 13.07 14.25 20.20 25.82 16.72Public profit at warket prices 30.40 34.38 33.06 39.51 28.01
2. Profit at constant 1981/1982 prices-.-.. 6s ^*v............... ................. -
Public profit at _rket prices 32.47 34.38 26.77 44.57 25.29
3. Assets
Tota: assets at Curr. Aect. values 311.83 331.24 309.90 307.81 317.7sNet Worth at Curr. Acet. values 60.60 83.73 117.26 117.00 118.90Cqpital Exp. at Curr. Acct. values 193.73 2z3.50 269.39 256.71 245.85Fixed Op. Assets at Curr. Acct. values 76.29 93.14 87.52 123.55 117.84Fixed Op. Assets at Curr. Market values 1040.60 1113.30 1221.38 1344.81 1423.32Fixed Op. Assets at Constant mrket values 1086.74 1113.30 1116.78 1159.69 1165.46
4. Profitability
Private: After tax; on total assets 4.19 4.30 6.24 8.34 2.43Private: After tax; on net worth 21.56 17.02 16.50 21.94 6.49Private: Before tax; on cap. exp. 6.74 6.37 7.50 10.06 6.80Public: At curr. mkt.Ps on fix.op. assets 2.92 3.09 2.71 2.94 1.97Public: At cons. kt.Ps on fix.op. assets 2.99 3.09 2.40 3.84 2.17
U--= = " = # S BUZUE3UUUUUUUUUUUUUUEU33U33 UU3UUUUI BUUUUUUUU EUSUUEUZUUUIUUUUZUSU 33S- 3*33U332

TABLE 6PAK SAUDI FERTILIZER
PROFITASILITY(Iitlions of Rupees)
1980/81 1981/82 1982/83 1983/84 1984/85............ I................................. ............................................................... ...............
1. Profit at Current Prices.........................Private profit bfter taxes 100.78 240.16 202.49 142.36 127.41Private profit before taxes 100.78 240.16 202.49 190.66 197.41Putic profit at mrket prices 348.42 502.48 445.18 394.43 453.21
2. Profit at constant 1981/1962 prices
Public profit at mrket prices 255.57 502.48 320.44 298.70 430.67
3. Assets
Total asets at Curr. Acet. values 2099.59 2276.94 2444.65 2102.60 1950.60Net Worth at Curr. Aect. values 655.45 802.63 892.96 951.13 904.04Capital Exp. at Ctrr. Acct. values 1650.41 1852.61 1838.26 1726.96 1527.28Fixed Op. Assets at Curr. Acct. values 1677.37 1680.27 1552.48 1396.71 1262.73Fixed Op. Assets at Curr. Market values 3684.03 4011.10 4492.21 4831.65 5205.59Fixed Op. Assets at Constant mrket values 3833.94 4011.10 4094.43 4153.43 4241.32
4. Profitability cn
Private: After tax; on total assets 4.80 10.55 8.28 6.77 6.53Private: After tax; on not worth 15.38 29.92 22.68 14.97 14.09Private: Before tax; on cap. exp. 6.11 12.96 11.02 11.04 12.93Public: At curr. *kt. prices an fix. op. assets 9.46 12.53 9.91 8.16 8.71Pubilc: At cons. *kt. prices on fix. op. assets 6.67 12.53 7.83 7.19 10.15
U =.UU= =-U.UU._UCU.:Z=UU8=ZUU 3=38:33 ZinU=C=CC=CC:UU===U=: C S====.= =C-

TALBE 7LYALLPUR CHEMICAL AND FERTILIZER
PROFITABILITY(Ni'iAons of Rupees)
1980/81 1981/82 1982/83 1983/84 1984/15.... ...... .. ........... ............... ............... ............... ......... ...........
1. Profit at Current Prices........... ........................ ..
Private profit after taxes 2.23 -4.21 1.97 2.18 2.01Private profit before taxes 4.17 4.73 4.69 5.29 4.95 Public profit at mrket prices 19.19 6.65 3.29 5.43 6.10
2. Profit at constant 1981/1982 prices...................................
Public profit at mrket prices 3.61 6.65 13.36 58.86 35.89
3. Assets
Total assets at Curr. Acct. values 94.70 92.43 121.36 83.24 87.33let Worth at Curr. Acet. values 12.34 17.61 16.99 15.93 17.94Capital Exp. at Curr. Acet. values 17.27 21.50 19.83 18.26 18.84Fixed Op. Assets at Curr. Acet. values 13.44 12.57 10.65 8.55 7.78Fixed Op. Assets at Curr. Narket values 75.43 82.34 140.06 148.67 155.88fixed Op. Assets at Constont mrket values 80.64 82.34 130.89 131.00 132.17
4. Profitability cn.............Private: After tax; on total assets 2.36 -4.56 1.62 2.62 2.31Private: After tax; on rwt mworth 18.09 -23.91 11.57 13.70 11.t2Private: Before tax; on cap. exp. 24.13 22.02 23.65 28.98 26.26PuklIc: At curr. skt.Pa.on fix.op.as.ets 25.44 8.08 2.35 3.65 3.91Public: At const. kt.Ps.on fix.op.asaets 4.48 8.08 10.21 44.93 27.15
Source: EAC

TABLE 8JAVEDAI CEENTPROFiTABILITY
(Millions of Rupees). . ............................ ............................................................ ... .... ............. ............................ ........... ................... ....
1980/81 1981/82 1982/83 1963/84 1984/85 1985/86
1. Profiti at Curret PricesPiaeroa..... ....... ... 1
Private profit bfter taxes -15.73 3.61 9.96 13.98 16.80 2.5Private profit before tules -15.73 3.61 9.96 13.98 16.80 25.54Pubtic profit at mrket prices S.99 90.81 89.14 81.45 77.'6 80.67
2. Profit at constant 1981/1982 prices
Public profit at mrket prices 87.99 90.81 104.40 58.01 57.63 72.13
3. Assets1I
Total assets at Curr. Acct. values 589.98 608.51 606.49 1 573.27 529.71 552.88 1net North at Curr. Acet. values 86.56 88.47 100.13 | 103.11 106.71 130.30Capital Exp. at Curr. Acct. values 433.86 456.88 393.34 332.67 351.43 345.25Fixed Op. Assets at Curr. Acct. values 463.24 458.52 448.06 415.63 394.02 393.19Fixed 4. Assets at Curr. Narket values 991.50 1090.41 1222.62 1307.13 1386.00 1546.71Fixed Op. Assets at Constant mrket values 1043.93 1090.41 1125.50 1135.44 1147.54 1147.54 |
4. Profitability | * - co.............
Private: After tax; on total assets -2.67 0.59 1.64 2.44 3.17 4.62 1Private: After tax; on net worth -18.17 4.08 9.95 13.55 15.75 19.60Private: Before tax; on cap. exp. -3.62 0.79 2.53 4.20 4.78 7.40 IPublic: At curr. skt.Ps.on fix.op.assets 0.60 8.33 7.29 6.23 5.57 5.22Pubtic: At const. mkt.Ps.on fix.op.assets 8.43 8.33 9.28 5.11 5.02 6.29
So= =:= r3rce= _::_=EAC__
Source: EAC

TABLE 9GCARIBAL CEIENT: PROFITABILITY
(Millions of Rupeos)..... ....... .......... ..................... ................ ................................... ........... ....................... ..........
1980/81 1961/82 1982/83 1983/84 1984/85 1985/86......... ................. ................... ............... ............................................... .................... . .. ...... ...... ............... ....................... ........
1. Profit at Current Prices....... ..........
Private profit after taxes 9.62 13.71 11.46 10.26 8.35 15.61Private profit before taxes 16.49 27.61 19.98 20.76 23.47 21.71 PubLic profit at maket prices 11.86 16.82 13.31 15.59 16.04 10.83
2. Profit at constant 1981/1982 prices
- 51 I
Public profit at m_rket prices 25.21 16.82 21.56 55.15 53.07 I 34.71
3. Assets
Total assets at Curr. Acct. values 194.78 200.97 229.19 254.15 238. 73 289.65 1Net Worth at Curr. Acct. values 76.50 60.27 66.03 68.33 68. 73 84.28|Capital Exp. at Curr. Acot. values 79.68 62.78 67.72 68.76 68. 73 84.28Fixed Op. Assets at Curr. Acct. values 71.50 59.83 66.02 64.89 70.91 69.68Fixed Op. Assets at Curr. Narket values 651.32 692.98 768.90 825.73 882.75 981.54Fixed Op. Assets at Constant m_rket values 686.59 692.98 709.53 719.04 74.40 &4.4
4. Profitability
Private: After tax; on total assets 4.94 6.82 5.00 4.0. 3.50 5.39 wPrivate: After tax; on net worth 12.58 22.74 17.36 15.02 12.15 18.52Private: Before tax; on cap. exp. 20.69 43.98 29.50 30.20 34.14 25.76Public: At curr. mkt.Ps.on fix.op.assets 1.82 2.43 1.73 1.89 1.82 1.10Public: At const. ekt.Ps.on fix.op.assets 3.67 2.43 3.04 7.67 7.23 4.73
Source: EAC

TABLE 10ZEAL PAK
PROFITABILITY(Millions of Rupees)
.................................... ................................................................................ ............... ............................ ...........
1980/81 19B1/82 1962/83 1983/84 1984/85
1I. Profit *t Current Prices ---------........................
Private profit after taxes 12.84 12.88 12.64 15.35 22.61Private profit before t xes 22.84 23.13 12.64 19.73 29.61Public profit at market prices 8.75 13.02 5.53 15.94 25.17
2. Profit at constant 1981/1982 prices............... ......................... .
Public profit at _rket prices 46.62 13.02 -18.30 -167.64 -165.98
3. Assets
Total assets at Curr. Aect. values 399.47 350.66 385.77 456.17Net Worth at Curr. Acct. values 105.87 111.72 112.36 129.16Capital Exp. at Curr. Acct. values 150.93 137.23 121.24 150.30Fixed Op. Assets at Curr. Acct. values 80.72 92.73 128.61 142.67Fixed Op. Assets at Curr. Narket values 1105.61 118t.14 1323.18 1431.86 1492.36Fixed Op. Assets at Constant mrket values 1163.95 1187.14 1221.52 1245.19 1238.16
4. Profitability oo
Private: After tax; on total assets 3.21 3.67 3.28 3.37 n.a.Private: After tax; on net worth 12.12 11.53 11.25 11.89 n.a.Private: Before tax; on cap. exp. 15.13 16.85 10.43 13.13 n.a.Pubtic: At curr. kt.Ps.on fix.op.assets 0.79 1.10 0.42 1.11 1.69Pub4ic: At const. *kt.Ps.on fix.op.assets 4.01 1.10 -1.50 -13.46 -13.41
U iauuuuuu 3333 zggaa.auU:=,33:3:33.u=: 3S=.3-=aS==US--="=st=-==== Q ========C===

TABLE 11MILLAT TRACTORSPROFITABILITY
(Nitlions of Rupees)........................... ............................................................ ...................................................
9P60/81 1981/82 19M2/83 1983/aU 1984U85 1985/86......................... ..................... ............... ............... ........ -------- --------- ---------
I1. Profit I Current Prices
Private profit after taxes 12.92 24.08 41.19 45.29 40.48 9.53Private profit before taxes 27.19 45.92 81.49 93.59 77.72 9.95
Public profit a: mrker prices 9.98 28.46 47.39 54.20 &7.82 -5.47
2. Profit at constant 1981/1982 prices
-- -- I
Public profit at market prices 221.92 28.46 -126.68 | 203.79 -221.87 12.29
3. Assets
Total assets at Curr. Acct. values 257.18 405.72 551.52 571.96 570.54 654.76 1Net Worth at Curr. Acct. values 31.a2 60.74 101.30 139.76 | 181.78 182.89Capital Exp. at Curr. Acct. values 31.82 60.74 128.30 172 .88 199.51 189.64Fixed Op. Assets at Curr. Acct. values 7.38 21.43 24.75 78.98 117.72 123.30Fixed Op. Assets at Curr. Market values 25.09 42.51 51.14 112.19 167.70 202.00Fixed Op. Assets at Constant market values 27.09 42.51 48.16 98.88 140.24 | 153.83
4. Profitability . cc
Private: After tax; on total assets 5.02 5.93 7.47 7.92 7.10 I."
Private: After tax; on net worth 40.59 39.64 40.67 32.41 22.27 5.21
Private: Before tax; on cap. exp. 85.44 75.61 63.52 54.14 38.96 5.25Public: At curr. kt.Ps.on fix.op.assets 39.80 66.96 92.66 48.31 28.52 -2.71Public: At const. skt.Ps.on fix.qp.as eta 819.32 66.96 -263.07 -206.10 -158.20 7.99
_g__zSSIIg===s==a---e=: =_AC________
Source: EAC
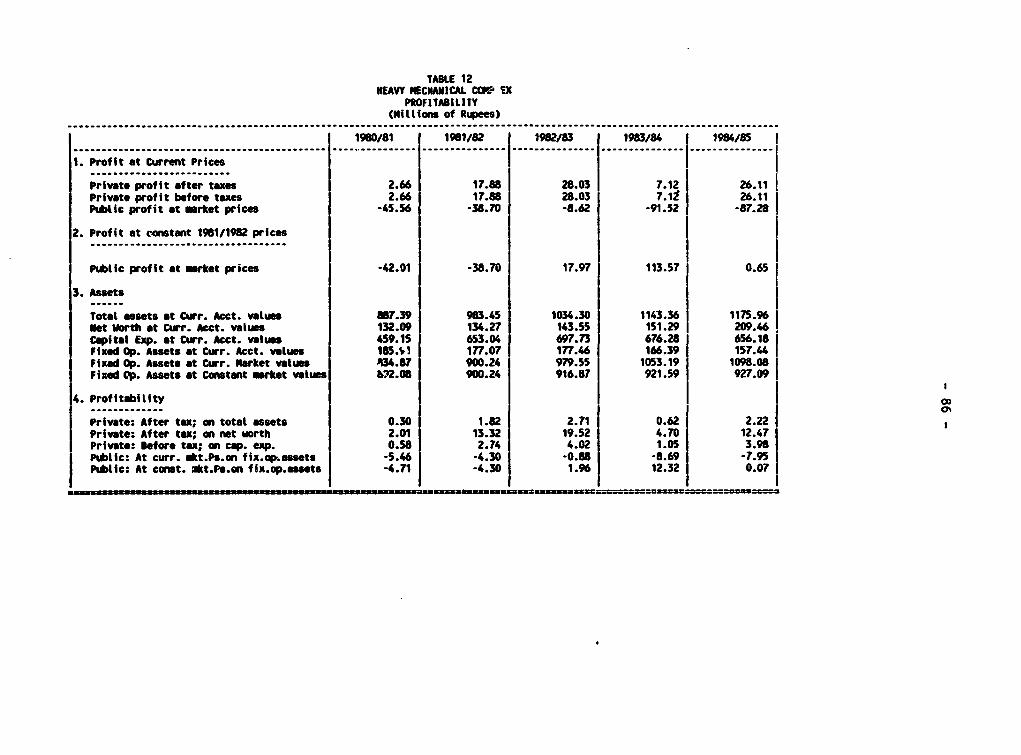
TABLE 12HEAVY MECHANICAL COGP TX
PROFITABILITY(Millions of Rupees)
... .... . .... .. . . . .. . . . . . . . . . . . . . . . . . .. . .. . . . . .. . . . .. . . . . . . . . . . . . . . . . .
1980/81 1981/82 1982/83 1983/84 1984/85................... .................... ..... ... .. .......... . ... ...... .......
1. Profit at Current PricesP..t p....rofit after te-.61682071261Private profit after taxes 2.66 17.88 28.03 7.12 26.11Private profit before t xes 2.66 17.88 28.03 7.: 12 26.11Public profit at inrket prices -45.56 -38.70 -8.62 -91.52 -87.28
2. Profit at constant 1981/1982 prices
Pubtic profit at *rket prices -42.91 -38.70 17.97 113.57 0.65
3. Assets
Total assets at Curr. AcCt. valuas 887.39 983.45 1034.30 1143.36 1175.96Ht Worth at Curr. Acet. values 132.09 134.27 143.55 151.29 209.46Capital Exp. et Curr. Acct. values 459.15 653.04 697.73 676.28 656.18Fixed Op. Assets at Curr. Acet. values 185.S1V 177.07 177.46 166.39 157.44Fixed Op. Assets at Curr. Market values 034.87 900.24 979.55 1053.19 1098.08Fixed Op. Assets at Constant mrket values bV2.08 900.24 916.87 921.59 927.09
4. Profit bitity co
Private: After tax; on total assets 0.30 1.82 2.71 0.62 2.22Private: After tax; on net worth 2.01 13.32 19.52 4.70 12.47Private: Bfore tax; on cap. exp. 0.58 2.74 4.02 1.05 3.98Public: At curr. skt.Ps.on fix.op.essets -5.46 -4.30 -0.8U -8.69 -7.95Public: At const. mkt.Ps.on fix.op.assets -4.71 -4.30 1.96 12.32 0.07
*~= .uuuuauimuunanuuuuauuazmzz3 = =22
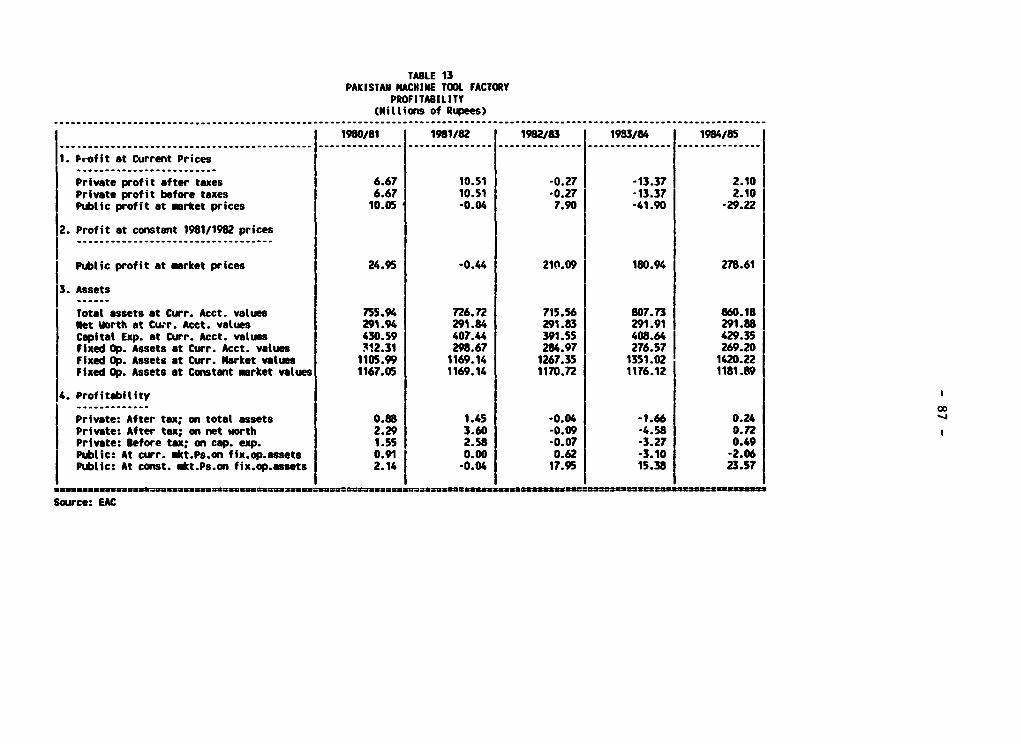
TABLE 13PAKISTAN MACNINE TOOL FACTORY
PROFITABILITY(Nillions of Rupees)
1980/81 I 1981/82 1982/83 1983/84 1984/85
II. Frofit at Current PricesPiaepftatrae..705-02-332.Private profit after taxes 6.67 10.51 -0.27 -13.37 2.10Private profit before taxes 6.67 10.51 *0.27 -13.37 2.10Public profit at mrket prices 10.05 -0.04 7.90 -41.90 -29.22
2. Profit at constant 1981/1982 prices
Public profit at mrket prices 24.95 -0.44 210.09 180.94 278.61
3. Assets
Total assets at Curr. Acct. values 755.94 726.72 715.56 807.73 860.18Net Worth at Cuwr. Acct. vaLues 291.94 291.84 291.83 291.91 291.88Capital Exp. at Curr. Acet. values 430.59 407.44 391.55 408.64 429.35Fixed Op. Assets at Curr. Acct. values 312.31 298.67 284.97 276.57 269.20Fixed Op. Assets at Curr. Narket values 1105.99 1169.14 1267.35 1351.02 1420.22Fixed Op. Assets at Constant mrket values 1167.05 1169.14 1170.72 1176.12 1181.89
4. Profitability
Private: After tax; on total assets 0.88 1.45 -0.04 -1.66 0.24 -
Private: After tax; on ret worth 2.29 3.60 -0.09 -4.58 0.72Private: Before tax; an cap. exp. 1.55 2.58 -0.07 -3.27 0.49Public: At curr. ekt.Ps.on fix.op.assets 0.91 0.00 0.62 -3.10 -2.06PuLtic: At const. mkt.Ps.on fix.op.assets 2.14 -0.04 17.95 15.38 23.57
I .UUU33333U3UUU3U3~3233U333Z3UU 1 :UIa=uasas-aazs.azauz-u----------z
Source: EAC

TABLE 14PAKISTAN ENGINEERING COMPANY
PROFITABILITY(Millims of Rupees)
____. ___________._. ........ ................ _........ ................ _. _. _. _ _ _ _.. ... .. ._. .. _.._. .. _.._.._. .. _.._.. ._
1980/81 1981/82 1982/83 1983/84 1984/85
1. Profit at Current Prices
Private profit after taxis -4.91 26.78 28.61 6.39 8.58Private profit before taxes -4.91 26.78 28.61 9.93 15.48Public profit at _mrket prices -16.35 25.21 24.35 15.22 -2.99
2. Profit at constant 1981/1982 prices
Ptulic profit at *erket prices 3.19 25.21 110.04 119.07 82.15
3. Assets
Total assets at Curr. Acct. values 604.63 577.37 542.16 554.76 631.99Met Worth at Curr. Aect. values 55.65 55.59 80.45 86.09 94.67Capital Exp. at Curr. Acet. values 96.40 86.28 102.07 102.88 140.64Fixed Op. Assets at Curr. Acct. values 47.51 70.78 66.10 69.78 67.75Fixed Op. Assets at Curr. Market values 258.83 303.79 331.48 362.87 385.33Fixed Op. Assets at Constant earket values 272.78 303.79 305.91 315.70 320.00
375.594. Profitability oD
............. O
Private: After tax; on total assets -0.81 4.64 5.28 1.15 1.36Private: After tax; on net worth -8.83 48.17 35.56 7.43 9.16Private: Before tax; on cap. exp. -5.10 31.04 28.03 9.65 11.00Pubtic: At curr. akt.Ps.on fix.op.assets -6.32 8.30 7.35 4.19 -0.78Public: At const. kt.Ps.on flx.op.assets 1.17 8.30 35.97 37.72 25.67
B auaz U UUUUUUUUUUUUUUUUUUIU UUUUUUUUUEUUSUUUUUUUUUUUUU IUUUUUUU BIUUUUUUUUU

TABLE 15NATIONAL REFINERYPROFITABILITY
(Millions of Rupees). .. .. .... ........... ....... ............. ..... ........ ...... ... .. ................ ............
l 19J0/81 ~~~~~~~ ~ ~~~~~1981/82 198/83 198/84 19B4/85
1. Profit at Current Prices.. ... . . ... ..... .
Private profit after taxes 40.13 52.25 43.67 48.00 120.00Private profit before taxes 40.13 52.25 53.20 114.45 120.00Public profit at m_rket prices 38.84 15.4" 17.57 94.35 184.83
2. Profit at constant 1981/1982 prices
Public profit at market prices -435.21 15.44 -283.91 686.90 385.31
3. Assets
Total assets at Curr. Acct. vatues 2031.90 2338.99 2570.52 3447.19 3642.26Net Worth at Curr. Acct. values 303.4 302.38 298.07 656.52 697.97Capital Exp. at Curr. Acct. values 453.99 619.53 982.35 1744.90 1803.18Fixed Op. Assets at Curr. Acct. values 555.77 528.26 487.71 446.30 2355.36Fixed Op. Asseta at Curr. Market values 899.01 967.28 1050.61 1126.87 3184.55Fixed Op. Assets at Constant market values 952.96 967.28 974.84 985.41 2642.46
4. Profitability
Private: After tax; on total assets 1.98 2.23 1.70 1.39 3.29Private: After tax; on net worth 13.23 17.28 14.65 7.31 17.19 lPrivate: Before tax; on cap. exp. 8.84 8.43 5.42 6.56 6.65Pubtic: At curr. ukt.Ps.on fix.op.assets 4.32 1.60 1.67 8.37 5.80Public: At const. mkt.Ps.on fix.op.assets -45.67 1.60 -29.12 69.71 14.58
.zg uzu2D==-: I 3.uu .==2-==-=a=========3== D ===-===5 8~ ==s ==I- X=-~3 -~u2 ==-======_=- - ==-
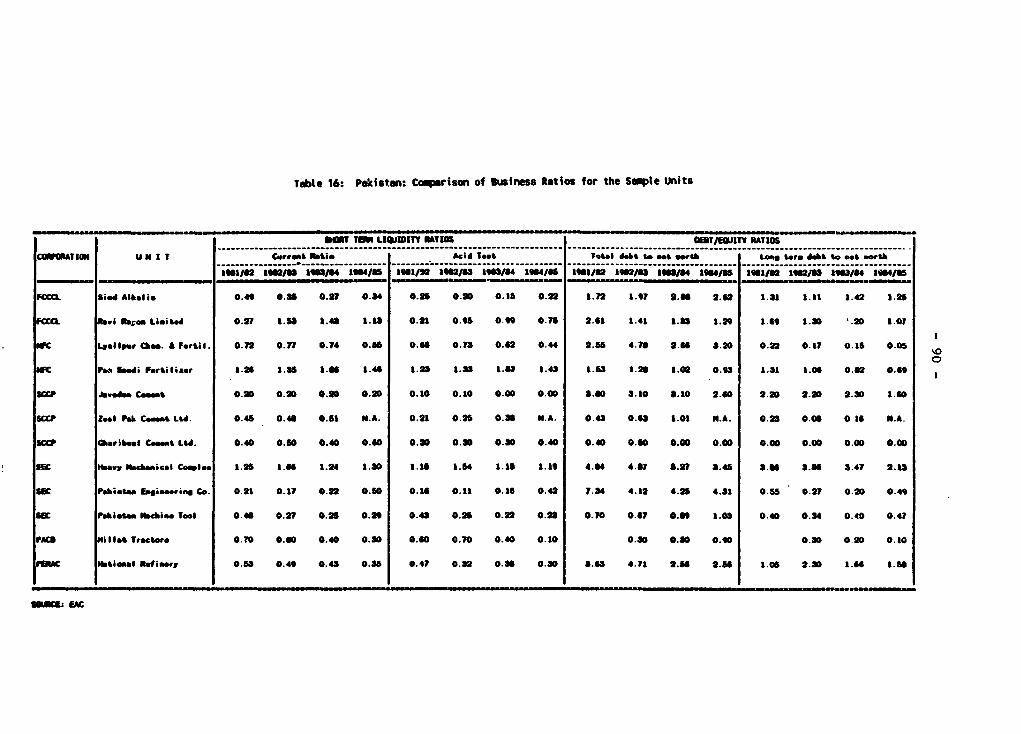
Table 16: Pakistan: Coparison of Business Ratios for the Spte Units
9OT TO LlIDUITY RATIS OEMEITVRA^TIOS
CA TIIf U N I T got %is Acid-Tet T,ota debt to met 1eeI Loe te debt to aet worth
1aw1ie2 1waj. 1`13/11 11694/85, IalZ 19I2/63 I3/04 ab14/41 1401/82 112/4 196I/34 jo4/55 £9l1/l2 12/3 193/04 164/05
FCCX Si dAltelis 0.4 0.@ 0.27 0.34 0.25 0.2D 0.8I 0.22 1.72 L.O 26.0 2.62 1.31 1.11 1.42 1.25
FCC Rewl pages Lieted 0.27 1. 3 1.43 1.13 0.21 0.91 0.9 0.75 2.61 1.41 1.33 1.29 1.59 1.30 '.20 1.01
C Leal Ope em. A Forti. 0.12 o. 0.74 0.5 0." 0.73 0.62 O.44 2.55 4.7S 2.S6 3.20 0.22 0.17 0.15 I .05
WPa Soodi Pertil&sa. 1.2 1.3 1.6 I.4 1.23 1.33 1.05 1.43 1.53 1.26 1.62 0.93 1.31 1.06 0.62 0."
SCP Jjewede Cemet 0.20 0.20 0.90 0.29 0.10 0.10 0.00 0.00 3.60 3.10 S.10 2.C0 2.2D 2.20 2.30 1.60
SCCP Zest Fab Cmeet Lt. 0.45 0.4S 0.51 N.A. 0.21 0.25 0.3S N.A. 0.43 0.63 1.01 N.A. 0.25 0.03 0 t N.A.
1CCP *ber*,.ae Cemt 1Ltd. 0.40 0.60 0.40 0.40 0.90 0.30 0.30 0.40 0.40 0.60 0.00 0.00 0.00 0.00 0.00 0.00
INeway Necheeeal Cowles 1.25 1.16 1.24 1.30 1.15 1.56 1.16 1.19 4.64 4.67 5.27 3.45 3.1 3.66 3.47 2.13
SW P ;-eiete umgeing Co. 0.21 0.17 0.22 0.50 0.16 0.11 0.16 0.42 7.34 4.12 4.25 4.31 0.55 0.27 0.20 0.49
#IC ;-ti.t 1Nebime Tool 0.46 0.27 0.25 0.29 0.43 0.26 0.22 0.23 0.70 0.67 0." 1.0 0.40 0.34 0(. 0.47
PAW Hillt Ie Trtrem 0.70 0.S0 0.40 0.30 0.60 0.70 0.40 0.10 0.30 0.30 0.0o 0.30 0920 0.10
PAC t btiemel Refinery 0.63 0.49 0.43 0.35 0.47 0.32 0.30 0.30 3.63 4.71 2.56 2.54 1.06 2.3S 1." a.5B
6S3 E

- 91 -
Table 17: Pakistan: Reporting Rpquirements of the EAC
(i) Monthlv Operating Results:
(a) Profit and Loss Statement;
(b) Operating Expenses;
(c) Cost of goods sold;
(d) Manufacturing Costs;
(e) Inputs Consumption;
(f) Net Sales;
(g) Sales analysis;
(h) Production Cost;
(i) Others (energy consumption, production losses, man hours).
(ii) Quarterly Reportst:
(a) Balance Sheet
(b) Cash and Bank Balance;
(c) Trade Receivables Analysis;
(d) Material Inventory;
(e) Finished Goods Inventory
(f) Loans;
(g) Taxes and Duties;
(h) Product Prices
(i) Personnel Summary Officers;
(j) Project Progress report
Source: EAC
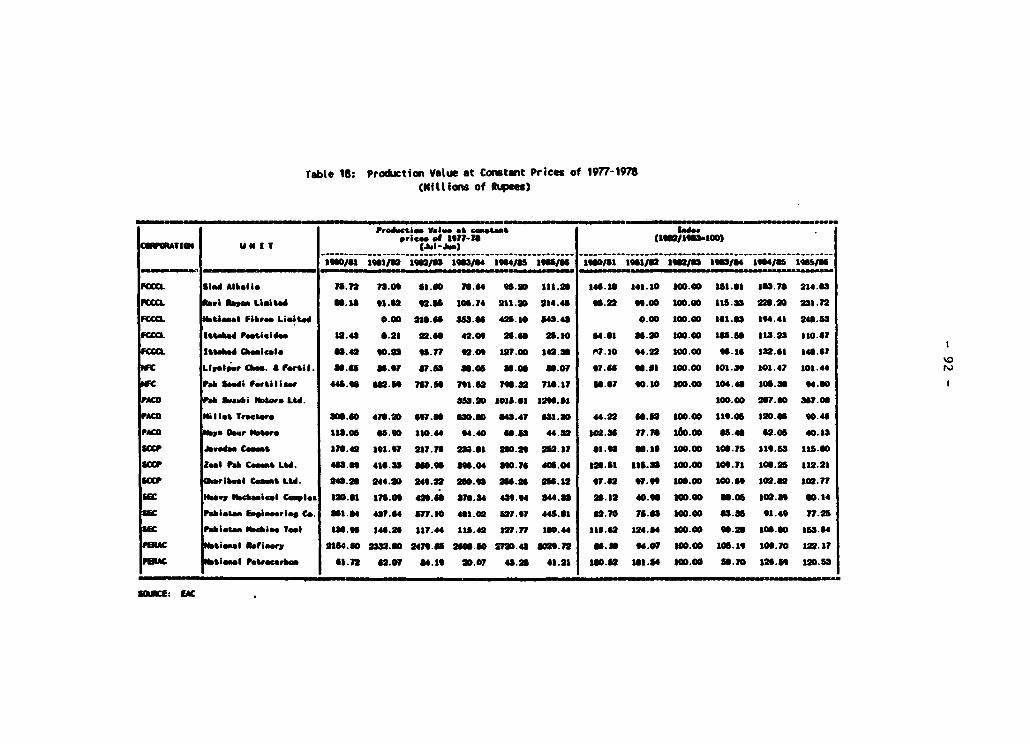
Table 16: Productionl Value at Constant Prices of 1977-1978(Nilltons of Rupees)
Pi odual Volvo a ..tes .prices .of 1- (12310)CIATIO ui T (ai-be)
Imjoi 1361/3 136/0 116/5 £35/US 135/8 1360101 116/6 112/6 136/4 114/fl *135/
FcC Sled ibeli* n 7.12 73.0n 51.60 7s.64 6.90 £11.2 1 U.U 1 141.10 100.00 151.61 1I.1? 214.63FCCL Suwi Iepe LIited ft. 1 31.62 32.5 106.74 211.90 214.46 35.22 n.c0 £0.0 115.33 22 .21 231.12fCCL **i_el Fib,.. Limited 0.00 216.6 35s.6 425.10 4.4" 0.00 100.00 1o1.63 134.41 248.53FCCCL U*1 P ieetiide £2.43 0.21 22.6 42.06 25." 21.10 ".01 8.20 00.00 135.50 113.23 110.67FCCC. itt.ic amaieal* 6.42 30.2 f1.77 12.03 127.00 142.3 N. 10 34.22 100.00 36.16 132.61 146.61WfC LtwLiep >_. * Feti I. 8." 5 86.3, 87.58 3.06 J3.03 J.01 37.16 ".61 100.00 101.39 101.47 10l.44SfC Pt. saui fP.,ii.., 44." 60.5 n7.1.6 71.62 7M.32 718.11 66.or7 0.10o 10.00 104.43 £006.86 4.00PACO Fa Susui beD,. LUd. 313.20 IOIS001 12516.6£ £00.00 207.60 367.06PACO Hillu I TreateK 016.60 410.20 S6." 6O. o 04.47 81.20 44.22 60.52 100.00 11.056 320.65 0.046PACO fye Doug, ber. 113.0e 6.c0 110.44 4.40 *.u 44.32 100.36 17.n0 110.00 36.43 62.05 40.13SCCP Jwed commet 173.42 131.31 217.76 233.81 260.2 261.a17 at." $0.16 1o.00 105.75 113.53 115.60sca Zeal etr Cmet LtW. 463.10 416.33 3O.16 36.04 6.76 406.04 125.1 11.18 100.00 106.71 106.25 12.215aP1amribwaI Comem LU. 248.25 244.90 243.21 210." 264.25 26.12 37.52 37.3 10.00 100.63 102.12 102.71SW Ibwe Noeicul Cuwle. 120.61 176.03 42M.6 8n.84 436.4 "4.3 25.12 40.6 100.00 0.06 102.83 60.14S66 rahiese Clm_meerle Ce. as1.84 481.64 577.10 451.02 127.37 445.61 62.70 75.43 £00.00 63.36 31.43 7.255S Pubiet.e S"BAIN TeeS US." 146.25 117.44 115.42 127.11 10.44 115.62 £24.04 NO.-O 30.23 103.60 153.64410ACc isbiemel fati&0e 2154.40 232.0 247. 2101.00 2M.43 SM2.12 3.3 34.07 N100. 101.13 103.70 in..17
Oitiemal Petrecerbee 61.72 62.07 84.16 20.07 4.25 41.21 160.62 101.54 100.00 0.70 120.5 120.13
EVAM- C .
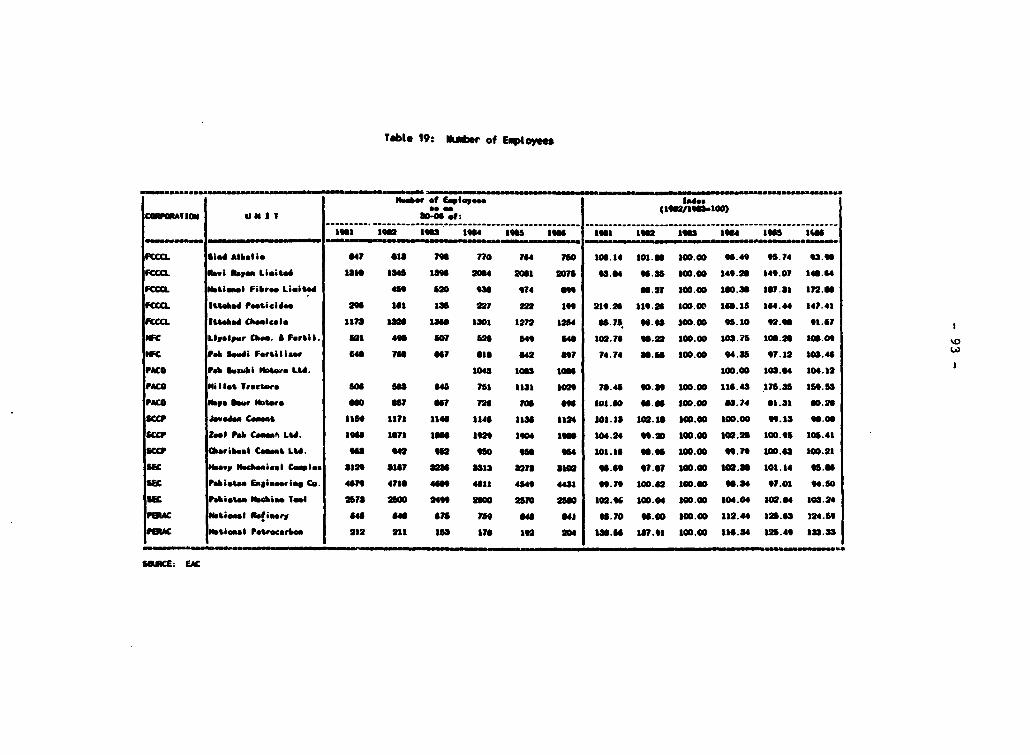
Table 19: Niber of EJploye
_.______ .. f...f..... _ .. ___.....a..___._._ ...... ______................. ... ... ___.__...............__.________________
COMMI1I0 uN1 1 6 0-M of:
1901 192 190 *904 1HI5 11101 RIt 1"2 19 1084 1905 11
FCCCL id Alblis 417 O1S 1 1n0 764 710 106.14 101.00 100.00 1.49 a5.74 9."
FCC Nolvi Atye LIsite 13*0 1345 131 204 2001 2075 03.04 10.35 100.00 149.26 149.07 140.14
FCtI blXi.el Fibre. Liied 459 20 93 914 on .21 100.I0 160.35 107.31 172.10
FCCCL Itidmd te.ticid.e 260 10 135 221 U222 1m 219.20 119.20 100.00 IU1.1 144.444 14.41
FCCCI lEteted O seicele 1171 1ug 131 101 1272 1214 6S.7S W.98 100.00 95.10 2.906 91.67
NWC Lletor Chem. A FortAl. 621 40 601 52 549 5 "5 102.10 1.22 100.00 103.15 100.20 100.06
WfC Pet leui Fertiiae a4 IU 0417 01 042 017 74.74 JO.U 100.00 94.3S *7.12 103.46
PCO Feb So"uI ible LU. 1043 la" to"1 100.00 io*." o1.12
PACO millet Tractore GM se "A 751 11321 102 76.45 .6 100.00 11D.43 11.3 151S UPACO #by* Osqar bte_* 00 as1 001 121 100 096 *01.6D0 ff.f 100.00 68.74 01.31 00.20
SCCP ir ed_ cesmt 115 l*l 1140 1145 1130 1124 101.13 102.10 100.00 100.00 5. 3.1 10.0s9cr P le Pth Cmew, Ltd. 197 lt f A 1sn 192 1604 1 104.24 99.00 100.00 102.25 1OO.9 105.41
W" e aribe.l Cemspe Ltd. s t42 92 ff0 in 4 101.16 10.10 300.00 ".71 100.03 100.21CECW mobvg ftec*a ieeil C Ies 31520 3157 a1 2313 27 310D2 f0.05 7.07 100.00 102.30 101.14 S.00Su Fblet"i Ee 6iteeriss CD. 01 4110 4000 46I1 4549 4431 9.1 IC00.52 100.00 *0.84 97.01 04.50
S tietee Nttife. Tool 2073 2100 24 2000 2S70 2100 100.96 100.04 100.00 104.04 102.U4 103.24
rouc timet uooir S" 446 013 17 9 8 41 t l .70 1.00 100.00 112.44 125.03 124.n9
from le-tiean;l Ptrocearbo 212 211 153 176 " 204 10.06 137.91 100.00 116.34 120.49 133.33
lONCE: EAC
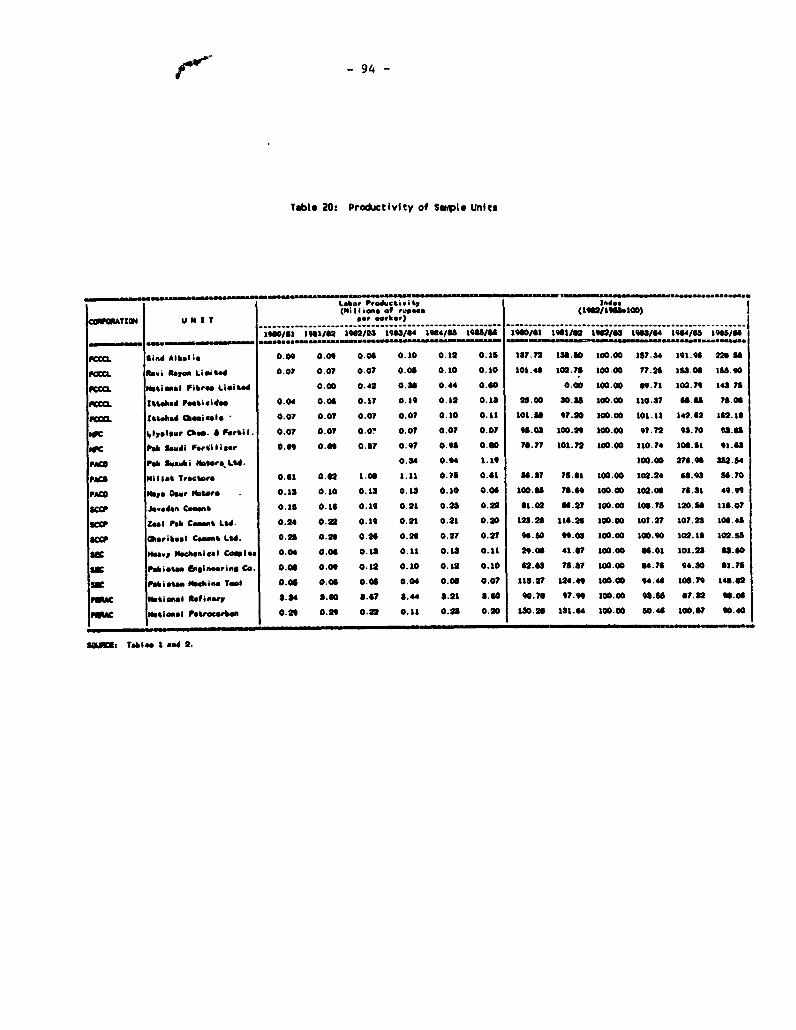
-94 -
Table 20: Productivity of Saupl Units
i n . ~~~~~~~~~~~~~Labor PeOductivit-Y ae(MilIioan of r,e (1162/1960)
CO6 TIA U 11 I T of who)
IWOal i108a/2 1962/63 1963/84 19114/63 18/U 1960/61 1961/62 1962/63 163/64 101"/5 1966/. ----- ---- -- -- -- -- -- -- -- --- -- -- -- -- -
,cmCC. Sinda MW ie 0.00 0.09 0.06 0.10 0.12 0.1i 137.72 136.60 100.00 157.34 IOI.9 22 5a
FcCCL Nawi Mbo Limit" 0.07 0.07 0.07 0.06 0.10 0.10 101.48 102.75 100.00 77. 2 151.09 IS690
F=CCL Hatiw FPibrt Lialted 0.00 0.42 0.30 o." 0.60 0.00 100.00 n9.71 103.79 143 75
FCMcO Itthaed Pr .id.e 0.04 0.06 0.17 0.19 0.12 0.13 25.00 10.31 100.00 110.37 61.61 7r.06
F= Itbeked Chemiels, 0.07 0.07 0.07 0.07 0.10 0.11 101. " 97.20 100.00 101.11 142.62 162.11
1SC l1yelere aOa_. a Pitil. 0.07 0.07 0.01 0.07 0.07 0.07 ".03 100.2 100.00 97.72 93.70 93."
N b Sui FPt..liaer 0.69 0.n5 0.a7 0.07 0.u8 0.60 76.77 101.72 100.00 110.74 106.61 91.63
PAC Fe& subi * b9Or; L. 0.34 0.04 1.19 100.00 276.94 162.54
PACO "illat Trnctor* 0.61 0.62 1.e0 1.11 0.75 0.61 5.37 75.61 100.00 102.24 64.93 56.70
jPACO e ft' Daeu Ib' . 0.13 0.10 0.13 0.13 0.10 0.06 10o." 76.69 100.00 102.06 16.31 49.9n
S1 Jedan Caowas 0.15 0.16 0.19 0.21 0.23 0.22 61.02 M6.27 100.00 106.75 120.56 116.07
sew Zeal Pak cement Ltd. 0.28 0.22 0.19 0.21 0.21 0.20 123.26 116.25 100.00 107.27 107.23 106. 4
S_CP Wba,ibwel comeat Ltd. 0.25 0.26 0.26 0.26 0.27 0.27 96.50 99.0 100.00 100.90 102.10 102.15
6o Mary N eIsnical Cewle 0.04 0.06 0.13 u 011 0.13 0.11 29.06 41.W7 100.00 48.01 101.23 6.o60
so P.bi. abaanringC co 0.06 0.06 0.1 0.10 0.12 0.10 62.63 71.37 100.00 84.76 94.30 61.75
sC Pakiotn Ibshiae Tan 0.06 0.06 0.06 0.04 0.06 0.07 113.27 124.49 100.00 94.48 16s.70 146.62
9e iotimes leafiearr 3.84 8.C0 3.47 S.44 3.21 3.60 90.75 97." 100.00 9 OS.8 87.32 6.06
9.AC htional Ptrarboea 0.2" 0.26 0.22 0.11 0.23 0.20 130.26 131.64 100.00 50.4 100.67 90.40
S : Tablha I en 2.

- 95 -
lltl tl' 0~~~~~~~~
~~~~~~~~~~~~~~~~~~~~~U9
li W!~~~~~~~~~~~~~~~~~~~~~~~~~~~~~~~a

Graphs 1- 4
SIND ALKALIS: PRIvATE PROFIT AFTER TAX PAK SAUDI: PRIVATE PROFIT AFTER TAX(M c.wud *im)(ACm iw
245
3 ~ ~ ~ ~ ~ ~ ~ ~~~~~~~~220 -
I:~~~~~~~~~~~~~~~~~~~~~~~~~2I173~~~~~~~~~~~~~~~~~~~~~~1
-2~~~~~~11 13445mi91
-. 13~~~~~~~~~~~~~~~~~~~~~~~~~~~~~~~aPi wf
23 -~~~~~~~~~~~~~~~~~~~~~~2
-1
-mIr
13 - ~ ~ ~ ~ ~ ~ ~ ~ ~
24 ~ ~ ~ ~ ~ ~ ~~ "25 2~~~~~~~~~~~~~~~~~~~~~~~~~~~00
22~~~~~~~Pi ti21~~~~~~~~~~~~~~~~~~~~~~~~~~~~aM i
23~~~ORE als4 1 o h ttSia pedx

Graphs 5 - 8
JAVFDAN: PRIVATE PROFIT AFTER TAX GHARIBWAL: PRIVATE PROFrr AFTER TAX30 ~~~~(Al C.,.u voc ) isgwwA4m
is
20
14 -
is131
2. .. II
-10
-Ia
my"tS wu r U,VU4 * n , Vo S is m
ZEAL PAK: PRIVATE PROFIT AFTER TAX MILLAT TRACT.: PRIVATE PROFIT AFTER TAX(m cwmd okkm)~ ~ ~ ~ ~~~~~~~~~N w,d34m
45 21
23 -
1:13~~~~~~~~~~~~~~~~~~~~~~~~~~~~~~~~~3rbWN

Graphs 9- 12
HEAVY MECHAN.: PRIVATE PROFIT AFTER TAX PMTF: PRIVATE PROFIT AFTER TAX3U (sa Cuwmlt Mcin) *
25 -~~~~~~~~~~~~~~~~~~~~~~~1
243
24 ~ ~ ~ ~ ~ ~ ~ ~ ~ ~ ~ ~~~~~~422 ~ ~ ~ ~ ~ ~ ~ ~ ~~~~~~~~~~2
4 -12~~~~~~~~~~~~~~~~~~~~~
2~~~~1
2 12~~~~~~~~~~~~~~~~~~~~~~~1G"3 -IW 70 8;251
* ~~~~~~~~~~~~~~~~~~~~~~~~~s-u2* -I
to -~~~~~~~~~~~~~~~~~~~~1
12 - 10-~~~~~~~~~~~~~~~~~~311 2/31/1 if
La 9- ~ ~ ~ ~ M ~,. tm MC,d~m
24-
13~~~~~~~~~Wi 3Pb
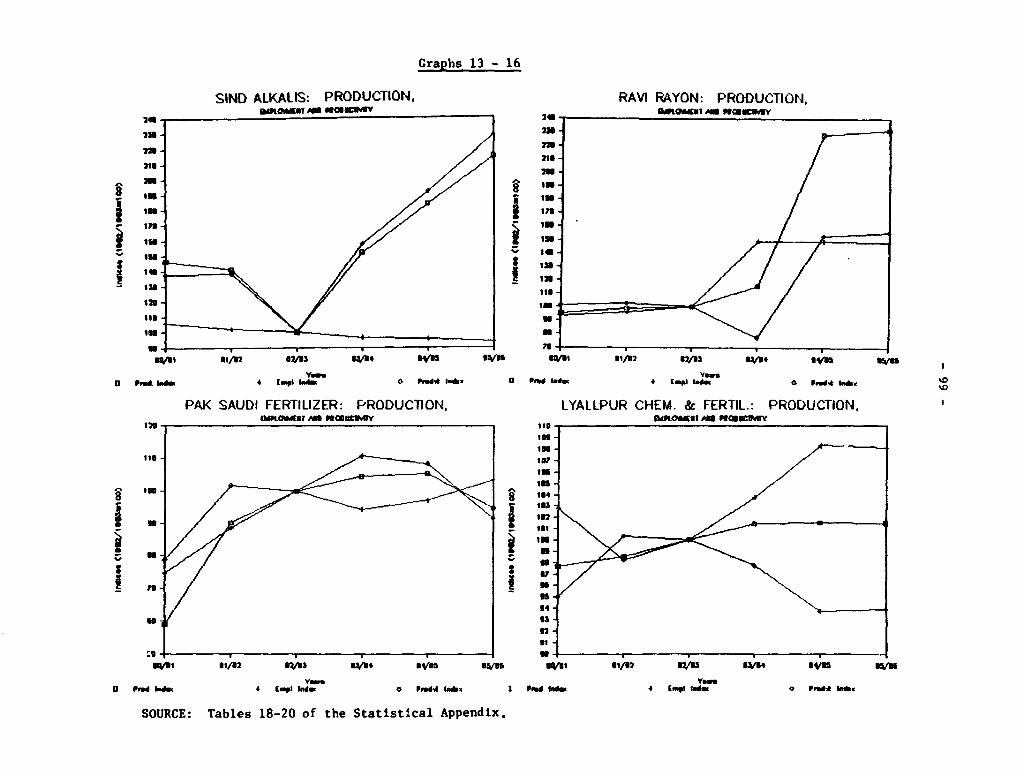
Graphs 13 - 16
SIND ALKALIS: PRODUCTION, RAVI RAYON: PRODUCTION,
246.- 26 .wgwun IlUV
213 ~~~~~~~~~~~~~~~~~~~~~~~213
2 2
I.In
O i { *19 a 4 -i INW
in 1 so-136 ~ ~ ~ ~ ~ ~ ~ ~ ~ ~ ~ ~ ~ ~~ n
120 To4
123
U/Ut 111/U2 32/113 33/4 .3 9'V3 3W11 3112 "3/3 33/Ut *4U !
Ye". Vows
Prod. hw 4 tmp' bdW 0 Pomd.* 1e6. a Peed bod 4 Enq * pr" n&
PAK SAUDI FERTILIZER: PRODUCTION, LYALLPUR CHEM. & FERTIL.: PRODUCTION,
IMftQ.NT ANl PWG UMTY fDftQdgIJll AN OuUC14IY
i~~~~~~~~~~~~~~~~~i
to- 32o32-
31:
91/t 31/12 32/33 833/4 3n3 3/ 30l 31/32 323 3/4 4U 2
UP..d Iedk 4 keep leedac PmeeA leb I Peed ledg 4 [MOp lede Pmed* too.
SOURCE: Tables 18-20 of the Statistical Appendix.

Graphs 17 - 20
JAVEDAN CEMENT: PRODUCTION,
ZELP K C4NT A PRODUCTION IGHAIBWAL TRCEMENT: PRODUCTION,
123 ~ ~ ~ WLEJM POUWV - In DPU"T AN ,mmuWwWY
178ltE tiC114V -Ot
is 4 4 iU
37
a *Id .WU 4 *v n Ut oo, m' P". 5 sx u,
Oiud. I.mdin 4 1I d O Pmd x a pU' 4 g Proolvi. xh e
ZEAL PAK CEMENT: PRODUCTION. MILLAT IRACTORS: PRODUJCTION.B.4PLni mU faloUcIUY DOdLOiNUT AN OW(MINCIPrY
133 -u
135~~~~~~~~~~~~~~~~~~~~~~~?
123~~~~~~~~~~~~~~~~~~~~~~~3
its-IN u
33/3 111/32 32/3 ll:V14 kV3 /U 11/112 47ma 34'a. mVU aw
a IeEE "Md 4 (110 *" P,d-A. I*x 0 prod mewo 4 [MOp led. Prod" bhb

Graphs 21 - 24
HEAVY MECHANICAL: PUBUC PROFITABIUTY PAKISTAN ENGINEER: PUBLIC PROFITABIUTY,13
12
7-
1'00~~~~~~~~~~~~~~~~~~~~~
-X1a -1
A pn X CiZ Y
PAKISTAN MACHINE: PUBUC PROFITABIUTY NATIONAL REFINERY: PUBUC PROFITABIlUTY
la- 20
la
14
12
1~~~~~~~~~~~~~~~~~~~~~~~~~~~~~~1 a 0
4.~rO -1 | Y
4- -23
04-3
-4 1/ a&VSwam aim awa a, &SAM m/r
Ye" x~~~~~~~~~~~~~~m

Graphs 25-28
SIND ALKALIS: AVERAGE WAGES RAVI RAYON: AVERAGE WAGES241 AUI POOMCTM in*m pIooCLkiw
-IN 1'-3. .,w 2un - ISO V4ltV
14. 1I
ea ~~~_ _ ~~~ =l ea _ t~l I
I.I~~~~~~~~~~~~~~~~~~~~~~~~~~~~~~~~~~~~~~~l
oo~~~
123~~~~~~~~~~~~~~~~~~~~~~~~~7
n 41
14= b UVd3 PM".V 32./Il N/it *t/1 V~SWI WI *Vmd 32,3

Craphs 29 - 32
JAVEDAN CEMENT: AVERAGE WAGES GHARIBWAL CEMENT: AVERAGE WAGES
AMUD PlOttUtIMblY StOI PlOO3UCbIAtY
to0 .*0pOOCP 140 MDpoii.t
ISO. 130I
120- 120-
Ing Iin
go90 / o
an -so -~~~~~~~~~
50 8
40- 40 -
3so/ 30-A
20- 20
O0/I D"1 2/2 8/1 V 80/11 81/b2 82/3 53/54 8"S282U
I7M AV' Yogem n=V"d-h Ine a &,mYew, PdA ne
ZEAL PAK CEMENT: AVERAGE MILLAT TRACTORS: AVERAGEWAIB AND PSOGUI1ANY WANS Aa Pto0uLTIMTY
ISO 130-
140- 2
130-
110 7~~~~~~~~~~~~~~~~~~~~~~~1
an -~ ~ ~ ~ ~ ~ ~ ~ ~ ~ ~ ~ ~ ~ ~ I
so-~ ~~ ~ ~ ~~~~~~~~~~~~~~~~~~~~~g
!E 540-
40
30 / / ~~~~~~~~~~~~~~~~~~~~~~35
20 in 10t *1
80/U 81l/12 82/2 *3/U avis asv'a 8/1 81/12 82/3 82/4 BVI 8/1
Aw Waoom Idiw Ycm M Pmwdt Index IZZ] ' Pftd-A Inch

Graphs 33-36
HEAVY MECHANICAL COMPLEX: AVERAGE WAGES PAK(ISTAN MACHINE TOOL: AVERAGEMD UIOouEIk41Y WAMB MID PSOUCThIY
140 -taoo
130 150w
120 ~~~~~~~~~~~~~~~~~~~~~~~~~140 /130 -~~~~~~~~~~~~~~~~~~~~~~3
ISO 110
go N t~~~~~~~~~~~~~~~~~~~~~~~~ioo-
70 SI
10 7~~~~~~~~~~~~~~~~~~~~~~~~~00
00 M
40
30-
01/82 5 3 "4 8"s 5~~~~~. o"I 0~1/82 "3 3/4 34,15 05/86
AV vbg I"dwYowe MPmdA nde Ca2 A' W e,lmn Wd anMpmdt :*d.
PAKISTAN ENGINEERING: AVERAGE NATIONAL REFINERY LIMITED: AVERAGE
130 - ASOPfOLWY130 WASM ROCN
120 140
110 130
100 12
8 go t
00~~~~~~~~~~~~~~~~~~~~~~~~~~~~~~~~ ii 0
*~~~~~~~~~~~~~~~~~~~~~~~~~~~~~s /
C.~~~~~~~~~~~~~~~~~~~~~~~~~~~5
30
20~~~~~~~~~~~~~~~~~~~~~~~~~210~~~~~~~~~~~~~~~~~~~~~~~2 10 ~~~~~~~~~~~~~~~~~~~~~~~~~~10
0- 06ot 1/82 02/03 33/84 0"/5 05/81 50/81 31/82 82/82 034 Bv"5 ms/mo
17.Z A' ft) ,tnl Pmdt .4 h?:2 A'. YM0 Ind= , p,ud. ite.~

PPR Working Paper Series
Title Author Date Contact
WPS140 Building Educational Evaluation
Capacity In Developing Countries John Middleton February 1989 C. Cristobal
James Torry 33640Deborah Bloch
WPS141 Payroll Taxes for Financing TrainingIn Developing Countries Adrian Zlderman January 1989 C. Cristobal
33640
WPS142 Vocational Secondary Schooling Inisrael: A Study of Labor Market
Outcomes Adrian Zlderman January 1989 C. Cristobal33640
WPS143 Decentralizatlon In Education:An Ecoor.ic Perspective Donald R. Winkler
WPS144 Proa... Differentiation and theTreatment of Foreign Trade in
CGE Models of Small Economies Jaime de Meio February 1989 K. Cabana
Sherman Robinson 61539
WPS145 Revenue Raising Taxes: GeneralEquilibrium Evaluation of AlternativeTaxation in U.S. Petroleum Industries Jaime de Melo February 1989 K. Cabana
Julie Stanton 61539David Tarr
WPS146 Exchange Rate-Based Disinflation, WageRigidity, and Capital Inflows:Tradeoffs for Chile 1977-81 Timothy Condon February 1989 K. Cabana
Vittorio Corbo 61539Jaime de Melo
WPS147 The Private Sector's Response toFinancial Liberalization In Turkey:1980-82 Izak Atlyas January 1989 W. Pitayatonakarn
60353
WPS148 Impact of the International CoffeeAgreement's Export Quota System on the
World Coffee Market Takamasa Akiyama February 1989 D. Gustafson
Panayotis N. Varangis 33714
WPS149 Reflections on Perestroyka and theForeign Economic Ties of the USSR Bela Balassa January 1989 N. Campbell
33769

PPR Working Paper Series
Title Author Date Contact
WPS150 Improving the Currency Composition
of External Debt: Applications InIndonesia and Turkey Ken Kroner January 1989 L. Chavarria
Stijn Claessens 33730
WPS151 U.S. Trade Policy Towards
Developing Countries Bela Balassa January 1989 N. Campbell33769
WPS152 Subsidies and Countervailing Measures:
Economic Considerations Bela Balassa January 1989 N. Campbell33769
WPS153 An Analysis of Debt Reduction Schemes
Initiated by Debtor Countries Ishac Diwan
Stijn Claessens
WPS154 Forecasting, Uncertainty and Public
Project Appraisal Jock R. Anderson February 1989 A. Kitson-Walters33712
WPS155 Measuring Adult Mortality In
Developing Countries: A Review and
Assessment of Methods Ian Timaeus
Wendy Graham
WPS156 Experience with Credit Cooperatives
in Israeli Agriculture Yoav Kislev
Zvi Lerman
Pinhas Zusman
WPS157 A Policy Model for Tunisia with
Real and Financial Flows Martha de Melo January 1989 A. BhalIla
Marc Leduc 60359
Setareh Razmara
WPS158 Labor Redundancy In the Transport
Sector Alice Galenson February 1989 W. Wright33744
WPS159 Current International Gas Trades
and Prices Kay McKeough March 1989 M. iernandez33637
WPS160 Evaluating the Performance of Public
Enterprises in Pakistan Mary M. Shirley March 1989 R. Malcolm61708