evaluating the impact of different types of stabilized
TRANSCRIPT

Rowan University Rowan University
Rowan Digital Works Rowan Digital Works
Theses and Dissertations
4-4-2017
Evaluating the impact of different types of stabilized bases on the Evaluating the impact of different types of stabilized bases on the
overall performance of flexible pavements overall performance of flexible pavements
Andrae Anthony Francois Rowan University
Follow this and additional works at: https://rdw.rowan.edu/etd
Part of the Structural Engineering Commons, and the Transportation Engineering Commons
Recommended Citation Recommended Citation Francois, Andrae Anthony, "Evaluating the impact of different types of stabilized bases on the overall performance of flexible pavements" (2017). Theses and Dissertations. 2384. https://rdw.rowan.edu/etd/2384
This Thesis is brought to you for free and open access by Rowan Digital Works. It has been accepted for inclusion in Theses and Dissertations by an authorized administrator of Rowan Digital Works. For more information, please contact [email protected].

EVALUATING THE IMPACT OF DIFFERENT TYPES OF STABILIZED
BASES ON THE OVERALL PERFORMANCE OF FLEXIBLE PAVEMENTS
by
Andraé Anthony François
A Thesis
Submitted to the
Department of Civil and Environmental Engineering
College of Engineering
In partial fulfillment of the requirement
For the degree of
Master of Science in Civil Engineering
at
Rowan University
November 21, 2016
Thesis Chair: Yusuf Mehta, Ph.D.

© 2016 Andraé A. François

Dedications
I would like to dedicate this document to my parents, Gary François and Marilyn
Thomas-François as well as my sister, Marisa Adele-Marie Gray, for their continuous
support of all my academic endeavors.

iv
Acknowledgements
I would like to express my heartfelt gratitude to Professor Dr. Yusuf Mehta who
has guided me during my research and provided sound academic advice throughout my
graduate career thus far. I will also like to thank Dr. Ayman Ali and Dr. Hashim Rizvi
who have also advised and assisted me throughout my research. Lastly, I would like to
acknowledge my aunts, Maria D. Thomas and Beverly A. Thomas for the assistance they
provided in editing this document.

v
Abstract
Andraé François
EVALUATING THE IMPACT OF DIFFERENT TYPES OF STABILIZED BASES ON
THE OVERALL PERFORMANCE OF FLEXIBLE PAVEMENTS
2016-2017
Yusuf Mehta, Ph.D.
Master of Science in Civil Engineering
This study was initiated with the aim of evaluating the impact of stabilized and
untreated base layers on the performance (i.e., fatigue and rutting) of flexible pavements.
Four field sections constructed using stabilized base layers (i.e., bituminous (asphalt
emulsion), calcium chloride (CaCl2), Portland cement, and geogrid stabilized base layers)
and a control section constructed using untreated RAP aggregates were analyzed in this
study. Falling Weight Deflectometer (FWD) tests were conducted on all the field sections
and the collected data was used to backcalculate the elastic moduli for all layers. The
influence of the stabilized bases and the untreated RAP base on the mechanical responses
(stresses and strains) of the overall pavement structure was also evaluated by conducting
layered elastic analyses. Pavement ME simulations were also conducted to determine
which of the four stabilized bases enhanced the predicted performance of flexible
pavements the most. Based on the results of the study, it was concluded that the Portland
cement stabilized base seemed to be more effective than the other stabilized bases at
improving the resistance of the pavement sections to fatigue cracking. It was also
determined that base layer stabilization appeared to have little effect on the rutting
resistance of the pavement sections.

vi
Table of Contents
Abstract ............................................................................................................................... v
List of Figures .................................................................................................................... ix
List of Tables ...................................................................................................................... x
Chapter 1: Introduction ....................................................................................................... 1
Background ................................................................................................................... 3
Problem Statement ........................................................................................................ 5
Significance of Study .................................................................................................... 5
Hypothesis .................................................................................................................... 6
Goal & Objectives ........................................................................................................ 6
Research Approach ....................................................................................................... 7
Research Scope ............................................................................................................. 8
Chapter 2: Literature Review ............................................................................................ 10
Performance of Stabilized Bases ................................................................................ 10
Calcium Chloride Stabilized Base. ....................................................................... 10
Portland Cement Stabilized Base. ......................................................................... 13
Geogrid Stabilized Base. ....................................................................................... 15
Bituminous Stabilized Base. ................................................................................. 19
Background of Testing and Analysis Procedures ....................................................... 22
Falling Weight Deflectometer Testing. ................................................................ 22
Backcalculation. .................................................................................................... 23
The Kenlayer Software. ........................................................................................ 24
AASHTOware Pavement ME Software. .............................................................. 25

vii
Table of Contents (Continued)
Chapter 3: Pavement Sections, Analysis Procedures & Inputs......................................... 28
Geology of Rhode Island Route 165 ........................................................................... 29
Rhode Island Route 165 Pavement Section Overview ............................................... 29
Section Containing Calcium Chloride (CaCl2) Stabilized Base. .......................... 30
Control Section Containing Untreated (RAP) Base. ............................................ 31
Section Containing Portland Cement Stabilized Base. ......................................... 31
Section Containing Geogrid Stabilized Base. ....................................................... 32
Section Containing Bituminous Stabilized Base. ................................................. 32
Falling Weight Deflectometer Testing Procedure ...................................................... 33
Backcalculation Procedure and Inputs ........................................................................ 34
Kenpave Analysis Procedure and Inputs .................................................................... 35
Pavement ME Design Simulation Inputs .................................................................... 37
Chapter 4: Results, Analysis & Discussion ...................................................................... 39
Backcalculated Moduli Values ................................................................................... 39
Validation of Backcalculated Base Layer Moduli. ............................................... 40
Comparison of Backcalculated Layer Moduli of Pavement Sections. ................. 42
Impact of Stabilized Base on the Field Performance of the Pavement Sections ........ 44
Impact of Stabilized Base on Pavement Section Fatigue Cracking Resistance. ... 45
Impact of Stabilized Base on Pavement Section Rutting Resistance. .................. 47
Pavement ME Design Predicted Performance ............................................................ 50
Pavement ME Total Predicted Fatigue Cracking. ................................................ 50
Pavement ME Total Predicted Rutting. ................................................................ 52
viii
Table of Contents (Continued)
Determining Change in Pavement Condition with Time Using PSHI ....................... 53
Evaluation of Pavement Section Condition. ......................................................... 57
Comparison of Pavement Section Condition Over Time. .................................... 59
Comparison of Life Cycle Costs of Pavement Sections ............................................. 60
Chapter 5: Summary of Findings, Conclusions & Recommendations ............................. 65
Summary of Findings .................................................................................................. 65
Conclusions ................................................................................................................. 68
Recommendations ....................................................................................................... 70
References ......................................................................................................................... 71
Appendix: Pavement Deflections ..................................................................................... 75

ix
List of Figures
Figure Page
Figure 1. Field segment of RI Route 165 analyzed in this study ........................................ 9
Figure 2. Lateral confinement mechanism of geogrid: (Zornberg et al. (2010) [8]) ........ 16
Figure 3. Increased bearing capacity mechanism of geogrid: (Zornberg et al (2010) [8]) ........ 17
Figure 4. Tensioned membrane mechanism of geogrid: (Zornberg et al. (2010) [8]) ............... 18
Figure 5. Schematic of Falling Weight Deflectometer testing: (Mehta et al. (2003) [27]) ....... 23
Figure 6. Vehicle classifications based on number of axles ............................................. 27
Figure 7. Pavement structures of all five pavement sections ............................................ 28
Figure 8. Measured and calculated deflections in BAKFAA software ............................ 34
Figure 9. Comparison of backcalculated base layer moduli of all pavement sections one
year after construction ....................................................................................... 43
Figure 10. Comparison of tensile strain at the bottom of the HMA layer of all sections
one year after construction and at crack initiation .......................................... 46
Figure 11. Comparison of compressive strain at the top of the subgrade of all sections
immediately after construction and at crack initiation .................................... 49 Figure 12. Total predicted fatigue cracking in pavement sections ................................... 51
Figure 13. Total predicted rutting in pavement sections ................................................... 53
Figure 14. RIDOT rutting distress scoring system for flexible pavements ...................... 56
Figure 15. RIDOT IRI distress scoring system for flexible pavements ............................ 56
Figure 16. Change in Pavement Structural Health Index of pavement sections with time ....... 58
x
List of Tables
Table Page
Table 1. Summary of key findings of previous studies which have evaluated the
laboratory and field performance of cement stabilized bases ............................ 14
Table 2. Summary of Pavement ME design inputs........................................................... 38
Table 3. Average backcalculated layer moduli values for each pavement section
immediately after construction ........................................................................... 40
Table 4. Backcalculated and laboratory-measured moduli values for base layers ........... 42
Table 5. RIDOT Pavement Structural Health Index scoring system weight distribution ..... 54
Table 6. RIDOT scoring system for alligator, longitudinal and transverse cracking on
flexible pavements .............................................................................................. 55
Table 7. Initial construction costs of untreated and stabilized pavement sections [38] .... 62
Table 8. Total life cycle costs of the pavement sections containing the stabilized and
untreated base layers ........................................................................................... 64

1
Chapter 1
Introduction
Pavement performance is influenced by both the pavement structure and the
properties of its respective layers. Structural failure in a pavement occurs when the
mechanical responses, such as the horizontal tensile strains at the bottom of the surface
layer and/or the vertical deformation in each of the layers exceed a criterion. The tensile
strains and the deformation in these layers cause major distresses such as fatigue cracking
and rutting to develop in flexible pavements. These distresses tend to reduce the ability of
flexible pavements to withstand traffic loads because they decrease the overall structural
capacity of the pavement structure. Pavement distresses like fatigue cracking and rutting
also reduces the smoothness or “rideability” of a pavement surface and this in turn
decreases the safety and quality of ride the pavement provides for road users.
In flexible pavements, tensile strains develop at the bottom of each layer when a
traffic load is applied. However, the tensile strains that form at the bottom of the hot mix
asphalt (HMA) layer are responsible for bottom-up fatigue distresses that arise in the
wearing course of a flexible pavement. As the number of load repetitions due to traffic
increases on a pavement structure, the horizontal tensile strain at the bottom of the HMA
layer also increases. This causes micro-cracks to form at the bottom of the HMA layer.
When the strain on the asphalt layer reaches the tensile limit or fatigue threshold of the
HMA, these micro-cracks develop into macro-cracks. If the pavement continues to be
subjected to repeated traffic loads, these macro-cracks then begin to propagate upward,
until they become visible at the surface of the pavement. The formation and propagation

2
of macro-cracks in the HMA layer of flexible pavements hinders the ability of the layer
to effectively distribute traffic loads to the underlying layer (i.e. the base layer) and
allows increased moisture or runoff to enter the pavement structure. Therefore, the tensile
strains which cause these macro-cracks to form, contribute to a reduction in the overall
structural capacity of flexible pavements and negatively impact on pavement
performance.
Pavement performance is also affected by the vertical stress at the top of the
subgrade. Large vertical stress on the top of the subgrade causes detrimental permanent
deformation to occur. The role of pavements is to limit the vertical stress on the subgrade.
The resilient modulus of the subgrade determines the maximum vertical stress (i.e.
allowable stress) the subgrade could withstand before it experiences significant
deterioration. This relationship between the vertical compressive stress and the resilient
modulus of the subgrade is quantified by the vertical compressive strains at the top of the
subgrade [1]. If there are large vertical compressive strains at the top of the subgrade, the
vertical stress on the subgrade due to traffic loads may exceed the resilient modulus of
the subgrade. This may cause detrimental permanent deformation to occur within the
pavement structure which in turn may lead to severe rutting (i.e. permanent deformation)
in the flexible pavement. When there is severe rutting in a flexible pavement, depressions
form at the surface of the pavement along the wheel path. These depressions reduce the
serviceability of the flexible pavement and have a negative impact on the overall
performance of the pavement.

3
Background
The stiffness of the base layer can significantly influence the tensile strains in the
HMA layers and the compressive strains on the subgrade layer of flexible pavements.
Since the stiffness of the base layer depends on the material properties of that layer, the
type of base layer used in a flexible pavement can have an effect on the overall
performance of flexible pavements. Generally, two types of base layers are utilized in the
flexible pavements; unbound aggregate bases and bound (stabilized) aggregate bases.
Unbound aggregate bases consist of untreated granular materials (e.g., naturally-existing,
crushed aggregates) while stabilized bases consist of granular material bounded by a
stabilizing agent (e.g., asphalt emulsion, foamed asphalt, or cement). The functions of all
base layers, regardless of their type, are to provide support for the HMA layer(s) and to
efficiently distribute traffic loads onto subgrade and/or subbase pavement layers.
Load transfer in both unbound and bound bases involves the transference of
traffic-induced stresses along load carrying aggregate chains. The aggregate interlock
between these aggregate chains (and the aggregates in a particular chain) facilitates load
transfer and significantly influences the ability of base layers to withstand traffic loads. In
unbound pavements, aggregate chains consist of continuous columns of aggregates which
actually carry and transfer the load. These continuous columns of aggregates are laterally
supported by the aggregates between individual aggregate chains that do not carry any
load [2]. When a critical load (i.e., failure load) is applied to a base layer, load carrying
chains fail; thus, forcing aggregate particles to realign to form new load carrying chains.
This aggregate realignment process results in permanent deformation (or rutting) which
in turn reduces both the structural capacity and stability of base layers. Studies have

4
shown that permanent deformation in unbound bases is directly related to the load
transfer by the shear in the load carrying aggregate columns [2]. This implies that
aggregate interlock influences the level of permanent deformation in unbound base layers
and the overall flexible pavement structure.
Two types of stresses affect the performance of unbound (untreated) base layers
when traffic loads are applied to flexible pavement. These stresses include the residual
stresses due to compaction of the in-situ material (i.e. subbase and subgrade) and the
vertical stresses due to moving traffic loads. The residual stresses in the granular layers of
flexible pavements are static stresses that generally increase as depth from the surface
increases. The vertical stresses under moving wheel loads create dynamic shear stresses
between adjacent aggregates that are highest directly below the wheel load and decrease
as radial distance from the moving wheel load increases [2]. The ability of the aggregates
in unbound base layers to withstand the combination of these two types of stresses
determines how an unbound base layer will perform. The impact of unbound base layers
on overall pavement performance will therefore depend on the depth of the layer from the
surface and the stiffness properties of the in-situ layers below.
The treatment of untreated granular aggregates with stabilizing agents provides
bound bases with improved stability because stabilization increases aggregate interlock
and facilitates load transfer. However the actual stabilizing agents themselves contribute
very little to the structural capacity of the bound base. There is a variety of stabilizing
agents currently used to treat the base layers of flexible pavements. Some of the
commonly used stabilizers in bound bases include: foamed asphalt, cutback asphalt,
Portland cement concrete (PCC), geogrids, and calcium chloride (CaCl2). The increased

5
aggregate interlock provided by these stabilization agents enables load transfer in bound
bases to be more efficient than the load transfer in unbound bases.
Problem Statement
There is a general consensus among researchers [3, 4, 5, 6, 7, 8, 9, 10] that the use
of stabilizing agents in the base layer of flexible pavements improves the overall
performance of that layer. However, there is limited insight on how different types of
stabilized base layers compare in terms of their impact on the overall performance of
flexible pavements. To better understand the impact of stabilized base layer stabilization
on pavement performance there is a need to conduct a controlled study with pavement
sections that contain different types of bounded base layers. These stabilized base layers
should be constructed with the same thickness, similar aggregates, similar aggregate
gradation, and similar material properties above and below the bound base, in order to
capture the true effect of base layer stabilization on overall pavement performance.
Significance of Study
This study is designed to evaluate the impact of different types of stabilized base
layers on the predicted performance of flexible pavements. Previous studies conducted on
stabilized bases have evaluated how changes in the physical properties of the stabilized
material have affected the overall laboratory performance of the base layer. However, this
study will provide a direct comparison of how the changes in the mechanical responses of
various types of stabilized base layers affect the overall performance of flexible
pavements. Determining the best performing stabilizing agent and aggregate types will
enable state transportation agencies (STAs) to make better informed decisions when

6
selecting base layers for future flexible pavement infrastructure. This will reduce overall
pavement maintenance costs since transportation officials will be able to design flexible
pavements that require less rehabilitation and maintenance throughout the pavement life.
Hypothesis
The fatigue (i.e. tensile strains below the HMA layer) and rutting (i.e. the
compressive strains at the top of the subgrade) performance of flexible pavements that
contain bound bases are more than likely influenced by the type of stabilizing agent used
to treat the base layer.
Goal & Objectives
The main objective of this study is to evaluate the impact of stabilizing agent on
the overall pavement performance. (i.e., bases stabilized using calcium chloride,
emulsified asphalt, Portland cement, and geogrids) and one control base layer (untreated
Reclaimed Asphalt Pavement (RAP) base) on the overall performance and life cycle costs
of flexible pavements that are subjected to similar traffic and environmental conditions.
To accomplish the overall goal, this study involved the following objectives:
Evaluating the impact of stabilized base layers on the mechanical responses of
flexible pavements (stresses and strains), as measured using the field Falling
Weight Deflectometer (FWD) and layered elastic analysis results of five field
sections in the state of Rhode Island.
Conducting Pavement ME Design analyses of the five field sections to
determine which of the four types of stabilized bases improved the overall
performance of flexible pavements the most.

7
Comparing the life cycle costs of each of the pavement sections containing the
four different stabilized bases to that of the section containing the untreated
base in order to determine which stabilized base was the most cost effective to
use in flexible pavements.
Research Approach
The approach utilized to accomplish the overall goal of the study consisted of
several tasks, which included:
Task 1: Conducting Falling Weight Deflectometer (FWD) tests on five field sections
located on Rhode Island (RI) Route 165; one year after construction. These field sections
contained a CaCl2 stabilized base, Portland cement stabilized base, geogrid stabilized
base, bituminous stabilized base, and a control, untreated RAP base. The purpose of this
task was to obtain the pavement deflections of the five field sections after they were
subjected to one year of trafficking.
Task 2: Backcalculating the elastic moduli of all the layers of the five field sections by
analyzing the collected FWD data (or deflections) in the BAKFAA backcalculation
software. The overall purpose of this task was to determine the stiffness (or elastic
modulus) of each layer of the five field sections of RI Route 165 after one year of
trafficking.
Task 3: Computing the critical pavement mechanical responses (i.e. the tensile strains at
the bottom of the HMA layer and the compressive strains at the top of the subgrade layer)
of the five field sections by conducting a layered elastic analysis using the Kenlayer
software and the backcalculated layer moduli obtained for all the sections. This task also

8
involved computing the mechanical responses at the stage of crack initiation in a flexible
pavement. The overall purpose of this task was to gain insight into fatigue cracking
potential of the HMA layer and the total rutting expected in the structure of all the field
sections.
Task 4: Comparing the impact of each of the stabilized/untreated bases on the overall
predicted performance of the entire pavement section by conducting Pavement ME
Design simulations. The purpose of this task was to determine which of the stabilized
bases improved the fatigue and rutting performance of the entire pavement section the
most.
Research Scope
Figure 1 below, shows an illustration of the five field sections evaluated in this
study. These field sections were located on RI Route 165 between utility poles 304 and
521. These pavement sections are part of a controlled study currently being conducted by
RI Department of Transportation (RIDOT) to evaluate their long-term field performance.
Four of the five sections were constructed using stabilized base layers and one was
constructed as a control section using an untreated RAP aggregates base. Four different
stabilizing agents (i.e., calcium chloride, emulsified asphalt, Portland cement, and
geogrids) were utilized to construct the four stabilized base layers. All these sections
were constructed in 2013.
Falling Weight Deflectometer tests were conducted on all five pavement sections
in July 2014; one year after construction. The BAKFAA software was used to
backcalculate the elastic moduli of all the layers of each field section, from the pavement

9
deflections obtained during FWD testing. The Kenpave software was utilized to conduct
a layered elastic analysis of each pavement section after one year after construction and at
the point of crack initiation. The performance of the five pavement sections was predicted
by performing AASHTOWare Pavement ME Design simulations.
Figure 1. Field segment of RI Route 165 analyzed in this study
Connecticut
State Line
Utility Pole 304

10
Chapter 2
Literature Review
This literature review is divided into three components. The first component of
the literature review summarizes the findings of previous studies that have evaluated the
laboratory performance and field performance of the stabilized bases evaluated in the
study. The second component of the literature review provides a detailed description and
background of FWD testing, backcalculation, the Kenlayer software, and the
AASHTOWare Pavement ME software.
Performance of Stabilized Bases
Calcium chloride stabilized base. Calcium chloride is an alkaline earth metal
salt that is most stable in the liquid state. It is a hygroscopic, deliquescent, chemical
compound that absorbs and retains moisture for long periods. The capacity of calcium
chloride to absorb moisture is heavily reliant on the temperature and relative humidity of
the environment. Generally, the absorptive capacity of calcium chloride increases as the
relative humidity of its environment increases [11]. Calcium chloride has traditionally
been used in the pavements industry as a treatment to regulate dust formation in unpaved,
low volume roads [12]. However, in recent time, the use of calcium chloride has been
expanded to base/subbase layer stabilization in flexible pavements. As such, there have
been numerous studies which have investigated the laboratory and field performance of
calcium chloride stabilized bases/subbases to assess how these stabilized bases influence
the overall performance of flexible pavements.

11
Kirchner et al. (1991) [13] conducted a study which evaluated the laboratory
performance of reclaimed base courses stabilized with CaCl2. In this study, the
researchers compared the laboratory performance of the CaCl2 stabilized base with the
laboratory performance of an untreated aggregate base. The study involved a series of
compaction tests which were carried out on both the untreated and CaCl2 stabilized bases.
The researchers also looked at the effect of various amounts of CaCl2 on the reduction of
frost heaving in soil mixes. Kirchner et al. (1991) [13] reported that the water absorbed
by CaCl2 in stabilized bases had a stronger moisture film when compared with the plain
water in untreated bases. This stronger moisture film was mainly attributed to the
alterations the CaCl2 made to the moisture it absorbed. When the moisture was absorbed
by the CaCl2, the calcium chloride increased the surface tension and reduced the vapor
pressure and freezing point of the moisture. It was reported that this strengthened
moisture film, enhanced the lubrication between the base layer aggregates and enabled
greater densities to be achieved with less compaction. Since compaction typically
improves base layer stability and increases the bearing capacity and shear strength of
base layer aggregate, calcium chloride stabilization was found to enhance the bearing
capacity and shear strength of aggregate base layers [13].
In the study, Kirchner et al. (1991) [13] also reported that frost heave was
eliminated when 0.5% of calcium chloride (by weight) was added to untreated aggregates
of the CaCl2 stabilized base. Since frost heave usually leads to permanent deformation in
flexible pavements, CaCl2 stabilization was found to reduce permanent deformation (i.e.
frost damage) in aggregate base layers particularly during freeze-thaw cycles.

12
Shon et al. (2008) [14] conducted a study which evaluated the field performance
aggregate base layers stabilized with Class C fly ash and CaCl2. In this study the
researchers investigated the effect of adding CaCl2 to a fly ash treated roadbed during
construction. Shon et al. (2008) [14] assessed the impact of the CaCl2 on the setting time,
compaction efficiency, and ultimate strength of the stabilized base. This study involved
the construction of three full scale test sections which contained an untreated base, a
stabilized base (treated with 1.3 CaCl2 and 5% Class C fly ash), and a stabilized base
(treated with 1.7 CaCl2 and 5% Class C fly ash). The unconfined compressive strength
and soil suction of the three aggregate bases were evaluated in the laboratory and
dynamic cone penetrometer (DCP) tests were conducted on the full scale base sections
after they were subjected to trafficking by a pickup truck.
Shon et al. (2008) [14]reported that the addition of the CaCl2 to the fly ash
stabilized bases resulted in increased and accelerated strength gains. The researchers also
reported that the soil suction values of laboratory samples which contained CaCl2 was
higher than those that did not contain CaCl2. Since higher suction values typically
indicates a higher potential to increase compression between aggregate particles, the
addition of CaCl2 was found to increase the shear strength of the aggregates in the
stabilized bases. Additionally, Shon et al. (2008) [14] found that the DCP index of the
test sections decreased as CaCl2 content increased. This indicated that the addition of the
CaCl2 to the fly ash treated bases also increased the stiffness of these layers.
In addition to the studies previously outlined, there have been numerous studies
which have evaluated the laboratory and field performance of CaCl2 stabilized bases. The
key findings of some of these studies are outlined in Table 1 below.

13
Portland cement stabilized base. Portland cement (PC) is one of the most
commonly utilized stabilizing agents [15]. Cement stabilization is independent of the
aggregate and occurs during cement hydration; a process that involves a series of
chemical reactions. Portland cement stabilized bases generally consist of a mixture of
pulverized aggregate, Portland cement and water. Portland cement stabilized bases are
usually compacted to a high unit weight and shielded against moisture loss for a specified
curing period [16]. When the mixture of Portland cement, pulverized material, and water
is cured, a hardened material is formed. The plasticity index and permeability of this
hardened material is typically lower than that of untreated aggregates and the strength of
the hardened material is generally higher than that of untreated aggregates as well [16].
Many studies have evaluated the effectiveness of using cement stabilized bases in
flexible pavements. These studies have analyzed both the laboratory and field
performance of cement stabilized bases. Jones et al. (2015) [17] conducted a study which
compared the relative field performance of full scale test sections which underwent full-
depth reclamation (FDR) with Portland cement and no stabilization. The test sections
evaluated in the study were subjected to accelerated load testing using a heavy vehicle
simulator (HVS) and the stiffness, cracking, rutting, and moisture susceptibility of the
pavement sections were monitored. Jones et al. (2015) [17] reported that permanent
deformation on the surface of the Portland cement FDR section was significantly lower
than that of the non-stabilized FDR section after testing. This was because the terminal
average maximum rut depth (13 mm) was met on the non-stabilized FDR section after
335,000 load repetitions while the average maximum rut recorded on the Portland cement
FDR section was 3.0 mm after 1.5 million load repetitions. Jones et al. (2015) [17]

14
reported that no cracking was observed on either section after testing. The researchers
also concluded that the stiffness of the recycled layer in the Portland cement FDR section
was significantly higher than that of the non-stabilized FDR section before and after the
sections were subjected to trafficking.
In addition to the study conducted by Jones et al. (2015) [17], numerous studies
have been conducted to evaluate the field and laboratory performance of cement
stabilized bases. The key findings of some of these studies are summarized in Table 1
below.
Table 1
Summary of key findings of previous studies which have evaluated the laboratory and
field performance of cement stabilized bases
Author Key Findings
Wang et al.
(2010) [18] Shrinkage cracks which form during cement hydration negatively
impact performance of cement treated bases.
Shrinkage stress in base layers increases as cement dosage
increases.
Cement treated base containing a cement dosage of 3% to 4% had
the lowest dry-shrinkage potential.
Singh et al.
(2007) [19] Increase in cement content increases the maximum dry density
(MDD) and decreases the optimum moisture content (OMC) of
laboratory compacted cement stabilized fly ash bases.
MDD of cement stabilized fly ash bases is comparably lower than
that of similarly graded natural soil.
Increase in cement content exponentially increases the CBR value
of cement stabilized fly ash bases.
Taha et al.
(2002) [20] Ability of RAP aggregates to function as a structural component of
pavement is enhanced when they are stabilized with cement rather
than blended with only virgin aggregate.
Cement stabilized RAP virgin aggregate mixtures appeared to be a
viable alternative to dense graded aggregate in road base
construction.

15
Geogrid stabilized base. A geogrid is a type of geosynthetic manufactured from
synthetic polymer materials. Geosynthetics are generally used in flexible pavements to
provide reinforcement, separation, filtration, and drainage. [21]. Geogrids are generally
used in the subbase and granular layers of flexible pavements in order to provide
reinforcement for those layers. Studies have found that geogrids limit the amount rutting
and fatigue in flexible pavement [8]. This is generally attributed to three main
mechanisms which are inherent in all geogrids. These mechanisms are: lateral
confinement, increased bearing capacity, and the “tensioned membrane” effect.
Geogrids laterally confine base layer aggregates at the interface of the geogrid and
base layer aggregate. The lateral confinement typically leads to the formation of frictional
forces at the interface of the geogrid reinforcement and the aggregates in the base layer.
When flexible pavements are subjected to vertical stresses due to traffic loads, base layer
aggregates tend to shift laterally. This causes the base layer aggregates to transfer shear
loads to the geogrid at the geogrid to aggregate interface, which in turn creates tensile
forces in the geogrid [8]. The horizontal tensile strains in the base layer are then reduced
by the tensile strength of the geogrid as illustrated in Figure 2 below. Additionally, the
horizontal confinement created by geogrid reinforcement also increases the average stress
of the base layer aggregates and this in turn increases the shear strength of these
aggregates.

16
Figure 2. Lateral confinement mechanism of geogrid: (Zornberg et al. (2010) [8])
The increased bearing capacity mechanism in geogrids enables them to provide
additional reinforcement for the base layer aggregates of flexible pavements. The
reinforcement provided by geogrids creates an alternative surface (plane) of failure in the
base layer where there is increased bearing capacity [8]. This is shown in Figure 3 below.
This alternative plane of increased bearing capacity reduces the magnitude of the shear
stresses transferred to the subbase or subgrade layers and provides additional vertical
confinement outside the area loading in the base layer.
Base Layer
Subgrade Layer
HMA Layer
Horizontal Confinement due to
friction
Wheel load
Flow
of
Shear force
Geogrid Reinforcement

17
Figure 3. Increased bearing capacity mechanism of geogrid: (Zornberg et al (2010) [8])
In addition to providing confinement, geogrids provide support for wheel loads
through the “tensioned membrane” effect. Geogrids act similar to tensioned membranes
when there is significant deformation in flexible pavements. Geogrids develop a concave
shape when there is large permanent deformation as shown in Figure 4 below. When
traffic loads are applied directly in the wheel paths of flexible pavements, geogrids
provide vertical reactive forces which support the wheel loads. These vertical reactive
forces also cause the compressive stress on the subgrade layer to decrease [8]. Large
deformations in the pavement are usually required in order to mobilize the tension in the
geogrid which creates these reactive forces.
Base Layer
Subgrade Layer
HMA Layer
Wheel load
Reinforced
Shear Surface
Unreinforced
Shear Surface
Geogrid Reinforcement

18
Figure 4. Tensioned membrane mechanism of geogrid: (Zornberg et al. (2010) [8])
A study by Abu-Farsakh et al. (2011) [22] evaluated the laboratory performance
of geogrid reinforced bases in flexible pavements using cyclic plate load testing. Four
different types of geogrids with different geometries, mechanical properties, and physical
properties were utilized in the study. A cyclic load was applied to flexible pavement test
sections which were constructed with and without geogrid reinforcement inside a box.
Testing was conducted on two unreinforced sections, four reinforced sections; with a
geogrid layer placed at the base/subbase layer interface, two reinforced sections; with one
geogrid layer placed at the middle third of the base layer, and a reinforced section; with
one geogrid layer placed at the upper one third of the base layer. These cyclic plate load
tests were carried out in order to evaluate the impact of the geogrid geometry, location
and tensile strength on the stress distribution and permanent vertical strain in the
subgrade. Testing results, according to Abu-Farsakh et al. (2011) [22], indicated that use
of geogrid base reinforcement extended the service life of flexible pavement sections.
The researchers also determined that the use of geogrids in the upper one third of the base
layer improved the overall performance of the stabilized base. Additionally, Abu-Farsakh
Base Layer
Subgrade Layer
HMA Layer
Wheel load
Vertical Reactive Forces
Tension in
Geogrid
Geogrid Reinforcement
Wheel path

19
et al. (2011) [22] concluded that geogrid helped to redistribute the applied loads over a
wider area on top the subgrade. This caused less permanent deformation to accumulate in
the subgrade and reduced the overall rut depths of the pavement.
Wu et al. (2015) [23] conducted a study which evaluated the effect of geogrid
reinforcement on unbound granular pavement base materials. Four types of geogrids;
with different apertures and strengths were evaluated in the study. Two of the geogrids
evaluated in the study consisted of two and three layers of high strength, biaxial,
polypropylene respectively while the other two geogrids consisted of a single layer of
punched-drawn biaxial polypropylene. Loaded wheel tester (LWT) tests were conducted
on compacted base course specimen to simulate actual service conditions and the rut
depths of the base specimen and were measured along the loading path. Cyclic plate load
tests were also conducted on the geogrid reinforced base course specimen. Testing results
according to Wu et al. (2015) [23] indicated that the rut depths of all the geogrid
reinforced base layer specimen was less than that of the control specimen with no
reinforcement. The researchers reported that the triple layered high strength,
polypropylene geogrids showed significant improvement in reinforcement when it was
used in river sand bases while the single layered, biaxial polypropylene geogrid was the
most effective geogrid in reinforcing grave bases.
Bituminous stabilized base. The modification of untreated soil material
(aggregates) by emulsified asphalt is referred to as bituminous stabilization. Bituminous
stabilization of base layer aggregates generally consists of a three stage process. This
process includes the blending of aggregates, compaction, and the application of
emulsified asphalt. The base layer aggregates are initially blended in order to alter the

20
gradation of the in place material. This change in aggregate gradation facilitates
compaction; which is performed to increase aggregate interlock in the base layer [4].
Emulsified asphalt is added to the untreated base layer aggregates in order to increase soil
strength through aggregate adhesion. Bituminous stabilization generally decreases the
soil permeability of base layers in flexible pavements and increases aggregate interlock,
soil strength, and durability.
Cold recycling is a common method used to stabilize base layers with emulsified
asphalt. The process of cold recycling involves milling, mix design, binder addition,
placement, compaction, and quality assurance [24]. The emulsified asphalt in cold
recycled asphalt functions as an adhesive agent while the aggregates usually consist of
the RAP. Studies have shown that the performance of cold recycled asphalt base layers
can be improved by using additives such as fly ash, cement, and lime [4]. However, other
studies have indicated that the presence of aged binder around the RAP aggregates can
cause cold recycled asphalt bases to perform poorly.
Wu et al. (2006) [25] conducted a study to evaluate the field performance of
foamed asphalt base materials. This study involved accelerated pavement testing on three
identical, full-scale test sections. The base layer of the control test section in the study
consisted of crushed stone and the base layer of the other two test sections consisted of a
foamed asphalt blend. A 50% RAP and 50% recycled soil cement foamed asphalt blend
was used in the base layer of one test section and a 100% RAP foamed asphalt blend was
used in the base layer of the other test section. The accelerated pavement testing was
performed using an accelerated load facility (ALF) wheel assembly and the surface

21
deflections, surface rut depths and cracking maps of the full scale test sections were
monitored during testing.
The results of the testing according to Wu et al. (2006) [25] indicated that the
foamed asphalt bases performed similarly under the initial load level of 43.4 kN and this
performance was found to be better than that of the crushed stone base. However, the
researchers reported that the rutting rates on both foamed asphalt bases was higher than
that of the crushed stone base when the load level was increased. Wu et al. (2006) [25]
determined that the high rutting rates on the (50% RAP and 50% recycled soil cement)
foamed asphalt base test section was due to the water susceptibility and weak aggregate
skeleton of the foamed asphalt base. The researchers also determined that the high rutting
rates on the (100 % RAP) foamed asphalt base test section was due to the poor water
resistance and over asphalting of the foamed asphalt base.
Lane et al. (2012) [26] conducted a study which evaluated the long term
performance of a flexible pavement which underwent a full depth reclamation with
expanded asphalt. The study involved the construction of a full depth reclamation with
expanded asphalt stabilization on the Tans Canada Highway between the cities of Sault
Sainte Marie and Wawa, in Northern Ontario, Canada. The study evaluated three
highway sections which were constructed with different expanded asphalt mix designs
and a control section which was constructed with HMA. The researchers monitored the
field sections annually for 10 years using an Automated Road Analyzer (ARAN) which
measured rutting and IRI.

22
Lane et al. (2012) [26] reported that the pavement remained smooth on the
expanded asphalt sections since in the IRI was less than 1 after 10 years. The researchers
also reported that the condition of the expanded asphalt sections was excellent since the
Pavement condition index (PCI) was greater than 85 after the 10 year evaluation period.
Lane et al. (2012) [26] concluded that the control section deteriorated at a much faster
rate than the expanded asphalt stabilized pavement sections during the 10 year period.
Background of Testing and Analysis Procedures
Falling Weight Deflectometer testing. Falling Weight Deflectometer testing is a
nondestructive method of testing used to obtain the deflection basin of flexible
pavements. A Falling Weight Deflectometer is a deflection testing instrument which
operates based on the impulse loading principle [27]. In FWD testing, a drop weight or
variable load is released from set heights and allowed to fall under gravity onto
cylindrical shock absorbers. These shock absorbers then transfer an impulse load to a
spring loaded plate which rests on the surface of the pavement. The variable load is
typically 9000 lb (40kN) and the diameter of the spring loaded plates is usually 11.82 in.
(30cm) [27]. The pavement response to the impulse load (i.e. deflections is measured
using seven velocity transducers (geophones) that are placed at specific radial distances
from the center of the applied load or plate [27]. These radial distances are usually given
the designations D0, D1, D2, D3, D4, D5, and D6 [28]. The maximum pavement deflection
is recorded directly under the load at the D0 location and the remaining six geophones are
generally placed radially out from the center of the load at 12 in (30.48 cm) intervals
[28]. Therefore the D1 geophone is placed at 12 in from the center of the load and the D6

23
geophone is placed 72 in (182.88 cm) from the center of the load. A typical setup of
FWD testing is shown in Figure 5 below.
Figure 5. Schematic of Falling Weight Deflectometer testing: (Mehta et al. (2003) [27])
Backcalculation. Backcalculation is often referred to as the “inverse” problem of
determining material the properties (i.e. layer moduli) of a flexible pavement from its
response to surface loading [27]. Backcalculation is an ill-posed process in which
iterative or optimization methods are utilized to compute theoretical deflections. These
deflections are calculated by varying the layer moduli of the pavement until a tolerable
“match is made with measured field deflections obtained from FWD testing [29].
Backcalculation is based on the half-space theory where a pavement is assumed to be a
homogenous, isotropic, linear-elastic half-space [30].
Computer programs are usually used to perform backcalculation of multi-layered
systems. These computer programs allow users to input estimated initial or “seed” moduli
HMA Layer
Base Layer
Subgrade
Subbase Layer
D6
Variable Load
Geophones
Measured Deflection Basin
Plate
D5D2 D3 D4D0 D1

24
values for the various layers of a pavement. A subroutine program within the
backcalculation software utilizes a particular type of analysis (finite element or multi-
layer) to compute the corresponding theoretical deflections based on the inputted moduli
values [29]. The final layer moduli outputted by the backcalculation software represents
an “effective” layer moduli which adjusts for stress-sensitivity and discontinuities. The
allowable range of the computed layer elastic moduli depends on the computer software
used to perform the backcalculation [29].
The BAKFAA backcalculation software. BAKFAA is a backcalculation
computer software developed by the Federal Aviation Administration (FAA). This
software is used by the FAA to analyze field deflections of airport pavements. The
subroutine program in the BAKFAA software computes theoretical deflections by
matching the radius of curvature of the measured and calculated deflection basins. This
minimizes the error between the calculated and measured deflections. Matching the
radius of curvature of the computed and measured deflection basins ensures that more
representative elastic moduli values are outputted by the software because the pavement
stiffness is strongly related to the radius of curvature of the deflection basin [29]. The
analysis of deflection data with the BAKFAA software stops when the error value
between the radius of curvature of the measured and calculated deflections is less than or
equal to a minimum threshold value. The allowable range for the computed deflections or
elastic moduli in the BAKFAA software is (+/-) 20%.
The Kenlayer software. Kenlayer is a component of the Kenpave computer
program; which consists of a suite of pavement analysis and design software. The
Kenlayer software is a computer program commonly used to compute the stresses and

25
strains in elastic multilayered systems that are subjected to circular loads. Generally, the
solutions provided by Kenlayer analyses can be superimposed for multiple wheel loads,
applied iteratively for non-linear layers, and collocated at various periods for viscoelastic
layers [31]. Hence, this software can be used to analyze single and multiple wheel loads
acting on pavements with elastic, viscoelastic, linear or nonlinear layers.
The analyses performed by Kenlayer software are based on the layered elastic
theory. The layered elastic theory assumes that the stress, strains, and deflections created
by concentrated loads can be integrated to obtain the mechanical responses created by a
circular loaded area [31]. Several other assumptions are made in linear elastic analyses.
These assumptions include: a) the stress in each pavement layer is proportional to the
strain in accordance with Hooke’s Law; b) each pavement layer (with the exception of
the lowest layer) is finite, homogenous, and isotropic; c) the pavement extends infinitely
in the vertical and horizontal directions; d) the vertical and horizontal displacements of
pavement material is continuous across the layer interfaces [31].
AASHTOware Pavement ME software. The AASHTOware Pavement ME
software is based on the mechanistic-empirical design approach to flexible pavements.
This approach to flexible pavement design involves the use of mechanistic models to
predict pavement performance. The AASHTOware Pavement ME software was
developed to incorporate the effect of climate, material properties, traffic, and damage
accumulation when designing flexible pavements. The software uses an iterative process
to predict the level of distress that may arise in a flexible pavement. This iterative process
uses stresses, strains, and deflections to determine the incremental damage that may
accumulate in a pavement structure over its design life [32]. The level of pavement

26
distress predicted by the AASHTOware Pavement ME software is set against reliability
values which determine whether the flexible pavement passes specific distress criteria.
The AASHTOware Pavement ME software allows users to input three levels of
hierarchal inputs based on the method the users utilized to obtain the resilient moduli of
the pavement layers. Level 1 inputs are entered in the software if the resilient moduli of
the pavement layers were obtained from site specific testing, level 2 inputs are used in
Pavement ME if the resilient moduli were obtained from correlations with standard tests
and level 3 moduli are utilized in the software if the resilient moduli obtained were
obtained from local or national default values [32]. The software also permits users to
specify the amount of vehicles that are expected to traverse the pavement based on their
vehicular classification. It then uses the traffic data inputted by the user to replicate the
traffic conditions that a flexible pavement may typically experience throughout its design
life. An illustration of the vehicle classifications used in the AASHTOware Pavement
ME for analysis is shown below in Figure 6.
The AASHTOware Pavement ME software also utilizes an Enhanced Integrated
Climatic Model (EICM) to simulate the moisture, temperature, and freezing conditions
that a flexible pavement may be subjected to throughout its design life [32]. The EICM
includes weather databases from the National Oceanic Atmospheric Administration
(NOAA) and the soil index from the long term pavement performance (LTPP) program
and the United States Geological Surveys (USGS). The EICM accounts for the monthly
air temperature and precipitation a pavement will experience by using data from the
weather station closest to the pavement. The software allows the user to specify the

27
weather station that is nearest to the pavement prior to the AASHTOware Pavement ME
analysis.
Figure 6. Vehicle classifications based on number of axles

28
Chapter 3
Pavement Sections, Analysis Procedures & Inputs
This section outlines the construction and analysis procedures utilized to evaluate
the pavement sections considered in the study. Five field sections located on Route 165
(between utility poles 304 and 521) in Rhode Island (RI) were evaluated in this study.
These sections are part of a controlled study currently being conducted by RI Department
of Transportation (RIDOT) to evaluate their long-term field performance. Four of the five
sections were constructed using stabilized base layers and one was constructed as a
control section using untreated Reclaimed Asphalt Pavement (RAP) aggregates base.
Four different stabilizing agents (i.e., calcium chloride, emulsified asphalt, Portland
cement, and geogrids) were utilized to construct the four stabilized base layers. All these
sections were constructed in 2013. Figure 7 presents the typical pavement structure
utilized in all five sections selected for this study.
Figure 7. Pavement structures of all five pavement sections

29
Geology of Rhode Island Route 165
RI Route 165 was initially constructed on soft, swampy soil. During its
reconstruction in 1986, soil material that was unconducive to pavement construction was
removed, and an embankment was floated on the soft soil. The natural soil at the time of
reconstruction contained deposits of sand, gravel, silt, peat, and organic silt [33]. Based
on the results of boring tests, researchers concluded that RI Route 165 was constructed on
glacial till and stratified kame [33]. The natural soil beneath RI Route 165 has a plasticity
index of zero, a low shrink-swell capacity, and a soil classification that ranges from A-1
to A-4 (based on the AASHTO soil classification). It is important to note that the natural
soil has a high water table due to the presence of granite near its surface as well as a high
susceptibility to frost action.
Rhode Island Route 165 Pavement Section Overview
As can be seen from in Figure 7 above, all sections of RI Route 165 have a 4.5 in.
(114.3 mm) HMA pavement layer (i.e., 2 in. (50.8 mm) surface and 2.5 in. (63.5 mm)
intermediate courses). The base layers (treated or untreated) in all sections had a
thickness of 8 in. (203.2 mm) (Figure 7) and was overlaid on top of a 1 in. (25.4 mm)
crushed gravel subbase layer. In addition to having the same pavement structure (i.e.,
similar layer thicknesses), the gradation of the base layers of all the test sections was
similar; with 95% to 100% passing the No.3 sieve (0.265 in. (6.7 mm)) and 2% to 15%
passing the No.200 sieve (0.0029 in. (75 μm). Additionally, all sections were subjected
to the same traffic and environmental conditions. This is the case because all sections are
located adjacent to each other along RI Route 165. Since traffic and environmental

30
conditions as well as pavement structure for all sections were similar the impact of base
type on overall performance of these sections can be investigated. This is because the
only difference in the pavement sections was base layer type. The following subsections
provide a discussion of the materials and procedures used to construct the base layers in
each of these sections.
Section containing calcium chloride (CaCl2) stabilized base. The section
containing the CaCl2 treated base is 9332 ft. (≈ 2844 m.) long starting at utility pole 304
and ending on utility pole 369 on RI Route 165. This section underwent a Full Depth
Reclamation (FDR) process in which a CaCl2 solution, prepared in accordance to
AASHTO M144 standards “Standard Specification for Calcium Chloride,” was utilized
to stabilize the base layer (8 in. thick in Figure 6 above). This solution consisted of
approximately 35 % ± 1% alkali chloride, 2% sodium chloride, and 0.1 % magnesium
chloride. A total volume of 0.8 gallons per square foot (3.40 L/m2) of CaCl2 solution was
applied to and mixed with the reclaimed aggregates to a depth of 7.87 in (20 cm) using a
pressure distributer. The rate of application was 0.1 to 2 gallons per square yard [33].
Vibratory sheep foot rollers and motorized graders were utilized to grade and compact
the CaCl2 treated aggregate. The compaction quality was deemed satisfactory when the
field density was approximately 95% or higher than that measured in the laboratory (i.e.,
Proctor density). The dry density of the CaCl2 stabilized base was 131.1 lb/ft3 (20.6
kN/m3). It is important to note that the target in place density was the same for all the
field sections. It is also noteworthy that the same grading and compaction equipment
were utilized to compact all base layers for all five sections considered in this study.

31
Control section containing untreated (RAP) base. The control section
containing the untreated RAP base layer is a 2650 ft. (≈ 808 m.) long starting a utility
pole 369 and ending at utility pole 400 on RI Route 165. Similar to the section containing
the CaCl2 base discussed above, the control section also underwent a FDR process in
which the existing pavement was pulverized and used as aggregates for constructing an
untreated base [33]. These untreated reclaimed aggregates were then compacted using the
equipment discussed above. The dry density of the untreated RAP base was 129.1 lb/ft3
(20.4 kN/m3).
Section containing Portland cement stabilized base. The section containing the
Portland cement stabilized base is approximately 15700 ft. (≈ 4785 m.) long starting at
utility pole 400 and ending at utility pole 506 on RI Route 165. This section underwent a
FDR process in which Portland cement was utilized to stabilize the base layer. The FDR
process involved the pulverization and blending of existing RAP aggregates using a
reclaimer followed by the addition of 3.5 lb./ft.2 (17.4 kg/m2) or 4% by total sample
weight of Portland cement [34]. A cement spreader was used to distribute dry cement
over the over the pulverized material. The cement spreader contained a tractor trailer with
a pressure controlled “Drop behind system”. This system was calibrated daily to ensure
that 3 lbs/yd2 (1627.5 g/m2) of dry cement was distributed over the pulverized material
[33]. Water was then supplied to the mixing chamber of the reclaimer via a water truck,
and the reclaimer was passed over the pulverized material (a second time) in order to mix
the cement-treated material to a required depth [34]. After the cement treated material
was mixed, it was compacted and graded. The dry density of the cement stabilized base
was 127.3 lb/ft3 (20.0 kN/m3).

32
Section containing geogrid stabilized base. The section containing the geogrid
stabilized base geogrid base segment is approximately 3500 ft. (≈ 1066 m.) long starting
at utility pole 506 and ending at utility pole 518 on RI Route 165. This section underwent
mechanical stabilization using geogrids. The type of geogrid utilized was manufactured
from polypropylene and had triangular apertures. The selected geogrid was used as
reinforcement in bases constructed using the pulverized aggregates [33]. The goal of
using geogrids was to evaluate the potential benefits of using geogrids in stabilizing
aggregate base layers. The dry density of the geogrid stabilized base was 129.9 lb/ft3
(20.4 kN/m3).
Section containing bituminous stabilized base. The section containing the
bituminous stabilized asphalt base is 6600 ft. (≈ 2012 m.) long starting at utility pole 518
and ending at the Connecticut state line. This section underwent a FDR process in which
asphalt emulsion, prepared in accordance to AASHTO T-40 standards “Standard
Specification for Asphalt Emulsion Sampling, Storage, and Handling,” was utilized to
stabilize the base layer. The type of asphalt emulsion used to stabilize the base layer was
an anionic medium to rapid setting (HFMS-2) asphalt emulsion [33]. The asphalt
emulsion was heated to between 212F to 248 F (100oC and 120oC), mixed thoroughly
into the base layer during the FDR, and allowed to cure for 5 days. The asphalt emulsion
was applied using a spray nozzle and then mixed uniformly with the pulverized aggregate
materials reclaimed from existing pavement. The mixture was then compacted using the
previously discussed equipment. The dry density of the bituminous stabilized base was
126.1 lb/ft3 (19.8 kN/m3).

33
Falling Weight Deflectometer Testing Procedure
Falling Weight Deflectometer (FWD) tests were conducted on the westbound and
eastbound directions of all the sections discussed above. These tests were conducted in
July 2014. The pavement temperature at the time of testing was 70oF (21.1oC). The FWD
tests were carried out by applying four loads (i.e., 6612 lbs [≈29.4kN], 9256 lbs [≈41
kN], 13,224 lbs [≈58.8 kN], and 17,631 lbs [≈78.4 kN]) to the pavement sections and
measuring deflections at varying locations from the center of the applied loads. The loads
were allowed to fall under gravity onto two plates which contained (9+9) buffers. The
radius of these plates was 5.91 in. (150 mm). The 6612 lbs (≈29.4 kN) load was initially
applied to the pavement sections followed by the 9256 lbs (≈41 kN), 13,224 lbs (≈58.8
kN), and 17,631 lbs (≈78.4 kN) loads. The pavement deflections were then measured
using seven geophones. These geophones were placed that were placed at 0 in. (0 mm),
7.87 in. (≈200 mm), 11.81 in. (≈300 mm), 17.72 in. (≈450 mm), 23.62 in. (600 mm),
35.43 in. (≈900 mm), and 47.24 in. (1200 mm) away from the center of the load.
There were forty six points of FWD testing in total conducted along the five
sections of RI Route 165 immediately after construction. There were 10 test points on the
CaCl2 stabilized base section of the highway; five in the westbound direction and five in
the eastbound direction. There were six locations on the untreated (control) base section
with three test points in both the westbound and eastbound directions. On the cement
stabilized base section, there were eight test points in both directions of travel (i.e. the
westbound and eastbound directions). There were six points of FWD testing on the
geogrid stabilized base section; three in the eastbound direction and three in the

34
westbound direction. There were also eight points of FWD testing on the bituminous
stabilized section with four test points in both the westbound and eastbound directions.
Backcalculation Procedure and Inputs
The BAKFAA software was used to analyze the pavement deflections obtained
from the FWD testing at the various test locations along RI Route 165. These deflections
are shown in Appendix A. The backcalculated layer moduli of all the pavement sections
were obtained from the analysis of the July 2014 FWD data. The following procedure
explained below was utilized to backcalculate the layer moduli of all the pavement
sections:
a. Fix the subgrade modulus value so that the computed and measured deflections at
the sensor 7 in Figure 8 (i.e. the geophone furthest from the applied load)
matched. If the backcalculated subgrade moduli values along a pavement section
were within 15% of each other, the average of these values were locked as the
subgrade modulus for that entire pavement section. This guaranteed that the
subgrade modulus values along individual pavement sections were consistent.
Figure 8. Measured and calculated deflections in BAKFAA software

35
b. Fix the subbase, base and HMA moduli values so that the computed and
measured deflections at sensor 5, sensor 4, or sensor 3 exactly matched. If the
backcalculated subbase, base, and HMA layer moduli along a pavement section
were within 20%, the average backcalculated modulus value for each pavement
layer was determined. These average values were then locked as the subbase,
base, and HMA layer moduli of the pavement section. It is important to note that
more variability was allowed in the backcalculated moduli of the upper layers
(i.e. HMA, base and subbase layers) because they take the majority of the load
[35]. Therefore it was expected that there would have been naturally more
variability in these layers.
c. Ensure that there was no swapping or crossover between the measured and
calculated deflection basins. This step guaranteed that the radius of curvature of
both the measured and calculated deflections was similar. Swapping refers to a
situation where the computed deflections in a pavement layer are noticeably
higher than the measured deflections while the computed deflections in the
pavement layer above is markedly lower than the measured deflections.
Swapping causes the backcalculated modulus in a pavement layer to be higher
than backcalculated modulus in the neighboring layer above. When swapping
occurred, an iteration was performed with the two layers combined and an
equivalent backcalculated modulus was obtained for both layers [27].
Kenpave Analysis Procedure and Inputs
A layered elastic analysis of the pavement sections was performed using the
Kenpave software; a layered elastic analysis software .The backcalculated layer moduli

36
for each pavement section were used as inputs for the layered elastic analysis. The
layered elastic analysis was performed to compute critical pavement mechanical
responses in the pavement sections. These mechanical responses included the tensile
strains at the bottom of the HMA layer, the compressive strains at the top of the subgrade
layer and the total vertical displacement for the entire pavement structure. The bottom of
the HMA layer is located 4.5 in. (114.3 mm) from top surface of the pavement sections
and the top of the subgrade is located 13.5 in. (342.9 mm) from top surface as well. This
is illustrated in Figure 7. The tensile strains at the bottom of the HMA layer were
computed because they usually provide insight into fatigue cracking potential within that
layer [1]. The compressive strains and total vertical displacement were also computed
because they both provide indications about the total rutting expected in the pavement
structure [1].
In addition to the computing the mechanical responses from backcalculated
moduli immediately after construction (i.e. FWD data obtained in July 2014), the
mechanical responses were also computed at the stage of cracking initiation in a flexible
pavement. Researchers [36] have reported that this stage (i.e., crack initiation in flexible
pavements) occurs when the moduli values of the HMA layers are reduced by 50% from
their initial values immediately after construction. It is important to note that the 2014
backcalculated moduli values were considered as the “initial” (or immediately after
construction) values in this study, despite the fact that the sections discussed above were
constructed in 2013. The 2014 backcalculated moduli values were considered as the
initial moduli values because no FWD testing was conducted at the time of constructing

37
the sections. Kenlayer was also utilized to compute the critical mechanical responses at
the stages of crack initiation.
An 18-kip (≈ 80 kN) load was utilized in the Kenlayer analysis to compute the
selected mechanical responses. Comparisons between the Kenlayer outputs (i.e., critical
mechanical responses) were then carried out to determine the impact of the varying base
stabilizing agents (or stabilized base) on pavement performance.
Pavement ME Design Simulation Inputs
Pavement ME Design simulations were conducted in order to compare the impact
of each of the bases (stabilized or untreated) on the overall predicted performance of the
entire pavement section. The inputs utilized in these simulations were level 3 inputs. To
determine a vehicle class distribution that was representative of traffic on RI Route 165,
data collected from Weigh in Motion (WIM) stations in close proximity to Route 165
were analyzed. The moduli values backcalculated from the 2014 FWD data were also
utilized as inputs in the Pavement ME Simulations along with the layer thicknesses
presented in Figure 7 above. In addition, climate data obtained from a weather station
located in Providence, RI were used as inputs for the Pavement ME Design simulations.
Table 2 below presents a summary of all inputs utilized in conducting the Pavement ME
Design simulations. Upon completion of the Pavement ME Design simulations, the
predicted rutting and fatigue cracking performance measures were compared for all
sections to evaluate the impact of the various stabilizing agents (or stabilized base layers)
on overall pavement performance.

38
Table 2
Summary of Pavement ME design inputs
Vehicle
Class
Distribution
(%) Other Inputs
Class 4 06.62 AADT 5800
Class 5 68.59 AADTT 240
Class 6 09.37 Traffic Growth Rate (%) 1.3
Class 7 01.64 HMA Thickness (in.) 4.5
Class 8 03.41 Base Thickness (in.) 8
Class 9 10.10 Subbase Thickness (in.) 1
Class 10 00.23 Surface Course HMA Binder
Grade PG 64-28
Class 11 00.00 Intermediate Course HMA Binder
Grade PG 64-22
Class 12 00.00 Base Modulus (psi) Varies*
Class 13 00.04 Subbase Modulus (psi) Varies*

39
Chapter 4
Results, Analysis & Discussion
Backcalculated Moduli Values
The results of the backcalculation analysis procedure implemented in this study to
determine the values of the layer moduli for the five pavement segments are presented in
this section. The average backcalculated moduli for the HMA, base, subbase, and
subgrade layers of all the pavement sections (i.e. the CaCl2 stabilized, the untreated, the
cement stabilized, the geogrid stabilized, and the bituminous stabilized base sections) are
presented in Table 3 below. The coefficient of variation between the backcalculated layer
moduli for each layer along the five pavement section is also presented in Table 3.
Based on the results illustrated in Table 3, it can be concluded that the coefficient
of variation between the backcalculated subgrade moduli along each pavement section is
less than/or equal to 0.15 (or 15%). These results indicate that the values of the
backcalculated subgrade moduli along individual pavement sections are consistent. It is
also important to note that the average percent difference between the backcalculated
subgrade moduli of all the pavement sections analyzed is 19.4%. This implies that the
moduli values for the subgrade layer are relatively consistent across all five pavement
sections since the allowable range for computed deflections in the BAKFAA software is
+/-20%. Additionally, the backcalculated moduli values of the HMA, base, and subbase
layers along each pavement section are also consistent since the coefficient of variation
between the moduli values for these layers is less than or equal to 0.20 (20%) on each
section. This coefficient of variation falls within the +/-20% allowable range for

40
computed deflections in the BAKFAA software. As was mentioned previously, a larger
variability was expected in the HMA, base and subbase layers of the pavement sections
because these layers were subjected to the majority of the applied load.
Table 3
Average backcalculated layer moduli values for each pavement section immediately after
construction
Pavement Section Backcalculated Layer Moduli, psi
HMA Base Subbase Subgrade
(Control) Untreated RAP Base 255,771 35,663 31,924 35,122
Coefficient of Variation
0.09 0.15 0.06 0.11
Bituminous Stabilized Base 199,219 43,711 36,502 28,230
Coefficient of Variance (%)
0.17 0.06 0.16 0.15
CaCl2 Stabilized Base 430,625 37,948 43,471 39,364
Coefficient of Variation
0.06 0.13 0.01 0.14
Cement Stabilized Base 316,440 126,817 43,536 31,736
Coefficient of Variation
0.20 0.06 0.10 0.11
Geogrid Stabilized Base 286,250 24,102 33,287 28,627
Coefficient of Variance (%)
0.00 0.10 0.01 0.15
Validation of backcalculated base layer moduli. The backcalculated base layer
moduli for all sections were verified by comparing the average base layer modulus value
along individual pavement sections to results obtained from a previous study [37]. In that
study, the resilient moduli of samples of the same stabilized/untreated base layers
considered in this study were investigated. The researchers prepared 5.90 in. (15 cm)

41
diameter specimens of the stabilized/untreated bases by blending virgin and RAP
aggregates from the full depth reclamation on RI Route 165 and applying treatment to the
RAP blends in accordance with RIDOT project specifications. The researchers then
compacted the specimen and conducted cyclic triaxial tests on the samples. The triaxial
tests consisted of two phases in which a uniform cyclic stress was applied for 500
compression cycles and a varying cyclical stress was applied for 15 compression cycles
[37]. The confining pressures ranged from 2.9 psi to 20.0 psi (20 kPa to 138 kPa) while
the cyclic stress amplitudes ranged from 2.9 psi to 40 psi (20 kPa to 275 kPa). From the
laboratory tests, the range of the resilient modulus for each base (stabilized/untreated)
was obtained. The backcalculated and laboratory-measured moduli values for all base
layers considered in the study are shown in Table 4 below.
As illustrated in Table 4, the backcalculated base layer modulus of each pavement
section falls within the range of laboratory-measured moduli values obtained from
samples of corresponding pavement sections. This suggests that the backcalculated
moduli values for the base layers are appropriate for use in additional analyses. This also
implies that the backcalculated moduli values of the layers below the base layer (i.e. the
subbase and subgrade) are also suitable for the analysis because the base layer modulus is
strongly influenced by the modulus of these layers [27]. Since the backcalculated moduli
values of the base, subbase, and subgrade layers are appropriate for the analysis, these
layers values are therefore validated.

42
Table 4
Backcalculated and laboratory-measured moduli values for base layers
Base Layer Backcalculated
Moduli, psi
Laboratory-Measured
Moduli, psi*
(Control) Untreated RAP
Base
35,663
24,802 to 83,832
Bituminous Stabilized Base 43,711
25,672 to 53,809
CaCl2 Stabilized Base 37,948
34,229 to 82,381
Cement Stabilized Base 126,817
76,580 to 275,282
Geogrid Stabilized Base 24,102
24,802 to 83,832
Comparison of backcalculated layer moduli of pavement sections. A
comparison of the backcalculated moduli values of all the pavement sections immediately
after construction is presented in Figure 9 below. The results presented in this figure
indicate that the HMA layers in all the pavement sections had the highest moduli values.
This trend, (i.e. the HMA layers having the highest moduli values) was expected because
the HMA layers of flexible pavements are usually constructed with better-controlled and
better-performing materials when compared to other layers. Figure 9 also illustrates
another trend in which the base layer of all the pavements sections had the next highest
backcalculated stiffness. This trend is also due to the fact that higher quality aggregates
are used in the upper layers of flexible pavements.

43
Figure 9. Comparison of backcalculated base layer moduli of all pavement sections one
year after construction
Better performing aggregates are usually used closer to the surface of flexible
pavements in order to ensure and maintain efficient load transfer between aggregates,
while aggregates of an inferior quality compared to those in the upper layers, are used in
the lower layers in order to reduce construction costs. If poorly performing aggregates are
used in the upper layers of flexible pavements, there will be an increased risk of
aggregates failing under traffic loads. When this occurs, the stresses due to traffic loads in
the lower layers of flexible pavements increase. The lower layers of flexible pavements
will become more prone to failure because the physical and mechanical properties of the
aggregates in these layers hinder the aggregates’ ability to withstand high traffic loads.
As such, the overall pavement performance may be adversely affected since the
0
100,000
200,000
300,000
400,000
500,000
600,000
Control Section
Untreated RAP
Base
Section 1
Bituminous
Stabilzed Base
Section 2
CaCl2
Stabilized Base
Section 3
Cement
Stabilized Base
Section 4
Geogrid
Stabilized Base
Ba
ck-C
alc
ula
ted
Mo
du
lus
(psi
)
HMA Layer Moduli Base Layer Moduli
Subbase Layer Moduli Subgrade Layer Moduli

44
aggregates in the lower layers may be more likely to fail and this may cause flexible
pavements to fail prematurely.
In terms of the backcalculated base layer modulus of the pavement sections,
Figure 9 reveals several trends. The results in the figure indicate that the cement
stabilized base section (Section 3) had the highest backcalculated base layer modulus
while the geogrid stabilized base section (section 4) had the lowest backcalculated base
layer modulus. The results presented in the figure also indicate that the CaCl2 stabilized
base section (Section 2) and bituminous stabilized base section (Section 1) had relatively
similar backcalculated base layer moduli values (approximately 37,000 psi (255 N/mm2)
as the untreated base section (control section). These results suggest that Portland cement
was the best stabilizing agent to use for stabilizing aggregate base layers, while the
geogrid was the least effective stabilizing agent to use for stabilizing aggregate base
layers. These results also suggest that the using calcium chloride or bituminous material
to stabilize aggregate base layers may have little or no effect in improving the stiffness of
aggregate base layers immediately after construction.
Impact of Stabilized Base on the Field Performance of the Pavement Sections
This section presents the results of the layered elastic analysis, which was
performed using the backcalculated layer moduli of the pavement sections and Kenpave
software. A comparison of the mechanical responses for all sections immediately after
construction and at the crack initiation stage is also presented in this section. It is
important to reiterate that crack initiation in flexible pavement occurs when the moduli
values of the HMA layers are reduced by 50% from their initial values immediately after
construction [36].

45
Impact of stabilized base on pavement section fatigue cracking resistance.
The tensile strains at the bottom of the HMA layer of all pavement sections immediately
after construction and at the crack initiation stage are presented in Figure 10 below. Of all
the sections analyzed in the study, the Portland cement stabilized base section (i.e.,
Section 3) had the lowest tensile strains at the bottom of its HMA layer immediately after
construction. The tensile strain below the HMA layer of Section 3 immediately after
construction was 110 micro-strains. This tensile strain was approximately 56% less than
that of the section containing the untreated RAP base (i.e. the control section). The tensile
strain below the HMA layer of the section containing the untreated RAP base was 251
micro-strains. These results suggest that the cement stabilized base may have a better
fatigue cracking resistance than the untreated base and the other stabilized bases.
The results presented in Figure 10 also indicate that the tensile strains below the
HMA layer of the CaCl2 stabilized base section were comparable or similar to those of the
untreated base section immediately after construction. The tensile strain below the HMA
layer of the CaCl2 stabilized base section was 233 micro-strains. This represented a 7%
difference between the tensile strains obtained for the HMA layers of the CaCl2 stabilized
base section and the untreated base section. These results indicate that both sections may
have the same ability to resist fatigue cracking.

46
Figure 10. Comparison of tensile strain at the bottom of the HMA layer of all sections
one year after construction and at crack initiation
Furthermore, the results in Figure 10 show that Section 4 (i.e., the section
containing geogrid) and Section 1 (i.e., the section containing bituminous material) had
higher tensile strains than those obtained for the control section immediately after
construction. The tensile strain below the HMA layer of Section 4 was 373 micro-strains
while that of Section 1 was 321 micro-strains. Therefore the tensile strains obtained for
these two pavement sections were approximately 49% and 28% respectively higher than
the control untreated base section. This suggests that utilizing geogrid or emulsified
asphalt (bituminous material) may have a negative impact on the ability of flexible
pavements to resist fatigue cracking.
Moreover, by comparing the difference in tensile strains, Δεt, obtained
immediately after construction and those obtained at the stage of crack initiation, the
0
100
200
300
400
500
600
700
800
Control Section
Untreated RAP
Base
Bituminous
Stabilized Base
Section
CaCl2 Stabilized
Base Section
Cement
Stabilized Base
Section
Geogrid
Stabilized Base
Section
Ten
sile
Str
ain
s at
Bott
om
of
HM
A (me)
One Year After Construction Crack Initiation Stage
ΔεtΔεt
Δεt
Δεt
Δεt

47
impact of the type of stabilized base on the fatigue life of flexible pavements can be
determined. As can be seen from Figure 10, the Δεt values for the control section were
lower (by 18% and 61%) than those obtained for Sections 2 and 4, respectively. This
observation indicates that these sections will have a lower fatigue life than the control
section since the fatigue life of flexible pavements is characterized by the rate at which a
fatigue cracking criterion is met. Sections 2 and 4 are expected to fail faster (in terms of
fatigue) than the control section. This is because the increase in tensile strain below the
HMA layers of these sections are significantly higher than that of the control section,
when all three pavement sections are subjected to the same amount of load repetitions.
The results in Figure 10 also show that the Δεt for the control section was higher than that
obtained for Sections 3 and 1, by approximately 7% and 16% respectively. This suggests
that these sections (i.e., Sections 3 and 1) have a longer fatigue life than the control
section. Therefore, it can be concluded that sections 3 and 1 will not fail as fast as the
control section with respect to fatigue cracking.
Impact of stabilized base on pavement section rutting resistance. The
compressive strains at the top of the subgrade layer of all the pavement sections
immediately after construction and at the crack initiation stage are presented in Figure 11
below. As can be seen in this figure, the sections containing the geogrid stabilized base
and the bituminous stabilized base had similar compressive strain values on top of their
respective subgrade layers when compared with that of the control section. The
compressive strains at the top of the subgrade layers of the geogrid and bituminous
stabilized base sections were 403 micro-strains and 395 micro-strains respectively while
the compressive strains obtained for the untreated base section was 406 micro-strains.

48
These results suggest that both the geogrid and bituminous stabilized base sections had a
similar impact as the untreated base section on the rutting susceptibility of the flexible
pavement sections. This implies that the stabilization of base layers using geogrid and
bituminous material (i.e. emulsified asphalt) may provide minimal benefit in terms of
reducing the rutting susceptibility of flexible pavements.
The results presented in Figure 11 also provide insight about the impact of the
CaCl2 and cement stabilized base layers on their respective pavement section’s ability to
resist rutting. The compressive strains on top of the subgrade layer of these two sections
immediately after construction were 298 micro-strains (for the CaCl2 stabilized base
section) and 267 micro-strains (for the cement stabilized base section). Therefore the
compressive strains obtained for the sections containing the CaCl2 and cement stabilized
bases were approximately 26% and 34% respectively lower than those obtained for the
control section. These results indicate that both the CaCl2 and cement stabilized bases had
a positive impact (i.e., improve rutting resistance) on the ability of the entire pavement
section to resist rutting.

49
Figure 11. Comparison of compressive strain at the top of the subgrade of all sections
immediately after construction and at crack initiation
In the case of the rutting susceptibility, the change in compressive strains (Δεc) at
the top of the subgrade provides insight about the impact of the stabilized bases on the
rutting life of the pavement sections. The results illustrated in Figure 11 show that all
stabilized base sections had similar Δεc values as the untreated (control) base section;
with the exception of the cement stabilized base section. This suggests that all the
stabilized sections except the cement treated section will fail, in terms of rutting, after the
same amount of time. With respect to the cement treated section, the Δεc approximately
48% lower than the Δεc of the untreated section. The Δεc of the cement treated section
was 32 micro-strains while that of the untreated base section was 61 micro-strains. These
results imply that using a cement treated base layer in flexible pavements improves the
rutting life (i.e. performance) of the overall pavement structure.
0
100
200
300
400
500
600
700
800
Control Section
Untreated RAP
Base
Bituminous
Stabilized Base
Section
CaCl2 Stabilized
Base Section
Cement
Stabilized Base
Section
Geogrid
Stabilized Base
Section
Co
mp
ress
ive
Str
ain
s a
t T
op
of
Su
bg
rad
e (me) One Year After Construction Crack Initiation Stage
Δεc
Δεc Δεc
ΔεcΔεc

50
Pavement ME Design Predicted Performance
This section presents the results of the Pavement ME design simulations. The
total predicted fatigue cracking and rutting in each of the pavement sections are discussed
in addition to implications of the results of the design simulations on the overall
performance of the pavement sections.
Pavement ME total predicted fatigue cracking. The results of the predicted
fatigue cracking are illustrated in Figure 12 below. As can be seen in this figure, the total
predicted of fatigue cracking in the sections containing the CaCl2 stabilized base and
bituminous stabilized base was relatively similar to the predicted fatigue cracking in the
control section. The total predicted fatigue cracking in the control section was
approximately 1,650 ft./mile (312.5 m/km) while the total predicted fatigue cracking in
the CaCl2 stabilized base and bituminous stabilized base was 1,825 ft./mile (345.6 m/km)
and 1,865 ft./mile (353.2 m/km) respectively. These results confirm the trend observed in
the layered elastic analysis results as they indicate that CaCl2 and bituminous stabilized
base sections have relatively the same susceptibility to fatigue cracking as the untreated
base section.

51
Figure 12. Total predicted fatigue cracking in pavement sections
The results illustrated in Figure 12 also show that Section 3, which contained the
cement treated base layer, had lower total predicted fatigue cracking values than the
control section. The total predicted fatigue cracking of this section (i.e. Section 3) was
769 ft./mile (145.6 m/km); which was approximately 53% lower than that of the control
section. This observation implies that the use of cement treated bases improves the
fatigue life of flexible pavements. With respect to the predicted fatigue cracking in the
geogrid stabilized base section (i.e. Section 4), the results in Figure 12 indicate that this
pavement section may be more susceptible to fatigue cracking than the control section.
This is believed to be the case because the total predicted fatigue cracking in Section 4
was 2,551 ft./mile (483 m/km); which was substantially higher (i.e., 56%) than that
obtained for the control section.
0
500
1000
1500
2000
2500
3000
Bituminous
Stabilzed Base
Section
CaCl2 Stabilized
Base Section
Cement Stabilized
Base Section
Geogrid Stabilized
Base Section
Pre
dic
ted
To
tal
Fa
tig
ue
Cra
ckin
g (
ft./
mil
e)
1635
Control Section Total Predicted Fatigue Cracking

52
Pavement ME total predicted rutting. The values of the total predicted rutting
for all pavement sections analyzed with Pavement ME are presented in Figure 13 below.
As can be seen from this figure, the total predicted rutting, after 20 years of traffic loads,
for the control section as well as Sections 1 2, and 3 was similar. The total predicted
rutting of both Sections 1, and 2 (i.e. the bituminous stabilized, and CalCl2 stabilized base
sections respectively) was 0.3 in. (7.62 mm) while those of Section 3 (i.e. the cement
stabilized base section) and the control section were 0.27 in. (6.85 mm) and 0.3 in. (7.62
mm) respectively. These results indicate that the rutting susceptibility, as predicted using
Pavement ME Design, was similar for the control section and Sections 1, 2, and 3.
With regard to the total predicted rutting for section 4 (i.e. the section containing
the geogrid stabilized base), the results in Figure 13 indicate that predicted rutting in this
section was 0.37 in. (9.40 mm). This total predicted rutting was higher (by about 23%)
than the total predicted rutting obtained for the control section. This suggests that using
geogrid to stabilize aggregate base layers may have a negative impact on flexible
pavements’ rutting life, which supports the results of the layered elastic analysis.

53
Figure 13. Total predicted rutting in pavement sections
Determining Change in Pavement Condition with Time using PSHI
This section presents a comparison of the change in pavement condition of all the
pavement sections with time. The results of the Pavement ME design simulations are
used in conjunction with the RIDOT Pavement Structural Health Index (PSHI) to
determine the change in condition of each of the pavement sections. The Pavement
Structural Health Index is a tool used to assess and monitor the condition of flexible
pavements. It is a weighted average that is determined from a comprehensive scoring
system which accounts for flexible pavement distresses such as International Roughness
Index (IRI), rutting, cracking (i.e. longitudinal, transverse, alligator, and block), and
patch failure [38]. The weight distribution of the pavement distresses accounted for in the
RIDOT PSHI scoring system are presented in Table 5 below.
0
0.05
0.1
0.15
0.2
0.25
0.3
0.35
0.4
Bituminous
Stabilzed Base
Section
CaCl2 Stabilized
Base Section
Cement Stabilized
Base Section
Geogrid Stabilized
Base Section
Pre
dic
ted
To
tal
Ru
ttin
g (
in.)
0.3
Control Section Total Predicted Rutting

54
Table 5
RIDOT Pavement Structural Health Index scoring system weight distribution
Pavement Distress Weight Distribution of Distress Scores
in RIDOT PSHI Scoring System
Alligator Cracking 16
Longitudinal Cracking 7
Transverse Cracking 7
Block Cracking 10
Patch Failure 20
Total Rutting 10
International Roughness Index (IRI) 30
The pavement distress which are factored into the overall RIDOT PSHI scoring
system each have their respective scoring systems. The scores in these individual
pavement distress scoring systems typically range from 0 to 100 and they are determined
based on a 328 ft. (100 m) long test section of a roadway [32]. The scoring system for
alligator cracking, longitudinal cracking and transverse cracking are presented in Table 6
below. The scores designated in the respective scoring systems for each type of cracking
depend on whether the amount of cracking falls within a particular range. The general
trend in the scoring system for each type of cracking indicate that the score increases as
the amount of alligator, longitudinal, and transverse cracking decrease respectively.

55
Table 6
RIDOT scoring system for alligator, longitudinal and transverse cracking on flexible
pavements
Alligator
Cracking
Longitudinal
Cracking
Transverse
Cracking
Ranges
(ft.2)
Score Ranges
(ft.2)
Score Ranges
(ft./mi)
Score
0 – 10.8 100 0 – 10.8 100 0 – 57.0 100
10.8 - 322.9 90 10.8 - 322.9 90 57.0 – 170.5 95
322.9 - 645.8 80 322.9 - 645.8 80 170.5 – 284.0 90
645.8 – 968.8 70 645.8 – 968.8 70 284.0 – 397.6 85
968.8 - 1291.7 60 968.8 - 1291.7 60 397.6 – 511.6 80
1291.7 - 1614.6 50 1291.7 - 1614.6 50 511.6 – 625.2 75
1614.6 - 1937.5 40 1614.6 - 1937.5 40 625.2 – 739.2 70
1937.5 - 2260.4 30 1937.5 - 2260.4 30 739.2 – 852.7 65
2260.4 - 2583.3 20 2260.4 - 2583.3 20 852.7– 966.2 60
2583.3 - 2906.3 10 2583.3 - 2906.3 10 966.2– 1079.8 55
2906.3 < 0 2906.3 < 0 1079.8 – 1193.2 50
The scoring system for rutting is presented in Figure 14 below [38]. The scoring
system for rutting generally becomes stricter once the total rutting on a flexible pavement
exceeds 1in. (25.4 mm). As the total rutting reaches and exceeds 1.5 in. (38.1 mm), the
rutting score becomes 0. It is important to note that he graph in Figure 14 does not extend
all the way to 100 because a rutting score of 100 is assigned to pavements which
experience less than 0.28 in. (7.1 mm) of rutting [32]. The scoring system for IRI is
presented in Figure 15. From this figure, it can be observed that an IRI score of 100 is
assigned to a flexible pavements which have an IRI of 75 in./mile (1.2m/km) or less. It
can also be seen from the figure that an IRI score of 0 is allocated to flexible pavements
which have an IRI of 400 inches/mile (6.3 m/km) or more.

56
Figure 14. RIDOT rutting distress scoring system for flexible pavements
Figure 15. RIDOT IRI distress scoring system for flexible pavements
0
10
20
30
40
50
60
70
80
90
100
0.2
8
0.3
1
0.3
8
0.4
4
0.5
0
0.5
6
0.6
3
0.6
9
0.7
5
0.8
1
0.8
8
0.9
4
1.0
0
1.0
6
1.1
3
1.1
9
1.2
5
1.3
1
1.3
8
1.4
4
1.5
0
Sco
re
Rutting, Inches
0
10
20
30
40
50
60
70
80
90
100
75
85
95
105
115
125
135
145
155
165
175
185
195
205
215
225
235
245
255
265
275
285
295
305
315
325
335
345
355
365
375
385
395
Sco
re
International Roughness Index (IRI), Inches/mile

57
The overall PSHI score of flexible pavements is generally used to qualitatively
classify the condition of the pavement as excellent, good, fair, poor, or failed. These
classifications for pavement condition depend on whether the overall PSHI score of a
flexible pavement falls within a particular range of values. The scores for the overall
PSHI of flexible pavements typically range from 0 to 100. However, the range of the
overall PSHI score for the pavement sections evaluated in the study had to be modified to
0 to 70 because the scope of the study did not account for block cracking and patch
failure in flexible pavements. Therefore the final PSHI scores of the pavement sections
analyzed in the study were calculated as percentages; with 70 being the total or maximum
PSHI score. It is important to note that the pavement condition was classified as excellent
when the PSHI scores of the pavement sections fell within the 90.5 to 100 range.
Additionally, the pavement condition was classified as good, fair, poor, and failed when
the PSHI score fell within 84.1 to 90.5 range, 75.6 to 84.1 range, 64.5 to 75.6 range, and
0 to 64.5 range respectively [38].
Evaluation of pavement section condition. Figure 16 below presents the change
in PSHI score of each pavement section (i.e. the control section and the sections
containing the stabilized bases) during the 20 year Pavement ME analysis period. The
threshold PSHI score for pavement serviceability used by RIDOT is also shown in the
Figure 16. The threshold PSHI score for pavement serviceability was 64.5 because this
score was the upper limit for the range of PSHI scores that represented a “failed”
pavement condition. It can be observed in Figure 16 that the section containing the
cement stabilized base had the smallest reduction in PSHI score as trafficking progressed
on the pavement section during the analysis period. The PSHI score of the cement

58
stabilized section decreased from 100 to 78.4. Quantitatively this reflected a 21.6%
decrease in PSHI score and indicated that the condition of the cement stabilized section
deteriorated from an excellent condition to a fair condition after 20 years of trafficking.
Figure 16. Change in Pavement Structural Health Index of pavement sections with time
In regard to the sections containing the calcium chloride stabilized base and
bituminous stabilized base, the PSHI score decreased from 100 to 73.1 on both sections
after 20 years of trafficking. This reflected a 26.9 % reduction in PSHI score and
indicated that the pavement condition of both pavement sections declined from excellent
to poor during the 20-year Pavement ME analysis period. The section containing the
untreated RAP base experienced a decrease in PSHI score from 100 to 74.1 during the 20
year analysis period and this reflected a 25.9% reduction in PSHI score. Qualitatively,
50
55
60
65
70
75
80
85
90
95
100
105
0 5 10 15 20
Pa
vem
ent
Str
uct
ura
l H
ealt
h I
nd
ex
Years
Pavement Serviceability Health Index of Sections
Untreated Base Cement Stabilized Base
Geogrid Stabilized Base Bituminous Stabilized Base
Pavement Serviceability Threshold CaCl Stabilized Base
Pavement Treatment Threshold

59
this meant that the condition of this section declined from excellent to poor after the
pavement section was subjected to 20 year of trafficking. With respect to the section
containing the geogrid stabilized base, the PSHI score declined from 100 to 72.4 during
the pavement ME analysis period. This reflected a 27.6% decrease in PSHI score and a
change in pavement condition from excellent to poor.
Comparison of pavement section condition over time. It can be observed in
Figure 16 that none pavement sections containing the stabilized/untreated base layers
experienced a “failed” pavement condition during the 20 year Pavement ME analysis
period. However, the PSHI score of all the pavement sections (except the Portland
cement stabilized base section) met the pavement treatment threshold during this period.
The time required for the PSHI score of the pavement sections to reach the pavement
treatment threshold can be used to compare the impact of the base layer stabilization on
pavement condition. This change in PSHI score reflected a decline in pavement condition
from excellent to poor.
Figure 16 above, shows that the PSHI score on the control section (i.e. the section
containing the untreated RAP base) reached the pavement treatment threshold after the
pavement section experienced 16.25 years of trafficking. This figure also indicates that
the PSHI score of the cement stabilized base section, did not reach the pavement treat
threshold during the 20 year analysis period. With respect to the sections containing the
CaCl2 and bituminous stabilized bases, the PSHI score on both sections reached the
pavement treatment threshold after 14 years and 13.4 years respectively. This indicated
the pavement condition of the CaCl2 and bituminous stabilized base sections declined at a
relatively similar rate to that of the control section. In regard to the section containing the
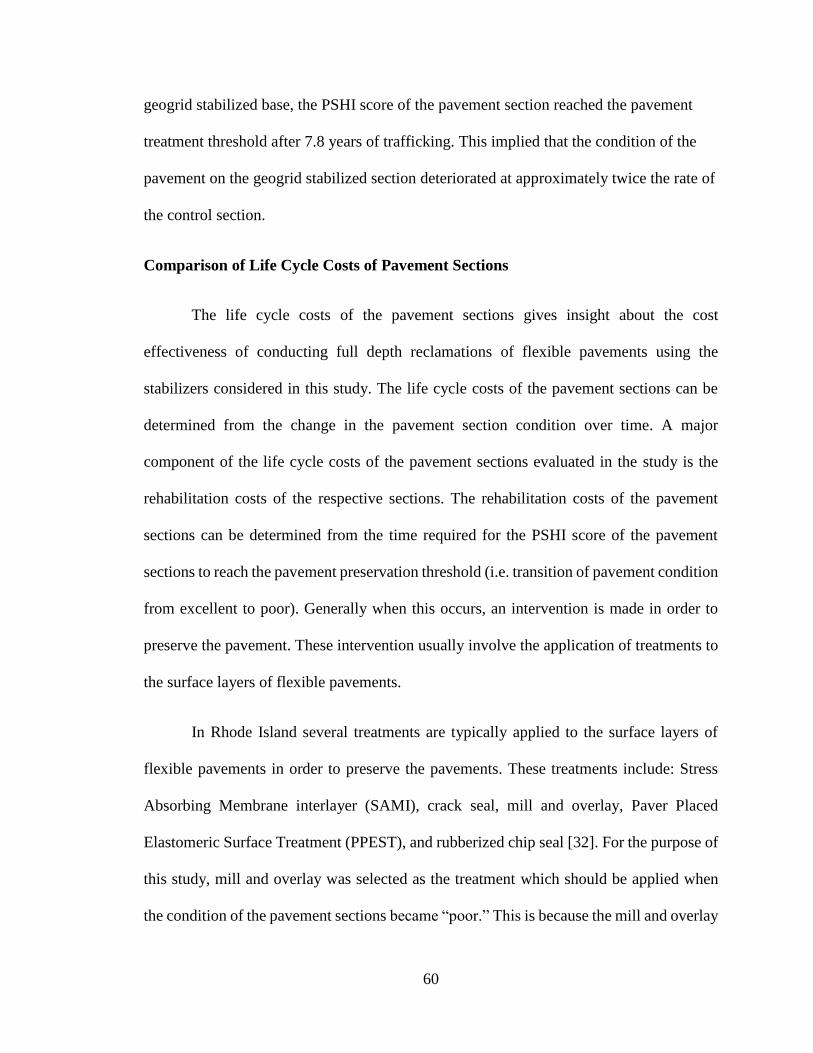
60
geogrid stabilized base, the PSHI score of the pavement section reached the pavement
treatment threshold after 7.8 years of trafficking. This implied that the condition of the
pavement on the geogrid stabilized section deteriorated at approximately twice the rate of
the control section.
Comparison of Life Cycle Costs of Pavement Sections
The life cycle costs of the pavement sections gives insight about the cost
effectiveness of conducting full depth reclamations of flexible pavements using the
stabilizers considered in this study. The life cycle costs of the pavement sections can be
determined from the change in the pavement section condition over time. A major
component of the life cycle costs of the pavement sections evaluated in the study is the
rehabilitation costs of the respective sections. The rehabilitation costs of the pavement
sections can be determined from the time required for the PSHI score of the pavement
sections to reach the pavement preservation threshold (i.e. transition of pavement condition
from excellent to poor). Generally when this occurs, an intervention is made in order to
preserve the pavement. These intervention usually involve the application of treatments to
the surface layers of flexible pavements.
In Rhode Island several treatments are typically applied to the surface layers of
flexible pavements in order to preserve the pavements. These treatments include: Stress
Absorbing Membrane interlayer (SAMI), crack seal, mill and overlay, Paver Placed
Elastomeric Surface Treatment (PPEST), and rubberized chip seal [32]. For the purpose of
this study, mill and overlay was selected as the treatment which should be applied when
the condition of the pavement sections became “poor.” This is because the mill and overlay

61
treatments usually maintains pavement serviceability for a longer period (5 to 10 years)
than the other treatment options [32]. In the study, the worst case scenario was used to
determine rehabilitation costs in which mill and overlay treatment was assumed to only
add 5 years of pavement serviceability. It is important to note that the average cost of
conducting a mill and overlay of the pavement sections was approximately $142,000 per
lane mile [32]. The total rehabilitation costs of the pavement sections was found by
determining the amount of treatment interventions required on the pavement sections
during the 20 year Pavement ME analysis period and multiplying that number by the cost
of conducting a mill and overlay.
The surface layer of the control section required a mill and overlay once during the
analysis period. As a result the total rehabilitation cost of this section was $142,000 per
lane mile. The pavement section which required the most treatment interventions during
the 20 year analysis period was the geogrid stabilized base section. This pavement section
required a mill and overlay during the 8th year, 13th year, and 18th year of the analysis
period. An initial mill and overlay was required near the end of the 8th year in the analysis
period because the condition of this pavement section transitioned from fair to poor during
this period. Two additional mill and overlays were required during the 20 year analysis
period because the mill and overlay was assumed to only add 5 years of pavement
serviceability. As such, the total rehabilitation cost of this section was determined as
$426,000 per lane mile. The bituminous stabilized and CaCl2 stabilized sections both had
a total rehabilitation cost of $284,000 per lane mile because these two sections required
two treatment interventions during the analysis period. A mill and overlay was required on
both pavement sections during the 14th and 19th year of the analysis period. The

62
rehabilitation cost of the Portland cement stabilized section was $0 per lane mile since this
section did not require treatment for the entire 20 year period.
In addition to the rehabilitation costs, the initial cost of constructing the pavement
sections was also factored into the life cycle costs of the pavement sections. Table 7 below,
presents the initial costs of constructing the pavement sections analyzed in this study. The
initial cost of constructing the pavement sections was determined by adding the
construction costs of the full depth reclamations and the cost of constructing the HMA,
subbase, and subgrade layers. The cost of constructing the HMA layers, on each pavement
section was $3,589,780 per lane mile while the cost of constructing the in-situ (subbase
and subgrade) layers was 88,967 per lane mile. From Table 7, it can be seen that the
pavement section with the highest initial construction costs was the cement stabilized base
section while the pavement section with lowest initial construction cost was the section
containing the untreated RAP base.
Table 7
Initial construction costs of untreated and stabilized pavement sections [38]
Pavement Section
Initial cost of constructing the
pavement sections
($) per lane mile
(Control) Untreated base 3,693,572
Bituminous stabilized base 3,775,547
CaCl2 stabilized base 3,798,132
Cement stabilized base 4,024,155
Geogrid stabilized base 3,884,247
Note. All costs are rounded to the nearest dollar.

63
The total life cycle cost for each section is presented in Table 8 below. The total
life cycle cost of the pavement sections was determined by adding the initial construction
costs of the pavement sections to their respective rehabilitation costs for the 20 year
analysis period. The results presented in Table 8 indicate the section containing the
geogrid stabilized base had the highest life cycle cost while the control section had the
lowest life cycle cost. The results in this table also show that the pavement sections
containing the bituminous stabilized base, CaCl2 stabilized base and Portland cement
stabilized base all had relatively similar lifecycle costs (approximately $4,000,000 per
lane mile). Overall the results of the life cycle cost analysis of the pavement sections
reveals that it may not be cost effective to use bases stabilized by asphalt emulsions,
CaCl2, Portland cement, and geogrids in flexible pavement sections on RI Route 165.
However it is important to note that the results of the lifecycle cost analysis is based on
the predicted performance of the pavement sections. Therefore definite conclusions can
be made about the cost effectiveness constructing flexible pavements with stabilized
bases.

64
Table 8
Total life cycle costs of the pavement sections containing the stabilized and untreated
base layers
Pavement Section
Total life cycle cost pavement
sections
($) per lane mile
(Control) Untreated base 3,835,572
Bituminous stabilized base 4,059,547
CaCl2 stabilized base 4,082,132
Cement stabilized base 4,024,155
Geogrid stabilized base 4,310,247
Note. All costs are rounded to the nearest dollar.

65
Chapter 5
Summary of Findings, Conclusions & Recommendations
Summary of Findings
The research presented in this study evaluated the impact of stabilized and
untreated base layers on field performance (i.e., fatigue and rutting) of flexible
pavements. Five field sections located on Route 165 (between utility poles 304 and 521)
in Rhode Island were evaluated. These sections are part of a controlled study currently
being conducted by RIDOT to evaluate their long-term field performance. Four of the
five sections were constructed using stabilized base layers and one was constructed as a
control section using untreated RAP aggregates. The approach utilized to evaluate the
impact of different stabilizing agents (or stabilized bases) on field performance of flexible
pavements involved conducting FWD tests on all selected field sections. The collected
FWD data (or deflections) were used to backcalculate the elastic moduli for all layers in
each pavement section. The influence of the stabilized bases and the untreated control
RAP base on the mechanical responses (i.e. stresses and strains) of the overall pavement
structure was also evaluated by conducting layered elastic analyses. In addition,
AASHTOWare Pavement ME Design simulations were conducted to determine which of
the four stabilized base types enhanced the overall performance of flexible pavements the
most. The results of the Pavement ME Design simulations were then used to analyze the
life cycle costs of each pavement section in order to determine the most cost effective
stabilized base.

66
The results of the layered elastic analysis provided insight about the fatigue
cracking and rutting susceptibility of the pavement sections considered in the study. The
fatigue and rutting lives of the pavements were also determined from the layered elastic
analysis. The results of the layered elastic analysis were as follows:
The field section containing an untreated RAP base had a tensile strain of 251
micro-strains at the bottom of the HMA layers immediately after construction.
The field sections containing a CaCl2 stabilized base, cement stabilized base,
geogrid stabilized base and bituminous stabilized had tensile strains of 233 micro-
strains, 110 micro-strains, 373 micro-strains and 321 micro-strains at the bottom
of their respective HMA layers immediately after construction.
The change in tensile strain (Δεt) below the HMA layers of the field sections
containing the CaCl2 stabilized base and the geogrid stabilized base was 18% and
61% respectively, higher than that of the control section at crack initiation. The
Δεt below the HMA layers of the cement stabilized and bituminous stabilized base
sections was 7% and 16% respectively lower than that of the control section at
crack initiation.
The field section containing an untreated RAP base had a compressive strain of
406 micro-strains at the top of the subgrade layer immediately after construction.
The field sections containing a CaCl2 stabilized base, cement stabilized base,
geogrid stabilized base and bituminous stabilized base had compressive strains of
298 micro-strains, 267 micro-strains, 403 micro-strains and 395 micro-strains at
the bottom of their respective HMA layers immediately after construction.

67
The change in compressive strain (Δεc) on top the subgrade layer of all the field
sections except the cement stabilized base section was approximately 61 micro
strains at crack initiation. The Δεc on the field section containing the cement-
stabilized base was 18% lower than that of the control section since the Δεc on the
cement stabilized section was 32 micro-strains at crack initiation.
The results of the Pavement ME predicted performance also provided insight
about the fatigue cracking and rutting susceptibility of the pavement sections considered
in the study. The results of the Pavement ME design simulations were as follows:
The predicted fatigue cracking on the field section containing an untreated RAP
base was 1650 ft./mi (312.5 m/km) after the pavement section experienced 20
years of traffic. The predicted fatigue cracking of the field sections containing a
CaCl2 stabilized base, cement stabilized base, geogrid stabilized base and
bituminous stabilized base was 1825 ft./mi (345.6 m/km), 769 ft./mi (145.6
m/km), 2551 ft./mi (483 m/km), and 1865 ft./mi (353.2 m/km) respectively after
the pavement sections were subjected to 20 years of traffic.
The predicted rutting on the field sections containing an untreated RAP base,
CaCl2 stabilized base, and bituminous stabilized base was 0.3 in. (7.62 mm) after
the pavement section experienced 20 years of traffic. The predicted rutting on the
field section containing a cement stabilized base was 0.27 in. (6.25 mm) while
that of the section containing the geogrid stabilized base was 0.37 in. (9.40 mm)
when both pavement sections were subjected to 20 years of traffic.

68
The life cycle costs of the pavement sections were determined by analyzing the
construction and rehabilitation costs of the five field sections as well as the change in
Pavement Structural Health Index (PSHI) during the Pavement ME analysis period. The
results of the Pavement ME predicted performance were used to determine the PSHI of
the pavement sections in order to investigate the change in pavement condition of the
pavement sections during the Pavement ME analysis period. The results of the life cycle
cost analysis were as follows:
The life cycle costs in, per lane mile, of the field sections containing untreated
RAP base, bituminous stabilized base, CaCl2 stabilized base, Portland cement
stabilized base, and geogrid stabilized base was $3,.83 M, $4,.05 M, $4,.08 M,
$4,.02 M, and $4,.31 M , respectively.
Conclusions
Based on the results of the layered elastic analysis and Pavement ME performance
predictions obtained for the pavement sections considered in the study, the following
conclusions can be drawn:
The Portland cement treated base appeared to be more effective than the other
stabilized bases at extending the predicted fatigue life of the flexible pavement
sections. The Portland cement treated base also appeared to reduce the
susceptibility of the pavement section to fatigue cracking more than the other
stabilized bases.
The CaCl2 stabilized and bituminous stabilized bases seemed to have a similar
impact as the control (untreated RAP base) on the overall predicted fatigue

69
performance of the flexible pavement sections. However, only the bituminous
stabilized base appeared to have a similar impact as the control base (untreated
RAP base) on the fatigue cracking potential of the overall pavement.
The geogrid stabilized base seemed to have the lowest impact on the predicted
fatigue and rutting lives of the overall pavement. The geogrid stabilized base also
appeared to have the lowest impact in terms of reducing the susceptibility of the
overall pavement section to fatigue cracking. It is important to note however, that
the effect and strength of the geogrid could not be fully captured by the impulse
load applied during FWD testing. This was a shortcoming which arose due to the
scope of the scope of this study.
Base layer stabilization may not have a significant impact on the overall rutting
performance of flexible pavements because the predicted rutting performance of
all the pavement sections were similar.
It may not be cost effective to use stabilized bases (i.e. bases stabilized with by
asphalt emulsions, CaCl2, Portland cement, and geogrids) in flexible pavement
sections on RI Route 165 since the lifecycle cost of the untreated RAP base
section appeared to be the lowest of all the pavement sections analyzed in the
study. It is important to note however that the lifecycle cost of the pavement
sections were evaluated based on the predicted performance of the pavement
sections. Hence no definite conclusion can be made about the cost effectiveness
of base layer stabilization.

70
Recommendations
The following recommendations can be made about using the stabilized bases
considered in this study in flexible pavements:
Portland cement may be used as a stabilizing agent in the base layer of flexible
pavements. This is because it appeared to have the greatest impact on the
predicted fatigue life of the flexible pavement section.
Calcium chloride and asphalt emulsions may not be feasible stabilizing agents for
the base layers of flexible pavements because they appeared to have no significant
impact on the predicted fatigue performance. Additionally the lifecycle costs of
flexible pavements containing these bases seemed to be higher when compared to
untreated RAP bases.
Geogrids are may be the least effective stabilizing agents to use in the base layers
of flexible pavements because it seemed to have the lowest impact on the
predicted fatigue cracking of flexible pavement sections. However, due to the
limitations of testing carried out in this study, no evidence is provided to
conclusively state that geogrids are ineffective base layer stabilizing agents.

71
References
[1] Y. H. Huang, “Stresses and Strains in Flexible Pavements” in Pavement Analysis and
Design, 2nd ed. Upper Saddle River, NJ, 2004, ch.2, sec.2.2, pp.57-76.
[2] E. Tutumluer, “Practices for Unbound Aggregate Pavement Layers: A Synthesis of
Highway Practice.” Transportation Research Board of the National Academies,
Washington, D.C., Rep. NCHRP Synthesis 445, 2013.
[3] W. Kipp et al., “Reclaimed Base Course Stabilized with Calcium Chloride,” Materials
and Research Section, State of Vermont Agency of Transportation, Montpelier, VT,
Rep. 2008-4, 2008.
[4] S. Tang et al., “Structural Evaluation of Asphalt Pavements with Full-Depth
Reclaimed Base,” Minnesota Department of Transportation Research Services, St.
Paul, MN Rep. MN/RC 2012-36, 2012.
[5] S. Sebsta and T. Scullion, “Effectiveness of Minimizing Reflective Cracking in
Cement-Treated Bases by Microcracking,” Texas Department of Transportation
Research and Technology Implementation Office, Austin, TX, Rep. FHWA/TX-05/0-
4502-1, 2004.
[6] S. Sebesta, “Test Use of Microcracking to Reduce Shrinkage Cracking in Cement
Treated Bases,” Transportation Research Record: Journal of the Transportation
Research Board, vol. 1936, pp.1-11, Jan., 2005.
[7] H.E. Bofinger et al., “The Shrinkage of Fine-Grained Soil-Cement,” Transport and
Road Research Laboratory, Crawthorne, England, Rep. 398, 1978.
[8] J.G. Zornberg and R. Gupta, “Geosynthetics in pavements: North American
Contributions,” 9th International Conference of Geosynthetics, Guaruja, Brazil, 2010,
pp.379-398.
[9] O. Ogundipe, “Strength and Compaction Characteristics of Bitumen-Stabilized
Granular Soil,” International Journal of Scientific & Technology Research, vol. 3, no.
9, Sep. 2014.
[10] S. Khosravifar, and C. Schwartz, “Design and Evaluation of Foamed Asphalt Base
Materials,” Maryland State Highway Administration Office of Policy and Research,
Maryland State Highway Administration, Baltimore, MD, Rep. MD-13-SP909B4E,
2013.
[11] D. Saylak et al., “Fly Ash-Calcium Chloride Stabilization in Road Construction,”
Transportation Research Record: Journal of the Transportation Research Board, vol.
2053, pp.23-29, Dec., 2008.

72
[12] D. Saylak et al., “Base Stabilization and Dust Control Using calcium Chloride and
Fly Ash,” in International Ash Utilization Symposium, Lexington, KY, 2003.
[13] H. Kirchner and J. A. Gail. “Liquid Calcium Chloride Dust Control and Base
Stabilization of Unpaved Road Systems,” Transportation Research Record: Journal
of the Transportation Research Board, vol. 1291, pp.173-178, Aug., 1991.
[14] C. Shon et al., “Combined Use of Calcium Chloride and Fly Ash in Road Base
Stabilization,” Transportation Research Record: Journal of the Transportation
Research Board, vol. 2186, pp.120-129, Dec., 2010.
[15] W. Grogan et al., “Stabilized Base Coaurses for Advanced Pavement Design Report
1: Literature Review and Field Performance Data,” U.S. Department of
Transportation Federal Aviation Administration, Washington, D.C., Rep.
DOT/FAA/AR-97/65, 1999.
[16] H. J. Pendola et al., “Evaluation of Factors Affecting the Tensile Properties of
Cement–Treated Materials,” U.S Department of Transportation, Federal Highway
Administration Bureau of Public Roads, Washington, D.C., Rep. 98-3, 1969.
[17] D. Jones et al., “Comparison of Full-Depth reclamation with Portland Cement and
Full Depth reclamation with No Stabilizer in Accelerated Loading Test,”
Transportation Research Record: Journal of the Transportation Research Board,
vol. 2524, pp.133-142, Jan., 2015.
[18] Y. Wang et al., “Shrinkage Performance of Cement-Treated Macadam Base
Materials,” 7th International Conference on Traffic and Transportation Studies,
Kunming, China, 2010, pp.1378-1386.
[19] S. P. Singh et al., “Performance Evaluation of Cement Stabilized Fly Ash-GBFS
Mixes as a Highway Construction Material,” Waste management, vol. 28, no. 8,
pp.1331-1337, Nov., 2008.
[20] R. Taha et al., “Cement Stabilization of Reclaimed Asphalt Pavement Aggregate for
Road Bases and Subbases,” Journal of Materials in Civil Engineering, vol. 14, no. 3,
June, 2002.
[21] S. M. Mounes et al., “Improving Rutting Resistance of Pavement Structures Using
Geosynthetics: An Overview,” The Scientific World Journal, vol. 2014, no. 764218,
Jan., 2014.
[22] M. Y. Abu-Farsakh et al., “Evaluation of Geogrid Base Reinforcement in Flexible
Pavements using Cyclic Plate Load Testing,” International Journal of Pavement
Engineering, vol. 12, no. 3, pp.275-288, June, 2011.

73
[23] H. Wu et al., “Evaluation of Geogrid Base Reinforcement on Unbound Granular
Pavement Base Courses using Loaded Wheel Tester,” Goetextiles and
Geomembranes, vol. 43, no. 5, pp.462-469, Oct., 2015.
[24] Cold Recycling: Wirtgen Cold Recycling Technology, 1st ed., Wirtgen GmbH,
Windhagen, Germany, 2010, pp. 73-98.
[25] Z. Wu et al., “Accelerated Pavement Testing on Foamed Asphalt Base Materials,”
unpublished.
[26] B. Lane et al., “Long Term Performance of Full Depth Reclamation with Expanded
Asphalt on the Trans-Canada Highway Near Wawa, Ontario,” 2012 Conference and
Exhibition of the Transportation Association of Canada-Transportation: Innovations
and Oportunities, New Brunswick, Canada, 2012, pp.12.
[27] Y. Mehta and R. Roque, “Evaluation of FWD Data for Determination of Layer
Moduli of Pavements,” Journal of Materials in Civil Engineering, vol. 15, no. 1, pp.
25-31, Feb., 2003.
[28] P. Donovan and E. Tutumluer, “Falling Weight Deflectometer Testing to Determine
Relative Damage in Asphalt Pavement Unbound Aggregate Layers,” Transportation
Research Record: Journal of the Transportation Research Board, vol. 2104, pp.12-
23, Dec., 2009.
[29] J. M. Maestas, and M.S. Mamlouk, “Comparison of Pavement Deflection Analysis
Methods Using Overlay Design,” Transportation Research Record: Journal of the
Transportation Research Board, vol. 1377, pp.17-21, Aug., 1992.
[30] C. Asil et al., “Backcalculation of Elastic Modulus of Soil and Subgrade from
Portable Falling Weight Deflectometer Measurements,” Engineering Structures, vol.
34, pp. 1-7, Nov. 2011.
[31] Y. H. Huang, “KENLAYER Computer Program,” in Pavement Analysis and Design,
2nd ed. Upper Saddle River, NJ, 2004, ch.3, sec.3.2, pp.106-108.
[32] S. Coffey, “Developing Pavement Preservation and Mitigation Strategies using
Pavement ME Design Guide for Rhode Island DOT,” M.S. thesis, Department of
Civil and Environmental Engineering, Rowan University, Glassboro, NJ, 2013.
[33] K. Wilson, “Evaluation of Pavement Rehabilitation Strategies on Route 165 and
Prediction Performance,” Ph.D. dissertation, Department of Civil and Environmental
Engineering, University of Rhode Island, Kingston, RI, 2016.

74
[34] A. V. Brown, “Cement Stabilization of Aggregate Base Materials Blended with
Reclaimed Asphalt Pavement,” M.S. thesis, Department of Civil and Environmental
Engineering, Brigham Young University, Provo, U.T., 2006.
[35] T. A. Redles et al., “Estimating Fatigue Endurance Limits of Flexible Airfield
Pavements,” Transportation Research Board 94th Annual Meeting, Washington,
D.C., 2015, pp. 17.
[36] S. Shen and S. Carpenter. “Dissipated Energy Concepts for HMA Performance:
Fatigue and Healing,” Federal Aviation Administration (FAA), Washington, D.C.,
Rep. DOT 05-C-AT-UIUC-COE, 2007.
[37] A. Bradshaw et al., “Resilient Moduli of Reclaimed Asphalt Pavement Aggregate
Subbase Blends”. Journal of Materials in Civil Engineering, vol. 28, no. 5, May,
2016.
[38] Y. Mehta. (2016, Oct. 5th). Fwd:Data [email].

75
Appendix
Pavement Deflections
Table A.1
Falling Weight Deflectometer data obtained from pavement section containing the CaCl2
stabilized.
Direction Distance
(ft.)
Impact
Load
(lbs)
Deflections (mils)
D0 D1 D2 D3 D4 D5 D6
Westbound 858 12,458 15.68 11.29 9.24 5.86 4.00 2.88 2.24
Westbound 2,586 12,342 14.57 9.83 7.81 4.87 3.32 2.39 1.79
Westbound 4,255 12,467 13.25 8.57 6.64 3.69 2.37 1.64 1.26
Westbound 5,946 12,317 14.68 9.52 7.36 4.24 2.95 2.22 1.74
Westbound 7,647 12,285 16.82 10.84 8.57 5.35 3.71 3.45 1.96
Eastbound 887 12,263 16.04 10.36 8.27 5.15 3.51 2.51 1.92
Eastbound 2,569 12,227 16.25 11.05 8.26 4.11 2.56 1.69 1.18
Eastbound 5,866 12,257 14.46 8.85 6.93 3.81 2.34 1.53 1.09
Eastbound 7,987 12,278 15.10 9.28 7.09 3.99 2.53 1.71 1.30
Eastbound 7,763 12,157 15.12 9.57 7.56 4.54 2.98 2.09 1.57
Note. The average pavement temperature in the westbound and eastbound directions of the
section containing the CaCl2 was 68.8 oF and 72 oF respectively.
Table A.2
Falling Weight Deflectometer data obtained from pavement section containing the
untreated RAP base.
Direction Distance
(ft.)
Impact
Load
(lbs)
Deflections (mils)
D0 D1 D2 D3 D4 D5 D6
Westbound 394 12,279 18.39 12.08 9.34 5.72 4.19 3.19 2.55
Westbound 1,170 12,296 15.49 9.59 7.03 3.92 2.47 1.55 0.95
Westbound 2,210 12,129 19.82 13.68 10.95 6.52 4.27 2.89 2.07
Eastbound 443 12,084 21.20 14.44 11.34 6.43 4.12 2.74 1.97
Eastbound 1,234 12,237 17.28 11.16 8.43 4.39 2.65 1.79 1.31
Eastbound 1,915 12,275 15.06 9.00 7.04 3.91 2.58 1.81 1.35
Note. The average pavement temperature in the westbound and eastbound directions of the
section containing the CaCl2 was 70.3 oF and 72.3 oF respectively.

76
Table A.3
Falling Weight Deflectometer data obtained from pavement section containing the
Portland cement stabilized base.
Direction Distance
(ft.)
Impact
Load
(lbs)
Deflections (mils)
D0 D1 D2 D3 D4 D5 D6
Westbound 1,036 12,526 9.17 6.58 5.90 4.53 3.31 2.43 1.83
Westbound 2,790 12,433 12.78 9.93 8.80 6.28 4.48 3.18 2.34
Westbound 4,620 12,387 11.87 8.93 7.95 5.75 4.13 3.00 2.23
Westbound 6,465 12,418 12.27 9.29 8.59 6.73 5.10 3.76 2.82
Westbound 8,317 12,352 8.83 6.17 5.62 4.22 3.04 2.15 1.57
Westbound 10,222 12,365 10.76 7.68 6.78 4.61 3.16 2.15 1.57
Westbound 12,015 12,306 8.58 5.82 5.21 3.89 2.68 1.79 1.19
Westbound 13,853 12,376 9.06 6.37 5.74 4.22 2.99 2.13 1.59
Eastbound 1,042 12390 10.10 7.47 6.82 5.17 3.88 2.87 2.20
Eastbound 2,797 12403 9.97 7.04 6.25 4.58 3.23 2.27 1.69
Eastbound 4,616 12254 10.25 7.61 7.04 5.43 4.07 2.98 2.26
Eastbound 6,483 12330 9.08 6.34 5.54 3.75 2.37 1.49 0.93
Eastbound 8,356 12370 11.36 9.09 8.51 6.83 5.29 4.11 3.29
Eastbound 10,191 12382 10.59 8.46 7.85 6.08 4.60 3.2 2.64
Eastbound 12,006 12255 9.83 7.50 6.89 5.41 4.21 3.28 2.71
Eastbound 13,862 12275 13.20 10.35 9.37 7.03 5.19 3.63 2.62
Note. The average pavement temperature in the westbound and eastbound directions of the
section containing the CaCl2 was 61.8 oF and 60.1 oF respectively.
Table A.4
Falling Weight Deflectometer data obtained from pavement section containing the
geogrid stabilized base.
Direction Distance
(ft.)
Impact
Load
(lbs)
Deflections (mils)
D0 D1 D2 D3 D4 D5 D6
Westbound 540 11,999 23.57 15.35 12.10 7.06 4.49 2.88 1.88
Westbound 1,505 11,903 29.29 21.28 17.02 10.24 6.92 4.68 3.27
Westbound 2,500 12,006 24.14 15.96 11.69 6.29 4.14 2.81 1.95
Eastbound 501 12,134 19.88 11.33 8.01 4.33 2.92 2.01 1.49
Eastbound 1,515 11,925 22.90 15.36 11.75 6.58 4.32 3.00 2.12
Eastbound 2,505 12,030 12.75 12.92 10.19 5.46 3.28 2.14 1.53
Note. The average pavement temperature in the westbound and eastbound directions of the
section containing the CaCl2 was 66.7 oF and 66.3 oF respectively.

77
Table A.5
Falling weight deflectometer data obtained from pavement section containing the
bituminous stabilized base.
Direction Distance
(ft.)
Impact
Load
(lbs)
Deflections (mils)
D0 D1 D2 D3 D4 D5 D6
Westbound 738 12,111 21.34 12.74 9.05 5.05 3.70 2.91 2.34
Westbound 2,290 12,102 17.72 8.42 5.40 2.38 1.45 1.00 0.72
Westbound 3,685 12,114 20.80 12.38 8.95 5.40 3.93 2.97 2.28
Westbound 5,910 12,046 21.21 13.51 10.71 7.18 5.44 4.27 3.46
Eastbound 0 12150 17.32 12.18 9.82 5.92 4.20 3.14 2.53
Eastbound 822 12101 21.22 15.96 12.94 7.74 5.41 4.07 3.29
Eastbound 2,623 12,266 14.56 7.92 5.25 2.16 1.04 0.60 0.42
Eastbound 3,836 12194 17.22 8.84 5.88 2.65 1.35 0.72 0.42
Note. The average pavement temperature in the westbound and eastbound directions of the
section containing the CaCl2 was 84.5 oF and 68 oF respectively.