evaluating suitable soil stabilization method for …
TRANSCRIPT

EVALUATING SUITABLE SOIL STABILIZATION
METHOD FOR LOCAL ROAD CONSTRUCTION
INDUSTRY
H.M.S.M.Herath
(09/8060)
Thesis Submitted in Partial Fulfillment of the Requirement for the Degree of Master of Science
Department of Civil Engineering
University of Moratuwa
Sri Lanka
May 2011

i
DECLARATION I declare that is my own work and this thesis does not incorporate without
acknowledgement any material previously submitted for a Degree or Diploma in any
other University or Institute of higher learning and to the best of my knowledge and
belief it does not contain any material previously published or written by another
person except where the acknowledgement is made in the text.
Also, I hereby grant to University of Moratuwa the non–exclusive right to reproduce
and distribute my thesis, in whole or part in print, electronic or other medium. I
retain the right to use this content in whole or part in future works.
.............................................. .........................................
H.M.S.M.Herath Date
Department of Civil Engineering
University of Moratuwa
Sri Lanka.
The above candidate has carried out research for the Masters’ thesis under my
supervision
……………………………… .........................................
Dr. W.K.Mampearachchi Date
Department of Civil Engineering
University of Moratuwa
Sri Lanka.
ii
ABSTRACT There has been a rapid development in infrastructures in Sri Lanka since early 90s. Roads and related constructions are the major components of infrastructure development. Due to this construction boom, there is a heavy demand to the construction materials. Availability of natural resources is not sufficient to satisfy demand of the industry. Due to this reason there is a scarcity of good quality natural recourses like soil, metal etc. As a result of this scarcity, many road projects have been delayed in completion and costly.
Soil can be identified as one of the major construction material in road constructions. To overcome the dearth of suitable soil for construction, soil modification should be done in major scale. Soil stabilization is a well known soil modification method, commonly used in developed countries. But, soil stabilization is not popular technique in Sri Lanka. The aim of this research is to evaluate the suitable soil stabilization methods for local road construction industry.
To determine the real reasons for invisibility of this technology in Sri Lanka, questionnaire survey was done among the professional in the industry. Further, selected sandy clay soil with unsatisfactory engineering properties were used for the investigations. Extensive lab and field tests were conducted to examine the effect of mixing, mixing time and stabilizer type, delay compaction to evaluate the performance of stabilized soil. When consider the availability and suitability of the stabilizers, Cement and Lime are the most appropriate stabilizers for local conditions. Strength variation of cement and lime stabilized soil with the mixing time and degree of pulverization were determined. It was found that, degree of pulverization is a critical factor should be considered in the stabilization. Further, blending action is more effective than rolling action in soil mixing with stabilizers.
Influence of compaction delay was another important factor in soil stabilization. It was found in this study that the soil-stabilizer mixing should be done in dry condition and compaction should be done at the relevant optimum moisture content of the mixture at the time of compaction, for the maximum compressive strength. Finally, cost evaluation was carried out to compare the transport sub base material and soil stabilization. As the results of cost comparison, soil stabilization is most suitable for the soil which have properties just out from the specification.
iii
DEDICATION
To My Dear
Father, Mother, Brother, Sister and my wife

iv
ACKNOWLEDGEMENT I gratefully acknowledge my sincere gratitude to my supervisor, Dr.
W.K.Mampearachchi, University of Moratuwa for giving me the opportunity to
undertake this research study and providing valuable advice and support throughout
the research study. I would like to acknowledge and appreciate the advice given by
Professor J.M.S.J Bandara, Research Coordinator of Department of Civil
Engineering, University of Moratuwa, and Dr. H.L.D.M. A. Judith, Road
Development Authority, Sri Lanka.
The support given by Professor W.P.S. Dias (Head, Department of Civil
Engineering) is acknowledged gratefully. I thank all the other lecturers for the
positive attitude they adopted in promoting research at Civil Engineering
Department.
I owe a very special gratitude to Mr. A.M.A.N. Karunaratne and other research
students at the Transportation Engineering Division of the Department of Civil
Engineering University of Moratuwa for giving me the support throughout the
research.
I would like to take this opportunity to extend my heartfelt appreciation to all the
academic and non academic staff of the University of Moratuwa, who has assisted
me in numerous occasions.
H.M.S.M. Herath
v
TABLE OF CONTENTS
DECLARATION .......................................................................................................... i ABSTRACT ................................................................................................................. ii DEDICATION ............................................................................................................ iii ACKNOWLEDGEMENT .......................................................................................... iv TABLE OF CONTENTS ............................................................................................. v TABLE OF FIGURES .............................................................................................. viii LIST OF TABLES ...................................................................................................... ix
CHAPTER 01 .............................................................................................................. 1 INTRODUCTION ....................................................................................................... 1
1.1 General ............................................................................................................... 1
1.2 Objectives ........................................................................................................... 2
1.3 Significance of the research ............................................................................... 2
1.4 Scope of the report ............................................................................................. 3
CHAPTER 02 .............................................................................................................. 4 LITRATURE REVIEW ON SOIL STABILIZATION ............................................... 4
2.1 General ............................................................................................................... 4
2.2 Method of Stabilising ......................................................................................... 4
2.2.1 Mechanical Stabilization ............................................................................. 5
2.2.2 Admixture Stabilization .............................................................................. 7
2.3 Local experiments and experience in soil stabilization.................................... 16
2.4 Studies on Degree of Pulverization of Soil in Stabilization. ............................ 17
CHAPTER 03 ............................................................................................................ 20 METHODOLOGY..................................................................................................... 20
3.1 Questionnaire Survey ....................................................................................... 20
3.1.1. General ..................................................................................................... 20
3.1.2 Selection of the survey sample .................................................................. 21
3.1.3 Preparation of questions ............................................................................ 21
3.2 Review of stabilizer selection criteria. ............................................................. 21
3.2.1 General ...................................................................................................... 21
3.2.2 Overseas Road Note 31 guideline ............................................................. 22
3.2.3 US Army Guideline................................................................................... 22
3.2.4 Flaherty Guideline ..................................................................................... 22
3.3 Selection of soil for the study........................................................................... 22
3.4 Laboratory Tests............................................................................................... 23
vi
3.4.1 Introduction ............................................................................................... 23
3.4.2. Determination of the optimum percentage of stabilizer. .......................... 25
3.4.3. Degree of Pulverization............................................................................ 26
3.4.4. Unconfined Compressive Strength (UCS) ............................................... 26
3.5 Field Tests ........................................................................................................ 27
3.5.1. Introduction .............................................................................................. 27
3.5.2 Test Pavements.......................................................................................... 27
3.6 Effect of delay compaction to the UCS of stabilized soil ................................ 28
CHAPTER 4 .............................................................................................................. 29 OBSERVATIONS AND RESULTS ......................................................................... 29
4.1 Evaluating stabilizer selection criteria. ............................................................ 29
4.1.1 Road Note 31 method................................................................................ 29
4.1.2. US Army method. .................................................................................... 29
4.1.3. C.A.O’Flaherty guideline. ........................................................................ 32
4.2 Laboratory Results. .......................................................................................... 32
4.2.1 Effect of mixing time on UCS and DOP ................................................... 32
4.2.2 Effect of Delay compaction and moisture content for the UCS................ 35
CHAPTER 05 ............................................................................................................ 39 ANALYSIS OF DATA .............................................................................................. 39
5.1 Findings of the Questionnaire Survey .............................................................. 39
5.2.1 Evaluation Stabilizer Selection Criteria .................................................... 40
5.2.2. Limitation of Guidelines. ......................................................................... 41
5.2.3. Effect of stabilizer selection on different soil types ................................. 41
5.3 Behaviour of DOP, UCS with Mixing Time .................................................... 43
5.4 Effect on delay compaction to UCS and OMC ................................................ 50
5.4.1 Soil – Cement, Lime mix under Prevailing Moisture Content ................. 50
5.4.2 Soil – Cement, Lime mix under delayed OMC condition ........................ 52
5.5 Field Test .......................................................................................................... 56
5.5.1 Cement Stabilized Pavement Section........................................................ 56
5.5.2. Lime Stabilized Pavement Section........................................................... 57
5.6 Comparison between Laboratory results and Field Results ............................. 58
CHAPTER 06 ............................................................................................................ 60 ECONOMICAL ANALYSIS .................................................................................... 60
6.1 General ............................................................................................................. 60

vii
6.2 Cost Analysis ................................................................................................... 60
6.2.1 Estimation of cost for transportation and laying good quality soil. .......... 60
6.3 Cost analysis for lime and cement stabilization ............................................... 61
CHAPTER 07 ............................................................................................................ 66 CONCLUSION AND RECOMENDATIONS .......................................................... 66
7.1 Conclusion ....................................................................................................... 66
7.2 Future Study ..................................................................................................... 67
7.3 Recommendation.............................................................................................. 68
REFERENCE ............................................................................................................. 69
APPENDIX A ............................................................................................................ 72
APPENDIX B ............................................................................................................ 75
APPENDIX C ............................................................................................................ 83

viii
TABLE OF FIGURES
Figure 2.1 : Methods of Stabilization ........................................................................ 5
Figure 2.2 : Mechanism of granular stabilization ..................................................... 6
Figure 2.3 : Effect of cement content on the unconfined compressive strength ....... 8
Figure 2.4 : Spreading of quick lime .......................................................................10
Figure 2.5 : Spreading of Lime slurry ..................................................................... 10
Figure 2.6 : Behaviour of UCS with Lime Content (Rawi and Samadi, 1995) ...... 10
Figure 2.7 : Factors affecting the design and behaviour of bitumen ....................... 12
Figure2.8 :Variationof MDD, OMC.......................................................................14
Figure 2.9 :Variation of CBR .................................................................................. 14
Figure 2.10 : Variation of UCS with RHA (Musa -2008) ......................................... 14
Figure 2.11 : Variation of MDD, OMC with Quarry dust ........................................ 16
Figure 2.12 : Variation of CBR with different percentages of quarry dust ............... 16
Figure 2.13 : Compaction curves for natural and lime stabilized soil ....................... 18
Figure 2.14 : Variation of UCS with Degree of Pulverization 6% Lime) ................. 19
Figure 2.15 : Variation of UCS with Degree of Pulverization 9% Lime .................. 19
Figure 3.1 : Sieve Analysis of soil used for the study ............................................. 23
Figure 3.2 : Test pavement ...................................................................................... 27
Figure 3.3 : Rotary mixing in field.......................................................................... 26
Figure 4.1 : Stabilizer selection criteria (Road Note 31,1993)................................ 29
Figure 4.2 : Sub group of soil based on sieve sizes................................................. 30
Figure 4.3 : Stabilizer selection method based on soil type and LL and PI ............ 31
Figure 4.4 : O’ Flaherty guideline to stabilizer selection. ....................................... 32
Figure 5.1 :Relationship among of DOP, UCS with 5 % cement soil no 1 ............ 44
Figure 5.2 :Relationship among of DOP, UCS with 4 % cement soil no 2 ............ 45
Figure 5.3 :Relationship among of DOP, UCS with 5 % cement soil no 3 ............ 46
Figure 5.4 : Relationship among of DOP, UCS with 6 % lime soil no 1 ................ 47
Figure 5.5 : Relationship among of DOP, UCS with 7 % lime soil no 2 ................ 48
Figure 5.6 : Relationship among of DOP, UCS with 7% lime soil no 3 ................. 49
Figure 5.7 : Formation of soil lump with mixing time ............................................ 50
Figure 5.8 : Relationship of UCS of Soil Cement mix with compaction delay ...... 54

ix
Figure 5.9 : Relationship of UCS of Soil Lime mix with compaction delay .......... 55
Figure 5.10 : Behaviour of UCS with No. Mixing Cycles ........................................ 57
Figure 5.11 : Behaviour of DOP with No. Mixing Cycles ........................................ 57
Figure 5.12 : Behaviour of UCS with No. Mixing Cycles ........................................ 58
Figure 5.13 : Behaviour of DOP with No. Mixing Cycles ........................................ 58
Figure 5.14 : DOP with mixing time of Cement stabilized soil ................................ 58
Figure 5.15 : DOP with mixing time of Lime Stabilized Soil................................... 58
Figure 5.16 : UCS with mixing time of Cement stabilized soil ................................ 59
Figure 5.17 : DOP with mixing time of Lime Stabilized Soil................................... 59

x
LIST OF TABLES Table 3.1 : Original Properties of soil used for study ............................................. 22
Table 3.2 : Requirements of Embankment Material ............................................... 24
Table 3.3 :Requirements of Upper Sub bas ............................................................. 24
Table 3.4 : Standard tests for soil property determination ...................................... 25
Table 3.5 : Properties of stabilized soil (Subbase) .................................................. 25
Table 4.1 : DOP and UCS with mixing time (Soil no 1 stabilized with lime 6%).. 33
Table 4.2 : DOP, UCS with mixing time (Soil no 2 stabilized with lime 7%) ....... 33
Table 4.3 : DOP, UCS with mixing time (Soil no 3 stabilized with lime 7%) ....... 33
Table 4.4 : DOP, UCS with mixing time (Soil no 1 stabilized with Cement 5%) .. 34
Table 4.5 : DOP, UCS with mixing time (Soil no 2 stabilized with Cement 4%) .. 34
Table 4.6 : DOP, UCS with mixing time (Soil no 3 stabilized with Cement 5%) .. 34
Table 4.7 : UCS values of delay compacted lime stabilized under OMC ............... 35
Table 4.8 : UCS values of delay compacted cement stabilized under OMC .......... 36
Table 4.9 : OMC of air dried stabilized soil ............................................................ 36
Table 4.10 : UCS values of lime stabilized soil compacted at OMC condition ........ 37
Table 4.11 : UCS values of lime stabilized soil compacted at air dried condition ... 37
Table 4.12 : UCS value of soil lime mixture ( Rotary mixing) ................................. 38
Table 4.13 : UCS value of soil cement mixture (Rotary mixing) ............................. 38
Table 5.1 : Categorized survey results .................................................................... 39
Table 5.2 : Limitation of stabilizer in guidelines .................................................... 41
Table 5.3 : PI limits of soil for road construction ................................................... 42
Table 5.4 : Type of Stabilizer based on PI and Sieve Size...................................... 43
Table 5.5 : Properties of 5% cement stabilized with soil no 1 ................................ 44
Table 5.6 : Properties of 4% cement stabilized with soil no 2 ................................ 45
Table 5.7 : Properties of 5% cement stabilized with soil no 3 ................................ 46
Table 5.8 : Properties of 6% Lime stabilized with soil no 1 ................................... 47
Table 5.9 : Properties of 7% Lime stabilized with soil no 2 ................................... 48
Table 5.10 : Properties of 7% Lime stabilized with soil no 3 ................................... 49
Table 5.11 : Delayed compacted Cement Soil, mixed under OMC .......................... 51
Table 5.12 : Delayed compacted Lime Soil, mixed under OMC .............................. 51
xi
Table 5.13 : Delayed compacted Cement Soil, mixed under air dried condition ..... 52
Table 5.14 : Delayed compacted Lime Soil, mixed under air dried condition ......... 53
Table 5.15 : Deduction percentages of UCSS (Soil – Cement Mixing) ................... 54
Table 5.16 : Deduction percentages of UCSS (Soil – Lime Mixing) ....................... 55
Table 5.17 : Field test results (Soil Cement Mixing) ................................................ 56
Table 5.18 : Field test results (Soil Lime Mixing) .................................................... 57
Table 6.1 : Cost Comparison for Deferent Cement Percentages. ............................ 64
Table 6.2 : Cost Comparison for Deferent Lime Percentages. ................................ 65
1
CHAPTER 01
INTRODUCTION
1.1 General
After the Second World War, there was a rapid development in most technical fields.
In the Civil Engineering Field, there were many innovations and technological
developments in each and every section including Road and Building constructions.
Mainly in the late seventies, major scale of infrastructure development projects were
started in Sri Lanka. At the beginning of this development projects, availability of the
construction materials were not a major problem. But as a result of rapid
infrastructure development in all over the country, presently there is a shortage of
some construction materials like good quality soil and aggregate. Due to this scarcity
of good quality materials, construction field has been faced severe problems like low
quality, project delaying and cost increasing etc.
Road construction is a major industry of the local infrastructure field. There are
several of ongoing road construction projects in every province, including few
highways. Most of these projects are widening or new constructions projects.
Therefore good quality soil demand is high and it has become the major problem in
some provinces.
Soil stabilization has been used widely in developed countries to overcome
scarcity of quality soil in past. Soil stabilization can be defined as any treatment
applied to the soil to improve its strength and reduce its vulnerability to water.
Mainly, there are two types of stabilization; Mechanical stabilization (granular
stabilization) and admixture stabilization (blend with cementing materials such as
cement, lime fly ash) etc. Soil stabilization has been used in Sri Lanka for certain
roads in experimental level but the agencies have not adopted it as a method of road
construction. Therefore, through this study, attempt to evaluate the suitability of soil
stabilization methods was made local road construction industry.

2
1.2 Objectives
The main objectives of the research are
To evaluate the suitability of soil stabilization method for local road construction
industry
To review suitable soil stabilization selection criteria
To develop a soil stabilization methodology for local road construction industry
1.3 Significance of the research Soil stabilization is not commonly used in Sri Lanka. Various reasons cause to
invisibility of this method in local construction sector. Therefore, it is very important
to find out the reasons for non popularity of this technology.
Further, specifications which are used in local industry do not provide broad
guideline to stabilizer selection. Under this study, analyse the stabilizer selection
criteria found in the literature. Furthermore, degree of pulverization and mixing time
are important parameters in soil stabilization. There have been few studies, which
focused on these parameters. The effectiveness of degree of pulverization and mixing
time for property of stabilized soil were considered in this study.
Effect of delayed compaction is a one of major factor should be considered in soil
stabilization. As a part of this research, a series of laboratory tests were conducted to
determine the effect of delayed compaction and moisture content on the stabilization.
In addition to laboratory investigations, field performances of stabilized soil were
determined by the aid of pavements constructed using stabilized soil. As the final
step of the study, cost evaluation was carried out to compare the cost effectiveness of
this technology.
This research attempts to provide evaluation of suitability of soil stabilization method
for local road construction industry.
3
1.4 Scope of the report
This thesis consists of seven chapters.
First chapter presents an introduction of the study with importance of soil
stabilization as a technology to minimize scarcity of good quality soil.
Second chapter provides literature on historical background, soil stabilization
methods and stabilization action, performance of stabilized soil, new invented
stabilizers and current practices of soil stabilization.
Third chapter explains the methodology for questionnaire survey, laboratory scale
investigation, field investigation and cost analysis for soil stabilization technology.
Fourth chapter presents investigation results obtained through laboratory, field tests
and questionnaire survey.
Fifth chapter presents the analysis of investigation results obtained through
questionnaire survey, laboratory and field testing.
By the sixth chapter, discuss about the cost comparison between stabilized soil and
conventional subbase material.
Chapter seventh presents the conclusion and recommendation.
4
CHAPTER 02
LITRATURE REVIEW ON SOIL STABILIZATION
2.1 General
Soil stabilization is the alteration of the property of locally available soil to improve
its engineering properties, such as strength, stiffness, compressibility, permeability,
workability and sensitivity. In other words stabilization of soil, means limitation or
removal of unacceptable soil properties. (Emilijan, Mladen , 1990 ) .This technique
was used in nearly 2000 years ago in Romans in road construction.(Mallawarachchi,
1992)
Stabilization techniques can be divided into different categories mechanical,
admixture (cement, lime, asphalt, chemical compound or combination of those),
electrical or thermal based on the methodology / stabilizer used (Nagih and Samadi,
1995). Application of the stabilizer type is based on the original properties of soil to
be stabilized. Both the advantages and disadvantages are together with each type of
stabilization. The most common improvements which can be achieved through the
stabilization are better soil gradation, reduction of plasticity index or swelling
potential, and increases in durability, and strength. Further, structural layer
coefficient can be increased using stabilization. Structural layer coefficient of natural
subbase is taken as 0.1 and lime or cement stabilized layer 0.18. (AASHTO Guide
for design of pavement structures,1993). Therefore, in the pavement designing, layer
thicknesses of the soil layers can be reduced using stabilized soil pavements.Strength
of the stabilized soil is depended on the type of stabilizer, the content of the
stabiliser, degree of compaction, moisture content, the chemical composition of the
material to be stabilised, degree of mixing the material with the stabiliser and
subsequent external environmental effects.
2.2 Method of Stabilising According to the original properties of soil, stabilization methods are varied. Further,
for each stabilizer, stabilization mechanism is different. Mainly, stabilization can be

5
divided into two categories; Mechanical stabilization and Admixture stabilization.
Under admixture stabilization cement, lime, bitumen and other types of stabilizers
(which strength gaining through chemical reactions) are categorized. The mechanism
of strength gaining is varied from stabilizer type. Figure 2.1 shows the stabilization
methods commonly available in literature.
Figure 2.1 : Methods of Stabilization
2.2.1 Mechanical Stabilization Mechanical Stabilization is also known as “Soil – Aggregate Stabilization” and
“Granular stabilization” (Flaherty C.A.2006). The aim of mechanical stabilization is
achieving dense homogeneous mass when compacted through improving the
gradation of raw soil. Here, the physical properties of the soil will be changed.
6
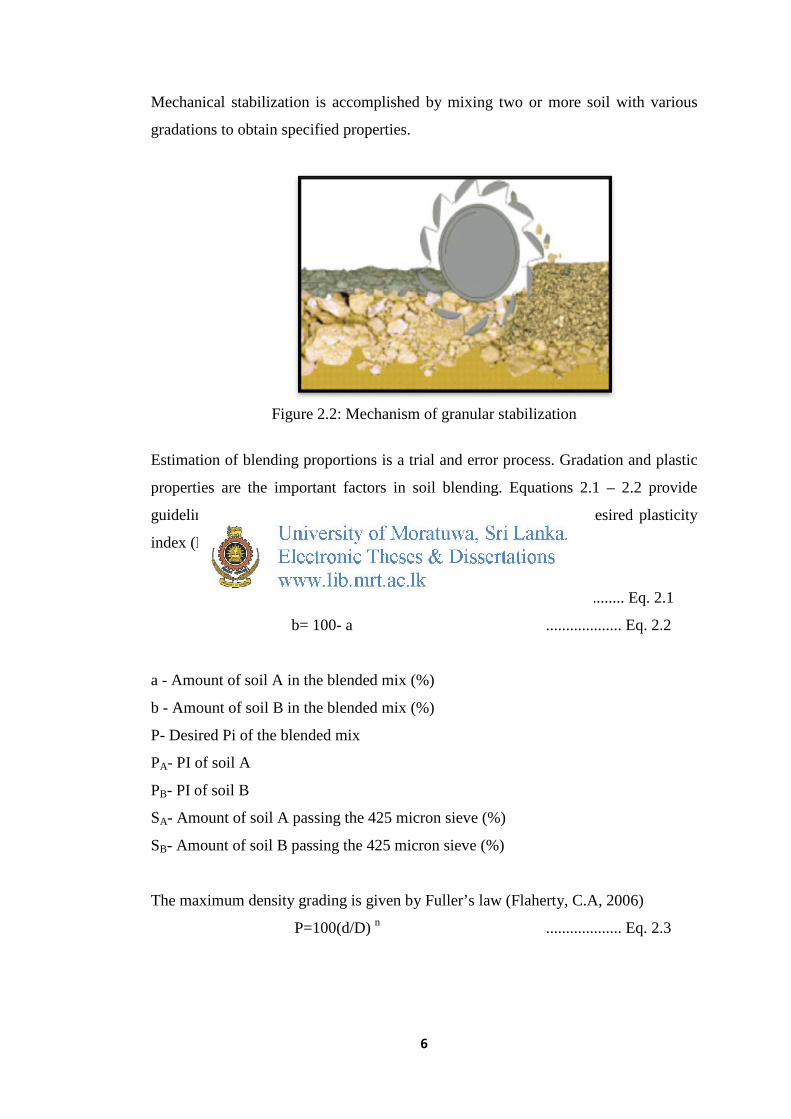
Mechanical stabilization is accomplished by mixing two or more soil with various
gradations to obtain specified properties.
Figure 2.2: Mechanism of granular stabilization
Estimation of blending proportions is a trial and error process. Gradation and plastic
properties are the important factors in soil blending. Equations 2.1 – 2.2 provide
guideline to determine the initial proportions of blending, to give desired plasticity
index (Flaherty, C.A, 2006)
a= 100SB (P-PB)/ [(SB(P-PB)-SA(P-PA)] ................... Eq. 2.1
b= 100- a ................... Eq. 2.2
a - Amount of soil A in the blended mix (%)
b - Amount of soil B in the blended mix (%)
P- Desired Pi of the blended mix
PA- PI of soil A
PB- PI of soil B
SA- Amount of soil A passing the 425 micron sieve (%)
SB- Amount of soil B passing the 425 micron sieve (%)
The maximum density grading is given by Fuller’s law (Flaherty, C.A, 2006)
P=100(d/D) n ................... Eq. 2.3

7
p- Percentage by weight of the total sample passing any given sieve size
Aperture of that sieve (mm)
D- Size of the largest particle in the sample (mm)
n- An exponent between 0.33 and 0.5
The proportion of material added to the soil, usually 10% to 50%. Mix in plant,
travelling plant and stationary plant methods are normally used in mechanical
stabilization. The main advantage of this type of stabilization is low cost. Major
applications of the mechanically stabilized soils are,
Unsealed surface courses, road base and subbases of lightly trafficked roads
Subbases and road bases in single carriageway roads with bituminous surfacing
Subbases and capping layers in heavily trafficked roads. (Flaherty, C.A, 2006)
2.2.2 Admixture Stabilization Rather than changing the physical properties of the materials, chemical reactions are
the strength gaining mechanisms of admixture stabilization. Cement, Lime and
Bitumen are the most popular chemical stabilizers in the road construction industry.
In addition to those stabilizers, fly ash, chlorides, rice husk ash and other
cementation mixtures are also used in minor scale.
2.2.2.1. Cement Stabilization The first controlled soil- cement mixture was used in road construction in 1915
(Dallas et al, 2000). Cement stabilization is the most common method which use in
the industry due to availability in most countries, availability of more technical
information, less care respect to other stabilizers and provision to use with wide
range of soil. Gradation and plasticity index of the soil are the most important
parameters that should be considered in cement stabilization. It is not economical to
use cement as stabilizer for heavy clays.
Cement stabilized materials fall into two categories Soil cement and cement modified
soil. Soil cement is a mixture of pulverized soil material and aggregate, measured
amount of Portland cement, and water that is compacted into high density. Cement

8
treated aggregate bases and recycle flexible pavement are known as soil-cement
product. Cement modified soil is a mixture of soil or aggregate with a small amount
of cement (less proportion). Cement modified soil is used to improve subgrade soil
(Dallas et al, 2000).
In the soil cement stabilization, moisture content of mixture is a critical factor
influence to the dry density and unconfined compressive strength. Therefore,
stabilization process should be carried out at the optimum moisture content. Further,
by increasing the cement content of the mixture, higher compressive strength can be
obtained. Unconfined strength increase lineally with the cement content as shown in
figure 2.3
Figure 2.3: Effect of cement content on the unconfined compressive strength (Rawi and Samadi, 1995)
Reactions in cement stabilization
Dry soil + Cement + Water Calcium Silicate + Calcium Aluminate
Hydrate + Hydrated Lime
As a result of above primary reaction, calcium silicate and calcium aluminates
hydrate bind soil particles together. This reaction takes short time and therefore
9
immediately soil gains significant strength. The hydrated lime will be entered to
secondary reaction to further inter particle bonding by react with any reactive
elements in first reactions. Further, there is a reaction with cation of soil to reduce the
plasticity of soil.
Strength of cement stabilized soil
The strength of cement stabilized soil is depend on the chemical composition of the
material to be stabilised, the stabiliser content, the degree of compaction achieved,
the moisture content, the success of mixing the material with the stabiliser,
subsequent external environmental effects. Further, it is directly proportional to the
amount of cement admix. Normally strengthening period is very long for the cement
stabilized soil.
Stabilizer Amount
Determination of optimum cement content for the stabilization is a trial and error
method (Soil Stabilization Pavements, 2004). But In practice, it is usually less than 5
%.
Cement stabilized soil could be used as subgrade capping layers and subbase layers
in major road pavements and Subbases and road bases in secondary roads.
Note – It is never use as a surface cause due to poor resistance to the abrasion.
2.2.2.2 Lime Stabilization
Lime was used in road construction as a stabilizer in early roman roads (Flaherty
C.A, 2006). There are few types of lime can use as a stabilizer, such as hydrated high
calcium lime, Ca (OH) 2 and calcitic quick lime. Lime can be used in both dust and
liquid form to mix with soil. Main differences between lime and cement stabilization
are the nature and rate of lime soil reaction. Further, it is not advisable to use lime
with cohesionless or less cohesive soil.
10
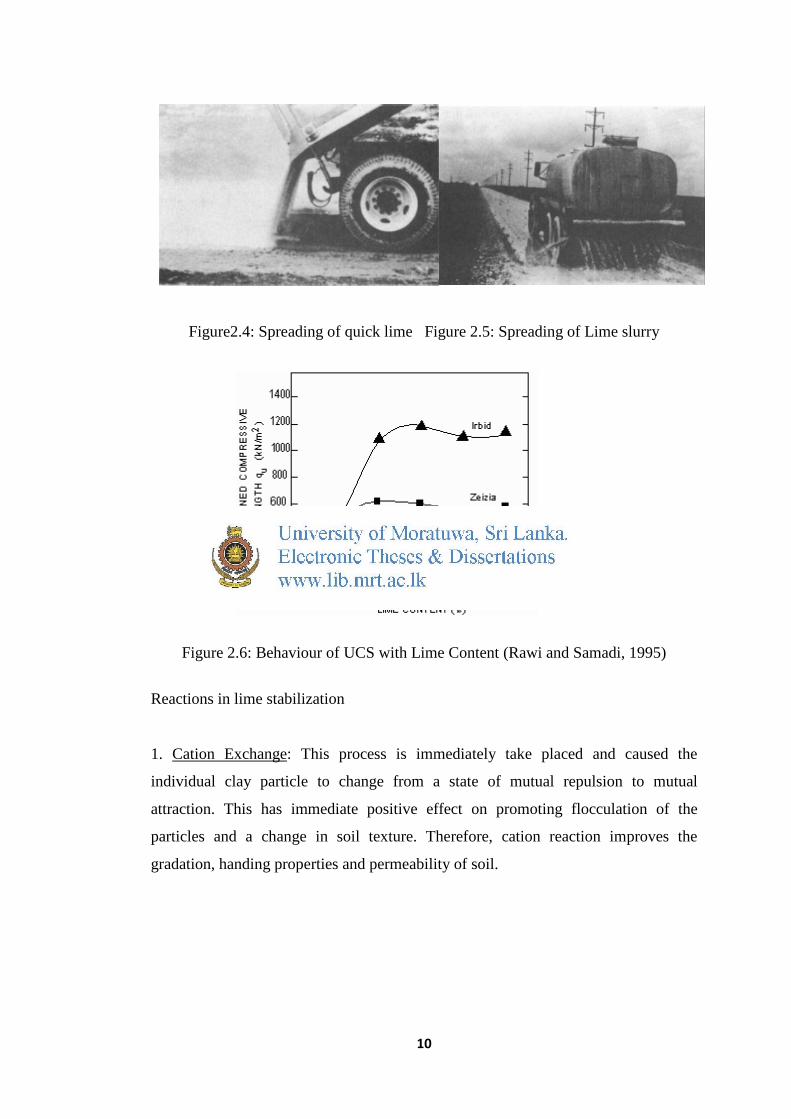
Figure2.4: Spreading of quick lime Figure 2.5: Spreading of Lime slurry
Figure 2.6: Behaviour of UCS with Lime Content (Rawi and Samadi, 1995)
Reactions in lime stabilization
1. Cation Exchange: This process is immediately take placed and caused the
individual clay particle to change from a state of mutual repulsion to mutual
attraction. This has immediate positive effect on promoting flocculation of the
particles and a change in soil texture. Therefore, cation reaction improves the
gradation, handing properties and permeability of soil.
11
2. Pozzolonic reaction; Pozzolonic reaction is slower than cationic reaction and form
cementations products that have long term strength, volume stability and resistance
to frost action in stabilized soil.
3. Carbonation: This is a reaction between carbon dioxide from air and rain water
with free calcium, magnesium oxides and hydroxides is known as carbonation. This
causes to lower strength in soil lime mixture. Therefore, long intensive mixing and
long term processing to be avoided if high strength gain is objected.
Strength of Lime stabilized soil In general, the early strength (first 7 day) gaining occurs quickly (low speed than
cement) and after that increases more slowly until finish free lime. Further, curing
time and curing temperature also affect to the strength of lime stabilized soil.
(Techniques to Improve Local Materials for Rural Road Pavements in Cambodia ,
2008).
Stabilizer Amount Minimum lime amount for stabilization is varied for different type of soil, according
to their properties. There is a standard guideline provided by American Society for
Testing and Materials (ASTM D6276-99a) to estimate the minimum lime
requirement to stabilization (National Lime Association, 2004).
Lime stabilized soil use as a subbase and subgrade in roads pavements and base
stabilizer in new roads. Note- It is never use as surface cause due to the dust
generation.
2.2.2.3 Bituminous Stabilization Emulsion, hot bitumen and cutback bitumen could be used in soil stabilization. When
considering the stabilization mechanism, it is totally deferent from cement and lime
stabilization. The basic mechanism is waterproofing phenomena in fine grain soil.
The bitumen coated soil particles or soil agglomerates decrease the water penetration
and it prevents the strength loss from the soil. The second mechanism is adhesion,

12
bitumen acts as glue between the soil particles. Shear strength of soil is increased due
to this action.
To obtain expected results from bitumen stabilization, bituminous materials should
be thoroughly, uniformly mixed at the higher temperature and allowed sufficient
time after mixing and before compacting to aerate properly.
Figure 2.7: Factors affecting the design and behaviour of bitumen stabilized material (O’Flaherty -2006)

13
2.2.2.4. Other stabilizers for soil stabilization
Coal fly ash stabilization
Fly ash is a product of combustion of bituminous. Anthracite and lignite coal are
pozzolonic but not self cementing. To produce cementations products cement or lime
activator should be added. By burning low sulphur coal, self cementing fly ash could
be obtained.Fly ash is a pozzolanic material, consisting mainly of silicon and
aluminum compounds that, when mixed with lime and water, forms a hardened
cementitious mass capable of obtaining high compressive strengths . Therefore, lime
and fly ash mixture can often be used successfully in stabilizing granular materials
having few fines since the fly ash provides an agent with which the lime can be
reacted. In addition to lime and fly ash, a small amount of Portland cement is also
added to accelerate and increase strength gain
Chlorides
Sodium Chloride (NaCl) and Calcium Chloride ( CaCl2) are the most common
chloride types which are used in unsealed granular stabilized pavement. For the best
results chlorides should be added with mechanically stabilized pavement. Further,
chloride filtering to the bottom part of the pavement should be prevented. The
hygroscopic and deliquescent properties of the chloride are act major role in soil
stabilization. Due to hygroscopic behaviour, chloride absorbs water from the air and
due to deliquescent dissolve in moisture. Due to these properties chloride can
maintains a dust free surface of unsealed gravel road by absorbing water from the
atmosphere.
Rice husk ash (RHA) stabilization
Rice husk is an agricultural waste obtained from milling of rice. Ash has been
categorized under pozzolana, with about 67 – 70 % silica, about 4.9% aluminium
oxide and 0.95% iron oxides. (Oyetola and Abdullahi, 2006). When increase the rise
husk ash percentage in soil ash mixture maximum dry density is decreased due to the
lower density of RHA. (Osula 1991) . Further, there is an increase of the OMC with

14
increase of RHA content. (Ola 1975, Osinubi 1999 and Musa 2008). The influence of
RHA content for the MDD, OMC, soaked and unsoaked CBR,
Unconfined Compressive Strength are shown in following figure 2.8, 2.9 and 2.10
respectively.
Figure 2.8: Variation of MDD, OMC Figure 2.9: Variation of CBR
(Musa, 2008) with RHA Content (Musa, 2008)
Figure 2.10: Variation of UCS with RHA (Musa -2008)
Quarry Dust Stabilization
Quarry dust is a by product of metal crushers widely use in the construction industry.
Quarry dust is commonly used India as a soil improving agent (Soosan 2005).
Further, it has been found that quarry dust with cement provide higher improvement

15
of engineering properties of unsuitable soil (Priyankara et al. 2008). But the
influence of small percentage of quarry dust is minimum for the CBR. (Soaked as
well as Unsoaked). Figure 2.11 and 2.12 presents the MDD, OMC variation and
CBR
varia
tion
with
the
quar
ry
dust
perc
enta
ge
resp
ectively
16
Figure 2.11: Variation of MDD, OMC with Quarry dust percentage of Soil – Quarry dust mixture (Priyankara et al.,2008)
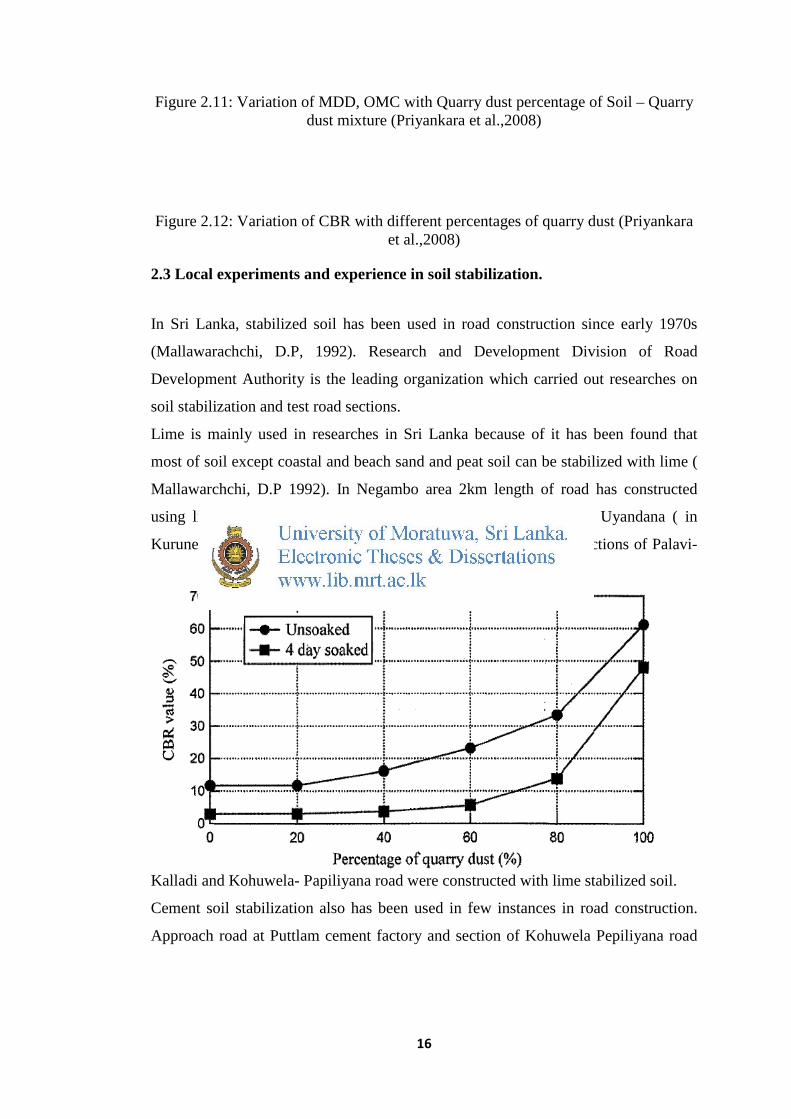
Figure 2.12: Variation of CBR with different percentages of quarry dust (Priyankara et al.,2008)
2.3 Local experiments and experience in soil stabilization.
In Sri Lanka, stabilized soil has been used in road construction since early 1970s
(Mallawarachchi, D.P, 1992). Research and Development Division of Road
Development Authority is the leading organization which carried out researches on
soil stabilization and test road sections.
Lime is mainly used in researches in Sri Lanka because of it has been found that
most of soil except coastal and beach sand and peat soil can be stabilized with lime (
Mallawarchchi, D.P 1992). In Negambo area 2km length of road has constructed
using lime stabilized soil, In 1981, 100m section of Yaggalpitiya Uyandana ( in
Kurunegala area) road has surfaced using soil lime mixture. Few sections of Palavi-
Kalladi and Kohuwela- Papiliyana road were constructed with lime stabilized soil.
Cement soil stabilization also has been used in few instances in road construction.
Approach road at Puttlam cement factory and section of Kohuwela Pepiliyana road

17
are few experiences in soil cement stabilization. Recently in Putlam Padeniya road,
cement stabilized soil has been used in shoulder construction in few areas. In 1970 at
Angulana area road section was constructed using bitumen stabilized soil. Further,
few road sections has been constructed with mechanical stabilized soil in Sri Lanka
(Ceremonial Pathway at Katharagamab,Bangadeniya – Anamaduwa Road).
In addition to researches and road sections mentioned above, there may be few
applications of soil stabilization in Sri Lanka. Due to the unavailability of proper
documentation, it has been difficult to collect those data for studies.
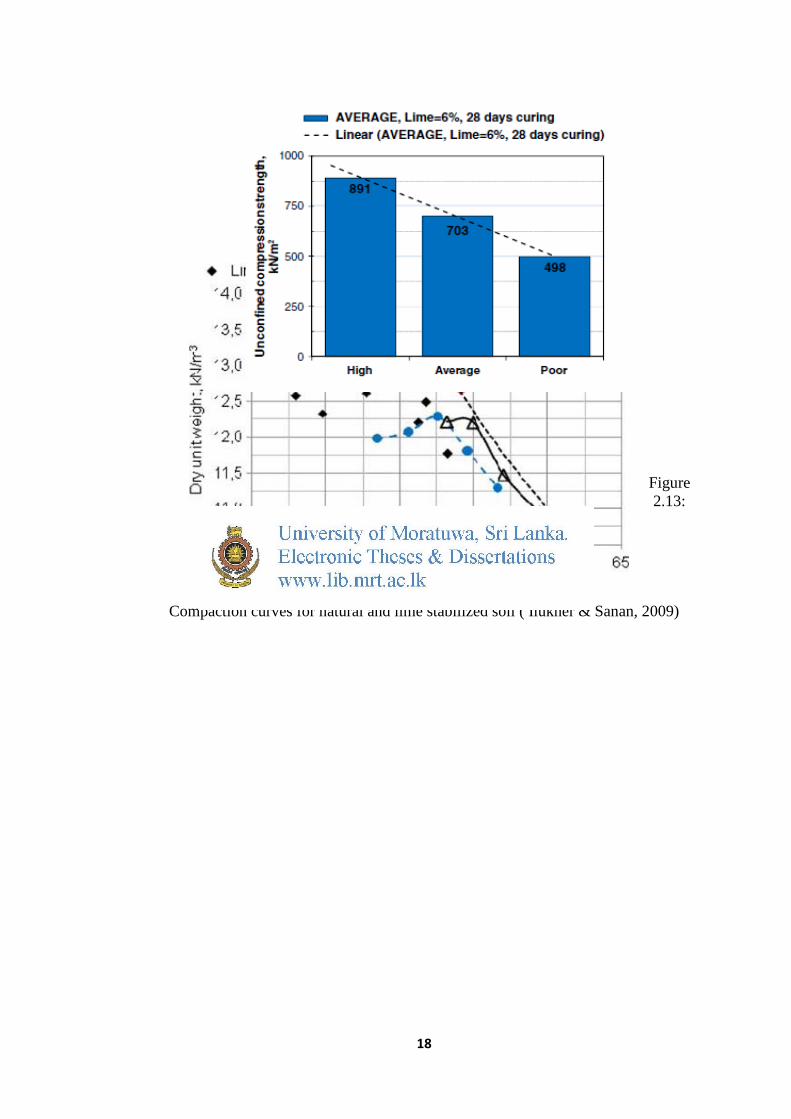
2.4 Studies on Degree of Pulverization of Soil in Stabilization.
Soil Pulverization is an important parameter which should be considered in the soil
stabilization. But only few studies have been done on this topic. Ilukner Bozbey and
Sanan Garaiisayev have done few studies in 2009 on effect of soil pulverization
quality on lime stabilization. Furthermore few studies have been done by Petry and
Little in 2002, and Petry and Wohlegemuth in 1988. They have concluded that
degree of pulverization is an important parameter in chemical stabilization.
Variations of Optimum Moisture Content with the various lime percentages which
obtained by Ilukner are shown in figure 2.13. ( Ilukner & Sanan, 2009). Further,
Figure 2.14 and 2.15 present the variation in strength values for different
pulverization qualities with 6% and 9% lime addition respectively. Here, soil
pulverization has defined as good, average and poor.
18
Figure 2.13:
Compaction curves for natural and lime stabilized soil ( Ilukner & Sanan, 2009)
19
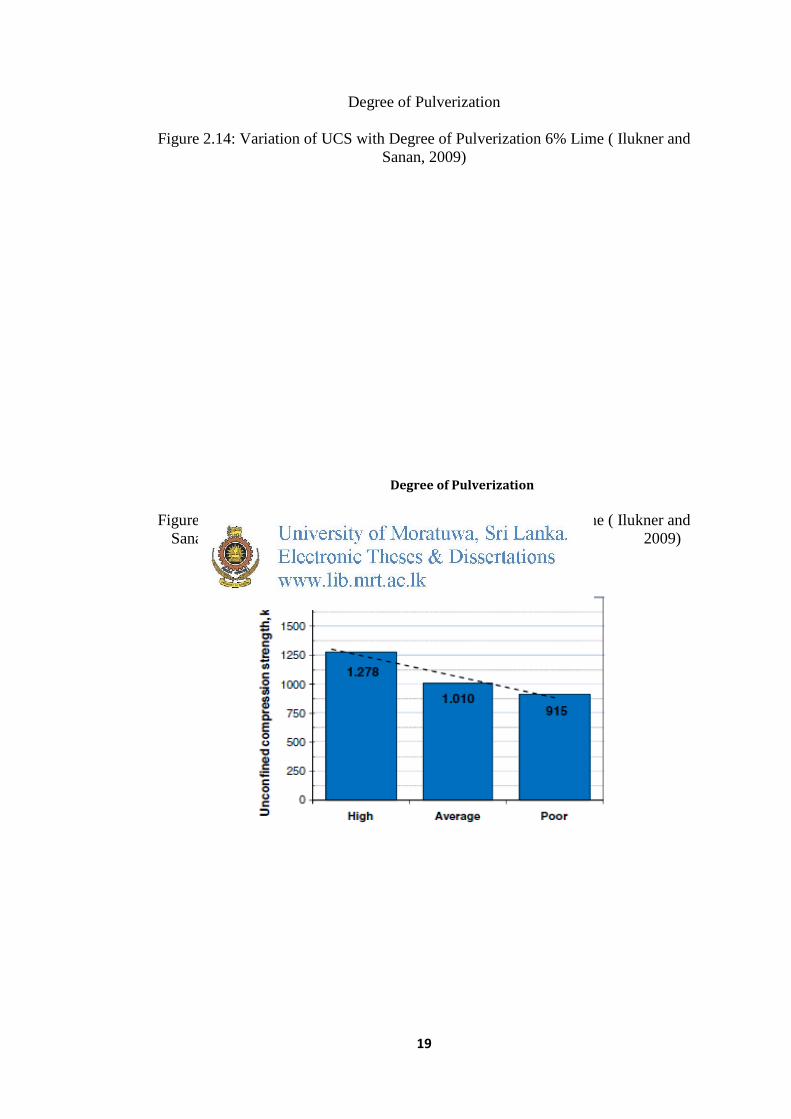
Degree of Pulverization
Figure 2.14: Variation of UCS with Degree of Pulverization 6% Lime ( Ilukner and Sanan, 2009)
Degree of Pulverization Figure 2.15: Variation of UCS with Degree of Pulverization 9% Lime ( Ilukner and
Sanan, 2009)
20
CHAPTER 03
METHODOLOGY
3.1 Questionnaire Survey
3.1.1. General Soil stabilization is a very popular technology in developed countries. In Sri Lanka
this technology has been used in laboratory research and minor construction for more
than 40 years (Mallawarachchi, D.P. 1992). However, this technology is not use in
local industries as a common practice. Specially, in road construction industry soil is
a major construction material. In a high demand situation like present condition,
professionals in the industry do not promote to use stabilized soil. Therefore, as the
first step of the methodology, carried out a questionnaire survey. The main objectives
of the questionnaire survey was find out the factors which have been affect to the non
popularity of soil stabilization in local road construction industry.
The questionnaire survey is a set of questions given to a sample of people to gather
information about the people’s attitudes, thoughts, behaviours, and so forth. Then the
authors have compiled the answers of the people in the sample in order to know how
the group as a whole thinks or behaves. Followings are the main advantages of
questionnaires survey.
Easy to analysing
Participants have to answer same questions and in most questions answers have to be
selected from given. Therefore, variation of answers is very low compare with the
descriptive questions.
Reduce bias
There is uniform question presentation and no middle-man bias. The researcher's
own opinions will not influence the respondent to answer questions in a certain
manner. There are no verbal or visual clues to influence the respondent.
Less intrusive than telephone or face-to-face surveys
There is enough time to complete the paper and no any interrupting from the
researcher.
Familiar to most people
21
Nearly everyone has had some experience completing questionnaires and they
generally do not make people apprehensive.
Cost effective
Questionnaires are very cost effective when compare with the face to face or
telephone conversation.
3.1.2 Selection of the survey sample People who respond to the questionnaires are known as survey sample. The results
obtain by analysing the questionnaires are definitely based on the survey sample.
This questionnaire survey was mainly focused on road construction industry. The
survey sample was selected from the professionals who directly engaged with road
construction to collect more detail about the present status of the road construction
industry. Therefore, survey sample has consisted of Road Engineers and Technicians.
3.1.3 Preparation of questions At the beginning of the questionnaire paper, basic details of the respondent have
been included. (Ex. Name, Designation, Experience in road construction industry
etc). Then some questions have been included to find out the usage of soil, supplying
method and distance to the borrow pit, storage time prior to the use in construction in
their projects. Next questions were based on the engineering properties of available
soil and specified soil. At the end, questionnaire was consisted of the questions
which related to soil stabilization. Sample survey form is attached in APPENDIX A.
3.2 Review of stabilizer selection criteria.
3.2.1 General Stabilizer selection is a most important and critical factor in the stabilization process.
As mentioned in earlier chapter (Chapter 2) there are various types of stabilizers for
soil stabilization. The effect of stabilizer on a specified soil is depended on the
stabilizer type. There is no opportunity to achieve target results with every type of
stabilizers. To overcome this problem, previous studies have introduced several

22
guidelines for stabilizer selection, based on the original properties of the soil. Details
of the guidelines are given in section 3.2.2- 3.2.4.
3.2.2 Overseas Road Note 31 guideline Overseas Road Note 31 is a guide to the structural design of the bitumen surfaced
road in tropical and sub tropical countries and published by the overseas centre of
Transport Research Laboratory (TRL). Further, these guidelines are based on the
research conducted by the TRL in the tropical countries.
3.2.3 US Army Guideline This guideline is introduced by the department of the army, the navy and the air force
in USA by publication named “Soil Stabilization for Pavements”.
3.2.4 Flaherty Guideline C.A. Flaherty, pavement engineer has introduced method for stabilizer selection
based on his experiences and technical detail. This guideline has been mentioned in
the “HIGHWAYS” text book written by C.A. Flaherty.
3.3 Selection of soil for the study When selecting the soil for the study, soils with marginally out of properties were
specially considered. As the first step of the stabilizing procedure; original properties
of soil were checked. As specified in ICTAD standard specification for road and
bridge maintenances liquid limit ,plasticity Index, maximum Dry Density and
California Bearing Ratio (CBR) soaked and sieve analysis were checked for all three
soil types. Following table 3.1 presents the original properties of soil used for the
study.
Table 3.1: Original Properties of soil used for study
Soil Type LL % PI % CBR%
(Soaked)
AASHTO-
Soil
Classification 1 45 16 12 A-2-7
2 58 17 22 A-2-7
3 63 18 18 A-2-7

23
Figure 3.1: Sieve Analysis of soil used for the study
According to the original properties of 3 soil types as shown in table 3.1, those soil
not comply with the specification. Further, when evaluate the stabilize selection by
three guidelines cement and Lime are suitable for stabilizing above three soils.
3.4 Laboratory Tests
3.4.1 Introduction Soil is used as subgrade, Embankment, subbase, shoulder materials and base
materials (rarely) in road construction. The required standard for each case varies
according to the specifications which use in the industry. Specification published by

24
the Institute for Construction Training and Development (ICTAD) is the widely used
standard for construction and maintenance of roads and bridges in Sri Lanka. The
summary of the required properties of original soil and stabilized soils in the ICTAD
specification are given in Table 3.2and .3.3.
Table 3.2 - Requirements of Embankment Material
Property Embankment Type 1 Embankment Type II
Liquid Limit (LL) Not Exceed 50% Not Exceed 55%
Plastic Index (PI) Not Exceed 25% Not Exceed 25%
Maximum Dry Density
(Modified)
Not less than 1,600
kg/m3
Not less than 1,500
kg/m3
4 day soaked CBR at 95%
MDD (Modified)
Not less than 7% Not less than 5%
Table 3-3 -Requirements of Upper Sub bas
Property Upper Subbase
Flexible Pavement Rigid Pavement
Liquid Limit (LL) Not Exceed 40% Not Exceed 25%
Plastic Index (PI) Not Exceed 15% Not Exceed 6%
Maximum Dry Density
(Modified)
Not less than 1,750 kg/m3
4 day soaked CBR at 95%
MDD (Modified)
Not less than 30%
Not less than 5%

25
Evaluate the suitability of original soil, following tests have been conducted.
Table 3.4 – Standard tests for soil property determination
According to the results obtained by above tests it was found that properties are not
complied with the specification. Therefore that soil was used for the stabilization.
(Test reports are attached in Appendix B)
Specified properties for stabilized soil as a subbase are presented in the table 3.5.
Table 3.5 – Properties of stabilized soil (Subbase)
Property Upper Subbase
Liquid Limit (LL) Not Exceed 40%
Plastic Index (PI) Not Exceed 15%
Maximum Dry Density
(Modified)
Not less than 1,750
kg/m3
Unconfined Compressive
Strength 750 -1500kN/m2
3.4.2. Determination of the optimum percentage of stabilizer.
Soil – Lime mixing
Standard test method of ASTM 6276 can be used to determine the optimum lime
amount for stabilization. This test method provides the optimum soil-lime proportion
Test Name ASTM Standard No. Sieve Analysis D 422 - 98
Liquid limit D 4318 -00
Plastic Index D 4318 -00
Optimum Moisture Content D 1557 -00
Maximum Dry Density D 1557 -00
California Bearing Ratio D 1883 -99
26
for stabilization of a soil. This test is performed on soil passing 425-μm sieve. A
series of specimens is prepared with various amount of lime percentages. pH value of
the soil lime slurries were checked to determine minimum lime content of the soil-
lime mixture to obtain the pH value of 12.4. The lime content which shows the 12.4
pH value is known as the minimum lime amount for stabilization.
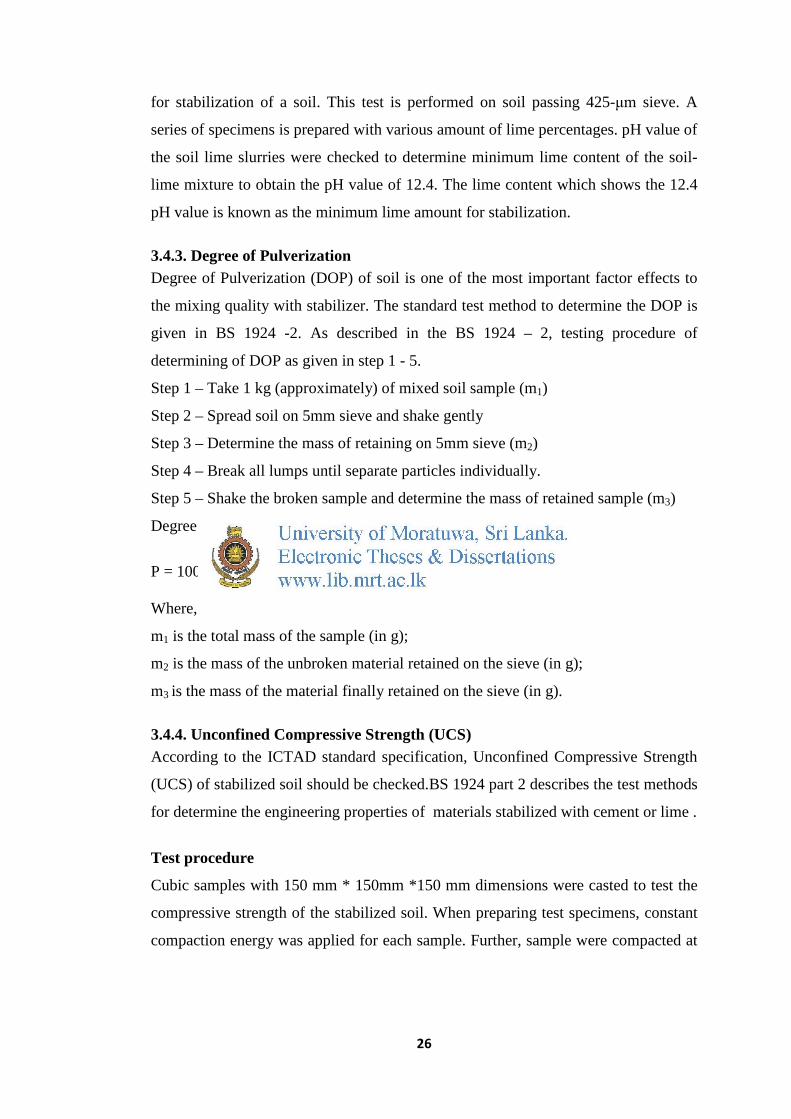
3.4.3. Degree of Pulverization Degree of Pulverization (DOP) of soil is one of the most important factor effects to
the mixing quality with stabilizer. The standard test method to determine the DOP is
given in BS 1924 -2. As described in the BS 1924 – 2, testing procedure of
determining of DOP as given in step 1 - 5.
Step 1 – Take 1 kg (approximately) of mixed soil sample (m1)
Step 2 – Spread soil on 5mm sieve and shake gently
Step 3 – Determine the mass of retaining on 5mm sieve (m2)
Step 4 – Break all lumps until separate particles individually.
Step 5 – Shake the broken sample and determine the mass of retained sample (m3)
Degree of Pulverization of Sample,
P = 100 (m1 – m2)/(m1 – m3) ------------------------------ Eq. 3.1 Where,
m1 is the total mass of the sample (in g);
m2 is the mass of the unbroken material retained on the sieve (in g);
m3 is the mass of the material finally retained on the sieve (in g).
3.4.4. Unconfined Compressive Strength (UCS) According to the ICTAD standard specification, Unconfined Compressive Strength
(UCS) of stabilized soil should be checked.BS 1924 part 2 describes the test methods
for determine the engineering properties of materials stabilized with cement or lime .
Test procedure
Cubic samples with 150 mm * 150mm *150 mm dimensions were casted to test the
compressive strength of the stabilized soil. When preparing test specimens, constant
compaction energy was applied for each sample. Further, sample were compacted at

27
the optimum moisture content in 3 layers with 35 blows for each.4.5 kg weight
hammer with, 45mm squire face and 450mm controlled height was used for the
compaction. Curing of samples should be done using a curing tins or air sealed
containers to prevent removing water from samples. After the curing period samples
were crushed at 7 days and 28 days loading rate of 2.5 – 4.5 MPa/min.
3.5 Field Tests
3.5.1. Introduction Evaluation of applicability of laboratory findings for field condition is important in
civil engineering field. Therefore, performances of stabilized soil were measured in
field condition. For the mixing purpose, rotary mixture was used with 600mm (2
feet) width and 18 blades. Rotating speed was 90 rpm. Stabilized soil parameters,
DOP and UCS were measured with mixing time.
3.5.2 Test Pavements Eight test pavement sections were constructed in the university premises to test the
performance of cement and lime stabilized soil. Four test sections from each were
constructed with 3m (10 feet) length, 1.2m (4 feet) width and 0.15m(6 inch)
thickness. Width of the pavement section was selected considering the width of the
rotary used. Length was selected to be able to record the mixing time. Test pavement
and mixing with stabilizer are shown in figure 3.2 and 3.3 respectively.
Figure 3.2: Test pavement Figure 3.3 : Rotary mixing in field
To determine the optimum mixing time and DOP, various mixing cycles were used
in each pavement. Further, six samples were collected from each pavement for

28
laboratory test. DOP, UCS were checked in each sample. Compaction of test
pavements was done using a plate vibrator under optimum moisture content.
3.6 Effect of delay compaction to the UCS of stabilized soil It is found in literature (Kolawole J. Osinubi , Charles M. O. Nwaiwu, 2006),
compaction time is crucial factor in strength gaining of stabilized soil. Stabilizer
mixed under OMC condition and air dried condition for both cement and lime
stabilizer. To determine the effect of delay compaction on UCS, compaction time
was delayed up to 0 to 6 hours in both stabilizing and measured the UCS of delayed
compacted sample.

29
CHAPTER 4
OBSERVATIONS AND RESULTS
4.1 Evaluating stabilizer selection criteria.
4.1.1 Road Note 31 method
PP – Plasticity Product Figure 4.1: Stabilizer selection criteria (Road Note 31,1993)
Road note 31 provides guideline for selecting Cement, Lime and Lime pozzolan as
stabilizers. Further, plasticity Index (P1) and 0.075mm passing percentage are the
major factors in selecting the stabilizer.
4.1.2. US Army method.
This guideline provides direction for selecting lime, Portland cement, bituminous and
lime-cement-fly ash stabilizer
According to the figure 4.2, material type can be selected based on percentage of
materials passing no 200 sieve and material passing no 4 sieve and retained on no
200 sieve. (Ex-Sands, Gravels etc.) Column 1, in figure 4.3 presents the relevant area
of the figure 4.2. And column 2, 3 provides soil class and type of stabilizing additive
recommended respectively. Column 4 and 5 provide restriction on LL& PI and
percentage passing no 200 sieve respectively, for the stabilizer selection.
PI=<6 PP=<60
More than 25% passing the 0.075mm sieve
Less than 25% passing the 0.075mm sieve
PI=<10 10<PI< 20 PI>20 PI=<10 PI>10
Type of Stabilizer
Cement Yes Yes * Yes Yes
Yes * No Yes
Yes
*
Lime Lime-
Pozzolan
*
Yes * No Yes Yes
Yes
Soil Properties

30
Figure 4.2: Sub group of soil based on sieve sizes (Soil Stabilization Pavements,
2004)

31
Figure 4.3: Stabilizer selection method based on soil type and LL and PI (Soil Stabilization Pavements, 2004)
32
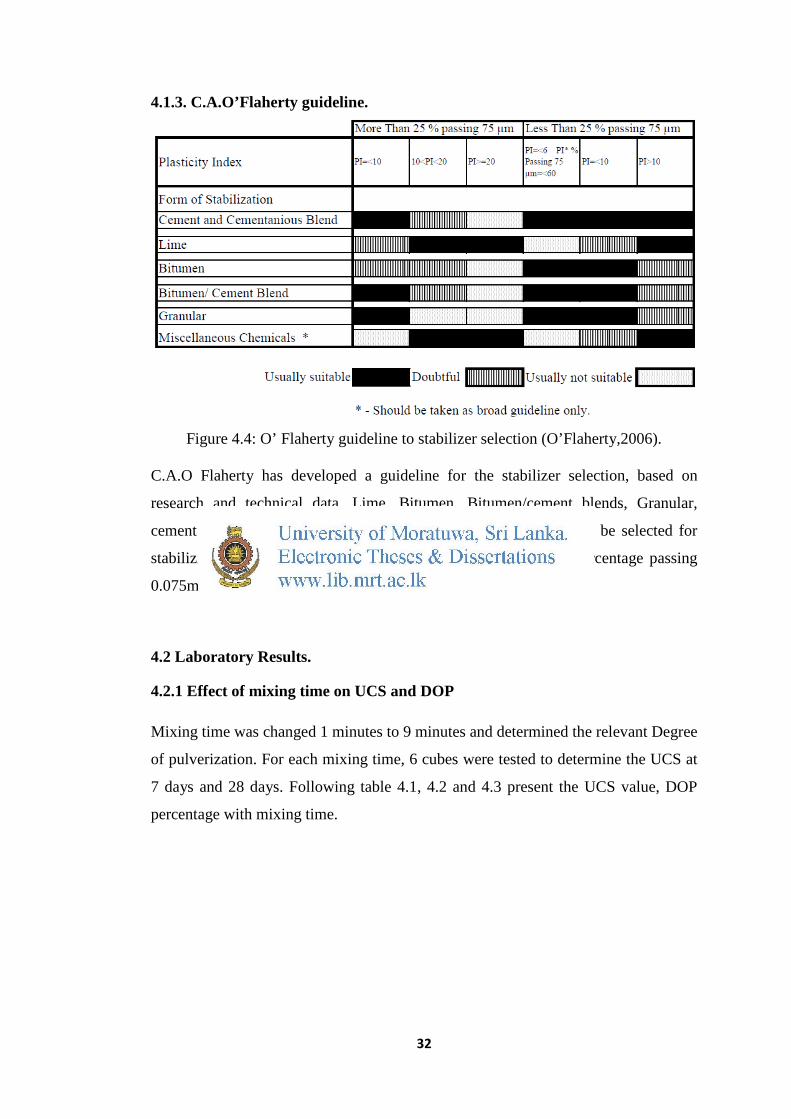
4.1.3. C.A.O’Flaherty guideline.
Figure 4.4: O’ Flaherty guideline to stabilizer selection (O’Flaherty,2006).
C.A.O Flaherty has developed a guideline for the stabilizer selection, based on
research and technical data. Lime, Bitumen, Bitumen/cement blends, Granular,
cement and cementations blend and miscellaneous chemicals could be selected for
stabilizing using Flaherty method. Plasticity Index (PI) and the percentage passing
0.075mm sieve are the basic factors consider in selection.
4.2 Laboratory Results.
4.2.1 Effect of mixing time on UCS and DOP Mixing time was changed 1 minutes to 9 minutes and determined the relevant Degree
of pulverization. For each mixing time, 6 cubes were tested to determine the UCS at
7 days and 28 days. Following table 4.1, 4.2 and 4.3 present the UCS value, DOP
percentage with mixing time.

33
Table 4.1: DOP and UCS with mixing time (Soil no 1 stabilized with lime 6%)
Table 4.2: DOP and UCS with mixing time (Soil no 2 stabilized with lime 7%)
Mixing Time
(Mins)
Degree of Pulverization
(%)
7 Days Unconfined Compressive Strength
( kN/m2)
28 Days Unconfined Compressive Strength
( kN/m2) Cube
1 Cube
2 Cube
3 Cube
1 Cube
2 Cube
3 1 78 897.2 827.6 757.9 1027.9 966.9 932.1
3 79 862.4 897.2 827.6 1080.2 1036.6 1097.6
6 72 845.0 862.4 845.0 1027.9 1036.6 1019.2
9 68 845.0 836.3 845.0 1001.8 984.4 993.1
Table 4.3: DOP and UCS with mixing time (Soil no 3 stabilized with lime 7%)
Mixing Time
(Mins)
Degree of Pulverization
(%)
7 Days Unconfined Compressive Strength
( kN/m2)
28 Days Unconfined Compressive Strength
( kN/m2) Cube
1 Cube
2 Cube
3 Cube
1 Cube
2 Cube
3 1 74 784.0 845.0 818.8 897.2 845.0 853.7 3 85 862.4 871.1 879.8 897.2 906.0 897.2 6 80 845.0 845.0 827.6 862.4 871.1 862.4 9 78 810.1 792.7 792.1 818.8 810.1 801.4
Mixing Time
(Mins)
Degree of Pulverization
(%)
7 Days Unconfined Compressive Strength
( kN/m2)
28 Days Unconfined Compressive Strength
( kN/m2)
Cube 1
Cube 2
Cube 3
Cube 1
Cube 2
Cube 3
1 77 706.5 670.8 688.2 897.2 853.7 862.4
3 82 792.7 766.6 775.3 888.5 906.0 871.1
6 80 731.7 723.0 731.7 810.1 784.0 801.4
9 75 714.3 714.3 731.7 749.2 740.4 740.4
34
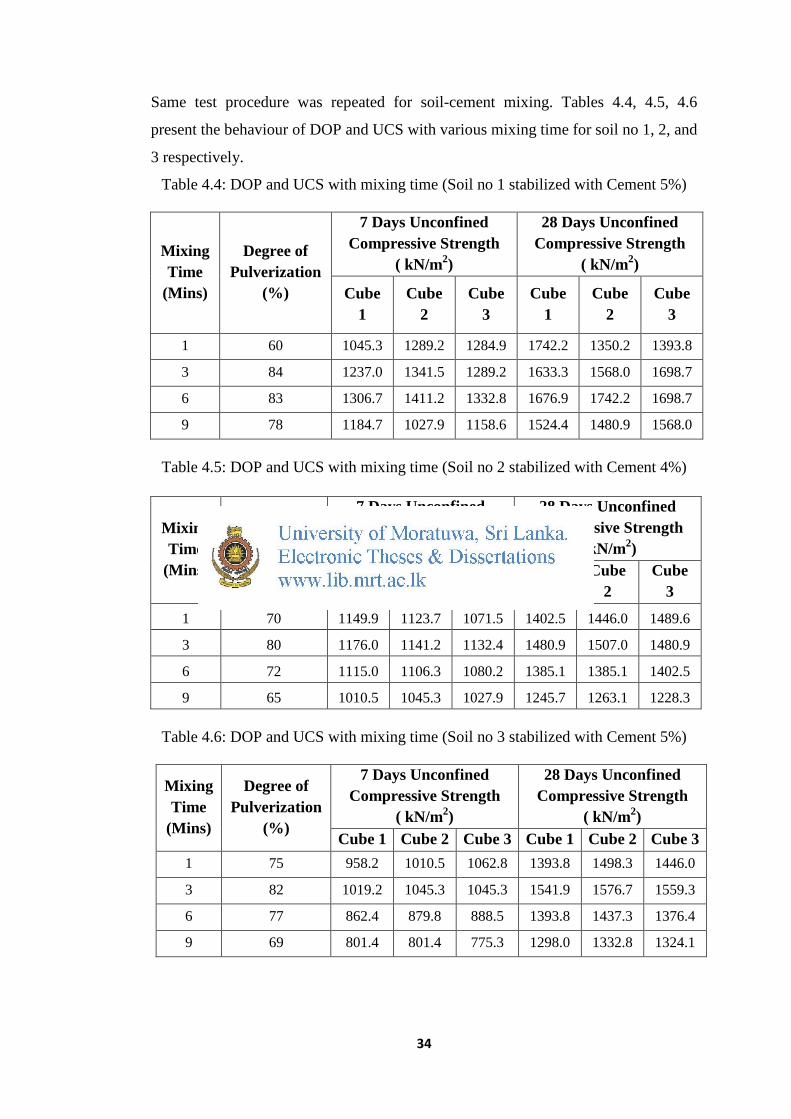
Same test procedure was repeated for soil-cement mixing. Tables 4.4, 4.5, 4.6
present the behaviour of DOP and UCS with various mixing time for soil no 1, 2, and
3 respectively.
Table 4.4: DOP and UCS with mixing time (Soil no 1 stabilized with Cement 5%)
Mixing Time
(Mins)
Degree of Pulverization
(%)
7 Days Unconfined Compressive Strength
( kN/m2)
28 Days Unconfined Compressive Strength
( kN/m2)
Cube 1
Cube 2
Cube 3
Cube 1
Cube 2
Cube 3
1 60 1045.3 1289.2 1284.9 1742.2 1350.2 1393.8
3 84 1237.0 1341.5 1289.2 1633.3 1568.0 1698.7
6 83 1306.7 1411.2 1332.8 1676.9 1742.2 1698.7
9 78 1184.7 1027.9 1158.6 1524.4 1480.9 1568.0
Table 4.5: DOP and UCS with mixing time (Soil no 2 stabilized with Cement 4%)
Table 4.6: DOP and UCS with mixing time (Soil no 3 stabilized with Cement 5%)
Mixing Time
(Mins)
Degree of Pulverization
(%)
7 Days Unconfined Compressive Strength
( kN/m2)
28 Days Unconfined Compressive Strength
( kN/m2) Cube 1 Cube 2 Cube 3 Cube 1 Cube 2 Cube 3
1 75 958.2 1010.5 1062.8 1393.8 1498.3 1446.0
3 82 1019.2 1045.3 1045.3 1541.9 1576.7 1559.3
6 77 862.4 879.8 888.5 1393.8 1437.3 1376.4
9 69 801.4 801.4 775.3 1298.0 1332.8 1324.1
Mixing Time
(Mins)
Degree of Pulverization
(%)
7 Days Unconfined Compressive Strength
( kN/m2)
28 Days Unconfined Compressive Strength
( kN/m2) Cube
1 Cube
2 Cube
3 Cube
1 Cube
2 Cube
3
1 70 1149.9 1123.7 1071.5 1402.5 1446.0 1489.6
3 80 1176.0 1141.2 1132.4 1480.9 1507.0 1480.9
6 72 1115.0 1106.3 1080.2 1385.1 1385.1 1402.5
9 65 1010.5 1045.3 1027.9 1245.7 1263.1 1228.3

35
4.2.2 Effect of Delay compaction and moisture content for the UCS. UCS was measured by delaying the compaction of stabilized mixture. Further,
delayed sample were compacted at OMC and at the prevailing moisture content.
Table 4.7 and 4.8 shows the 7 days and 28 days UCS of lime and cement stabilized
soil compacted at prevailing condition.
Table 4.7: UCS values of delay compacted lime stabilized under OMC
Cube No. Delayed Time 7 Days Strength (kN/m2)
28 Days Strength (kN/m2)
1 Just After Mixing
862.4 1149.9 2 879.8 1115.0 3 879.8 1167.3 1
After 1 Hour 818.8 1071.5
2 801.4 1054.0 3 792.7 1045.3 1
After 2 Hour 740.4 1019.2
2 757.9 993.1 3 731.7 871.1 1
After 4 Hour 679.5 949.5
2 688.2 810.1 3 670.8 801.4 1
After 6 Hour 618.5 731.7
2 601.1 749.2 3 627.2 731.7

36
Table 4.8: UCS values of delay compacted cement stabilized under OMC
Cube No. Delayed Time 7 Days Strength (kN/m2)
28 Days Strength (kN/m2)
1 Just After Mixing
1358.9 1559.3 2 1062.8 1585.4 3 1132.4 1515.7 1
After 1 Hour 1019.2 1341.5
2 993.1 1350.2 3 1010.5 1324.1 1
After 2 Hour 958.2 1271.8
2 932.1 1263.1 3 923.4 1271.8 1
After 4 Hour 975.6 1210.8
2 888.5 1193.4 3 923.4 1176.0 1
After 6 Hour 792.7 1001.8
2 662.0 984.4 3 740.4 949.5
OMC of stabilized soils, which had been air dried due to delayed compaction were
found. Table 4.9 shows the OMC of lime and cement stabilized soil with the delayed
(air dried) for compaction.
Table 4.9: OMC of air dried stabilized soil
Delay Time (Air Dried
Hours)
OMC (%)
Cement Stabilized Lime Stabilized 0 25.5 26 1 24 25.5 2 23 24.5 4 21 23.5 6 20 22
UCSS were obtained at the correspondent OMC for the delayed sample. UCS of
delayed sample of lime and cement are shown in table 4.10 and 4.11 respectively.
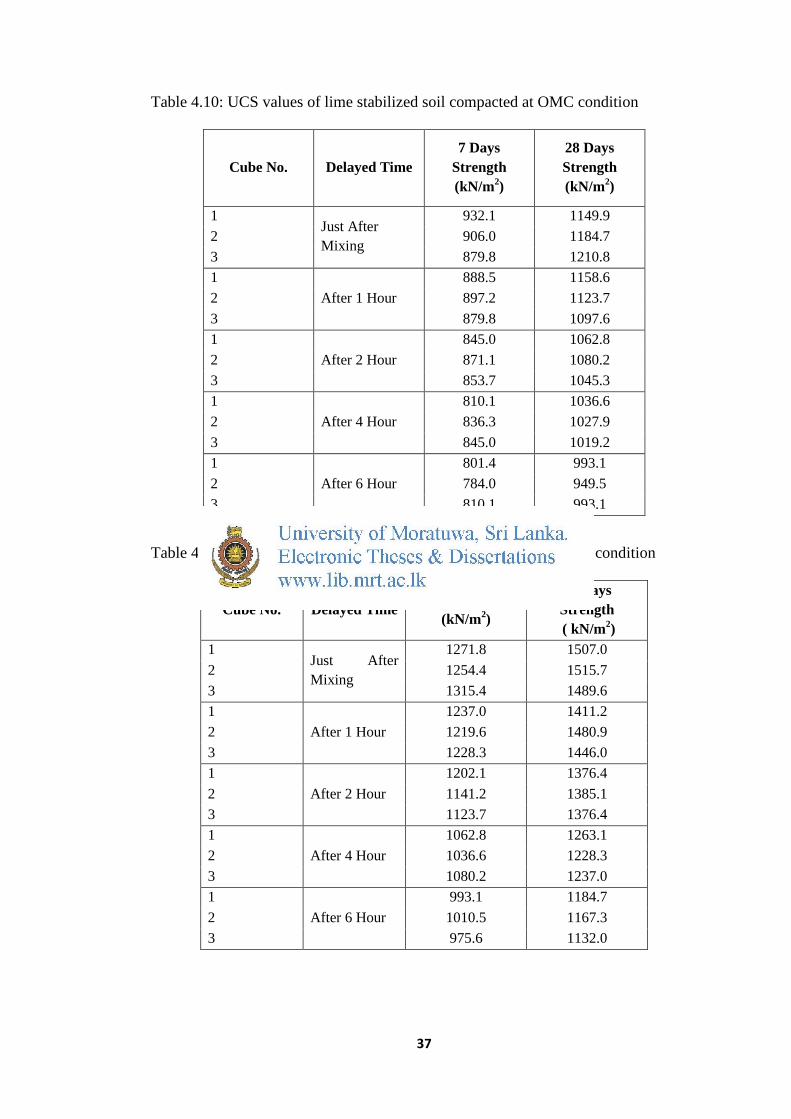
37
Table 4.10: UCS values of lime stabilized soil compacted at OMC condition
Cube No. Delayed Time 7 Days
Strength (kN/m2)
28 Days Strength (kN/m2)
1 Just After Mixing
932.1 1149.9 2 906.0 1184.7 3 879.8 1210.8 1
After 1 Hour 888.5 1158.6
2 897.2 1123.7 3 879.8 1097.6 1
After 2 Hour 845.0 1062.8
2 871.1 1080.2 3 853.7 1045.3 1
After 4 Hour 810.1 1036.6
2 836.3 1027.9 3 845.0 1019.2 1
After 6 Hour 801.4 993.1
2 784.0 949.5 3 810.1 993.1
Table 4.11: UCS values of lime stabilized soil compacted at air dried condition
Cube No. Delayed Time 7 Days Strength
(kN/m2)
28 Days Strength ( kN/m2)
1 Just After Mixing
1271.8 1507.0 2 1254.4 1515.7 3 1315.4 1489.6 1
After 1 Hour 1237.0 1411.2
2 1219.6 1480.9 3 1228.3 1446.0 1
After 2 Hour 1202.1 1376.4
2 1141.2 1385.1 3 1123.7 1376.4 1
After 4 Hour 1062.8 1263.1
2 1036.6 1228.3 3 1080.2 1237.0 1
After 6 Hour 993.1 1184.7
2 1010.5 1167.3 3 975.6 1132.0
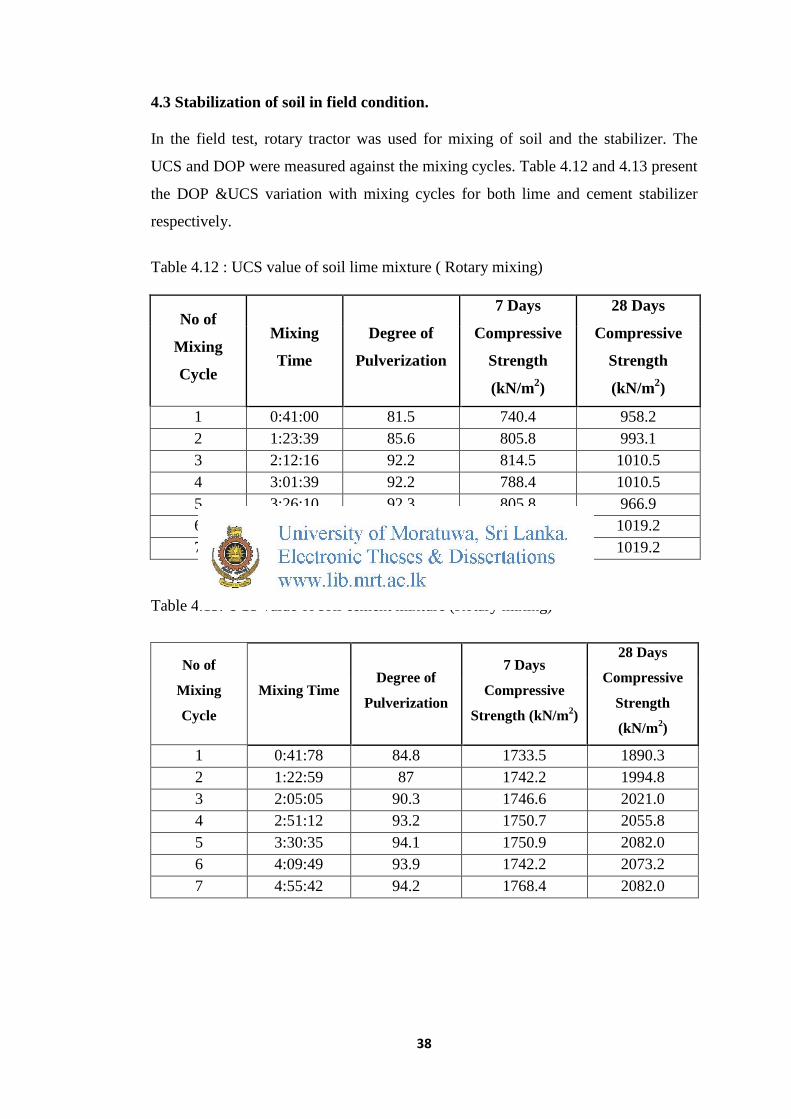
38
4.3 Stabilization of soil in field condition. In the field test, rotary tractor was used for mixing of soil and the stabilizer. The
UCS and DOP were measured against the mixing cycles. Table 4.12 and 4.13 present
the DOP &UCS variation with mixing cycles for both lime and cement stabilizer
respectively.
Table 4.12 : UCS value of soil lime mixture ( Rotary mixing)
No of
Mixing
Cycle
Mixing
Time
Degree of
Pulverization
7 Days
Compressive
Strength
(kN/m2)
28 Days
Compressive
Strength
(kN/m2)
1 0:41:00 81.5 740.4 958.2 2 1:23:39 85.6 805.8 993.1 3 2:12:16 92.2 814.5 1010.5 4 3:01:39 92.2 788.4 1010.5 5 3:26:10 92.3 805.8 966.9 6 4:28:58 92.5 766.6 1019.2 7 5:17:28 92.8 805.8 1019.2
Table 4.13: UCS value of soil cement mixture (Rotary mixing)
No of
Mixing
Cycle
Mixing Time Degree of
Pulverization
7 Days
Compressive
Strength (kN/m2)
28 Days
Compressive
Strength
(kN/m2)
1 0:41:78 84.8 1733.5 1890.3 2 1:22:59 87 1742.2 1994.8 3 2:05:05 90.3 1746.6 2021.0 4 2:51:12 93.2 1750.7 2055.8 5 3:30:35 94.1 1750.9 2082.0 6 4:09:49 93.9 1742.2 2073.2 7 4:55:42 94.2 1768.4 2082.0

39
CHAPTER 05
ANALYSIS OF DATA
5.1 Findings of the Questionnaire Survey 40 numbers of professionals in road construction industry participated for the survey.
Survey results shows that soil has been used as subgrade, subbase and shoulder all
the projects. However, use of soil as a base material as not found in this survey. Soil
has been supplied by either soil supplier or the contractor or the both contractor and
soil suppliers in the projects. Percentage of supply by the soil supplier, contractor and
both supplier and contractor in projects were 60%, 17.5% and 22.5% respectively.
The average storage time of the soil at the site before use is 3 days.
Experience and knowledge of the soil stabilization among the professional were
gathered in the survey. Table 5.1 shows the analyzed results of experience and
knowledge of the professionals involved in road construction projects.
Table 5.1: Categorized surveyed sample based on year of experience and knowledge
Experience and knowledge of soil stabilization
Experience in Road Construction (Years)
0-5 6-10 11-15 16-20 21-25
Professionals with Experienced and good Knowledge of soil stabilization
1 1 4 4 4
Professionals with no Experienced and fair Knowledge of soil stabilization
8 4 2 0 0
Professionals with no Experienced and no Knowledge of soil stabilization
7 4 1 0 0
Sample Size 16 9 7 4 4

40
Survey result shows that soil stabilization has been used by professionals who have
more than 16 years of experience. Most of the professionals with less than 16 years
experience have not used soil stabilization and did not have sufficient knowledge of
soil stabilization. Further survey results show that, only 35% had the soil
stabilization experience and good technical knowledge. 35% had the fair knowledge
without experience. Further 30 % did not have experience or knowledge on soil
stabilization.
72% of survey participants expressed as the extra cost is the main reason for non
popularity of this technology in Sri Lanka.55% of the participants expressed as
quality controlling will be a problem in soil stabilization.
5.2.1 Evaluation Stabilizer Selection Criteria As mentioned in chapter 3 and 4, three stabilizer selection criteria (ORN 31, US
ARMY and O’Flaherty method) were considered. It can be seen that, basic
parameters considered in stabilizer selection are same in all three method such as.
Sieve Analysis and
Plasticity index of the soil
Sieve Analysis
ORN 31 has been divided soil into two categories in soil stabilization (more than or
less than 25 passing the 0075mm sieve). US Army method, soil has been divided in
to sub section based on the, percentage passing the 0.075mm sieve and passing
percentage the 4.75mm and retaining 0.075 sieve (Figure 4.2). O’Flaherty method is
same as ORN 31. When consider these three guide lines, 0.075mm passing is a main
factor which consider as a basic parameter in selecting stabilizer. (Simply, fine
amount of the soil is important factor in stabilizer selecting)
Plasticity Index of soil
Other common factors used in the three guidelines are plasticity index of the soil.
Once soil is selected based on sieve analysis, soil is further subdivided based on
plasticity index. ORN 31 and 0’ Flaherty plasticity limitation are same and US army
provide slightly different categorization based on plasticity index.
41
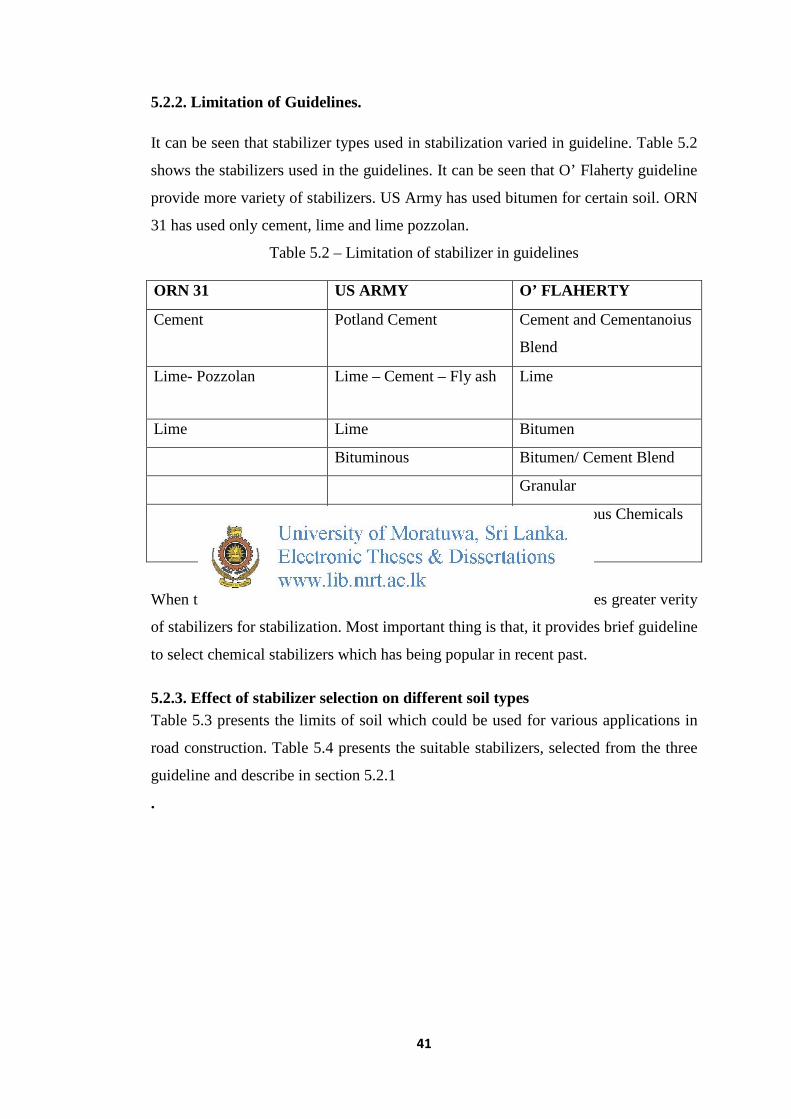
5.2.2. Limitation of Guidelines. It can be seen that stabilizer types used in stabilization varied in guideline. Table 5.2
shows the stabilizers used in the guidelines. It can be seen that O’ Flaherty guideline
provide more variety of stabilizers. US Army has used bitumen for certain soil. ORN
31 has used only cement, lime and lime pozzolan.
Table 5.2 – Limitation of stabilizer in guidelines ORN 31 US ARMY O’ FLAHERTY
Cement Potland Cement Cement and Cementanoius
Blend
Lime- Pozzolan Lime – Cement – Fly ash Lime
Lime Lime Bitumen
Bituminous Bitumen/ Cement Blend
Granular
Miscellaneous Chemicals
When the three guidelines are considered, 0’ Flaherty method provides greater verity
of stabilizers for stabilization. Most important thing is that, it provides brief guideline
to select chemical stabilizers which has being popular in recent past.
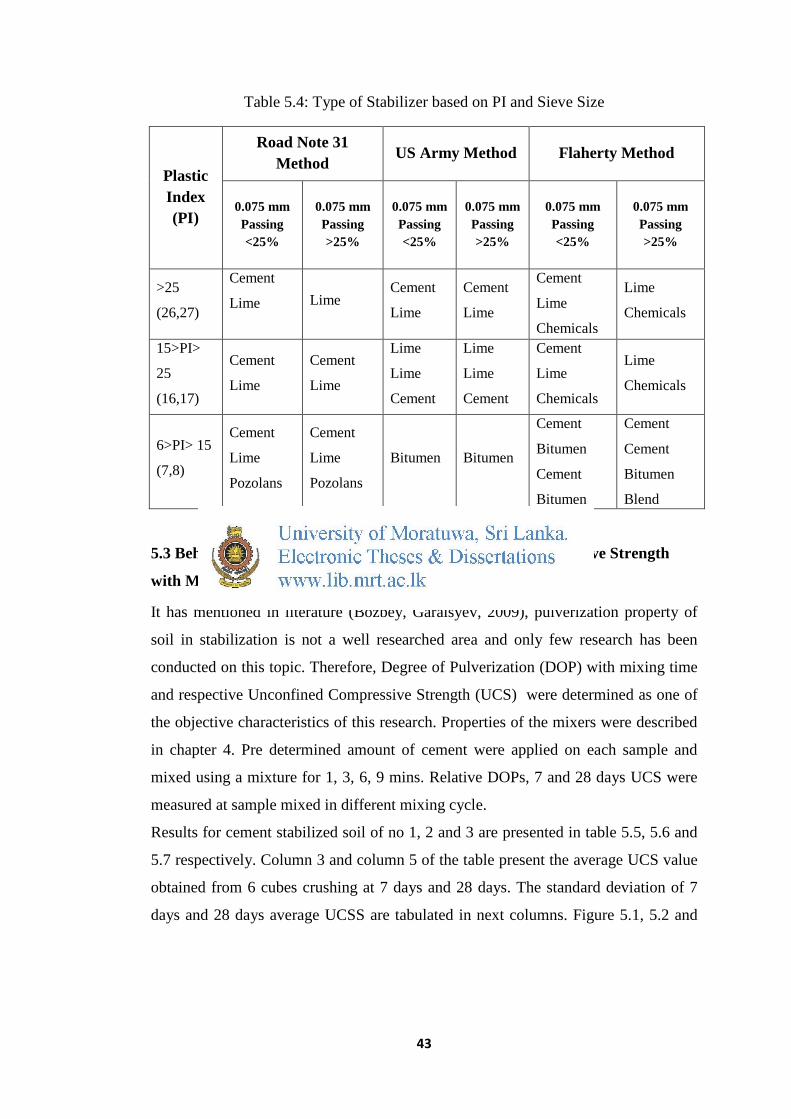
5.2.3. Effect of stabilizer selection on different soil types Table 5.3 presents the limits of soil which could be used for various applications in
road construction. Table 5.4 presents the suitable stabilizers, selected from the three
guideline and describe in section 5.2.1
.

42
Table 5.3: PI limits of soil for road construction
Construction Stage Plastic Index
Shoulders & Gravel Surfacing (Wet Zone) 4-15
Shoulder & Gravel Surfacing (Dry Zone) 6 -25
Embankment Type 1 <25
Embankment Type 2 <25
Subbase (Flexible Pavement) <15
Subbase (Rigid Pavement) < 6
In Road construction as well as Soil stabilization, Plastic Index (PI) is an important
parameter which should be considered in stabilizer selection. Table 5.4 presents the
suitable stabilizer types based on each guideline. For this explanation, soil types were
selected based on the Plastic Index which suitable for different construction stages in
road construction. Table 5.4 shows that lime is the common stabilizer for soil with
high PI (26% & 27%) values. All three stabilizer selection methods show same
behaviour for above soil types. Further according to the all stabilizer selection
method, lime is the common stabilizer for soil category with 15<PI<25 (16% and
17%). However, cement also could be used as a stabilizer at many cases in this
category. But, common stabilizer could not be identified for the soil with PI value
between 6 and 15 ( 7% , 8%). According to the RN 31 and Flaherty method cement
is the common stabilizer for above soil category. Therefore, when consider the three
stabilizer selection criteria RN 31 and Flaherty method indicate similar behaviour in
most cases.
43
Table 5.4: Type of Stabilizer based on PI and Sieve Size
Plastic Index (PI)
Road Note 31 Method US Army Method Flaherty Method
0.075 mm Passing <25%
0.075 mm Passing >25%
0.075 mm Passing <25%
0.075 mm Passing >25%
0.075 mm Passing <25%
0.075 mm Passing >25%
>25
(26,27)
Cement
Lime
Lime Cement
Lime
Cement
Lime
Cement
Lime
Chemicals
Lime
Chemicals
15>PI>
25
(16,17)
Cement
Lime
Cement
Lime
Lime
Lime
Cement
Lime
Lime
Cement
Cement
Lime
Chemicals
Lime
Chemicals
6>PI> 15
(7,8)
Cement
Lime
Pozolans
Cement
Lime
Pozolans
Bitumen Bitumen
Cement
Bitumen
Cement
Bitumen
Cement
Cement
Bitumen
Blend
5.3 Behaviour of Degree of Pulverization, Unconfined Compressive Strength
with Mixing Time
It has mentioned in literature (Bozbey, Garaisyev, 2009), pulverization property of
soil in stabilization is not a well researched area and only few research has been
conducted on this topic. Therefore, Degree of Pulverization (DOP) with mixing time
and respective Unconfined Compressive Strength (UCS) were determined as one of
the objective characteristics of this research. Properties of the mixers were described
in chapter 4. Pre determined amount of cement were applied on each sample and
mixed using a mixture for 1, 3, 6, 9 mins. Relative DOPs, 7 and 28 days UCS were
measured at sample mixed in different mixing cycle.
Results for cement stabilized soil of no 1, 2 and 3 are presented in table 5.5, 5.6 and
5.7 respectively. Column 3 and column 5 of the table present the average UCS value
obtained from 6 cubes crushing at 7 days and 28 days. The standard deviation of 7
days and 28 days average UCSS are tabulated in next columns. Figure 5.1, 5.2 and
44
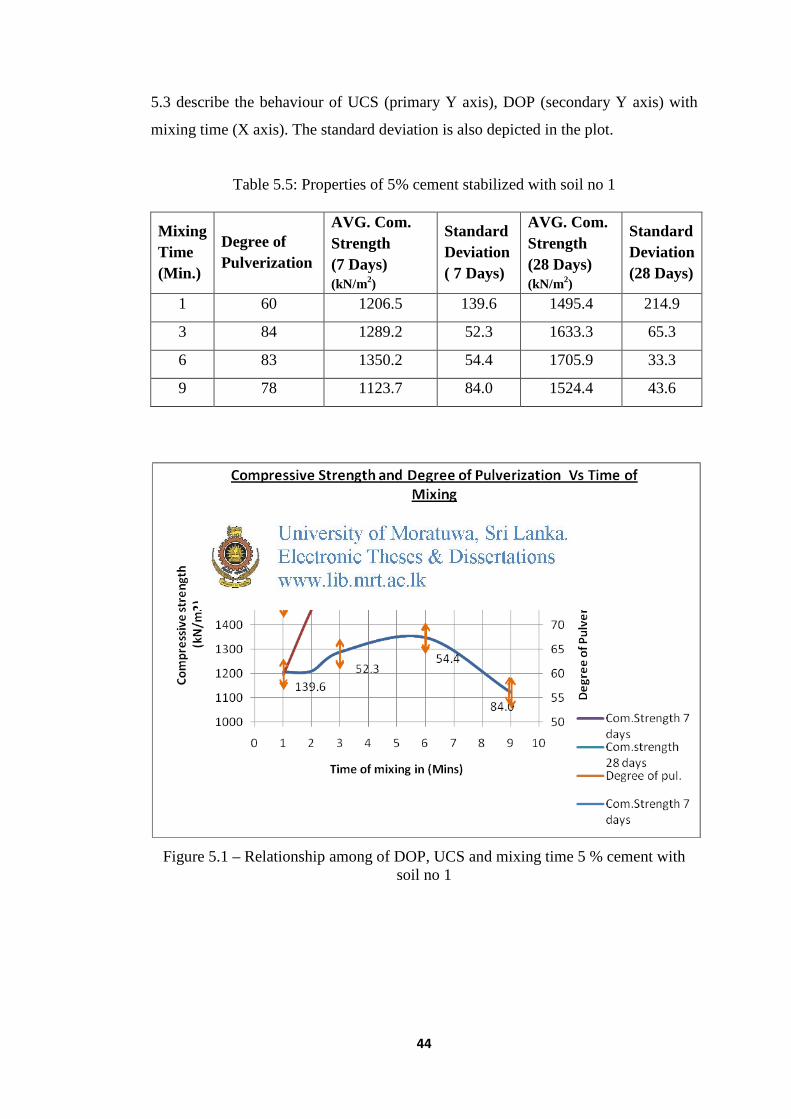
5.3 describe the behaviour of UCS (primary Y axis), DOP (secondary Y axis) with
mixing time (X axis). The standard deviation is also depicted in the plot.
Table 5.5: Properties of 5% cement stabilized with soil no 1
Mixing Time (Min.)
Degree of Pulverization
AVG. Com. Strength (7 Days) (kN/m2)
Standard Deviation ( 7 Days)
AVG. Com. Strength (28 Days) (kN/m2)
Standard Deviation (28 Days)
1 60 1206.5 139.6 1495.4 214.9
3 84 1289.2 52.3 1633.3 65.3
6 83 1350.2 54.4 1705.9 33.3
9 78 1123.7 84.0 1524.4 43.6
Figure 5.1 – Relationship among of DOP, UCS and mixing time 5 % cement with
soil no 1

45
Table 5.6: Properties of 4% cement stabilized with soil no 2
Mixing Time (Min.)
Degree of Pulverization
AVG. Com.
Strength (7 Days) (kN/m2)
Standard Deviation ( 7 Days)
AVG. Com.
Strength (28 Days)
(kN/m2)
Standard Deviation (28 Days)
1 70 1115.0 39.9 1446.04 43.56 3 80 1149.9 23.0 1489.60 15.09 6 72 1100.5 18.1 1390.87 10.06 9 65 1027.9 17.4 1245.69 17.42
Figure 5.2– Relationship among of DOP, UCS and mixing time 4 % cement with soil no 2

46
Table 5.7: Properties of 5% cement stabilized with soil no 3
Mixing Time (Min.)
Degree of Pulverization
AVG. Com.
Strength (7 Days) (kN/m2)
Standard Deviation ( 7 Days)
AVG. Com.
Strength (28 Days) (kN/m2)
Standard Deviation (28 Days)
1 75 1010.5 52.3 1446.04 52.3 3 82 1036.6 15.1 1559.29 17.4 6 77 876.9 13.3 1402.49 31.4 9 69 792.7 15.1 1318.28 18.1
Figure 5.3 – Relationship among of DOP, UCS and mixing time 5 % cement with
soil no 3
Figure 5.1-5.3, show that maximum DOP and UCS is achieved at the 3 minutes of
mixing time (Except Soil no 1). Up to 3 minutes, DOP and UCS are increased
gradually and at the further mixing tend to decrease both properties. Standard
Deviation of UCS was at high at 1 minute mixing and the standard deviation reduces
as the mixing time increase. Same tests were conducted for the soil lime mixing. Pre
determined amount of lime mixed with same soil samples, DOP and UCS with

47
mixing time were measured. Obtained results are tabulated in Table 5.8, 5.9 and 5.10
for soil no 1, 2 and 3 respectively. . Figure 5.4, 5.5 and 5.6 describe the behaviour of
UCS (primary Y axis), DOP (secondary Y axis) with mixing time (X axis).
Table 5.8: Properties of 6% Lime stabilized with soil no 1
Mixing Time (Min.)
Degree of Pulverization
AVG. Com. Strength (7 Days) (kN/m2)
Standard Deviation ( 7 Days)
AVG. Com. Strength (28 Days) (kN/m2)
Standard Deviation (28 Days)
1 74 815.94 30.6 865.30 28.0 3 85 871.11 8.7 900.15 5.0 6 80 839.17 10.1 865.30 5.0 9 78 798.52 10.1 810.13 8.7
Figure 5.4 – Relationship among of DOP, UCS and mixing time 6 % lime with soil no 1

48
Table 5.9: Properties of 7% Lime stabilized with soil no 2
Mixing Time
Degree of Pulverization
AVG. Com. Strength (7 Days) (kN/m2)
Standard Deviation ( 7 Days)
AVG. Com. Strength (28 Days) (kN/m2)
Standard Deviation (28 Days)
1 78 827.56 69.69 975.64 48.5 3 79 862.40 34.84 1071.47 31.4 6 72 850.79 10.05 1027.91 8.7 9 68 842.07 5.03 993.07 8.7
Figure 5.5- Relationship among of DOP, UCS and mixing time 7 % lime with soil no 2

49
Table 5.10: Properties of 7% Lime stabilized with soil no 3
Mixing Time
Degree of Pulverization
AVG. Com. Strength (7 Days) (kN/m2)
Standard Deviation ( 7 Days)
AVG. Com. Strength (28 Days) (kN/m2)
Standard Deviation (28 Days)
1 77 688.47 17.9 871.11 23.0 3 82 778.19 13.3 888.53 17.4 6 80 728.83 5.0 798.52 13.3 9 75 720.12 10.0 743.35 5.0
Figure 5.6 – Relationship among of DOP, UCS and mixing time 7% lime with
soil no 3
Soil lime mixing, DOP and UCS increased with the mixing time up to 3 minutes and
after achieving the maximum values decreased gradually ( Same behaviour as soil
cement mixing). Standard deviation of the UCS is highest at 1 minute mixing and
decrees at the mixing time increase. Figure 5.7(a), 5.7(b), 5.7(c) and 5.7(d) showed
the formation of soil balls at the each mixing time.
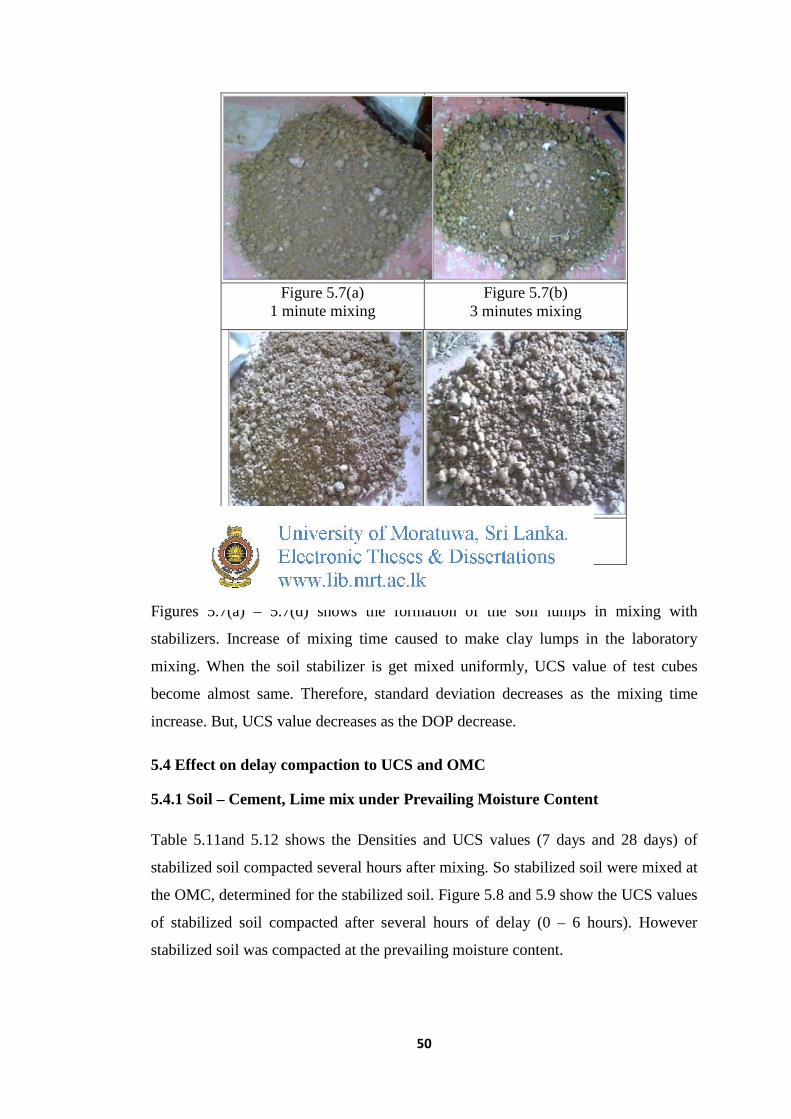
50
Figure 5.7(a) 1 minute mixing
Figure 5.7(b) 3 minutes mixing
Figure 5.7(c) 6 minutes mixing
Figure 5.7(d) 9 minutes mixing
Figure 5.7: Formation of soil lump with mixing time
Figures 5.7(a) – 5.7(d) shows the formation of the soil lumps in mixing with
stabilizers. Increase of mixing time caused to make clay lumps in the laboratory
mixing. When the soil stabilizer is get mixed uniformly, UCS value of test cubes
become almost same. Therefore, standard deviation decreases as the mixing time
increase. But, UCS value decreases as the DOP decrease.
5.4 Effect on delay compaction to UCS and OMC
5.4.1 Soil – Cement, Lime mix under Prevailing Moisture Content Table 5.11and 5.12 shows the Densities and UCS values (7 days and 28 days) of
stabilized soil compacted several hours after mixing. So stabilized soil were mixed at
the OMC, determined for the stabilized soil. Figure 5.8 and 5.9 show the UCS values
of stabilized soil compacted after several hours of delay (0 – 6 hours). However
stabilized soil was compacted at the prevailing moisture content.
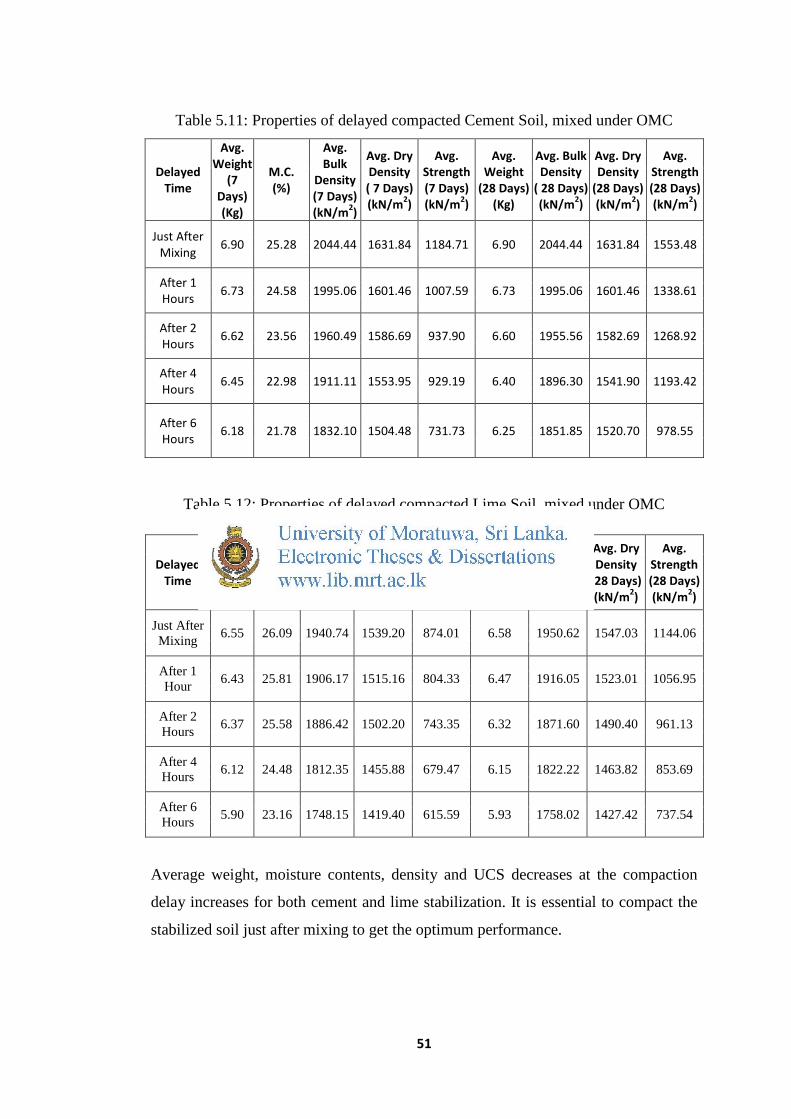
51
Table 5.11: Properties of delayed compacted Cement Soil, mixed under OMC
Table 5.12: Properties of delayed compacted Lime Soil, mixed under OMC
Average weight, moisture contents, density and UCS decreases at the compaction
delay increases for both cement and lime stabilization. It is essential to compact the
stabilized soil just after mixing to get the optimum performance.
Delayed Time
Avg. Weight
(7 Days) (Kg)
M.C. (%)
Avg. Bulk
Density (7 Days) (kN/m2)
Avg. Dry Density ( 7 Days) (kN/m2)
Avg. Strength (7 Days) (kN/m2)
Avg. Weight
(28 Days) (Kg)
Avg. Bulk Density
( 28 Days) (kN/m2)
Avg. Dry Density
(28 Days) (kN/m2)
Avg. Strength (28 Days) (kN/m2)
Just After Mixing 6.90 25.28 2044.44 1631.84 1184.71 6.90 2044.44 1631.84 1553.48
After 1 Hours 6.73 24.58 1995.06 1601.46 1007.59 6.73 1995.06 1601.46 1338.61
After 2 Hours 6.62 23.56 1960.49 1586.69 937.90 6.60 1955.56 1582.69 1268.92
After 4 Hours 6.45 22.98 1911.11 1553.95 929.19 6.40 1896.30 1541.90 1193.42
After 6 Hours 6.18 21.78 1832.10 1504.48 731.73 6.25 1851.85 1520.70 978.55
Delayed Time
Avg.Weight (7 Days) (Kg)
M.C (%)
Avg. Bulk Density (7 Days) (kN/m2)
Avg. Dry Density ( 7 Days) (kN/m2)
Avg. Strength (7 Days) (kN/m2)
Avg. Weight
(28 Days) (Kg)
Avg. Bulk Density ( 28 Days) (kN/m2)
Avg. Dry Density
(28 Days) (kN/m2)
Avg. Strength (28 Days) (kN/m2)
Just After Mixing 6.55 26.09 1940.74 1539.20 874.01 6.58 1950.62 1547.03 1144.06
After 1 Hour 6.43 25.81 1906.17 1515.16 804.33 6.47 1916.05 1523.01 1056.95
After 2 Hours 6.37 25.58 1886.42 1502.20 743.35 6.32 1871.60 1490.40 961.13
After 4 Hours 6.12 24.48 1812.35 1455.88 679.47 6.15 1822.22 1463.82 853.69
After 6 Hours 5.90 23.16 1748.15 1419.40 615.59 5.93 1758.02 1427.42 737.54

52
5.4.2 Soil – Cement, Lime mix under delayed OMC condition Table 5.13, 5.14 present the Densities, UCSS ( 7 days and 28 days) of delayed
compacted soil cement and lime mixed under air dried condition and added water at
the compaction time to get the relevant OMC.
Table 5.13: Properties of delayed compacted Cement Soil, mixed under air dried
condition
It can be seen that strength has increased compared with soil which has been
compacted at the OMC of original stabilized soil (Just after mixing). OMC of the air
dried soil is relatively lower than the OMC of the original stabilized soil. So, delayed
stabilized soil strength can be slightly increased by compacted at the OMC of the air
dried soil.
Delayed Time
Average Weight (7 Days)
(Kg)
M.C. (%)
Avg. Bulk
Density (7 Days) (kN/m2)
Avg. Dry Density
( 7 Days) (kN/m2)
Avg. Stre.
(7 Days) (kN/m2)
Avg. Weight
(28 Days) (Kg)
Avg. Bulk
Density ( 28
Days) (kN/m2)
Avg. Dry Density
(28 Days)
(kN/m2)
Avg. Strength
(28 Days)
(kN/m2)
Just After Mixing 6.73 25.22 1995.06 1593.30 1280.53 6.73 1995.06 1593.30 1504.12
After 1 Hour 6.62 24.30 1960.49 1577.28 1228.27 6.62 1960.49 1577.28 1446.04
After 2 Hours 6.52 23.11 1930.86 1568.39 1155.67 6.53 1935.80 1572.41 1379.26
After 4 Hours 6.42 20.91 1901.23 1572.40 1059.85 6.48 1920.99 1588.74 1367.64
After 6 Hours 6.37 20.15 1886.42 1570.05 993.07 6.42 1901.23 1582.38 1347.32

53
Table 5.14: Properties of delayed compacted Lime Soil, mixed under air dried condition
Delayed Time
Average
Weight (7
Days)
M.C. (%)
Avg. Bulk
Density (7 Days) (kN/m2)
Avg. Dry Density ( 7 Days) (kN/m2)
Avg. Strength (7 Days) (kN/m2)
Avg. Weight
(28 Days) (Kg)
Avg. Bulk
Density (28 Days) (kN/m2)
Avg. Dry Density
(28 Days) (kN/m2)
Avg. Strength (28 Days) (kN/m2)
Just After Mixing 6.73 25.84 1995.06 1585.44 932.09 6.67 1975.31 1569.74 1181.81
After 1 Hour 6.63 25.68 1965.43 1563.79 888.53 6.63 1965.43 1563.79 1126.64
After 2 Hour 6.58 24.51 1950.62 1566.66 844.98 6.55 1940.74 1558.73 1062.76
After 4 Hour 6.47 23.49 1916.05 1551.56 810.13 6.53 1935.80 1567.55 1027.91
After 6 Hour 6.40 22.16 1896.30 1605.13 801.42 6.43 1906.17 1560.42 978.55
Density of the air dried soil has been reduced with the delayed compaction. So the
laboratory compaction in a delayed time tends to change the gradation of the soil. In
addition, stabilizers have reacted with available water and air in the stabilized soil.
Figure 5.8 – 5.9 and table 5.15 – 5.16 shows the relationship of UCS and deduction
of UCS with compaction delay of both cement and lime stabilized soil.

54
Figure 5.8: Relationship of UCS of Soil Cement mix with compaction delay
Table 5.15: Deduction percentages of UCSS (Soil – Cement Mixing)
Delay Time
Deduction of UCS (Compacted under prevailing M.C.)
Deduction of UCS ( Compacted under
relevant OMC) 7 Days 28 Days 7 Days 28 Days
0
1 14.95% 13.83% 4.08% 3.86%
2 20.83% 18.32% 9.75% 8.30%
4 21.57% 23.18% 17.23% 17.37%
6 38.24% 37.01% 22.45% 22.78%

55
Figure 5.9: Relationship of UCS of Soil Lime mix with compaction delay
Table5.16: Deduction percentages of UCSS (Soil – Lime Mixing)
Table 5.15 and 5.16 shown the deduction of UCSS value with the compaction delay.
It can be shown that deduction percentage is high at the mixing of stabilized at OMC
condition. 6 hour deduction is around 1/3 from the 0 hour UCS in both cement and
lime stabilizing. At the air dried mixing it is around 1/5 in soil cement mixing and
Delay Time
Deduction of UCS (Compacted under prevailing
M.C.)
Deduction of UCS ( Compacted under relevant
OMC) 7 Days 28 Days 7 Days 28 Days
0
1 7.97% 7.61% 1.92% 4.67%
2 14.95% 15.99% 6.73% 10.07%
4 22.26% 25.38% 10.58% 13.02%
6 29.57% 35.54% 11.54% 17.20%
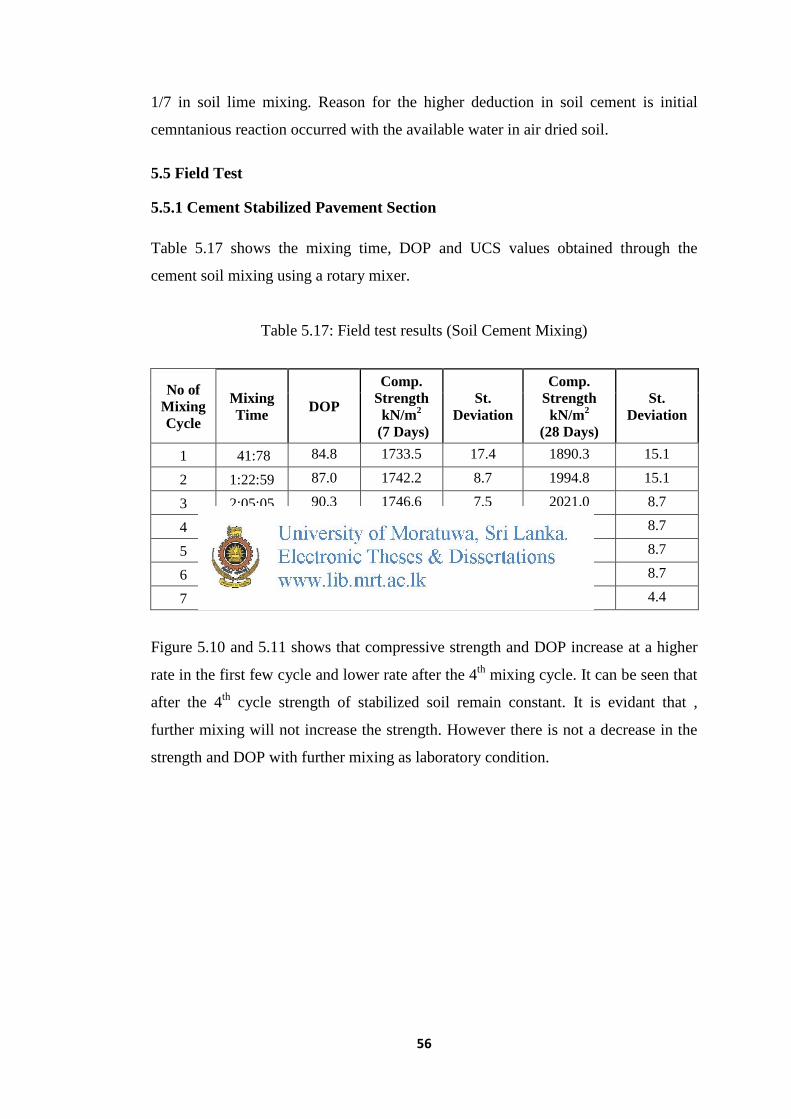
56
1/7 in soil lime mixing. Reason for the higher deduction in soil cement is initial
cemntanious reaction occurred with the available water in air dried soil.
5.5 Field Test
5.5.1 Cement Stabilized Pavement Section Table 5.17 shows the mixing time, DOP and UCS values obtained through the
cement soil mixing using a rotary mixer.
Table 5.17: Field test results (Soil Cement Mixing)
Figure 5.10 and 5.11 shows that compressive strength and DOP increase at a higher
rate in the first few cycle and lower rate after the 4th mixing cycle. It can be seen that
after the 4th cycle strength of stabilized soil remain constant. It is evidant that ,
further mixing will not increase the strength. However there is not a decrease in the
strength and DOP with further mixing as laboratory condition.
No of Mixing Cycle
Mixing Time DOP
Comp. Strength
kN/m2 (7 Days)
St. Deviation
Comp. Strength
kN/m2 (28 Days)
St. Deviation
1 41:78 84.8 1733.5 17.4 1890.3 15.1
2 1:22:59 87.0 1742.2 8.7 1994.8 15.1
3 2:05:05 90.3 1746.6 7.5 2021.0 8.7
4 2:51:12 93.2 1750.7 8.7 2055.8 8.7
5 3:30:35 94.1 1750.9 5.0 2082.0 8.7
6 4:09:49 93.9 1742.2 8.7 2073.2 8.7
7 4:55:42 94.2 1768.4 8.7 2082.0 4.4

57
Figure 5.10 Behaviour of UCS with No. Mixing Cycles
Figure 5.11: Behaviour of DOP with No. Mixing Cycles
5.5.2. Lime Stabilized Pavement Section Following table 5.18 shows the results obtained for DOP, UCSS with mixing time in
soil lime mixing using a rotary mixture.
Table 5.18: Field test results (Soil Lime Mixing)
No of Mixing Cycle
Mixing Time DOP
Comp. Strength
kN/m2 (7 Days)
St. Deviation
Comp. Strength
kN/m2 (28 Days)
St. Deviation
1 41:00 81.5 740.4 15.1 958.2 17.4 2 1:23:39 85.6 805.8 13.1 993.1 8.7 3 2:12:16 92.2 814.5 15.7 1013.4 11.0 4 3:01:39 92.2 801.4 17.4 1010.5 8.7 5 3:26:10 92.3 805.8 11.5 966.9 53.0 6 4:28:58 92.5 766.6 61.0 1019.2 8.7 7 5:17:28 92.8 805.8 11.5 1019.2 4.4
Figure no 5. 12 and 5.13 could be obtained using above test results.Figure 5.12 and
5.13 show the UCSS and DOP are incresed with no of mixing cycles. At the initial
stage increasing rate is high and after certain point (3 mixing cycle) increasing rate is
vary low.

58
Field test results shows, that DOP increase at the mixing period or mixing cycles
increase with the rotary mixer. Similar behaviour has been observed for UCS. Both
UCS and DOP increases at a high rate initially and slower rate at the later stage.
5.6 Comparison between Laboratory results and Field Results Following table 5.14, 5.15 shown the comparison of DOP between laboratory and
field test for the cement stabilized soil and lime stabilized soil respectively.
5.14 DOP with mixing time of Cement stabilized soil
5.15 DOP with mixing time of Lime Stabilized Soil
Figure 5.12- Behaviour of UCS with No. Mixing Cycles
Figure 5.13- Behaviour of DOP with No. Mixing Cycles
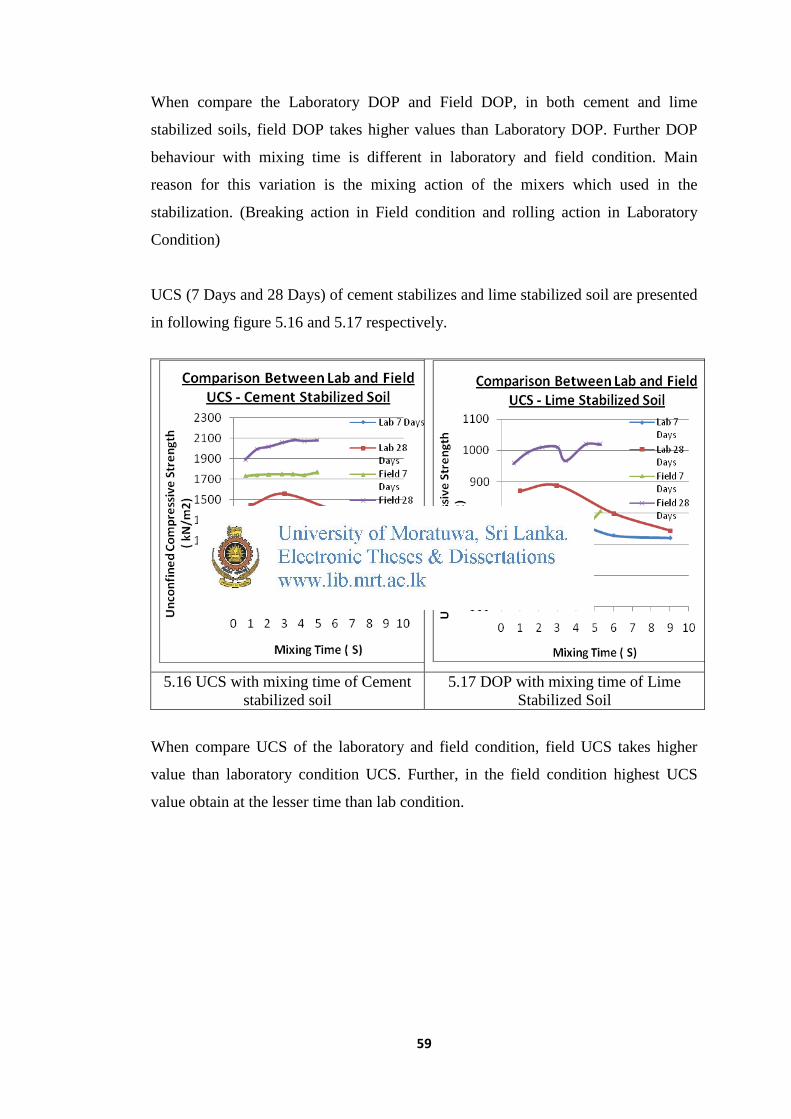
59
When compare the Laboratory DOP and Field DOP, in both cement and lime
stabilized soils, field DOP takes higher values than Laboratory DOP. Further DOP
behaviour with mixing time is different in laboratory and field condition. Main
reason for this variation is the mixing action of the mixers which used in the
stabilization. (Breaking action in Field condition and rolling action in Laboratory
Condition)
UCS (7 Days and 28 Days) of cement stabilizes and lime stabilized soil are presented
in following figure 5.16 and 5.17 respectively.
5.16 UCS with mixing time of Cement
stabilized soil 5.17 DOP with mixing time of Lime
Stabilized Soil
When compare UCS of the laboratory and field condition, field UCS takes higher
value than laboratory condition UCS. Further, in the field condition highest UCS
value obtain at the lesser time than lab condition.
60
CHAPTER 06
ECONOMICAL ANALYSIS
6.1 General Cost is a main factor which affect to the popularity of a technology. That means the
quality and cost of the final product should be within the acceptable limits. Therefore
when introduce a new technology, it is important to do a cost analysis. This chapter
mainly focus on comparison of the cost between soil stabilization and good quality
soil for subbase and embankment construction. It was found from our survey soil
borrow pits are usually located in 15- 20 km distance from the job site in most of
project. So I considered the travelling distance of 20 km for cost analysis. And
available substituted soil to be improved located in 5 km distance for the analysis.
Further, rates used for the analysis are taken from the Highway Schedule Rates
(HSR) 2009.
6.2 Cost Analysis
6.2.1 Estimation of cost for transportation and laying good quality soil. Cost for 1m3 of material
Approve soil (Type 1 & 11) excavation using machineries
Cost for bases & Shoulder Construction including loading and stock piling
= Rs. 230.45
1 m3 Subbase material (Loos Volume) = Rs.186.00
1 m3 Subbase material (Compacted Volume) = 1.42 * 186.00
= Rs. 264.12
Transport Cost
Soil transport and the stock pile in the site (20 km) = Rs.18.50*20
= Rs.370.00
Spreading and compacting 1 m3 at site

61
Approved soil spread and rolled using machinery (Compacted) = Rs152.90 * 1.42
= Rs. 217.12
Total Cost for 1 cu.m of subbase material compaction in site
=Rs.1081.69
6.3 Cost analysis for lime and cement stabilization with soil within 5km distance.
Lime Stabilization Volume of pavement subjected to stabilization in field tests = 3*1*0.15
=0.45 m3
Required lime weight (7% by dry weight of lime) = 45.36 kg
Cost for lime = 45.36*12
= Rs. 544.32
Cost for lime spreading (15 minutes spent for lime spreading)
= 491.07/8/60*15
= Rs.15.35
Hourly rate of rotary mixer = Rs. 625.00
Optimum mixing cycles no: 3 and mixing time =2:12:16
Cost for mixing =Rs.625/60*2:12:16
=Rs.22.92
Total cost for stabilization process (0.45 m3) = Rs.582.59
Cost for stabilize 1.0 m3 soil = Rs 582.59 /0.45
= Rs. 1294.64
Cost for stabilized 1.o m3 soil (Compacted) = Rs.1.42 * 1294.64
= Rs.1838.39

62
Cement Stabilization Volume of pavement subjected to stabilization = 3*1*0.15
= 0.45 m3
Required cement weight (5% by dry weight of Cement) = 32.4 kg
Cost for cement = 32.4*14.80
= Rs. 479.52
Cost for cement spreading (15 minutes spent for cement spreading
= 491.07/8/60*15
= Rs.15.35
Hourly rate of rotary mixer = Rs. 625.00
Optimum mixing cycles no: 4 and mixing =2:51:12
Cost for mixing =Rs.625/60*2:51:12
= Rs. 29.79
Total cost for stabilization process (0.45 m3) =Rs. 524.66
Cost for stabilize 1.0 m3 soil = Rs. 524.66/0.45
= Rs.1165.91
Cost for stabilized 1.o m3 soil (Compacted) = Rs.1.42 * 1165.91
= Rs.1655.59
Addition
Approve soil (Type 1 & 11) excavation using machineries
= Rs. 230.45
For bases & Shoulder Construction including loading and pilling
1 cu.m Embankment material (Loose) = Rs.163.75
1 cu.m Embankment material (Compacted) =163.75*1.42
=Rs. 232.52
Transport cost 5km (19.55*5) =Rs. 97.75

63
Approved soil spread and rolled using machinery (Compacted)
= Rs152.90 * 1.42
= Rs. 217.12
Cost for lime stabilization process = Rs.1838.39
Cost for cement stabilization process = Rs. 1655.59
Cost for complete subbase using lime stabilized soil 1m3
= Rs. 2612.95
Cost for complete subbase using Cement stabilized soil 1m
= Rs. 2434.38
Following table 6.1 and 6.2 present the total cost of the cement and lime stabilized
soil (per 1 cu.m) for different stabilizer percentage. Further, final rows describe the
increase of total cost for 1 cu.m stabilized soil compare with the natural subbase soil.
It shows, when increase the stabilizer amount, increasing percentage of cost takes
higher values and not economical further.
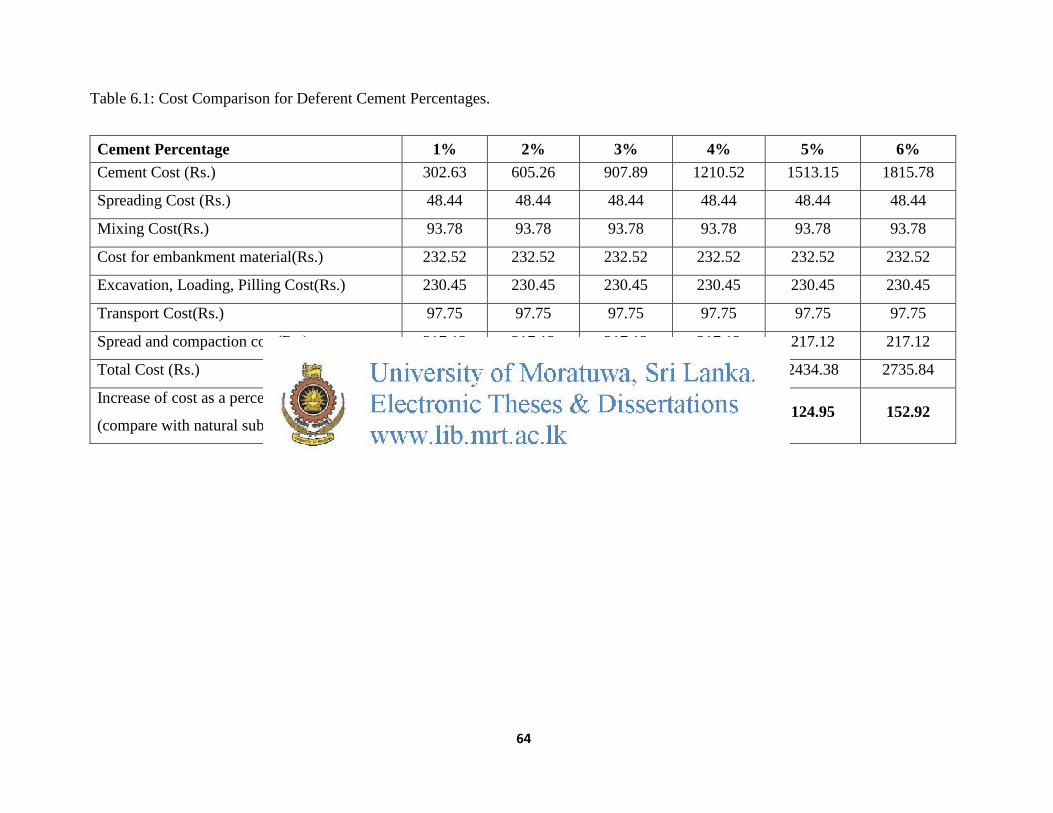
64
Table 6.1: Cost Comparison for Deferent Cement Percentages.
Cement Percentage 1% 2% 3% 4% 5% 6% Cement Cost (Rs.) 302.63 605.26 907.89 1210.52 1513.15 1815.78
Spreading Cost (Rs.) 48.44 48.44 48.44 48.44 48.44 48.44
Mixing Cost(Rs.) 93.78 93.78 93.78 93.78 93.78 93.78
Cost for embankment material(Rs.) 232.52 232.52 232.52 232.52 232.52 232.52
Excavation, Loading, Pilling Cost(Rs.) 230.45 230.45 230.45 230.45 230.45 230.45
Transport Cost(Rs.) 97.75 97.75 97.75 97.75 97.75 97.75
Spread and compaction cost(Rs.) 217.12 217.12 217.12 217.12 217.12 217.12
Total Cost (Rs.) 1222.69 1525.32 1827.95 2130.58 2434.38 2735.84
Increase of cost as a percentage
(compare with natural subbase) 13.04 41.01 68.99 96.97 124.95 152.92
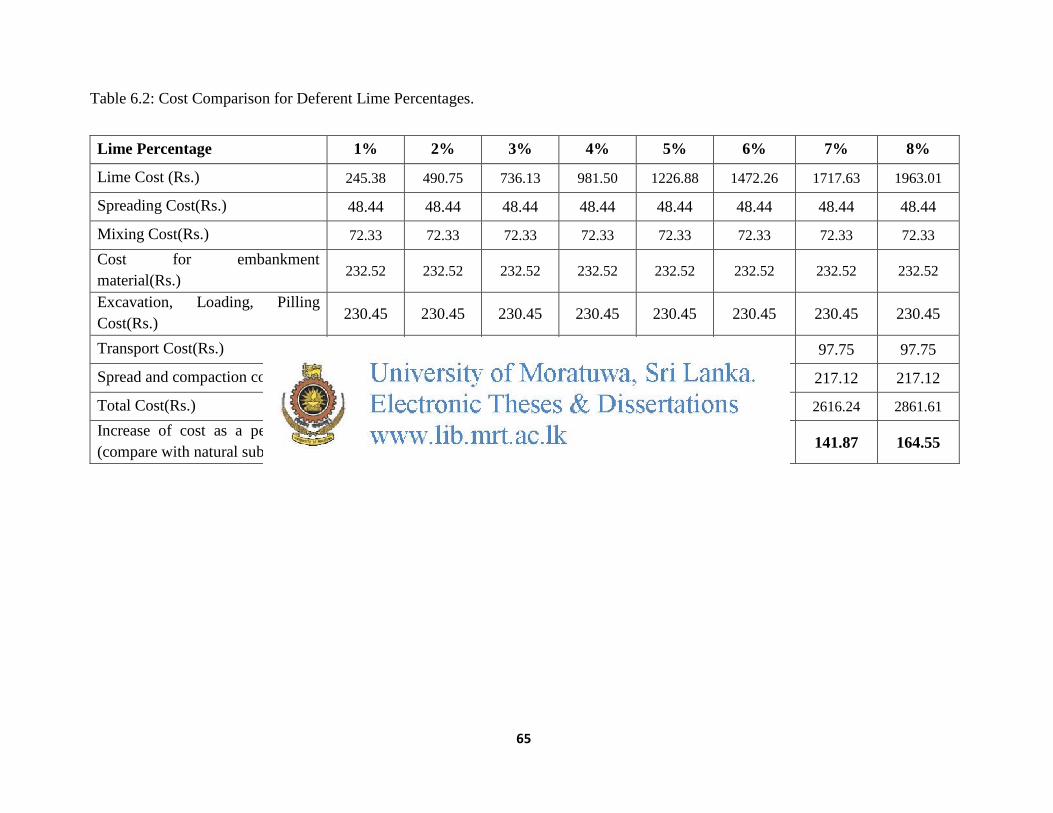
65
Table 6.2: Cost Comparison for Deferent Lime Percentages.
Lime Percentage 1% 2% 3% 4% 5% 6% 7% 8%
Lime Cost (Rs.) 245.38 490.75 736.13 981.50 1226.88 1472.26 1717.63 1963.01
Spreading Cost(Rs.) 48.44 48.44 48.44 48.44 48.44 48.44 48.44 48.44
Mixing Cost(Rs.) 72.33 72.33 72.33 72.33 72.33 72.33 72.33 72.33
Cost for embankment material(Rs.) 232.52 232.52 232.52 232.52 232.52 232.52 232.52 232.52
Excavation, Loading, Pilling Cost(Rs.) 230.45 230.45 230.45 230.45 230.45 230.45 230.45 230.45
Transport Cost(Rs.) 97.75 97.75 97.75 97.75 97.75 97.75 97.75 97.75
Spread and compaction cost(Rs.) 217.12 217.12 217.12 217.12 217.12 217.12 217.12 217.12
Total Cost(Rs.) 1143.98 1389.36 1838.39 1880.11 2125.49 2370.86 2616.24 2861.61
Increase of cost as a percentage (compare with natural subbase) 5.76 28.44 51.13 73.81 96.50 119.18 141.87 164.55

66
CHAPTER 07
CONCLUSION AND RECOMENDATIONS
7.1 Conclusion
This study was conducted with the objective to develop quality control measures in soil
stabilization and review the stabilizer selection criteria. Improving the quality and popularity of soil
stabilization in local road construction industry were main concern in this study. Several reasons for
non popularity were found in the survey. Questionnaire Survey results shows that
(1) Lack of knowledge and experience in industrial profession,
(2) 55% expressed that non awareness of quality control methods for soil stabilization, and
(3) 72% expressed that Extra Cost as the main reason for non popularity of soil stabilization in
the industry.
This study was based on laboratory and field experiments. Soil parameters and mixing parameters
were investigated under laboratory condition. For the laboratory mixing, Belle mini mix 150
concrete mixer was used with 24 rpm. According to the original properties of the selected soil are
A-2-7 (AASHTO classification). Mixing behaviour of the concrete mixture is not a blending and it
is simply rolling with the stabilizer. In stabilizer selection criteria, Three (3) methods are analyzed
(In chapter three (3) discussed)Sieve sizes and plasticity index of the soil were basic factors to be
considered in stabilizer selection C.A. O’ Flaherty guide lines provides simply and expanded
variety of stabilizer. Selected 3 soil types for the experiment, were suitable for cement and lime
stabilization as per the three guidelines. Relevant percentages of stabilizer were determined using
PH test and trial and error method for lime and cement respectively. Behaviour of Degree of
pulverization and unconfined compressive strength were determined with the various mixing time.
All soil types showed a similar behaviour on DOP and UCS with mixing time. The maximum UCS
was obtained at the maximum DOP values (Except soil type 1 mixing with cement) and DOP is
increased with the mixing time and decreased with further mixing. Maximum UCS and DOP were
achieved at 3 minutes mixing time for both lime and cement stabilizing. (UCS also has the same
pattern with mixing time).
Effect of delay compaction was studied under two scenarios.
Stabilizer mixing under optimum moisture content and air dried condition

67
Mixing was conducted until achieve the optimum mixing time and used same mixer as above
mentioned.
Compaction time was delayed from zero (0) to six (6) hours. Seven (7) days and Twenty Eight (28)
days UCS were measured. There was a considerable deduction of the UCS of both lime and
cement. (17% and 22% respectively)
Eight number of test pavements were constructed (soil-lime 4 pavements and soil cement 4
pavements). Tractor rotary (2 feet width 18 blades and 90 rpm) was used for the stabilizing. Mixing
time was varying for each pavement and checked the DOP and UCS with mixing time. It found that
up to certain point DOP and UCS is increased with mixing time and after further mixing, both
factors increase in minor rates. Highest UCS values are 2082 kN/m2 and 1019.2 kN/m2 for cement
stabilized and lime stabilized pavement respectively ( Highest DOP for cement stabilized and lime
stabilized soil are 94.2 % and 92.8% respectively).
In the cost analysis, 2009 Highway schedule rates were used for the analysis. It shows that soil
stabilization is economical when the stabilizer percentage is lower. Even in the stabilizer
percentages are low, cost is higher than natural subbase transporting. But the time is a very crucial
factor in any type of project. Therefore, when consider the delaying time to overall process of
borrowing subbase from far away; soil stabilization will be a good alternative.
7.2 Future Study Due to time constraints of this study certain aspects have not been covered adequately. The
following could be recommended for future work.
In this research, it is not possible to determine the Engineering Properties and performance of the
stabilized soil pavements under long term traffic load. It is very important to determine the
behaviour of stabilized pavement under traffic and should be constructed a road section using
stabilized soil to measure the long term performance under local condition.
Further, it is recommended to popular this technology among the professionals in the road
construction industry through workshops and training programmes.

68
7.3 Recommendation
Soil stabilization should be well promoted among the professionals in local road construction
industry as a solution for the problem of scarcity of soil with good quality. The Promotion should
be done through improving their knowledge and loyalty on stabilization technology.
Degree of Pulverization (DOP) is a severe factor in soil stabilization. It directly affects to the
Unconfined Compressive Strength (UCS) of stabilized material.
Mixing time is not directly affects to the UCS of stabilized material. But, it should be extended until
obtain the optimum DOP.
After getting the optimum DOP, DOP variation with the mixing time is lower.
Mixing method of the mixers is important in stabilization. Here, breaking method is more
appropriate rather than rolling method. Therefore, rotary mixers are suitable for the soil - stabilizer
mixing.
For the higher UCS values, compaction should be done soon as mixing completed. Therefore, site
mixing is appropriate rather than central plant mixing.
The moisture content of the soil should be maintained lower at the mixing time and when
compacting, it should be relevant optimum moisture content.
69
REFERENCE
Mallawarachchi, D.P, Silva, G.H.W, Improvements to Buttala Sellakatharagama Road by construction of gravel base, prime coat and sand seal, 8th conference of the Road Engineering of Australia and Asia, Taipei,Taiwan, 17 -21 April,1995. Mallawarachchi, D.P, Soil Stabilization in Road Works, A paper presented at the Sri Lankan geotechnical society seminar on Ground Improvement Techniques. Colombo, Sri Lanka,February 1992. Mallawarachchi, D.P, Fernando, M.B.S, Sumanaratne, I.H.D, Silva, G.H.W, September 1997, Improvements to Bangadeniya Anamaduwa Road, A paper published in the proceedings of 13th meeting of the international road federation, Toronto, Ontario, Canada, 2005. Overseas Development Administration, 1993, Overseas Road Note 31, 1993, A guide to the structural design of bitumen surfaced roads in tropical and sub tropical countries, Overseas centre, Transport Research Laboratory, Crowthorne, Berkshire, United Kingdom. Emilijan, L, Mladen, B, 1990, Soil stabilization by means of LENDUR EH urea formaldehyde resin, Rudarsko-geoloSko-naftniz bornik,Volume 2, P.P 137- 143. Priyankara, N.H, Wijesooriya, M.S.D, 2008, Utilization of quarry dust in geotechnical applications, Paper presented at 64th Scientific Sessions Glance Programe, Colombo Sri Lanka, 03 – 06 December 2008. Nagith,M, Mohammad, M.Y, 1995, Optimization of cement lime chemical additives to stabilize Jordanian soil, pp 167 – 174, Material Science, Journal of Islamic Academy of Science,Jordan. Alhasan, M, 2008 Potentials of Rice Husk Ash for Soil Stabilization, Assumption University Journal of Technology William F.B, John M, 2005, Practical approach to criteria for the use of lime fly ash stabilization in base courses, Soil Mechanics, pp 20 -27, ISSN: 0361-1981, Transport Research Board, New York, USA.

70
Dallas, N.L, Eric, H.M, Jan, R.P, Barry, S,2000, Cementitious Stabilization, Transportation in the New Millennium, Transport Research Board, New York, USA. Bozbey I, Garaisayev S, 2009, Effects of soil pulverization quality on lime stabilization of an expansive clay, Environmental Earth Science, vol. 02, pp. 1137-1151, Springer, Heidelberg, Allemagne. Department of the army, the navy and the air force, 1994, Manual of Soil stabilization for pavements, USA. Nagith, M, Mohammad, M.Y, 1995, Optimization of Cement Lime Chemical Additives to Stabilized Jordan Soil, Journal of Islamic Academy of Sciences 8:4, 167-174, Amman, Jordan. Road Development Authority, 1989, Standard Specification for Construction and Maintenance of Roads and Bridges. Sri Lanka. American Association of State Highway and Transportation Official (ASSHTO) 1993 Guide for design of pavement structures, American Association of state Highway and Transportation officials. Washington,D.C. Kolawole J. O. Charles M. O .N, 2006, Compaction Delay Effects on Properties of Lime-Treated Soil, American Society of Civil Engineers, Vol. 18, No. 2, , pp. 250-258 O’Connell M.J, Cook J.R, 2008, Stabilisation Techniques to Improve Local Materials for Rural Road Pavements in Cambodia, SEACAP 19. O’Flaherty C.A.,2006, soil stabilization pavements, Highways, pp 161-184, New Delhi National Lime Association, 2004, Lime Treated Soil Construction Manual; Lime Stabilization & Lime Modification, USA. Petry TM, Little DN (2002) Review of stabilization of clays and expansive soils in pavements and lightly loaded structures History, practice and future. ASCE J Mater Eng 14(6):447–460 Petry TM, Wohlegemuth SK (1988) Effects of pulverization on the strength and durability of highly active clay soils stabilized with lime and Portland cement, Transportation Research Board 1190, 0-309-04758-7, pp 38–45

71
Fernando,M.J,(December,2005),Soil Stabilization Osinubi KJ, 1999, Evaluation of admixture stabilization of Nigeria black cotton soil, Nigeria Soc, Engin, Tech, Trans. 34(3): pp 88- 96. Ola SA, 1975, Stabilization of Nigeria lateritic soil with cement, bitumen and lime. Proc. 6th Reg. Conf. Africa on Soil Mechanics and Foundation Engineering, Durban, South Africa. Oyetola EB, Abdullahi M, 2006, The use of rice husk ash in low cost sandcrete block production, Leonardo Electronic J, Pract. Tech. ( Romania)8 , pp 58 -70

72
APPENDIX A
SURVEY FORM

73
74
75
APPENDIX B
ORIGINAL PROPERTIES OF SOIL

76
Calculation for Liquid Limit and Plastic Index
Soil no : 1
Soil Condition : Natural
No. of Drops Weight of wet Soil + Can
Weight of Dry Soil +
Weight of empty can
M.C ( %)
41 55.09 47.83 30.53 41.97 36 54.21 47.37 31.32 42.62 28 60.11 51.25 31.12 44.01 23 58.7 50.01 31.48 46.90
Moisture content at the 25 drops = LL of soil
LL of soil =45
Weight of wet Soil + Can
Weight of Dry Soil + Can
Weight of empty can
M.C ( %)
43.93 41.08 31.35 29.29 44.12 41.35 31.75 28.85
Plastic Limit of Soil = 29
PI of soil =16

77
Calculation for Liquid Limit and Plastic Index
Soil no : 2
Soil Condition : Natural
No. of Drops Weight of wet Soil + Can
Weight of Dry Soil + Can
Weight of empty can
M.C ( %)
38 52.01 44.7 31.35 54.76 30 61.99 50.78 30.6 55.55 23 48.69 42.33 31.32 57.77 15 68.39 53.83 31.56 65.38
Moisture content at the 25 drops = LL of soil
LL of soil =58
Weight of wet Soil + Can
Weight of Dry Soil + Can
Weight of empty can M.C ( %)
29.68 26.23 17.8 40.93 42.69 39.18 30.64 41.10
Plastic Limit of Soil = 41
PI of soil =17
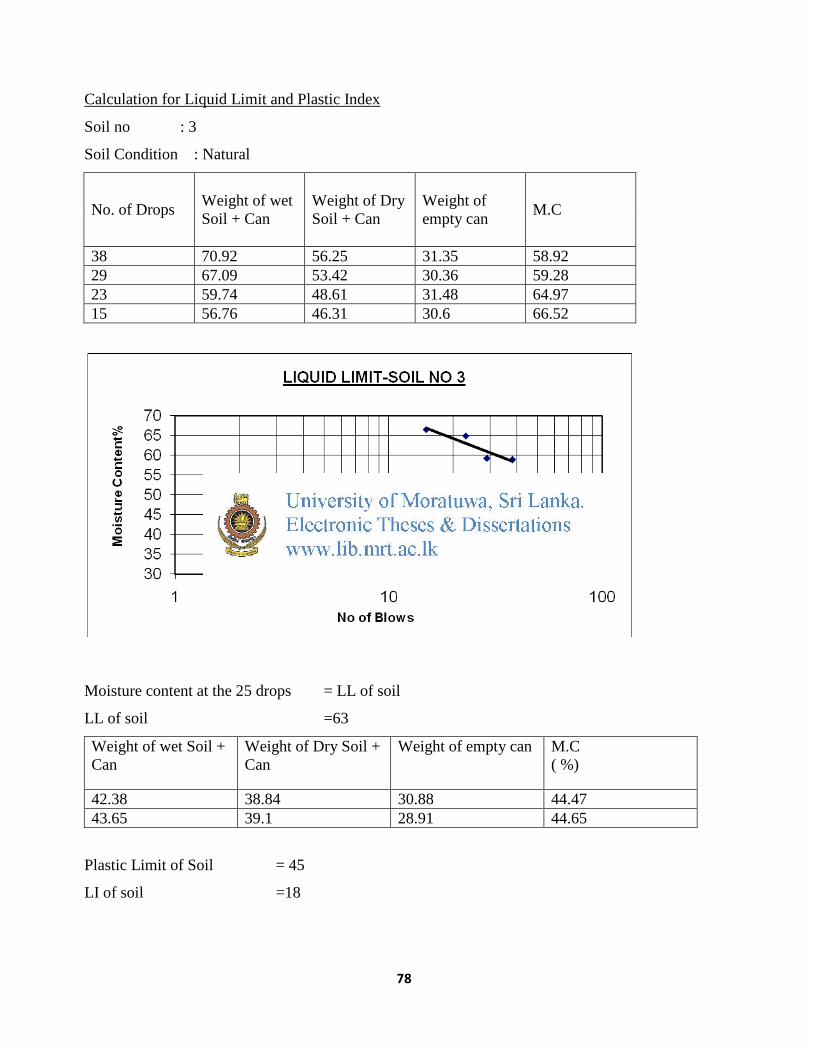
78
Calculation for Liquid Limit and Plastic Index
Soil no : 3
Soil Condition : Natural
No. of Drops Weight of wet Soil + Can
Weight of Dry Soil + Can
Weight of empty can M.C
38 70.92 56.25 31.35 58.92 29 67.09 53.42 30.36 59.28 23 59.74 48.61 31.48 64.97 15 56.76 46.31 30.6 66.52
Moisture content at the 25 drops = LL of soil
LL of soil =63
Weight of wet Soil + Can
Weight of Dry Soil + Can
Weight of empty can M.C ( %)
42.38 38.84 30.88 44.47 43.65 39.1 28.91 44.65
Plastic Limit of Soil = 45
LI of soil =18

79
Calculation for OMC and MDD
Soil no : 1
Soil Condition : Natural
Can weight (g)
Can + Wet Soil (g)
Can+ Dry Soil (g)
Moisture Content
(%) 30.4 131.22 123.1 8.76 30.48 159.2 144.98 12.42 30.1 108.39 97.55 16.07 30.6 107.57 93.72 21.94 30.53 112.25 95.23 26.31
Sample m1 Kg ( mould + Base plate)
m2 Kg ( m1+ soil) Ah
wet=(m2-m1)/Ah*1000 m.c%
dry=s wet/(100+w)
1 4.084 5.788 0.000944 1805.08 8.76 1659.70
2 4.084 5.92 0.000944 1944.92 12.42 1730.06
3 4.084 6.127 0.000944 2164.19 16.07 1864.54
4 4.084 6.007 0.000944 2037.08 21.94 1670.52
5 4.084 5.92 0.000944 1944.92 26.31 1539.84
Optimum Moisture Content – 16% Maximum Dry Density – 1838 Kg/m3

80
Calculation for OMC and MDD
Soil no : 2
Soil Condition : Natural
Can weight (g) Can + Wet Soil (g)
Can+ Dry Soil (g)
Moisture Content (%)
31.38 132.02 121.99 11.07 30.53 131.05 118.91 13.74 31.32 116.54 104.95 15.74 31.42 132.56 117.56 17.41 31.56 102.56 91.16 19.13
Sample
m1 Kg ( mould + Base plate)
m2 Kg ( m1+ soil) Ah
wet=(m2-m1)/Ah*1000 m.c%
dry=s wet/(100+w)
1 1.9 3.72 0.000944 1927.97 11.07 1735.82
2 1.9 3.804 0.000944 2016.95 13.74 1773.36
3 1.9 3.872 0.000944 2088.98 15.74 1804.88
4 1.9 3.859 0.000944 2075.21 17.41 1767.44
5 1.9 3.863 0.000944 2079.45 19.13 1745.57
Optimum Moisture Content – 16% Maximum Dry Density – 1805 Kg/m3

81
Calculation for OMC and MDD
Soil no : 3
Soil Condition : Natural
Can weight (g)
Can + Wet Soil (g)
Can+ Dry Soil (g)
Moisture Content (%)
30.24 124.76 116.45 9.64 30.62 128.45 116.47 13.95 31.16 138.45 122.94 16.90 31.74 132.67 117.05 18.31 31.17 128.4 110.52 22.53
Sample
m1 Kg ( mould)
m2 Kg ( m1+ soil) Ah
wet=(m2-m1)/Ah*1000 m.c%
dry=s wet/(100+w)
1 1.8994 3.537 0.000944 1734.75 9.64 1582.23 2 1.8994 3.884 0.000944 2102.33 13.95 1844.88 3 1.8994 3.987 0.000944 2211.44 16.90 1891.75 4 1.8994 3.956 0.000944 2178.60 18.31 1841.44 5 1.8994 3.792 0.000944 2004.87 22.53 1636.19
Optimum Moisture Content – 16.5% Maximum Dry Density – 1880 Kg/m3

82
California Bearing Ratio Test ( CBR) Soil Type : No 01 Original
Condition : Soaked Penetration(mm) Reading. Load (kN) Stress(KN/mm2) Stress(KN/m2)
0 0 0 0 0
0.64 12 0.265 0.0001375 137.4816
1.27 23 0.551 0.0002859 285.858
1.91 35 0.863 0.0004477 447.7231
2.54 50 1.253 0.0006501 650.0545
3.18 64 1.617 0.0008389 838.8971
3.81 76 1.929 0.0010008 1000.762
4.45 88 2.241 0.0011626 1162.627
5.08 100 2.553 0.0013245 1324.493
7.62 138 3.541 0.0018371 1837.065
10.16 173 4.451 0.0023092 2309.172
12.7 210 5.413 0.0028083 2808.256
Dia. Of penetration rod 49.53mm
Area of the rod 1927.531mm2
CBR – 12
83
APPENDIX C
PROPERTIES OF STABILIZED
SOIL

84
Calculation for OMC and MDD
Soil no : 1
Soil Condition : Stabilized With 6% Lime
Can weight (g)
Can + Wet Soil (g)
Can+ Dry Soil (g)
Moisture Content (%)
31.35 114.89 100.73 20.41 31.48 124.16 106.93 22.84 31.12 108.3 92.96 24.81 31.56 121.57 102.98 26.03 31.33 116.76 97.98 28.18
Sample m1 Kg ( mould)
m2 Kg ( m1+ soil) Ah
σwet =(m2-m1)/Ah*1000 m.c%
σdry=s wet/(100+w)
1 4.084 5.933 0.000944 1958.69 20.41 1626.69 2 4.084 6.045 0.000944 2077.33 22.84 1691.14 3 4.084 6.189 0.000944 2229.87 24.81 1786.67 4 4.084 6.102 0.000944 2137.71 26.03 1696.20 5 4.084 5.944 0.000944 1970.34 28.18 1537.20
Optimum Moisture Content – 24.5%
Maximum Dry Density – 1790 Kg/m3
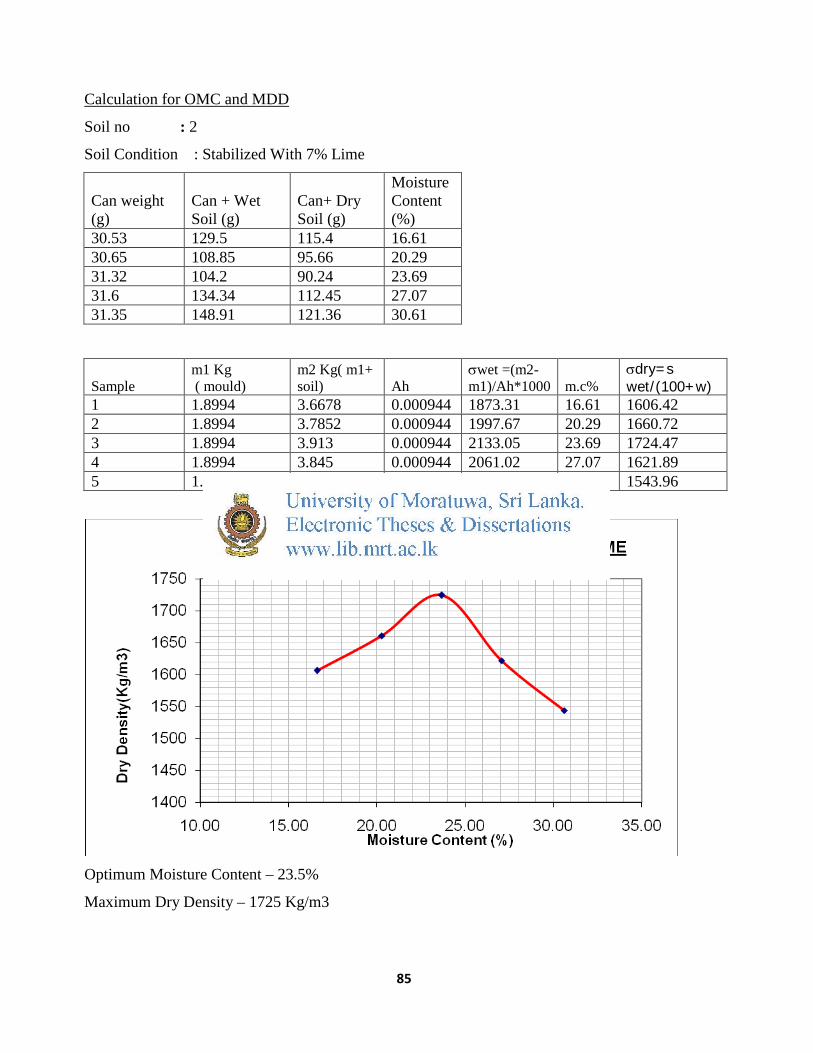
85
Calculation for OMC and MDD
Soil no : 2
Soil Condition : Stabilized With 7% Lime
Can weight (g)
Can + Wet Soil (g)
Can+ Dry Soil (g)
Moisture Content (%)
30.53 129.5 115.4 16.61 30.65 108.85 95.66 20.29 31.32 104.2 90.24 23.69 31.6 134.34 112.45 27.07 31.35 148.91 121.36 30.61
Sample
m1 Kg ( mould)
m2 Kg( m1+ soil) Ah
σwet =(m2-m1)/Ah*1000 m.c%
σdry=s wet/(100+w)
1 1.8994 3.6678 0.000944 1873.31 16.61 1606.42 2 1.8994 3.7852 0.000944 1997.67 20.29 1660.72 3 1.8994 3.913 0.000944 2133.05 23.69 1724.47 4 1.8994 3.845 0.000944 2061.02 27.07 1621.89 5 1.8994 3.803 0.000944 2016.53 30.61 1543.96
Optimum Moisture Content – 23.5%
Maximum Dry Density – 1725 Kg/m3

86
Calculation for OMC and MDD
Soil no : 3
Soil Condition : Stabilized With 7% Lime
Can weight (g)
Can + Wet Soil (g)
Can+ Dry Soil (g)
Moisture Content (%)
31.3 140.73 125.67 15.96 30.62 139.67 122.47 18.73 30.52 129.52 111.94 21.59 30.6 141.02 119.05 24.84 30.6 115.25 97.52 26.49
Sample m1 Kg ( mould)
m2 Kg( m1+ soil) Ah
σwet =(m2-m1)/Ah*1000 m.c%
σdry=s wet/(100+w)
1 1.8994 3.567 0.000944 1766.53 15.96 1523.41 2 1.8994 3.678 0.000944 1884.11 18.73 1586.94 3 1.8994 3.855 0.000944 2071.61 21.59 1703.74 4 1.8994 3.987 0.000944 2211.44 24.84 1771.44 5 1.8994 3.775 0.000944 1986.86 26.49 1570.71
Optimum Moisture Content – 24.5%
Maximum Dry Density – 1775 Kg/m3
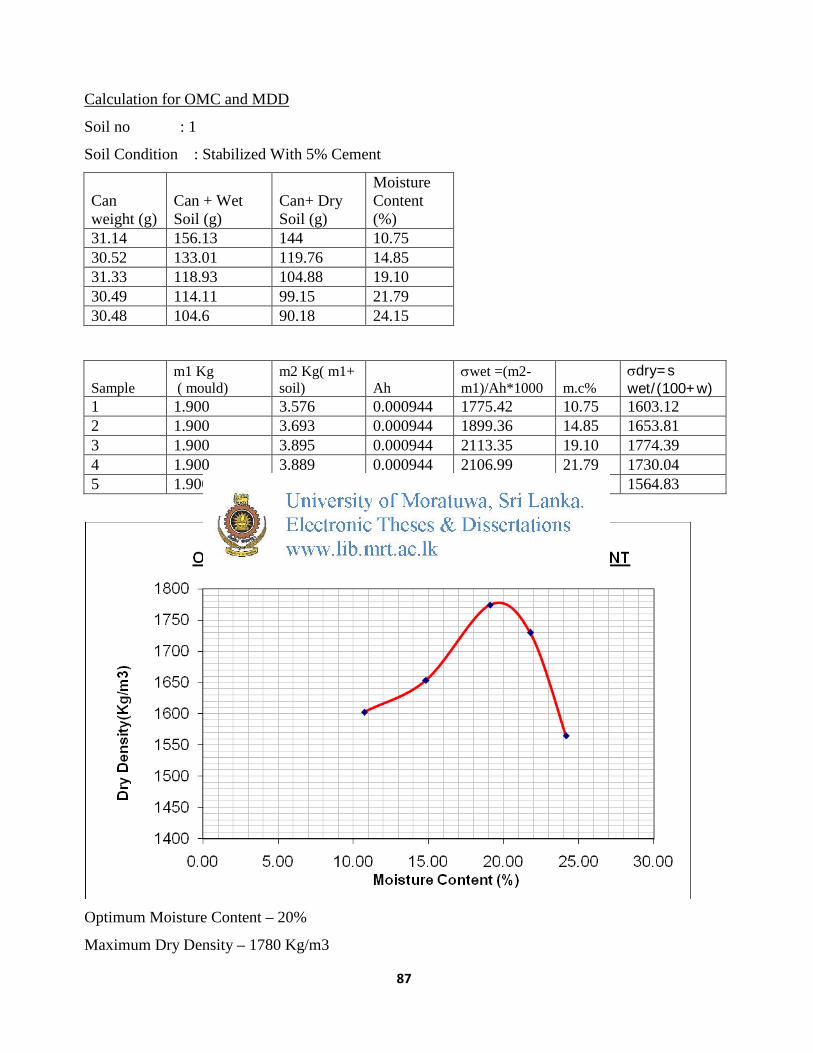
87
Calculation for OMC and MDD
Soil no : 1
Soil Condition : Stabilized With 5% Cement
Can weight (g)
Can + Wet Soil (g)
Can+ Dry Soil (g)
Moisture Content (%)
31.14 156.13 144 10.75 30.52 133.01 119.76 14.85 31.33 118.93 104.88 19.10 30.49 114.11 99.15 21.79 30.48 104.6 90.18 24.15
Sample
m1 Kg ( mould)
m2 Kg( m1+ soil) Ah
σwet =(m2-m1)/Ah*1000 m.c%
σdry=s wet/(100+w)
1 1.900 3.576 0.000944 1775.42 10.75 1603.12 2 1.900 3.693 0.000944 1899.36 14.85 1653.81 3 1.900 3.895 0.000944 2113.35 19.10 1774.39 4 1.900 3.889 0.000944 2106.99 21.79 1730.04 5 1.900 3.734 0.000944 1942.80 24.15 1564.83
Optimum Moisture Content – 20%
Maximum Dry Density – 1780 Kg/m3
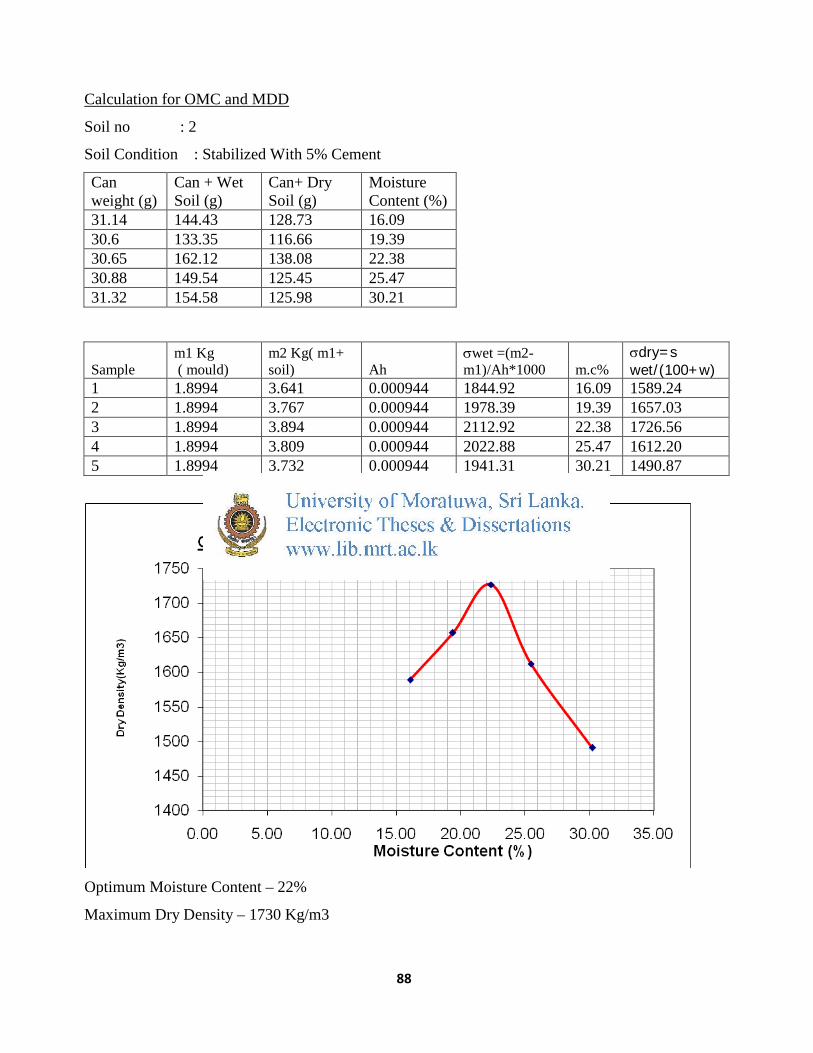
88
Calculation for OMC and MDD
Soil no : 2
Soil Condition : Stabilized With 5% Cement
Can weight (g)
Can + Wet Soil (g)
Can+ Dry Soil (g)
Moisture Content (%)
31.14 144.43 128.73 16.09 30.6 133.35 116.66 19.39 30.65 162.12 138.08 22.38 30.88 149.54 125.45 25.47 31.32 154.58 125.98 30.21
Sample
m1 Kg ( mould)
m2 Kg( m1+ soil) Ah
σwet =(m2-m1)/Ah*1000 m.c%
σdry=s wet/(100+w)
1 1.8994 3.641 0.000944 1844.92 16.09 1589.24 2 1.8994 3.767 0.000944 1978.39 19.39 1657.03 3 1.8994 3.894 0.000944 2112.92 22.38 1726.56 4 1.8994 3.809 0.000944 2022.88 25.47 1612.20 5 1.8994 3.732 0.000944 1941.31 30.21 1490.87
Optimum Moisture Content – 22%
Maximum Dry Density – 1730 Kg/m3

89
Calculation for OMC and MDD
Soil no : 3
Soil Condition : Stabilized With 5% Cement
Can weight (g)
Can + Wet Soil (g)
Can+ Dry Soil (g)
Moisture Content (%)
30.63 125.56 110.64 18.65 30.6 120.03 104.53 20.97 30.6 135.53 115.62 23.42 30.89 161.75 135.85 24.68 18.07 58.42 49.6 27.97
Sample
m1 Kg ( mould)
m2 Kg( m1+ soil) Ah
σwet =(m2-m1)/Ah*1000 m.c%
σdry=s wet/(100+w)
1 1.8994 3.5378 0.000944 1735.59 18.65 1462.81 2 1.8994 3.6856 0.000944 1892.16 20.97 1564.21 3 1.8994 3.93 0.000944 2151.06 23.42 1742.91 4 1.8994 3.98 0.000944 2204.03 24.68 1767.80 5 1.8994 3.7321 0.000944 1941.42 27.97 1517.05
Optimum Moisture Content – 24% Maximum Dry Density – 1780 Kg/m3