evaluating recruitment of american eel, anguilla … · 1 evaluating recruitment of american eel,...
TRANSCRIPT

1
Evaluating Recruitment of American Eel, Anguilla rostrata, to the Potomac River (Spring 2007)
February 2007 - July 2007
By
Hank Brooks, Wendy Lowery, Aimee Halvorson, James Gartland
and Marcel Montane
Department of Fisheries Science Virginia Institute of Marine Science
College of William and Mary Gloucester Point, Virginia 23062
Submitted to
Potomac River Fisheries Commission
September 2007

2
Acknowledgements Julia Ellis, Mandy Hewitt, Courtney Ford, Ashleigh Rhea, Justine Woodward and Mark Henderson deserve thanks for their participation in field sampling. Thanks also to the Virginia Marine Resources Commission (VMRC) law enforcement officers who kept the survey gear from being vandalized during the study. A special thanks to Mr. James Hess (Clark’s Millpond) and Ms. Joanne Northern and family (Gardy’s Millpond), who granted permission to sample on their respective properties.
This report was prepared by Marcel Montane (Principal Investigator) and co-authors, Wendy Lowery, Hank Brooks and Aimee Halvorson under award NA06NMF4740101 from the National Oceanic and Atmospheric Administration, United States Department of Commerce. The statements, findings, conclusions, and recommendations are those of the authors and do not necessarily reflect the views of the National Oceanic and Atmospheric Administration or the Department of Commerce. Table of Contents: Objectives….………………………………………………………………………….…3 Introduction…..…………………………………………………………………………..3 Life History…...…………………………………………………………………………..5 Methods…...…………………………………………………………………………......6 Results and Discussion………………………………………………………………...8 Conclusions and Recommendations…..…………………………………………….11 References…..…………………………………………………………………………12 Tables…..………………………………………………………………………………15 List of Figures…...……………………………………………………………….…….17 Figures…...……………………………………………………………………….…….18

3
Objectives The objectives of this study are to:
1. monitor the young-of-the-year (glass eel) migration into the Potomac River watershed to determine the spatial and temporal components of American eel recruitment;
2. examine the influence of tidal, lunar and hydrographic factors on
young-of–the-year eel recruitment; and
3. collect basic biological information on recruiting glass eels, including length, weight and pigment stage.
Introduction
Measures of juvenile recruitment success have long been recognized as
valuable tools in fisheries management. In Chesapeake Bay, these measures
provide reliable indicators of year class strength for species such as blue crab
(Lipcius and Van Engel, 1990), striped bass (Goodyear, 1985), and several other
recreationally, commercially, and ecologically important species (Geer and
Austin, 1999).
The American eel, Anguilla rostrata, is a valuable commercial species
along the entire Atlantic coast from New Brunswick to Florida. Landings along
the U.S. Atlantic coast have varied from 290 MT in 1962 to a high of 1600 MT in
1975 (NMFS, 1999). The Mid-Atlantic states (i.e., New York, New Jersey,
Delaware, Maryland, and Virginia) have accounted for the largest portion of the
east coast landings (88% of the reported landings) since 1988 (NMFS, 1999).
The Chesapeake Bay jurisdictions of Virginia, Maryland and the Potomac River
Fisheries Commission (PRFC) alone represent 30,15, and 18% respectively, of
the annual U.S. commercial harvest between 1987 and 1996 (ASMFC, 1999).
Harvests of American eel along the U.S. Atlantic Coast have declined in
recent years, and similar patterns have been noted in the Canadian Maritime
Provinces as well as in Europe with its congener, A. anguilla (Ciccotti et al.,

4
1995). Fishery independent indices of abundance have also shown a decline in
American eel populations in recent years (Richkus and Whalen, 1999; Geer,
2003; Montane and Fabrizio, 2006). Possible explanations for this decline
include Gulf Stream shifts, pollution, overfishing, parasites, and barriers to fish
passage (Castonguay et al., 1994; Haro et al., 2000). In addition, local factors
such as unfavorable wind-driven currents may affect glass eel survival on
continental shelves and may have a greater impact than fishing mortality or
continental climate change (Knights, 2003).
Efforts to assess and manage American eel have been hampered by a
lack of basic biological information, such growth rate and length at age. The
ASFMC American Eel Fishery Management Plan (hereafter referred to as FMP)
was adopted in 1999 and attempted to address these data gaps by encouraging
coastal states to augment their American eel data collection efforts through both
fishery-dependent and fishery-independent studies. Several states, including
Virginia, each implemented an annual survey intended to quantify the recruitment
of YOY American eel to estuarine and freshwater habitats. The development of
these various state surveys began in 2000, and most were fully implemented by
2001. Besides quantifying glass eel recruitment success, these surveys have the
potential to provide a more comprehensive understanding of physical and
environmental factors affecting the American eel population.
Life History
The American eel is a catadromous species occurring along the Atlantic and Gulf
coasts of North America and inland in the St. Lawrence Seaway and Great Lakes
(Murdy et al., 1997). The species is panmictic and supported throughout its range
by a single spawning population (Haro et al., 2000; Meister and Flagg, 1997).
Spawning takes place during winter to early spring in the Sargasso Sea. The
eggs hatch into transparent, leaf-shaped, ribbon-like larvae called leptocephali,
which are transported by ocean currents (over 9-12 months) in a northwesterly

5
direction. Within a year, metamorphosis into the glass eel stage occurs in the
Western Atlantic near the east coast of North America. Coastal currents and
active migration transport these glass eels into the rivers and estuaries of Virginia
and Maryland from February to July. As growth continues, the eel becomes
pigmented (elver stage) and within 12–14 months acquires a dark color with
underlying yellow (yellow eel stage; Facey and Van Den Avyle, 1987). Many
eels migrate upriver into freshwater rivers, streams, lakes, and ponds, while
others remain in estuaries. Most of the eel’s life is spent in these fresh-to-
brackish water habitats as a yellow eel. Upon maturity, eels migrate back to the
Sargasso Sea to spawn and subsequently perish (Haro et al., 2000). It is during
this migration, usually occurring from late summer through autumn, that
metamorphosis into the silver eel stage occurs. American eel age at maturity
varies by location, and eels from Chesapeake Bay have been found to mature
and migrate at an earlier age (i.e., approximately 10 years) than those inhabiting
more northern areas (Hedgepeth, 1983; Owens and Geer, 2003).
It has been suggested that glass eel migration occurs in waves (Boetius
and Boetius, 1989 as reported by Ciccotti et al., 1995), perhaps with a two-week
periodicity related to selective tidal stream transport (Ciccotti et al., 1995).
Further, changes in patterns and magnitudes freshwater inflow to bays and
estuaries may affect the size, timing, and spatial patterns of the upstream
migration of glass eels and elvers (Facey and Van Den Avyle, 1987).
Methods
The FMP established the following minimum criteria for the sampling of
glass eels with gear approved by the ASMFC Technical Committee:
1) timing and placement of gear must coincide with periods of peak onshore
migration;

6
2) at a minimum, the gear must fish during nighttime flood tides;
3) sampling must occur a minimum of four days per week for at least six
weeks or for the duration of the run;
4) at least one site must be sampled in each jurisdiction;
5) the entire catch of glass eels must be counted from each sampling event;
and
6) a minimum of 60 glass eels (if present) per system must be examined for
length, weight, and pigmentation stage weekly.
Due to the importance of the eel fishery in Virginia and the Potomac River,
efforts to quantify glass eel recruitment must ensure proper temporal and spatial
sampling coverage. Numerous sites in both Virginia and Maryland were
evaluated at the outset of the survey to provide the necessary spatial coverage
and to assess suitable locations (Geer, 2001). Final site selection was based on
known areas of glass eel recruitment, accessibility, and specific physical criteria
suitable for recruitment to the sampling gear. The Maryland sampling of the
Potomac River (northern shore site) was discontinued in 2001, due in part to the
low catch rates (Geer, 2001). At the request of PRFC, the Virginia Institute of
Marine Science (VIMS) has sampled two sites on the Potomac River’s south
shore (i.e., Gardy’s Millpond and Clark’s Millpond; Figure 1) from 2000 through
2007.
Eels were collected using Irish eel ramps (Figure 2) at both sites. Irish eel
ramps are an approved gear as stated in the FMP (ASMFC, 1999). The
configuration of these ramps (as described below) successfully attracts and
captures glass eels and elvers in tidal waters of Chesapeake Bay. Ramp
operation required continuous, gravity fed flow of water over the climbing
substrate and through the collection device. Hoses were attached to the ramp
and collection buckets with common poly vinyl chloride (PVC) pipe fittings, which
allowed quick adjustment, removal and replacement during collection.
EnkamatTM erosion control material was affixed to the floor of the ramp and
allowed to extend into the water below the ramp to provide a textured climbing

7
surface. The ramps were placed on an incline (15-45o), often on land, with the
ramp entrance and textured mat extending into the water. This inclination, in
combination with the 4o elevation of the substrate inside the ramp, resulted in
sufficient slope to create attractant flow. A hinged lid provided access for
cleaning and flow adjustments. Flow over the textured climbing surface was
regularly adjusted to maintain minimal depth and proper velocity.
Traps were checked four days per week (generally Monday, Tuesday,
Thursday and Friday), and only those eels captured in the ramp’s collection
bucket were recorded. Trap performance was rated on a scale of 0 to 3 (0 = new
set, 1 = gear fishing, 2 = gear fishing but not efficiently, 3 = gear not fishing).
Water temperature, pH, air temperature, wind direction, wind speed, and
precipitation were recorded during site visits. In addition, temperature data
loggers (Stowaway TidbitsTM) recorded hourly water temperature at each site. All
eels were enumerated and returned to the water above the trap to prevent them
from being re-collected by the trap. Subsampling, if applicable, was done
volumetrically. Lengths, weights, and pigment stage (as described by Haro and
Krueger, 1988) were collected from up to sixty eels each week. Glass eels were
distinguished from elvers by length and/or pigmentation. Eels less than or equal
to 85 mm total length (TL) were classified as glass eels, while those greater than
85 mm TL were classified as elvers. These two distinct length frequency modes
likely represent different year classes (Geer, 2001).
Clark’s Millpond (Coan River – Northumberland County) was sampled
from 27 February to 5 July 2007. The spillway is approximately one meter above
the creek. It was necessary to modify the ramp extension to allow eels total
access to the spillway due to the steady and strong stream flow at this site
(Figure 3). Gardy’s Millpond (Yeocomico River – Northumberland County) was
sampled over the same time span (Figure 4). The site contains a spillway that
drains through four box culverts, across a riffle constructed of riprap and into a
lotic area of the Yeocomico River.

8
Computation of CPUE was modified following a request by ASMFC.
Glass eel and elver CPUEs at each site were standardized to a 24 hour soak
time for the Irish eel ramp, and geometric means were calculated using the time
period in which 95% of the cumulative total catch was sampled (i.e. dates in
which 0%-2.5% and 97.5%-100% of the cumulative total catch was collected
were excluded), in an effort to account for the interannual variability in the period
of maximum recruitment. CPUEs for each of the previous sampling years were
recalculated using the aforementioned method which explains any discrepancies
in the CPUEs provided here and those given in previous reports.
Results and Discussion
A daily catch per unit effort (geometric mean CPUE) was calculated for
each site as well as for both sites combined. Potomac River (Clark’s and
Gardy’s Millponds combined) CPUEs for both glass eels and elvers have varied
through time with glass eels exhibiting a slight decreasing trend while elvers have
exhibited neither an increasing nor decreasing trend (Table 1 A - F; Figure 5).
The overall glass eel CPUE in 2007 was four times greater than 2006, while the
overall elver CPUE decreased threefold (Table 1 A - B; Figure 5).
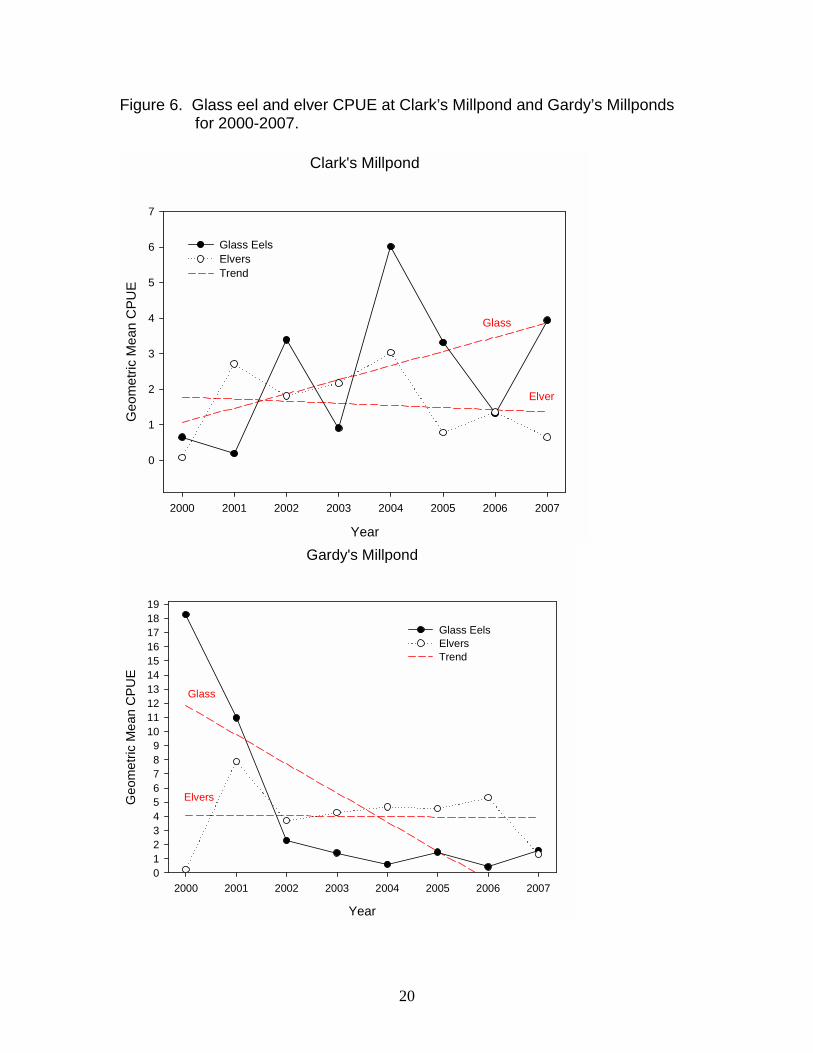
Glass eel CPUE at Clark’s Millpond has shown an increasing trend
between 2000 and 2007, whereas elver CPUE has not exhibited an increasing or
decreasing trend (Table 1 C-D; Figure 6, top). At Gardy’s Millpond, glass eel
CPUE has exhibited a significant decreasing trend (Table 1 E; Figure 6, bottom).
Elver CPUE at this site has neither increased nor decreased since 2000 (Table 1
F; Figure 6, bottom).
Initial arrival and migration of glass eels may be correlated to large
increases in water temperature, while elver migration may be delayed at
freshwater interfaces until certain behavioral and physiological changes have
occurred (Sorensen and Bianchini, 1986). As water temperature increased, the

9
number of glass eels captured at Clark’s Millpond increased, though a large
spike in catch did not occur until the water temperature reached 25o C (Figure 7,
top). Elver catches at this site occurred regularly throughout the survey without
obvious relationship to water temperature (Figure 7, bottom). At Gardy’s
Millpond there did not appear to be any relationship between glass eel catch and
water temperature (Figure 8, top), as only a single large collection occurred
during sampling. Elvers were captured throughout the sampling period without
an obvious relationship to water temperature (Figure 8, bottom).
At Clark’s Millpond, a large influx of glass eels occurred during the last
month of the survey, although specimens were collected in smaller numbers
beginning early April (Figure 9, top). There was no apparent relationship between
glass eel catch and lunar phase (Figure 9, top) at this site. Elvers collections at
Clark’s Mill also appeared to be independent of lunar phase (Figure 9, bottom).
Visual inspection of the data again revealed no relationship between lunar phase
and catch of either glass eels or elvers at Gardy’s Millpond (Figure 10).
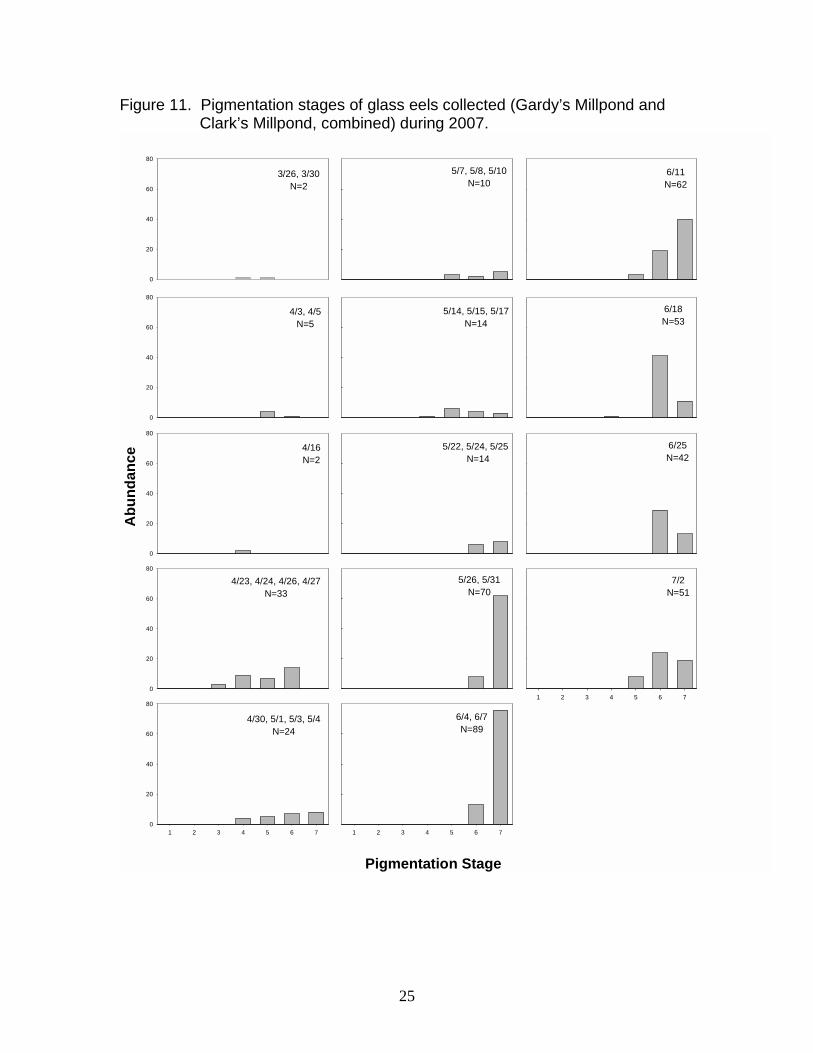
Glass eels exhibiting pigmentation stages 3 through 7 were collected
(Figures 11 and 12). Only three stage 3 eels were collected, and all were
sampled from Gardy’s Millpond. The more developed stages (5 through 7) were
collected at both Clark’s and Gardy’s Millponds later in the survey (Figure 12).
The pigmentation stages of eels sampled from the Potomac River sites were, in
general, more advanced than those collected from James and York River sites
(VIMS American Eel Survey, unpublished data) possibly due to the greater
distance and, in turn, longer migration period necessary to reach the middle
Chesapeake Bay. As found in previous years, glass eel weight increased with
length (Figure 13). Long term (20+ years) glass eel recruitment studies in both
North Carolina and New Jersey have suggested glass eel lengths have been
decreasing (M. Sullivan, pers. comm.). This does not seem to be the case in the
Potomac River, however (Figure 14). Glass eel condition, analyzed using the
Fulton Condition Index (K) described in Anderson and Neumann (1996), reveals
a trend toward more robust individuals (i.e., increasing weight at a given length).
10
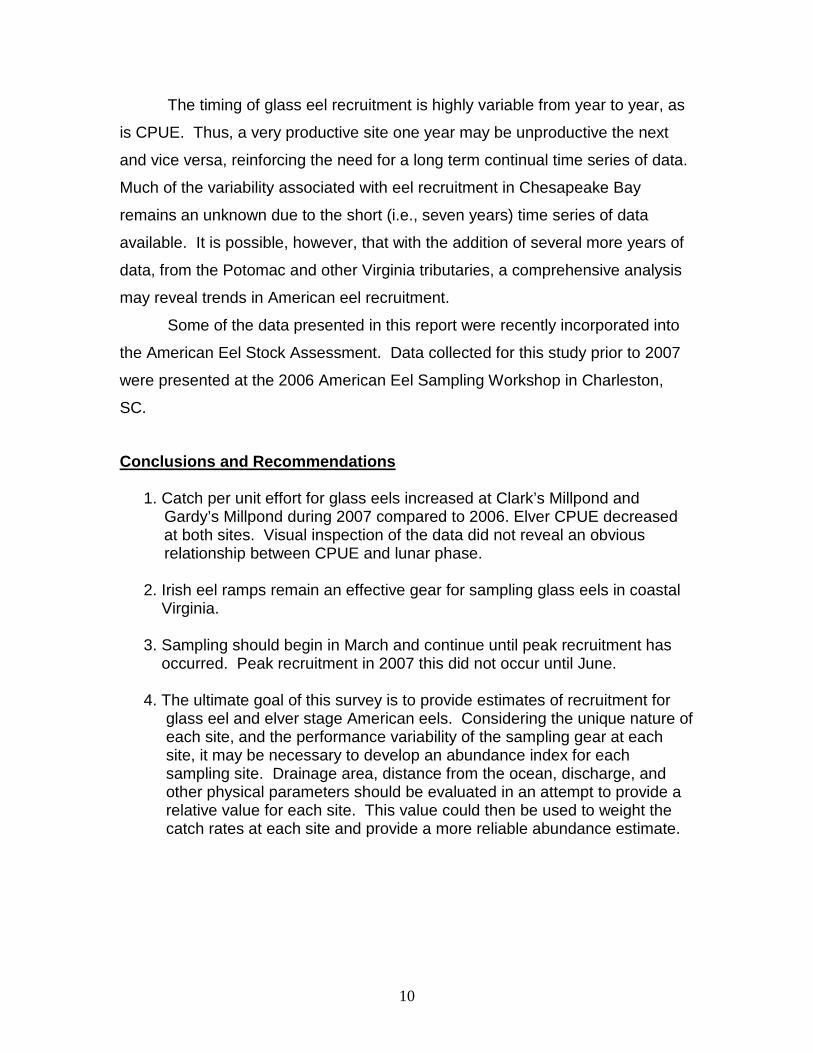
The timing of glass eel recruitment is highly variable from year to year, as
is CPUE. Thus, a very productive site one year may be unproductive the next
and vice versa, reinforcing the need for a long term continual time series of data.
Much of the variability associated with eel recruitment in Chesapeake Bay
remains an unknown due to the short (i.e., seven years) time series of data
available. It is possible, however, that with the addition of several more years of
data, from the Potomac and other Virginia tributaries, a comprehensive analysis
may reveal trends in American eel recruitment.
Some of the data presented in this report were recently incorporated into
the American Eel Stock Assessment. Data collected for this study prior to 2007
were presented at the 2006 American Eel Sampling Workshop in Charleston,
SC.
Conclusions and Recommendations
1. Catch per unit effort for glass eels increased at Clark’s Millpond and
Gardy’s Millpond during 2007 compared to 2006. Elver CPUE decreased at both sites. Visual inspection of the data did not reveal an obvious relationship between CPUE and lunar phase.
2. Irish eel ramps remain an effective gear for sampling glass eels in coastal Virginia. 3. Sampling should begin in March and continue until peak recruitment has occurred. Peak recruitment in 2007 this did not occur until June. 4. The ultimate goal of this survey is to provide estimates of recruitment for glass eel and elver stage American eels. Considering the unique nature of each site, and the performance variability of the sampling gear at each site, it may be necessary to develop an abundance index for each sampling site. Drainage area, distance from the ocean, discharge, and other physical parameters should be evaluated in an attempt to provide a relative value for each site. This value could then be used to weight the catch rates at each site and provide a more reliable abundance estimate.

11
References Anderson, R. O. and R. M. Neumann. 1996. Length, weight and associated structural indices. Pages 447-482 in B. R. Murphy and D. W. Willis, editors. Fisheries Techniques, 2nd edition. American Fisheries Society, Bethesda, Maryland. ASMFC, 1999. Fishery Management Plan for American Eel, Anguilla rostrata. Boetius, J. 1976. Elvers, Anguilla anguilla and Anguilla rostrata from two Danish localities. Size, body weight, developmental stage and number of vertebrae related to time of descent. Meddr Danm. Fisk- og Havundersw N.S. 7:199-220. Castonguay, M., P.V. Hodson, C.M. Couillard, M.J. Eckersley, J.D. Dutil and G. Verreault. 1994. Why is recruitment of American Eel, Anguilla rostrata, declining in the St. Lawrence River and Gulf? Can. J. Fish. Aquat. Sci. 51:479-488. Ciccotti, E, T. Ricci, M. Scardi, E. Fresi and S. Cataudella. 1995. Intraseasonal characterization of glass eel migration in the River Tiber: space and time dynamics. J. Fish Biol. 47:248-255. Facey, D. E. and M. J. Van Den Avyle. 1987. Species profiles: life histories and environmental requirements of coastal fishes and invertebrates (North Atlantic)—Americen eel. U. S. Fish Wildl. Serv. Biol. Rep. 82(11.74). U. S. Army Corps of Engineers, TR EL-82-4. 28 pp. Geer, P.J. 2001. Evaluating recruitment of American eel, Anguilla rostrata, to the Potomac River ---Spring 2001. Report prepared for Potomac River Fisheries Commission. Virginia Institute of Marine Science, Gloucester Point, Virginia 23062. 21 pp. Geer, P. J. 2003. Distribution, relative abundance, and habitat use of American eel, Anguilla rostrata, in the Virginia portion of the Chesapeake Bay. Pages 101-115 in D. A. Dixon (Editor). Biology, Management and Protection of Catadromous Eels. American Fisheries Society, Sympoium 33, Bethesda, MD, USA. Geer, P.J., and H.M. Austin. 1999. Estimation of relative abundance of recreationally important finfish in the Virginia portion of Chesapeake Bay. Annual Report to VMRC/USFWS Sportfish Restoration Project F104R9. July 1998 to June 1999. Virginia Institute of Marine Science, Gloucester Point, Virginia 23062. 139 pp. Goodyear, C.P. 1985. Relationship between reported commercial landings and abundance of young striped bass in Chesapeake Bay, Maryland. Trans. Amer. Fish. Soc. 114(1):92-96.

12
Haro, A. J. and W. H. Kreuger. 1988. Pigmentation, size and migration of elvers, Anguilla rostrata (Lesuer), in a coastal Rhode Island stream. Can. J. Zool. 66:2528-2533. Haro, A., W. Richkus, K. Whalen, W.-Dieter Busch, S. Lary, T. Brush, and D. Dixon. 2000. Population decline of the American eel: Implications for Research and management. Fisheries 25(9): 7-16. Hedgepeth, M. Y. 1983. Age, growth and reproduction of American eels, Anguilla rostrata (Lesueur), from the Chesapeake Bay area. Masters Thesis. College of William and Mary. 61 pp. Knights, B. 2003. A review of the possible impacts of long-term oceanic and climate changes and fishing mortality on recruitment of anguillid eels of the Northern Hemisphere. The Science of the Total Environment 310(1-3):237-244. Lipcius, R. N. and W. A. Van Engel. 1990. Blue crab population dynamics in Chesapeake Bay: variation in abundance (York River, 1972 – 1988) and stock-recruit functions. Bull. Mar. Sci. 46(1): 180-194. Meister, A. L. and L. N. Flagg. 1997. Recent developments in the American eel fisheries of North America. FOCUS 22(1):1-4. Montane, M.M. and M.C. Fabrizio. 2006. Estimating Relative Abundance of Recreationally Important Finfish and Crustaceans in the Virginia Portion of Chesapeake Bay, Project # RF 05-15, June 2005-May 2006. Annual report to the Virginia Marine Resources Commission Marine Recreational Fishing Advisory Board. Virginia Institute of Marine Science, Gloucester Point, VA. 125 pp. Murdy, E.O., R.S. Birdsong and J.A. Musick. 1997. Fishes of Chesapeake Bay. Smithsonian Institution Press. 324 pp. NMFS, 1999. February 21, 1999. “Annual commercial landings statistics. National Marine Fisheries Service Fisheries Statistics Division Annual Landings Query”. http://remora.ssp.nmfs.gov/MFPUBLIC/owa/mrfss.ft_HELP.SPECIES. Owens, S. J. and P. J. Geer. 2003. Size and age structure of American eels in tributaries of the Virginia portion of the Chesapeake Bay. Pages 117-124 in D. A. Dixon (Editor). Biology, Management and Protection of Catadromous Eels. American Fisheries Society, Sympoium 33, Bethesda, MD, USA. Richkus, W. and K. Whalen. 1999. American eel, Anguilla rostrata, scooping study. A literature review and data review of the life history, stock status, population dynamics, and hydroelectric impacts. Final Report, March 1999 by Versar, Inc., Prepared for EPRI.

13
Sorensen, P. W. and M. L. Bianchini. 1986. Environmental correlates of the freshwater migration of elvers of the American eel in a Rhode Island Brook. Trans. Amer. Fish. Soc. 115:258-268.

14
Table 1. Potomac River catch statistics by year (2000-2007). Dates and CPUE (geometric mean) for 95% catch.
A. Sites Combined - Glass Eels
SITE YEAR Start Date
End Date
Total Catch
Number Used
Trap Days
CPUE Geo
Mean Standard
Error
Combined 2000 16-Apr 12-May 306 295 27 4.510 0.280 2001 8-Apr 24-Apr 733 711 17 11.223 0.467 2002 29-Mar 27-Apr 244 233 30 5.649 0.138 2003 9-Apr 13-May 95 87 35 1.886 0.114 2004 13-Apr 27-May 486 461 45 5.712 0.164 2005 30-Mar 26-May 317 305 58 4.000 0.095 2006 20-Mar 21-May 126 119 63 1.373 0.083 2007 23-Mar 1-Jul 683 619 70 5.877 0.123
B. Sites Combined - Elvers
SITE YEAR Start Date
End Date
Total Catch
Number Used
Trap Days
CPUE Geo
Mean Standard
Error
Combined 2000 5-Apr 15-May 20 17 41 0.245 0.052 2001 16-Mar 8-May 829 801 54 9.842 0.112 2002 15-Mar 27-Apr 363 346 44 5.614 0.127 2003 17-Mar 8-May 525 503 53 6.868 0.114 2004 10-Mar 20-May 797 740 72 6.558 0.107 2005 23-Mar 19-May 375 365 58 5.266 0.073 2006 10-Mar 21-May 845 821 73 6.367 0.118 2007 15-Mar 27-Jun 288 275 105 2.030 0.059
C. Clark’s Millpond - Glass Eels
SITE YEAR Start Date
End Date
Total Catch
Number Used
Trap Days
CPUE Geo
Mean Standard
Error
CLARKS 2000 28-Apr 15-May 15 12 18 0.650 0.088 2001 9-Apr 22-Apr 4 3 14 0.186 0.069 2002 1-Apr 27-Apr 115 109 27 3.387 0.115 2003 25-Apr 15-May 24 22 21 0.902 0.090 2004 21-Apr 27-May 447 430 37 6.006 0.179 2005 13-Apr 26-May 223 213 44 3.311 0.128 2006 6-Apr 22-May 80 77 47 1.311 0.079 2007 26-Apr 1-Jul 435 379 67 3.934 0.122

15
D. Clark’s Millpond - Elvers
SITE YEAR Start Date
End Date
Total Catch
Number Used
Trap Days
CPUE Geo
Mean Standard
Error
CLARKS 2000 5-Apr 15-May 5 3 41 0.078 0.022 2001 19-Mar 10-May 205 196 53 2.711 0.099 2002 13-Mar 21-Apr 90 83 40 1.810 0.071 2003 17-Mar 8-May 225 213 53 2.165 0.140 2004 2-Apr 23-May 314 299 52 3.029 0.153 2005 28-Mar 24-May 62 59 58 0.773 0.068 2006 15-Mar 24-May 153 146 71 1.351 0.081 2007 15-Mar 27-Jun 90 85 105 0.646 0.045
E. Gardy’s Millpond - Glass Eels
SITE YEAR Start Date
End Date
Total Catch
Number Used
Trap Days
CPUE Geo
Mean Standard
Error
GARDYS 2000 16-Apr 27-Apr 291 262 12 18.266 0.183 2001 8-Apr 24-Apr 729 707 17 10.956 0.471 2002 29-Mar 25-Apr 129 122 28 2.281 0.190 2003 7-Apr 13-May 71 68 37 1.407 0.103 2004 2-Apr 18-May 39 38 47 0.612 0.071 2005 28-Mar 5-May 94 89 39 1.462 0.126 2006 17-Mar 11-May 46 39 56 0.419 0.066 2007 23-Apr 27-Jun 248 237 66 1.590 0.120
F. Gardy’s Millpond - Elvers
SITE YEAR Start Date
End Date
Total Catch
Number Used
Trap Days
CPUE Geo
Mean Standard
Error
GARDYS 2000 16-Apr 15-May 15 14 30 0.232 0.065 2001 16-Mar 1-May 624 605 47 7.887 0.135 2002 15-Mar 27-Apr 273 261 44 3.682 0.154 2003 19-Mar 6-May 300 280 49 4.248 0.109 2004 10-Mar 11-May 483 470 63 4.663 0.109 2005 23-Mar 17-May 313 304 56 4.540 0.072 2006 10-Mar 14-May 692 672 66 5.300 0.129 2007 15-Mar 27-Jun 198 190 105 1.320 0.059

16
Figure List Figure 1. Potomac River sampling sites. Figure 2. Irish ramp at Gardy’s Millpond showing its configuration. Figure 3. Irish ramp at Clark’s Millpond. Figure 4. Spillway at Gardy’s Millpond. Figure 5. Potomac River CPUE (geometric mean) for glass eels and elvers (sites combined), 2000 - 2007. Figure 6. Glass eel and elver CPUE at Clark’s Millpond and Gardy’s Millpond for 2000-2007. Figure 7. Glass eel and elver catch vs. water temperature at Clark’s Millpond. Figure 8. Glass eel and elver catch vs. water temperature at Gardy’s Millpond. Figure 9. Daily glass eel and elver catch vs. lunar phase at Clark’s Millpond Figure 10. Daily glass eel and elver catch vs. lunar phase at Gardy’s Millpond Figure 11. Potomac River pigmentation stages (sites combined) during 2007. Figure 12. Frequency distribution of glass eel pigmentation stages. Figure 13. Glass eel length-weight regression. Figure 14. Length, weight and condition index (K) for glass eels 2002-2007.

17
Figure 1. Potomac River sampling sites.
Figure 2. The Irish Ramp at Gardy’s Millpond showing its configuration. The arrows indicate the flow of water and eels.
Potomac River
Chesapeake Bay
Gardy’s Millpond
Clark’s Millpond

18
Figure 3. The Irish Ramp at Clark’s Millpond (Coan River). The green tube in the foreground was initially used as the modified ramp extension. This was replaced in 2004 with ¼” Delta knotless nylon placed in layers in the same location. Figure 4. The spillway at Gardy’s Millpond (Yeocomico River). The Irish Ramp was located in the culvert on the left.

Figure 5. Potomac River geometric mean CPUE for glass eels and elvers (Gardy’s Millpond and Clark’s Millpond, combined), 2000 - 2007.
Year
2000 2001 2002 2003 2004 2005 2006 2007
Geo
met
ric M
ean
CPU
E
0
1
2
3
4
5
6
7
8
9
10
11
12
Glass eelElverTrend
Glass
Elver
19
20
Figure 6. Glass eel and elver CPUE at Clark’s Millpond and Gardy’s Millponds for 2000-2007.
Clark's Millpond
Year
2000 2001 2002 2003 2004 2005 2006 2007
Geo
met
ric M
ean
CPU
E
0
1
2
3
4
5
6
7
Glass EelsElversTrend
Glass
Elver
Gardy's Millpond
Year
2000 2001 2002 2003 2004 2005 2006 2007
Geo
met
ric M
ean
CP
UE
0123456789
10111213141516171819
Glass EelsElversTrend
Glass
Elvers

21
Figure 7. Glass eel and elver catch vs. water temperature at Clark’s Millpond during 2007.
Date
3/1 4/1 5/1 6/1 7/1
Cat
ch -
Gla
ss e
el
0
10
20
30
40
50
Wat
er T
empe
ratu
re (C
)
5
10
15
20
25
30CatchUpstream Water Temp.Downstream Water Temp.
Date
3/1 4/1 5/1 6/1 7/1
Cat
ch -
Elve
r
0
2
4
6
8
Wat
er T
empe
ratu
re (C
)
5
10
15
20
25
30

22
Figure 8. Glass eel and elver catch vs. water temperature at Gardy’s Millpond during 2007.
Date
3/1 4/1 5/1 6/1 7/1
Cat
ch -
Gla
ss e
el
0
20
40
60
80
100
120
Wat
er T
empe
ratu
re (C
)
0
5
10
15
20
25
30
CatchUpstream Water Temp.Downstream Water Temp.
Date
3/1 4/1 5/1 6/1 7/1
Cat
ch -
Elve
r
0
5
10
15
20
Wat
er T
empe
ratu
re (C
)
0
5
10
15
20
25
30

23
Figure 9. Catch versus lunar phase for glass eels and elvers at Clarks Millpond during 2007.
Date/Lunar Phase
3/1 4/1 5/1 6/1 7/1
Cat
ch -
Gla
ss E
el
0
10
20
30
40
50 Full moon
New moon
1st quarter (waxing)
Last quarter (waning)
Date/Lunar phase
3/1 4/1 5/1 6/1 7/1
Cat
ch -
Elve
r
0
2
4
6
8

24
Figure 10. Catch versus lunar phase for glass eels and elvers at Gardy’s Millpond during 2007.
Date/Lunar phase
3/1 4/1 5/1 6/1 7/1
Cat
ch -
Gla
ss E
el
0
20
40
60
80
100
120 Full moon
New moon
1st quarter (waxing)
Last quarter (waning)
Date/Lunar phase
3/1 4/1 5/1 6/1 7/1
Cat
ch -
Elve
r
0
5
10
15
20
25
Figure 11. Pigmentation stages of glass eels collected (Gardy’s Millpond and Clark’s Millpond, combined) during 2007.
0
20
40
60
80
3/26, 3/30N=2
0
20
40
60
80
0
20
40
60
80
Abu
ndan
ce
0
20
40
60
80
4/3, 4/5N=5
4/16N=2
1 2 3 4 5 6 70
20
40
60
80
4/23, 4/24, 4/26, 4/27N=33
Pigmentation Stage
4/30, 5/1, 5/3, 5/4N=24
5/7, 5/8, 5/10N=10
5/14, 5/15, 5/17N=14
5/22, 5/24, 5/25 N=14
1 2 3 4 5 6 7
1 2 3 4 5 6 7
5/26, 5/31N=70
6/4, 6/7N=89
6/11N=62
6/18N=53
6/25N=42
7/2N=51

26
Figure 12. Frequency distribution of glass eel pigmentation during 2007 at Clark’s Millpond and Gardy’s Millpond.
Pigment Stage
1 2 3 4 5 6 7
Freq
uenc
y
0
50
100
150
200
250
ClarksGardys
n= 471
Figure 13. Glass eel length-weight regression (Clark’s Millpond and Gardy’s Millpond, combined). (Note: Solid line denotes regression line)
Length (mm)
50 60 70 80
Wei
ght (
g)
0.0
0.1
0.2
0.3
0.4
0.5
0.6
Weight = -0.599 + 0.013* Lengthr2 = 0.752, P = 0.0005

27
Figure 14. Length, weight and condition index (K) for glass eels examined from Potomac River sites (combined), 2002-2007. Note: Due to low numbers of eels collected in 2003, no biological data were available.
Year
2002 2003 2004 2005 2006 2007
Mea
n Le
ngth
(mm
)
56.5
57.0
57.5
58.0
58.5
59.0
59.5
60.0
60.5
Year
2002 2003 2004 2005 2006 2007
Mea
n W
eigh
t (g)
0.12
0.13
0.14
0.15
0.16
0.17
0.18
0.19
0.20
Year
2002 2003 2004 2005 2006 2007
Con
ditio
n Fa
ctor
(K)
0.065
0.070
0.075
0.080
0.085
0.090