evaluating education governance: does state takeover of
TRANSCRIPT
Evaluating Education Governance: Does State Takeover of School Districts Affect Student Achievement?
Local school boards have primary authority for running educational systems in the U.S. but little is known empirically about the merits of this arrangement. State takeovers of struggling districts represent a rare alternative form of educational governance and have become an increasingly common response to low performance. However, limited research explores whether this effectively improves student outcomes. We track all takeovers nationwide from the late 1980s, when the first takeovers occurred, through 2016 and describe takeover districts. While these districts are low performing, we find academic performance plays less of a role in predicting takeover for districts serving larger concentrations of African American students. We then use a new data source allowing for cross-state comparisons of student outcomes to estimate the effect of takeovers that occurred between 2011 and 2016. On average, we find no evidence that takeover generates academic benefits. Takeover appears to be disruptive in the early years of takeover, particularly to English Language Arts achievement, although the longer-term effects are less clear. We also observe considerable heterogeneity of effects across districts. Takeovers were least effective in districts with higher baseline achievement and least harmful in majority Latinx communities. Leaders should be cautious about using takeover without considering local context and a better understanding of why some takeovers are more effective than others.
Suggested citation: Schueler, Beth E., and Joshua Bleiberg. (2021). Evaluating Education Governance: Does State Takeover of School Districts Affect Student Achievement? . (EdWorkingPaper: 21-411). Retrieved from Annenberg Institute at Brown University: https://doi.org/10.26300/v2px-v524
VERSION: May 2021
EdWorkingPaper No. 21-411
Beth E. SchuelerUniversity of Virginia
Joshua BleibergBrown University

STATE TAKEOVERS 1
EVALUATING EDUCATION GOVERNANCE: DOES STATE TAKEOVER OF SCHOOL DISTRICTS AFFECT STUDENT ACHIEVEMENT?
Beth E. Schueler, University of Virginia Joshua F. Bleiberg, Brown University
Abstract: Local school boards have primary authority for running educational systems in the U.S. but little is known empirically about the merits of this arrangement. State takeovers of struggling districts represent a rare alternative form of educational governance and have become an increasingly common response to low performance. However, limited research explores whether this effectively improves student outcomes. We track all takeovers nationwide from the late 1980s, when the first takeovers occurred, through 2016 and describe takeover districts. While these districts are low performing, we find academic performance plays less of a role in predicting takeover for districts serving larger concentrations of African American students. We then use a new data source allowing for cross-state comparisons of student outcomes to estimate the effect of takeovers that occurred between 2011 and 2016. On average, we find no evidence that takeover generates academic benefits. Takeover appears to be disruptive in the early years of takeover, particularly to English Language Arts achievement, although the longer-term effects are less clear. We also observe considerable heterogeneity of effects across districts. Takeovers were least effective in districts with higher baseline achievement and least harmful in majority Latinx communities. Leaders should be cautious about using takeover without considering local context and a better understanding of why some takeovers are more effective than others. Notes: We thank the Russell Sage Foundation and WT Grant Foundation for generously funding this project. We are grateful to the state agency officials who helped verify our policy tracking. Thanks are also due to our editor and anonymous reviewers, Daphna Bassok, Jim Wyckoff, Adam Kho, Adela Soliz, Ben Skinner, Matthew Kraft, Kenneth Wong, writing group and seminar participants at Harvard University, University of Virginia, and Brown University, as well as Sean Reardon, Susanna Loeb, and other attendees of the RSF/WT Grant Foundation meeting on “Improving Education and Reducing Inequity in the United States” for helpful feedback. Please address correspondence to Beth E. Schueler, Ridley Hall 268, University of Virginia, P.O. Box 400277, Charlottesville, VA 22904; [email protected].
STATE TAKEOVERS 2
EVALUATING EDUCATION GOVERNANCE: DOES STATE TAKEOVER OF
SCHOOL DISTRICTS AFFECT STUDENT ACHIEVEMENT?
WHY STUDY STATE TAKEOVER?
School boards hold a special place in the American political landscape. They have been
described by some as the purest expression of American democratic ideals (Iannaccone & Lutz,
2006; Maeroff, 2010; Resnick & Bryant, 2010; Hess & Meeks, 2013) and by others as
institutions outdated and dysfunctional enough to be jettisoned entirely (Miller, 2008; Manna &
McGuinn, 2013; Henig, Jacobsen, Reckhow, 2019). Historically, education has been a largely
local affair with elected school boards holding the primary responsibility for governing our
nation’s schools and wielding the authority to hire and fire the superintendent responsible for
school system operations (Howell, 2005). Progressive Era reformers created this system of
locally elected boards with the goal of separating out education from the rest of urban
governance, shielding schools from corruption and patronage, and placing educational experts at
the helm (Finn & Keegan, 2004; Iannaccone & Lutz, 2006). However, very little empirical
evidence speaks to whether this unique form of governance represents an effective arrangement
for students.
Whereas most domestic public policy issues in the U.S. are handled by general-purpose
institutions that cover a wide range of issues, education is an unusual policy area given its heavy
reliance on single-purpose institutions, including school boards, that operate separately from the
rest of local government (Kirst, 2004; Kirst & Wirt, 2009; Henig, 2013). However, this
arrangement has been shifting in recent years as general-purpose governments (e.g.,
municipalities) and their executives (e.g., mayors and governors) have claimed greater authority

STATE TAKEOVERS 3
in the governance of school systems (Wong, Shen, Anagnostopoulos & Rutledge, 2007; Henig,
2013; Wong, 2013; Peterson, 2016). Public education has become more centralized as states and
the federal government have taken on a greater role in funding and running educational systems.
These changes have led political scientist Jeffrey Henig (2013) to argue that we are in the midst
of the end to an era of “educational exceptionalism” where education policy is treated differently
from other domestic issues.
An increased reliance on state takeovers of struggling local school districts represents a
key example of this shift away from educational exceptionalism in that it removes school board
authority, increases centralization, and often involves a greater role for general-purpose
governments and executives. In 2015 alone, eleven states either debated or passed legislation that
would allow for the creation of state-run districts (Layton, 2016) and at least 34 states now have
the explicit authority to take over the management of schools, districts, or both (Jochim, 2016).
Twenty states have laws authorizing state interventions into the finances of municipal
governments (Huh, Fehr & Murphy, 2013) or the declaration of a fiscal emergency (Beckett-
Camarata, 2004), which a state could theoretically use to take over a school district.
Typically, state takeover involves a shift in decision-making power from a locally elected
school board to the state which then has the authority to do one or all of the following: run the
school system directly, transfer authority to another official such as the mayor, abolish the school
board, appoint all or some of a new school board, and/or appoint a new superintendent, receiver,
or emergency manager to operate the system. State takeover, along with mayoral control, is
therefore one of the few alternatives to the traditional school board system of educational
governance that has been attempted in practice. However, there have been limited systematic

STATE TAKEOVERS 4
efforts to study the nature of these reforms, such as the frequency and length, as well as the types
of districts that are targeted for takeover (for exceptions, see Jochim, 2016; Morel, 2018).
State takeover reforms have important equity implications. Takeovers tend to target low-
performing systems where low-income learners and students of color are concentrated (Wong &
Shen, 2003; Morel, 2018). Therefore, the impact of takeover on student achievement outcomes
could contribute to either narrowing or widening race- and/or class-based achievement gaps.
Additionally, school boards have historically served as key avenues for people of color to gain
entry into public office (Henig, Hula, Orr & Pedescleaux, 1999). As a result, the removal of
school board authority could have an impact on the descriptive representation of these
communities’ elected officials. Indeed, Morel (2018) finds that state takeovers of majority-Black
districts have been followed by a decrease in the representation of African Americans in local
government. However, he finds the opposite is true for majority-Latinx districts. Takeovers in
these contexts have actually been followed by an increase in local Latinx political representation.
In other words, we know these governance reforms have important political consequences but we
know less about their effects on educational equity.
A key challenge for studying the effect of districtwide takeovers on student academic
outcomes is that they occur relatively infrequently within any single state. Furthermore, each
state has historically deployed its own standardized tests to measure student achievement. These
two factors make cross-state comparisons both essential and difficult. Fortunately, we are able to
capitalize on a new data source that allows us to compare academic outcomes across states to
provide what we believe is the first available evidence on the question of whether and how state
takeover of school districts affects the students served by these systems. More specifically, we
estimate the effect of state takeover of districts nationally between 2011 and 2016 on test-based

STATE TAKEOVERS 5
English Language Arts and mathematics achievement among third through eighth grade students
as well as educational inputs, including class size, the size of the charter sector, and educational
spending. In the process, we examine and describe the characteristics of the full universe of
districts that have undergone state takeover from 1988 to 2016.
WHAT IS THE RATIONALE AND EXISTING EVIDENCE FOR TAKEOVER?
Proponents of state takeover argue that it is a necessity in the case of persistent
underperformance, financial mismanagement, noncompliance, or safety concerns, given that
states have a constitutional obligation for providing public education (Parker, 2016; Ziebarth,
2002). They further point to school board dysfunction (e.g., Henig, Hula, Orr & Pedescleaux,
1999; Hess & Leal, 2004; Payne, 2008) and the low voter turnout that plagues school board
elections, minimizing the degree to which these bodies are democratically representative and
maximizing the influence of organized interest groups in these venues (Berry & Howell, 2005;
Moe, 2005; Moe, 2011; Anzia, 2014). State takeover is therefore viewed as a governance
arrangement that shields state level actors from local political pressures that make it otherwise
difficult to enact change and shifts the venue of decision-making to one in which interest groups
may have less power. In some cases, takeover is seen as a tool to remove officials who fail to
follow basic rules (e.g., record keeping, education regulations) or local actors who break the law
(e.g., fraud) (Jochim, 2016).
Critics of state takeover, on the other hand, argue that it is an ineffective strategy for
improving school systems given state-level leaders’ distance from students and limited capacity
for directly running educational organizations. Instead, they make the case that local decision-
makers who are closer to the teachers and students they serve are in the best position to turn

STATE TAKEOVERS 6
around failing school districts (Greenblatt, 2018). In contrast, takeover can get in the way of the
development of local “civic capacity”—collective problem solving—to sustain school
improvement efforts (Stone, Henig, Jones & Pierannunzi, 2001; Morel, 2018). They warn that
state takeover often comes with disruptive changes, including turnover of leaders and teachers,
that can get in the way of student learning. Furthermore, these skeptics caution that, beyond the
effects on student outcomes, takeover usurps transparent, local, democratic decision-making,
representation, and often the economic and political power of communities of color. Opponents
have even at times gone so far as to compare state takeover to colonialism in cases where mostly
white state-level leaders have seized power from communities composed primarily of and led by
people of color (Oluwole & Green, 2009; Morel, 2018).
Recent national survey evidence suggests majority public support for state takeovers of
troubled school systems in the case of persistently low academic performance and even higher
levels of support in the case of financial mismanagement, at least when considered in the
abstract. However, those citizens most likely to be directly affected by takeovers—teachers,
residents of low-performing districts, and Black respondents—express significantly lower levels
of support and higher rates of opposition (Schueler & West, 2019). This suggests that resistance
to state takeover arises, at least in part, due to the loss of political power, autonomy, and job
security that these stakeholders often experience when a takeover occurs in their community.
Importantly, the effect of alternatives to the traditional school board governance
arrangement, let alone state takeovers, on student academic outcomes is unclear. Examining state
takeovers and attempted turnarounds of districts from 1992 to 2000, Wong and Shen (2002,
2003) found that states have had some success at improving the financial management of
struggling school systems but have had less success at improving student academic outcomes.

STATE TAKEOVERS 7
Given the data limitations at the time of publication, these researchers compared proficiency
rates for districts across states. Unfortunately, this method has known drawbacks due to the fact
that effects on these outcomes are dependent on underlying performance distributions (Ho,
2008). Furthermore, these studies predate the No Child Left Behind (NCLB) Act and thus the
interventions under examination did not occur in a policy context with standardized performance
information and high-stakes testing nationwide. As a result, there is a need to examine state
takeovers in a more contemporary accountability climate.
More recent research on post-NCLB state takeovers is made up primarily of a series of
case studies of districts under takeover, with bright spots in terms of student achievement
outcomes from cities including New Orleans, Louisiana (Harris & Larsen, 2016; Harris &
Larsen, 2018) and Lawrence, Massachusetts (Schueler, Goodman & Deming, 2016). However,
researchers have also uncovered more mixed results from contexts such as Philadelphia,
Pennsylvania (Gill, Zimmer, Christman & Blanc, 2007), Tennessee’s Achievement School
District (Zimmer, Henry, & Kho, 2017), and Newark, New Jersey (Chin, Kane, Kozakowski,
Schueler & Staiger, 2017). The case studies reveal that state takeover can result in a diverse
range of interventions designed to turn around school performance, even among those cases that
have produced similar outcomes. For example, in New Orleans, Louisiana, collective bargaining
was discontinued, tenure protections eliminated, nearly all teachers fired, and all schools
eventually converted to charters. In contrast, in Lawrence, Massachusetts, although the state-
appointed receiver had the authority to ignore the collective bargaining agreement and fire all
teachers, he chose to re-negotiate a new contract with the union and to retain a majority of
teachers. The district partnered with charter operators to manage a small number of schools, but
did not convert any schools to charter status. While this literature is valuable in providing proof

STATE TAKEOVERS 8
points for the field about the viability of state-led, district-wide turnaround, it suffers from a key
limitation: the case selection process is unclear. It could be that the districts chosen for case
study are exceptional on a range of dimensions, and some states may have greater capacity for
takeover than others, leaving the broader question on average nationwide takeover effects
unanswered.
DATA
Tracking State Takeovers
To both track and describe state takeovers of school districts over time, and to estimate
the effect of takeover on academic and policy outcomes, we generated an original dataset that
identifies all districts that have ever been under state takeover since the first takeover occurred in
1988 up until 2016. Specifically, we track whether a district was under takeover by year, when
the district transitioned to takeover, and if/when it was returned to local control. We define
“takeover” as an instance when the state assumes control of an entire district and responds by
either replacing all or part of the locally elected school board or superintendent with another
decisionmaker or decision-making body. We exclusively track districtwide takeovers not
takeovers of individual schools. The dataset also tracks variation in the type of takeover and
governance shift (e.g., whether it led to mayoral control, a state appointed board, a state
appointed superintendent, a jointly appointed board, etc.), as well as the rationale for the
takeover (e.g., low academic performance, financial mismanagement, allegations of corruption,
safety issues).
To create this dataset, we began by collecting existing studies of state takeover of
districts (Jochim, 2016; Morel, 2018; Oluwole & Green, 2009; Ziebarth, 2002) and used them to

STATE TAKEOVERS 9
generate an initial list of districts that scholars who have previously studied this topic have
identified as having ever been taken over. Each of these pre-existing reports focused on different
periods of time and none provided comprehensive coverage of the time period we study,
particularly the most recent takeovers in our study window that ultimately end up contributing to
our estimates of takeover effects.
We validated the dates that districts entered and exited takeover, the type of takeover, and
rationale for takeover using media reports and publicly available governmental records.
Specifically, we used Google News Advanced Search and Education Week Archives to search
for each individual takeover on our initial list. We then searched within these sources for state
takeovers more generally over the entire period and thoroughly combed through all news articles
to identify any takeovers that our other sources may have missed. Generally, we were able to
confirm the tracking provided by the other secondary reports. However, we made a handful of
changes based primarily on differences in the way we defined takeover or counted takeover start
and end dates (which we describe below).
Finally, we verified our list of takeover districts and entry and exit dates via email
communication with state education officials responsible for school accountability, turnaround,
or state takeover. We emailed education officials in states where we observed at least one
takeover or states that had takeover laws. This excluded states that did not have laws authorizing
district takeover (Jochim, 2016; Ziebarth, 2002). We emailed officials in 26 states and received
responses from 69 percent of these offices. These officials generally confirmed the accuracy of
our tracking, but we did learn of and add to our list three additional districts that we had not
included in our original tracking.

STATE TAKEOVERS 10
To define takeover timing, throughout the paper, we refer to an academic year by its
spring year. For example, 2014 refers to the 2013-14 school year. Similarly, we identify takeover
year as the spring of that academic school year. In other words, if the first year of takeover was
the 2011-12 school year, we refer to the first takeover year as 2012. More specifically, if the
takeover occurred between July 2011 and June 2012, we consider 2012 to be the first year of
takeover. However, it is possible that takeovers announced late in a school year will have a low
likelihood of being implemented until the next school year. Therefore, we confirm that our
results do not fundamentally shift if we code the next school year to be the first takeover year if a
takeover occurred between January and June (e.g., if we code the first takeover year as 2013 for
takeovers that occurred between January 2012 and June 2012).
Academic Outcomes and District Characteristics
Historically, a key challenge of estimating the effect of state takeover on student learning
has been the difficulty of making credible comparisons of district-level academic achievement
outcomes across states. This is because individual states have used a variety of annual
assessments – varying in form and difficulty – to measure annual progress. Measures of the
percentage of students considered proficient on these exams have known limitations given that
effects on these outcomes are dependent on underlying performance distributions (Ho, 2008).
The Stanford Education Data Archive (SEDA) (Reardon, Kalogrides, Ho, Shear, Shores
& Fahle, 2016) provides a solution to this problem since these data have been normed to the
National Assessment of Education Progress (NAEP) exam, allowing for cross-state achievement
comparisons. SEDA currently includes measures of third to eighth grade academic performance
in mathematics and English Language Arts (ELA) at the grade-district level across all states for
2009 to 2016. These test scores are standardized to the nationwide population of school districts.

STATE TAKEOVERS 11
In addition to academic outcomes, the SEDA also includes data compiled from the
federal Common Core of Data (CCD), American Communities Survey (ACS), and Small Area
Income Poverty Estimate (SAIPE). We use these data for our measures of district demographics
and educational inputs such as pupil-teacher ratio, total per pupil expenditures, the share of
expenditures spent on instruction, and the percent of public school students in charter schools.
For our analysis of takeover impact, we merge the SEDA Version 3.0 data with the
subset of our tracking data covering the time period included in the SEDA data (2009 to 2016).
We also merge in information on whether a district has ever been taken over by a state prior to
2016 (even if this occurred in the pre-2011 period). The resulting data are at the district-grade-
year level and include over 500,000 district-grade-year observations, covering over 15,000
districts spread out over the fifty states. For our analysis, we ultimately exclude districts in states
without statutes authorizing takeover, as well as districts that were taken over prior to 2011 and
therefore could be considered “treated” though we confirm that our findings are not a function of
these sample restrictions.
Finally, we supplement these data with information on additional state and district
characteristics. We construct an indicator for whether a state had passed a state takeover
authorization law, drawn from secondary sources (Jochim, 2016; Ziebarth, 2002; Morel, 2018;
Rutgers, 2006) and our own policy tracking. We also added state political characteristics
including measures of the partisanship of control over state legislatures and the governor’s office
from the National Council of State Legislators (2018) and Ballotpedia (2018). To examine the
relationship between takeover and fiscal factors, we merged data from the Annual Survey of
School System Finances (Census Bureau, 2018). These data allowed us to calculate the percent
of a district’s expenditures that came from state funding sources. Finally, to test whether district-

STATE TAKEOVERS 12
level policy changes could be driving results, we use data tracking the early implementation of
teacher evaluation systems from Bleiberg and Harbatkin (2020).
DESCRIBING STATE TAKEOVERS 1988 – 2016
We begin by describing the full universe of state takeovers. In Figure 1, we display the
number of takeovers that occurred in each year since the earliest takeovers in the late 1980s
through 2016, as well as the average length of takeovers by the first year of takeover. This figure
includes all takeovers but a version excluding takeovers that are ongoing post-2016 reveals the
same patterns. The top panel shows that takeover is a relatively rare event, occurring between
once and nine times per year. However, the use of takeovers has increased somewhat over time.
For example, we observe an average of 3.9 takeovers per year (1988-2010) and 5.8 takeovers per
year (2011-2016).
The bottom panel of Figure 1 illustrates that the average takeover length in a given year
ranges from one to 14 years. The only exception is 1990 in which a single long-lasting takeover
of New Jersey’s Jersey City Public Schools began. Across all years, the average takeover lasts
6.31 years, ranging from one to 28 years. The average length of takeovers in our analysis
window is somewhat shorter (five or fewer years) than the averages for previous years which are
more likely to be between five and 10 years (although in part this could be because the takeovers
in our analysis window are more likely to be ongoing).
In Figure 2 we show the states and regions where takeovers have been geographically
concentrated. In the top panel, we show that historically, takeovers have occurred in all major
regions of the U.S. (Northeast, South, Midwest, and West) but have been least common in the
West—particularly the Mountain West (i.e., Montana, Wyoming, Colorado, New Mexico, Utah)

STATE TAKEOVERS 13
and the Great Plains (i.e., the Dakotas, Nebraska, Kansas, Oklahoma). The greatest number of
takeovers have occurred in Mississippi (19) and Arkansas (11). There have also been a
significant number in California (9), Kentucky (9), Alabama (9), West Virginia (9), Illinois (8),
Pennsylvania (7), and Connecticut (6).
We further describe the sample in Table 1. Here we split up the complete universe of
takeover districts into those that were taken over before the 2011 – 2016 window covered by the
SEDA data (2009-2016) and those that occurred during that window and therefore contribute to
our estimates of the effect of takeover. We do this to assess the extent to which our analytic
sample of takeover districts is representative of the full population of takeover districts.
Therefore, the first column represents the 79 districts that were taken over prior to 2011 and the
second column includes the 35 districts that make up the treatment group in our analysis sample.
These treatment group districts are also listed by name and year of takeover in Appendix Table
A1. We do not include districts taken over in 2009 or 2010 in this group in order to preserve two
years of baseline measures for our treated districts used in the analytic strategy we describe
below. Column three includes only those districts that have never been taken over. For all
characteristics, we average across all years in the SEDA panel (2009-2016).
Takeover districts vary in important ways from districts that have never experienced
takeover. First, students of color and low-income students are overrepresented in these contexts.
For instance, on average, 57 percent of the students in takeover districts in our analysis sample
are Black compared to only 7 percent in the non-takeover districts. Similarly, 22 percent of
treated students in the analysis sample are Hispanic versus only 13 percent of students in the
non-takeover districts. On average, the recent takeover districts served a student population in
which 86 percent of students received free or reduced-price lunch while the average non-
STATE TAKEOVERS 14
takeover district served a population in which 48 percent received reduced-price lunch. Not
surprisingly given that state takeovers are known to target low-performing districts, on average,
these districts score a little more than a half of a standard deviation lower than the typical district
nationwide. All of these differences are statistically significant, as shown in column four.
We provide further visual evidence to explore the relative role of race and achievement in
predicting takeover. In Figure 3, we show the density of various percentages of Black students
among the takeover districts, illustrating that a large share of these takeover districts served
student populations in which three-quarters or more of the students are Black. In Figure 4, we
plot the percent of students in a district that are Black on the x-axis against baseline ELA (in the
top panel) and math (in the bottom panel) achievement on the y-axis, for takeover districts (in
black) and non-takeover districts (in grey). For the non-takeover districts, we have plotted a
random sample of districts so that the takeover districts can be visually identified more easily but
the patterns hold when we plot the full sample. Not surprisingly, overall, we observe a negative
relationship between achievement and the percent of a district student population that is Black
(shown on Figure 4 with a line of best fit), suggesting lower average levels of test-based
performance among districts serving high concentrations of Black students, on average.
However, this relationship is stronger in non-takeover than takeover districts. Among majority-
Black districts, we observe takeovers throughout the performance distribution whereas in
majority-non-Black districts, takeovers are concentrated in the bottom half of the performance
distribution. In other words, in districts serving fewer Black students, academic performance is
more predictive of takeover than it is in districts serving large populations of Black children.
This suggests that race is playing an important role in the process of selection for takeover,

STATE TAKEOVERS 15
above and beyond the academic performance of a given district, with majority-Black
communities at greater risk of being taken over.
Beyond their demographic makeup, takeover districts also tend to be situated in unique
policy and political contexts. For instance, they are more likely to receive a large share of their
funding from state sources. In our analysis sample, the average district received 61 percent of its
revenue from their state compared to 47 percent for the non-takeover districts. Takeover districts
are more likely to be found in urban contexts (25 percent of takeover districts versus 6 percent of
non-takeover districts). Takeover districts have a larger charter school sector, serving 7 percent
of students on average, compared to non-takeover districts, serving 1 percent. Finally, these
districts are more likely to be both led by a Republican governor and to have unified
government—the same party controlling both chambers of the legislature and the executive
branch—at the state level. Again, all of these differences are statistically significant. Our
descriptive results are generally consistent with previous research on this question that has
examined some of these characteristics of takeover districts such as share of revenue coming
from the state (e.g., Morel, 2018).
Perhaps surprisingly, state takeover is not exclusively a big city phenomenon. Only 25
percent of takeover districts are classified as urban. The average district in our analysis window
includes 3,972 students. This is not very large but is still larger than the average non-takeover
district which has 1,539 students. None of the districts in our analysis sample come close to
being in the top 100 largest districts in the country though such districts have historically been
subject to takeover in years prior to our analysis window (e.g., Detroit, MI).
Nearly all of the takeovers that occurred within our analysis window resulted in the
replacement of or loss of decision-making power for both the superintendent and the local school

STATE TAKEOVERS 16
board. Only eight takeovers resulted in either one or the other losing authority. The reasons for
takeover that were publicly provided in news coverage included fiscal mismanagement, poor
academic performance, noncompliance with state mandates, safety concerns, and under-
enrollment. However, there were very few districts in which there seemed to be a single stated
reason for takeover. Nearly all were described as having a host of these issues. Furthermore,
there’s a possibility that the avowed reason for a state takeover is related to the state authorizing
law regardless of state officials’ true motivations. In Appendix Table A2, we list all 28 states that
have passed laws allowing the takeover of entire districts and the rationale(s) for takeover that
each law permits. All but two of these states allow takeover in the event of persistent low
academic performance. Half allow takeover due to either poor academic performance or
financial mismanagement and two states only permit takeover in the event of financial issues.
The takeover districts in our analysis sample (2011 - 2016) are generally representative of
the full universe of takeover districts (1988 - 2016). In Table 1, we show that the main difference
between takeovers occurring after 2010 is that they targeted districts that were smaller (3,972
students on average) than the districts taken over prior to 2011 (serving 14,910 students),
however, this difference is not statistically significant (as shown in column five of Table 1).
Districts taken over prior to our window had a somewhat lower concentration of students
qualifying for subsidized lunch (81 versus 86 percent) and a higher concentration of Asian
students (2 versus 1 percent). They were also slightly lower achieving in ELA (-0.53 standard
deviations) than the pre-2011 takeover districts (-0.46 standard deviations), though this is hard to
assess given we are reliant on achievement data from the SEDA window (2009-2016) even for
those districts taken over in prior decades (i.e., before 2009) and this difference is not statistically
significant.

STATE TAKEOVERS 17
The bottom panel of Figure 2 shows that all four regions are represented in the analysis
sample but that there are seven takeover states not represented. Importantly, our analysis sample
does not include New Orleans, the one district that has experienced takeover in Louisiana and
that serves as a notable example of a takeover and districtwide turnaround that has been
rigorously studied and shown to have generated significant student achievement improvements
(Harris & Larsen, 2016; Harris & Larsen, 2018). New Orleans is not in our analysis sample
because this takeover occurred prior to 2011. Tennessee’s Achievement School District is also
not in our analysis sample because it includes schools from throughout the state and is not
identified as a district in the SEDA data. However, our analysis sample does include
Massachusetts’ Lawrence Public Schools, the other major positive proof point of state takeover
that has been previously evaluated (Schueler, Goodman & Deming, 2017).
ANALYZING THE EFFECT OF TAKEOVER 2011 – 2016
To study the overall effect of state takeover on academic achievement for the period
between 2011 and 2016, we conduct difference-in-differences analyses comparing the
achievement trends of takeover districts to the trends of comparable districts not experiencing
state takeover. In other words, we test whether the change in achievement for takeover districts
before versus after takeover was different than the change in achievement for districts that were
not under state control over the same time period. We rely on the following model:
!"#$% = () + (+,-./01/2#$% + 3# + 4$% + 5" + (67#" + 8"#$%
where Y is an outcome for grade g in district d in state s and year y. ,-./01/2#$% is a
binary indicator that equals one if a district was ever under takeover within our 2011-2016
analysis window and if the year is a post-takeover year. Therefore, (+ is the coefficient of

STATE TAKEOVERS 18
interest that allows us to assess the effect of takeover on our outcomes. We include district fixed
effects (3#) which flexibly provide the main effect of whether a district was ever taken over
within our analysis window (2011-2016) for the purpose of our difference-in-differences model
and control for time-invariant characteristics of school districts. State-by-year fixed effects (4$%)
control for state-level factors that change over time, other than takeover, that could influence
student achievement such as changes to state policy or collective bargaining laws, flexibilities
granted to states from the federal government, the rigor of state standards, and state-level
economic shocks. They also provide the main effect of year for the purpose of our difference-in-
differences model. Grade fixed effects (5") ensure that we are comparing students in the same
grade levels as our data are at the district-grade-year level (though our results are not sensitive to
the inclusion of grade fixed effects). Given takeover districts are likely selected on the basis of
low-performance we control for pre-2011 baseline math and ELA performance at the district-
grade level (7#"). In short, we estimate whether the change in outcomes before and after
takeover is different for takeover districts than for similarly achieving districts that were not
subject to takeover over the same period. We cluster standard errors at the district level given
this is the unit assigned to treatment. We run all models on a sample excluding those previously-
treated districts that were taken over prior to 2011 as well excluding districts in states without
takeover laws (where takeover is therefore not possible).
Importantly, the above model pools all post-takeover years to calculate the average effect
of takeover. These pooled estimates are accompanied by results based on event-study models
where we replace the main effect of takeover with separate indicators for each year leading up to
and after takeover interacted with an indicator for whether the district was taken over. The event-
study models take the following form:

STATE TAKEOVERS 19
!"#$% = () +: ,-./01/2#$%;
<=>;+3# + 4$% + 5" + (67#" + 8"#$%
Here, ∑ ,-./01/2#$%;<=>; represents a series of indicators for the number of years since
takeover, centered on and omitting the year prior to takeover, for all six cohorts of takeovers that
occur within our analytic window between 2011 and 2016. We observe a maximum of seven pre-
takeover years for the 2016 cohort (pre-takeover year -6 through pre-takeover year 0) and a
maximum of six post-takeover years for the 2011 cohort (takeover year 1 through takeover year
6). These post-takeover indicators allow us to assess the effect of takeover by the number of
years of exposure to the reform. We include and highlight the event study results because the
question of whether the effect of takeover changes over time is substantively interesting and
because the event study specification allows us to transparently test whether pre-trend
assumptions hold by examining the coefficients on the pre-takeover indicators.
Additionally, the methodological literature on difference-in-differences approaches to
policy evaluation has rapidly progressed in recent years, suggesting that bias can arise in
situations with multiple time periods and variation in treatment timing, particularly when relying
on models estimating only two time periods (“pre” and “post”) (e.g., Callaway and Sant’Anna,
2020; Sun and Abraham, forthcoming). First, such pooled difference-in-difference estimates can
be biased when treatment effects vary across time (Goodman-Bacon, 2018; Baker, Larcker &
Wang, 2021; Sun and Abraham, forthcoming). Therefore, rather than simply presenting pooled
difference-in-differences estimates with only two time periods (“pre” and “post”), we present
and indeed privilege event study models that estimate effects by year of treatment, overall and
separately by cohort. An additional source of bias stems from the use of already-treated units as
controls (Goodman-Bacon, 2018). We address this possibility by first excluding districts from
our analytic sample that were taken over prior to our analysis window. Finally, we estimate our

STATE TAKEOVERS 20
models separately for each of the six cohorts of takeover districts (2011-2016), excluding all
other ever-treated districts from our sample and examine the extent to which patterns are
consistent across cohorts.
STATE TAKEOVER IMPACTS 2011 – 2016
Academic Achievement Effects
Overall, we find no evidence that state takeover improves academic achievement. We
display results from our difference-in-differences estimates pooling all post-takeover years in
Table 2. For ELA achievement, takeover has a moderate negative effect on ELA achievement on
the order of 0.05 standard deviations, though this estimate does not quite achieve statistical
significance (p=0.10). Given we know that these pooled estimates can be biased away from the
true effects when there is variation in treatment timing, we turn to the results from our event
study specification in which we include separate indicators for each pre- and post-takeover year
(displayed in Table 3). Here we find negative effects concentrated in years two and three. There
is some evidence of a bounce back to pre-takeover levels by year five, though not a statistically
significant improvement relative to the pre-takeover period, and a suggestive decline again in
year six. The estimate for year one is also negative in direction (-0.03) but does not achieve
statistical significance.
We have greater confidence in our estimates for the first three years of takeover than for
years four through six given we have an unbalanced panel and larger samples of treated districts
contributing to these results. In other words, for all 35 takeover districts in our window, we
observe the first year of takeover. However, for takeovers that occurred toward the end of our
window (e.g., 2015), we do not observe outcomes in the later years of takeover. In the last

STATE TAKEOVERS 21
column of Table 3 we show the number of treated districts that contribute to each of our
estimates. For years one through three, this is 24 districts or more. In year four, this declines to
18 districts and continues declining through year six for which we observe only four districts that
were taken over in 2011 and were therefore under takeover for six years within our window.
We do not find strong evidence of a takeover effect on math achievement. When pooling
all post-takeover years, we find takeover decreases test performance on the order of 0.04
standard deviations. However, this effect does not achieve statistical significance. When we
break out the results by year using the event study approach, we again observe small, non-
significant, negative effects in years one through four of takeover ranging from -0.03 to -0.04
depending on the number of years of takeover exposure. There is suggestive evidence of
improvement in math by year five (0.07) and six (0.03) but neither of these coefficients reach
statistical significance and again are based on a smaller number of treated districts (ten for year
five and four for year six).
In Figure 5 we plot the coefficients from our event study specification which—for
ELA—provide visual evidence of a break from the pre-treatment trend in outcomes after
takeover, a recovery of test scores in the fifth year of takeover and a decline again in year six.
The bump in year five has visual impact but, again, it is important to keep in mind that this
estimate is both based on a mere ten treated districts and is not statistically different from zero.
We find the scores in years one to three more informative of average takeover effects given the
larger sample size of treated districts contributing to these means. For math, Figure 5 again
provides some evidence of a small initial decline followed by recovery in years five and six but
also illustrates that these coefficients are all estimated imprecisely (the farther out from takeover,
the more imprecise).

STATE TAKEOVERS 22
To formally test whether or not we observe pre-takeover achievement trends, we examine
the coefficients on the pre-takeover indicators displayed in Table 2 and plotted in Figure 5. We
do not observe any statistically significant “effects” in the years leading up to takeover in either
subject. Furthermore, in ELA, the magnitude of the pre-takeover coefficients is never larger than
the magnitude of effects in the post-takeover years. The one exception is year negative six for
which we find evidence of a pre-treatment “effect” in both subjects. However, we do not view
this as a major threat to the validity of the post-takeover estimates as it is based on the single
cohort for which we observe year negative six (the cohort of six districts taken over in 2016).
This is also a cohort for which we only observe one post-takeover year (and therefore does not
contribute to the estimates of years two through six of takeover). We discuss the cohort models
in more detail below.
We detect no visual evidence in either subject of a substantial short-term decline in test
scores in the year prior to takeover—an “Ashenfelter’s dip”—which could be inflating our
results due to mean reversion or suggesting that takeover districts were already experiencing
performance declines relative to similar districts leading up to treatment (Ashenfelter, 1978). We
also conduct a test in the spirit of a Granger causality check (Angrist & Pischke, 2009) by
running an event study model without controls and find that none of the coefficients on the pre-
treatment year estimates for year negative five to negative one approach statistical significance.
The coefficients in the pre-takeover years farthest away from takeover do increase somewhat
(from year negative five to negative three) in both subjects. However, the pre-takeover years
leading up to intervention (years negative three to negative one) remain relatively consistent in
magnitude, suggesting that the post-takeover effects are not an artifact of a pre-trend in the years
leading up to takeover.

STATE TAKEOVERS 23
To further probe the pre-trends assumption, we estimate a comparative interrupted time
series model where we include a linear time trend (“Year”) as well as our treatment indicator and
an interaction between an indicator for being taken over and the linear time trend. We display the
results in Appendix Table A3, showing that our estimates of the treatment effects are robust to
this specification. With this specification, the negative results become larger (-0.07 standard
deviations) and statistically significant for both subjects. The insignificance and small magnitude
of the interaction between the takeover indicator and the linear time trend imply there is no
significant difference in the pre-treatment trend between the treatment and control group.
To examine the role that each cohort plays in driving the post-takeover effects, we
estimate a version of our model where we include separate pre- and post-takeover indicators by
year for each of the six cohorts contributing to our estimates and display the results in Table 4. In
ELA, we observe no significant pre-treatment coefficients for four of the six cohorts. One of the
two cohorts with significant pre-takeover “effects” is the 2016 cohort, which again, only
contributes to our estimates of the first year of takeover. All but one cohort (2012) reflects a
pattern of negative post-takeover effects and the apparent ELA improvement in year five is
driven entirely by the 2012 cohort. In short, these results provide confidence that the results for
years one through three of takeover are not driven by any one cohort. In math, the patterns of
results are more mixed by cohort, but overall, Table 4 supports our conclusion that there is no
strong evidence that state takeover, on average, has a significant effect on math scores in one
direction or the other.
We also illustrate that our results are not due to changes in missingness for our outcomes
or district-grade observations over time. In Appendix Table A4, we show that state takeover does
not predict a change in the likelihood of a district-grade observation missing an ELA or math test

STATE TAKEOVERS 24
score value when using the pooled difference-in-differences model with test score missingness as
the outcome. When we examine the effect of takeover on test score missingness using the event
study model, we do not find evidence of a differential change in missingness. The one exception
is takeover year five for ELA in which we observe a slight increase in missingness. Interestingly,
year five is the only year for which we observe a positive (though statistically insignificant)
coefficient on ELA test scores.
Finally, we explore whether other time varying district-level policies, besides state
takeover, could be explaining our results. While most major relevant policy changes over this
period were occurring primarily at the state level (e.g., adoption of Common Core State
Standards), one exception was the introduction of a new generation of teacher evaluation systems
that were encouraged and piloted in certain districts in response to the federal Race to the Top
competitive grant program. We estimate a version of our models where we replace state-year
fixed effects with separate state and year fixed effects and then control for time-varying
indicators of district-level teacher evaluation policy adoption based on Bleiberg and Harbatkin’s
(2020) tracking of teacher evaluation policy diffusion. Results are displayed in Appendix Table
A5. Our findings remain unchanged. Furthermore, given that state takeover is a relatively all-
encompassing reform, to the extent that it is correlated in time with other district-level policy
changes, it is likely that those policy changes are the result of takeover itself. We would view
these other policy changes as a mechanism through which takeover influences student outcomes
and therefore not a threat to the validity of our inferences about takeover.
Heterogeneity of Achievement Effects
In Figure 6 we illustrate that the effect of state takeover on academic achievement is far
from uniform. To generate this figure, we ran a modified version of our pooled model with

STATE TAKEOVERS 25
indicators for each individual treated district interacted with an indicator for whether it was a
post-takeover year. Our model is otherwise the same as the model described above. We then plot
the coefficients for each takeover district sorted from most negative to most positive for ELA in
the top panel and math in the bottom panel.
While roughly half of districts saw negative effects in ELA, there were several districts
that experienced virtually no change in outcomes. In both subjects, a handful of districts saw
non-trivial positive impacts in the aftermath of takeover. We would caution against attaching
much meaning to the specific rank order of districts given the precise order is sensitive to
modelling choices and sample restrictions. However, Lawrence, Massachusetts is an interesting
case where we observe positive gains in both subjects (though larger in math than ELA). This
finding is notable because Lawrence is one of the few takeover districts in our sample that has
been studied in the period overlapping our analysis window and previous studies have identified
it as a positive proof point for state takeover, consistent with our findings here (Schueler,
Goodman & Deming, 2017; Schueler, 2018).
To test for patterns in the heterogenous effects, we examined whether effects varied by a
number of baseline district-level characteristics, including the racial and ethnic makeup of a
district, the percent of students qualifying for subsidized meals and English language learner
services, baseline achievement and district size (i.e., number of students). We display the results
in Table 5, showing that, in both ELA and math, takeovers had smaller effects in districts serving
a greater share of Hispanic students. In other words, these findings suggest that takeover has a
greater potential to be beneficial in districts serving larger concentrations of Latinx students. The
effects are also smaller in districts with a larger share of students classified as English Language
Learners (though only the interaction for ELA is statistically significant). In both subjects, we

STATE TAKEOVERS 26
find that the negative effects of takeover were larger in districts with higher baseline test scores.
The effect of takeover does not appear to vary based on the percent of students qualifying for
subsidized lunch, the size of the district, or whether the stated rationale for takeover was
unrelated to academic performance based on our tracking.
Effects on District Enrollment and Demographics
We also examine whether the effects of takeover are driven by changes to the
composition of the districts under study. In other words, we wanted to know whether—for
example—these effects could be due to families leaving or entering takeover districts due to
takeover. In Table 2, we show the results from a series of regressions where we run our pooled
difference-in-differences models but replace test score outcomes with a variety of district
characteristics. Overall, we find no strong evidence that changes in the size or demographic
makeup of treated districts are driving our conclusions. We observe a small effect of takeover on
the number of students enrolled in a district (by approximately193 students on average), on the
percent of students who are Black or classified as English Language Learners (by half a
percentage point in both cases), and the percent of students qualifying for subsidized lunch (by
1.75 percentage points). However, when we examine the effect of takeover on demographic
characteristics in an event study framework (results displayed in Table 6), it is not clear whether
or not these changes are due to pre-trends leading up to takeover. We find no evidence takeover
significantly shifted the percent of Hispanic students served by takeover districts relative to
comparison districts or altered the rate at which districts were classifying students as in need of
special education services.
Effects on Educational Inputs

STATE TAKEOVERS 27
To examine possible mechanisms for the effect of state takeover, we examine the extent
to which takeover in the 2011 to 2016 period had an effect on major education inputs. We
display results from pooled difference-in-differences estimates in Table 2 and from event study
estimates in Table 7. We find no strong evidence that takeover changed average class sizes, the
size of the charter sector or overall per pupil expenditures. For all three outcomes, the
coefficients are positive both overall and for any given takeover year but are rarely statistically
significant. The one exception is that takeover appears to have increased the charter sector share
by 2.83 percentage points (when pooling all post-takeover years), however, we also observe
statistically significant “effects” on the size of the charter sector in several pre-takeover years
and therefore cannot rule out the possibility that these impacts are due to pre-trends. In other
words, there is no strong evidence that the results are due to a major increase in class sizes, the
charter market share, or major reductions in educational spending.
DISCUSSION
State takeover of struggling school systems has become an increasingly common policy
response in the event of persistent districtwide underperformance, particularly as a range of
observers have pointed to school board dysfunction as a potential cause for chronic low
achievement. However, there has been little empirical evidence to shed light on the average
impact of governance reforms that shift authority from local school boards to state governments.
This is a particularly concerning gap in the literature given that the Every Student Succeeds Act
now provides states with greater autonomy over turnaround policies and requires them to use
federal funds for turnaround policies that are backed by federally-defined evidence standards

STATE TAKEOVERS 28
(Levesque, 2016; West, 2016). States therefore have a substantial need for research on state-level
takeover and turnaround policy.
To address this need, we provide a systematic tracking and description of state takeovers
nationally from the first takeovers in the late 1980s through 2016. We show that takeovers have
become more common and shorter over time, are not an exclusively big city phenomenon, and
tend to occur in districts with larger charter sectors. The latter finding could suggest that there is
overlap in the political forces and community of educational reform-oriented entrepreneurs
exerting influence in these districts. Perhaps most interestingly, districts serving larger
concentrations of African American students tend to be more likely targets for takeover
regardless of the academic performance of these systems. This is something previous studies
have not been able to examine given the lack of comparable performance metrics across states.
Beyond describing takeovers, this study examines the effect of state takeover on
academic achievement and key educational inputs in the post-No Child Left Behind era. On
average, we find no strong evidence that takeover produces benefits for student academic
achievement in ELA or math, at least in the short run, and evidence that it is typically disruptive
for student ELA achievement in the early years of takeover. The magnitude of the effects on
short term ELA performance are not trivial—about ten percent of the gap between students
eligible and ineligible for subsidized lunch in eighth grade reading on the National Assessment
of Educational Progress (NAEP) (Hill, Bloom, Black, Lipsey, 2007). We find no strong evidence
of causal impacts on class size, charter market share, or educational spending. While we argue
that the negative effects are non-trivial in size, even a null finding is important in this case given
the extreme step of state takeover is often made on the promise of rapid performance
improvements. Additionally, we observe suggestive evidence that takeover could produce

STATE TAKEOVERS 29
benefits in the longer term but are less confident in these results given they are based on a small
subset of districts and more sensitive to modelling choices and sample restrictions. Future
research should therefore shed additional light on the longer-term impacts of takeover which
could potentially improve performance in the long-run despite short-term disruptions.
Importantly, we find a nontrivial amount of heterogeneity from district to district in the
effect of takeover on academic achievement. Unfortunately, the existing case study literature of
district takeovers does not provide much in the way of consistent patterns that would help to
explain the heterogeneity of effects. This is in part because there is variation across these cases
studies in terms of the characteristics of the districts under takeover, the policy interventions that
leaders took in the aftermath of takeover, and the academic outcomes these cases produced. For
instance, Henry, Pham, Kho and Zimmer (2020) find that high teacher turnover in Tennessee’s
state-run Achievement School District helped to explain why the effects weren’t more positive,
and in Lawrence, leaders erred on the side of retaining teachers and generated benefits. In
contrast, in New Orleans, nearly all teachers were let go and the reforms resulted in large
academic gains. One might wonder about the role of charter operators. New Orleans converted
all schools to charter status and produced positive results. Similarly, in Newark, shifting
enrollment from low-performing traditional public schools to higher-performing charter schools
improved district outcomes. However, Lawrence was able to make notable improvements
without converting schools to charter status and charters played a major role in the Tennessee
Achievement School District reforms which produced disappointing outcomes. In terms of
district baseline characteristics, Lawrence is the one impact evaluation case study featuring a
majority-Latinx district, although the other positive proof point, New Orleans, serves a majority-
Black student population. In both subjects, our study finds that the negative effects were smaller

STATE TAKEOVERS 30
in the districts that were the lowest performing at baseline but with the existing data we cannot
provide much information about the mechanisms at play. A key direction for future research
would be to better explain this heterogeneity. One possibility is that there is an interaction
between the contextual characteristics of districts and the intervention features needed to
generate improvement. Another possibility is that the case studies are not representative of
average takeovers.
Interestingly, the heterogeneity in takeover effects seems to be at the district rather than
state level. For example, Mississippi and Arkansas are home to both positive and negative
outliers in terms of the achievement effects of its various takeovers. This suggests that state
capacity or other state level factors may not be the primary (or at least are not the only) factors
that explain why some takeovers are successful and others are not. Unpacking these questions
may require the collection of new data describing these districts and the features of the reforms
that were undertaken in the aftermath of takeover. One promising approach would be to study
these states with both positive and negative cases in more detail to try to understand why some
were more successful than others.
We do find that these negative takeover effects were smaller in districts serving larger
Hispanic student populations. Unfortunately, we are unable with the existing data to say much
about why this is the case, but previous research may provide some clues. Our finding on the
differences in the effectiveness of takeovers of districts serving majority-African American vs.
majority Latinx student populations aligns with Morel’s (2017) findings on the effects of
takeover on local descriptive political representation. He finds that takeovers of majority-Black
districts lead to a loss of local Black political power whereas takeovers of majority-Latinx
districts are more often followed by an increase in Latinx local political representation. It is

STATE TAKEOVERS 31
possible that this dynamic could help explain the mechanisms through which takeover harms
academic outcomes given our parallel findings, especially since others have found that increases
in non-white political representation on school boards leads to increased spending on and
academic achievement of non-white students (Kogan, Lavertu & Peskowitz, 2020; Fischer,
2020). Interestingly, in a meta-analysis of studies of reforms designed to improve low-
performing schools, Schueler, Asher, Larned, Mehrotra and Pollard (2020) also find that the
benefits from these reforms have been concentrated in majority Latinx contexts. Regardless of
the mechanisms, these two studies together suggest that takeover is particularly risky for both the
adults and children in majority-African American communities.
From a policy perspective, although our findings suggest that there are some cases in
which state takeover can result in immediate gains for kids, this does not appear to be true on
average, at least in the period from 2011 to 2016. These results do not provide support for the
theory that school board governance is the primary cause of low academic performance in
struggling school districts. Notably, we find that the main takeover that both occurred within our
analysis window and that has been previously evaluated, Massachusetts’ Lawrence Public
Schools, is an outlier demonstrating positive effects of takeover in both reading and math. This
finding illustrates why researchers should remain cautious about drawing conclusions from
single case studies about state takeover as a reform strategy more generally. Similarly, before
learning what makes a state takeover more or less successful, policymakers should be careful
about deploying takeover as a strategy for improving academic achievement, particularly in
contexts that differ on important dimensions from those rare districts that have demonstrated
positive results.

STATE TAKEOVERS 32
REFERENCES
Angrist, J. & Pischke, J. (2009). Mostly harmless econometrics. Princeton, NJ: Princeton
University Press.
Anzia, S. (2014). Timing and turnout: How off-cycle elections favor organized groups. The
University of Chicago Press.
Baker, A., Larcker, D. & Wang, C. (2021). How much should we trust staggered difference-in-
differences estimates? Working paper:
https://papers.ssrn.com/sol3/papers.cfm?abstract_id=3794018
Beckett-Camarata, J. (2004). Identifying and coping with fiscal emergencies in Ohio local
governments. International Journal of Public Administration. 27(8-9), 615-630.
Berry, C. & Howell, W. (2005). Democratic accountability in public education. In W. Howell
(Ed.), Besieged: School boards and the future of education politics. Washington, DC: Brookings
Institution Press.
Bleiberg, J. and Harbatkin, E. (2020). Teacher evaluation reform: A convergence of federal and
local forces. Educational Policy, 34(6), 918-952.

STATE TAKEOVERS 33
Callaway, B. and Sant’Anna, P. (2020). Difference-in-differences with multiple time periods.
Journal of Econometrics. https://doi.org/10.1016/j.jeconom.2020.12.001
Chin, M., Kane, T., Kozakowski, W., Schueler, B. and Staiger, D. (2018). School district
reform in Newark: Within- and between-school changes in achievement growth. Industrial and
Labor Relations Review, 72(2), 323-354.
Duncan, G. & Murnane, R. (2011). Whither opportunity? Rising inequality, schools, and
children’s life chances. New York, NY: Russell Sage.
Finn, C. (1991). Reinventing local control. Education Week.
Finn, C. & Keegan, L. (2004). Lost at sea. Education Next, 4(3), 15-17.
Fischer, B. (2020). No spending without representation: School boards and the racial gap in
education finance. Working Paper: https://drive.google.com/file/d/1sCJJgaku4OUVNrrV3Z1V-
w65GJImAFfB/view
Gill, B., Zimmer, R., Christman, J., & Blanc, S. (2007). State takeover, school restructuring,
private management, and student achievement in Philadelphia. Santa Monica, CA: RAND
Corporation.

STATE TAKEOVERS 34
Goodman-Bacon, A. (2018). Difference-in-differences with variation in treatment timing.
National Bureau of Economic Research Working Paper No. 25018.
Greenblatt, A. (2018). The problem with school takeovers. Governing. Accessed at:
https://www.governing.com/topics/education/gov-school-takeovers-newark-new-jersey.html
Harris, D., & Larsen, M. (2016). The effects of the New Orleans Post-Katrina school reforms on
student academic outcomes. Education Research Alliance for New Orleans.
Harris & Larsen (2018). The effects of the New Orleans post-Katrina market-based school
reforms on student achievement, high school graduation, and college outcomes. New Orleans,
LA: Tulane University, Education Research Alliance for New Orleans.
Henig, J., Hula, R., Orr, M. & Pedescleaux, D. (1999). The color of school reform: Race,
politics, and the challenge of urban education. Princeton, NJ: Princeton University Press.
Henig, J. (2009). Mayors, governors, and presidents: The new education executives and the end
of educational exceptionalism. Peabody Journal of Education, 84(3), 283-299.
Henig, J. (2013). The end of exceptionalism in American education. Cambridge, MA: Harvard
Education Press.

STATE TAKEOVERS 35
Henig, J., Jacobsen, R. & Reckhow, S. (2019). Outside money in school board elections.
Cambridge, MA: Harvard Education Press.
Henry, G.. Pham, L., Kho, A. and Zimmer, R. (2020). Peeking into the black box of school
turnaround: A formal test of mediators and suppressors. Educational Evaluation and Policy
Analysis, 42(2), 232-256.
Hess, F. & Leal, D. (2005). School house politics. In W. Howell (Ed.), Besieged: School boards
and the future of education politics. Washington, DC: Brookings Institution Press.
Hess, F. & Meeks, O. (2013). Rethinking district governance. In P. Manna and P. McGuinn
(Eds.), Education governance for the twenty-first century: Overcoming the structural barriers to
school reform. Washington, DC: Brookings Institution Press.
Hill, Bloom, Black, & Lipsey (2007). Empirical Benchmarks for Interpreting Effect Sizes in
Research. MDRC Working Papers on Research Methodology.
Ho, A. (2008). The problem with “proficiency”: Limitations of statistics and policy under No
Child Left Behind. Educational Researcher, 37(6), 351-360.
Howell, W. (2005). Introduction. In W. Howell (Ed.), Besieged: School boards and the future of
education politics. Washington, DC: Brookings Institution Press.

STATE TAKEOVERS 36
Huh, K., Fehr, S. & Murphy, M. (2013). The state role in local government financial distress.
Washington, D.C.: Pew.
Iannaccone, L. & Lutz, F. (2006). The crucible of democracy: The local arena. Politics of
Education Association Yearbook 1994, 39-52.
Jochim, A. (2016). Measures of last resort: Assessing strategies for state-initiated turnarounds.
Center for Reinventing Public Education.
Kirst, M. (2004). Turning points: A history of American school governance. In N. Epstein (Ed.),
Who’s in charge here? The tangled web of school governance and policy. Washington, D.C.:
Brookings Institution Press.
Kirst, M. & Wirt, F. (2009). The political dynamics of American education. Richmond, CA:
McCutchan Publishing.
Kogan, V. Lavertu, S. & Peskowitz, Z. (2020). How does minority political representation affect
school district administration and student outcomes? Annenberg Institute EdWorking Paper No.
20-244.
Lafortune, J., Rothstein, J., & Schanzenbach, D. W. (2018). School finance reform and the
distribution of student achievement. American Economic Journal: Applied Economics, 10(2), 1-
26.

STATE TAKEOVERS 37
Levesque, E. (2016). School turnaround under ESSA: Progress, but not a silver bullet.
Brookings. Accessed at: https://www.brookings.edu/blog/brown-center-
chalkboard/2016/10/31/school-turnaround-under-essa-progress-but-not-a-silver-bullet/
Maeroff, G. (2010) School boards in America: A flawed exercise in democracy. New York, NY:
Palgrave MacMillan.
Mann, E. (2016). School turnaround under ESSA: Progress, but not a silver bullet. The
Brookings Institute. https://www.brookings.edu/blog/brown-center-
chalkboard/2016/10/31/school-turnaround-under-essa-progress-but-not-a-silver-bullet/
Manna, P. & McGuinn, P. (2013). The tall task of education governance reform. In P. Manna
and P. McGuinn (Eds.), Education governance for the twenty-first century. Washington, DC:
Brookings Institution Press.
Miller, M. (2008). First, kill all the school boards. The Atlantic.
Moe, T. (2005). Teachers unions and school board elections. In W. Howell (Ed.), Besieged:
School boards and the future of education politics. Washington, DC: Brookings Institution Press.
Moe, T. (2011). Special interest: Teachers unions and America’s public schools. Washington,
DC: Brookings Institution Press.

STATE TAKEOVERS 38
Morel, D. (2018). Takeover: Race, education, and American democracy. New York, NY: Oxford
University Press.
Oluwole, J. & Green, P. (2009). State takeovers of school districts: Race and the equal protection
clause. Indiana Law Review, 42, 343-409.
Parker, E. (2016). 50-state review: Constitutional obligations for public education. Education
Commission of the States. https://www.ecs.org/wp-content/uploads/2016-Constitutional-
obligations-for-public-education-1.pdf
Peterson, P. (2016). The end of the Bush-Obama regulatory approach to school reform.
Education Next, 16(3), 22-32.
Reardon, S. (2011). The widening academic achievement gap between the rich and the poor:
New evidence and possible explanations. In G. Duncan, G. and R. Murnane (Eds.), Whither
opportunity? Rising inequality, schools, and children’s life chances. New York, NY: Russell
Sage.
Reardon, S., Kalogrides, D., Ho, A., Shear, B., Shores, K. & Fahle, E. (2016). Stanford
Education Data Archive (Version 1.1). http://purl.stanford.edu/db586ns4974.

STATE TAKEOVERS 39
Resnick, M. & Bryant, A. (2010). School boards: Why American education needs them. Phi
Delta Kappan, 91(6), 11-14.
Schueler, B., Goodman, J. & Deming, D. (2017). Can states take over and turn around school
districts? Evidence from Lawrence, Massachusetts. Educational Evaluation and Policy Analysis,
39(2), 311-332.
Schueler, B. (2018). A third way: The politics of school district takeover and turnaround in
Lawrence, Massachusetts. Educational Administration Quarterly. 1-38.
Schueler, B. & West, M. (2019). Federalism, race, and the politics of turnaround: U.S. public
opinion on improving low-performing schools and districts. (EdWorkingPaper: 19-129).
Retrieved from Annenberg Institute at Brown University:
http://www.edworkingpapers.com/ai19-129
Schueler, Asher, Larned, Merotra & Pollard (2020). Improving low-performing schools: A meta-
analysis of impact evaluation studies. (EdWorkingPaper 20-274). Retrieved from Annenberg
Institute at Brown University: https://doi.org/10.26300/qxjk-yq91
Stone, C., Henig, J., Jones, B., & Pierannunzi, C. (2001). Building civic capacity: The politics of
reforming urban schools. Lawrence: University Press of Kansas.
Tyack, D. (1974). The one best system. Cambridge, MA: Harvard University Press.

STATE TAKEOVERS 40
Sun, L. and Abraham, S. (forthcoming). Estimating dynamic treatment effects in event studies
with heterogenous treatment effects. Journal of Econometrics. Working paper:
http://economics.mit.edu/files/14964
West, M. (2016). From evidence-based programs to an evidence-based system: Opportunities
under the Every Student Succeeds Act. Brookings. Accessed at:
https://www.brookings.edu/research/from-evidence-based-programs-to-an-evidence-based-
system-opportunities-under-the-every-student-succeeds-act/
Wong, K. & Shen, F. (2002). Politics of state-led reform in education: market competition and
electoral dynamics. Educational Policy, 16: 161.
Wong, K. & Shen, F. (2003). Measuring the effectiveness of city and state takeover as a school
reform strategy. Peabody Journal of Education, 78(4), 89-119.
Wong, K., Shen, F., Anagnostopoulos, D. & Rutledge, S. (2007). The education mayor:
Improving America’s schools. Washington, D.C.: Georgetown University Press.
Wong, K. (2013). Education governance in performance-based federalism. In P. Manna and P.
McGuinn (Eds.), Education governance for the twenty-first century. Washington, D.C.:
Brookings Institution Press.

STATE TAKEOVERS 41
Ziebarth, T. (2004). State takeovers and reconstitutions. Education Commission of the States
Policy Brief.
Zimmer, R., Henry, G., & Kho, A. (2017). The effects of School Turnaround in Tennessee’s
Achievement School District and Innovation Zones. Educational Evaluation and Policy Analysis,
39(4), 670-696.
STATE TAKEOVERS 42
Figure 1. Number of Takeovers and Average Length of Takeover by Year.
02
46
810
Num
ber o
f Tak
eove
rs
1989 1992 1995 1998 2001 2004 2007 2010 2013 2016
N of Takeovers Fitted values
Number of Takeovers by Year0
510
1520
2530
Year
s U
nder
Tak
eove
r
1989 1992 1995 1998 2001 2004 2007 2010 2013 2016First Takeover Year
Takeover Length Fitted values
Average Length of Takeover

STATE TAKEOVERS 43
Number of Takeovers: 1988 – 2016
Number of Takeovers: 2011 – 2016
Figure 2. Number of Takeovers by State.

STATE TAKEOVERS 44
Table 1. Characteristics of Districts by Takeover Status and Timing (1) (2) (3) (4) (5)
Taken Over 1988-2010
Taken Over 2011-2016
Never Taken Over
Diff. (2) - (3)
Diff. (1) - (2)
Sample Size N of states 23 14 50 N of districts 79 35 13,561 District Student Demographics Asian 0.02 0.01 0.02 -0.01 0.01* Black 0.47 0.57 0.07 0.49*** -0.10 Hispanic 0.18 0.22 0.13 0.09** -0.04 Native American 0.01 0.00 0.03 -0.03 0.01 White 0.31 0.21 0.74 -0.54*** 0.10 Subsidized Lunch 0.81 0.86 0.48 0.37*** -0.05** English Language Learner 0.07 0.08 0.04 0.03** -0.01 Special Education 0.15 0.14 0.15 -0.00 0.01 District Characteristics N of tested students 14,910 3,972 1,539 2,433** 10,938 Percent in charter schools 0.09 0.07 0.01 0.06*** 0.02 Pupil teacher ratio 15.20 14.77 14.18 0.59 0.43 Per pupil expenditures 15,688 14,315 15,190 -875 1,373 Percent revenue from state 0.54 0.61 0.47 0.13*** -0.07 Urban 0.23 0.25 0.06 0.19*** -0.02 Percent of adults with B.A. 0.17 0.15 0.23 -0.08*** 0.02 Percent unemployed 0.12 0.12 0.08 0.05*** 0.00 District Average Achievement Standardized math scores -0.53 -0.55 0.02 -0.57*** 0.02 Standardized ELA scores -0.46 -0.53 0.03 -0.56*** 0.07 Percent missing test scores 0.08 0.03 0.05 -0.02 0.05 State Characteristics, 2009 Unified government 0.29 0.40 0.27 0.13** -0.11 GOP governor 0.50 0.46 0.53 0.07 0.04 GOP governor, unified gov't 0.20 0.40 0.14 0.25*** -0.20
Note: Student and district characteristics represent district averages over all years in our SEDA panel (2009 through 2016). Per pupil expenditures represent average annual spending in dollars. Percent missing test scores represent the percent of districts in each category missing districtwide test scores. *** p<0.01, ** p<0.05, * p<0.10.
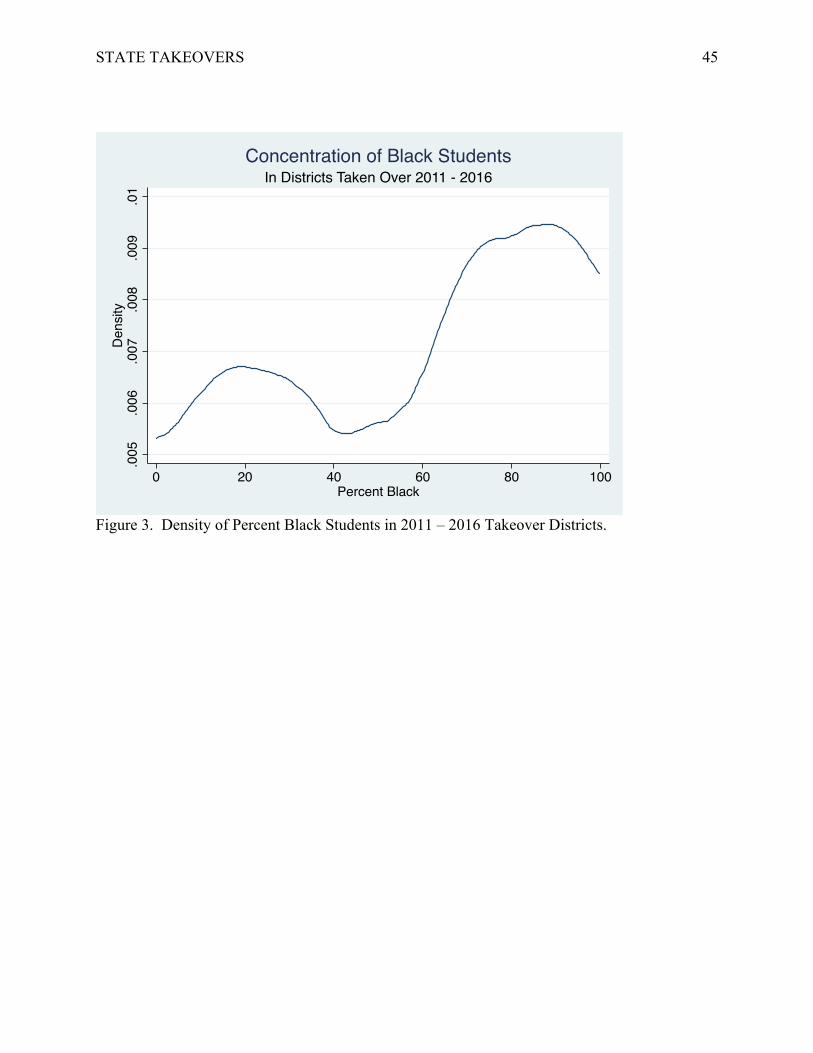
STATE TAKEOVERS 45
Figure 3. Density of Percent Black Students in 2011 – 2016 Takeover Districts.
.005
.006
.007
.008
.009
.01
Dens
ity
0 20 40 60 80 100Percent Black
In Districts Taken Over 2011 - 2016Concentration of Black Students

STATE TAKEOVERS 46
Figure 4. Performance Versus Percent Black in Takeover and Never Taken Over Districts.

STATE TAKEOVERS 47
ELA Math
Enrollment (N of
Students)Percent Black
Percent Hispanic
Percent Subsidized
Lunch
Percent English
Language Learners
Percent Special
Education
Class Size (N of
Students)
Percent in Charter Schools
Per Pupil Spending
Takeover -0.05 -0.04 -192.60* -0.50* 0.12 -1.75*** 0.50** -0.01 0.37 2.83*** 658.90(0.03) (0.04) (108) (0.30) (0.33) (0.56) -0.23 (0.25) (0.24) (1.04) (685.70)
N of Observations 337,386 326,064 338,540 338,540 338,540 338,540 321,392 333,687 327,995 298,301 335,589Comparison Mean -0.01 -0.01 1,772.27 8.89 13.17 43.69 5.03 14.00 14.60 1.03 13,056.91
Note: Estimates come from a regression of the listed outcome on an indicator for being in a district that was taken over in a post-takeover year. Here, the ending year is the last post-takeover year that we observe. These estimates pool effects from all post-takeover years and from all 35 takeovers in our analytic window. Models include baseline demographic and achievement controls, district fixed effects, grade fixed effects and state-year fixed effects. Samples exclude districts taken over before 2011 and in states without takeovers. Standard errors clustered at the district level. *** p<0.01, ** p<0.05, * p<0.1.
Table 2. The Effect of State Takeover, Difference-in-Difference Estimates

STATE TAKEOVERS 48
Table 3. The Effect of State Takeover on Test Scores, Event Study Estimates
ELA Math N of Takeover
Districts Pre-Takeover Year -6 -0.09*** -0.07* 6
(0.03) (0.04) Pre-Takeover Year -5 -0.05 -0.01 10
(0.04) (0.04) Pre-Takeover Year -4 -0.02 0.00 15
(0.03) (0.04) Pre-Takeover Year -3 0.01 0.04 24
(0.03) (0.04) Pre-Takeover Year -2 0.02 0.04 31
(0.03) (0.03) Pre-Takeover Year -1 0.01 0.02 35
(0.02) (0.02) Takeover Year 1 -0.03 -0.03 35
(0.02) (0.02) Takeover Year 2 -0.08*** -0.04 28
(0.02) (0.03) Takeover Year 3 -0.07** -0.04 24
(0.03) (0.04) Takeover Year 4 -0.03 -0.04 18
(0.04) (0.06) Takeover Year 5 0.03 0.07 10
(0.05) (0.07) Takeover Year 6 -0.04 0.03 4
(0.04) (0.11) N of Observations 337,386 326,064
Note: Estimates come from a regression of the listed outcome on indicators for being in a district that was taken over and interactions between that indicator and indicators for each pre- and post-takeover year (with Year 0 as the omitted year). Here, the ending year is the last post-takeover year that we observe. Models include baseline demographic and achievement controls, district fixed effects, grade fixed effects and state-year fixed effects. Samples exclude districts taken over before 2011 and in states without takeovers. Standard errors clustered at the district level. The final column represents the number of treated districts that contribute to each estimate. *** p<0.01, ** p<0.05, * p<0.1.

STATE TAKEOVERS 49
Figure 5. Pre-Takeover Effects on Test Scores.
-.3-.2
-.10
.1.2
.3C
oeffi
cien
t
-6 -5 -4 -3 -2 -1 1 2 3 4 5 6Takeover Year
ELA-.3
-.2-.1
0.1
.2.3
Coe
ffici
ent
-6 -5 -4 -3 -2 -1 1 2 3 4 5 6Takeover Year
Math
Note: Estimates come from a regression of the listed outcome on indicators for being in a district that was taken over in a given pre- or post-takeover year, using year zero as the omitted year. All models include district fixed effects, grade fixed effects, state-year fixed effects, and baseline achievement controls. We exclude districts taken over before 2011 and states without takeovers. Standard errors clustered at the district level.
Event Study Estimates
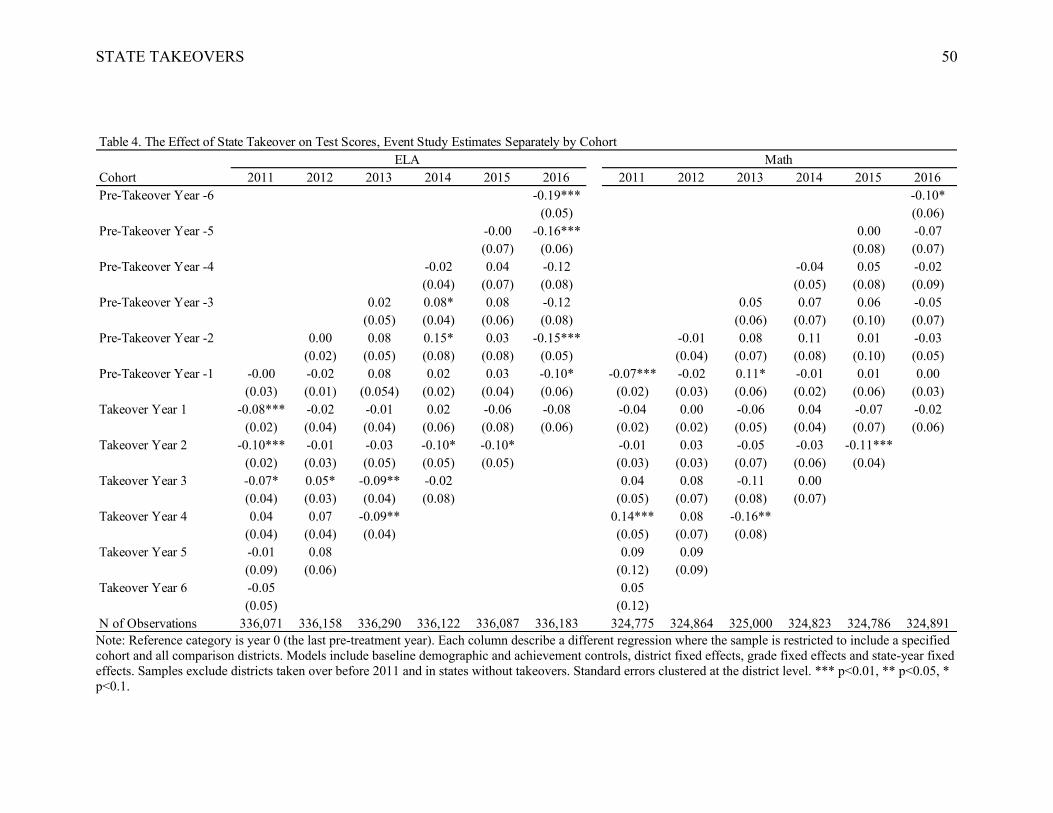
STATE TAKEOVERS 50
Note: Reference category is year 0 (the last pre-treatment year). Each column describe a different regression where the sample is restricted to include a specified
cohort and all comparison districts. Models include baseline demographic and achievement controls, district fixed effects, grade fixed effects and state-year fixed
effects. Samples exclude districts taken over before 2011 and in states without takeovers. Standard errors clustered at the district level. *** p<0.01, ** p<0.05, *
p<0.1.
Table 4. The Effect of State Takeover on Test Scores, Event Study Estimates Separately by Cohort
Cohort 2011 2012 2013 2014 2015 2016 2011 2012 2013 2014 2015 2016Pre-Takeover Year -6 -0.19*** -0.10*
(0.05) (0.06)Pre-Takeover Year -5 -0.00 -0.16*** 0.00 -0.07
(0.07) (0.06) (0.08) (0.07)Pre-Takeover Year -4 -0.02 0.04 -0.12 -0.04 0.05 -0.02
(0.04) (0.07) (0.08) (0.05) (0.08) (0.09)Pre-Takeover Year -3 0.02 0.08* 0.08 -0.12 0.05 0.07 0.06 -0.05
(0.05) (0.04) (0.06) (0.08) (0.06) (0.07) (0.10) (0.07)Pre-Takeover Year -2 0.00 0.08 0.15* 0.03 -0.15*** -0.01 0.08 0.11 0.01 -0.03
(0.02) (0.05) (0.08) (0.08) (0.05) (0.04) (0.07) (0.08) (0.10) (0.05)Pre-Takeover Year -1 -0.00 -0.02 0.08 0.02 0.03 -0.10* -0.07*** -0.02 0.11* -0.01 0.01 0.00
(0.03) (0.01) (0.054) (0.02) (0.04) (0.06) (0.02) (0.03) (0.06) (0.02) (0.06) (0.03)Takeover Year 1 -0.08*** -0.02 -0.01 0.02 -0.06 -0.08 -0.04 0.00 -0.06 0.04 -0.07 -0.02
(0.02) (0.04) (0.04) (0.06) (0.08) (0.06) (0.02) (0.02) (0.05) (0.04) (0.07) (0.06)Takeover Year 2 -0.10*** -0.01 -0.03 -0.10* -0.10* -0.01 0.03 -0.05 -0.03 -0.11***
(0.02) (0.03) (0.05) (0.05) (0.05) (0.03) (0.03) (0.07) (0.06) (0.04)Takeover Year 3 -0.07* 0.05* -0.09** -0.02 0.04 0.08 -0.11 0.00
(0.04) (0.03) (0.04) (0.08) (0.05) (0.07) (0.08) (0.07)Takeover Year 4 0.04 0.07 -0.09** 0.14*** 0.08 -0.16**
(0.04) (0.04) (0.04) (0.05) (0.07) (0.08)Takeover Year 5 -0.01 0.08 0.09 0.09
(0.09) (0.06) (0.12) (0.09)Takeover Year 6 -0.05 0.05
(0.05) (0.12)N of Observations 336,071 336,158 336,290 336,122 336,087 336,183 324,775 324,864 325,000 324,823 324,786 324,891
ELA Math

STATE TAKEOVERS 51
Table 5. Variation in Effect of State Takeover by Baseline District Characteristics
ELA
Percent
Black
Percent
Hispanic
Percent
FRPL
Percent
ELL
Baseline
Test
Scores
Student
Enrollment
Non-
Academic
Takeover
Takeover X Characteristic -0.07 0.18*** -0.10 0.34** -0.30*** 0.03 -0.04
(0.07) (0.06) (0.21) (0.17) (0.08) (0.02) (0.05)
Takeover -0.00 -0.08** 0.04 -0.07** -0.20*** -0.06* -0.04
(0.05) (0.04) (0.17) (0.03) (0.05) (0.03) (0.04)
N of Observations 337,358 337,358 337,358 336,435 337,386 337,358 337,386
Math
Percent
Black
Percent
Hispanic
Percent
FRPL
Percent
ELL
Baseline
Test
Scores
Student
Enrollment
Non-
Academic
Takeover
Takeover X Characteristic -0.01 0.17* 0.04 0.32 -0.35*** -0.03 0.03
(0.12) (0.09) (0.28) (0.21) (0.11) (0.05) (0.07)
Takeover -0.04 -0.08 -0.08 -0.07 -0.24*** -0.03 -0.05
(0.08) (0.05) (0.24) (0.04) (0.08) (0.05) (0.06)
N of Observations 326,036 326,036 326,036 325,120 326,064 326,036 326,064
Note: The student enrollment variable has been rescaled to represent increments of 10,000 students. Here, the ending year is the last
post-takeover year that we observe. *** p<0.01, ** p<0.05, * p<0.1.

STATE TAKEOVERS 52
Enrollment (N of
Students)Percent Black
Percent Hispanic
Percent Subsidized
Lunch
Percent English
Language Learners
Percent Special
EducationPre-Takeover Year -6 54.46*** 0.49 -1.27 3.88** -1.02* -0.74
(18.20) (0.93) (0.94) (1.52) (0.57) (1.72)Pre-Takeover Year -5 48.42*** 1.46*** -1.10 3.27** -0.89** -0.52
(14.24) (0.48) (0.74) (1.28) (0.41) (0.72)Pre-Takeover Year -4 37.90*** 1.32*** -0.89* -1.38 -0.22 -0.67
(9.34) (0.40) (0.48) (3.32) (0.35) (0.52)Pre-Takeover Year -3 43.57*** 1.18*** -0.18 1.13 -0.29 -0.06
(15.82) (0.38) (0.45) (0.87) (0.25) (0.36)Pre-Takeover Year -2 21.69* 0.04 -0.31 1.27* -0.54** -0.06
(11.99) (0.63) (0.24) (0.77) (0.24) (0.22)Pre-Takeover Year -1 14.64* 0.27 -0.16 -0.15 -0.21 0.08
(8.54) (0.23) (0.15) (0.92) (0.18) (0.17)Takeover Year 1 -6.68 0.19 -0.08 0.34 0.15 0.09
(4.70) (0.23) (0.11) (0.54) (0.21) (0.18)Takeover Year 2 -12.36 0.06 -0.11 -2.27*** 0.06 0.10
(11.20) (0.24) (0.21) (0.81) (0.28) (0.29)Takeover Year 3 -25.35 -0.17 -0.34 -1.85 0.13 -0.52
(17.37) (0.35) (0.29) (1.47) (0.39) (0.34)Takeover Year 4 -10.04 -0.57 -0.21 -2.11 0.42 -0.46
(21.95) (0.45) (0.49) (1.39) (0.36) (0.40)Takeover Year 5 54.82** -0.55 -0.53* -3.97** 1.17 -0.19
(24.32) (0.41) (0.30) (1.87) (0.81) (0.45)Takeover Year 6 65.02 0.08 -1.07*** -2.61* 1.32 -0.07
(43.35) (0.37) (0.33) (1.40) (1.09) (0.56)N of Observations 338,503 338,503 338,503 338,540 321,392 333,687
Table 6. The Effect of State Takeover on Enrollment and Demographics, Event Study Estimates
Note: Estimates come from regressions with indicators for being in a district that was taken over in a given post-takeover year. All models include district fixed effects, grade fixed effects, state-year fixed effects, and baseline achievement controls. All samples exclude districts taken over before 2011 and in states without takeovers. Standard errors clustered at the district level. *** p<0.01, ** p<0.05, * p<0.1.

STATE TAKEOVERS 53
Class Size (N of Students)
Percent in Charter Schools
Per Pupil Expenditures
Pre-Takeover Year -6 0.21 -2.37 -1,190.00-0.33 (1.61) (1,031.00)
Pre-Takeover Year -5 -0.16 -1.91** -121.90-0.36 (0.86) (595.60)
Pre-Takeover Year -4 -0.25 -0.96** 319.40-0.3 (0.49) (670.20)
Pre-Takeover Year -3 -0.41* -1.53** -171.90(0.24) (0.70) (643.00)
Pre-Takeover Year -2 -0.22 -1.11*** -334.40(0.30) (0.41) (531.70)
Pre-Takeover Year -1 -0.30 -0.19 174.50(0.31) (0.16) (369.20)
Takeover Year 1 0.047 1.08** 859.20(0.20) (0.54) (811.70)
Takeover Year 2 0.51* 2.57** 496.60(0.28) (1.16) (815.30)
Takeover Year 3 0.25 4.01** 596.20(0.30) (1.59) (626.80)
Takeover Year 4 0.02 3.66** -65.80(0.45) (1.67) (780.50)
Takeover Year 5 0.30 1.19 764.80(0.35) (1.02) (1,417.00)
Takeover Year 6 0.76 237.40(0.56) (633.30)
N of Observations 327,995 298,301 335,589
Table 7. The Effect of State Takeover on Educational Inputs
Note: Estimates come from regressions with indicators for being in a district that was taken over in a given post-takeover year. Models include district fixed effects, grade fixed effects, state-year fixed effects, and baseline achievement controls. Samples exclude districts taken over before 2011 and in states without takeovers. Standard errors clustered at the district level. We do not estimate year six effects on charter share because we do not have charter share data for 2016 (all year six estimates are based on 2016 outcomes). Expenditure variables are in dollar units. *** p<0.01, ** p<0.05, * p<0.1.
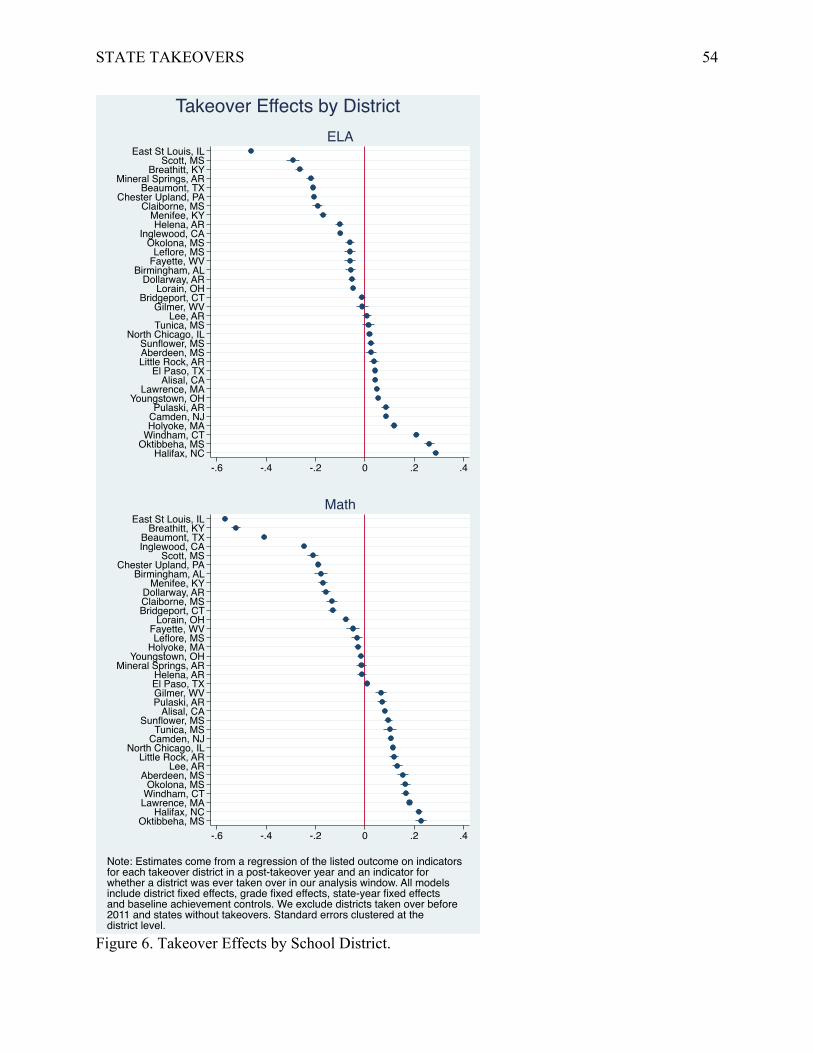
STATE TAKEOVERS 54
Figure 6. Takeover Effects by School District.
East St Louis, ILScott, MS
Breathitt, KYMineral Springs, AR
Beaumont, TXChester Upland, PA
Claiborne, MSMenifee, KYHelena, AR
Inglewood, CAOkolona, MS
Leflore, MSFayette, WV
Birmingham, ALDollarway, AR
Lorain, OHBridgeport, CT
Gilmer, WVLee, AR
Tunica, MSNorth Chicago, IL
Sunflower, MSAberdeen, MSLittle Rock, AR
El Paso, TXAlisal, CA
Lawrence, MAYoungstown, OH
Pulaski, ARCamden, NJHolyoke, MA
Windham, CTOktibbeha, MS
Halifax, NC-.6 -.4 -.2 0 .2 .4
ELA
East St Louis, ILBreathitt, KY
Beaumont, TXInglewood, CA
Scott, MSChester Upland, PA
Birmingham, ALMenifee, KY
Dollarway, ARClaiborne, MSBridgeport, CT
Lorain, OHFayette, WVLeflore, MS
Holyoke, MAYoungstown, OH
Mineral Springs, ARHelena, AREl Paso, TXGilmer, WVPulaski, AR
Alisal, CASunflower, MS
Tunica, MSCamden, NJ
North Chicago, ILLittle Rock, AR
Lee, ARAberdeen, MS
Okolona, MSWindham, CT
Lawrence, MAHalifax, NC
Oktibbeha, MS-.6 -.4 -.2 0 .2 .4
Math
Note: Estimates come from a regression of the listed outcome on indicators for each takeover district in a post-takeover year and an indicator for whether a district was ever taken over in our analysis window. All models include district fixed effects, grade fixed effects, state-year fixed effects and baseline achievement controls. We exclude districts taken over before 2011 and states without takeovers. Standard errors clustered at the district level.
Takeover Effects by District

STATE TAKEOVERS 55
Appendix Table A1. Districts Taken Over by Year, 2011 to 2016
2010-11
Alisal Union CA Fayette County WV Okolona Separate MS Sunflower County MS
2011-12
Bridgeport CT Drew MS Gilmer County WV Helena/West Helena AR Lawrence MA Pulaski County Spec. AR Windham CT
2012-13
Aberdeen MS Birmingham City AL Breathitt County KY Chester-Upland PA Dollarway AR East St. Louis IL Inglewood Unified CA North Chicago IL Oktibbeha County MS
2013-14
Camden City NJ Claiborne County MS El Paso TX Leflore County MS Mineral Springs AR
2014-15
Beaumont TX Lee County AR Scott County MS Youngstown City OH
2015-16
Halifax County NC Holyoke MA Little Rock School District AR Lorain City OH Menifee County KY Tunica County School District MS

STATE TAKEOVERS 56
Appendix Table A2. Rationale for Takeover by State, Among States with Laws Authorizing District Takeover State
Year Law Passed Academic
Financial
Alabama 1995 X Arizona 2008 X Arkansas 1983 X X California 1999 X X Colorado 2000 X Connecticut 1999 X X Idaho 2006 X Illinois 1980 X X Iowa 1990 X Kentucky 1984 X X Maryland 1999 X X Massachusetts 1989 X Michigan 1990 X Mississippi 2000 X Missouri 1999 X X New Jersey 1988 X New Mexico 2002 X X New York 2002 X X North Carolina 1998 X X Ohio 1998 X Oklahoma 1999 X X Pennsylvania 1998 X Rhode Island 1997 X X South Carolina 1998 X X Tennessee 2002 X Texas 2000 X X Vermont 2001 X West Virginia 1998 X
Note: Table includes all states that have a law or regulation that authorize takeover of a district. Law describes the first year a law authorizing takeovers was passed. Some states that authorize district takeover have never used their law. Achievement indicates a state may take over a district for weak academic outcomes and financial indicates a state may take over a district for fiscal mismanagement. Source: Jochim, 2016; Morel, 2018; Rutgers, 2006; Ziebarth, 2002.

STATE TAKEOVERS 57
Appendix Table A3. Effects on Test Scores Using a Comparative Interrupted Time Series Model ELA Math
Takeover -0.07*** -0.07**
(0.03) (0.03) Year 0.01*** 0.00***
(0.00) (0.00) Ever Takeover X Year 0.01 0.01
(0.01) (0.01)
Observations 337,386 326,064
Note: Estimates come from a regression of the listed outcome on indicators for being in a district that was taken over in a post-takeover year, a linear time trend, and an interaction between the indicator for being in a takeover district and the linear time trend. Here, the ending year is the last post-takeover year that we observe. All models include district fixed effects, grade fixed effects, state fixed effects, and baseline achievement controls. We exclude districts taken over before 2011 and states without takeovers. Standard errors clustered at the district level. *** p<0.01, ** p<0.05, * p<0.1

STATE TAKEOVERS 58
Missing ELA Missing Math
Takeover 0.01 0.00
(0.01) (0.00)
N of Observations 338,624 338,624
Missing ELA Missing Math
Pre-Takeover Year -6 0.00** -0.00
(0.00) (0.00)
Pre-Takeover Year -5 0.01*** 0.00
(0.00) (0.00)
Pre-Takeover Year -4 0.00 0.00
(0.00) (0.00)
Pre-Takeover Year -3 0.00 0.00
(0.00) (0.00)
Pre-Takeover Year -2 0.00 0.00
(0.00) (0.00)
Pre-Takeover Year -1 0.01 0.00
(0.01) (0.00)
Takeover Year 1 -0.00* 0.00
(0.00) (0.00)
Takeover Year 2 0.01 -0.00*
(0.01) (0.00)
Takeover Year 3 0.00 0.02*
(0.01) (0.01)
Takeover Year 4 0.01 -0.01**
(0.01) (0.00)
Takeover Year 5 0.09* 0.01
(0.05) (0.02)
Takeover Year 6 -0.01 -0.01
(0.01) (0.01)
N of Observations 338,624 338,624
Note: Estimates in the top row come from a regression of the listed outcome
on an indicator for being in a district that was taken over in a post-takeover
year and an interaction between that indicator and an indicator for whether it
was a post-takeover year. Here, the ending year is the last post-takeover year
that we observe. Estimates in the rest of the rows come from a separate
regression with indicators for being in a district that was taken over and
interactions between that indicator and indicators for each year (with Year 0 as
the omitted year). In other words, the top row pools all post-takeover years
while the rest separate out each post-takeover year. Models include district,
grade, and state-year fixed effects, and baseline achievement controls. Samples
exclude districts taken over before 2011 and in states without takeovers.
Standard errors clustered at the district level. The final column represents the
number of treated districts that contribute to each estimate. *** p<0.01, **
p<0.05, * p<0.1.
Appendix Table A4. Takeover Effect on Test Score Missingness

STATE TAKEOVERS 59
ELA MathN of Takeover
DistrictsTakeover -0.05 -0.04 35
(0.03) (0.04)Teacher evaluation control x xN of Observations 337,386 326,064
ELA MathN of Takeover
DistrictsPre-Takeover Year -6 -0.09*** -0.07* 6
(0.03) (0.04)Pre-Takeover Year -5 -0.05 -0.02 10
(0.04) (0.04)Pre-Takeover Year -4 -0.02 0.00 15
(0.03) (0.04)Pre-Takeover Year -3 0.01 0.04 24
(0.03) (0.04)Pre-Takeover Year -2 0.02 0.04 31
(0.03) (0.03)Pre-Takeover Year -1 0.01 0.02 35
(0.02) (0.02)Takeover Year 1 -0.03 -0.03 35
(0.02) (0.02)Takeover Year 2 -0.08*** -0.04 28
(0.02) (0.03)Takeover Year 3 -0.07** -0.04 24
(0.03) (0.04)Takeover Year 4 -0.03 -0.04 18
(0.04) (0.06)Takeover Year 5 0.03 0.07 10
(0.05) (0.07)Takeover Year 6 -0.04 0.03 4
(0.04) (0.11)Teacher evaluation control x xN of Observations 337,386 326,064
Appendix Table A5. Examining Robustness to Controlling for District Policy Changes
Note: Estimates in the top row come from a regression of the listed outcome on an indicator for being in a district that was taken over in a post-takeover year and an interaction between that indicator and an indicator for whether it was a post-takeover year. Here, the ending year is the last post-takeover year that we observe. Estimates in the rest of the rows come from a separate regression with indicators for being in a district that was taken over and interactions between that indicator and indicators for each year (with Year 0 as the omitted year). In other words, the top row pools all post-takeover years while the rest separate out each post-takeover year. Models include district, grade, and state-year fixed effects, baseline achievement controls, and controls for time varying policy changes at the district level. Samples exclude districts taken over before 2011 and in states without takeovers. Standard errors clustered at the district level. The final column represents the number of treated districts that contribute to each estimate. *** p<0.01, ** p<0.05, * p<0.1.