evaluating dryland crop/livestock system alternatives for
TRANSCRIPT
Evaluating Dryland Crop/Livestock System Alternatives for Risk Management under Declining Irrigation in the Texas Panhandle
David G. Lust Assistant Professor of Agriculture
Department of Agricultural Sciences, West Texas A&M University, WTAMU Box 60998, Canyon, Texas 79016
Lal K. Almas Associate Professor of Agricultural Business and Economics
Department of Agricultural Sciences, West Texas A&M University, WTAMU Box 60998, Canyon, Texas 79016
Bob A. Stewart Professor of Soil Science
Department of Agricultural Sciences, West Texas A&M University, WTAMU Box 60998, Canyon, Texas 79016
W.Arden Colette Professor of Agricultural Business and Economics, Retired
Canyon, Texas 79015 [email protected]
Selected Paper prepared for presentation at the Southern Agricultural Economics Association Annual Meeting, Atlanta, Georgia, January 31-February 3, 2009
Copyright 2009 by David Lust and Lal Almas. All rights reserved. Readers may make verbatim copies of this document for non-commercial purposes by any means, provided that this copyright notice appears on all such copies.
ABSTRACT: Production budgets for dryland crop and crop/livestock systems are developed to estimate yields, costs and returns for dryland wheat and sorghum and for alternative dryland crop/livestock systems. A crop simulation model aids yield estimation. The yield and return distributions are used to estimate risk and relative risk for included alternatives. Key Words: Relative Risk, Ogallala Aquifer, Crop-Livestock Systems, Wheat, Sorghum
2
Introduction
Agriculture is the largest industry in the Texas Panhandle region. Agriculture in the
region relies upon irrigation. Irrigation increases yield by 2 to 7 times over non-irrigation. When
risk is defined as a function of the variability in yield, irrigation reduces risk by 75% to 90%. The
development of irrigation in the region is a relatively recent phenomenon, developing largely
since the end of World War II. Between 1950 and 1980 irrigated acres increased from 19,315 to
1,754,560.
However, between 1980 and 1997 irrigated acres declined to 1,363,438 acres as the water
availability in the Ogallala aquifer declined and pumping costs increased. In addition, aquifer
recharge is negligible, and municipal, industrial, and conservation interests increasingly compete
for Ogallala aquifer water. Irrigated acres in the region are therefore expected to continue to
decline in the long-term due to economic or political forces. Decline in irrigated acreage will
result in increasing acreage dedicated to dryland crop or crop/livestock production systems.
Precipitation in the region is highly variable. In Amarillo the annual average precipitation
over the 120-year period from 1880 through 2000 is 20.53 inches (National Weather Service,
2000). However, the range in annual precipitation is from less than 9 inches to over 40 inches.
There are pronounced year-to-year variations with as much as 15 to 20 inch differences in
consecutive years. Major wet and dry cycles are observed. Short periods of significantly above
average precipitation are usually followed by long periods of below average to average
precipitation. A seasonal pattern adds to the variability. Over 50% of the annual precipitation is
received during the summer growing season from May through October. May, June and August
are the months with the highest average rainfall. Regional dryland systems face significantly

3
increased yield risk due to the limited precipitation amounts and patterns. Risk assessment and
management tools therefore provide benefits to regional producers.
Wheat, grain sorghum and corn are traditional crops grown in the Texas Panhandle under
irrigation. Wheat and grain sorghum, along with sorghum-sudan and cotton, are predominant in
in dryland systems. Livestock grazing of winter wheat pasture is also an important activity in the
region. Development of alternative crop/livestock systems may offer reduced yield production
risk in regional dryland systems. The objectives of this study are to estimate yield and expected
return distributions for traditional dryland crops wheat and sorghum, and for experimental
alternative crop/livestock systems for the Texas Panhandle, and; to compare the absolute risk and
relative risk associated with the traditional dryland crops and the experimental crop/livestock
systems.
Data and Methods
Yield distributions are determined for six primary Panhandle production alternatives:
winter wheat harvested for grain only (WH); winter wheat grazed by steers and then harvested
for grain (WHGRZ); winter wheat for grazeout only (WHGO); grain sorghum harvested for
grain only (GS); grain sorghum harvested for grain, followed by residue grazing (GSGRZ); and
sorghum-sudan raised for grazing (SS). Mean yields and distributions are then used in budget
development in order to estimate net returns to land, labor, and management (NR) for these
primary production alternatives and for additional alternatives.
Grain yields for wheat and sorghum are derived from simulations yields produced by the
EPIC model which is incorporated into the CropMan crop simulation model (Gerik, 2006).
These distributions are then adjusted to correspond with the average yields reported for Randall
4
county between 1983 and 2005 by the Texas Crop and Livestock Reporting Service. The EPIC
model utilizes daily weather data including precipitation, temperature, and radiation to simulate
plant growth. Since crop yields in the region are highly related to weather, Amarillo is chosen as
representative of the Texas Panhandle region. A 46-year precipitation record (1960-2005) for
Amarillo serves as the key input to the CropMan model.
A similar approach is used to determine yield of wheat forage and grain sorghum residue
available for grazing in the WHGRZ, WHGO, and GSGRZ production alternatives. The
CropMan database includes biomass production for both wheat and grain sorghum, providing the
most reliable and available long-term estimate of regional forage production for wheat and grain
sorghum. A 100-yr CropMan simulation is reconciled with local estimates of wheat and grain
sorghum forage production by Lust (2008) at the WTAMU Nance Ranch and the Texas AgriLife
Extension Service at Bushland, Texas to determine the expected forage yields associated with
WHGRZ and GSGRZ production alternatives. Expected forage yields are then transformed to
steer gain based on National Research Council (NRC) nutrient requirements and forage nutrient
values.
Steer gain per acre while grazing dryland wheat is estimated in Texas A&M University
AgriLife Extension Crop and Livestock Budgets (AgriLife Budgets, 2008). The steer gain
estimate from the District 1 AgriLife budget is chosen as representative of the region, as the
district includes the Panhandle. The estimate in this budget is reconciled with forage yield
estimates derived from the CropMan simulation to determine the expected steer gain used for the
WHGRZ production alternative.
AgriLife budgets, unfortunately, do not estimate wheat forage production or steer
performance for regional wheat grazed after March 1, the date associated with the first hollow
5
stem stage of wheat maturity and generally accepted as the cattle removal date if grain is to be
harvested. In addition, wheat forage growth during the typical March 1 – May 20 grazeout period
does not have a linear relationship with forage growth prior to March 1, since increasing
temperature, day length, and wheat maturity typically result in significantly increased forage
growth rate during the grazeout period as compared to the winter grazing period. This is
especially noticeable under dryland conditions. Therefore an alternative data source is required
to estimate steer gain for this period. West Texas A&M University (WTAMU) researchers
recorded steer gain on six plots of dryland wheat through grazeout during 2003-2007 (Lust,
2008). Mean steer gain per acre is calculated from this data set for the grazing period of March 1
– May 20. This gain is then combined with the steer gain estimate from the AgriLife budget for
the winter grazing period to determine the gain used in the WHGO budget.
Yield and distributions for sorghum-sudan are determined through local data sets and
CropMan simulation. McCuistion (2006) reports dryland sorghum-sudan forage production and
steer gain while grazing replicated plots of dryland sorghum-sudan at the James Bush Research
Farm in Bushland, TX. Lust (2008) determines steer gain grazing dryland sorghum-sudan at
WTAMU during 2003-2007. Weighted means from these studies and the 2008 AgriLife budget
for sorghum-sudan grazing are used to determine the expected mean steer gain for the SS
production alternative budget. However, increased use of sorghum-sudan varieties in the Texas
Panhandle has rapidly developed only during the last ten years. Since these data sources reflect a
relatively short time period with limited precipitation variance, a 100-year CropMan simulation
was used to estimate the variance of sorghum-sudan yield and steer gain over a longer time
period and a more representative precipitation distribution.
6
Budgets are developed for each of the six primary production alternatives specified
above. Budgets are based on four AgriLife budgets for WH, WHGRZ, GS and SS. Adjustments
are made to reflect crop yields as described above. The budget for WHGO is developed by
adding the steer gain for the grazeout period, as determined above, to the WHGRZ budget, so
that grazing from November 1 through May 20 is reflected in a single budget. The budget for
GSGRZ is similarly developed by adding steer gain from residue grazing to the GS budget to
reflect the dual product alternative.
Each budget estimates the mean net return to land, labor and management (NR) for the
production alternative specified. Net return for each budget is calculated by transforming the
yield data to Total Returns (TR) based on 2008 prices, and subtracting the total specified
expenses, which include variable and allocated fixed costs expressed on a per acre basis.
Production costs and commodity prices are based on respective 2008 AgriLife budgets, and were
held constant so that variance in TR is reflective of production risk, and not price risk. Dryland
cropping operations incur few production costs that are correlated with yield. Only grain hauling
costs are directly associated with yield, while the major costs are associated with planting,
harvesting, or fixed assets are incurred regardless of relative crop success. Therefore total
specified costs in the dryland budgets are not highly related to yield, and contribute negligibly to
variance in TR. Additionally, commodity prices received in the region vary primarily in response
to nationally prevalent conditions, rather than in response to local yields or supply. Therefore,
specified costs and commodity prices are assumed constant, so that σ Yield = σ TR = σ NR. The
standard deviation (σ) of NR is used as a measure of absolute risk, and the coefficient of
variation (CV), which is the ratio of the standard deviation to the mean, measures relative risk for
each production alternative.
7
A portfolio analysis is used to determine the NR, absolute risk, and relative risk of
experimental production alternatives. Combinations of equally weighted pairs of the six primary
production alternatives produced weighted mean NR for 15 additional production alternatives.
The total variance of the portfolio is calculated as the sum of the proportional variances plus the
covariance as described by Barry et al, (2000). Correlation coefficients between NR for each of
the six production alternatives are determined in order to calculate covariance between paired
production alternatives. A total of twenty-one single or combination production alternatives are
then ranked by mean NR, absolute risk, and relative risk.
Results and Discussion
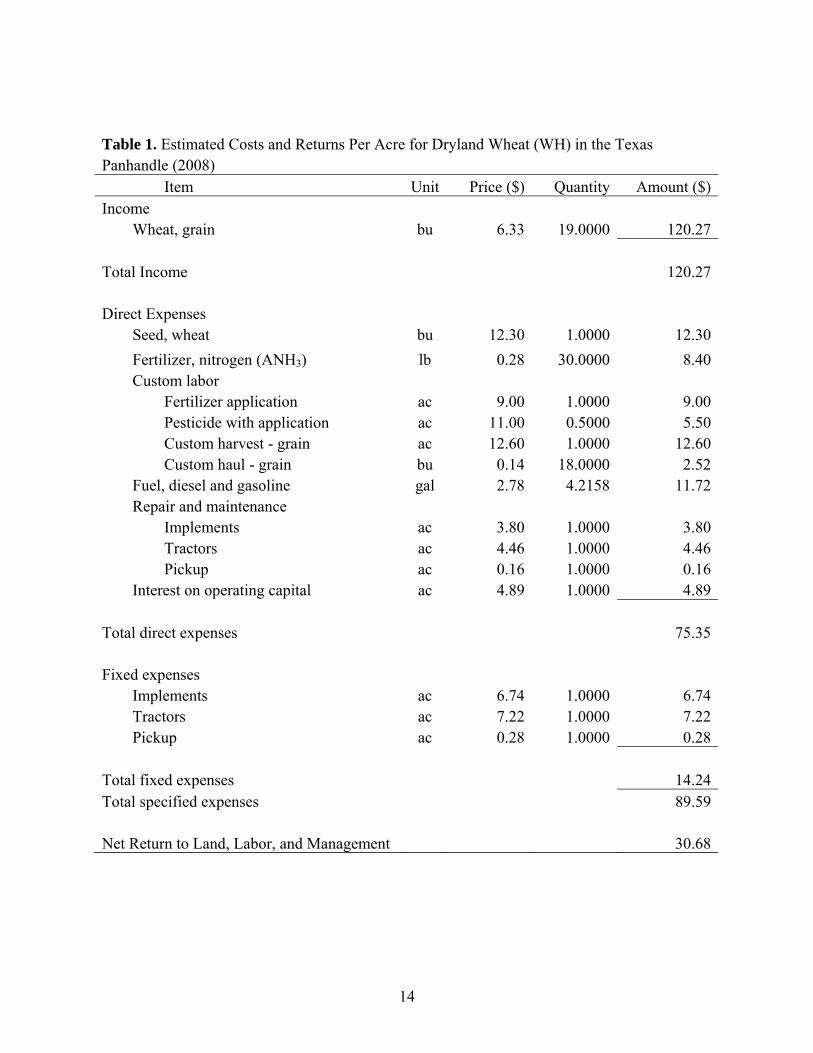
Budgets for each of the six primary production alternatives differ primarily due to the
relative amount of grazing the alternative utilizes (Tables 1-6). No harvest or transportation costs
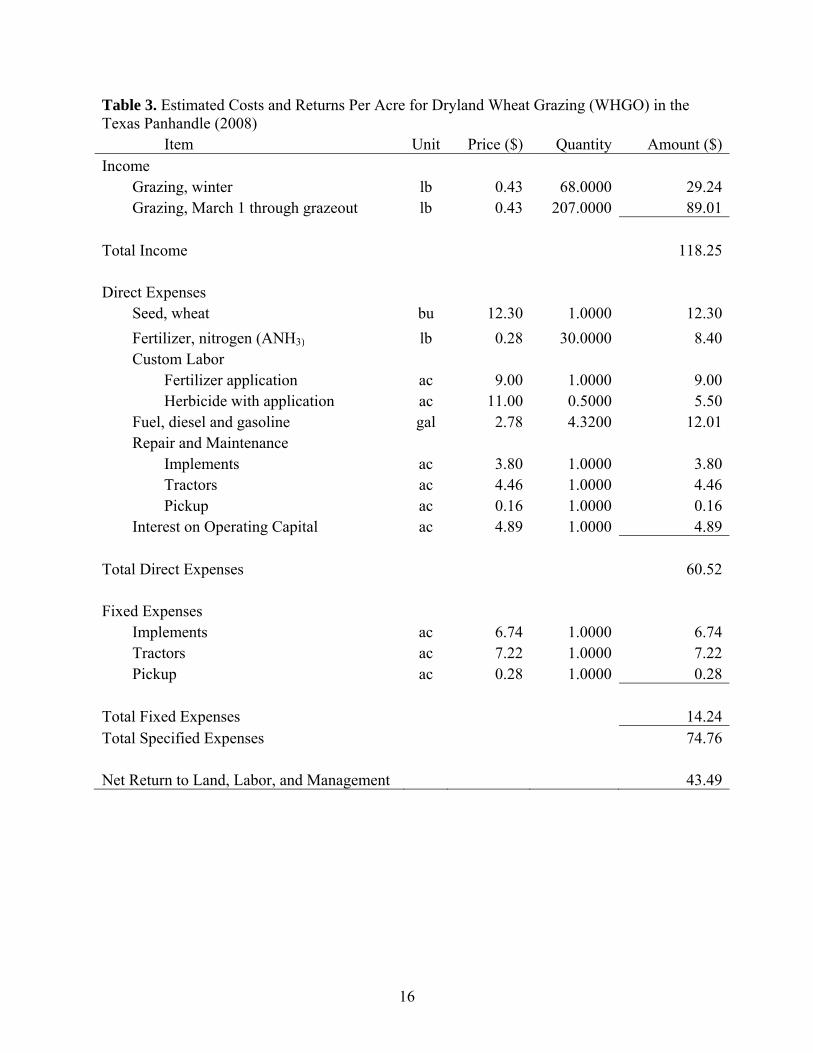
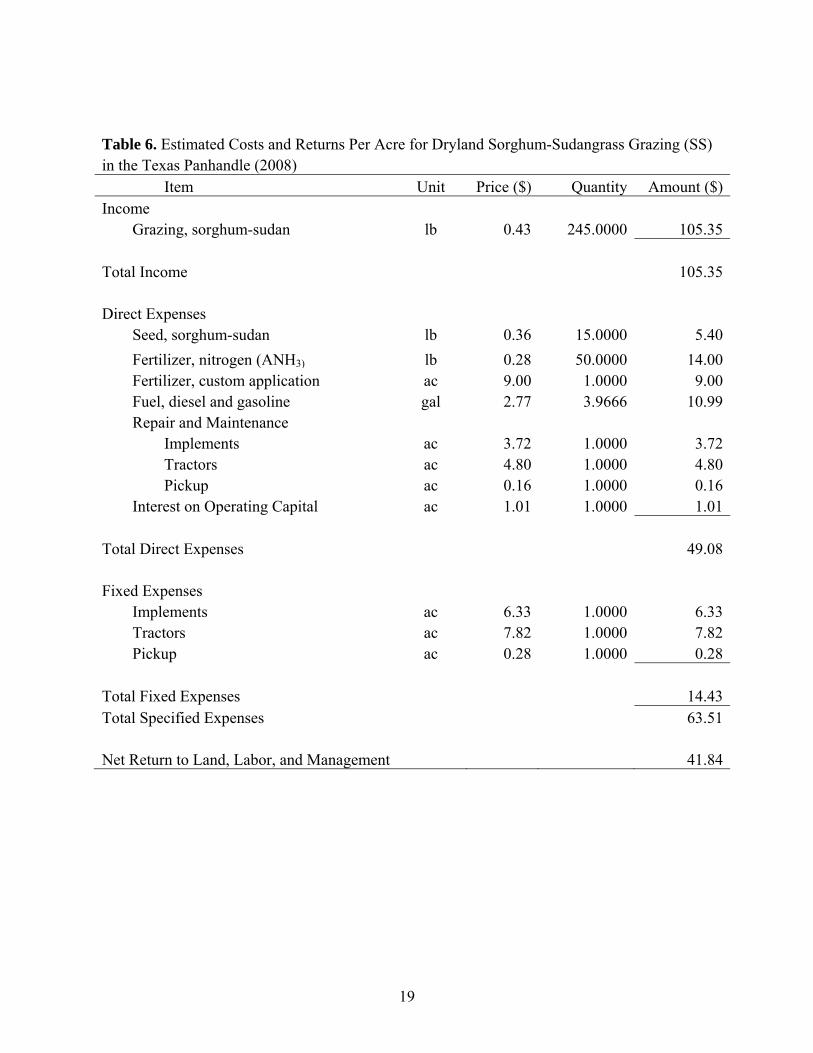
are incurred for WHGO (Table 3) or SS (Table 6), since these alternatives rely solely on grazing.
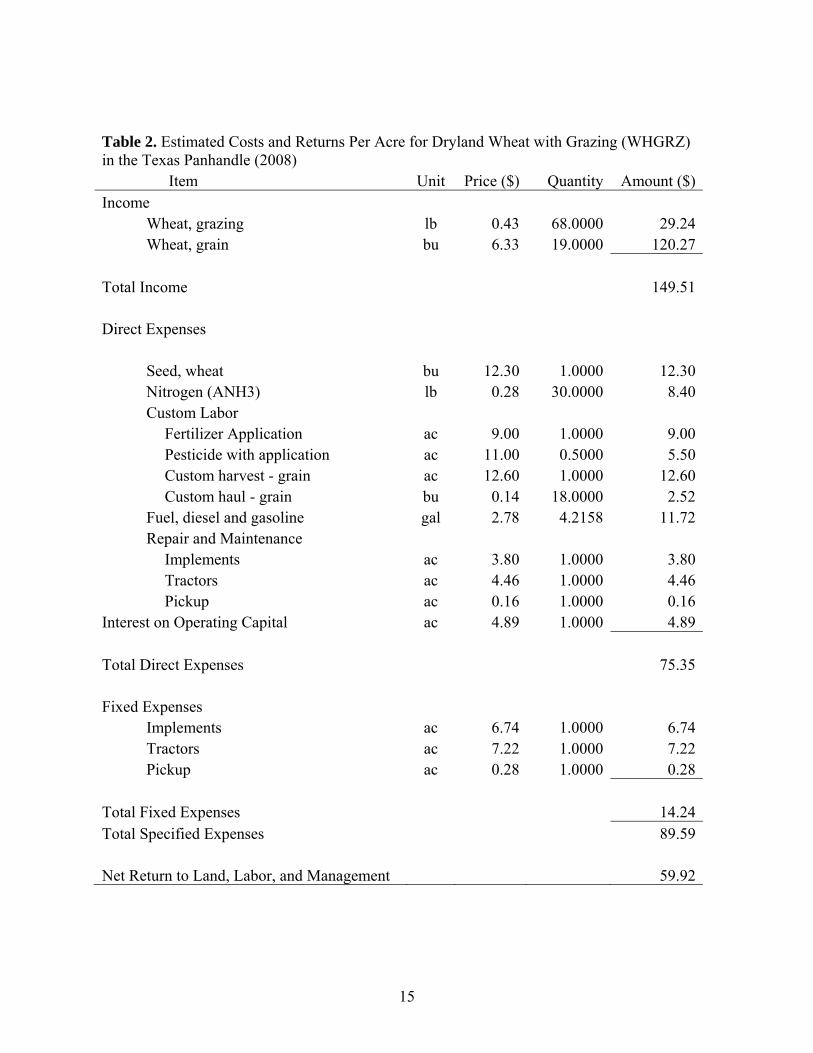
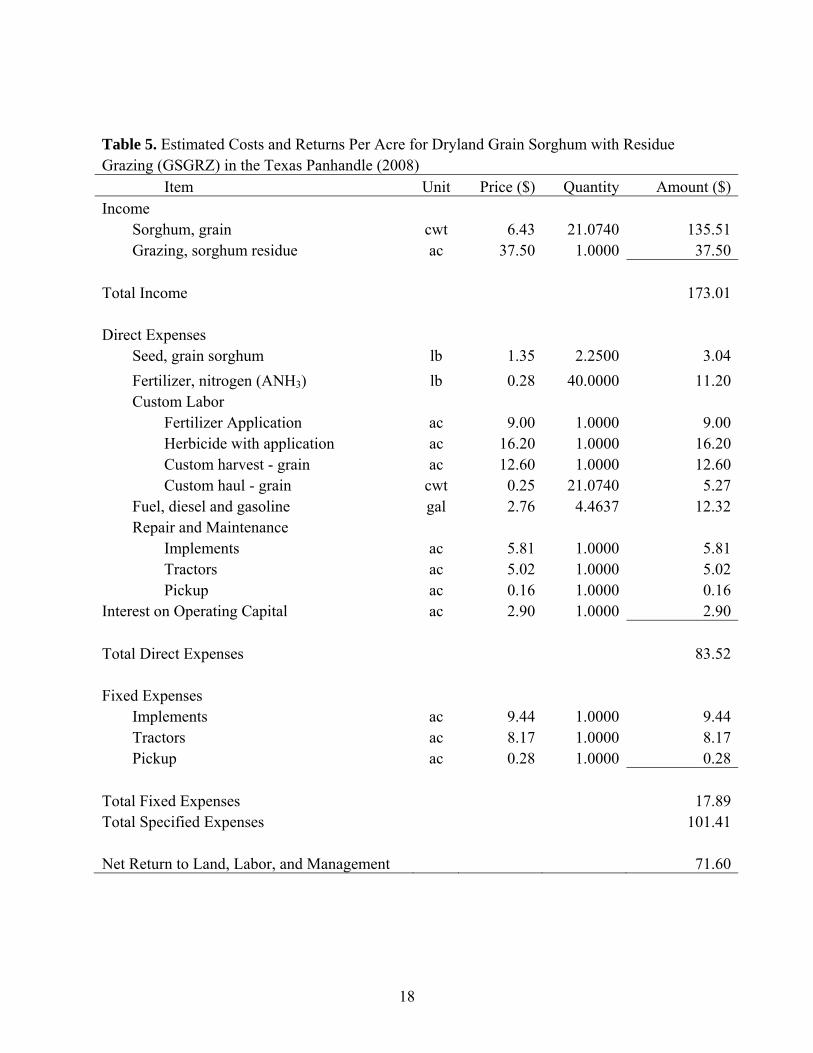
Dual product alternatives for WHGRZ (Table 2) and GSGRZ (Table 5) include additional
income categories. Fuel costs for WHGO (Table 3) are increased relative to WH (Table 1) and
WHGRZ (Table 2) budgets.
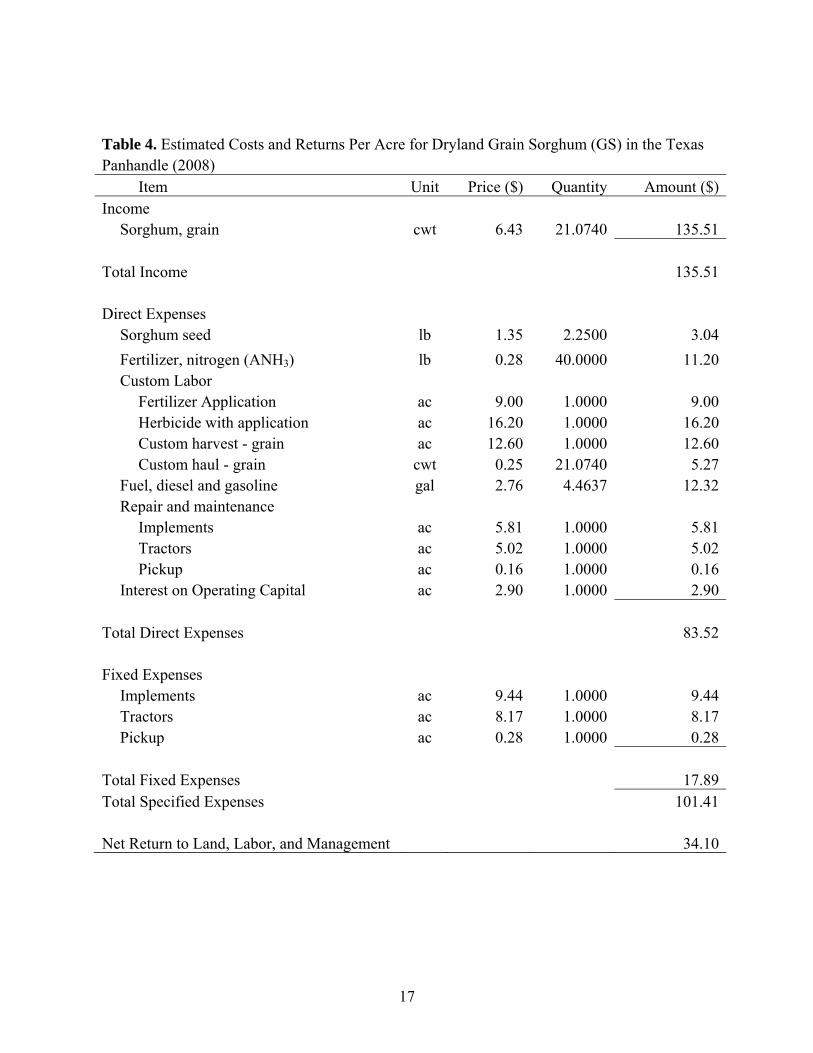
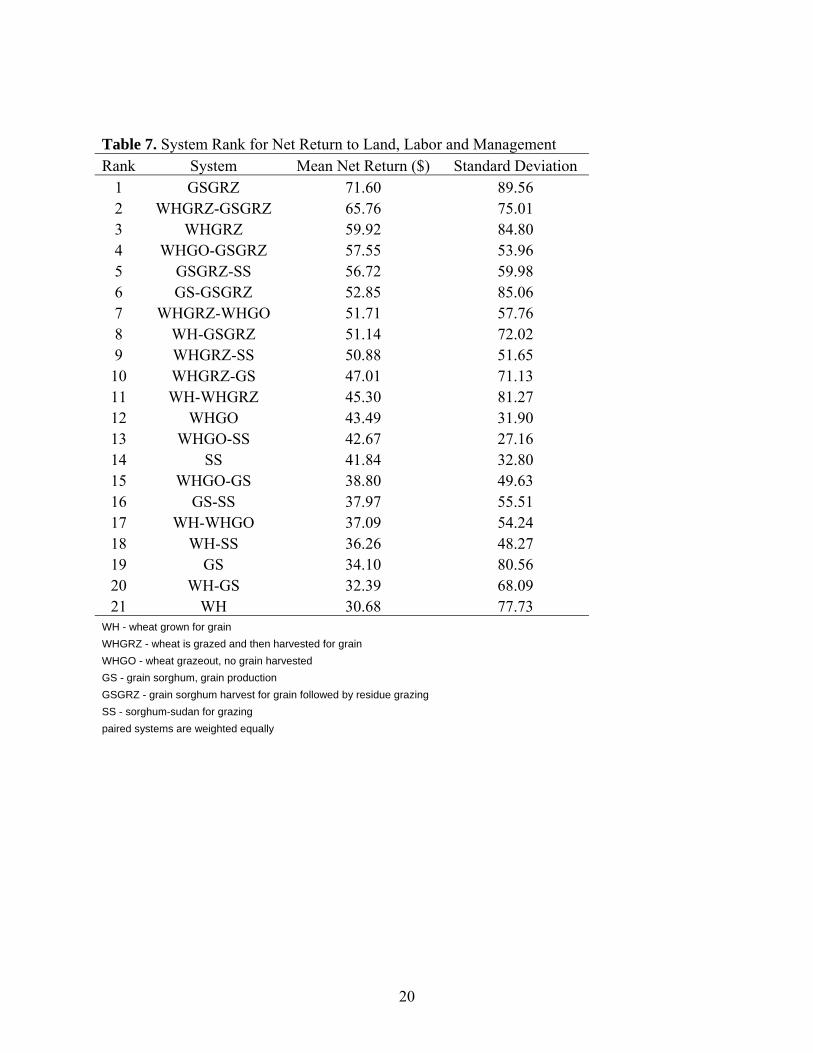
Mean NR for the six primary budgets ranged from $30.68 for WH to $71.60 for GSGRZ
(Table 7). Means, correlation coefficients, standard deviations, and coefficients of variation of
NR for all combinations of production alternatives analyzed are summarized and ranked. The
addition of grazing to the grain production alternatives (WHGRZ and GSGRZ) resulted in a
doubling of NR compared to the grain-only alternatives. Net Return increased from $30.68 for
WH to $59.92 for WHGRZ, and from $34.10 for GS to $71.60 for GSGRZ (Table 7), indicating
the effectiveness of dual product alternatives. The results for these two production alternatives
8
indicate the significant increase in NR that is potentially realized through inclusion of secondary
or dual products in a traditional grain production system. The grain portion of the WHGRZ and
GSGRZ contributed 51.0% and 47.6% of the NR, respectively, to the total NR for the production
alternatives. Forage produced in these two system alternatives is highly correlated with grain
produced, since grain and grazing are produced by the same crop. Nevertheless, the results
illustrate that harvest via grazing of the forage fraction of the crop may yield as much or more
NR as the grain that is traditionally considered the primary crop. Total harvest of crop biomass
through grazing may result in negative consequences not reflected in this analysis. Soil
characteristics such as organic matter content, water-holding capacity, and susceptibility to wind
and water erosion may be negatively affected by removal of forage or residue. This is especially
a consideration for the GSGRZ system, since residue is removed after crop maturity and grain
harvest. Wheat grazing on clay loam soils typical of the region may result in undesirable soil
compaction, especially if grazed when the soil is wet. Inclusion of additional costs related to
such potential problems may result in reduced NR.
The inclusion of grazing in the WHGRZ and GSGRZ alternatives suggests the
desirability of grazing based production strategies. Two alternatives (WHGO and SS) describe
grazing-only enterprises that harvest no grain. Such alternatives are attractive to some producers,
especially those familiar with cattle and grazing systems. These alternatives produced NR that
are $12.81 (WHGO v WH) and $7.74 (SS v GS) higher than the corresponding grain-only
option. However, the grazing-only alternatives produce NR below that of the dual product
systems WHGRZ and GSGRZ.
Wheat alternatives (WH, WHGRZ, WHGO) represent winter production systems, while
the sorghum-based alternatives (GS, GSGRZ, SS) represent summer production. However, no
9
seasonal advantage is clearly apparent based on the NR of the six primary alternatives. Sorghum-
based summer production alternatives produce slightly higher total NR ($147.54) than wheat-
based winter alternatives ($134.09). However, the winter system WHGO produces a slightly
higher NR than SS.
The six primary production alternatives are paired to create 15 new crop/livestock
production alternatives that are analyzed in a portfolio analysis. The NR for each of the
combination alternatives is calculated as the weighted mean of the two alternatives that are
paired, with equal weight (.50) given to each of the primary alternative systems. As expected,
NR of the combination alternatives are intermediate to the NR of the two primary contributors.
The twenty-one production scenarios are ranked by NR in Table 7. The overall mean NR for all
production alternatives is $46.94. The advantage to NR gained by including both grazing and
grain production in the production system becomes even more apparent when rankings are
examined. The top eleven alternatives based on NR include both grain production and grazing,
suggesting that diversified or dual product systems produce an advantage over single-product
systems. Grazing-only systems (WHGO, WHGO-SS, SS) rank 12th, 13th and 14th for NR,
slightly below the overall mean NR (Table 7). The distinct disadvantage of grain-only dryland
production systems is clearly highlighted, as the three grain-only alternatives (WH, GS, WH-GS)
rank 19th, 20th and 21st in NR. Results suggest that livestock grazing contributes significantly to
maximum NR in Panhandle dryland production systems.
Correlation coefficients are calculated for NR of each pair of production alternatives.
Correlations primarily indicate that NR are related by season. A correlation coefficient of .410 is
calculated for WHGO:SS, indicating the least closely related production alternatives. Other
summer:winter production system correlations were similar, with correlations of .432, .456, and
10
.480 determined for WH:SS, WHGO:GS, and WH:GS, respectively. Conversely, correlations of
production alternatives in the same season were high, .901 for GS:SS, and .949 for WH:WHGO.
Since forage production is a function of the respective grain crops, WH:WHGRZ and
GS:GSGRZ were perfectly correlated. Correlations are as expected given the randomness of
regional precipitation patterns and the dependence of yield and NR on precipitation.
The standard deviation of NR for each of the production alternatives provides a measure
of absolute risk. Variation is lowest for grazing-only production options, with WHGO-SS
producing the smallest distribution (σ = 27.14) followed by WHGO (σ = 31.90) and SS ( σ =
32.80). This may be explained in part by the greater ability of the grazing regimes to harvest
even marginal crop yields at a relatively low cost, resulting in reduced variation in grazing
alternative outcomes.
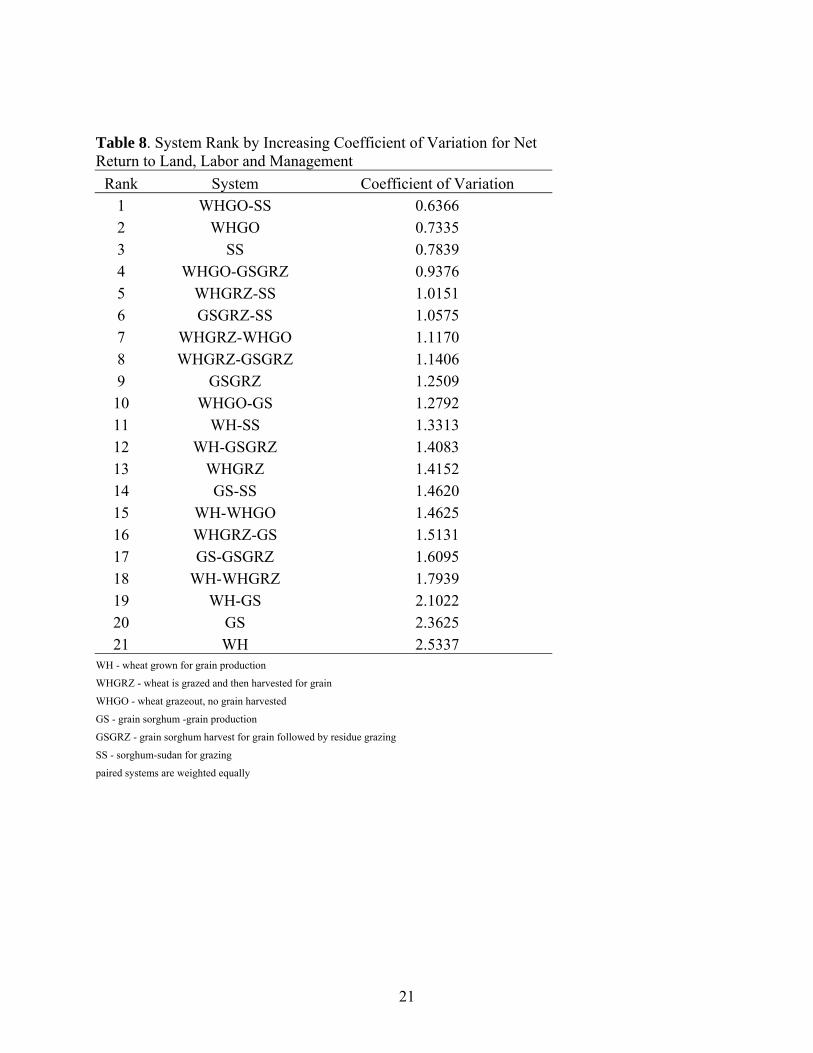
The coefficient of variation of NR is calculated for each production alternative as an
indication of relative risk. Production systems are ranked by CV of NR (Table 8). The top three
production alternatives (for lowest relative risk) are the grazing-only production systems
WHGO-SS, WHGO, and SS. The highest ranking alternative that includes a grain-only option is
WHGO-GS, ranking tenth on the list of twenty-one alternatives. Grain-only production systems
offer the greatest relative risk, with WH-GS, GS, and WH the three lowest ranking alternatives.
The difference in relative risk between the grazing-only and grain-only systems is striking. The
three grazing-only systems (WHGO-SS, WHGO, SS) have CV of .6366, .7335 and .7839
respectively, with a mean CV of .718. In contrast, the three grain-only production alternatives
(WH-GS, GS, WH) have respective CV of 2.1022, 2.3625, and 2.5337, and a mean CV of
2.3328. Thus the three grain-only enterprises on average result in 324% more relative risk than
the three grazing-only strategies. The most risky alternative (WH) produces almost 400% more
11
risk to NR than the safest alternative (WHGO-SS). The difference in risk may be due to the
greater sensitivity of dryland grain production systems to temporally and spatially variable local
precipitation. Grain production requires threshold levels of soil moisture at specific stages of
production, i.e. boot stage for sorghum and the grain-filling stage for wheat. The failure of
dryland systems to meet these moisture thresholds results in drastic reductions in grain yield, or
even crop failure. In contrast, forage production responds more positively to both the quantity
and timing of any precipitation during the much longer forage growth season. In addition,
stocking rates can be adjusted to harvest even marginal quantities of forage production, so that
the harvest efficiency associated with grazing may be greater than that of grain-production
systems, especially in times of drought or marginal precipitation. These factors may explain in
part the lower relative risk associated with grazing system alternatives.
Producers have differing goals concerning NR and risk. In addition, goals and risk
tolerance often change each year, or even within a production year due to various factors.
Therefore no optimum production system is suggested by this study, since the risk tolerance and
NR goals for each producer determine the optimum for that producer. A common strategy in
semi-arid dryland production regions is to attempt to minimize the possibility of a negative NR,
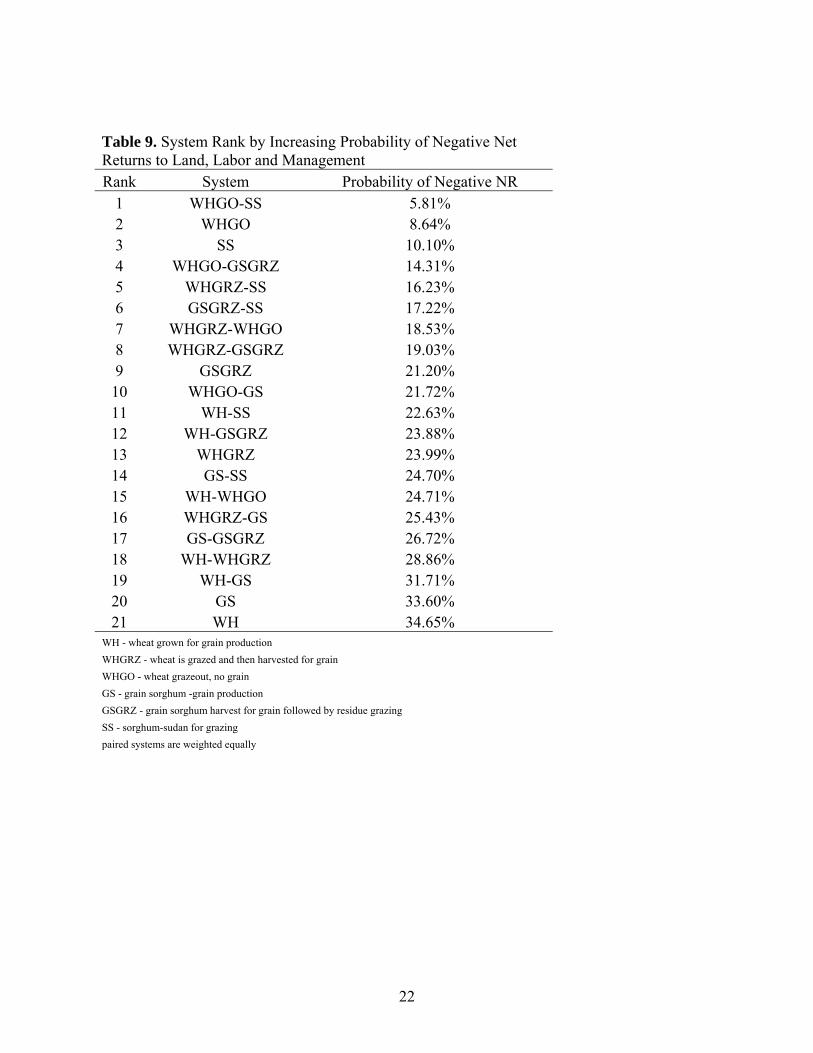
even at the expense of reduced maximum returns in a good year. Table 9 ranks the production
alternatives by probability of negative NR. The production alternatives are ranked identically to
the CV ranking, since both rely on the mean and variance of NR for derivation. However, this
expression of relative risk offers a producer-friendly format for communicating risk. The least
risky alternatives (WHGO-SS, WHGO, SS) have a mean probability of 8.166% of producing a
negative NR. In contrast, the most risky alternatives (WH-GS, GS, WH) have a mean probability
of 33.333% of producing a negative return, meaning that a producer can expect the grain-only
12
alternatives to result in negative NR in one out of every three years. The combination alternative
WHGO-SS has a 5.8% probability of NR, compared to a 34.7% probability for WH.
Conclusions
Agricultural producers in the Texas Panhandle will continue to face declining irrigated
acreage and increasing dryland acreage due to declining availability of water from the Ogallala
aquifer. Dryland systems are inherently risky in semi-arid regions due to the unpredictable nature
of precipitation. Producers benefit from risk management tools and strategies. The dryland crop-
livestock production systems evaluated by this study reveal the potential risk reduction attainable
by including livestock grazing in production alternatives. Grazing systems provide lower risk to
NR compared to grain-only production systems in this study. Portfolio analysis allows evaluation
of combination systems. Systems that include grain production, grazing, and both summer and
winter production offer potential for optimal tradeoffs between potential NR and relative risk,
based on the risk tolerance of individual producers. Additional data is needed to verify dryland
system yields and variation so that models for yield risk assessment can be further developed.
Bibliography
Barry, Peter J., Paul N. Ellinger, C.B. Baker and John A. Hopkin. 2000. Financial Management in Agriculture. Chapter 8, “Risk Management” p. 223. Interstate Publishers, Inc. Danville, Ill.
Gerik, Tom and Wyatte Harman, User’s Guide for CroPMan (Crop Production and Management Model), Version 4.0, Blackland Research and Extension Center , Texas Agricultural Experiment Station, Temple, Texas, 2006.
Gerik, Tom, Wyatte Harman and Jimmy Williams, Researcher’s Guide for WinEPIC, Version 3, BRC Report No. 05-01 (revised), Blackland Research and Extension Center , Texas Agricultural Experiment Station, Temple, Texas, 2006.
13
Lust, David G. 2008. An Optimization Model for evaluation of Dryland Forage-Livestock Systems Under Declining Irrigation Availability From the Ogallala Aquifer in the Texas Panhandle. Ph.D. Dissertation. West Texas A&M University, Canyon, Texas. McCuistion, Kimberly C. 2006. Forage Sorghum and Sorghum x Sudangrass Hybrids in Ruminant Diets. Ph.D. Dissertation. West Texas A&M University, Canyon, TX. National Weather Service. Amarillo Weather Forecast Office, Amarillo, TX. Archived data accessed at: http://www.srh.noaa.gov/ama/climate/yearly_precip.htm, accessed August 5, 2008.
National Research Council. 1996. Nutrient requirements of domestic animals: Nutrient requirements of beef cattle (Update 2000). Nat. Acad. Sci.- Nat. Res. Counc., Washington, D.C.
Texas AgriLife Extension Service, 2008. Extension Agricultural Economics. 2008 Texas Crop and Livestock Budgets. District 1. http://agecoext.tamu.edu/resources/crop-livestock-budgets/by-district/district-1/2008.html, accessed August 12, 2008.
Texas Agricultural Statistics Service, Texas Agricultural Statistics, 1984, 1989, 1990, 1991, 1992, 1993, 1994, 1995, 1996, 1997, 1998, 1999, 2000, 2001, 2002, 2003, 2004, and 2005.
14
Table 1. Estimated Costs and Returns Per Acre for Dryland Wheat (WH) in the Texas Panhandle (2008) Item Unit Price ($) Quantity Amount ($)Income Wheat, grain bu 6.33 19.0000 120.27 Total Income 120.27 Direct Expenses Seed, wheat bu 12.30 1.0000 12.30 Fertilizer, nitrogen (ANH3) lb 0.28 30.0000 8.40 Custom labor Fertilizer application ac 9.00 1.0000 9.00 Pesticide with application ac 11.00 0.5000 5.50 Custom harvest - grain ac 12.60 1.0000 12.60 Custom haul - grain bu 0.14 18.0000 2.52 Fuel, diesel and gasoline gal 2.78 4.2158 11.72 Repair and maintenance Implements ac 3.80 1.0000 3.80 Tractors ac 4.46 1.0000 4.46 Pickup ac 0.16 1.0000 0.16 Interest on operating capital ac 4.89 1.0000 4.89 Total direct expenses 75.35 Fixed expenses Implements ac 6.74 1.0000 6.74 Tractors ac 7.22 1.0000 7.22 Pickup ac 0.28 1.0000 0.28 Total fixed expenses 14.24Total specified expenses 89.59 Net Return to Land, Labor, and Management 30.68
15
Table 2. Estimated Costs and Returns Per Acre for Dryland Wheat with Grazing (WHGRZ) in the Texas Panhandle (2008) Item Unit Price ($) Quantity Amount ($)Income Wheat, grazing lb 0.43 68.0000 29.24 Wheat, grain bu 6.33 19.0000 120.27 Total Income 149.51 Direct Expenses Seed, wheat bu 12.30 1.0000 12.30 Nitrogen (ANH3) lb 0.28 30.0000 8.40 Custom Labor Fertilizer Application ac 9.00 1.0000 9.00 Pesticide with application ac 11.00 0.5000 5.50 Custom harvest - grain ac 12.60 1.0000 12.60 Custom haul - grain bu 0.14 18.0000 2.52 Fuel, diesel and gasoline gal 2.78 4.2158 11.72 Repair and Maintenance Implements ac 3.80 1.0000 3.80 Tractors ac 4.46 1.0000 4.46 Pickup ac 0.16 1.0000 0.16Interest on Operating Capital ac 4.89 1.0000 4.89 Total Direct Expenses 75.35 Fixed Expenses Implements ac 6.74 1.0000 6.74 Tractors ac 7.22 1.0000 7.22 Pickup ac 0.28 1.0000 0.28 Total Fixed Expenses 14.24Total Specified Expenses 89.59 Net Return to Land, Labor, and Management 59.92
16
Table 3. Estimated Costs and Returns Per Acre for Dryland Wheat Grazing (WHGO) in the Texas Panhandle (2008) Item Unit Price ($) Quantity Amount ($)Income Grazing, winter lb 0.43 68.0000 29.24 Grazing, March 1 through grazeout lb 0.43 207.0000 89.01 Total Income 118.25 Direct Expenses Seed, wheat bu 12.30 1.0000 12.30 Fertilizer, nitrogen (ANH3) lb 0.28 30.0000 8.40 Custom Labor Fertilizer application ac 9.00 1.0000 9.00 Herbicide with application ac 11.00 0.5000 5.50 Fuel, diesel and gasoline gal 2.78 4.3200 12.01 Repair and Maintenance Implements ac 3.80 1.0000 3.80 Tractors ac 4.46 1.0000 4.46 Pickup ac 0.16 1.0000 0.16 Interest on Operating Capital ac 4.89 1.0000 4.89 Total Direct Expenses 60.52 Fixed Expenses Implements ac 6.74 1.0000 6.74 Tractors ac 7.22 1.0000 7.22 Pickup ac 0.28 1.0000 0.28 Total Fixed Expenses 14.24Total Specified Expenses 74.76 Net Return to Land, Labor, and Management 43.49
17
Table 4. Estimated Costs and Returns Per Acre for Dryland Grain Sorghum (GS) in the Texas Panhandle (2008) Item Unit Price ($) Quantity Amount ($)Income Sorghum, grain cwt 6.43 21.0740 135.51 Total Income 135.51 Direct Expenses Sorghum seed lb 1.35 2.2500 3.04 Fertilizer, nitrogen (ANH3) lb 0.28 40.0000 11.20 Custom Labor Fertilizer Application ac 9.00 1.0000 9.00 Herbicide with application ac 16.20 1.0000 16.20 Custom harvest - grain ac 12.60 1.0000 12.60 Custom haul - grain cwt 0.25 21.0740 5.27 Fuel, diesel and gasoline gal 2.76 4.4637 12.32 Repair and maintenance Implements ac 5.81 1.0000 5.81 Tractors ac 5.02 1.0000 5.02 Pickup ac 0.16 1.0000 0.16 Interest on Operating Capital ac 2.90 1.0000 2.90 Total Direct Expenses 83.52 Fixed Expenses Implements ac 9.44 1.0000 9.44 Tractors ac 8.17 1.0000 8.17 Pickup ac 0.28 1.0000 0.28 Total Fixed Expenses 17.89Total Specified Expenses 101.41 Net Return to Land, Labor, and Management 34.10
18
Table 5. Estimated Costs and Returns Per Acre for Dryland Grain Sorghum with Residue Grazing (GSGRZ) in the Texas Panhandle (2008) Item Unit Price ($) Quantity Amount ($)Income Sorghum, grain cwt 6.43 21.0740 135.51 Grazing, sorghum residue ac 37.50 1.0000 37.50 Total Income 173.01 Direct Expenses Seed, grain sorghum lb 1.35 2.2500 3.04 Fertilizer, nitrogen (ANH3) lb 0.28 40.0000 11.20 Custom Labor Fertilizer Application ac 9.00 1.0000 9.00 Herbicide with application ac 16.20 1.0000 16.20 Custom harvest - grain ac 12.60 1.0000 12.60 Custom haul - grain cwt 0.25 21.0740 5.27 Fuel, diesel and gasoline gal 2.76 4.4637 12.32 Repair and Maintenance Implements ac 5.81 1.0000 5.81 Tractors ac 5.02 1.0000 5.02 Pickup ac 0.16 1.0000 0.16Interest on Operating Capital ac 2.90 1.0000 2.90 Total Direct Expenses 83.52 Fixed Expenses Implements ac 9.44 1.0000 9.44 Tractors ac 8.17 1.0000 8.17 Pickup ac 0.28 1.0000 0.28 Total Fixed Expenses 17.89Total Specified Expenses 101.41 Net Return to Land, Labor, and Management 71.60
19
Table 6. Estimated Costs and Returns Per Acre for Dryland Sorghum-Sudangrass Grazing (SS) in the Texas Panhandle (2008) Item Unit Price ($) Quantity Amount ($)Income Grazing, sorghum-sudan lb 0.43 245.0000 105.35 Total Income 105.35 Direct Expenses Seed, sorghum-sudan lb 0.36 15.0000 5.40 Fertilizer, nitrogen (ANH3) lb 0.28 50.0000 14.00 Fertilizer, custom application ac 9.00 1.0000 9.00 Fuel, diesel and gasoline gal 2.77 3.9666 10.99 Repair and Maintenance Implements ac 3.72 1.0000 3.72 Tractors ac 4.80 1.0000 4.80 Pickup ac 0.16 1.0000 0.16 Interest on Operating Capital ac 1.01 1.0000 1.01 Total Direct Expenses 49.08 Fixed Expenses Implements ac 6.33 1.0000 6.33 Tractors ac 7.82 1.0000 7.82 Pickup ac 0.28 1.0000 0.28 Total Fixed Expenses 14.43Total Specified Expenses 63.51 Net Return to Land, Labor, and Management 41.84
20
Table 7. System Rank for Net Return to Land, Labor and Management Rank System Mean Net Return ($) Standard Deviation
1 GSGRZ 71.60 89.56 2 WHGRZ-GSGRZ 65.76 75.01 3 WHGRZ 59.92 84.80 4 WHGO-GSGRZ 57.55 53.96 5 GSGRZ-SS 56.72 59.98 6 GS-GSGRZ 52.85 85.06 7 WHGRZ-WHGO 51.71 57.76 8 WH-GSGRZ 51.14 72.02 9 WHGRZ-SS 50.88 51.65 10 WHGRZ-GS 47.01 71.13 11 WH-WHGRZ 45.30 81.27 12 WHGO 43.49 31.90 13 WHGO-SS 42.67 27.16 14 SS 41.84 32.80 15 WHGO-GS 38.80 49.63 16 GS-SS 37.97 55.51 17 WH-WHGO 37.09 54.24 18 WH-SS 36.26 48.27 19 GS 34.10 80.56 20 WH-GS 32.39 68.09 21 WH 30.68 77.73
WH - wheat grown for grain WHGRZ - wheat is grazed and then harvested for grain WHGO - wheat grazeout, no grain harvested GS - grain sorghum, grain production GSGRZ - grain sorghum harvest for grain followed by residue grazing SS - sorghum-sudan for grazing paired systems are weighted equally
21
Table 8. System Rank by Increasing Coefficient of Variation for Net Return to Land, Labor and Management
Rank System Coefficient of Variation 1 WHGO-SS 0.6366 2 WHGO 0.7335 3 SS 0.7839 4 WHGO-GSGRZ 0.9376 5 WHGRZ-SS 1.0151 6 GSGRZ-SS 1.0575 7 WHGRZ-WHGO 1.1170 8 WHGRZ-GSGRZ 1.1406 9 GSGRZ 1.2509 10 WHGO-GS 1.2792 11 WH-SS 1.3313 12 WH-GSGRZ 1.4083 13 WHGRZ 1.4152 14 GS-SS 1.4620 15 WH-WHGO 1.4625 16 WHGRZ-GS 1.5131 17 GS-GSGRZ 1.6095 18 WH-WHGRZ 1.7939 19 WH-GS 2.1022 20 GS 2.3625 21 WH 2.5337
WH - wheat grown for grain production
WHGRZ - wheat is grazed and then harvested for grain
WHGO - wheat grazeout, no grain harvested
GS - grain sorghum -grain production
GSGRZ - grain sorghum harvest for grain followed by residue grazing
SS - sorghum-sudan for grazing
paired systems are weighted equally
22
Table 9. System Rank by Increasing Probability of Negative Net Returns to Land, Labor and Management Rank System Probability of Negative NR
1 WHGO-SS 5.81% 2 WHGO 8.64% 3 SS 10.10% 4 WHGO-GSGRZ 14.31% 5 WHGRZ-SS 16.23% 6 GSGRZ-SS 17.22% 7 WHGRZ-WHGO 18.53% 8 WHGRZ-GSGRZ 19.03% 9 GSGRZ 21.20% 10 WHGO-GS 21.72% 11 WH-SS 22.63% 12 WH-GSGRZ 23.88% 13 WHGRZ 23.99% 14 GS-SS 24.70% 15 WH-WHGO 24.71% 16 WHGRZ-GS 25.43% 17 GS-GSGRZ 26.72% 18 WH-WHGRZ 28.86% 19 WH-GS 31.71% 20 GS 33.60% 21 WH 34.65%
WH - wheat grown for grain production WHGRZ - wheat is grazed and then harvested for grain WHGO - wheat grazeout, no grain GS - grain sorghum -grain production GSGRZ - grain sorghum harvest for grain followed by residue grazing SS - sorghum-sudan for grazing paired systems are weighted equally