evaluating cardiac form and function in marine …
TRANSCRIPT

EVALUATING CARDIAC FORM AND FUNCTION IN MARINE MAMMALS
by
Rhea Storlund
B.Sc., The University of British Columbia, 2015
A THESIS SUBMITTED IN PARTIAL FULFILLMENT OF
THE REQUIREMENTS FOR THE DEGREE OF
MASTER OF SCIENCE
in
THE FACULTY OF GRADUATE AND POSTDOCTORAL STUDIES
(Zoology)
THE UNIVERSITY OF BRITISH COLUMBIA
(Vancouver)
March 2019
© Rhea Storlund, 2019

ii
The following individuals certify that they have read, and recommend to the Faculty of Graduate
and Postdoctoral Studies for acceptance, a thesis/dissertation entitled:
Evaluating cardiac form and function in marine mammals
submitted by Rhea Storlund in partial fulfillment of the requirements for
the degree of Master of Science
in Zoology
Examining Committee:
Dr. Andrew Trites
Supervisor
Dr. David Rosen
Supervisory Committee Member
Dr. William Milsom
Additional Examiner
Additional Supervisory Committee Members:
Dr. Robert Shadwick
Supervisory Committee Member
Dr. Martin Haulena
Supervisory Committee Member

iii
Abstract
The hearts of marine mammals frequently sustain marked changes in heart rate and vascular
resistance when diving. However, it is not known how marine mammal hearts facilitate these
changes. I examined cardiac function and electrical activity of marine mammal hearts to
understand how they might differ from terrestrial mammals. I measured electrocardiographic
parameters in 8 Steller sea lions, 5 northern fur seals, and 1 walrus—and echocardiographic
function in all 8 Steller sea lions. I also compiled electrocardiographic parameters from 17 species
of marine mammals (including my measurements) for comparison with 50 species of terrestrial
mammals. I found that atrial and ventricular depolarization are slower in marine mammals after
accounting for differences in body mass—and that the left ventricle of Steller sea lions contracts
less than expected for a mammal of that size. These differences in cardiac timing and function may
reflect specialized adaptations for diving. Electrocardiographic measurements of Steller sea lions,
northern fur seals, and a walrus also varied between species and among the individuals of each
species. For example, sinus arrhythmias occurred in 5 out of 8 individual Steller sea lions, but not
in northern fur seals or the walrus. Mean electrical axes were also unique to each individual and
varied greatly. Measurements ranged from -124° to 80°—with 3 of the Steller sea lions having
extreme right axis deviation (-111° to -124°). Echocardiographic measurements showed that left
ventricular form was similar between Steller sea lions and terrestrial mammals, except that Steller
sea lions have larger aortic roots and larger left ventricular end-systolic dimensions than terrestrial
mammals. Overall, my results show that marine mammals have functionally similar hearts to
terrestrial mammals with a number of notable differences that likely support anatomical
adaptations to diving.

iv
Lay Summary
I compared the hearts of marine mammals with those of terrestrial mammals to identify the
differences that allow marine mammals to dive for long durations. Overall, I found the functioning
hearts of marine mammals were similar to those of terrestrial mammals, with two notable
exceptions. One difference is the way in which their electrical conduction systems perform (which
affects their heart rates); and the second is differences in the sizes of their left ventricles (which
affects the extent of contractions and the volume of blood pumped out with each beat). These
differences from terrestrial mammalian hearts are likely evolutionary modifications that enhance
the diving abilities of marine mammals.

v
Preface
The research presented in this thesis is my original work. Under the guidance of Dr. Andrew
Trites and Dr. David Rosen, I designed the experiments, organized procedures, assisted with data
collection, compiled electrocardiographic data from the literature, performed the analyses, and
summarized my findings in writing. Suggestions and feedback from my committee members, Dr.
Trites, Dr. Rosen, Dr. Robert Shadwick, and Dr. Martin Haulena, were incorporated into the
experimental design, data analysis, and final draft of my thesis. Before final submission, I also
incorporated comments from my examiner, Dr. Bill Milsom. I formatted the data chapters (Ch. 2
and Ch. 3) as manuscripts for submission to peer-reviewed journals.
Conducting research with marine mammals was made possible with the help of the veterinary,
training, and technical staff at the Vancouver Aquarium and Open Water Research Station. Dr.
Marco Margiocco performed all of the echocardiograms and several of the electrocardiograms and
made all of the cardiac measurements. I assisted with the echocardiograms and performed the
remaining electrocardiograms. All research was conducted under the approval of the Animal Care
Committees at the Vancouver Aquarium and University of British Columbia (Permit #A17-0092).

vi
Table of Contents
Abstract ......................................................................................................................................... iii Lay Summary ................................................................................................................................ iv Preface ............................................................................................................................................ v Table of Contents .......................................................................................................................... vi List of Tables ............................................................................................................................... viii List of Figures ............................................................................................................................... ix List of Abbreviations ..................................................................................................................... x Acknowledgements ...................................................................................................................... xii Chapter 1: General introduction ................................................................................................. 1
Diving and the heart ............................................................................................................... 1 Mechanics of the dive response ............................................................................................. 1
Current knowledge of cardiac function in diving marine mammals ...................................... 3 Examining marine mammal cardiac function ........................................................................ 5
Chapter 2: Cardiac examinations of pinnipeds show deviations in structure and function
from typical mammalian hearts ................................................................................................... 7 Summary ................................................................................................................................ 7 Introduction ............................................................................................................................ 7 Methods .................................................................................................................................. 9
Animals ......................................................................................................................... 9 Anaesthetic protocols ................................................................................................... 9 General procedure ....................................................................................................... 10 Electrocardiography of pinnipeds ............................................................................... 10 Echocardiography of Steller sea lions ........................................................................ 10 Calculations ................................................................................................................ 11
Results .................................................................................................................................. 18 Steller sea lion echocardiography results ................................................................... 18 Steller sea lion, northern fur seal, and walrus ECG results ........................................ 18
Discussion ............................................................................................................................ 23 Steller sea lion cardiac structure ................................................................................. 23
Steller sea lion left ventricular form and function ...................................................... 24

vii
Steller sea lion, northern fur seal, and walrus electrocardiographic function ............ 25 Clinical significance ................................................................................................... 27
Conclusion ........................................................................................................................... 28 Chapter 3: Electrocardiographic scaling reveals differences in cardiac function between
marine and terrestrial mammals ............................................................................................... 29 Summary .............................................................................................................................. 29 Introduction .......................................................................................................................... 29 Methods ................................................................................................................................ 31
Meta-analysis .............................................................................................................. 31
ECG protocol .............................................................................................................. 33 Statistical analyses ...................................................................................................... 34
Results .................................................................................................................................. 34 Discussion ............................................................................................................................ 39
Marine and terrestrial mammals ................................................................................. 40 Effects of anaesthesia ................................................................................................. 41 ECG allometry ............................................................................................................ 42
Conclusion ........................................................................................................................... 43 Chapter 4: General discussion ................................................................................................... 44
Strengths and weaknesses .................................................................................................... 45 Future research ..................................................................................................................... 47 Conclusion ........................................................................................................................... 48
References .................................................................................................................................... 49 Appendices ................................................................................................................................... 58
Appendix A Steller sea lion QRS morphology .................................................................... 58 Appendix B Northern fur seal QRS morphology ................................................................. 59 Appendix C Walrus QRS morphology ................................................................................ 60 Appendix D ECG dataset ..................................................................................................... 61
Appendix E Supporting references for Appendix D ............................................................ 70

viii
List of Tables
Table 2.1 Echocardiographic measurements for 8 individual anaesthetized Steller sea lions and
group summary (median ± SD). All values are M-mode measurements except for LAD, Ao,
LA:Ao (2D), and AV Vmax, and PV Vmax (Doppler) ................................................................ 19
Table 2.2 Mean ± SD duration (ms) of ECG parameters for 5 northern fur seals, 8 Steller sea
lions and 1 walrus. ......................................................................................................................... 20
Table 2.3 Steller sea lion P-wave and T-wave polarity indicated by the number of individuals
with positive (+), negative (-), or biphasic waves in limb and augmented leads. ......................... 22
Table 2.4 Northern fur seal P-wave and T-wave polarity indicated by the number of individuals
with positive (+), negative (-), or biphasic waves in limb and augmented leads. ......................... 22
Table 2.5 Walrus P-wave and T-wave polarity indicated by the number of individuals with
positive (+), negative (-), or biphasic waves in limb and augmented leads. ................................. 22
Table 3.1 ANCOVA results of the minimal adequate model describing the relationship between
ecological group (EG), physiological state (PS), and ECG parameters accounting for the effects
of body mass (BM) as a covariate ................................................................................................. 36
Table 3.2 Linear regressions and allometric equations describing the relationship between body
mass (BM) and ECG parameters for mammals separated by ecological group and physiological
state as appropriate. ....................................................................................................................... 36
ix
List of Figures
Figure 2.1 Parasternal long axis view of a Steller sea lion heart showing the left ventricle (LV),
right ventricle (RV), left atrium (LA), and aortic root (Ao) .......................................................... 12 Figure 2.2 Parasternal short axis view of a Steller sea lion heart at the level of the aortic valve
showing the left atrium (LA) and aortic root (Ao) ........................................................................ 13 Figure 2.3 Parasternal short axis view of a Steller sea lion heart at the level of the papillary
muscles showing the left ventricle (LV), right ventricle (RV), interventricular septum (IVS), left
ventricular free wall (LVW) and the papillary muscles (PM) ....................................................... 14 Figure 2.4 Parasternal short axis view of a Steller sea lion heart at the level of the papillary
muscles (2D image, top), and motion of the cardiac chambers over time (M-mode image,
bottom) showing the left ventricle (LV), right ventricle (RV), interventricular septum (IVS) and
posterior wall of the left ventricle (LVW) ..................................................................................... 15
Figure 2.5 Doppler recording of aortic blood flow in a Steller sea lion ....................................... 16 Figure 2.6 Doppler recording of pulmonary blood flow in a Steller sea lion ............................... 17 Figure 2.7 Mean electrical axes of anaesthetized northern fur seals (n=5) .................................. 20 Figure 2.8 Mean electrical axes and typical QRS complexes of anaesthetized Steller sea lions
(n=8) .............................................................................................................................................. 21 Figure 3.1 Characteristic cardiac waveform for a single cardiac cycle in a mammal consisting of
several well-defined deflections termed the P, Q, R, S, and T waves ........................................... 32 Figure 3.2 Relationships between body mass and heart rate (A), PR interval (B), and QT interval
(C) in mammals ............................................................................................................................. 37 Figure 3.3 Relationship between body mass and P-wave duration in marine (grey circles and
dashed line) and terrestrial (black squares and solid line) mammals ............................................ 38 Figure 3.4 Relationship between body mass, ecological group, physiological state, and QRS
complex duration ........................................................................................................................... 38

x
List of Abbreviations
Ao Aortic root or aortic root diameter
AV Atrioventricular
AV Vmax Peak systolic aortic blood velocity
BM Body mass
CO Cardiac output
ECG Electrocardiogram
EG Ecological group
FS Fractional shortening
HR Heart rate
IVS Interventricular septum
IVSd Interventricular septum thickness in diastole
IVSs Interventricular septum thickness in systole
LA Left atrium
LA:Ao Left atrial to aortic root ratio
LAD Left atrial diameter
LVIDd Left-ventricular dimension in diastole
LVIDs Left-ventricular dimension in systole
LVW Left-ventricular free wall
LVWd Left-ventricular free wall thickness in diastole
LVWs Left-ventricular free wall thickness in systole
MAP Mean arterial blood pressure
MEA Mean electrical axis
M-mode Motion-mode echocardiography
NFS Northern fur seal
PM Papillary muscle
PS Physiological state
PV Vmax Peak systolic pulmonary blood velocity
RV Right ventricle
SA Sinoatrial
SSL Steller sea lion

xi
SV Stroke volume
TPR Total peripheral resistance
2D Two-dimensional echocardiography

xii
Acknowledgements
Thank you to everyone who has supported me in this endeavour. Mentors, colleagues, friends,
and family, I am grateful for your help in achieving this.
To my supervisor, Dr. Andrew Trites, thank you for allowing me to undertake a project
adjacent to your area of expertise and trusting me to complete it. You taught me to be a better
writer by teaching me to think of the whole story before beginning to write. To Dr. Dave Rosen,
your mentorship through every stage of this thesis has helped me to develop into a confident
researcher; thank you so much. To Dr. Martin Haulena, thank you for sharing your veterinary
expertise on this project and allowing me to work with the animals under your care. To Dr. Robert
Shadwick, thank you for inviting me into your lab, and thank you for your thoughtful questions
and helpful suggestions on my thesis. To Dr. Bill Milsom, thank you for helping me to better
understand my data and improve the final version of this thesis.
There is one person without whom my research would not have been possible. Dr. Marco
Margiocco, thank you for the countless hours that you have volunteered to this project. You have
taught me so much about echocardiography and electrocardiography and I am so grateful for your
expertise. It was a pleasure looking at hearts with you.
Working with 200 kg Steller sea lions is not easy, but thanks to the trainers, vet staff, and
technicians at the Vancouver Aquarium and Open Water Research Station, I never noticed.
Although this list is not exhaustive, I would like to thank Billy Lasby, Nigel Waller, Malgosia
Kaczmarska, Rebecca Barrick, Cesar Bertomeu, Troy Neale, Danielle Hyson, Sion Cahoon,
Gabrielle Beer, Dr. Amy Gould, Dr. Megan Strobel, Rob Marshall and Brian Sheehan for their
consistent involvement with this project. Your work has been critical to my success. I would also
like to recognize all of the animals that we work with because without them this research would
not be possible.
Thank you to the Marine Mammal Research Unit: Selina Agbayani, Aaron Purdy, Zach
Sherker, Dr. Sarah Fortune, Dr. Mei Sato, Dr. Beth Volpov, Hassen Allegue, and Mariana Diaz
Gomez for your friendship and advice. Pamela Rosenbaum, thank you for all the hard work that
you do behind-the-scenes, please know that it does not go unnoticed. Thank you to the
undergraduate students who wholeheartedly participated in our lab and assisted me with my data
collection: Casey Chiu, Brianna Cairns, Cody Carlyle, Allesandra Gentile, Eric Yang, Johanna
Fee, and Natasha Harland.

xiii
To my marine mammal friends who look at parts other than hearts, Dr. Margo Lillie, Kelsey
Gil, Cassandra Girdlestone, and Ellika Crichton, thank you. It has been so much fun exploring and
discussing marine mammals with you. Thank you also to everyone on the second floor of AERL
for making me smile every day, and a special thank you to Melanie Ang for cheering me on.
Thank you to my friends outside of UBC for getting me away from the computer and out into
nature. Having fun with you helped reenergize me to work on my thesis. I would especially like to
thank Steffy Chwedoruk for her supportive ear throughout my degree, and Anderson Li for his
daily encouragement and support during the final stages of this process, as well as his assistance
with graphic design.
To my family, Joan, Cliff, Nyls, and Piper Storlund, thank you for your unconditional love and
support every day. Everything that you have taught me and all the things that you do for me have
brought me to this point. Thank you!

1
Chapter 1: General introduction
Diving and the heart
Marine mammals are expert breath-holders that rely on their diving abilities for survival. Their
underwater success is due in large part to significant anatomical and physiological adaptations that
extend the duration of their dives. Their entire body is seemingly adapted to an aquatic life.
However, the adaptations of one organ to an aquatic existence, the heart, remain unclear. Knowing
how the hearts of marine mammals function can help to explain how they both facilitate and restrict
the diving abilities of marine mammals.
The fact that marine mammal hearts are grossly anatomically similar to terrestrial mammal
hearts suggests that they may function in similar ways. However, little research has been done on
the functionality of freely diving and resting marine mammal hearts. At its most basic level, the
heart is a pump that delivers blood to ensure adequate circulation of oxygen, carbon dioxide,
nutrients, waste, heat, and hormones. Marine mammal hearts, like the hearts of all mammals,
perform these same functions—but also must contend with circulatory changes that occur as part
of adaptations for prolonged diving, namely the dive response.
The dive response is one of the most important contributions to a marine mammal’s ability to
dive for long durations. It is found in all mammals, but is well-developed in marine mammals to
support their impressive diving abilities. The dive response consists of breath-hold (apnea),
constriction of blood vessels (vasoconstriction), and a decreased heart rate (bradycardia)
(Kooyman and Ponganis, 1998; Scholander, 1940) that coupled with enhanced oxygen stores
allows for the unrivalled diving abilities of marine mammals. During a dive, peripheral blood
vessels constrict and heart rate decreases facilitating conservation of blood oxygen stores for the
brain and heart, and use of muscle oxygen stores by the active muscles. Interestingly, the same
response that is required for oxygen storage management while diving may challenge the normal
functioning of the heart. It is unclear how marine mammal hearts accommodate such extensive
circulatory changes that would likely have detrimental effects on the hearts of terrestrial mammals.
Mechanics of the dive response
Management of oxygen stores through changes to circulation are attained by peripheral
vasoconstriction. The constriction of peripheral blood vessels conserves blood oxygen stores for
organs that depend on aerobic respiration (i.e., the brain and heart) by restricting circulation to

2
active muscles and inactive organs. A secondary consequence of peripheral vasoconstriction is
that it creates a localized hypoxemic environment at the muscles that is conducive to offloading
oxygen from myoglobin. This, in turn, makes the oxygen readily available for cellular respiration
in active muscles (Davis et al., 2004). Increases in blood pressure that would normally occur while
diving because of vasoconstriction must be prevented by adjustments to other aspects of the
circulation.
The circulatory system maintains a relatively constant mean blood pressure via tight regulation
of heart rate, stroke volume (the volume of blood ejected per heartbeat), blood vessel diameter
(i.e., changing the resistance to blood flow via vasoconstriction or vasodilation), and peripheral
vascular shunts (bypasses). This relationship is expressed by the mathematical equation:
!"# = %& × () × *#&
where MAP is mean arterial blood pressure, HR is heart rate, SV is stroke volume, and TPR is the
total resistance of the peripheral blood vessels (Boron and Boulpaep, 2017). In marine mammals,
decreases in heart rate are expected to be matched by increases in total peripheral resistance of
equal magnitude, while stroke volume does not change (e.g., Elsner et al., 1964; Ponganis et al.,
2006, 1991). In this way, increased vasoconstriction and decreased heart rate appear to occur in
tandem to prevent changes to blood pressure during a dive.
However, decreasing heart rate while maintaining stroke volume will result in decreased total
blood flow through the circulatory system. Decreased blood flow due to bradycardia challenges
the hearts of marine mammals because infrequent heartbeats can decrease oxygen delivery to the
heart and brain. The flow of blood exiting the heart (cardiac output, CO) is a function of heart rate
(HR) and stroke volume (SV), whereby:
+, = %& × () (Boron and Boulpaep, 2017).
Cardiac output, that is blood flow, will decrease if heart rate decreases and stroke volume remains
the same. This suggests that total circulation is reduced while marine mammals dive. However,
selective vasoconstriction allows for the diversion of blood away from the peripheral muscles and
inactive organs and helps maintain blood flow to the oxygen-sensitive heart and brain.
The aortic bulb is an adaptation in marine mammals that may also help maintain blood flow by
what is known as the windkessel effect (Blix and Folkow, 1983). The aortic bulb is an elastic

3
enlargement of the ascending aorta found in several species of marine mammals. It is thought to
act like a blood-filled balloon that provides continuous blood flow by passively recoiling between
heartbeats. It performs similarly to the human aorta, except that it is larger in size and more
distensible which could potentially prolong blood flow for longer times in marine mammals.
Marine mammal hearts need to be able to rapidly change how fast they beat. During a dive,
heart rate decreases, usually reaching its lowest rate as the animal reaches the maximum depth of
its dive (e.g., Williams et al., 1991). When the animal approaches the surface, its heart rate
increases to support replenishment of oxygen stores and removal of carbon dioxide and wastes
from the blood. These changes in heart rate are mediated by input from the autonomic nervous
system (Ponganis et al., 2017). Vagal stimulation to the heart’s atrioventricular (AV) node signals
a decrease in heart rate.
How marine mammal hearts can withstand the challenges imposed by the dive response is
unclear. Understanding of the cardiovascular changes that occur in diving mammals would be best
studied from direct, non-invasive measurements of blood pressure, blood flow, heart rate and
stroke volume in freely diving marine mammals; but such measures are extremely logistically
difficult to obtain. There is evidence suggesting that cardiac function in marine mammals is
unique, but it is difficult to ascertain how cardiac function in marine mammals has been modified
from terrestrial mammals. Determining how cardiac function in marine mammals differs from
terrestrial mammals may reveal cardiac limitations to diving, and may help explain why marine
mammals can dive for such long durations.
Current knowledge of cardiac function in diving marine mammals
Cardiovascular function in marine mammals was initially studied using invasive methods and
forced dives which limit understanding of the natural cardiovascular responses of marine
mammals. As more measurements from unrestrained animals were collected, it became apparent
that the dive response was more variable and complex than what was initially reported. However,
measurements from forced dives provided knowledge of the extremes of what marine mammals
are capable of.
Fundamental studies of diving physiology have shaped how we think about cardiovascular
responses to diving. Diving physiology was investigated by Scholander (1940) who described the
bradycardia, vasoconstriction, and oxygen storage management now synonymous with the dive

4
response. Using forced submersions of seals, Irving, Scholander, and Grinnel (1941) observed that
blood pressure did not change during a forced dive, despite the decrease in heart rate, suggesting
that heart rate decreases in synchrony with increasing vascular resistance. Using a similar protocol,
Zapol (1979) showed the distribution of blood flow in Weddell seals when they are submerged.
This study also showed that blood flow to the brain was maintained and blood flow to the heart
decreased slightly, whereas blood flow to the muscles was greatly restricted. These results
provided direct evidence of vasoconstriction and confirmed that oxygen-dependent tissues are
supplied with blood during a dive. To this day, slowed heart rate, vasoconstriction, unchanged
blood pressure, and redistribution of blood oxygen stores remain as the key cardiovascular
components of the dive response.
The dive response elicited from forced dives produced an immediate marked bradycardia and
vasoconstriction, which is not observed to the same extent in freely diving animals. Animals that
perform short dives without exhausting their oxygen stores (within their aerobic dive limit) do not
exhibit the classic dive response described by the early research (Butler, 1982). Their heart rates
are also more variable and may correspond better to exercise than diving (Butler, 1982). However,
the classic dive response is still observed during long-duration, deep dives.
More recently, variability in the dive response was further explored in freely diving animals.
Minimally invasive biologging techniques have shown that cardiac arrhythmias occur at the
bottom of Weddell seal and bottlenose dolphin dives, and that the dive response is not all or
nothing, but instead a gradation that reflects cognitive control dive depth, dive duration, physical
activity, and external stress (Elmegaard et al., 2016; Elsner et al., 1964; Hindle et al., 2010;
Williams et al., 2017, 2015). There is debate over how the dive response and the exercise response
interact in diving marine mammals as they have opposite effects on heart rate and vasoconstriction
(Davis and Williams, 2012; Ponganis et al., 2017).
Throughout my thesis, I discuss the dive response in terms of all marine mammals. However,
it is important to note that there is minimal data to show a similar response occurs in baleen whales.
Understanding of the dive response mostly comes from studies on pinnipeds and dolphins because
cardiovascular studies of large whales are extremely difficult to perform. The limited cardiac data
from large whales comes from electrocardiographic recordings of a grey whale, two humpback
whale and a fin whale (Meijler et al., 1992; Ponganis and Kooyman, 1999; Senft and Kanwisher,
1960). Due to this data deficit, large whales cannot be claimed to display the same dive response

5
as observed in pinnipeds and dolphins. However, there is evidence from eupneic and apneic heart
rates of a young grey whale to suggest that they similarly undergo diving bradycardia (Ponganis
and Kooyman, 1999). In addition, the deep, long-duration dives performed by whales are
suggestive of them having a pronounced dive response.
An additional complicating factor in documenting the dive response of large whales is that the
majority of a large whale’s daily activities take place underwater while they are breath hold diving
and they only come to the surface to breathe. In studied marine mammals, the dive response
appears to reflect the amount of time that a species spends diving compared to the time they spend
hauled-out on land or at the surface. Generally speaking, empirical data has shown that species
that spend more time diving than hauled out, such as phocids, have more pronounced dive
responses than species that spend less time diving than time hauled out, such as otariids. It is
unclear if this trend continues in large cetaceans which likely undergo bodily processes that require
blood flow like digestion while holding their breath underwater. How these processes affect the
dive response are unclear. It would seem that a pronounced dive response would be required for
the deep, long-duration dives that whales make, but perhaps shorter surface dives with minimal
vasoconstriction are also occurring.
Despite what has been learned about the ability of marine mammals to dive, several questions
about the cardiovascular system of marine mammals remain. My research focuses on
understanding how the hearts of marine mammals’ function to cope with the challenges imposed
by the dive response.
Examining marine mammal cardiac function
My thesis research seeks to determine whether adaptations to cardiac function exist in marine
mammals. I addressed this research question in two ways. First, I evaluated cardiac function in 3
species of marine mammals. Second, I compared cardiac function in marine mammals to terrestrial
mammals. Thus, the overarching goal of my thesis was to increase understanding of marine
mammal heart function by identifying potential cardiac adaptations to diving. I thereby sought to
explain how marine mammal hearts support extended diving, as well as how they also constrain
this behaviour.
My first data chapter (Chapter 2) evaluates within- and between-species variability in cardiac
function in Steller sea lions, northern fur seals, and walrus using electrocardiographic recordings

6
of all three species, and echocardiographic examinations of Steller sea lions. These two techniques
are non-invasive, have standardized protocols, and can be compared with other marine and
terrestrial mammals.
Electrocardiography records cardiac rhythm by measuring the electrical activity of the heart
(Bayés De Luna et al., 2012). When the sinoatrial node spontaneously depolarizes, adjacent
myocardial cells also depolarize. This depolarization of cardiac muscle cells stimulates
contraction. Consequently, the timing and coordination of the electrical signalling is imperative
for cardiac filling and ejection. Comparative analyses of mammalian electrocardiograms (ECGs)
demonstrate that there is a characteristic pattern to electrical depolarization, and that the timing is
fairly consistent for all species when body mass is accounted for (Günther and Morgado, 1997).
Thus, adjusting for body mass allows for ECG measurements to be compared between marine and
terrestrial mammals.
Echocardiography provides real-time images of the heart throughout the cardiac cycle. It is
largely used to assess left ventricular function and can evaluate blood flow when Doppler data are
available. In contrast with electrocardiography, broad comparisons of mammalian
echocardiographic parameters have not yet been described. However, within-species relationships
from dogs and cats clearly show that echocardiographic parameters scale to body mass (Cornell et
al., 2004; Scansen and Morgan, 2015). The beating heart of Steller sea lions can be observed as it
contracts and relaxes using echocardiography—information that cannot be learned from
dissections or ECGs.
My second data chapter (Chapter 3) compares the cardiac timing of different species of marine
and terrestrial mammals to identify differences in the electrical activity of their hearts. I obtained
these data for Steller sea lions, northern fur seals, and a walrus in the studies presented in Chapter
2, as well as from published articles. Using these data, I compared cardiac timing to determine
how electrical activity in the hearts of marine mammals differs from that of terrestrial mammals.
The mammalian ECG is ideal for comparative analysis because it is well understood and
characterized, and scales with body mass. This chapter benefits from the wide range of published
mammalian ECGs, including 14 accounts from marine mammals.
Both data chapters are prepared as stand-alone manuscripts that I intend to publish in peer-
reviewed journals. As a result, there is some overlap of the material covered in each chapter.
7
Chapter 2: Cardiac examinations of pinnipeds show deviations in structure
and function from typical mammalian hearts
Summary
Pinniped hearts are anatomically well described, but less is known about how they function.
We evaluated cardiac function in three species of pinnipeds under anaesthesia by performing
complete electrocardiographic examinations of Steller sea lions (n=8), northern fur seals (n=5) and
a walrus (n=1). We also undertook echocardiographic examinations of all 8 Steller sea lions to
evaluate cardiac form and function. Compared with terrestrial mammals, the hearts of Steller sea
lions had larger aortic roots and larger left ventricular end-systolic diameters. Additionally, mean
electrical axes of pinniped hearts were atypical of terrestrial mammals (ranging from -124° to 80°),
with some individuals having right cranial orientations indicative of extreme right axis deviation
(when compared to humans). The values we measured provide insights into cardiac function in
marine mammals and are useful baseline reference points for assessing cardiac function in
pinnipeds under human care. Our results suggest that while some functional differences between
marine and terrestrial mammal hearts simply reflect anatomy, others are likely specialized
adaptations to support diving and prolonged breath-holding.
Introduction
The anatomy and function of mammalian hearts have changed little over evolutionary time due
to the essential role that the heart plays in transporting oxygen, nutrients, carbon dioxide, wastes
and hormones throughout the body. Comparative mammalian studies have found that cardiac
morphology, heart mass, electrical signal conduction, and left ventricular function are similar
among many species of mammals (e.g., Günther and Morgado, 1997; Holt et al., 1968, 1962;
Kusunose et al., 2012; Meijler, 1985; Noujaim et al., 2004; Prothero, 1979). However, marine
mammals, which have long been suspected of having specialized cardiac adaptations to support
extended breath holding, have been underrepresented in these analyses. Additional in vivo studies
of marine mammal hearts are therefore required to determine whether functional cardiac
differences do in fact exist between marine and terrestrial mammals to support diving and the
accompanying cardiovascular changes experienced by marine mammals (e.g., bradycardia and
vasoconstriction).

8
Despite the noted commonality among mammals, some structural differences have been
observed between the hearts of marine and terrestrial mammals. For example, dissections of
marine mammal hearts have revealed dorsoventral compression (Murie, 1874; Smodlaka et al.,
2008) and a tendency towards a bifid apex (Drabek, 1975; Murie, 1874; Rowlatt, 1990; Stewardson
et al., 1999; Tarpley et al., 1997). It has also been shown that marine mammals have enlarged
ascending aortas (aortic bulbs) (Drabek, 1975; King, 1977; Murie, 1874; Smodlaka et al., 2009)
and enlarged or specialized regions of conductive tissue (Purkinje and Todd fibres) (Nie, 1987;
Pfeiffer, 1990; van Nie, 1986). While dissections effectively demonstrate anatomical differences
with terrestrial mammal hearts, they cannot reveal how these structural differences affect cardiac
function throughout the cardiac cycle.
Electrocardiography and echocardiography are two methods commonly used to assess cardiac
function. Electrocardiography is a means to measure heat rate and electrical signal conduction
through the myocardium—and has shown similar patterns between the timing of electrical signal
conduction in terrestrial mammals and at least 14 species of cetaceans and pinnipeds (e.g., Dassis
et al., 2016; Harms et al., 2013; Irving et al., 1941; King et al., 1953; Meijler et al., 1992; Meijler
and van der Tweel, 1986; Murdaugh et al., 1966; Ponganis and Kooyman, 1999). Despite the
seemingly large dataset of mammalian electrocardiograms, more ECGs from marine mammals are
required to evaluate electrophysiological adaptations to diving, and allow for comparisons
between cetaceans and pinnipeds. Currently, there are too few electrocardiographic recordings of
marine mammals in the literature to confidently draw conclusions about diving specializations.
Further, most data for marine species are collected from only one or a few individuals which may
not accurately represent the entire species. Electrocardiography provides overall information about
electrical cardiac function, but does not directly address left ventricular function and myocardial
contraction. Other techniques are required for this, such as echocardiography.
Echocardiography has recently been used to study left ventricular structure and function in
marine mammals (e.g., Castro et al., 2018; Chetboul et al., 2012; Dennison et al., 2011b, 2011a;
Miedler et al., 2015). This non-invasive technique makes it possible to directly observe structural
changes of the heart during cardiac cycles—thus providing information about function that cannot
be seen through dissection. It is less invasive than previous techniques (although anaesthesia may
be required) and echocardiographic reference values have only been determined for two species
of marine mammals (both of which were trained and conscious during the procedure)—southern

9
sea lions (Otaria flavenscens) (Castro et al., 2018) and bottlenose dolphins (Tursiops truncatus)
(Chetboul et al., 2012; Miedler et al., 2015). Unfortunately, echocardiograms of marine mammals
have not been performed underwater on diving or stationary animals, largely due to the difficulty
of taking ultrasounds measurements underwater. Collecting additional echocardiograms from an
array of marine mammals can yield data needed to better understand what, if any, specialized
cardiac adaptations marine mammals possess to facilitate diving.
To increase understanding of cardiac function in pinnipeds, we used electrocardiography and
echocardiography to assess cardiac structure and function in anaesthetized, female Steller sea lions
(Eumetopias jubatus). We also collected additional ECGs from northern fur seals (Callorhinus
ursinus) and a walrus (Odobenus rosmarus) to better understand electrophysiological function of
pinniped hearts. This is the first complete cardiac study of Steller sea lions, and the second
documented echocardiographic assessment of a pinniped to report reference values. The cardiac
data we obtained are useful for interspecies comparisons, to understand adaptions that may be
linked to diving capacity, and provide useful baselines for cardiac function in pinnipeds cared for
in zoos, aquariums, and rehabilitation facilities.
Methods
Animals
We used Steller sea lions (n=8), northern fur seals (n=5), and one walrus maintained in human
care either at the Vancouver Aquarium (Vancouver, BC) or the UBC Open Water Research Station
(Port Moody, BC). All animals were clinically healthy at the time of the study. The sea lions and
fur seals were all adult females, and the walrus was a juvenile male (23 months).
Anaesthetic protocols
All animals were anaesthetized according to previously established protocols under the
supervision of a veterinarian. The sea lions and fur seals were anaesthetized using <5% inhalational
isoflurane, while the walrus was anaesthetized using <8% inhalational sevoflurane. Two of the
Steller sea lions, F03RO and F03IZ, were given diazepam (~0.14 mg/kg) about thirty minutes prior
to anaesthesia.

10
General procedure
We performed electrocardiography and transthoracic echocardiography on the Steller sea lions,
and performed only electrocardiography on the northern fur seals and walrus. All animals were
out of water for the duration of the procedure. Measurements at the Vancouver Aquarium were
taken indoors, whereas those at the Open Water Research Station were collected outdoors. No
attempt was made to keep air temperature constant at either location.
Electrocardiography of pinnipeds
We used an IDEXX CardioPet ECG device and CardioPet software version 6.2 to record 6-
lead ECGs. All ECG recordings were made in the frontal plane. Clip positioning was species-
dependent, and subcutaneous needles were required to obtain a recording from the walrus. We
collected two one-minute ECG recordings from each individual.
Electrocardiographic measurements were taken by a veterinary cardiologist following standard
procedures using VetMedStat online telemedicine software. In all individuals, we measured the
following electrocardiographic parameters: P-wave, PQ, QRS, and QT interval durations, P-, R-,
and T-wave amplitudes, P- and T-wave polarities, and calculated the net direction of myocardial
depolarization and repolarization (mean electrical axis).
Echocardiography of Steller sea lions
Echocardiography was also performed by a veterinary cardiologist. We used a GE LOGIQ e
portable ultrasound with ECG module to obtain images and take measurements.
Electrocardiograms (procedure above) were recorded prior to positioning the sea lions for
echocardiography.
Echocardiographic recordings were first taken from F00BO and F97SI. The procedure was
subsequently modified for the remaining sea lions. Initially, we viewed the heart with the sea lion
in left lateral recumbency using a probe positioned on the right side of the sea lion’s chest near the
flipper insertion. We then positioned the sea lion in dorsal recumbency with the probe on the right
side of their chest to measure peak aortic and pulmonary velocities. The first two procedures were
challenging because we imaged the heart from above—while gravity pulled the heart away from
the chest (and probe). This positioning required placing greater pressure on the chest to obtain
images, and meant we were initially unable to obtain useable images for one sea lion, F00YA.

11
We improved our procedure by setting up two large wooden platforms arranged with a V-
shaped gap between them to act as an echocardiographer’s table. With a sea lion in right lateral
recumbency with its chest positioned over the gap, we obtained images from below. This setup
resulted in clearer images that could be reliably obtained in less time, and required less pressure
on the sea lions’ chests. To record flow measurements, we repositioned the platforms so that the
cut-out was on the opposite side—and positioned the sea lion in left lateral recumbency with its
chest over the gap. Again, we obtained images from below.
In all of the Steller sea lions, we were able to view the parasternal long axis (Fig. 2.1) and
parasternal short axes at the level of the aortic valve (Fig. 2.2), mitral valve, and papillary muscles
(Fig. 2.3) of the heart. The measured echocardiographic parameters included: heart rate, left
ventricular chamber diameter, interventricular septum thickness, and left ventricular posterior wall
thickness at end-systole and end-diastole using M-mode (Fig. 2.4), left atrium and aortic root
dimensions using 2D, and maximum aortic and pulmonary flow velocities using Doppler (Fig. 2.5
and 2.6).
Calculations
Mean ± standard deviation (SD) electrocardiographic parameters are reported for the Steller
sea lions, northern fur seals, and walrus. The mean electrical axis (MEA) for each individual was
calculated using:
!-" = arctan345678, ;)<678= ×180A
where DIamp is the amplitude of the R-wave in lead I, and aVFamp is the amplitude of the R-wave in lead aVF (Santilli and Perego, 2009).
Echocardiographic measurements for the Steller sea lions were not normally distributed, and
are therefore reported as medians ± SD. Medians are not as sensitive as means to outliers when
samples sizes are small, and therefore provided a more accurate representation of our sample
population. The non-normal distribution also prevented us from calculating and reporting the 95%
prediction intervals that would have been beneficial for clinical use. Fractional shortening, the
percentage decrease of the left ventricular diameter from diastole to systole, was calculated using:
B)54C − B)54EB)54C × 100%

12
where LVIDd is left ventricular end-diastolic diameter, and LVIDs is left ventricular end-systolic
diameter.
Figure 2.1 Parasternal long axis view of a Steller sea lion heart showing the left ventricle (LV), right ventricle (RV), left atrium (LA), and aortic root (Ao).

13
Figure 2.2 Parasternal short axis view of a Steller sea lion heart at the level of the aortic valve showing the left atrium (LA) and aortic root (Ao).

14
Figure 2.3 Parasternal short axis view of a Steller sea lion heart at the level of the papillary muscles
showing the left ventricle (LV), right ventricle (RV), interventricular septum (IVS), left ventricular free wall (LVW) and the papillary muscles (PM).

15
Figure 2.4 Parasternal short axis view of a Steller sea lion heart at the level of the papillary muscles (2D image, top), and motion of the cardiac chambers over time (M-mode image, bottom) showing the left
ventricle (LV), right ventricle (RV), interventricular septum (IVS) and posterior wall of the left ventricle (LVW). Left ventricular end-diastolic diameter (LVIDd) and left ventricular end-systolic diameter (LVIDs) were measured as shown by the white arrows using the leading edge to leading edge technique.

16
Figure 2.5 Doppler recording of aortic blood flow in a Steller sea lion. Flow profile is traced in green.

17
Figure 2.6 Doppler recording of pulmonary blood flow in a Steller sea lion. Flow profile is traced in green.

18
Results
Steller sea lion echocardiography results
All echocardiographic parameters were successfully measured for all study animals unless
specifically noted. Echocardiographic parameters for Steller sea lions under anaesthesia (Table
2.1) were summarized as medians ± SD. Median heart rate determined in M-mode was 50.5 ± 7.1
bpm. Left atrial to aortic root ratio (LA:Ao) was 0.92 ± 0.17, with the ratio <1 in 5 of the 8 sea
lions, meaning these individuals have a larger aortic root than left atrial diameter. Fractional
shortening was 31.90 ± 7.75 %. Peak aortic velocity measured in 7 of the 8 sea lions had a median
of 0.64 ± 0.21 m/s, while peak pulmonary velocity measured in 6 of 8 sea lions had a median of
0.83 ± 0.17 m/s.
Steller sea lion, northern fur seal, and walrus ECG results
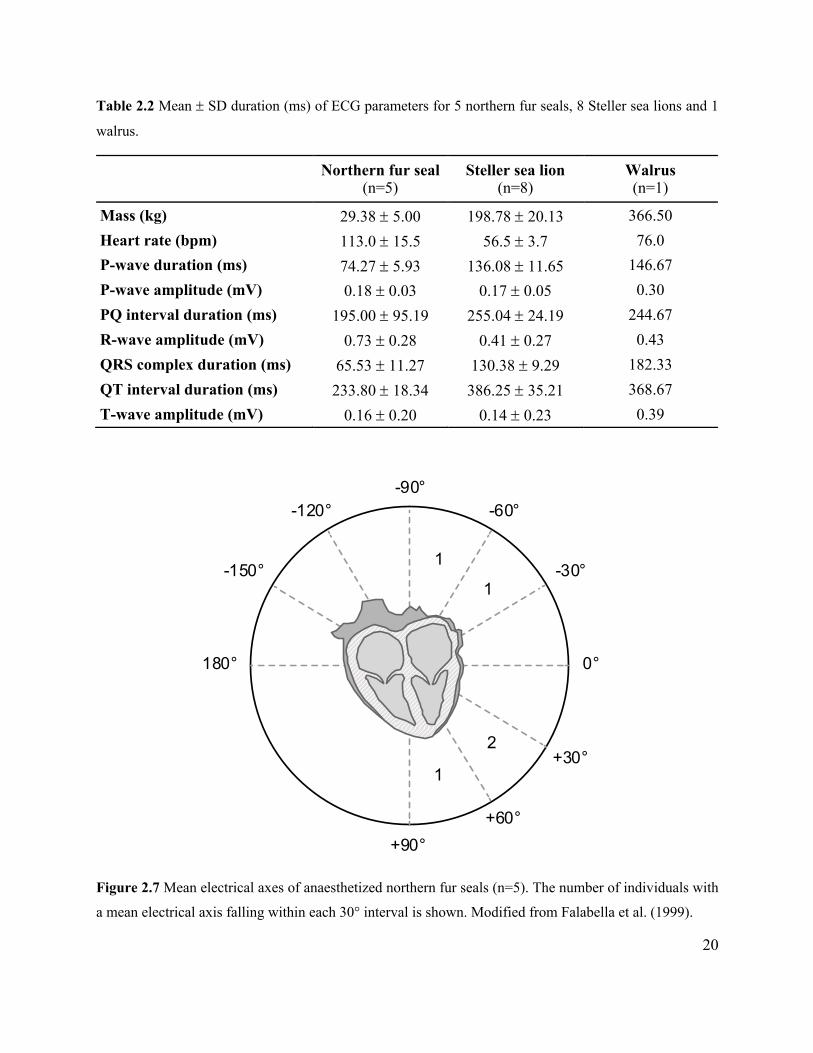
Mean heart rate while anaesthetized was 113.0 ± 15.5 bpm in northern fur seals, 56.5 ± 3.7
bpm in Steller sea lions, and 76.0 bpm in a walrus (Table 2.2). Sinus arrhythmias were detected in
5 out of 8 Steller sea lions, but not in the walrus or any of the northern fur seals. Cardiac waveforms
for all species matched the typical mammalian pattern.
Mean electrical axes for northern fur seals ranged from -79° to 80° (Fig. 2.7), while those of
Steller sea lions ranged from -124° to 8° (Fig. 2.8), and the MEA of the walrus was -35°. There
was no identifiable dominance in MEA for Steller sea lions and northern fur seals, perhaps due to
small sample sizes.
Steller sea lion P- and T-wave polarities were fairly consistent between individuals for each
lead (Table 2.3). The majority of sea lions had positive P-waves in all leads except in aVL (for
which the majority had negative P-waves). Similarly, the majority of sea lions had positive T-
waves in all leads except for aVR and aVL. P- and T-wave polarity in northern fur seals was
consistent with the pattern observed for Steller sea lions with the exception of the majority of fur
seals having negative P-wave polarity in lead aVR (Table 2.4). The P- and T-wave polarities of
the walrus were almost the same as Steller sea lions, with the exception of having a biphasic T-
wave in lead 1 (Table 2.5).

19
QRS morphology for each lead was consistent among the sea lions (Fig. 2.8 and Appendix A),
but appeared to be unique for each northern fur seal with few observable trends (Appendix B). No
comparisons could be made for walrus with just one set of measurements (Appendix C).
Table 2.1 Echocardiographic measurements for 8 individual anaesthetized Steller sea lions and group summary (median ± SD). All values are M-mode measurements except for LAD, Ao, LA:Ao (2D), and AV
Vmax, and PV Vmax (Doppler). Abbreviations: LAD = left atrial diameter, Ao = aortic root diameter, LA:Ao = left atrial to aortic root ratio, LVIDs = left ventricular internal diameter in systole, LVIDd = left ventricular internal diameter in diastole, IVSs = interventricular septum thickness in systole, IVSd = interventricular septum thickness in diastole, LVWs = left ventricular free wall thickness in systole, LVWd = left ventricular free wall thickness in diastole, FS = fractional shortening, AV Vmax = peak systolic aortic blood velocity, PV Vmax = peak systolic pulmonary blood velocity, HR = heart rate. NA indicates measurement not available.
Individual Measurements
F00BO F97HA F03RO F03AS F03WI F03IZ F00YA F97SI Median ± SD
Mass (kg) 166.5 173.0 192.0 199.2 204.4 208.6 219.5 227.0 201.8 ± 21.1
LAD (cm) 4.53 4.15 4.20 3.01 4.28 5.23 4.60 4.71 4.41 ± 0.64
Ao (cm) 4.25 4.47 5.13 4.90 5.25 4.90 4.25 5.17 4.90 ± 0.41
LA:Ao 1.07 0.93 0.82 0.61 0.77 1.07 1.08 0.91 0.92 ± 0.17
LVIDs (cm) 5.50 3.48 3.64 5.34 4.65 4.00 4.43 5.69 4.54 ± 0.86
LVIDd (cm) 8.26 5.57 5.23 6.45 5.93 6.25 6.00 9.16 6.13 ± 1.37
IVSs (cm) 1.70 2.15 2.10 1.97 2.20 2.85 1.70 2.28 2.12 ± 0.37
IVSd (cm) 1.13 1.68 1.45 1.46 1.48 1.79 1.47 1.51 1.47 ± 0.19
LVWs (cm) 1.80 2.23 2.30 1.84 2.40 2.12 2.32 2.44 2.26 ± 0.24
LVWd (cm) 1.18 1.69 1.91 1.63 2.15 1.68 1.60 1.96 1.69 ± 0.29
FS (%) 33.35 37.51 30.45 17.29 21.16 36.04 26.17 37.89 31.90 ± 7.75
AV Vmax 1.06 0.49 0.58 0.64 0.94 0.58 0.75 NA 0.64 ± 0.21
PV Vmax 0.80 0.60 0.86 0.56 0.87 1.01 NA NA 0.83 ± 0.17
HR (bpm) 56.1 41.5 62.5 50.5 48.0 NA 46.8 56.2 50.5 ± 7.1
20
Table 2.2 Mean ± SD duration (ms) of ECG parameters for 5 northern fur seals, 8 Steller sea lions and 1
walrus.
Northern fur seal
(n=5) Steller sea lion
(n=8) Walrus
(n=1)
Mass (kg) 29.38 ± 5.00 198.78 ± 20.13 366.50 Heart rate (bpm) 113.0 ± 15.5 56.5 ± 3.7 76.0 P-wave duration (ms) 74.27 ± 5.93 136.08 ± 11.65 146.67 P-wave amplitude (mV) 0.18 ± 0.03 0.17 ± 0.05 0.30 PQ interval duration (ms) 195.00 ± 95.19 255.04 ± 24.19 244.67 R-wave amplitude (mV) 0.73 ± 0.28 0.41 ± 0.27 0.43 QRS complex duration (ms) 65.53 ± 11.27 130.38 ± 9.29 182.33 QT interval duration (ms) 233.80 ± 18.34 386.25 ± 35.21 368.67 T-wave amplitude (mV) 0.16 ± 0.20 0.14 ± 0.23 0.39
Figure 2.7 Mean electrical axes of anaesthetized northern fur seals (n=5). The number of individuals with
a mean electrical axis falling within each 30° interval is shown. Modified from Falabella et al. (1999).
1
1
2
1
0°
+30°
-30°
+60°
180°
-150°
-120°-90°
-60°
+90°

21
Figure 2.8 Mean electrical axes and typical QRS complexes of anaesthetized Steller sea lions (n=8). The number of individuals with a mean electrical axis falling within each 30° interval is shown. Typical QRS morphology based on the shape displayed by the highest proportion of sea lions for each lead is depicted with descriptive nomenclature. Lowercase letters indicate small deflections, capital letters indicate large deflections, and apostrophes indicate a secondary wave of the given type. Modified from Falabella et al. (1999) and Santilli and Perego (2009).
0°
+30°
-30°
+60°
180°
-150°
-120°-90°
-60°
+90°+120°
+150°
2
1
2
12
+aVL
+I
+II
+aVF
+III
+aVR
qR
qRs
qRS
rS
rS
rSr’

22
Table 2.3 Steller sea lion P-wave and T-wave polarity indicated by the number of individuals with positive (+), negative (-), or biphasic waves in limb and augmented leads.
P-wave polarity T-wave polarity
+ - Biphasic + - Biphasic I 8 0 0 6 1 1 II 8 0 0 7 0 1 III 5 1 2 6 1 1 aVR 0 8 0 1 7 0 aVL 5 3 0 2 5 1 aVF 8 0 0 6 0 2
Table 2.4 Northern fur seal P-wave and T-wave polarity indicated by the number of individuals with positive (+), negative (-), or biphasic waves in limb and augmented leads.
P-wave polarity T-wave polarity
+ - Biphasic + - Biphasic I 5 0 0 3 1 1 II 5 0 0 4 0 1 III 5 0 0 3 0 2 aVR 0 5 0 0 4 1 aVL 0 5 0 1 2 2 aVF 4 0 1 4 0 1
Table 2.5 Walrus P-wave and T-wave polarity indicated by the number of individuals with positive (+), negative (-), or biphasic waves in limb and augmented leads.
P T
I + Biphasic II + + III + + aVR - - aVL + - aVF + +

23
Discussion
Our echocardiographic and electrocardiographic analyses of pinnipeds revealed several
deviations from typical mammalian cardiac structure and function. As expected, our results
confirm that Steller sea lions have large aortic roots. Unexpectedly, we found that Steller sea lions
have larger left ventricular chamber dimensions during contraction that terrestrial mammals of
equivalent body mass. In addition, the mean electrical axis of most individuals deviated from the
expected left caudal orientation. The significance of these differences is largely unknown, but may
reflect functional consequences of diving.
Steller sea lion cardiac structure
This is the first complete echocardiographic study of a Steller sea lion, and only the second of
a pinniped to date (Castro et al., 2018). Comparing to other mammals (including cats, dogs, goats,
buffalo, and cows), echocardiographic parameters for Steller sea lion hearts were more similar to
those of southern sea lions and bottlenose dolphins than to terrestrial mammals (Castro et al., 2018;
Chetboul et al., 2012). No visible signs of cardiac abnormalities were detected in the
echocardiograms. The only notable observation was the presence of a false tendon in one of the
sea lions (F00YA). False tendons are bands of fibrous tissue that stretch across the left ventricle,
and naturally occur in healthy mammals, especially cats (Kimura et al., 2016). Therefore, it is not
an entirely unexpected finding in sea lions.
Consistent with other studies, we found that Steller sea lions have a larger aortic root than
terrestrial mammals of similar sizes. A large aortic root is common in marine mammals and has
been previously documented by echocardiography in southern sea lions (Castro et al., 2018). The
proposed functions of this structure, known as the aortic bulb, are to maintain continuous blood
flow to the brain and heart during the prolonged inter-beat intervals due to diving bradycardia, to
decrease peak systolic blood pressure, and to reduce myocardial work (Campbell et al., 1981;
Elsner, 1969; Rhode et al., 1986; Shadwick and Gosline, 1994; Thornton et al., 2005).
Aortic bulbs have been documented in more than 13 species of marine mammals to date (e.g.,
Drabek, 1975; Drabek and Burns, 2002; King, 1977; Rhode et al., 1986; Smodlaka et al., 2008;
Stewardson et al., 1999), including Steller sea lions (Murie, 1874). Beyond blood flow
maintenance, the functional consequences of the aortic bulb, such as its effects on cardiac work
and stroke volume, are unknown. Technical and anatomical limitations prevented us from viewing

24
the ascending aorta using transthoracic echocardiography in Steller sea lions and thus prevented
further inquiry into the function of the aortic bulb. Future in vivo studies of the aortic bulb are
needed to confirm that it maintains blood flow in marine mammals when they are diving, and to
test the additional hypotheses of its functional significance.
Steller sea lion left ventricular form and function
In comparison to terrestrial mammals, Steller sea lions (this study) and southern sea lions
(Castro et al., 2018) appear to have larger left ventricular end-systolic diameters than expected for
their body masses, suggesting that there is less left ventricular contraction during systole. In fact,
the LVIDs measurements for pinnipeds weighing 93.5-250 kg were most similar to those of 450-
650 kg cows (Hallowell et al., 2007). Left ventricular end-systolic diameter is measured when the
heart contracts and blood is ejected from the left ventricle into the aorta, e.g., when the ventricle
is at its minimal diameter (Otto, 2018). Thus, a larger end-systolic diameter could indicate the
marine mammal heart is ejecting a smaller volume of blood with each beat than would be expected
for a terrestrial mammal of similar body size.
Similarly, the change in size of the left ventricle from the relaxed to contracted state (fractional
shortening) in Steller sea lions (32%) was less than the median value calculated from 14 species
of terrestrial mammals (40%) (Boon et al., 1983; Diniz et al., 2017; Fontes-Sousa et al., 2006;
Guglielmini et al., 2006; Häggström et al., 2016; Hallowell et al., 2007; Leroux et al., 2012;
Morrison et al., 1992; Noviana and Kurniawan, 2013; Petrič et al., 2012; Scansen and Morgan,
2015; Torad et al., 2017). This observation primarily reflects the larger dimension of the sea lions’
left ventricle in systole as the end-diastolic left ventricular dimensions were within the expected
range for mammals of this size. The smaller fractional shortening provides further evidence that
the left ventricle contracts less in anaesthetized sea lions than in similar-sized terrestrial mammals.
It is conceivable that the ventricles may be contracting more and ejecting a greater volume of blood
during diving. However, fractional shortening in other species of marine mammals (bottlenose
dolphins and southern sea lions), also measured while not diving or submerged, is similar to
terrestrial mammals suggesting that small fractional shortening may be unique to Steller sea lions.
Greater blood volume leaving the left ventricle during each cardiac cycle (stroke volume) has
not yet been observed in forced or freely-diving marine mammals (Blix et al., 1976; Murdaugh et
al., 1966; Ponganis et al., 2006, 1991)—despite the expectation that it (along with forceful

25
contractions of the left ventricle) could counter potential decreases in blood flow caused by diving
bradycardia. Having a small fractional shortening while resting would give marine mammals
greater capacity than terrestrial mammals to increase left ventricular contraction. That is, at rest
they have a lower set point which means the total amount they can increase fractional shortening
before reaching a physiological maximum is greater than terrestrial mammals. How this benefits
Steller sea lions while diving remains a conundrum because while blood flow could be maintained
for a longer duration, increasing stroke volume will increase blood pressure if heart rate and
peripheral vasoconstriction remain unchanged. Since blood pressure is expected to be relatively
constant during a dive, an increase in stroke volume to maintain blood flow seems counterintuitive.
Thus, it is unclear why the Steller sea lions we studied had smaller fractional shortening than
expected.
Blood flow through the aortic and pulmonary valves can be used as an indicator of cardiac
problems such as aortic stenosis (Otto, 2018). While we report median values for Steller sea lions
that may be useful for diagnosing abnormalities, we cannot make comparisons of peak flow
velocities to those of terrestrial mammals due to a lack of reported values for mammals larger than
30 kg. A wide range of peak aortic velocities (0.60 - 0.99 m/s) and pulmonary velocities (0.45 –
1.00 m/s) have been reported for terrestrial mammals less than 30 kg, which may indicate that
these functional parameters are highly variable and may not correlate with body mass.
Steller sea lion, northern fur seal, and walrus electrocardiographic function
All Steller sea lions, northern fur seals, and the walrus displayed the characteristic mammalian
ECG waveform. No abnormal findings indicative of cardiac pathology were present in any of the
studied ECGs.
Observing the net direction of the electrical activity of the heart, the mean electrical axis
(MEA), reveals where the bulk of the myocardium is situated. The MEAs of Steller sea lions (SSL)
and northern fur seals (NFS) were unique to each individual, with no overarching trend. Right
cranial (3 SSL), left cranial (2 SSL, 2 NFS, 1 walrus), and left caudal orientations (3 SSL, 3 NFS)
were all measured. Other species of marine mammals (southern sea lions, southern elephant seals,
bottlenose dolphins, manatees) have left cranial MEA orientations (Dassis et al., 2016; Falabella
et al., 1999; Harms et al., 2013; Siegal-Willott et al., 2006).

26
Left caudal and cranial orientations are common in terrestrial mammals. The left ventricle is
thought to contribute the most to depolarization, which in turn draws the MEA towards it either
cranially or caudally and to the left (Bayés De Luna et al., 2012). In adult humans, for example,
the normal MEA is between -30° and 90° (Surawicz et al., 2009). Right cranial orientations in
three of the Steller sea lions may have been physiologically normal or could be indicative of
cardiac anomalies such as the potential atrial enlargement observed in a southern seal lion (Dassis
et al., 2016). However, we found no evidence from the ECG (such as a notched P-wave) or
echocardiogram to suggest pathology in our study animals.
Based on the broad, flat shape of Steller sea lion hearts and the unusually large right ventricle
and enlarged left and right atria (Murie, 1874), right cranial mean electrical axes may be a normal
finding that reflects cardiac anatomy. The unique distribution of the myocardium could alter the
net direction of the electrical flow through the heart. Therefore, an extreme right axis deviation
could be recorded in a Steller sea lion, and the finding would still be physiologically normal.
We observed sinus arrhythmias (slight changes in heart rate) that coincide with the respiratory
cycle in 5 of the 8 Steller sea lions, but not in the walrus or northern fur seals. Sinus arrhythmias
are a common occurrence in marine and terrestrial mammals (e.g., Ben-Tal et al., 2012; Castellini
et al., 1994; Hamlin et al., 1972; Harms et al., 2013; Kastelein and Meijler, 1989; Ponganis and
Kooyman, 1999; Senft and Kanwisher, 1960) that may increase the efficiency of oxygen uptake
by increasing heart rate during inspiration (Yasuma and Hayano, 2004) and reduce cardiac work
by slowing the heart rate during expiration (Ben-Tal et al., 2012).
In marine mammals, sinus arrhythmias may be related to diving and diving ability. For
example, in northern elephant seals, the development of sinus arrhythmias occurs in association
with increased diving and increased sleep apneas, with adult seals and older pups having more
pronounced sinus arrhythmias than younger pups (Castellini et al., 1994). In addition, sinus
arrhythmias and the dive response are both under vagal control (Grossman and Kollai, 1993;
Ponganis et al., 2017), which suggests that the heart rates of marine mammals with pronounced
sinus arrhythmias may be under greater control than those without sinus arrhythmias. It follows
that sinus arrhythmias may be an indicator of diving ability, assuming that greater heart rate control
is beneficial for diving. Further research into sinus arrhythmias and diving is needed to confirm
this hypothesis.

27
There are several plausible explanations for why we did not observe sinus arrhythmias in all of
the individuals we studied. One reason is that the pinniped species we studied are not true seals
(phocids). Sinus arrhythmias are associated with spontaneous breath-holds which are more
commonly observed in phocids (seals) than in otariids and odobenids (sea lions and walruses)
(Ponganis, 2015). Furthermore, the individuals we studied were maintained under human care.
The limitations on their dive depths may have thus stunted development of a sinus arrhythmia.
Additionally, the walrus was only ~2 years old and may not have developed a sinus arrhythmia
yet. Another possibility is that we did not detect sinus arrhythmias in these individuals because
they were anaesthetized during the ECGs (Grossman and Kollai, 1993).
Clinical significance
Our study provides cardiac reference values for healthy anaesthetized Steller sea lions, northern
fur seals, and one walrus. These values can be used by veterinarians to diagnose cardiac
abnormalities in future pinniped health assessments. It is important to have species-specific
baseline-reference values when evaluating ill or stranded individuals. Our Steller sea lion ECGs
and echocardiograms should represent anaesthetized adult females well. We did observe
considerable individual variation, which further exemplifies the importance of obtaining reference
values from healthy individuals. Knowing, for example, that extreme right axis deviation (as
defined for humans) is not an uncommon occurrence in healthy pinnipeds, can help rule this out
as a cause for concern.
Although our measurements all come from anaesthetized animals, they are valuable reference
measurements because animals are often sedated for clinical exams. Performing echocardiography
on Steller sea lions required considerable pressure on their chests, which may not be tolerated by
individuals that are awake, even with training. Therefore, analysis of cardiac structure, left
ventricular function, and pulmonary and aortic blood flow using echocardiography may be
restricted to anaesthetized Steller sea lions, even though measurements on conscious individuals
(e.g., southern sea lions, a smaller species) have been successfully obtained (Castro et al., 2018).
There is a slight chance that cardiac compression affected our results, but there were no indications
of this during the procedures and data analysis. For example, the majority of echocardiographic
measurements that we made fell within the expected range for mammals of that body mass.

28
Conclusion
We report baseline cardiac measurements for Steller sea lions, northern fur seals, and a walrus.
We found many similarities in cardiac form and function between these pinnipeds and terrestrial
mammals. However, our echocardiographic examinations of Steller sea lions confirm differences
in cardiac form, such as the enlarged aortic root. Our findings also suggest differences in cardiac
function, between marine and terrestrial mammals, such as reduced fractional shortening that may
support the dive response. Electrophysiological measurements from our study animals also did not
match those of terrestrial mammals. Overall, our findings reveal possible cardiac adaptations to
diving in marine mammals. Future studies are needed to evaluate the functional roles of these
differences and confirm their presence in other marine mammals including cetaceans.

29
Chapter 3: Electrocardiographic scaling reveals differences in cardiac
function between marine and terrestrial mammals
Summary
Adaptations to diving may explain apparent differences in cardiac function between marine
mammals and terrestrial mammals. While the ability of marine mammals to lower heart rates for
extended periods when diving is well documented, it is unknown whether marine mammals have
cardiac adaptations that extend beyond overall bradycardia. We analyzed electrocardiographic data
from 50 species of terrestrial mammals and 17 species of marine mammals to determine whether
cardiac function differs between these two ecological groups. We also tested whether physiological
state (i.e., anaesthetized or conscious) affects ECG parameters. Analyses of cardiac waveform
morphology (heart rate, P-wave duration, and PQ, PR, QRS, and QT intervals) revealed allometric
relationships between body mass and all ECG intervals (as well as heart rates) for both groups of
mammals and specific differences in ECG parameters between marine mammals and their
terrestrial counterparts. Model outputs indicated that marine mammals had 20% longer P-waves
(regardless of physiological state) and 11% longer QRS intervals (in conscious individuals). In
other words, marine mammals had slower atrial and ventricular depolarization than terrestrial
mammals. Heart rate, PQ, and QT intervals were not significantly different between marine and
terrestrial mammals. Most of our ECG parameters scaled with body mass to the power of 0.20
(range: 0.137 - 0.213) rather than the expected 0.25—while heart rate scaled to body mass to the
power of -0.22 and was also less than the widely accepted -0.25 derived from fractal geometry.
Our findings show clear differences between the hearts of terrestrial and marine mammals in terms
of cardiac timing that extend beyond diving bradycardia. They also highlight the importance of
considering animal physiological state and special adaptations when analyzing allometric
relationships.
Introduction
Cardiac function is expected to scale with body mass across all mammals because of the
essential nature of the heart’s function and the conservation of cardiac anatomy and physiology
across mammalian species. For example, the mass of a heart relative to the mass of a body scales
to 0.98 in both marine and terrestrial mammals (Prothero, 1979). However, heart rates and
waveforms of contracting hearts may nevertheless scale differently between the two types of

30
mammals because of cardiac adaptations related to diving and the large body size of marine
mammals. Heart rates may be higher in marine mammals due to some species having higher
metabolic rates than similarly-sized terrestrial mammals (Green, 2011; Williams et al., 2001). In
contrast, heart rates may also be lower in marine mammals due to diving bradycardia. Additionally,
the hearts of marine mammals must cope with extreme physiological changes—bradycardia and
vasoconstriction—that occur with breath-hold diving. Thus, differences in how the hearts of
marine and terrestrial mammals perform could occur despite well-described general anatomical
similarities between the hearts of the two ecological groups (Drabek, 1975; Rowlatt, 1990).
Dissections have generally confirmed the gross similarity between the hearts of marine and
terrestrial mammals. However, they have also revealed anatomical differences that may cause
cardiac signal conduction in marine mammal hearts to deviate from typical mammalian signal
conduction. For example, cetaceans such as bowhead whales (Balaena mysticetus), sperm whales
(Physeter macrocephalus), beluga whales (Delphinapterus leucas), and a few species of porpoise
have abnormally large Purkinje fibres (Pfeiffer, 1990) that are thought to increase signal
conduction velocity from the atrioventricular (AV) node to the ventricular myocardium (van Nie,
1986). Similarly, Todd fibres found in the right atrial wall of white-beaked dolphins are suspected
of increasing signal conduction velocity between the sinoatrial (SA) and AV nodes (Nie, 1987).
The function of these specialized conduction tissues is unknown, but it has been suggested that
they may be beneficial for rapid heart rate transitions such as those observed in marine mammals
as they dive and resurface (Nie, 1987; van Nie, 1986). Thereby making marine mammals better
equipped to rapidly decrease their heart rates when diving, and increase their heart rates when
surfacing to breathe.
In addition to having specialized myocardial cells, the shape of marine mammal hearts may
result in differences in cardiac function. Changes to the amount and distribution of cardiac muscle
affect how electrical signals travel through the heart. For example, pinnipeds have broad hearts
(Drabek, 1975; Rowlatt, 1990) which may increase the duration of ventricular depolarization
because the signal must travel a greater distance, thereby resulting in a longer QRS interval on an
ECG.
Data from marine mammals have been included in previous interspecific analyses of cardiac
performance among mammals. However, low numbers of marine mammal species have precluded
a statistical comparison with terrestrial mammals. We therefore combined published

31
electrocardiographic data with new measurements from three species of marine mammals (Steller
sea lions, northern fur seals, and walrus) to determine whether cardiac performance differs between
marine and terrestrial mammals. We categorized the data based on the physiological state of the
individual when ECG measurements were taken, and considered the effects of anaesthesia on
cardiac rate and rhythm—before calculating and comparing scaling exponents as a function of
body mass for ECG data across a wide range of mammalian sizes, from mice to whales.
Methods
Meta-analysis
We amassed an ECG dataset from 82 species (representing over 2000 individuals) of marine
and terrestrial mammals for analysis. The majority of the data were obtained from the scientific
literature, but we also added unpublished data we collected from three species of marine
mammals—Steller sea lions, northern fur seals, and walrus (Chapter 2). We extracted values for
heart rate, P-wave, and PQ, PR, QRS, and QT interval durations (Fig. 3.1), and recorded
information about the source group or individual including age, sex, physiological state
(anaesthetized or conscious) and body mass, when available.
Optimally, ECG measurements should be taken under standardized conditions in calm, healthy
individuals to minimize any effects of anaesthesia on cardiac characteristics—including alterations
in heart rate—that might complicate multispecies comparisons. However, in practice, ECGs are
often taken while under anaesthesia during medical procedures, particularly for exotic species,
which is why we categorized measurements based on the physiological state of the individual.
We grouped the PQ and PR intervals and report them as the PR interval, because these intervals
are the same by definition. The PR interval is the timing between the beginning of the P-wave to
the onset of the QRS complex—either the Q-wave or the R-wave—which is why the PQ and PR
intervals are both classified as the PR interval (Bayés De Luna et al., 2012). We report a single
mean or mid-range value for each species that had sample sizes ranging from a single animal to
hundreds of individuals (e.g., dogs) (see Appendix D).

32
Figure 3.1 Characteristic cardiac waveform for a single cardiac cycle in a mammal consisting of several well-defined deflections termed the P, Q, R, S, and T waves. As shown, the ECG can be divided into several standardized, measurable intervals (PR, QRS, QT, and RR) that represent the timing of electrical signal
conduction through the myocardium that stimulates contraction of the heart’s atria and ventricles. Figure reproduced from Clinical Echocardiography (Bayés De Luna et al., 2012) with permission from the publisher. © 2012 by John Wiley & Sons, Ltd.
We categorized the data based on physiological state of the individuals. In our dataset, we
classified measurements as being taken under anaesthesia when the majority (> 90%) of the
individuals in the sample were known to be anaesthetized. In 22 out of 23 species recorded as
anaesthetized, all individuals of the species were anaesthetized and for the 23rd species, 9 out of
10 individuals were anaesthetized. Data from five species allowed us to report conscious and
anaesthetized ECG parameters separately (e.g., dogs). All measurements from 49 other species
came from individuals that were not anaesthetized (i.e., “conscious”). Data indicating
physiological state (anaesthetized or conscious) were unavailable for 24 species and was therefore
excluded from our analysis. Our final dataset consisted of 67 mammalian species (17 marine and
50 terrestrial), representing 1660 individuals.
To calculate representative ECG parameters for each species under a specific physiological
state, we first calculated means and midranges for each individual source. Averages were

33
preferable, but when these were unavailable, we used the midrange as a proxy which we considered
to fairly represent that species. Midrange was calculated as the mean of the reported minimum and
maximum values of a given ECG parameter. To combine data from multiple sources, we calculated
weighted averages and midranges using sample size as the weighting factor. When sample size
was unavailable, we assigned a value of one as the weighting factor because each report had to
have come from at least one individual. Therefore, reports from species for which no sample size
was stated may be underrepresented in the calculated average for that species.
For terrestrial mammals, we followed the procedure for harvesting ECG data and estimating
species’ masses as outlined in Günther and Morgado (1997) with some modifications. Our source
for terrestrial ECG data was Grauwiler (1965), who reported ECG parameters for a wide variety
of mammals. Often, body mass was not indicated, so we estimated body mass by matching reported
information about the individual or group, such as age and sex, to corresponding species
information from additional literature sources (see Appendix D). When mass estimates could not
be informed by age and sex, we used a general average species mass from the available literature.
In many cases, estimates of mass were from only one or a few individuals
ECG data for marine mammals were previously published for 14 species, to which we added
ECG data for three additional species (Steller sea lions, northern fur seals, and walrus—Chapter
2). Masses for all individuals were documented at the time of the ECG recordings either as an
estimate (for the large whales) or by direct measurement.
For all species, heart rate data were either explicitly stated or were calculated as 60 divided by
the RR interval. Midrange heart rates were calculated as described above when averages were not
reported. For species that had multiple types of heart rate data available, the reported value used
for analysis was selected based on the estimate requiring the fewest number of calculations. Our
ranking system from highest to lowest preference was heart rate, heart rate calculated from the RR
interval, heart rate midrange, and finally heart rate midrange calculated from RR midrange.
ECG protocol
To increase the number of marine mammal species available for comparison, we recorded
ECGs as described in Chapter 2 from 8 Steller sea lions, 5 northern fur seals, and 1 walrus housed
at the Vancouver Aquarium (Vancouver, BC) and the University of British Columbia Open Water
Research Station (Port Moody, BC). In brief, we recorded two, one-minute ECGs from

34
anaesthetized individuals in the frontal plane using an IDEXX CardioPet telemetric ECG device.
Standard electrocardiographic measurements were made by a veterinary cardiologist using IDEXX
VetMedStat software. Next, we calculated species’ averages for each measured parameter and
added them to the mammalian ECG dataset for analysis.
Statistical analyses
We fit linear models to our dataset to test the effects of ecological group (marine or terrestrial)
and physiological state (conscious or anaesthetized) on ECG parameters, and to derive allometric
equations between cardiac parameters and body mass. We first log-transformed body mass and
each ECG parameter to linearize the data. Then, we fit three-way interaction models between body
mass, ecological group, and physiological state. We used Akaike’s Information Criterion to find
the minimal adequate model by dropping terms from our interaction model and determining if this
improved the fit. We performed a two-way analysis of covariance (ANCOVA) on the minimal
adequate model for each ECG parameter using mass as a covariate and ecological group (terrestrial
or marine mammal) and physiological state (conscious or anaesthetized) as fixed categorical
factors. Data from all the models met the assumptions for ANCOVA. Analyses were performed
using the statistical software R version 3.4.4.
Results
The effects of ecological group, physiological state, body mass, and interactions between these
factors were specific to each ECG parameter (Tables 3.1 and 3.2). All ECG parameters
significantly correlated to body mass. Heart rate decreased with body mass, while P-wave, PR,
QRS, and QT durations increased with body mass. Mass-specific differences between marine and
terrestrial mammals were detected in P-wave and QRS durations, but not in heart rate, PR or QT
durations. We also found an interaction between ecological group and physiological state that
affected the QRS duration. However, there were no other significant differences between
anaesthetized and conscious mammals aside from this lone interaction.
Heart rate, PR interval, and QT interval correlated with body mass over a range of 0.017 kg
(mouse) to 32000 kg (fin whale) (Table 3.1). No significant effects of ecological group,
physiological state or interactions between factors were detected in these three parameters. Heart
rate scaled with body mass to the power of -0.219 (Fig. 3.2a, Table 3.2). PR interval duration

35
scaled with body mass to the power of 0.211 (Fig. 3.2b, Table 3.2), while QT interval duration
scaled with body mass to the power of 0.217 (Fig. 3.2c, Table 3.2).
Although heart rate was only affected by body mass, there was a slight but nonsignificant
interaction between physiological state and mass indicating that anaesthetized and conscious
mammals have different mass-specific heart rates. The nonsignificant trend suggests that
anaesthetized mammals larger than ~1 kg had higher heart rates than conscious mammals of
similar mass (Table 3.1, p = 0.050) — i.e., when comparing two individuals of the same mass (>
1 kg), the anaesthetized individual should have a higher heart rate than the conscious individual.
P-wave duration increased with body mass over a range of 0.017 (mouse) to 3200 kg (Asian
elephant) (Table 3.1, p < 0.0001) and depended on ecological group. Marine mammals had 20%
longer P-waves than terrestrial mammals over the range that marine and terrestrial mammal masses
overlapped (Table 3.1, p = 0.035). For example, a terrestrial mammal weighing 100 kg would have
a P-wave duration of 0.077 s, whereas a marine mammal of the same mass would have a P-wave
duration of 0.096 s. In marine mammals, P-wave duration scaled with body mass to the power of
0.213 and in terrestrial mammals to the power of 0.210 (Table 3.2, Fig. 3.3). Physiological state
had no effect on P-wave duration and all interactions were nonsignificant.
QRS complex duration depended on mass, ecological group, and an interaction between
ecological group and physiological state (Fig. 3.4). QRS duration increased with body mass over
a range of 0.017 kg (mouse) to 32000 kg (fin whale) (Table 3.1, p < 0.0001). The relationship
between QRS complex duration and body mass was similar between ecological groups for a given
physiological state, but the exponent for both groups differed between conscious (0.195) and
anaesthetized (0.137) animals. The intercepts also differ, showing that marine mammals had 11%
(conscious) and 43% (anaesthetized) longer QRS complexes than terrestrial mammals of the same
mass and same physiological state (Table 3.1, p = 0.021). For example, a conscious 100 kg
terrestrial mammal would have a QRS complex of 0.072 s, while a marine mammal of the same
mass would have a QRS complex of 0.081 s. The relative difference would be greater for
anaesthetized animals, where a 100 kg terrestrial mammal would have a QRS complex of 0.053 s,
whereas QRS complex of an anaesthetized marine mammal would be 0.094 s. Note that the
comparison between anaesthetized mammals is for illustration only, as the data for anaesthetized
marine and terrestrial mammals do not overlap (the QRS interval for a 100 kg anaesthetized
terrestrial mammal is an extrapolation for the sake of comparison). Further, physiological state

36
affected marine and terrestrial mammals differently, as indicated by the interaction effect (Table
3.1, p = 0.042) and the intercepts of the linear regressions (Table 3.2). As a result of this interaction,
QRS complex durations of mammals are specific to their ecological group and physiological state
for a given body mass.
Table 3.1 ANCOVA results of the minimal adequate model describing the relationship between ecological group (EG), physiological state (PS), and ECG parameters accounting for the effects of body mass (BM)
as a covariate. Values are degrees of freedom (DF), F-values, and multiple R2. Statistical significance: *** indicates P < 0.0001, * indicates P < 0.05. NP indicates that the factor or interaction was not present in the minimal adequate model
Parameter DF Body mass EG PS BM X
EG
BM X
PS
EG X
PS
BM X
EG X
PS
Multiple
R2
Heart rate 1,66 376.1*** NP 3.9 NP 4.0 NP NP 0.85 P 1,28 117.1*** 4.9* 0.1 NP 2.1 NP NP 0.82 PR 1,59 483.0*** 0.2 1.2 NP 3.1 3.0 NP 0.89 QRS 1,62 420.4*** 5.7* 0.1 NP 0.6 4.3* NP 0.87 QT 1,62 362.4*** 3.4 NP NP NP NP NP 0.86
Table 3.2 Linear regressions and allometric equations describing the relationship between body mass (BM) and ECG parameters for mammals separated by ecological group and physiological state as appropriate.
Group Response
variable
Linear equation of
log-transformed data
Allometric
equation
All mammals HR -0.219(BM) + 2.344 221(BM)-.219 Terrestrial mammals P 0.210(BM) - 1.533 0.0293(BM)0.210 Marine mammals P 0.213(BM) - 1.442 0.0361(BM)0.213 All mammals PR 0.211(BM) - 1.179 0.0663(BM)0.211 Conscious terrestrial mammals QRS 0.195(BM) - 1.533 0.0293(BM)0.195 Conscious marine mammals QRS 0.194(BM) - 1.481 0.0330(BM)0.195 Anaesthetized terrestrial mammals QRS 0.137(BM) - 1.547 0.0283(BM)0.137 Anaesthetized marine mammals QRS 0.137(BM) - 1.301 0.0500(BM)0.137 All mammals QT 0.217(BM) - 0.925 0.119(BM)0.217

37
Figure 3.2 Relationships between body mass and heart rate (A), PR interval (B), and QT interval (C) in mammals. Ecological group (terrestrial mammals shown in black squares, marine mammals shown in grey circles) and physiological state (conscious mammals indicated by closed squares and circles, anaesthetized mammals indicated by open squares and circles) had no effect on heart rate, PR interval, or QT interval.
Mass was the best predictor for these three ECG parameters. Regression equations for each parameter are provided in Table 3.2.
50
100
500
0.1
0.1
1
0.01 1 100 10000Mass (kg)
HR
(bpm
)PR
(s)
QT
(s)
Ecological group andphysiological state
Marine & Conscious
Marine & Anaesthetized
Terrestrial & Conscious
Terrestrial & Anaesthetized
A.
B.
C.

38
Figure 3.3 Relationship between body mass and P-wave duration in marine (grey circles and dashed line) and terrestrial (black squares and solid line) mammals. Anaesthetized species are represented as filled squares and circles, and conscious species as open squares and circles. Ecological group had a significant
effect on P-wave duration when mass was corrected for as a covariate. Regression equations are stated in Table 3.2.
Figure 3.4 Relationship between body mass, ecological group, physiological state, and QRS complex duration. Recordings of conscious mammals are indicated by filled squares and circles and regressions are shown as solid lines, while anaesthetized mammals are indicated by open squares and circles and regressions are shown as dashed lines. Terrestrial mammals are shown in black and marine mammals are shown in grey. Regression equations are stated in Table 3.2.
0.1
0.01 1 100 10000Mass (kg)
P (s
)Ecological group andphysiological state
Marine & Conscious
Marine & Anaesthetized
Terrestrial & Conscious
Terrestrial & Anaesthetized
0.01
0.1
0.01 1 100 10000Mass (kg)
QR
S (s
)
Ecological group andphysiological state
Marine & Conscious
Marine & Anaesthetized
Terrestrial & Conscious
Terrestrial & Anaesthetized

39
Discussion
Our results show that the mammalian ECG waveform is well conserved over a wide range of
body masses. However, some components of the ECG waveform differ between marine and
terrestrial mammals. Most notable is that marine mammals have a longer P-wave and a wider QRS
complex than terrestrial mammals, which is indicative of prolonged atrial and ventricular
depolarization. In other words, conduction through the atria and ventricles in marine mammals is
slower than in terrestrial mammals, which likely reflects differences in cardiac anatomy between
these two groups.
We detected differences between the ECGs of marine and terrestrial mammals despite the large
between-species variation observed for all parameters. About one quarter of the species we studied
fell on or were close to the allometric regression lines, indicating that body mass is not the only
factor influencing electrical signal conduction through the myocardium. This variation highlights
species-specific differences in cardiac electrophysiology that may relate to unique cardiac
adaptations. Consequently, our comparisons between marine and terrestrial mammals may not
apply to all of the species that we grouped within these categories because the hearts of some
marine mammals perform more similarly to the hearts of terrestrial mammals and vice versa.
However, these ecological groupings were necessary for us to effectively address the question of
whether the electrical activity of the heart differs between marine and terrestrial mammals.
In terms of how the heart behaves as a function of body size, we found that the P-wave, PR,
QRS, and QT intervals all increased with body mass in mammals — and all scaled to mass to the
power of ~0.21. In terms of heart rate however, bigger mammals have bigger hearts that beat
slower, and scaled to body mass to the power of ~-0.22. These data add to the debate over how
ECG parameters scale to body mass in mammals because our scaling exponents are inconsistent
with other predicted and empirical values.
Anaesthesia had a noticeable effect on how the heart functioned. Most apparent was how
anaesthesia dropped the QRS scalar with body mass from the power of ~0.20 to ~0.14. Our analysis
of physiological state also suggests that anaesthetized animals may have faster heart rates than
conscious animals. Potential explanations for these counterintuitive results lie in the different types
of anaesthetic protocols used when performing ECGs.

40
Marine and terrestrial mammals
The differences we found in cardiac parameters in our comparison between marine and
terrestrial mammals—a longer P-wave and a wider QRS complex—suggest that cardiac anatomy
may also differ between these two ecological groups. The duration of ECG parameters is
influenced by the mass of the myocardium that the electrical signal must pass through because
conduction time increases with distance (Bayés De Luna et al., 2012). For example, long QRS
intervals are commonly observed in association with left ventricular hypertrophy, especially in
elite athletes (Dorn, 2007; Zelenkova and Chomahidze, 2016). Hence, the longer P-waves and
QRS complexes of marine mammals may indicate that they have greater atrial and ventricular
myocardial mass or differently shaped cardiac chambers than terrestrial mammals. This is
supported by anatomical reports of the broad, dorsoventrally compressed hearts of phocids
(Drabek, 1975; Rowlatt, 1990); a shape that would potentially increase the signal conduction
distance slowing atrial and ventricular depolarization.
Atrial and ventricular depolarization were slower in marine mammals, but this had no effect
on overall cardiac timing (heart rates scaled the same for all mammals). A probable explanation is
that the enlarged Purkinje fibres and Todd fibres found in some species of marine mammals
increase signal conduction velocity through the myocardium (Nie, 1988, 1987; Pfeiffer, 1990).
In terms of the ECG, the duration of the PR interval was the same in marine and terrestrial
mammals, but the P-wave was longer in marine mammals. This means that the electrical signal
travels through the conduction pathways (SA node to AV node to the ends of the Purkinje fibres)
with the same timing in marine and terrestrial mammals, even though signal conduction through
the atrial and ventricular myocardium is slower. Faster signal propagation from the AV node to
the ventricular myocardium could result from the presence of enlarged Purkinje fibres in marine
mammals (Pfeiffer, 1990; van Nie, 1986). Although electrical activity through Purkinje fibres is
not visible on ECGs, the isoelectric line between the end of the P-wave and the start of the QRS
complex represents conduction through the Purkinje fibres (along with the bundle of His, and the
bundle branches) (Boron and Boulpaep, 2017). Therefore, the prolonged P-wave in marine
mammals, despite there being no difference in the length of the PR interval, likely corresponds to
faster signal conduction through the enlarged Purkinje fibres of marine mammals.

41
Theoretically, the Todd fibres found in white-beaked dolphins (Nie, 1987) could also decrease
the timing of the electrical activity to support the longer P-wave and QRS complex despite heart
rate remaining the same. However, it is more difficult to predict the effect of Todd fibres on the
ECG because conduction from the SA node to the AV node happens concurrently with atrial
depolarization.
It is important to note that we grouped all marine mammals together, but only a few species
are known to have Todd fibres and enlarged Purkinje fibres. Looking at where individual species
fall on our allometric trendlines may allow us to make inferences about which species have these
specialized conduction pathways and which ones likely do not.
Taking these findings together, our ECG data suggests that marine mammals have enlarged or
elongated cardiac chambers that require faster conduction pathways to maintain proper cardiac
timing for filling and contraction. Thus, electrical cardiac function is different in marine mammals
to support anatomical differences—not to directly support the dive response. However, the inferred
structural differences, such as dorsoventral flattening of the heart, likely are adaptations to diving.
We were surprised to find no difference between the heart rates of similar sized marine and
terrestrial mammals. Whether this reflects the challenge of determining what constitutes a “resting
heart rate” for marine mammals is unknown. It may also be important to distinguish between
whales, phocids (true seals), and otariids (fur seals and sea lions) as the “resting” cardiac state may
be determined by the proportion of time spent diving, surfacing, and on land (in the case of
pinnipeds). For example, whales and seals spend more time diving, so a bradycardic heart rate
might be considered their resting state. In contrast, sea lions spend more time hauled-out, so it
might be more appropriate to measure their resting heart rate at the surface.
Most ECG measurements of marine mammals to date have been recorded on land or while
resting at the surface, both for logistical reasons as well as to standardize the measurement process.
In the future, a comparison of heart rates between marine and terrestrial mammals that account for
these concepts of “true” resting conditions may prove more physiologically relevant for explaining
differences between ecological groups due to the dive response.
Effects of anaesthesia
The effects of anaesthesia on cardiac timing are complicated. Our results showed that
anaesthetized marine mammals had longer QRS intervals than similarly sized anaesthetized

42
terrestrial mammals. No effects of anaesthesia on QRS intervals have been previously reported,
but anaesthetic agents such as isoflurane, desflurane, and sevoflurane are known to increase the
QT interval (Yildirim et al., 2004). It is unclear why our study showed that anaesthesia affects the
QRS rather than the QT interval, but it is interesting that the impacts were different on marine and
terrestrial mammals.
We also observed a trend towards higher heart rates in anaesthetized individuals. Past studies
have also shown that anaesthesia can increase heart rate (Picker et al., 2001). This may seem
counter-intuitive, as the lack of response to stimuli of animals in an anaesthetized state elicits
images of a slowed heart rate. In reality, however, anaesthesia can increase heart rate by removing
vagal stimulation that normally serves to decrease heart rate (Picker et al., 2001), although the
effects are likely dependent on anaesthetic protocols. While our findings lend support for this
mechanism acting across a range of species and body masses, limited information was available
about the anaesthetic protocol used (e.g., type, plane, and duration of anaesthesia), which
prevented us from undertaking further analyses.
ECG allometry
Many anatomical, physiological, and ecological factors are known to scale allometrically with
body mass in animals, and electrical signal conduction through the heart is no different. The
specific mathematical relationship between body mass and ECG parameters lends insight into
basic constraints and consequences of evolutionary design that are relevant for understanding the
evolutionary function of deviations from defined allometric relationships. By performing
allometric analyses, we were also able to identify differences that exist between species based on
ecological niche and physiological state, which may be indicative of special anatomical or
physiological adaptations in marine mammals.
The ECG scaling exponents we found closely agree with other experimentally-derived cardiac
scaling exponents. Günther and Morgado (1997) found that the RR, PQ, QRS, and QT intervals
scaled with body mass to the power of 0.20, while our scaler ranged from 0.195 to 0.217 (with the
exception of QRS intervals for anaesthetized animals). Noujaim et al. (2004) found that
mammalian PR intervals scale to a power of 0.24, comparatively higher than our analysis which
determined the scaling exponent to be 0.21. The similarities between our results and that of
Günther and Morgado (1997) is likely because we followed similar methods and drew data from

43
some of the same sources (e.g., Grauwiler, 1965). Additionally, having more data from marine
mammal species may explain the lower value of our PR interval scaling compared to that of
Noujaim et al. (2004).
There is debate regarding the theoretical foundation for how ECG characteristics should scale
with body mass. Recent studies examining the scaling of ECG parameters with body size report
exponents more consistent with the theoretical one-quarter scaling law (Meijler and Meijler, 2011)
than with the simple one-third law predicted by Euclid—suggesting that fractal geometry is a more
likely explanation for how ECG parameters scale with body mass than volumetric scaling. Still,
our empirically-derived scaling exponents are lower than the theoretically-predicted exponent for
all of the ECG parameters we explored. Although our observed values of ~±0.20 are close to the
widely accepted 0.25 derived from fractal geometry, as these values are exponents, small
deviations have large impacts on the estimated range of cardiac measurements for a mammal of a
given size.
It is possible that the discrepancy between our data and the theoretical exponents simply reflect
variability in nature, measurement error, and technique and operator variability. It is also possible
that the theoretically derived scaling arguments are based on a supposed “average idealized
animal” that are simply approximations meant to aid understanding of fundamental biological
principles (West and Brown, 2005). Currently, no theoretical mechanism exists to explain our
consistent allometric scaling to the power of 0.20.
Conclusion
Overall, our study supports previous findings about mammalian ECG interval and heart rate
scaling while demonstrating the need to consider ecological and physiological groups when
making comparisons based on allometric relationships. Clear differences in the cardiac timing of
marine mammals appear to support anatomical adaptations to diving, rather than acting as
functional adaptations themselves. The timing of electrical conduction through the myocardium is
altered slightly in marine mammals, probably to maintain the timing of chamber filling and
contraction. Without this unique timing, the heart beats of marine mammals would be slowed, and
could negatively affect circulation.

44
Chapter 4: General discussion
I measured electrocardiographic variables in Steller sea lions, northern fur seals, and a walrus
to assess cardiac function in marine mammals and infer potential cardiac adaptations to diving. I
found within- and between-species variation in cardiac waveform timing and heart rates of these
three pinniped species, and obtained reference values of echocardiographic function in Steller sea
lions to compare with other mammals. Comparisons with terrestrial mammals revealed key
differences in both the electrical and left ventricular function of the hearts of marine mammals that
suggest marine mammal hearts may be adapted to diving.
My first two research goals were to 1) measure electrocardiographic function in three pinnipeds
(Steller sea lions, northern fur seals, and walruses), and to 2) examine left ventricular function in
Steller sea lions. Evaluating baseline cardiac function in Steller sea lions (i.e., cardiac rhythm and
left ventricular function) provided foundational measurements from which I inferred that cardiac
function in marine mammals differs from terrestrial mammals. I confirmed that the aortic root in
Steller sea lions is larger than the dimension of the left ventricle, which is consistent with having
an aortic bulb (Murie, 1874). My second finding was that the end-systolic dimension of the left
ventricle in Steller sea lions is larger than in terrestrial mammals of the same size (similar to
southern sea lions). However, the end-diastolic dimension of the sea lion hearts is similar to
terrestrial mammals, which results in decreased fractional shortening. In other words, Steller sea
lion hearts at rest contract less than the hearts of terrestrial mammals.
It is unclear what effect decreased fractional shortening at rest has on the capacity for
alterations in stroke volume. One possibility is that contracting the left ventricle at a lower set-
point at rest than seen in terrestrial mammals allows the marine mammal heart to undergo a greater
degree of contraction to increase blood flow when exercising or diving. However, stroke volume
typically does not increase in diving mammals (Elsner et al., 1964; Ponganis et al., 2006, 1991),
which suggests there is another yet unknown reason for marine mammals having reduced
fractional shortening.
The third goal of my thesis research was to compare electrical function between the hearts of
marine and terrestrial mammals. My main findings were that marine mammals have longer P-
waves and QRS complexes than terrestrial mammals, which means that it takes longer for atrial
and ventricular contraction to occur in marine mammal hearts after the first signal is sent by the
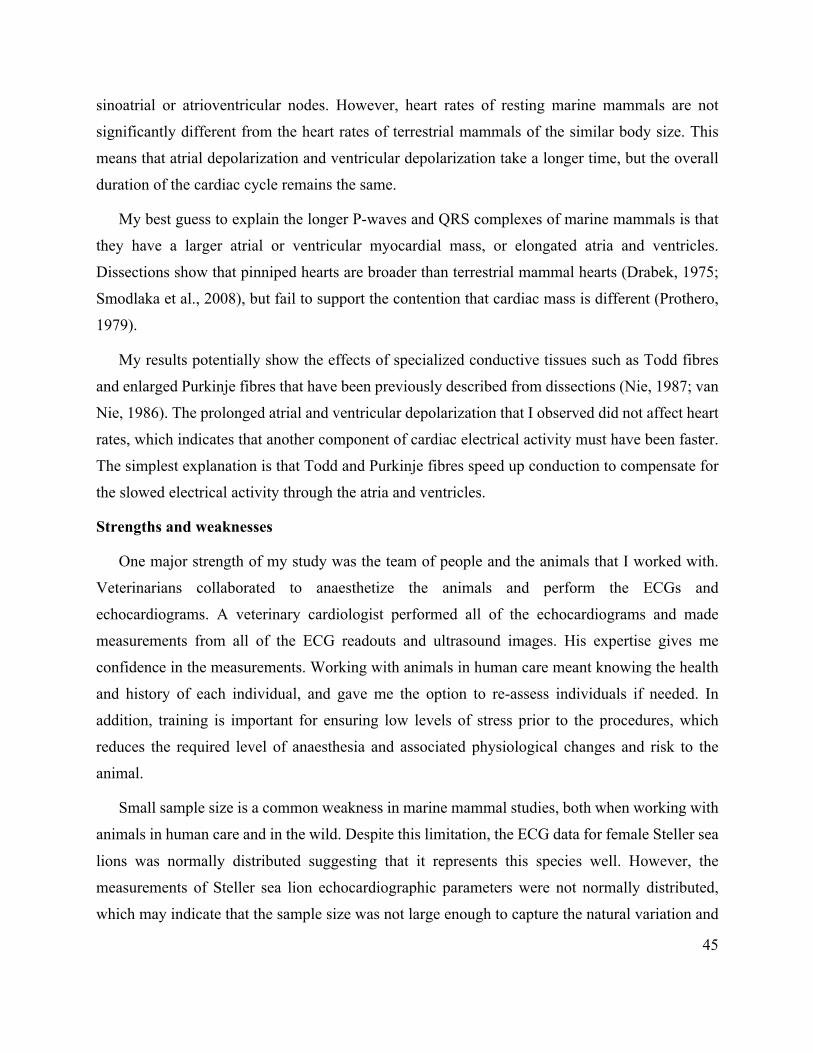
45
sinoatrial or atrioventricular nodes. However, heart rates of resting marine mammals are not
significantly different from the heart rates of terrestrial mammals of the similar body size. This
means that atrial depolarization and ventricular depolarization take a longer time, but the overall
duration of the cardiac cycle remains the same.
My best guess to explain the longer P-waves and QRS complexes of marine mammals is that
they have a larger atrial or ventricular myocardial mass, or elongated atria and ventricles.
Dissections show that pinniped hearts are broader than terrestrial mammal hearts (Drabek, 1975;
Smodlaka et al., 2008), but fail to support the contention that cardiac mass is different (Prothero,
1979).
My results potentially show the effects of specialized conductive tissues such as Todd fibres
and enlarged Purkinje fibres that have been previously described from dissections (Nie, 1987; van
Nie, 1986). The prolonged atrial and ventricular depolarization that I observed did not affect heart
rates, which indicates that another component of cardiac electrical activity must have been faster.
The simplest explanation is that Todd and Purkinje fibres speed up conduction to compensate for
the slowed electrical activity through the atria and ventricles.
Strengths and weaknesses
One major strength of my study was the team of people and the animals that I worked with.
Veterinarians collaborated to anaesthetize the animals and perform the ECGs and
echocardiograms. A veterinary cardiologist performed all of the echocardiograms and made
measurements from all of the ECG readouts and ultrasound images. His expertise gives me
confidence in the measurements. Working with animals in human care meant knowing the health
and history of each individual, and gave me the option to re-assess individuals if needed. In
addition, training is important for ensuring low levels of stress prior to the procedures, which
reduces the required level of anaesthesia and associated physiological changes and risk to the
animal.
Small sample size is a common weakness in marine mammal studies, both when working with
animals in human care and in the wild. Despite this limitation, the ECG data for female Steller sea
lions was normally distributed suggesting that it represents this species well. However, the
measurements of Steller sea lion echocardiographic parameters were not normally distributed,
which may indicate that the sample size was not large enough to capture the natural variation and

46
thus be representative of the population. Unfortunately, it was not logistically possible to obtain
more measurements from the three species I studied.
Measuring cardiac function in anaesthetized animals is often regarded as a weakness, but was
necessary in my study and the only way I could obtain a complete echocardiographic exam of a
Steller sea lion. Anaesthetic protocols affect cardiac function and the magnitude of the effect is
protocol-dependent. My allometric ECG analysis showed that anaesthesia had no effect on most
ECG parameters. The one exception was the QRS complex, which depended on the physiological
state of the animal. Due to the large number of terrestrial and marine species, and the wide range
of anesthetic protocols included in the analysis, I was able to use data from anaesthetized
individuals and evaluate electrocardiographic relationships based on physiological state.
For the echocardiographic analysis, it is unclear what effect anaesthesia had on the parameters
measured, but the values I obtained were similar to those collected from conscious southern sea
lions. This suggests that echocardiographic measurements may not be as sensitive to anaesthetic
protocols as ECG measurements. Lastly, it seems unlikely that echocardiograms can be obtained
from conscious Steller sea lions, because the procedure required the application of significant
pressure to their chests which may not be tolerated even by trained individuals. For this reason,
anesthetized values provide a good baseline for Steller sea lions.
The data in my thesis must be considered with several caveats in mind. When drawing
comparisons, the datasets did not include an exhaustive list of species. However, I added a distinct
group that was previously underrepresented in cardiac scaling arguments—marine mammals. In
my allometric comparisons, I often relied on a single individual to represent a species and I used
an approximation of body size when mass was not stated in a literature source. By estimating
masses, I may not have a true representation of the individual(s) from which the ECG
measurements were recorded. However, given the logarithmic scaling of body mass, I feel that this
did not greatly affect the results.
Unfortunately, the available literature on left ventricular function is only a fraction of what is
available for electrocardiography, and only three species of marine mammals (including Steller
sea lions) have been studied so far using this technology. This greatly limited my ability to
confidently address whether marine mammals have adaptations to left ventricular function and
pulmonary and aortic blood flow.

47
In my ECG comparison, I was unable to include metabolic state (e.g., resting, active, fasted
etc.)—which has implications for my heart rate comparisons. Furthermore, I did not have enough
records to assess differences between cetaceans and pinnipeds. The different dive behaviours
between taxonomic groups of marine mammals could reveal more interesting trends. Despite these
caveats, I found plausible linear trends for all ECG parameters and conducted a thorough
investigation addressing cardiac function in marine and terrestrial mammals—as well as in
anaesthetized and conscious mammals.
My research only identifies functional differences between the hearts of marine and terrestrial
mammals. From my comparisons, I can only suggest that cardiac adaptations to diving may exist
and provide possible explanations for the observed differences. It is interesting to note that despite
the majority of the measurements of marine mammals being taken at rest, and none of the
measurements being taken while diving, I still observed differences between marine and terrestrial
mammals. The measurable presence of these potential adaptations in resting individuals suggests
that they are constant, which further supports my hypothesis that they exist as a result of anatomical
adaptations to diving. If they were functional adaptations to diving, I would expect them to only
be observed during dives.
Future research
Future research should focus on cardiac function in marine mammals while diving. Observing
how cardiac timing and left ventricular function change during a dive would provide some
indication of what the functional consequence is of the differences observed in rest. Ideally resting
measurements of an individual can be compared to diving measurements. With advances in
implantable cardiac monitoring technology, recording an ECG through the duration of a dive is
possible. Unfortunately, echocardiography has not advanced as far. However, measurements can
be taken underwater, so the potential to measure left ventricular function in individuals breath-
holding near the surface is possible.
To further advance understanding of left ventricular function, it would be beneficial to model
the left ventricle of a marine mammal heart. Measurements of ejection fraction and stroke volume,
two important values for assessing left ventricular function, can be estimated from
echocardiography if the shape and size of the left ventricle is known. So far, these values have
only been calculated under a set of assumptions about the shape and size of the left ventricle—

48
assumptions that have only been validated in humans. Thus, modelling the left ventricle of a
marine mammal, and performing echocardiography would provide even better insight into how
the left ventricle functions.
Conclusion
In all, my comparisons show that the hearts of marine mammals function quite similarly to
those of terrestrial mammals, with some notable differences that I believe are evolutionary
modifications related to diving because knowledge of the mammalian dive response alone does
not completely explain how marine mammals can perform long-duration dives.
My research addressed the function of one organ, the heart, with respect to diving and its
potential adaptations. Further understanding of how these observed differences in function affect
marine mammal physiology while diving is unclear, but my results provide insights into potential
limitations to diving. Comparisons with other species often allow for reflection on current
knowledge. Re-assessment of current understanding of myocardial tissue, signal conduction, and
left ventricular function is needed to understand whether the differences noted for marine
mammals are novel or whether they are simple modifications and adjustments of what already
exists in all mammals. If only minor adjustments, as suggested from my findings, it begs asking
exactly what they are and how they allow the hearts of marine mammals to function normally
under extreme conditions.

49
References
Bayés De Luna, A., Bayés Genis, A., Brugada, R., Fiol, M., Zareba, W., 2012. Characteristics of
the normal electrocardiogram: Normal ECG waves and intervals, in: Clinical
Electrocardiography. John Wiley & Sons, Ltd, Barcelona, Spain, pp. 67–94.
doi:10.1002/9781118392041.ch7
Ben-Tal, A., Shamailov, S.S., Paton, J.F.R., 2012. Evaluating the physiological significance of
respiratory sinus arrhythmia : looking beyond ventilation – perfusion. J. Physiol. 8, 1989–
2008. doi:10.1113/jphysiol.2011.222422
Blix, A.S., Folkow, B., 1983. Cardiovascular adjustments to diving in mammals and birds. Handb.
Physiol. 3, 917–945. doi:10.1002/cphy.cp020325
Blix, A.S., Kjekshus, J.K., Enge, I., Bergan, A., 1976. Myocardial blood flow and metabolism in
the diving seal. Acta Physiol. Scand. 96, 277–280.
Boon, J., Wingfield, W.E., Miller, C.W., 1983. Echocardiographic indices in the normal dog. Vet.
Radiol. 24, 214–221. doi:10.1111/j.1740-8261.1983.tb00718.x
Boron, W.F., Boulpaep, E.L., 2017. Medical physiology, 3rd ed. Elsevier, Philadelphia, PA.
Butler, P., 1982. Respiratory and cardiovascular control during diving in birds and mammals. J.
Exp. Biol. 100, 195–221.
Campbell, K.B., Rhode, E.A., Cox, R.H., Hunter, W.C., Noordergraaf, A., 1981. Functional
consequences of expanded aortic bulb: a model study. Am. Physiol. Soc. 240, R200–R210.
Castellini, M.A., Rea, L.D., Sanders, J.L., Castellini, J.M., Zenteno-Savin, T., 1994.
Developmental changes in cardiorespiratory patterns of sleep-associated apnea in northern
elephant seals. Am. J. Physiol. 267, R1294-301.
Castro, E.F., Dassis, M., De León, M.C., Rodríguez, E., Davis, R.W., Saubidet, A., Rodríguez,
D.H., Díaz, A., 2018. Echocardiographic left ventricular structure and function in healthy,
non-sedated southern sea lions (Otaria flavescens). Aquat. Mamm. 44, 405–410.
doi:10.1578/AM.44.4.2018.405
Chetboul, V., Lichtenberger, J., Mellin, M., Mercera, B., Hoffmann, A.C., Chaix, G., Trehiou-
Sechi, E., Misbach, C., Petit, A., Lefebvre, H.P., Gaide, N., Tissier, R., Delfour, F., 2012.
Within-day and between-day variability of transthoracic anatomic M-mode echocardiography

50
in the awake bottlenose dolphin (Tursiops truncatus). J. Vet. Cardiol. 14, 511–518.
doi:10.1016/j.jvc.2012.07.002
Cornell, C.C., Kittleson, M.D., Della Torre, P., Häggström, J., Lombard, C.W., Pedersen, H.D.,
Vollmar, A., Wey, A., 2004. Allometric scaling of M-mode cardiac measurements in normal
adult dogs. J Vet Intern Med 18, 311–321. doi:10.1111/j.1939-1676.2004.tb02551.x
Dassis, M., Rodríguez, D.H., Rodríguez, E., Ponce De León, A., Castro, E., 2016. The
electrocardiogram of anaesthetized southern sea lion (Otaria flavescens) females. J. Vet.
Cardiol. 18, 71–78. doi:10.1016/j.jvc.2015.09.003
Davis, R.W., Polasek, L., Watson, R., Fuson, A., Williams, T.M., Kanatous, S.B., 2004. The diving
paradox: New insights into the role of the dive response in air-breathing vertebrates. Comp.
Biochem. Physiol. - A Mol. Integr. Physiol. 138, 263–268. doi:10.1016/j.cbpb.2004.05.003
Davis, R.W., Williams, T.M., 2012. The marine mammal dive response is exercise modulated to
maximize aerobic dive duration. J. Comp. Physiol. A Neuroethol. Sensory, Neural, Behav.
Physiol. 198, 583–591. doi:10.1007/s00359-012-0731-4
Dennison, S.E., Boor, M., Fauquier, D., van Bonn, W., Greig, D.J., Gulland, F.M.D., 2011a.
Foramen ovale and ductus arteriosus patency in neonatal harbor seal (Phoca vitulina) pups in
rehabilitation. Aquat. Mamm. 37, 161–166. doi:10.1578/AM.37.2.2011.161
Dennison, S.E., Van Bonn, W., Boor, M., Adams, J., Pussini, N., Spraker, T., Gulland, F.M.D.,
2011b. Antemortem diagnosis of a ventricular septal defect in a California sea lion Zalophus californianus. Dis. Aquat. Organ. 94, 83–88. doi:10.3354/dao02316
Diniz, A.N., Pessoa, G.T., Moura, L.S., Sousa, F.C.A., Rodrigues, R.P.S., Souza, A.B., Almeida,
H.M., Freire, L.D.S., Sanches, M.P., Alves, F.R., 2017. Echocardiographic findings of
bidimensional mode, M-mode, and Doppler of clinically normal black-rumped agouti
(Dasyprocta prymnolopha, Wagler 1831). J. Zoo Wildl. Med. 48, 287–293.
Dorn, G.W., 2007. The fuzzy logic of physiological cardiac hypertrophy. Hypertension 49, 962–
970. doi:10.1161/HYPERTENSIONAHA.106.079426
Drabek, C.M., 1975. Some anatomical aspects of the cardiovascular system of antarctic seals and
their possible functional significance in diving. J. Morphol. 145, 85–105.
doi:10.1002/jmor.1051450106
Drabek, C.M., Burns, J.M., 2002. Heart and aorta morphology of the deep-diving hooded seal
51
(Cystophora cristata). Can. J. Zool. Can. Zool. 80, 2030–2036. doi:Doi 10.1139/Z02-181
Elmegaard, S.L., Johnson, M., Madsen, P.T., Mcdonald, B.I., 2016. Cognitive control of heart rate
in diving harbor porpoises. Curr. Biol. Mag. 1175–1176.
Elsner, R., 1969. Cardiovascular adjustments to diving, in: Andersen, H.T. (Ed.), The Biology of
Marine Mammals. Academic Press, New York, New York, pp. 117–145.
Elsner, R.W., Franklin, D.L., Van Citters, R.L., 1964. Cardiac output during diving in an
unrestrained sea lion. Nature 202, 809–810. doi:10.1038/202809a0
Falabella, V., Campagna, C., Lewis, M., Falabella, V., Campagna, C., Lewis, M., 1999.
Electrocardiography of southern elephant seal (Mirounga leonina) weanlings. J. Zoo Wildl.
Med. 30, 526–531.
Fontes-Sousa, A.P.N., Bras-Silva, C., Moura, C., Areias, J.C., Leite-Moreira, A.F., 2006. M-mode
and Doppler echocardiographic reference values for male New Zealand white rabbits. Am. J.
Vet. Res. 67, 1725–1729.
Grauwiler, J., 1965. Herz und Kreislauf der Säugetiere. Vergleichend-funktionelle Daten von Jules
Grauwiler, mit einem Geleitwort von Heinrich Spörri. Birkhäuser Verlag, Basel.
Green, J.A., 2011. The heart rate method for estimating metabolic rate: Review and
recommendations. Comp. Biochem. Physiol. - A Mol. Integr. Physiol. 158, 287–304.
doi:10.1016/j.cbpa.2010.09.011
Grossman, P., Kollai, M., 1993. Respiratory sinus arrhythmia, cardiac vagal tone, and respiration:
Within- and between-individual relations. Psychophysiology 30, 486–495.
Guglielmini, C., Rocconi, F., Brugnola, L., Valerio, F., Mattei, L., Boari, A., 2006.
Echocardiographic and Doppler echocardiographic findings in 11 wolves (Canis lupus). Vet.
Rec. 158, 125–129.
Günther, B., Morgado, E., 1997. Allometry of ECG waves in mammals. Biol. Res. 30, 167–170.
Häggström, J., Andersson, O., Falk, T., Nilsfors, L., OIsson, U., Kresken, J.G., Höglund, K.,
Rishniw, M., Tidholm, A., Ljungvall, I., 2016. Effect of body weight on echocardiographic
measurements in 19,866 pure-bred cats with or without heart disease. J. Vet. Intern. Med. 30,
1601–1611. doi:10.1111/jvim.14569
Hallowell, G.D., Potter, T.J., Bowen, I.M., 2007. Methods and normal values for echocardiography

52
in adult dairy cattle. J. Vet. Cardiol. 9, 91–98. doi:10.1016/j.jvc.2007.10.001
Hamlin, R.L., Ridgway, S.H., Gilmartin, W.G., 1972. Electrocardiogram of pinnipeds. Am. J. Vet.
Res. 33, 867–875.
Harms, C.A., Jensen, E.D., Townsend, F.I., Hansen, L.J., Schwacke, L.H., Rowles, T.K., 2013.
Electrocardiograms of bottlenose dolphins (Tursiops truncatus) out of water: habituated
collection versus wild postcapture animals. J. Zoo Wildl. Med. 44, 972–81.
doi:10.1638/2013-0093.1
Hindle, A.G., Young, B.L., Rosen, D.A.S., Haulena, M., Trites, A.W., 2010. Dive response differs
between shallow- and deep-diving Steller sea lions (Eumetopias jubatus). J. Exp. Mar. Bio.
Ecol. 394, 141–148. doi:10.1016/j.jembe.2010.08.006
Holt, J.P., Rhode, E.A., Kines, H., 1968. Ventricular volumes and body weight in mammals. Am.
J. Physiol. 215, 704–715.
Holt, J.P., Rhode, E.A., Peoples, S.A., Kines, H., 1962. Left ventricular function in mammals of
greatly different size. Circ. Res. 10, 798–806.
Irving, L., Scholander, P.F., Grinnell, S.W., 1941. The regulation of arterial blood pressure in the
seal during diving. Am. J. Physiol. 135, 557–566. doi:10.1152/ajplegacy.1942.135.3.557
Kastelein, R.A., Meijler, F.L., 1989. Respiratory arrhythmia in the hearts of Harbour porpoises
(Phocoena phocoena). Aquat. Mamm. 15.2, 57–63.
Kimura, Y., Karakama, S., Kobayashi, M., Machinda, N., 2016. Incidence, distribution and
morphology of left ventricular false tendons in cat hearts. J. Vet. Med. Ser. C Anat. Histol.
Embryol. 45, 490–493. doi:10.1111/ahe.12216
King, J.E., 1977. Comparative anatomy of the major blood vessels of the sealions Neophoca and
Phocarctos; with comments on the differences between the otariid and phocid vascular
systems. J. Zool 181, 69–94. doi:10.1111/j.1469-7998.1977.tb04571.x
King, R.L., Jenks, J.L., White, P.D., 1953. The electrocardiogram of a beluga whale. Circulation
8, 387–393. doi:10.1161/01.CIR.8.3.387
Kooyman, G.L., Ponganis, P.J., 1998. The physiological basis of diving to depth: birds and
mammals. Annu. Rev. Physiol. 60, 19–32. doi:10.1146/annurev.physiol.60.1.19
Kusunose, K., Penn, M.S., Zhang, Y., Cheng, Y., Thomas, J.D., Marwick, T.H., Popović, Z.B.,

53
2012. How similar are the mice to men? Between-species comparison of left ventricular
mechanics using strain imaging. PLoS One 7. doi:10.1371/journal.pone.0040061
Leroux, A.A., Moonen, M.L., Farnir, F., Sandersen, C.F., Deleuze, S., Salciccia, A., Amory, H.,
2012. Two-dimensional and M-mode echocardiographic reference values in healthy adult
Saanen goats. Vet. Rec. 170, 154. doi:10.1136/vr.100192
Meijler, F.L., 1985. Atrioventricular conduction versus heart size from mouse to whale. J. Am.
Coll. Cardiol. 5, 363–365. doi:10.1016/S0735-1097(85)80060-7
Meijler, F.L., Meijler, T.D., 2011. Archetype, adaptation and the mammalian heart. Netherlands
Hear. J. 19, 142–148. doi:10.1007/s12471-011-0086-4
Meijler, F.L., van der Tweel, L.H., 1986. De elektrocardiogrammen van 10 olifanten en van de
orka in Harderwijk. Ned Tijdschr Geneeskd 130, 2344–2348.
Meijler, F.L., Wittkampf, F.H.M., Brennen, K.R., Baker, V., Wassenaar, C., Bakken, E.E., 1992.
Electrocardiogram of the humpback whale (Megaptera novaeangliae) with specific reference
to atrioventricular transmission and ventricular excitation. J. Am. Coll. Cardiol. 20, 475–479.
doi:10.1016/0735-1097(92)90120-C
Miedler, S., Fahlman, A., Valls Torres, M., Álvaro Álvarez, T., Garcia-Parraga, D., 2015.
Evaluating cardiac physiology through echocardiography in bottlenose dolphins: using stroke
volume and cardiac output to estimate systolic left ventricular function during rest and
following exercise. J. Exp. Biol. 218, 3604–3610. doi:10.1242/jeb.131532
Morrison, S.A., Moise, N.S., Scarlett, J., Mohammed, H., Yeager, A.E., 1992. Effect of breed and
body weight on echocardiographic values in four breeds of dogs of differing somatotype. J.
Vet. Intern. Med. 6, 220–224. doi:10.1111/j.1939-1676.1992.tb00342.x
Murdaugh, H. V, Robin, E.D., Millen, J.E., Drewry, W.F., Weiss, E., 1966. Adaptations to diving
in the harbor seal: cardiac output during diving. Am. J. Physiol. 210, 176–180.
Murie, J., 1874. Researches upon the anatomy of the Pinnipedia.—(Part III.) Descriptive anatomy
of the sea-lion (Otaria jubata). Trans. Zool. Soc. London 8, 501–582.
Nie, C.J. van, 1988. The conducting system of the heart of the Harbour Porpoise (Phocoena
phocoena, Linnaeus, 1758). Aquat. Mamm. 14.2, 69–72.
Nie, C.J. van, 1987. Todd fibres—Purkinje fibres—in the wall of the right atrium in dolphins

54
(Their structure and hypothetical function). Aquat. Mamm. 13.3, 103–104.
Noujaim, S.F., Lucca, E., Muñoz, V., Persaud, D., Berenfeld, O., Meijler, F.L., Jalife, J., 2004.
From mouse to whale: A universal scaling relation for the PR interval of the
electrocardiogram of mammals. Circulation 110, 2802–2808.
doi:10.1161/01.CIR.0000146785.15995.67
Noviana, D., Kurniawan, L.K.L., 2013. Heart size evaluation of Indonesian domestic house cat by
motion mode echocardiography imaging. HAYATI J. Biosci. 20, 40–46.
doi:10.4308/hjb.20.1.40
Otto, C.M., 2018. Textbook of clinical echocardiography, Sixth. ed. Elsevier/Saunders,
Philadelphia, PA.
Petrič, A.D., Rishniw, M., Thomas, W.P., 2012. Two-dimensionally-guided M-mode and pulsed
wave Doppler echocardiographic evaluation of the ventricles of apparently healthy cats. J.
Vet. Cardiol. 14, 423–430. doi:10.1016/j.jvc.2012.04.004
Pfeiffer, C.J., 1990. Observations on the ultrastructural morphology of the bowhead whale
(Balaena mysticetus) heart. J. Zoo Wildl. Med. 21, 48–55.
Picker, O., Scheeren, T.W.L., Arndt, J.O., 2001. Inhalation anaesthetics increase heart rate by
decreasing cardiac vagal activity in dogs. Br. J. Anaesth. 87, 748–754.
doi:10.1093/bja/87.5.748
Ponganis, P., 2015. Diving Physiology of Marine Mammals and Seabirds. Cambridge University
Press, Cambridge. doi:10.1017/CBO9781139045490
Ponganis, P.J., Kooyman, G.L., 1999. Heart rate and electrocardiogram characteristics of a young
California gray whale (Eschrichtius robustus). Mar. Mammal Sci. 15, 1198–1207.
Ponganis, P.J., Kooyman, G.L., Zornow, M.H., 1991. Cardiac output in swimming California sea
lions, Zalophus californianus. Univ. Chicago Press 64, 1296–1306.
Ponganis, P.J., McDonald, B.I., Tift, M.S., Williams, C.L., 2017. Heart rate regulation in diving
sea lions: the vagus nerve rules. J. Exp. Biol. 220, 1372–1381. doi:10.1242/jeb.146779
Ponganis, P.J., Stockard, T.K., Levenson, D.H., Berg, L., Baranov, E.A., 2006. Cardiac output and
muscle blood flow during rest-associated apneas of elephant seals. Comp. Biochem. Physiol.
Part A 144, 105–111. doi:10.1016/j.cbpa.2006.02.009

55
Prothero, J., 1979. Heart weight as a function of body weight in mammals. Growth 43, 139–50.
Rhode, E.A., Elsner, R., Peterson, T.M., Campbell, K.B., Spangler, W., 1986. Pressure-volume
characteristics of aortas of harbor and Weddell seals. Am. J. Physiol. 251, R174–R180.
Rowlatt, U., 1990. Comparative anatomy of the heart of mammals. Zool. J. Linn. Soc. 98, 73–110.
doi:10.1111/j.1096-3642.1990.tb01220.x
Santilli, R.A., Perego, M., 2009. Elettrocardiografia del cane e del gatto: Genesi e interpretazione
del ritmo cardiaco. Elsevier Masson, Italy.
Scansen, B.A., Morgan, K.L., 2015. Reference intervals and allometric scaling of
echocardiographic measurements in Bengal cats. J. Vet. Cardiol. 17, S282–S295.
doi:10.1016/j.jvc.2015.02.001
Scholander, P.F., 1940. Experimental investigations on the respiratory function in diving mammals
and birds. Hvalrådets Skr. 1–131.
Senft, A.W., Kanwisher, J.K., 1960. Cardiographic observations on a fin-back whale. Circ. Res.
8, 961–964. doi:10.1161/01.RES.8.5.961
Shadwick, R.E., Gosline, J.M., 1994. Arterial mechanics in the fin whale suggest a unique
hemodynamic design. Am. J. Physiol. 267, R805-18.
Siegal-Willott, J., Estrada, A., Bonde, R., Wong, A., Estrada, D.J., Harr, K., 2006.
Electrocardiography in two subspecies of manatee (Trichechus manatus latirostris and T. m. manatus). J. Zoo Wildl. Med. 37, 447–453.
Smodlaka, H., Henry, R.W., Reed, R.B., 2009. Macroscopic anatomy of the great vessels and
structures associated with the heart of the ringed seal (Pusa hispida). J. Vet. Med. Ser. C
Anat. Histol. Embryol. 38, 161–168. doi:10.1111/j.1439-0264.2008.00896.x
Smodlaka, H., Henry, R.W., Schumacher, J., Reed, R.B., 2008. Macroscopic anatomy of the heart
of the ringed seal (Phoca hispida). J. Vet. Med. Ser. C Anat. Histol. Embryol. 37, 30–35.
doi:10.1111/j.1439-0264.2007.00791.x
Stewardson, C.L., Hemsley, S., Meyer, M.A., Canfield, P.J., Maindonald, J.H., 1999. Gross and
microscopic visceral anatomy of the male Cape fur seal, Arctocephalus pusillus pusillus
(Pinnipedia: Otariidae), with reference to organ size and growth. J. Anat 195, 235–255.
doi:10.1017/S0021878299005270

56
Surawicz, B., Childers, R., Deal, B.J., Gettes, L.S., 2009. Recommendations for the
standardization and interpretation of the electrocardiogram. J. Am. Coll. Cardiol. 53, 976–
981. doi:10.1016/j.jacc.2007.01.025
Tarpley, R.J., Hillmann, D.J., Henk, W.G., George, J.C., 1997. Observations on the external
morphology and coronary vasculature of the heart of the bowhead whale, Balaena mysticetus.
Anat. Rec. 247, 556–581.
Thornton, S.J., Hochachka, P.W., Crocker, D.E., Costa, D.P., Leboeuf, B.J., Spielman, D.M., Pelc,
N.J., 2005. Stroke volume and cardiac output in juvenile elephant seals during forced dives.
J. Exp. Biol. 208, 3637–3643. doi:10.1242/jeb.01789
Torad, F.A., Amer, M.S., Shamaa, A.A., Elsherpieny, E.A., 2017. Echocardiographic
measurements and indices in normal adult buffalo (Bubalus bubalis). J. Appl. Anim. Res. 45,
336–341. doi:10.1080/09712119.2016.1190733
van Nie, C.J., 1986. The Purkinje fibres in the heart of the common seal Phoca vitulina (Linnaeus,
1758), the Baikal seal Pusa sibirica (Gmelin, 1788), the fur seal Arctocephalus australis
(Zimmermann, 1782), the harbour porpoise Phocoena phocoena . Aquat. Mamm. 12.2, 61–
64.
West, G.B., Brown, J.H., 2005. The origin of allometric scaling laws in biology from genomes to
ecosystems: towards a quantitative unifying theory of biological structure and organization.
J. Exp. Biol. 208, 1575–1592. doi:10.1242/jeb.01589
Williams, T.M., Blackwell, S.B., Richter, B., Sinding, M.H.S., Heide-Jørgensen, M.P., 2017.
Paradoxical escape responses by narwhals (Monodon monoceros). Science (80-. ). 358, 1328–
1331. doi:10.1126/science.aao2740
Williams, T.M., Fuiman, L.A., Kendall, T., Berry, P., Richter, B., Noren, S.R., Thometz, N.,
Shattock, M.J., Farrell, E., Stamper, A.M., Davis, R.W., 2015. Exercise at depth alters
bradycardia and incidence of cardiac anomalies in deep-diving marine mammals
Supplementary Figure ECG. Nat Commun 1–3.
Williams, T.M., Haun, J., Davis, R.W., Fuiman, L.A., Kohin, S., 2001. A killer appetite: Metabolic
consequences of carnivory in marine mammals. Comp. Biochem. Physiol. - A Mol. Integr.
Physiol. 129, 785–796. doi:10.1016/S1095-6433(01)00347-6
Williams, T.M., Kooyman, G.L., Croll, D.A., 1991. The effect of submergence on heart rate and

57
oxygen consumption of swimming seals and sea lions. J. Comp. Physiol. B 160, 637–44.
doi:10.1007/BF00571261
Yasuma, F., Hayano, J., 2004. Respiratory sinus arrhythmia: Why does the heartbeat synchronize
with respiratory rhythm? Chest 125, 683–690.
Yildirim, H., Adanir, T., Atay, A., Katircioğlu, K., Savaci, S., 2004. The effects of sevoflurane,
isoflurane and desflurane on QT interval of the ECG. Eur. J. Anaesthesiol. 21, 566–570.
doi:10.1017/S0265021504007112
Zapol, W.M., Schneider, R.C., Liggins, G.C., Qvist, J., Creasy, R.K., Snider, M.T., Hochachka,
P.W., 1979. Regional Blood Flow During Simulated Diving of the Conscious Antarctic
Weddell Seal. J. Appl. Physiol.
Zelenkova, I., Chomahidze, P., 2016. Long-term effects of frequent maximal breath-holding on
the cardiac health of elite freedivers. Scand. J. Med. Sci. Sport. 26, 1283–1286.
doi:10.1111/sms.12580

58
Appendices
Appendix A Steller sea lion QRS morphology
Typical QRS morphology of anaesthetized Steller sea lions (n=8) in limb and augmented leads. Numbers are counts of individuals with each QRS type. Lowercase letters indicate small deflections, capital letters indicate large deflections, and apostrophes indicate a secondary wave of the given type.
Lead QR QRs qR qRS qRs qrS R Rs rS rSR' rSr' rsR' s
I 0 1 0 1 5 1 0 0 0 0 0 0 0
II 0 0 0 4 2 1 0 0 1 0 0 0 0
III 0 0 0 0 0 0 0 1 7 0 0 0 0
aVR 0 0 0 0 0 0 0 0 0 1 4 2 0
aVL 1 1 3 0 2 0 1 0 0 0 0 0 0
aVF 0 0 1 1 1 0 0 0 4 0 0 0 1
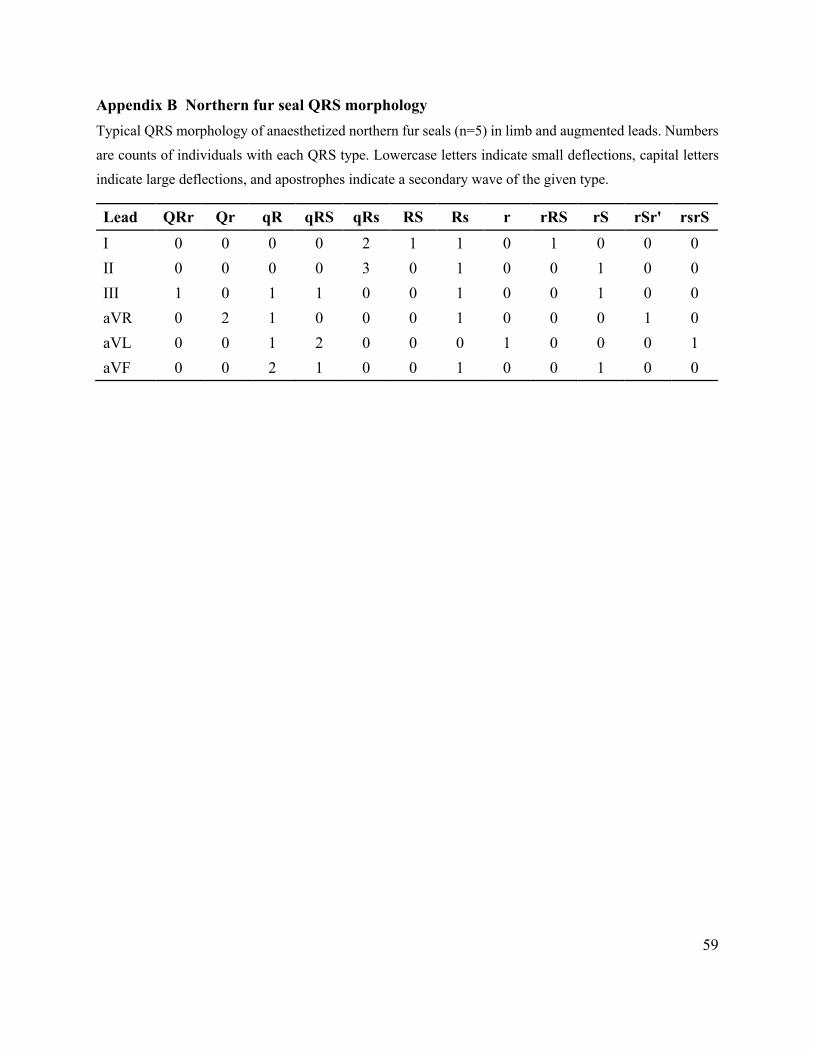
59
Appendix B Northern fur seal QRS morphology
Typical QRS morphology of anaesthetized northern fur seals (n=5) in limb and augmented leads. Numbers are counts of individuals with each QRS type. Lowercase letters indicate small deflections, capital letters indicate large deflections, and apostrophes indicate a secondary wave of the given type.
Lead QRr Qr qR qRS qRs RS Rs r rRS rS rSr' rsrS
I 0 0 0 0 2 1 1 0 1 0 0 0 II 0 0 0 0 3 0 1 0 0 1 0 0 III 1 0 1 1 0 0 1 0 0 1 0 0 aVR 0 2 1 0 0 0 1 0 0 0 1 0 aVL 0 0 1 2 0 0 0 1 0 0 0 1 aVF 0 0 2 1 0 0 1 0 0 1 0 0

60
Appendix C Walrus QRS morphology
Typical QRS morphology of an anaesthetized walrus (n=1) in limb and augmented leads. Lowercase letters indicate small deflections, capital letters indicate large deflections.
Lead Shape
I R II rS III rS aVR Qr aVL qR aVF rS

61
Appendix D ECG dataset Electrocardiographic measurements of mammals. n is the minimum sample size used to calculate average ECG parameters for each species. PS indicates the physiological state of the individuals at the time of the recording—Y = anaesthetized, N = conscious. EG indicates the ecological group of the species, either marine (M) or terrestrial (T). HR = heart rate, P = P-wave duration, PR = PR interval, QRS = QRS complex duration, QT = QT interval. ECG sources are references for the ECG data and mass sources are references for the mass data.
Species Common name n mass PS EG HR P PR QRS QT ECG source Mass source
Mirounga angustirostris
Northern elephant seal 13 1167 Y M 66.9 NaN 0.200 0.102 0.392
(Hamlin et al., 1972; Van Citters et al.,
1965)
(Hamlin et al., 1972; Van Citters et al.,
1965)
Mirounga leonina
Southern elephant seal 24 144 Y M 130.3 0.092 0.132 0.082 0.263 (Falabella et al.,
1999) (Falabella et al., 1999)
Otaria flavescens
Southern sea lion 13 81 Y M 104.6 0.107 NaN 0.084 0.314 (Dassis et al., 2016) (Dassis et al., 2016)
Didelphis marsupialis
Common opossum 10 1.3 Y T 200.0 NaN 0.080 0.025 0.140 Wilber, 1955 cited in
(Grauwiler, 1965) McNab, 1978 cited in
(Heusner, 1991)
Talpa europaea
European mole NA 0.08 Y T 345.0 NaN 0.025 0.009 0.029 (Grauwiler, 1965) (Bonin, 1937)
Macaca irus Crab-eating macaque 12 7.1 Y T 225.0 NaN 0.073 0.028 0.171
DeWaart and Storm, 1935; DeWaart et al.,
1936 cited in (Grauwiler, 1965)
(Tokura et al., 1975)

62
Papio ursinus Baboon 15 20.5 Y T 122.0 NaN 0.120 0.040 0.270 Kaminer, 1958 cited in (Grauwiler, 1965)
Kaminer, 1958 cited in (Grauwiler, 1965)
Mesocricetus auratus Hamster NA 0.12 Y T 400.0 NaN 0.043 0.021 NaN
Lombard, 1952; Nakamura and
Swank, 1960; both cited in (Grauwiler,
1965)
Tegowska and Gebczynski, 1975 cited in (Heusner,
1991)
Meriones shawii shawii Gerbil 3 0.18 Y T 240.5 NaN 0.060 0.025 0.068 (Grauwiler, 1965) (Grauwiler, 1965)
Acomys cahirinus Spiny mouse 5 0.065 Y T 367.5 NaN 0.045 0.023 0.060 (Grauwiler, 1965)
Shkolnik and Borut, 1969 cited in
(Heusner, 1991)
Rattus norvegicus Rat NA 0.17 Y T 396.5 0.015 0.044 0.021 0.072
Beinfield and Lehr, 1956; Heise and
Kimbel, 1955; Hill et al., 1960; Lombard, 1952; Normann et al., 1961; Sambhi and White, 1960; Schinzel, 1933;
Werth, 1958; all cited in (Grauwiler, 1965)
Morrison and Ryser, 1951; Hart, 1971;
both cited in (Heusner, 1991)
Peromyscus Deer mouse 10 0.042 Y T 420.0 NaN 0.032 0.025 NaN Lombard, 1952 cited in (Grauwiler, 1965)
Mazen and Rudd, 1980; McNab and Morrison, 1963;
Kenagy and Vleck, 1982; McNab and Morrison, 1963;
Glenn, 1970; Pearson, 1947; Muser and Shoemaker, 1965;
Hill, 1975; Hayward, 1965; McNab, 1973;

63
all cited in (Heusner, 1991)
Eliomys quercinus
Garden dormouse 1 0.075 Y T 350.0 NaN 0.050 0.020 0.110 (Grauwiler, 1965) (Grauwiler, 1965)
Cavia porcellus Guinea pig 10 0.43 Y T 260.0 NaN 0.065 0.033 NaN Lombard, 1952 cited
in (Grauwiler, 1965) (Gehr et al., 1981)
Canis familiaris
Domestic dog 106 21.4 Y T 117.6 NaN 0.102 0.050 0.272
Doherty and Hara, 1961; Lombard and
Witham, 1955; Santos and Kittle, 1958; Siems et al., 1955; all cited in (Grauwiler, 1965)
(Gehr et al., 1981)
Procyon lotor lotor Raccoon 1 7 Y T 200.0 NaN 0.060 0.030 0.160 Wilber, 1955 cited in
(Grauwiler, 1965) (Brown and Nicoletto,
1991)
Meles meles Badger 4 14.5 Y T 179.0 NaN 0.084 0.055 0.201 Johansson, 1957
cited in (Grauwiler, 1965)
Iversen, 1972 cited in (Heusner, 1991)
Felis catus Domestic cat 38 3.9 Y T NaN 0.040 0.075 0.030 0.210
Blok and Boeles, 1957 cited in
(Grauwiler, 1965) (Taylor et al., 1982)
Lynx rufus Bobcat 1 15 Y T 190.0 NaN NaN 0.050 0.200 (Grauwiler, 1965) (Brown and Nicoletto, 1991)
Mus musculus Mouse 20 0.017 Y T 428.0 NaN 0.038 0.022 NaN Lombard, 1952 cited in (Grauwiler, 1965)
Pearson, 1947 cited in (Heusner, 1991)

64
Callorhinus ursinus
Northern fur seal 5 29.4 Y M 113.0 0.074 0.195 0.066 0.234 this study this study
Eumetopias jubatus
Steller sea lion 8 198.8 Y M 56.5 0.136 0.255 0.130 0.386 this study this study
Odobenus rosmarus
Pacific walrus 1 366.5 Y M 76.0 0.147 0.245 0.182 0.369 this study this study
Mirounga angustirostris
Northern elephant seal 1 75 N M 90.0 0.135 0.180 0.100 0.300 (Hamlin et al., 1972) (Hamlin et al., 1972)
Phoca vitulina Harbour seal 56 17.9 N M 157.2 0.071 0.161 0.065 0.255 (Fonfara et al., 2015; Hamlin et al., 1972)
(Cottrell et al., 2002; Hamlin et al., 1972)
Tursiops truncatus
Bottlenose dolphin 41 162.2 N M 81.0 0.092 0.203 0.084 0.290
(Hamlin et al., 1972; Harms et al., 2013;
Kanwisher and Ridgway, 1983)
(Hamlin et al., 1972; Harms et al., 2013;
Kanwisher and Ridgway, 1983)
Eschrichtius robustus Gray whale 1 4363 N M 30.0 NaN 0.475 0.208 0.817 (Ponganis and
Kooyman, 1999) (Ponganis and
Kooyman, 1999)
Balaenoptera physalus Fin whale 1 3.20
E+04 N M 27.0 NaN 0.680 0.320 0.960 (Senft and Kanwisher, 1960)
(Senft and Kanwisher, 1960)
Orcinus orca Killer whale 1 1800 N M NaN 0.120 NaN 0.120 0.340 (Meijler and van der Tweel, 1986)
(Meijler and van der Tweel, 1986)
Delphinus delphis
Common dolphin 1 50 N M 71.0 NaN NaN NaN NaN (Kanwisher and
Ridgway, 1983) (Kanwisher and Ridgway, 1983)

65
Megaptera novaeangliae
Humpback whale 2 3.00
E+04 N M 32.5 NaN 0.400 0.200 NaN (Meijler et al., 1992) (Meijler et al., 1992)
Echidna aculeata
Spiny anteater 2 3.0 N T 59.0 NaN NaN NaN NaN (Grauwiler, 1965) (Augee et al., 1970)
Macropus bennetti
Bennett's kangaroo 7 54.6 N T 120.0 NaN 0.107 0.045 0.142 Sporri, 1956 cited in
(Grauwiler, 1965) T.-B. & Renfree, 1987
cited in (Rose et al., 1997)
Phascolomys latifrons
Hairy-nosed wombat 1 17.5 N T 88.0 0.070 0.210 0.065 0.290 (Grauwiler, 1965) (Grauwiler, 1965)
Hapale bacchus
Common marmoset 1 0.34 N T 230.0 NaN 0.050 0.032 0.165 (Grauwiler, 1965) (Araújo et al., 2000)
Saimiri sciurea
Squirrel monkey NA 0.8 N T 231.0 NaN 0.048 NaN 0.100
Graybiel et al., 1969; Hixson et al., 1960;
both cited in (Grauwiler, 1965)
Stitt and Hardy, 1971 cited in (Heusner,
1991)
Macaca mulatta
Rhesus monkey NA 3.5 N T 259.7 NaN 0.064 0.027 0.148
Atta and Vanace, 1960 cited in
(Grauwiler, 1965) (Crile and Quiring,
1940)
Pan troglodytes Chimpanzee 1 17.5 N T 101.0 NaN 0.098 0.064 0.280
Grauwiler, 1961 cited in (Grauwiler,
1965)
Taylor and Rowntree 1973 cited in (Taylor
et al., 1982)
Gorilla gorilla gorilla
Lowland gorilla 1 13 N T 119.0 NaN 0.110 0.060 0.300
Grauwiler, 1961 cited in (Grauwiler,
1965) (Harcourt et al., 1981)
Choloepus didactulus
Two-toed sloth 1 6.1 N T 63.0 NaN 0.195 0.070 0.420
Grauwiler, 1961 cited in (Grauwiler,
1965) (Adam, 1999)

66
Marmota marmota Marmot 1 3.4 N T 200.0 NaN 0.080 0.060 0.165
Grauwiler, 1961 cited in (Grauwiler,
1965) (Armitage et al.,
1976)
Cavia porcellus Guinea pig 355 0.43 N T 231.4 0.036 0.061 0.023 0.142
Sporri, 1944; Jasinski and Grauwiler, 1960; cited in (Grauwiler,
1965) (Gehr et al., 1981)
Canis aureaus Jackal 1 8.8 N T 128.0 0.040 0.106 0.040 0.180 Siegfried, 1956 cited in (Grauwiler, 1965) (Gittleman, 1985)
Canis familiaris
Domestic dog 686 64.4 N T 103.2 0.050 0.102 0.050 0.192
Corticelli, 1949; Horwitz et al., 1953;
Lannek, 1949; Petersen et al., 1951; Schulze et al., 1957; Soave, 1954; Sporri,
1954; Grauwiler, 1965; all cited in (Grauwiler, 1965)
(Gehr et al., 1981), American Kennel
Club
Nyctereutes procyonides Racoon dog 1 7.5 N T 93.0 NaN 0.082 0.040 0.180 Siegfried, 1956 cited
in (Grauwiler, 1965) (Gittleman, 1985)
Mustela putorius Polecat 1 1.0 N T 300.0 0.040 NaN 0.020 0.090 Siegfried, 1956 cited
in (Grauwiler, 1965) (Gittleman, 1985)
Mustela lutreola
European mink 1 0.59 N T 333.0 NaN NaN 0.020 0.100 Siegfried, 1956 cited
in (Grauwiler, 1965) (Gittleman, 1985)
Herpestes ichneumon
Common mongoose 1 3.0 N T 193.0 0.030 0.080 0.040 0.180
Grauwiler, 1961 cited in (Grauwiler,
1965) (Palomares and Delibes, 1992)

67
Felis catus Domestic cat 57 3.9 N T 158.5 0.034 0.084 0.040 0.183
Rothlin and Suter, 1947; Schinzel,
1933; Sporri, 1954; Grauwiler, 1965; all cited in (Grauwiler,
1965)
(Taylor et al., 1982)
Equus asinus Donkey 2 177.5 N T 60.0 NaN 0.200 0.060 0.430 Luisada et al., 1944 cited in (Grauwiler,
1965)
Yousef and Dill, 1969 cited in (Heusner,
1991)
Tapirus indicus
Malayan tapir 1 160 N T 43.0 0.140 0.316 0.111 0.539
Grauwiler, 1961 cited in (Grauwiler,
1965) (Bonin, 1937)
Rhinoceros unicornis
Indian rhinoceros 2 1600 N T 36.0 0.160 0.400 0.139 0.640
Siegfried, 1956; Grauwiler, 1961;
both cited in (Grauwiler, 1965)
(Laurie, 1982)
Didermoceros sumatraensis
Sumatran rhinoceros 1 698.1 N T 46.0 NaN 0.358 0.102 0.535
Grauwiler, 1961 cited in (Grauwiler,
1965) (Dierenfeld et al.,
2000)
Sus domesticus
Domestic pig 52 42.4 N T 153.1 0.067 0.086 0.048 0.234
Pantridge, 1948; Luisada et al., 1944; Zuckermann, 1959; Sporri, 1954; Miller
et al., 1957; Hausmann, 1934;
Grauwiler, 1965; all cited in (Grauwiler,
1965)
(Crile and Quiring, 1940); Sporri, 1954;
Grauwiler, 1965; both cited in (Grauwiler,
1965)
Phacochoerus aethiopicus Warthog 1 65.3 N T 143.0 0.070 0.140 0.055 0.240 Siegfried, 1956 cited
in (Grauwiler, 1965) (Crile and Quiring,
1940)

68
Choeropsis liberiensis
Pigmy hippopotamus
2 229 N T 53.0 0.093 0.273 0.085 0.481 Siegfried, 1956; Grauwiler, 1961;
both cited in (Grauwiler, 1965)
(Vendl et al., 2016)
Lama glama Llama 1 115 N T 134.0 0.040 0.110 0.040 0.230 Siegfried, 1956 cited in (Grauwiler, 1965)
El-Nouty et al.,1978 cited in (Heusner,
1991)
Camelus bactrianus Camel 2 433.1 N T 55.0 0.150 0.349 0.127 0.572
Grauwiler, 1961 cited in (Grauwiler,
1965) (Tsogttuya et al.,
2009)
Camelus dromedarius Dromedary 1 265 N T 27.0 0.100 0.250 0.090 0.620
Braun et al., 1958 cited in (Grauwiler,
1965)
Schmidt-Nielson et al., 1967) cited in (Heusner, 1991)
Okapia johnstoni Okapi 4 212.5 N T 43.5 NaN 0.325 0.105 0.528
Sporri, unpublished data; Grauwiler,
1961; both cited in (Grauwiler, 1965)
Gijzen, 1959; Grzimek, 1958; both cited in (Bodmer and
Rabb, 1992)
Giraffa camelopardalis
Giraffe 1 383 N T 30.8 0.100 0.305 0.090 0.602 Grauwiler, 1961
cited in (Grauwiler, 1965)
(Gehr et al., 1981)
Bos grunniens Domestic yak 1 15.9 N T 132.0 0.040 0.095 0.040 0.230 Siegfried, 1956 cited
in (Grauwiler, 1965) (Zi et al., 2004)
Delphinapterus leucas
Beluga whale 2 818 N M 30.5 NaN 0.320 0.105 0.380
(Kanwisher and Ridgway, 1983; King
et al., 1953)
(Kanwisher and Ridgway, 1983; King
et al., 1953)
Phocoena phocoena
Harbour porpoise 3 28.7 N M 116.7 0.050 0.120 0.050 0.220 (Kastelein and
Meijler, 1989) (Kastelein and Meijler, 1989)

69
Trichechus manatus Manatee 12 320.1 N M 63.3 0.115 0.240 0.095 0.500 (Siegal-Willott et al.,
2006) (Etheridge et al.,
1985; Quiring and Harlan, 1953)
Zalophus californianus
California sea lion 3 38 N M 108.3 0.093 0.147 0.070 0.273 (Hamlin et al., 1972) (Hamlin et al., 1972)
Elephas maximus
Asiatic elephant 21 3320.
3 N T 40.6 0.160 0.345 0.154 0.613 White et al., 1938; Sporri, unpublished data; both cited in (Grauwiler, 1965)
Benedict (1938) cited in (Heusner, 1991), (Hile et al., 1997)
Loxodonta africana
African elephant 10 6654 N T 41.5 NaN 0.360 0.162 0.640
Siegfried, 1956; Grauwiler, 1961;
both cited in (Grauwiler, 1965)
(Crile and Quiring, 1940)
Martes martes Pine marten 1 0.92 N T 243.0 NaN 0.054 0.040 0.100 Siegfried, 1965 cited in (Grauwiler, 1965)
Iversen, 1972 cited in (Heusner, 1991)
Microtus arvalis
Common vole 11 0.024 N T 633.2 NaN 0.031 0.013 0.044 (Grauwiler, 1965) Jansky, 1959 cited in
(Heusner, 1991)
Mus musculus Mouse 2 0.017 N T 710.0 NaN 0.033 NaN 0.032 (Grauwiler, 1965) Pearson, 1947 cited in (Heusner, 1991)
Tapirus terrestris
American lowland tapir
2 150 N T 58.5 0.085 0.225 0.083 0.412 Siegfried, 1956 cited in (Grauwiler, 1965) (Bodmer, 1990)

70
Appendix E Supporting references for Appendix D
Adam, P.J., 1999. Choloepus didactylus. Mamm. Species 1–8. doi:10.2307/3504332/2600770
Araújo, A., Arruda, M.F., Alencar, A.I., Albuquerque, F., Nascimento, M.C., Yamamoto, M.E.,
2000. Body weight of wild and captive common marmosets (Callithrix jacchus). Int. J.
Primatol. 21, 317–324. doi:10.1023/A:1005433722475
Armitage, K.B., Downhower, J.F., Svendsen, G.E., 1976. Seasonal changes in weights of marmots.
Am. Midl. Nat. 96, 36–51.
Augee, A.M.L., Ealey, E.H.M., Spencer, H., 1970. Biotelemetric studies of temperature regulation
and torpor in the echidna, Tachyglossus aculeatus. J. Mammal. 51, 561–570.
Bodmer, R.E., 1990. Fruit patch size and frugivory in the lowland tapir (Tapirus terrestris). J.
Zool. 222, 121–128. doi:10.1111/j.1469-7998.1990.tb04034.x
Bodmer, R.E., Rabb, G.B., 1992. Okapia johnstoni. Mamm. Species 422, 1–8.
Bonin, G. von, 1937. Brain-weight and body-weight of mammals. J. Gen. Psychol. 16, 379–389.
Brown, J.H., Nicoletto, P.F., 1991. Spatial scaling of species composition: Body masses of North
American land mammals. Am. Soc. Nat. 138, 1478–1512.
Cottrell, P.E., Jeffries, S., Beck, B., Ross, P.S., 2002. Growth and development in free-ranging
harbor seal (Phoca vitulina) pups from southern British Columbia, Canada. Mar. Mammal
Sci. 18, 721–733. doi:10.1111/j.1748-7692.2002.tb01069.x
Crile, G., Quiring, D.P., 1940. A record of the body weight and certain organ and gland weight of
3734 animals. Ohio J. Sci. 40, 219–59.
Dassis, M., Rodríguez, D.H., Rodríguez, E., Ponce De León, A., Castro, E., 2016. The
electrocardiogram of anaesthetized southern sea lion (Otaria flavescens) females. J. Vet.
Cardiol. 18, 71–78. doi:10.1016/j.jvc.2015.09.003
Dierenfeld, E.S., Wildman, R.E.C., Romo, S., 2000. Feed intake, diet utilization, and composition
of browses consumed by the Sumatran rhino (Dicerorhinus sumatrensis) in a North American
zoo. Zoo Biol. 19, 169–180. doi:10.1002/1098-2361(2000)19:3<169::AID-ZOO1>3.0.CO;2-
D
Etheridge, K., Rathbun, G.B., Powell, J.A., Kochman, H.I., 1985. Consumption of aquatic plants
by the West Indian manatee. J. Aquat. Plant Manag. 23, 21–25.

71
Falabella, V., Campagna, C., Lewis, M., Falabella, V., Campagna, C., Lewis, M., 1999.
Electrocardiography of southern elephant seal (Mirounga leonina) weanlings. J. Zoo Wildl.
Med. 30, 526–531.
Fonfara, S., Casamian-Sorrosal, D., Sundermeyer, J., Rosenberger, T., 2015. Variations in heart
rate and rhythm of harbor seal pups during rehabilitation. Mar. Mammal Sci. 31, 998–1013.
doi:10.1111/mms.12201
Gehr, P., Mwangi, D.K., Ammann, A., Maloiy, G.M.O., Taylor, C.R., Weibel, E.R., 1981. Design
of the mammalian respiratory system. V. Scaling morphometric pulmonary diffusing capacity
to body mass: Wild and domestic animals.
Gittleman, J.L., 1985. Carnivore body size: Ecological and taxonomic correlates. Oecologia 67,
540–554. doi:10.1007/BF00790026
Grauwiler, J., 1965. Herz und Kreislauf der Säugetiere. Vergleichend-funktionelle Daten von Jules
Grauwiler, mit einem Geleitwort von Heinrich Spörri. Birkhäuser Verlag, Basel.
Hamlin, R.L., Ridgway, S.H., Gilmartin, W.G., 1972. Electrocardiogram of pinnipeds. Am. J. Vet.
Res. 33, 867–875.
Harcourt, A.H., Fossey, D., Sabater‐Pi, J., 1981. Demography of Gorilla gorilla. J. Zool. 195,
215–233. doi:10.1111/j.1469-7998.1981.tb03460.x
Harms, C.A., Jensen, E.D., Townsend, F.I., Hansen, L.J., Schwacke, L.H., Rowles, T.K., 2013.
Electrocardiograms of bottlenose dolphins (Tursiops truncatus) out of water: habituated
collection versus wild postcapture animals. J. Zoo Wildl. Med. 44, 972–81.
doi:10.1638/2013-0093.1
Heusner, A.A., 1991. Size and power in mammals. J. Exp. Biol. 160, 25–54.
Hile, M.E., Hintz, H.F., Erb, H.N., 1997. Predicting body weight from body measurements in
Asian elephants (Elephas maximus). J. Zoo Wildl. Med. 28, 424–427.
Kanwisher, J.W., Ridgway, S.H., 1983. The physiological ecology of whales and porpoises. Sci.
Am. 248, 110–120. doi:10.1038/scientificamerican0683-110
Kastelein, R.A., Meijler, F.L., 1989. Respiratory arrhythmia in the hearts of Harbour porpoises
(Phocoena phocoena). Aquat. Mamm. 15.2, 57–63.
King, R.L., Jenks, J.L., White, P.D., 1953. The electrocardiogram of a beluga whale. Circulation

72
8, 387–393. doi:10.1161/01.CIR.8.3.387
Laurie, A., 1982. Behavioural ecology of the Greater one‐horned rhinoceros (Rhinoceros unicornis). J. Zool. 196, 307–341. doi:10.1111/j.1469-7998.1982.tb03506.x
Meijler, F.L., van der Tweel, L.H., 1986. De elektrocardiogrammen van 10 olifanten en van de
orka in Harderwijk. Ned Tijdschr Geneeskd 130, 2344–2348.
Meijler, F.L., Wittkampf, F.H.M., Brennen, K.R., Baker, V., Wassenaar, C., Bakken, E.E., 1992.
Electrocardiogram of the humpback whale (Megaptera novaeangliae) with specific reference
to atrioventricular transmission and ventricular excitation. J. Am. Coll. Cardiol. 20, 475–479.
doi:10.1016/0735-1097(92)90120-C
Palomares, F., Delibes, M., 1992. Some physical and population characteristics of Egyptian
mongooses (Herpestes ichneumon L., 1758) in southwestern Spain. Z. Saugetierkd. 57, 94–
99.
Ponganis, P.J., Kooyman, G.L., 1999. Heart rate and electrocardiogram characteristics of a young
California gray whale (Eschrichtius robustus). Mar. Mammal Sci. 15, 1198–1207.
Quiring, A.D.P., Harlan, C.F., 1953. On the anatomy of the manatee. J. Mammal. 34, 192–203.
Rose, R.W., Nevison, C.M., Dixson, A.F., 1997. Testes weight, body weight and mating systems
in marsupials and monotremes. J. Zool. 243, 523–531. doi:10.1111/j.1469-
7998.1997.tb02798.x
Senft, A.W., Kanwisher, J.K., 1960. Cardiographic observations on a fin-back whale. Circ. Res.
8, 961–964. doi:10.1161/01.RES.8.5.961
Siegal-Willott, J., Estrada, A., Bonde, R., Wong, A., Estrada, D.J., Harr, K., 2006.
Electrocardiography in two subspecies of manatee (Trichechus manatus latirostris and T. m. manatus). J. Zoo Wildl. Med. 37, 447–453.
Taylor, C.R., Heglund, N.C., Maloiy, G.M.D., 1982. Energetics and mechanics of terrestrial
locomotion. I. Metabolic energy consumption as a function of speed and size in birds and
mammals. J. Exp. Biol. 97, 1–21.
Tokura, H., Hara, F., Okada, M., Mekata, F., Ohsawa, W., 1975. A comparison of
thermoregulatory responses in the Japanese macaque (Macca fuscata) and the crab-eating
macaque (Macaca irus) during cold exposure. Jpn. J. Physiol. 25, 147–152.

73
Tsogttuya, C., Luvsan, B., Erdenebileg, U., 2009. Review of Mongol camel studies. Dalanzadgad.
Van Citters, R.L., Franklin, D.L., Smith, O.A., Watson, N.W., Elsner, R.W., 1965. Cardiovascular
adaptations to diving in the northern elephant seal Mirounga angustirostris. Comp. Biochem.
Physiol. 16, 267–276. doi:10.1016/0010-406X(65)90324-5
Vendl, C., Frei, S., Dittmann, M.T., Furrer, S., Ortmann, S., Lawrenz, A., Lange, B., Munn, A.,
Kreuzer, M., Clauss, M., 2016. Methane production by two non-ruminant foregut-fermenting
herbivores: The collared peccary (Pecari tajacu) and the pygmy hippopotamus
(Hexaprotodon liberiensis). Comp. Biochem. Physiol. -Part A Mol. Integr. Physiol. 191,
107–114. doi:10.1016/j.cbpa.2015.09.021
Zi, X.D., Zhong, G.H., Wen, Y.L., Zhong, J.C., Liu, C.L., Ni, Y.A., Yezi, Y.H., Ashi, M.G., 2004.
Growth performance, carcass composition and meat quality of Jiulong-yak (Bos grunniens).
Asian-Australian J. Anim. Sci. 17, 410–414.