ev 7 - · pdf fileyourself why eviews is a worldwide leader in statistical, econometric, and...
TRANSCRIPT
A Modern User InterfAce
EViews brings modern windowing and object-based techniques to statistical, econometric, and simulation software.
At the heart of the innovative EViews interface is the concept of an object. Series, equations, and systems are just a few examples of objects. Each object has its own window, menus, procedures, and views of its data. Most statistical procedures are simply alternate views of the object.
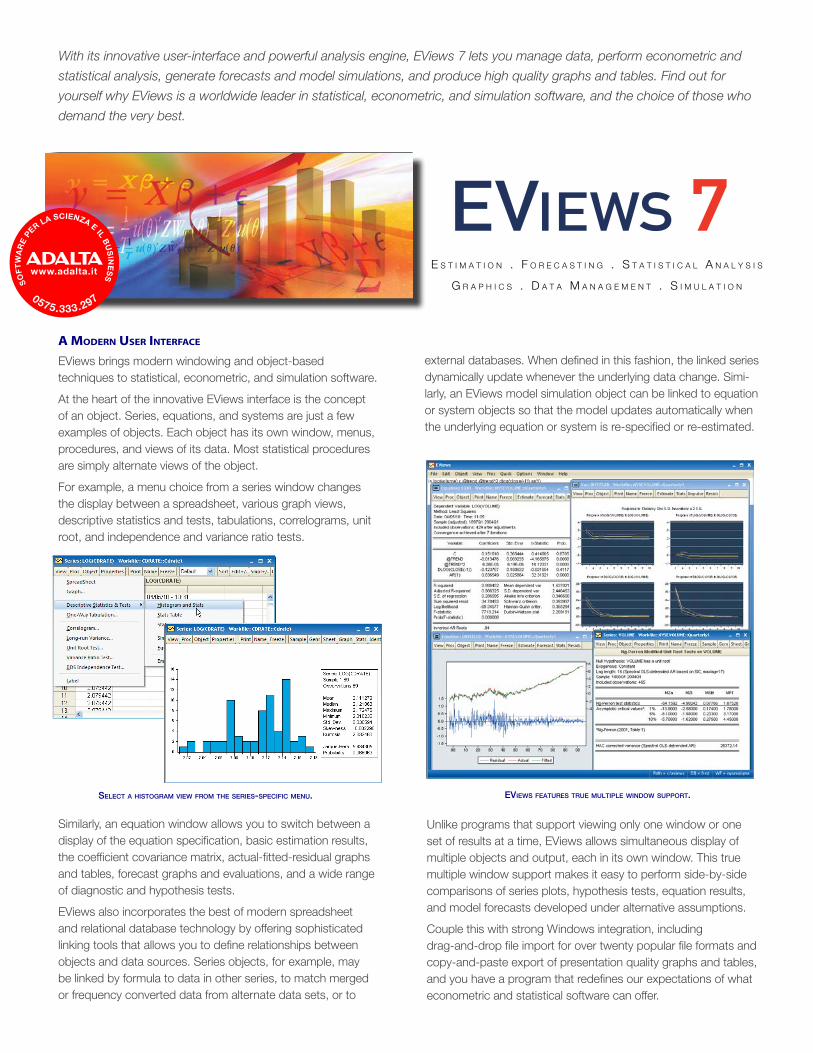
For example, a menu choice from a series window changes the display between a spreadsheet, various graph views, descriptive statistics and tests, tabulations, correlograms, unit root, and independence and variance ratio tests.
Similarly, an equation window allows you to switch between a display of the equation specification, basic estimation results, the coefficient covariance matrix, actual-fitted-residual graphs and tables, forecast graphs and evaluations, and a wide range of diagnostic and hypothesis tests.
EViews also incorporates the best of modern spreadsheet and relational database technology by offering sophisticated linking tools that allows you to define relationships between objects and data sources. Series objects, for example, may be linked by formula to data in other series, to match merged or frequency converted data from alternate data sets, or to
external databases. When defined in this fashion, the linked series dynamically update whenever the underlying data change. Simi-larly, an EViews model simulation object can be linked to equation or system objects so that the model updates automatically when the underlying equation or system is re-specified or re-estimated.
Unlike programs that support viewing only one window or one set of results at a time, EViews allows simultaneous display of multiple objects and output, each in its own window. This true multiple window support makes it easy to perform side-by-side comparisons of series plots, hypothesis tests, equation results, and model forecasts developed under alternative assumptions.
Couple this with strong Windows integration, including drag-and-drop file import for over twenty popular file formats and copy-and-paste export of presentation quality graphs and tables, and you have a program that redefines our expectations of what econometric and statistical software can offer.
EViEws fEaturEs truE multiplE window support.
With its innovative user-interface and powerful analysis engine, EViews 7 lets you manage data, perform econometric and
statistical analysis, generate forecasts and model simulations, and produce high quality graphs and tables. Find out for
yourself why EViews is a worldwide leader in statistical, econometric, and simulation software, and the choice of those who
demand the very best.
sElEct a histogram ViEw from thE sEriEs-spEcific mEnu.
EVIEWS 7E s t i m a t i o n . F o r E c a s t i n g . s t a t i s t i c a l a n a l y s i s
g r a p h i c s . D a t a m a n a g E m E n t . s i m u l a t i o n

PowerfUl AnAlytIc tools
A modern, easy-to-use interface is nothing without state-of-the-art analytic tools. With a feature set extending well beyond its roots in time-series analysis, EViews 7 offers the tools most frequently used in practical settings.
stAtIstIcAl AnAlysIs
EViews supports a wide range of basic statistical analyses, ranging from simple descriptive statistics to nonparametric hypothesis tests. Explore the time series properties of your data with autocorrelation plots or unit root and cointegration tests. Support for longitudinal data ranges from by-group and by-period statistics to panel unit root and cointegration diagnostics.
You can visualize the distribution of your data using various types of histograms, theoretical distribution, kernel density, or cumulative distribution, survivor, quantile, and QQ (quantile-quantile) plots. EViews also produces scatter plots with confidence ellipses or curves fit using ordinary, transfor-mation, kernel, nearest neighbor regression.
You can even use EViews to construct graphs of raw or summary data for subsets
of the data that are defined using the values of categorical variables. You may, for example, readily display a bar plot of the mean incomes of individuals living in each state, or histograms of net returns by asset class, or kernel density plots of wages for union and non-union workers in different industries.
estIMAtIon
When you’re ready to perform estima-tion, choose from an extensive set of single equation estimators, including ordinary and nonlinear least squares (multiple regression), weighted least squares, two-stage least squares, Gen-eralized Method of Moments (GMM), quantile regression, and Generalized Linear Models (GLM). For time series analysis, EViews estimates ARMA, ARMAX, and a variety of ARCH and cointegrating equation specifications. Estimation of limited dependent variable models for binary, ordered, censored (Tobit), truncated, and count data is sup-ported. Longitudinal data are handled by a family of pooled time-series and panel estimators that includes modern Dynam-ic Panel Data (DPD) techniques.
EViews offers powerful tools for analyzing systems of equations. You can use EViews to estimate linear and nonlinear systems by least squares, two-stage least squares, seemingly unrelated regression, three-stage least squares, GMM, and FIML. Additional support is provided for VAR and VEC, multivariate ARCH, and state space estimation (Kalman filtering).
For custom analysis, EViews’ easy-to-use likelihood object permits estimation of user-specified maximum likelihood models. Simply provide EViews expressions to describe the log likelihood contributions, set coefficient starting values, and EViews will do the rest.
Once you estimate your equation or system, EViews makes it easy to perform specifica-tion and diagnostic tests. You can evaluate coefficient restrictions, compute residual and influence diagnostics, examine your specification for stability, and conduct a variety of estimator specific specification tests. If your favorite test is not supported directly, fast access to coefficients, residuals, gradients, and other estimation results makes it easy to construct your own diagnostics.
ExplorE thE timE sEriEs propErtiEs of your data.
work with an ExtEnsiVE sEt of Easy-to-usE EconomEtric Estimation tools.pErform a widE rangE of basic statistical analysEs.

EViEws 7 Features ListdAtA HAndlIng
BAsIc
• Numeric,alphanumeric(string),anddateseries;valuelabels.
• Powerfullanguageforexpressionhandlingandtransformingdatausingoperatorsandstatistical,mathematical,financial,dateandstringfunctions,classification,orresampling.
• Samplesandsampleobjectsallowfortransparentsubsettingofdata.
• Supportforcomplexdatastructuresincludingregulardateddata,irregulardateddata,high-frequency(intraday)data,cross-sectiondatawithobservationidentifiers,balancedandunbalancedpaneldata.
• Multi-pageworkfileswithsupportfordynamicfrequencyconversionandmatchmergingofdatabetweenworkfilepages.
• Auto-updatingformulaseriesareautomaticallyrecalculatedwheneverunderlyingdatachange.
• Matchmerge,join,append,subset,resize,sort,andreshape(stackandunstack)workfiles;createnewworkfilepagesfromvaluesanddatesinexistingseries.
• Drag-and-dropsupportforreadingandimportingdata;simplydropfilesintoEViewsforautomaticconversionormergingofforeigndataintoEViewsworkfileformat.Easy-to-usetoolsforsubsettingdataoninput.
• ConvertdatabetweenEViewsandvariousspreadsheet,statistical,anddatabaseformats,including:MicrosoftAccess®andExcel®files,GaussDatasetfiles,SAS®Transportfiles,SPSSnativeandportablefiles,Statafiles,rawformattedASCIItextorbinaryfiles,HTML,orODBCdatabasesandqueries(ODBCsupportisprovidedonlyintheEnterpriseEdition).
• EViewsnative,disk-baseddatabasesprovidepowerfulqueryfeaturesandintegrationwithEViewsworkfiles.OLEDBsupportforreadingEViewsworkfilesanddatabasesusingOLEDB-awareclientsorcustomprograms.
• SupportforFRED®databases.EnterpriseEditionsupportforGlobalInsightDRIProandDRIBase,HaverAnalytics®DLX®,FAME,EcoWin,Datastream,FactSet,andMoody’sEconomy.comdatabases.
tIMe serIes
• Fullyintegratedsupportforhandlingdatesandtimeseriesdatawithspecializedtimeseriesfunctionsandoperators:lags,differences,log-differences,movingaverages,etc.
• Frequencyconversion(varioushigh-to-lowandlow-to-high)andinterpolation(linear,log-linear,Cagmul-Romspline,Cardinalspline).
• Exponentialsmoothing:single,double,Holt-Winters.
• Hodrick-Prescottfiltering.Band-pass(frequency)filtering:Baxter-King,Christiano-Fitzgeraldfixedlengthandfullsampleasymmetricfilters.
• Seasonaladjustment:X11,X12-ARIMA,Tramo/Seats,movingaverage.
stAtIstIcs
BAsIc
• Basicdatasummaries;by-groupsummaries.
• Testsofequality:t-tests,ANOVA(balancedandunbalanced),Welch/SatterthwaiteANOVA,Wilcoxon,Mann-Whitney,MedianChi-square,Kruskal-Wallis,vanderWaerden,F-test,Siegel-Tukey,Bartlett,Levene,Brown-Forsythe.
• One-waytabulation;cross-tabulationwithmeasuresofassociation(PhiCoefficient,Cramer’sV,ContingencyCoefficient)andindependencetesting(PearsonChi-Square,LikelihoodRatioG^2).
• CovarianceandcorrelationanalysisincludingPearson,Spearmanrank-order,Kendall’stau-aandtau-bandpartialanalysis;pairwisetestsofzerocorrelation,multiplecomparisonadjustments.
• Principalcomponentsanalysisincludingscreeplots,biplotsandloadingplots,andweightedcomponentscorecalculations.
• Factoranalysis:toolsforspecifyingthenumberoffactors,sixestimationmethods(includingMLandPACE),over30orthogonalandobliquerotationmethods,morethanadozenfactorscorecomputationmethods.
• EmpiricalDistributionFunction(EDF)Testsforvariousdistributions:Kolmogorov-Smirnov,Lilliefors,Cramer-vonMises,Anderson-Darling,andWatson.
tIMe serIes • Autocorrelation,partialautocorrelation,cross-correlationanalysis,
Q-statistics.Independencetesting(Brock,Dechert,ScheinkmanandLeBaron)andVarianceratiotesting,Grangercausalitytests.
• Standalonelong-runcovariancecalculation.HACoptionsincludingVARHAC,kernel,andprewhitenedkernel,withfixed,Andrews,orNewey-Westbandwithselection.
• Unitroottests:AugmentedDickey-Fuller,GLStransformedDickey-Fuller,Phillips-Perron,KPSS,Eliot-Richardson-StockPointOptimal,Ng-Perron.Panelunitroottests:Levin-Lin-Chu,Breitung,Im-Pesaran-Shin,Fisher-typetestsusingADFandPPtests(Maddala-Wu,Choi),Hadri.
• Johansen,Engle-Granger,Phillips-Ouliaris,Hansen,andParkcointe-grationtests.Panelcointegrationtests:Pedroni,Kao,MaddalaandWu.
estIMAtIon
regressIon
• Linearandnonlinearordinaryleastsquares(multipleregression).Weightedleastsquares,Stepwiseregression,GeneralizedLinearModels.
• LinearregressionwithPDLsonanynumberofindependentvariables.
• WhiteandHACrobuststandarderrorswithHACoptionsincludingVARHAC,kernel,andprewhitenedkernel,withfixed,Andrews,orNewey-Westbandwithselectionmethods.
• Linearquantileregressionandleastabsolutedeviations(LAD)estimationwithi.i.d.,Huber’sSandwich,orbootstrapstandarderrors.
• Analyticderivativesfornonlinearestimation.
InstrUMentAl VArIABles And gMM• Linearandnonlineartwo-stageleastsquares/instrumentalvariables
(2SLS/IV)andGeneralizedMethodofMoments(GMM)estimation.
• White,HAC,anduser-specifiedGMMweighting.Continuouslyupdatedestimation.
ArMA And ArMAX• Linearmodelswithautoregressivemovingaverage,seasonal
autoregressive,andseasonalmovingaverageerrors.
• NonlinearmodelswithARandSARspecifications.
• EstimationusingthebackcastingmethodofBoxandJenkinsorbyconditionalleastsquares.
ArcH/gArcH• GARCH(p,q),EGARCH,TARCH,ComponentGARCH,PowerARCH,
integratedARCHassumingNormal,Student’st,andGeneralizedErrorDistributions.
• ThelinearornonlinearmeanequationmayincludeARCHandARMAterms;boththemeanandvarianceequationsallowforexogenousvariables.
• Bollerslev-Wooldridgerobuststandarderrors.
• In-andout-of-sampleforecastsoftheconditionalvarianceandmean,andthepermanentcomponents.
lIMIted dePendent VArIABle Models
• BinaryandOrderedLogit,Probit,andGompit.Hosmer-LemeshowandAndrewsGoodness-of-Fittestingforbinarymodels.
• Censoredandtruncatedmodelswithnormal,logistic,andextremevalueerrors(Tobit,etc.).
• CountmodelswithPoisson,negativebinomial,andquasi-maximumlikelihood(QML)specifications.
• Nonlinearand/orcoefficientrestrictedindexspecifications.
• Huber/Whiterobuststandarderrors.CountmodelsalsosupportgeneralizedlinearmodelorQMLstandarderrors.
PAnel dAtA/Pooled tIMe serIes, cross-sectIonAl dAtA
• Linearandnonlinearleastsquaresor2SLS/IVestimationwithadditivecross-sectionandperiodfixedorrandomeffects.
• Generalizedleastsquares,generalized2SLS/IVestimation,GMMestimationallowingforcross-sectionorperiodheteroskedasticandcorrelatedspecifications.

• Choiceofquadraticunbiasedestimators(QUEs)forcomponentvariancesinrandomeffectsmodels:Swamy-Arora,Wallace-Hussain,Wansbeek-Kapteyn.
• Lineardynamicpaneldataestimationusingfirstdifferencesororthogonaldeviations,withperiod-specificpredeterminedinstruments(Arellano-Bond).
• RobuststandarderrorcalculationsincludeseventypesofrobustArellano,White,andPanel-correctedstandarderrors(PCSE).
User-sPecIfIed MAXIMUM lIkelIHood
• UsestandardEViewsseriesexpressionstodescribetheloglikelihoodcontributions.
• Examplesformultinomiallogit,conditionallogit,Box-Coxtransformationmodels,disequilibriumswitchingmodels,probitmodelswithheteroskedasticerrors,nestedlogit,Heckmansampleselectionmodels,Weibullhazardmodels.
systeMs of eqUAtIons
• Linearandnonlinearestimationbyleastsquares,2SLS,equationweighted(GLS)estimation,SeeminglyUnrelatedRegression,Three-StageLeastSquares,FullInformationMaximumLikelihood(FIML),GMM(withWhiteorHACweightingmatrices).
• ARestimationusingnonlinearleastsquaresonatransformedspecification.
• MultivariateARCH:ConditionalConstantCorrelation(p,q),DiagonalVECH(p,q),andDiagonalBEKK(p,q)modelswithasymmetricterms,normalorStudent’stmultivariateerrors.
VAr/Vec• Impulseresponsefunctionsinvarioustabularandgraphicalformats
withstandarderrorscalculatedanalyticallyorbyMonteCarlomethods.ShockscomputedfromCholeskyfactorization,one-unitorone-standarddeviationresiduals,generalizedimpulses,structuralfactorization,user-specifiedvector/matrix.
• EstimatestructuralfactorizationsinVARsbyimposingshort-orlong-runrestrictions.Imposeandtestlinearrestrictionsonthecointegratingrelationsand/oradjustmentcoefficientsinVECmodels.
• Extensivediagnosticsincluding:Grangercausalitytests,jointlagexclusiontests,laglengthcriteriaevaluation,correlograms,autocorrelationnormalityandheteroskedasticitytesting,cointegrationtesting,othermultivariatediagnostics.
stAte sPAce
• Kalmanfilteralgorithmforestimatinguser-specifiedsingle-andmulti-equationstructuralmodels.Modelsallowforexogenousvariablesinthestateequationandfullyparameterizedvariancespecifications.
• Generateone-stepahead,filtered,orsmoothedsignals,states,anderrors.Forecastingusingn-steporsmoothedvalues.
testIng And eVAlUAtIon
• Actual,fitted,residualplots.
•Coefficientdisplaysincludingstandardizedcoefficientsandelasticities.Varianceinflationfactors,influencediagnostics,leverageplots.
• Waldtestsforlinearandnonlinearcoefficientrestrictions;confidenceel-lipsesshowingtheconfidenceregionoffunctionsofestimatedparameters.
• OmittedandredundantvariablesLRtests,residualandsquaredresidualcorrelogramsandQ-statistics,residualserialcorrelationtests.
• Breusch-Pagan,Godfrey,HarveyandGleijser,White,andARCHheteroskedasticitytests.
• Chowbreakpointandforecasttests,Quandt-Andrewsunknownbreakpointtest,RamseyRESETtests,OLSrecursiveestimation.
• ARMAequationdiagnostics:graphsortablesoftheinverserootsoftheARMAcharacteristicpolynomial,comparetheoretical(estimated)autocorrelationpatternwithactualcorrelationpatternforstructuralresiduals,displayARMAimpulseresponsetoaninnovationshock.
• Easilysaveresults(coefficients,coefficientcovariancematrices,residuals,gradients,etc.)forfurtheranalysis.
forecAstIng And sIMUlAtIon
• In-orout-of-samplestaticordynamicforecastingfromestimatedequationobjects(withcalculationofthestandarderroroftheforecast).
• Forecastgraphsandin-sampleforecastevaluation:RMSE,MAE,MAPE,TheilInequalityCoefficientandproportions.
• State-of-the-artmodelbuildingtoolsformultipleequationforecastingandmultivariatesimulation.
• Modelequationsmaybeenteredintextoraslinksforautomaticupdatingonre-estimation.
• Displaydependencystructureorendogenousandexogenousvariablesofyourequations.
• Gauss-Seidel,Newton,andBroydenmodelsolversfornon-stochasticandstochasticsimulation.Non-stochasticforwardsolutionsolveformodelconsistentexpectations.
• Solvecontrolproblemssothatendogenousvariableachievesauser-specifiedtarget.
• Sophisticatedequationnormalization,addfactorandoverridesupport.
• Manageandcomparemultiplesolutionscenariosinvolvingvarioussetsofassumptions.
• Built-inmodelviewsandproceduresdisplaysimulationresultsingraphicalortabularform.
grAPHs And tABles
• Line,dotplot,area,bar,spike,seasonal,pie,xy-line,scatterplots,boxplots,errorbar,high-low-open-close,andareaband.
• Powerful,easy-to-usecategoricalandsummarygraphs.Categoriesandsummariesmaybecombinedinasinglegraphordisplayedinmultiplepanels.Sophisticatedtoolsallowyoutocustomizegraphtitlesandcategorylabelsforpresentation.
• Histograms,averageshiftedhistograms,frequencypolygons,edgefrequencypolygons,kerneldensity,fittedtheoreticaldistributions,boxplots,CDF,survivor,quantile,quantile-quantile.
• Scatterplotswithanycombinationparametricandnonparametrickernel(Nadaraya-Watson,locallinear,localpolynomial)andnearestneighbor(LOWESS)regressionlines,orconfidenceellipses.
• Interactivepoint-and-clickorcommand-basedcustomization.
• Extensivecustomizationofgraphdimensions,legends,axes,scaling,lines,symbols,text,shading,withgraphtemplatefeatures.
• Tablecustomizationwithcontrolovercellfontface,size,andcolor,cellbackgroundcolorandborders,merging,andannotation.
• Copy-and-pastegraphsintootherWindowsapplications,orsaveasWindowsmetafiles,PostScript®files,GIF,JPEG,PNG,orbitmapfiles.
• Copy-and-pastetablestoanotherapplicationorsaveittoaRTF,HTML,ortextfile.
• Managegraphsandtablesinaspoolobjectthatletsyouorganizeanddisplaymultipleresultsandanalysis.
coMMAnds And ProgrAMMIng
• Object-orientedcommandlanguageprovidesaccesstomenuitems.
• Batchexecutionofcommandsinprogramfiles.
• Loopingandconditionbranching,subroutine,andmacroprocessing.
• Extensivematrixsupport:matrixmanipulation,multiplication,inversion,Kroneckerproducts,eigenanalysis,andsingularvaluedecomposition.
eXternAl InterfAce And Add-Ins sUPPort
• COMserverandclientsupport.DevelopyourownprogramsorscriptsthatlaunchorcontrolEViews,transferdata,andexecuteEViewscommands.UseCOMclientsupporttocontrolMATLAB®andRservers.
• Easy-to-useOLEDB/MicrosoftExcel®accesstoEViewsdata.
• TheEViewsAdd-insinfrastructureoffersseamlessaccesstouser-definedprogramsusingthestandardEViewscommand,menu,andobjectinterface.
• DownloadandinstallpredefinedAdd-insfromtheEViewswebsite.
forecAstIng And sIMUlAtIon
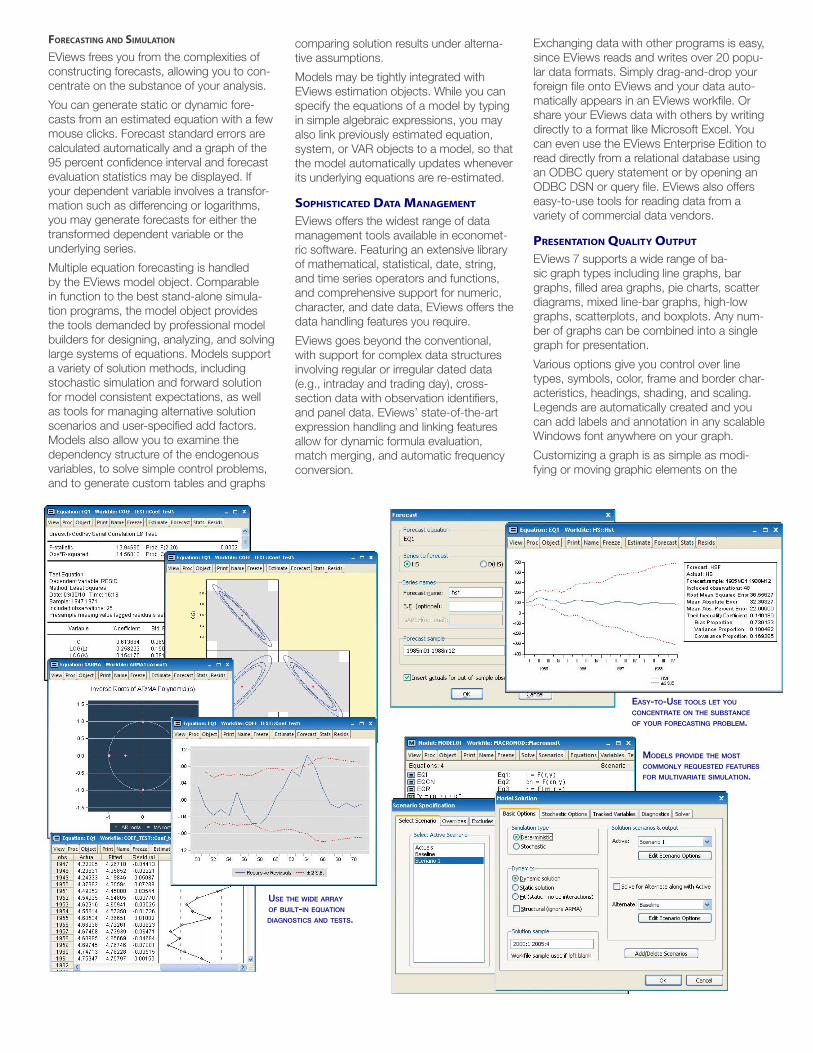
EViews frees you from the complexities of constructing forecasts, allowing you to con-centrate on the substance of your analysis.
You can generate static or dynamic fore-casts from an estimated equation with a few mouse clicks. Forecast standard errors are calculated automatically and a graph of the 95 percent confidence interval and forecast evaluation statistics may be displayed. If your dependent variable involves a transfor-mation such as differencing or logarithms, you may generate forecasts for either the transformed dependent variable or the underlying series.
Multiple equation forecasting is handled by the EViews model object. Comparable in function to the best stand-alone simula-tion programs, the model object provides the tools demanded by professional model builders for designing, analyzing, and solving large systems of equations. Models support a variety of solution methods, including stochastic simulation and forward solution for model consistent expectations, as well as tools for managing alternative solution scenarios and user-specified add factors. Models also allow you to examine the dependency structure of the endogenous variables, to solve simple control problems, and to generate custom tables and graphs
comparing solution results under alterna-tive assumptions.
Models may be tightly integrated with EViews estimation objects. While you can specify the equations of a model by typing in simple algebraic expressions, you may also link previously estimated equation, system, or VAR objects to a model, so that the model automatically updates whenever its underlying equations are re-estimated.
soPHIstIcAted dAtA MAnAgeMent
EViews offers the widest range of data management tools available in economet-ric software. Featuring an extensive library of mathematical, statistical, date, string, and time series operators and functions, and comprehensive support for numeric, character, and date data, EViews offers the data handling features you require.
EViews goes beyond the conventional, with support for complex data structures involving regular or irregular dated data (e.g., intraday and trading day), cross-section data with observation identifiers, and panel data. EViews’ state-of-the-art expression handling and linking features allow for dynamic formula evaluation, match merging, and automatic frequency conversion.
Exchanging data with other programs is easy, since EViews reads and writes over 20 popu-lar data formats. Simply drag-and-drop your foreign file onto EViews and your data auto-matically appears in an EViews workfile. Or share your EViews data with others by writing directly to a format like Microsoft Excel. You can even use the EViews Enterprise Edition to read directly from a relational database using an ODBC query statement or by opening an ODBC DSN or query file. EViews also offers easy-to-use tools for reading data from a variety of commercial data vendors.
PresentAtIon qUAlIty oUtPUt
EViews 7 supports a wide range of ba-sic graph types including line graphs, bar graphs, filled area graphs, pie charts, scatter diagrams, mixed line-bar graphs, high-low graphs, scatterplots, and boxplots. Any num-ber of graphs can be combined into a single graph for presentation.
Various options give you control over line types, symbols, color, frame and border char-acteristics, headings, shading, and scaling. Legends are automatically created and you can add labels and annotation in any scalable Windows font anywhere on your graph.
Customizing a graph is as simple as modi-fying or moving graphic elements on the
usE thE widE array of built-in Equation diagnostics and tEsts.
Easy-to-usE tools lEt you concEntratE on thE substancE of your forEcasting problEm.
modEls proVidE thE most commonly rEquEstEd fEaturEs for multiVariatE simulation.

4521 Campus Drive, #336, Irvine, CA 92612-2621
(tel) 949-856-3368, (fax) 949-856-2044, (email) [email protected], (web) www.eviews.com
screen. Want to change the font or other characteristics of a legend or a text label? Just click on a graph element and use the easy-to-understand dialog. Aspect ratios, line and symbol characteristics, axes scaling and labeling are all right at your fingertips. You can even use a customized graph tem-plate to modify all graph settings.
You can quickly export customized graphs to other applications using copy-and-paste or by writing to a graphics format file.
Extensive table customization tools allow you to produce presentation quality tables. An easy-to-use, interactive interface gives you control over cell font face, size, and color, cell background color and borders, merging, and annotation.
When completed, you can copy-and-paste your customized table to another application or save it as an RTF, HTML, or text file.
trAdItIonAl coMMAnd lIne And ProgrAMMIng InterfAce
Point-and-click is great, but what if you feel more comfortable entering commands? And what if you need programming capabilities? Not to worry, as EViews provides a powerful command language that offers access to all menu items.
Modeled loosely after the BASIC program-ming language but with object-oriented
extensions and matrix handling capabilities, EViews allows you to enter individual com-mands for immediate or batch execution. Your programs can make use of advanced capabilities such as looping and condition branching, as well as subroutine and macro processing.
Matrix primitives, from simple multiplication and inversion, to more advanced proce-dures for Kronecker products, eigenvector solution, and singular value decomposition, offer the tools you need for solving complex problems.
eXternAl InterfAce And Add-Ins sUPPort EViews 7 features Component Object Model (COM) server and client support as well as OLEDB/Microsoft Excel® access to EViews data. Develop your own programs or scripts that launch or control EViews, transfer data, and execute EViews commands, or use COM client support to control MATLAB® and R servers. The EViews OLEDB driver and easy-to-use Microsoft Excel® Add-in allow you to retrieve or link to EViews workfile or database data from other applications.
The new EViews Add-ins infrastructure provides seamless access to user-defined programs using the standard EViews com-mand, menu, and object interface. You can develop Add-ins to add features of power
and sophistication that are virtually indistinguishable from built-in features. Or download and install any of the Add-ins currently available on the EViews website, (with the promise of more to come).
eXtensIVe docUMentAtIon
The four volumes of printed documentation contain over 2,800 pages describing EViews 7, with examples and discussion. Want electronic help? EViews provides a com-piled HTML-based help system that mirrors the printed manuals with index and search capabilities. In addition, all four manuals are provided as hypertext-linked PDF files.
dAtA cAPAcIty And systeM reqUIreMents
EViews 7 is compatible with most versions of the Windows Operating system including Windows 7, Vista, and XP. With sufficient memory in your computer, you can tackle problems involving millions of observations or thousands of series. The one restriction is that no single data series may contain more than 15 million observations.
And because we take full advantage of 32-bit Windows’ virtual memory, you can work with data sets that exceed your system’s physical memory (subject to operating system restrictions on the total amount of memory, up to 3GB with Windows 7, Vista, and XP).
1702
-Evi
ews-
RM
810
gEnEratE and customizE graphs for inclusion in othEr applications.
you can rEad and writE oVEr 20 data formats.
EViEws offErs a powErful command languagE and programming support.