eutrophication in the baltic sea - s...
TRANSCRIPT

Eutrophication in the Baltic Sea
from area-specific biological effects to interdisciplinary consequences
Cecilia Lundberg
Environmental and Marine Biology, Department of Biology Åbo Akademi University
Åbo, Finland
2005
Supervised by Prof Erik Bonsdorff Environmental and Marine Biology, Department of Biology Åbo Akademi University Akademigatan 1 FI-20500 Åbo Finland Reviewed by PhD Sif Johansson Swedish Environment Protection Agency SE-106 48 Stockholm Sweden Prof Daniel Conley Danish National Environmetal Research Institute (NERI) Box 358 DK- 4000 Roskilde Denmark Faculty opponent Prof Michael Elliott Department of Biological Sciences University of Hull Hull, HU6 7RX United Kingdom
© Cecilia Lundberg ISBN: 952-12-1537-2
Åbo Akademis tryckeri
Åbo 2005

Eutrophication in the Baltic Sea - from area-specific biological effects to interdisciplinary consequences Cecilia Lundberg Environmental and Marine Biology, Department of Biology, Åbo Akademi University, FI-20500 Åbo, Finland Abstract The semi-enclosed topography and the strong anthropogenic pressures make the Baltic Sea vulnerable to environmentally induced ecological changes. The large-scale nutrient over-enrichment is one of the most serious threats against the health and future perspectives of the Baltic Sea ecosystem. To combat the eutrophication in a complex marine ecosystem, an interdisciplinary agenda is needed. Co-operation must function between the fields of natural science and socio-economy, and between science and management. For a complete understanding of the eutrophication process and possibilities for remedies, the linkages between ecology and economy is essential. Gaps in communication between science and decision-makers are other obstacles to overcome. The DPSIR-approach (drivers, pressure, state, impact, response) is one way to conceptualize environmental changes and present information in a comprehensive way for society. For a comprehensive analysis of the eutrophication-related processes in the Baltic Sea, the problem is here confronted both in general terms on a basinwide scale and in detail on regional scales. The complexness of eutrophication is illustrated in a general conceptual model, where the pathways from natural science to human society and management options are presented. The model is intended as an interdisciplinary communication base. To pin-point regional differences, the Baltic Sea is divided into nine sub-regions for area-specific analyses. Based on publicly available papers and reports, the effects and duration of the nutrient over-enrichment are described for each sub-region. The present state of any particular area is summarised in regional conceptual models, which are updated to cover the present situation (2004). For further detection of eutrophication-related trends on a site-specific level, monitoring programmes are important sources of information. Eutrophication is a problem in the entire Baltic Sea area, but the effects and consequences varies between sub-basins. Positive measurements and potential recovery require action both on basinwide and regional scales. To widen the awareness between scientific disciplines and to present the problem to society, principal and site-specific conceptual models are important starting points. Keywords: eutrophication, area-specific changes, conceptual models, interdisciplinary, DPSIR, Baltic Sea.

Övergödningen i Östersjön - småskaliga biologiska effekter ger tvärvetenskapliga följder Svensk sammanfattning – Summary in Swedish Östersjön är ett litet, grunt och instängt havsområde med ett begränsat vattenutbyte till Nordsjön. Skarpa skillnader i salthalt och klimat skiljer de södra och norra delarna från varandra. Ett invånarantal på 85 miljoner i hela avrinningsområdet gör belastningstrycket betydande. Dessa faktorer inverkar väsentligt på Östersjöns känslighet för miljöförändringar, speciellt sådana orsakade av människan. Eutrofiering innebär en ökad tillgänglighet av fosfor och kväve i vattnet. Näringsämnena härstammar från luftburet kväve, avrinning från jord- och skogsbruksmark samt orenat eller otillräckligt renat avloppsvatten från hushåll och industrier. Överskottsnäringen gynnar snabb-växande vegetation, som på sikt konkurrerar ut långsamt växande fleråriga arter med nyckel-funktioner för hela ekosystemet. Ute på öppet vatten leder övergödningen till massföre-komster av cyanobakterier (blågröna alger) under varma och vindstilla perioder av sommaren. Nedbrytningen av alla eutrofieringsgynnade arter är syrekrävande.Vid syrebrist produceras svavelväte, och stora bottenarealer förvandlas till undervattensöknar för kortare eller längre perioder då allt djurliv slås ut. I det sammansatta marina ekosystemet påverkas samtliga arter, biodiversiteten minskar då känsliga växter och djur minskar i antal eller försvinner helt. Eutrofiering är därtill inte Östersjöns enda problem, utan måste ställas i relation till andra gissel såsom miljögifter, överfiskning och etableringen av främmande arter. Åtgärder för en förbättring av Östersjöns tillstånd kräver en mångfacetterad syn och hand-lingskraft genom ett tvärvetenskapligt engagemang. Ett fungerande samarbete mellan natur-vetenskap och socio-ekonomi, liksom mellan vetenskap och beslutsfattande är nödvändigt. Övergödning har inte verkningar enbart på en biologisk och fysikalisk-kemisk nivå. Problemet kräver också ett ekonomiskt, tekniskt och sociologiskt nytänkande. Vilken teknik är mest hållbar ur miljöns synpunkt utan att hindra människan från att utnyttja naturens resurser? Vad kostar det att rena Östersjön och vilken strategi är mest prisvärd? Kom-munikationsförbistringar kan överkommas med hjälp av begreppsmässiga, s.k. konceptuella, modeller där förändringar i miljön kartläggs på ett lättförståeligt sätt, samtidigt som möjligast många aspekter av problemet framkommer. I min avhandling strävar jag till att framställa Östersjöns eutrofiering ur flera olika synvinklar. Problemet presenteras dels på ett allmänt plan, dels regionalt mer i detalj. Jag har gjort ett försök att kartlägga övergödningsproblemet i Östersjön i sin helhet i en konceptuell modell. Modellen visar hur både naturliga och antropogena drivmedel åstadkommer fysikalisk-kemiska och biologiska verkningar i ekosystemet, samt hur dessa kopplas till ekonomiska, hälsomässiga och estetiska konsekvenser på ett samhälleligt plan. För vidtagande av positiva åtgärder krävs restriktioner och bestämmelser från beslutsfattare. Min modell kan jämföras med det s.k. DPSIR-tankesättet, som visar hur drivkrafter (Drivers), påtryckning (Pressures), tillstånd (State), effekter (Impact) och reaktioner (Response) kopplas till varandra för att för-klara orsakerna till miljöförändringar. Övergödningen är ett hot mot hela Östersjöns framtid, men olika kusttyper och skillnaden mellan kustområde och öppet hav påverkar händelseförloppet. Skärgårdar fungerar som filter mellan kustområden och öppna Östersjön. Näringsämnen bibehålls, omformas och lagras på plats istället för att snabbt föras ut till havs. Längs en öppen kustlinje är förhållandet det motsatta. För att peka på regionala skillnader har jag delat in Östersjön i nio delområden. På

basen av tillgänglig litteratur, från vetenskapligt granskade publikationer till s.k. grå rapporter och webbinformation, har jag sammanställt eutrofieringsgraden och när problemen uppstod skilt för varje delområde. Det rådande tillståndet för varje region är sammanfattad i en konceptuell modell. För noggrannare analyser av utveckling i näringstillstånd, syresituation etc. på regional nivå har långtidsdata från nationella och internationella övervakningsprogram värdefullt informationsvärde. I det här arbetet har mönster i fysikaliska och biologiska para-metrar uppmätta längs den finska kustzonen av Finska viken studerats närmare. Resultaten av min avhandling visar att Östersjöns tillstånd och återhämtningsmöjligheter ifrågan om övergödning kräver handlingsprogram både på en storskalig nivå som täcker hela Östersjön och på regionala plan, där specifika problem för specifika områden beaktas. För positiva resultat krävs en medvetenhet och vilja till förbättringar som sträcker sig över vetenskapliga ämnesdomäner och ut till beslutsfattare och allmänheten. Användarvänliga modeller som beskriver problemet är en viktig grund för samarbetet. Nyckelord: eutrofiering, områdesspecifika förändringar, konceptuella modeller, tvär-vetenskap, DPSIR-tankesätt, Östersjön


Table of contents List of orginal publications.......................................................................................................... 11 Contributions to the publications, list of abbreviations ............................................................... 12 1. INTRODUCTION................................................................................................................ 13 1.1 The Baltic Sea .......................................................................................................... 14 1.2 Eutrophication – a global problem ........................................................................... 16 1.3 Ecology meets society .............................................................................................. 17 1.3.1 The DPSIR-approach ................................................................................... 18 1.4 Eutrophication – measurements in the Baltic Sea region ......................................... 18 1.5 Conceptualizing the eutrophication .......................................................................... 19 1.5.1 The EU Water Framework Directive............................................................ 20 1.6 Area-specific eutrophication .................................................................................... 20 1.7 Aims of the work ...................................................................................................... 22 2. ASSESSING EUTROPHICATION..................................................................................... 23 2.1 Eutrophication parameters ........................................................................................ 26 2.1.1 Secchi depth.................................................................................................. 26 2.1.2 Salinity.......................................................................................................... 26 2.1.3 Oxygen.......................................................................................................... 27 2.1.4 Nutrients ....................................................................................................... 27 2.1.5 Chlorophyll a and primary production......................................................... 28 2.1.6 Phytoplankton and harmful algal blooms..................................................... 29 2.1.7 Macrovegetation........................................................................................... 30 2.1.8 Drifting algal mats ....................................................................................... 30 2.1.9 Zoobenthos ................................................................................................... 31 2.1.10 Ichthyofauna ................................................................................................ 31 3. THE GULF OF BOTHNIA.................................................................................................. 33 3.1 Secchi depth ............................................................................................................. 34 3.2 Salinity ..................................................................................................................... 34 3.3 Oxygen ..................................................................................................................... 35 3.4 Nutrients ................................................................................................................... 36 3.5 Primary production and chlorophyll a ..................................................................... 37 3.6 Phytoplankton and algal blooms .............................................................................. 37 3.7 Macrovegetation ...................................................................................................... 38 3.8 Zoobenthos .............................................................................................................. 39 3.9 Ichthyofauna ............................................................................................................ 39 3.10 The present situation and suggestions for measurements ........................................ 40 4. THE ARCHIPELAGO REGION; Archipelago Sea, Åland Islands and Stockholm archipelago ........................................................................................................ 42 4.1 Secchi depth ............................................................................................................ 43 4.2 Salinity .................................................................................................................... 44 4.3 Oxygen .................................................................................................................... 44 4.4 Nutrients .................................................................................................................. 45 4.5 Primary production and chlorophyll a ..................................................................... 47 4.6 Phytoplankton and algal blooms............................................................................... 48 4.7 Macrovegetation ...................................................................................................... 49 4.8 Ephemeral algae and drifting algal mats .................................................................. 50 4.9 Zoobenthos .............................................................................................................. 51 4.10 Ichthyofauna ............................................................................................................ 52 4.11 The present situation and suggestions for measurements ........................................ 53 5. THE GULF OF FINLAND .................................................................................................. 56 5.1 Secchi depth ............................................................................................................ 57 5.2 Salinity ..................................................................................................................... 58 5.3 Oxygen .................................................................................................................... 58 5.4 Nutrients .................................................................................................................. 59

5.5 Primary production and chlorophyll a ..................................................................... 61 5.6 Phytoplankton and algal blooms .............................................................................. 61 5.7 Macrovegetation ...................................................................................................... 62 5.8 Ephemeral algae and algal mats ............................................................................... 63 5.9 Zoobenthos .............................................................................................................. 63 5.10 Ichthyofauna ............................................................................................................ 64 5.11 The present situation and suggestions for measurements ........................................ 65 5.12 Multiple use of monitoring data; case studies from the Gulf of Finland ................. 67 6. THE GULF OF RIGA ............................................................................................................ 71 6.1 Secchi depth ............................................................................................................ 72 6.2 Salinity ..................................................................................................................... 72 6.3 Oxygen .................................................................................................................... 73 6.4 Nutrients .................................................................................................................. 73 6.5 Chlorophyll a and primary production .................................................................... 74 6.6 Phytoplankton and algal blooms .............................................................................. 75 6.7 Macrovegetation ...................................................................................................... 75 6.8 Ephemeral algae and drifting algal mats................................................................... 76 6.9 Zoobenthos .............................................................................................................. 76 6.10 Ichthyofauna ............................................................................................................ 77 6.11 The present situation and suggestions for measurements ........................................ 78 7. THE GULF OF GDANSK, including the Curonian and Vistulan Lagoons ........................ 81 7.1 Secchi depth ............................................................................................................ 82 7.2 Salinity ..................................................................................................................... 83 7.3 Oxygen .................................................................................................................... 83 7.4 Nutrients .................................................................................................................. 84 7.5 Chlorophyll a and primary production .................................................................... 84 7.6 Phytoplankton and algal blooms .............................................................................. 85 7.7 Macrovegetation ...................................................................................................... 86 7.8 Zoobenthos .............................................................................................................. 87 7.9 Ichthyofauna ............................................................................................................ 87 7.10 The present situation and suggestions for measurements ........................................ 88 8. THE SWEDISH EAST-COAST; from the Himmerfjärden Bay to the Hanö Bay .............. 91 8.1 Secchi depth ............................................................................................................ 92 8.2 Salinity ..................................................................................................................... 92 8.3 Oxygen .................................................................................................................... 92 8.4 Nutrients .................................................................................................................. 93 8.5 Chlorophyll a and primary production .................................................................... 94 8.6 Phytoplankton and algal blooms .............................................................................. 94 8.7 Macrovegetation ...................................................................................................... 94 8.8 Ephemeral algae and drifting algal mats................................................................... 95 8.9 Zoobenthos .............................................................................................................. 95 8.10 Ichthyofauna ............................................................................................................ 96 8.11 The present situation and suggestions for measurements ........................................ 97 9. THE CENTRAL BALTIC SEA .......................................................................................... 99 9.1 Secchi depth ............................................................................................................ 100 9.2 Salinity ..................................................................................................................... 101 9.3 Oxygen .................................................................................................................... 101 9.4 Nutrients .................................................................................................................. 102 9.5 Chlorophyll a and primary production .................................................................... 103 9.6 Phytoplankton and algal blooms .............................................................................. 104 9.7 Macrovegetation ...................................................................................................... 104 9.8 Zoobenthos ............................................................................................................... 105 9.9 Ichthyofauna ............................................................................................................ 106 9.10 The present situation and suggestions for measurements ........................................ 107

10. THE BELT SEA REGION; including Great Belt, Little Belt and the Sound, Fehmarn Belt, and the Bights of Kiel, Mecklenburg and Pomerania ............................... 109 10.1 Secchi depth ............................................................................................................ 111 10.2 Salinity ..................................................................................................................... 111 10.3 Oxygen .................................................................................................................... 111 10.4 Nutrients .................................................................................................................. 113 10.5 Chlorophyll a and primary production .................................................................... 114 10.6 Phytoplankton and algal blooms .............................................................................. 115 10.7 Macrovegetation ...................................................................................................... 115 10.8 Ephemeral algae and drifting algal mats................................................................... 117 10.9 Zoobenthos .............................................................................................................. 117 10.10 Ichthyofauna ............................................................................................................ 118 10.11 The present situation and suggestions for measurements ........................................ 119
11. KATTEGAT ...................................................................................................................... 122 11.1 Secchi depth ............................................................................................................ 123 11.2 Salinity ..................................................................................................................... 123 11.3 Oxygen .................................................................................................................... 123 11.4 Nutrients .................................................................................................................. 124 11.5 Chlorophyll a and primary production .................................................................... 125 11.6 Phytoplankton and algal blooms .............................................................................. 126 11.7 Macrovegetation ...................................................................................................... 126 11.8 Ephemeral algae and drifting algal mats................................................................... 127 11.9 Zoobenthos .............................................................................................................. 127 11.10 Ichthyofauna ............................................................................................................ 128 11.11 The present situation and suggestions for measurements ........................................ 129 12. CONCLUSIONS ................................................................................................................. 131 13. ACKNOWLEDGEMENTS ................................................................................................ 135 14. REFERENCES .................................................................................................................... 136


List of original publications This thesis is a monograph, but it is also based on four original publications. N.B. Lundberg (né Rönnberg). The publications are referred to by their Roman numerals in the text: I. BONSDORFF, E., C. RÖNNBERG & K. AARNIO, 2002. Some ecological properties
in relation to eutrophication in the Baltic Sea. Hydrobiol. 475/476: 371-377. II. RÖNNBERG, C. & E. BONSDORFF, 2004. Baltic Sea eutrophication: area-specific
ecological consequences. Hydrobiol. 514: 227-241. III. RÖNNBERG, C. 2005. Conceptualizing the Baltic Sea ecosystem – an inter-
disciplinary tool for environmental decision making. Ambio, 35 (6), in print. IV. LUNDBERG, C., M. LÖNNROTH, M. VON NUMERS & E. BONSDORFF. A multi-
variate assessment of coastal eutrophication. Examples from the Gulf of Finland, northern Baltic Sea. Mar. Poll. Bull, accepted.
The papers are reprinted with permission from the respective publishers; I, II: Kluwer Academic Publisher, III: Royal Swedish Academy of Sciences and IV: Elsevier Ltd.
11

Contributions to the publications: I II III IV Concept EB, CL, KA CL, EB CL CL Data collection CL CL CL ML Data analysis KA CL CL ML, CL, MvN Manuscript preparation CL, EB CL, EB CL CL, MvN, EB CL = Cecilia Lundberg (Rönnberg), EB = Erik Bonsdorff, KA = Katri Aarnio, ML = Malin Lönnroth, MvN = Mikael von Numers List of abbrevations used in the text: BOD Biological oxygen demand DIN Dissolved inorganic nitrogen DIP Dissolved inorganic phosphorus POM Particulate organic material Tot-N Total nitrogen Tot-P Total phosphorus
12

Introduction
1. INTRODUCTION
This thesis is an attempt to summarise, analyse and interpret ecological information
on the state of the Baltic Sea in relation to the escalating process of eutrophication.
The state of knowledge is presented in a format aimed at facilitating environmental
decision-making by society. Hence, this study is based on the existing information
from numerous sources, and gives a comprehensive overview of the current situation
in the Baltic Sea, as well as suggestions for remedies for continued sustainable use of
the sea ecosystem.
A healthy ecosystem is stable and sustainable, maintaining organisation and
productivity over time and resilience to stress (RAPPORT et al. 1998, BOESCH 2000).
Signs of large-scale eutrophication of aquatic ecosystems were detected by biologists
in the 1960s, but the problem reached the minds of managers and the general public
only after several decades. As DUNLAP (1993) states, natural scientists debated the
causes of ecological problems in the early 1970s, but the social scientists were slow to
recognise the societal significance of pollution and related problems. Solutions for
environmental problems, such as eutrophication, need measures on an
interdisciplinary level. Marine ecologists contribute with monitoring and
interpretation of long-term data, but the final measures and financial considerations
will be the task for politicians (BONSDORFF et al. 1997a). For a more complete
understanding and sustainable decision-making, interlinkage between natural and
social sciences is necessary.
To be able to learn and understand new information, we must understand the
past and the processes that regulate the systems – in this case the Baltic Sea. The
eutrophication-related changes are described both in general (paper I) and in more
detail (Chapters 3-11, paper II). Based on these results, parameters and species of
special indicator-value can be identified and used for further investigation and
analysis where the actual links between nutrient loads and ecological effects are
studied, towards an interdisciplinary approach (paper III), and more site-specific
(paper IV). This thesis aims primarily at identifying eutrophication-related problems
by constructing conceptual models of the process at different environmental scales.
This enables us to further analyse the quantitative dose-response effects when nutrient
loadings and concentrations are coupled to ecological effects.
13

Introduction
This thesis is a part of the research programme MARE (Marine Research on
Eutrophication – a scientific base for cost-effective measures for the Baltic Sea;
WULFF et al. 2001a, MARE 2005). MARE has developed a decision-support system,
NEST, for testing cost-effective strategies to reduce eutrophication and its negative
effects in the Baltic Sea. MARE involves ecology, oceanography, economy and
modelling, and aims at narrowing the gap between scientists and decision-makers.
1.1 The Baltic Sea The Baltic Sea is one of the largest brackish water bodies on earth, situated between
54°-66°N and 10°30´-31°E (Fig. 1.1). It has steep gradients in topography,
hydrography and climate, as well as a permanent stratification of the water mass
(LEPPÄKOSKI & BONSDORFF 1989, paper I). The salinity is decreasing from 15-25 psu
in the surface water in the Kattegat, to 0-2 psu in the northern Bothnian Bay
(ELMGREN & LARSSON 2001). These characteristics make the system very species
poor with a limited number of ecological functional groups (BONSDORFF & PEARSON
1999). Tides are virtually non-existent and during winter the sea is partially covered
by ice (HELCOM 1996). Basic environmental data on the Baltic Sea are presented in
Table 1.1.
Table 1.1. Some basic data for the Baltic Sea (after JANSSON & VELNER 1995).
Statistics Measure Area 415.000 km²
Length (N-S) 1300 km Width (W-E) 1200 km Average depth 60 m Maximum depth 459 m Sill depth 17 m Volume 21.700 km³ Residence time of water 25 yrs Total catchment area 1.641.650 km²
The anthropogenic stress to the Baltic is severe, as 16 million people live on or
in immediate victincy of the coast and a total of 85 million within the catchment area.
The large riverine inflow and the shallow and narrow entrance to the North Sea
restrict the water exchange and give the Baltic Sea its brackish character. The largest
rivers; Neva (flow: 77.6 km3 yr-1), Vistula (33.6 km3 yr-1), Daugava (20.8 km3 yr-1),
14

Introduction
Njemen/Nemunas (19.9 km3 yr-1) and Odra/Oder (18.1 km3 yr-1), supply most of the
freshwater, and thereby also most of the nutrients to the system (STÅLNACKE 1996,
SCHERNEWSKI & NEUMANN 2005). Also, the five largest European lakes; Ladoga and
Fig. 1.1. The Baltic Sea and its catchment area. The surrounding nations (BEL=Belarus, CZE REP=Czech republic, EST=Estonia, DEN=Denmark, FIN=Finland, GER=Germany, LAT=Latvia, LIT=Lithuania, NOR=Norway, POL=Poland, RUS=Russia, SWE=Sweden, SLO REP=Slovak republic UKR=Ukraine) and the five biggest rivers and lakes are included, as well as the 9 sub-regions used in Chapters 3-11. Modified from GRIDA (2001).
15

Introduction
Onega in Russia, Vänern and Vättern in Sweden and Peipsi on the Estonian and
Russian boarder, are all situated within the Baltic drainage area (STÅLNACKE 1996;
Fig. 1.1).
More comprehensive information on the Baltic Sea is found in e.g.
FALANDYSZ et al. (2000) and KAUTSKY & KAUTSKY (2000). The special issue of
Ambio 30 (no. 4-5, 2001), with the title “Man and the Baltic Sea” is also
recommended for further reading. The Baltic system in relation to integrated coastal
zone management is found in SCHERNEWSKI & SCHIEWER (2002), and a system-
oriented analysis is presented in WULFF et al. (2001b).
1.2 Eutrophication – a global problem Eutrophication is defined as an increased input of nutrients or organic matter into an
aquatic ecosystem, resulting in an increase in primary production (e.g. NIXON 1995).
Marine eutrophication is well described, both globally and regionally. The
anthropogenic, or cultural, nutrient over-enrichment in marine systems are discussed
in e.g. JØRGENSEN & RICHARDSON (1996), CLOERN (2001), BOESCH (2002), DE JONGE
et al. (2002), and WASSMANN & OLLI (2004). BRICKER et al. (1999), give valuable
information on assessment of coastal eutrophication in the U.S.
For the Baltic Sea, LARSSON et al. (1985) have estimated a four-fold increase
in nitrogen (N) and eight-fold in phosphorus (P) during the 20th century. According to
ELMGREN & LARSSON (2001), the total annual nutrient load to the Baltic Sea is
1.249.000 tons nitrogen and 56.000 tons phosphorus.
The main sources of eutrophication are agriculture and husbandry, industries,
aquaculture, municipal sewage water, river run-off and erosion, atmospheric
deposition and nitrogen fixation (ELMGREN & LARSSON 2001, WASSMANN & OLLI
2004). Besides the Baltic Sea, large-scale nutrient over-enrichment is occurring in e.g.
the Black Sea area (e.g. MEE 1992), the North Sea and Wadden Sea (e.g. VAN
BEUSEKOM & DE JONGE 2002, DE GALAN et al. 2004), Chesapeake Bay (e.g. HERBST
2002) and the northern Gulf of Mexico (e.g. RABALAIS et al. 2002). In most cases
eutrophication seems to be more serious for coastal ecosystems than the open sea
(DIAZ & ROSENBERG 1995).
16
Introduction
1.3 Ecology meets society The marine ecosystem is considered to be the most complex (ELLIOTT 2002a).
Besides the linkages between physical, chemical and biological processes,
interrelations to sociology, economy and technology are evident. For an ecosystem to
be sustainable, it is dependent on how management is run and how political decisions
are made. To achieve a general understanding of a complex issue, the scientific
community working in detail must meet the holistic approach of the managers
(ELLIOTT 2002a). The aim of science is to serve society. Communication problems
form the largest obstacles in the co-operation between scientists and decision-makers.
Common failures are the use of different standards, lack of available information and
difficulties in quantifying uncertain data (KINZIG & STARRETT et al. 2003). Therefore,
the demand for an active interdisciplinary communication between different
disciplines of science and between science and management is important (WALTERS
1997). Then, transdisciplinary new theories, tools and techniques can be developed
(COSTANZA 1996).
The interdisciplinary linkages between ecology and economy is an important
factor in the eutrophication process. The socio-economic system with human
demographic, social, cultural and economic trends is a part of the ecosphere. The
carrying capacity of the whole system also involves the growth of the human
population and its activities (COSTANZA 1996, FOLKE et al. 1996). Even from a
sociological perspective, humans have exceeded the limit for the carrying capacity
during the 20th century (DUNLAP 1993, DUNLAP & CATTON 2002).
Fertilizer use and fossil-fuel consumption are examples of economic factors
driving the human decisions that further impact the nutrient over-enrichment.
Therefore, knowledge of economic forces provides identification and predictions of
trends in the nutrient cycles, both on national and global scales (SEGERSON &
WALKER 2002). The search for cost-effectiveness and choose of management
programmes play a role both nationally and internationally. ELOFSSON (2002) shows
that cost-effective reductions, where they are most needed, are more effective than
uniform reduction rates for all countries around the Baltic Sea. Theory and
methodology of eutrophication-management in the Baltic Sea area is found in the
special issue “Management of eutrophied coastal ecosystems” of Ecological
Economics (volume 47, 2003).
17

Introduction
1.3.1 The DPSIR-approach
The DPSIR-approach is a tool used to explain the causes of environmental change for
interdisciplinary problems. DPSIR stands for the Drivers of change causing Pressure
on the environment. The Status has to be assessed, giving the definition of Impacts.
All these indicate the human Response (TURNER et al. 1999, ELLIOTT 2002a, BOING
2005). The framework is developed from a conceptual identification of environmental
indicators by OECD, with the purpose to link human activities and environmental
degradation (BLANC et al. 2004). According to ELLIOTT (2002a), the human response
has to meet six tenets for environmental management. In other words, the response
has to be environmentally sustainable, including technology and economy, as well as
sociology, legislation and administration support an environmentally friendly
management (ELLIOTT 2002a).
1.4 Eutrophication – measurements in the Baltic Sea region Besides the coastal zone, also rivers and the atmosphere transport nutrients into the
Baltic Sea. In the year 2000, about 28.000 tons of phosphorus and 660.000 tons of
nitrogen were brought to the Baltic by rivers (HELCOM 2003a). The atmospheric
deposition is the major nitrogen source, 35 % of the total load. In the 1980s, 324.000
t y-1 entered the Baltic Sea through atmospheric deposition, which was reduced to
210.000 t in 1997 (HELCOM 2002).
Clear reductions in diffuse loads from agriculture and scattered dwellings are
harder to obtain compared to point-source reductions from industries and
municipalities. Policy governing preventive measures in agriculture has to be
prioritised for a reduction of diffuse loading. Efficiency in the recycling of nutrients,
with a decreased use of mineral fertilizers and an increase in the residence time of
water in river catchments are some examples (JANSSON 1997). Wetlands have a
capacity to reduce about 20 % of the nitrogen loading to the sea, while ecological
farming should potentially recycle most of the phosphorus (ŁYSIAK-PASTUSZAK et al.
2004).
The development of networks and organizations between the Baltic countries
are, according to KERN & LÖFFELSEND (2004), more dynamic compared to the rest of
Europe. The Helsinki Convention, HELCOM, was signed in 1974 of the nine riparian
states to the Baltic Sea with the intention to undertake measures to minimize the land-
18

Introduction
based pollution to the Baltic. By the Ministerial Declaration in 1988, the countries set
a reduction goal of 50 % of the nutrient loads until the year 1997. After only seven
years, in 1995, the total nitrogen and phosphorus load was reduced by 35 %
(SCHERNEWSKI & NEUMANN 2002). The fast drop was mostly reached in the post-
socialistic republics as the reductions co-occurred with the collapse of their political
structure. The results of the load reduction by the Ministerial Declaration are
evaluated in LÄÄNE et al. (2002).
Even if all Baltic countries, except Russia, are members of the EU since May
2004, the Baltic Sea region can still be divided into two disparate worlds due to
economic possibilities. JAHN & KUITTO (2005) found strong correlations between the
development of Gross Domestic Product (GDP) and CO2 emissions and fertilizer
consumption in the countries in the Baltic Sea region. In KERN & LÖFFELSEND (2004)
Germany and the Nordic countries are classified as environmental pioneers, whereas
Poland and the Baltic republics still lag behind European standards in environmental
issues. However, the fertilizer consumption is much lower in the eastern Baltic Sea
region than in the western part (JAHN & KUITTO 2005).
Mathematical models are useful and fast methods for predicting the
environmental status, both from long-term and short-term perspectives. For the Baltic
Sea, quantitative models for calculations of biogeochemical nutrient cycles (SAVCHUK
& WULFF 2001, SAVCHUK 2002), phytoplankton biomass (KIIRIKKI et al. 2001,
KORPINEN et al. 2004), and nutrient budgets (WULFF et al. 2001c) are used. On a
global scale, fuzzy logic modelling is used for predictions of eutrophication (e.g.
CHEN & MYNETT 2003). Fuzzy logic can be a useful tool, as environmental data
consists of heterogeneous and large data sets with a high range of uncertainty
(ADRIAENSSENS et al. 2004).
1.5 Conceptualizing the eutrophication Eutrophication is an interdisciplinary problem. The excessive input of nutrients,
mainly phosphorus and nitrogen, will lead to a chain of consequences and effects, not
only in the aquatic environment, but also on a socio-economic level and concretely
affect the well-being of humans. CLOERN (2001) has conceptualized the
eutrophication problem on a general level. A somewhat more detailed attempt to show
the complexness of eutrophication is presented in a conceptual model (so called
19

Introduction
“horrendogram” in ELLIOTT (2002a)) in paper III, where the pathways from natural
science to human society and management options are presented. Various kinds of
end-users can use the model for their mutual communication. A conceptual model
helps to formulate questions, identify gaps in knowledge, and act as a platform for
ideas from various scientific perspectives (READ et al. 2001, HEEMSKERK et al. 2003).
However, a complex model can never fully reflect reality. By increasing the
resolution and complexity in a model, the accuracy and uncertainty set limitations
(COSTANZA 1996). 1.5.1 The EU Water Framework Directive
The ongoing implementation of the European Union Water Framework Directive
(WFD) has contributed to raise the awareness for environmental issues in Europe. The
WFD shows the need for clear and precise information on an interdisciplinary level.
By promoting a sustainable use of water, the objective of the WFD legislation
is to achieve good ecological status of surface water by the year 2015 (ANON. 2000).
The EU member states have to develop classification systems for describing the
ecological status of water bodies and establish reference conditions (ANON. 2000,
ANDERSEN et al. 2004a). Methods from paleoecology (ANDERSEN et al. 2004a,
WECKSTRÖM et al. 2004) to modelling and expert judgement are under development
(ANON. 2000). The WFD raises the need for joint programmes, both for national and
international monitoring. In BÄCK et al. (2002) the phytobenthos programme for the
Finnish coast is assessed, and in PERUS et al. (2004) the corresponding for
macrozoobenthos.
In order to assess habitats at risk, the definition of Ecological Quality (EcoQ)
and Ecological Quality Objectives (EcoQO) is a useful tool as a basis for monitoring
(ELLIOTT & DE JONGE 2002). Recommendations for eutrophication-related risk
assessment by different kinds of models, monitoring and management are found in
READ et al. (2001).
1.6 Area-specific eutrophication When discussing the state of the environment, the Baltic Sea is often regarded as one,
uniform water body (DE JONGE et al. 1994, CLOERN 2001, paper I). In the case of
eutrophication, topography, exposure, upwelling and other physical factors influence
the process, and make it function differently in the various parts of the Baltic Sea.
20

Introduction
Open coasts with good water circulation behave differently from shallow
archipelago areas, which act as buffers between the coast and the open sea. Also the
climate and salinity status differ in the Baltic Sea system. The almost limnic and
species-poor Bothnian Bay can be classified as middle-boreal, whereas the
Archipelago Sea, Gulf of Finland, Baltic proper and Gulf of Riga are hemi-boreal.
The more marine and biologically diverse southern Baltic belongs to the temperate
vegetation zone (RYDIN et al. 1999, HUMBORG et al. 2003). The overall information
on transformation and retention of nutrients in estuaries is often based on eutrophied
north temperate estuaries, whereas the nutrient dynamics in boreal and arctic waters
are scarce (HUMBORG et al. 2003).
Hence, eutrophication is an area-specific problem, and the choice of
appropriate management strategies or policy varies among estuaries (SEGERSON &
WALKER 2002). In the Baltic Sea, regional differences occur especially in the coastal
waters (NEUMANN & SCHERNEWSKI 2005).
Based on this reasoning, the Baltic Sea is divided into nine sub-regions in
Chapters 3-11, where the state and changes due to eutrophication is presented and
evaluated. Chapter 2 presents the parameters studied, and Chapters 3-11 describe the
sub-regions: 1) the Gulf of Bothnia, 2) the Archipelago region, 3) the Gulf of Finland,
4) the Gulf of Riga, 5) the Gulf of Gdansk, 6) the East coast of Sweden, 7) the Central
Baltic, 8) the Belt Sea region, and 9) the Kattegat (Fig. 1.1).
The presentations of the eutrophication situation and related changes in the
sub-regions of the Baltic Sea are presented with data on both primary parameters and
secondary effects. The analysis is based on public and available information only, and
no attempt has been made to re-analyse reported numerical information. In that
respect, the present thesis is not to be confused with the large and valuable assessment
reports compiled regularly by HELCOM (HELCOM 1990, 1996, 2002), which describe
trends in concentrations and biotic conditions. The presented analysis is an updated
version of RÖNNBERG (2001).
21

Introduction
1.7 Aims of the work
The specific aims of this thesis are:
1. To present a comprehensive review of the knowledge of changes in and
responses to eutrophication in the Baltic Sea, when and where the first obvious
signs were detected and how severe the problems are at present (Chapters 3-
11, papers I, II).
2. To detect and describe differences in the effects and consequences of
eutrophication in the Baltic Sea, at the level of nine sub-regions (Fig. 1.1;
Chapters 3-11, papers I, II).
3. To view the Baltic eutrophication from an interdisciplinary perspective and
show the relations and interlinkages between ecological and social processes
(paper III).
4. To use long-term monitoring data for detection of spatial and temporal trends,
and for short-term predictions of the state of the environment (paper IV).
22

Assessing eutrophication
2. ASSESSING EUTROPHICATION Threats to the environment are described by a variety of parameters. Every parameter
contributes to the assessment of the state of the environment. Regarding the negative
effects of eutrophication, total phosphorus and nitrogen, chlorophyll a and
transparency (Secchi depth) are used as the key-parameters. Other parameters, such as
oxygen concentration, zoobenthos and ichthyofauna, also provide information for the
estimation of the degree of nutrient over-enrichment (ANON. 1999a). The assessment
of the state of the environment, in this case to eutrophication, needs a standardised
and uniform classification system. Despite the ongoing implementation of the EU
Water Framework Directive, such a system is still non-existing. In this thesis I have
used a three level classification scheme (Table 2.1, paper II). Note that it is not based
on reference conditions as required by the WFD (ANDERSEN et al. 2004a).
In Chapters 3-11, the eutrophication is illustrated for the nine sub-areas of the
Baltic Sea using a uniform conceptual model (Fig. 2.1). This model only describes the
environmental processes affected by eutrophication. The model is based on the model
in paper III. The estimates for the assessment and classification in the conceptualised
eutrophication models are found in Table 2.1 and in paper II. Fig. 2.2 shows the
legend for the colouring of the models in Chapters 3-11.
In the following, the parameters used for the assessment of the area-specific
descriptions and couplings to eutrophication in Chapters 3-11 are presented.
23

Assessing eutrophication
Table 2.1. Guidelines for the degree of changes in the parameters considered in Chapters 3-11. The degree of changes corresponds to the scale presented in Fig. 2.2. The classification is based on JUMPPANEN & MATTILA (1994), RUMOHR et al. (1996), ÆRTEBJERG et al. (1998), ANON. (1999a), and DAHLGREN & KAUTSKY (2002). The values for the first six parameters represent summer values (August value for chlorophyll a). The table is modified from paper II. Effects: Parameter: Small-moderate Serious Very serious Transparency 3-5 m 2-3 m < 2 m Oxygen 4-6 ml l-1 2-4 ml l-1 < 2 ml l-1 Tot-P 15-19 µg l-1 19-24 µg l-1 > 24 µg l-1 Tot-N 250-310 µg l-1 310-360 µg l-1 > 360 µg l-1 Chlorophyll a 1.5-2.2 µg l-1 2.2-3.2 µg l-1 > 3.2 µg l-1 Harmful Algal Blooms Few colonies Formation of Bloom-areas and (HAB) floating algae layer of cyano-
bacteria 1-5 g m-3 5-11 g m-3 > 11 g m-3
Zooplankton Diverse group, not used as an indicator for eutrophication. The
assessments in Fig. 3-11.2 are based on rough estimates. For mesozooplankton a biomass of 2-5 mg C m-3 = low, a biomass
> 30 mg C m-3 = high. Macrovegetation Fucus species, Filamentous algae No Fucus present. meadows of Zostera as epiphytes on Filamentous algae with associated Fucus, sporadic dominate. charophytes, relatively occurrences of Drifting algal mats sparse abundances Zostera, no charo- and sulphur- of filamentous algae. phytes. Filamentous bacteria. algae dominate. Zoobenthos Dominated by Animals live close to No macrofauna. molluscs and long- or at the sediment. Lack of bioturbation lived polychaetes. Small worms (e.g. → lamination of the Increased total Capitella capitata and sediment. biomass production. chironomids) dominate.
Low species richness, high adundance, low biomass. Fish Decrease in Decrease in cod, increase in herring, sprat,
flatfishes. pikeperch and cyprinides.
24

Assessing eutrophication
Fig. 2.1. A conceptual model of the ecological pathways of eutrophication (modified from BERNES 1988).
Fig. 2.2. Scheme that explains the colouring in the conceptual models, Figs. 3-11.2, in Chapters 3-11. The classification is based on the classification in Table 2.1. If an upper left corner (Fig. 4.2, 5.2, 6.2, 7.2, 10.2, 11.2) is coloured differently, it indicates changes to the assessment in RÖNNBERG (2001). The corner has the former colour of the state of the parameter.
25

Assessing eutrophication
2.1 Eutrophication parameters 2.1.1 Secchi depth
Secchi depth, i.e. transparency, is dependent on the amount of planktonic algae and
other particles in the water (JUMPPANEN & MATTILA 1994, BONSDORFF et al. 1997a).
The Secchi depth-method has advantages, as it is easy to conduct, and has been used
for about a century, allowing analysis of long-term trends (SANDÉN & HÅKANSSON
1996). However, the readings are semi-quantitative, and in the Bothnian Bay, the
Secchi depth is not reliable due to the humus and resuspended material in the water
(JOHAN WIKNER, pers. com.).
2.1.2 Salinity
Salinity variations in the history of the Baltic Sea have mainly been caused by
changes in the size of the sounds and in the overall freshwater supply (GUSTAFSSON &
WESTMAN 2002). The Baltic is dependent on inflow of marine water from the North
Sea, which occurs in wind- and current-driven irregular fluxes. The duration and
mean salinity of the inflowing water regulate the state in the Baltic Sea. Small
quantities of inflowing saline water and long intervals between the inflows cause
stagnation of the deep sub-halocline water. The inflows in 1913, 1920, 1921, 1951
and 1975-1976 are classified as the strongest recorded during the 20th century
(MATTHÄUS & FRANCK 1992).
In January 2003, 200 km3 of saline water entered through the Danish Straits,
which was the first larger inflow since 1993 (NAUSCH et al. 2003, PIECHURA &
BESZCZYŃSKA-MÖLLER 2003). Both inflows and runoff are also regulated by climatic
factors in the Atlantic, such as the NAO (Northern Atlantic Oscillation; HÄNNINEN et
al. 2000). Much research is today focused on climate change (see for example Ambio
33 (4-5), 2004; special issue on the Swedish regional climate modelling programme).
Salinity plays an important role for the general species distribution in the
Baltic Sea. The proportion of larger zooplankton, cod (Gadus morhua) abundance and
biomass, herring (Clupea harengus membras) biomass and weight at ages all correlate
positively with salinity (FLINKMAN et al. 1998). Many marine organisms, such as the
brown algae Fucus vesiculosus and the blue mussel Mytilus edulis reach their critical
salinity limit at about 5-6.5 psu (KUKK et al. 1997). Therefore, fluctuations in salinity
have consequences for the whole ecosystem of the Baltic Sea.
26

Assessing eutrophication
2.1.3 Oxygen
The concentration of oxygen in the deep water is partly influenced by the saltwater
inflows and partly by eutrophication. The saline inflows push nutrient-rich bottom
waters from the deep basins in the Central Baltic further north. The effects are
dependent on the size of the inflows (ANDERSIN & SANDLER 1991, CEDERWALL &
SJÖBERG 1995). Old, anoxic water is generally not pushed north of the Fårö Island,
because of the large volume of the Eastern Gotland Basin (CEDERWALL & SJÖBERG
1995). The sedimentation increases due to an increase in the algal production and
subsequent transport of organic material to the bottom. The decay of the organic
material consumes oxygen (RICHARSON & JØRGENSEN 1996, GRAY et al. 2002),
causing large-scale severe hypoxia and anoxia (KARLSON et al. 2002).
Benthic organisms are negatively affected by oxygen concentrations below 2
ml l -1, a value which is often used as the threshold for hypoxia (DIAZ & ROSENBERG
1995, CONLEY et al. 2002). In case of anoxia, hydrogen sulphide, H2S, is formed by
bacterial reduction of sulphate ions in the sediment-water interface. The hydrogen
sulphide is chemically dissolved in the anoxic water layers, mainly as HS- ions, and
when the water is re-oxygenated, sulphide is again formed (HELCOM 1990).
In a period of 30 years, from 1970 to 2000, the total area with oxygen
concentrations < 2 ml l-1 varied from < 12.000 km2 to 70.000 km2, which corresponds
to 5-27 % of the bottom area of the Baltic (CONLEY et al. 2002).
A comprehensive numerical modelling of long-term trends in oxygen and
hydrogen sulphide in the central Baltic Sea is presented in UNVERZAGT (2001). In
KARLSON et al. (2002) the couplings between oxygen deficiency and zoobenthos in
the Baltic Sea is reviewed, and estimates of potentially missing benthic biomass
presented.
2.1.4 Nutrients
The coupling of benthic and pelagic processes are complicated in the Baltic, as the
buffering capacities for different nutrients vary, the salt water inflows are irregular
and the length of the growth season differs between the sub-basins (KUPARINEN &
TUOMINEN 2001). A considerable part of the nutrients in the Baltic Sea is originating
from external, anthropogenic sources (HEISKANEN 1998). Nitrate and ammonia are the
dominant inorganic nitrogen compounds, and phosphate the dominating form of
27

Assessing eutrophication
phosphorus. In the transition between oxic and anoxic conditions, nitrate and
ammonia are denitrified into free N2. Phosphorus can bind to the sediment under oxic
conditions, whereas it is released back to the water column under anoxia
(LEHTORANTA 2003). Phosphate is more bioavailable in coastal marine water
compared to freshwater. This is a matter of salinity, which promotes nitrogen
limitation in marine coastal waters in contrast to dilute estuaries, where phosphorus is
often limiting (BLOMQVIST et al. 2004). For more detailed discussions of nutrient
cycling and sedimentation in the Baltic, see e.g. HEISKANEN (1998) and LEHTORANTA
(2003).
In this compilation I have, where possible, concentrated on summer values of
the total amounts of nitrogen and phosphorus in the different sub-regions. Tot-N and
Tot-P include all forms of the particular nutrient in the water, both as dissolved and
bound to particles and biomass (ANON. 1999a).
Contrary to the increasing amounts of nitrogen and phosphorus, the pool of
silica (Si) is decreasing, especially in the southern Baltic. This is partly due to
eutrophication, but most likely to the damming of rivers. Dams convert rivers to lakes,
and the sedimentation of Si occurs already in the lake-phase. The consequence is a
reduction in diatoms in the sea, in favour for e.g. toxic dinoflagellates (HUMBORG et
al. 2000). Silica is not included as a parameter in this text, as sufficient information
for all sub-regions is lacking.
2.1.5 Chlorophyll a and primary production
The chlorophyll a content in the productive layer gives an estimate of the amount of
phytoplankton in the water (JUMPPANEN & MATTILA 1994, KONONEN et al. 1998).
The concentration of chlorophyll a generally increases from the open sea towards the
coast, depending on the input from land and degree of mixing (PITKÄNEN & KANGAS
1987).
The primary production is the rate at which carbon is fixed by photosynthesis.
The amount varies with light and temperature. WASMUND et al. (2001) have estimated
the annual phytoplankton primary production in the entire Baltic Sea to 62 x 106 t C.
N.B. The concentrations of primary production are given both as g C m-2 and g C m-3 in Chapters 3-11,
depending on different methods used in different investigations and areas.
28

Assessing eutrophication
2.1.6 Phytoplankton and harmful algal blooms
The number of phytoplankton species identified in the Baltic Sea is about 2000
(GUNDERSEN 2002). Generally, diatoms have larger cells than dinoflagellates, which
are able to grow also under low nutrient concentrations. Cyanobacteria are only
limited by phosphate, as they can fix atmospheric nitrogen (SCHERNEWSKI &
NEUMANN 2005). The diatom:flagellate ratio is a potential indicator for
eutrophication, since an increase in flagellates cause harmful microalgal blooms
(HAB; SMAYDA 2004). However, the N:P ratio has raised more interest, because
nitrogen and phosphorus are the primary nutrients controlling cyanobacterial blooms
of e.g. Nodularia spp and Aphanizomenon spp (NIEMI 1979).
Cyanobacteria are able to fix dissolved molecular N2, and are therefore able to
grow in the summer period when other phytoplankton species are limited by nitrogen
(KAHRU et al. 1994). These species also have the ability to store phosphorus and
avoid grazing by forming filamentous cells (FEUERPFEIL et al. 2004). The filaments of
cyanobacteria are positively buoyant and, as an inverted sedimentation, aggregate in
the surface layer (Horstmann et al. 1986 in KAHRU et al. 1994). For a cyanobacterium
bloom to develop, the requirements are a water temperature > 16° C, a daily radiation
over 120 W m-2 and wind < 6 m s-1 (LARSSON et al. 1998). There are different scales
for estimation of the duration and quantity of blooms, for example in KANOSHINA et
al. (2003) and Reimers (1990) in OLENINA & OLENIN (2002).
The increase in frequency and magnitude of the cyanobacterial biomass during
the latest decades is related to the man-induced eutrophication, but the nitrogen
limitation of phytoplankton in the Baltic proper is not anthropogenic, rather a natural
phenomenon, and has endured for about 7000 years (BIANCHI et al. 2000). In FINNI et
al. (2001) the history of the cyanobaterial blooms in the Baltic is described.
ANON. (2001a) gives a brief guide to the nitrogen fixation in the Baltic Sea.
Mechanisms regulating the planktonic ecosystems are described in KONONEN (2001).
Continuously updated information of the algal situation in different parts of the Baltic
Sea during the summer season is found at the BALTIC SEA PORTAL (2004).
The diversity of zooplankton with respect to size, life cycles and behaviour,
make them difficult to use as indicators for eutrophication (ÆRTEBJERG et al. 2003).
Therefore, they are not included as a parameter in this thesis. However, as
zooplankton is an important component in the flow-chart of eutrophication-related
effects, they are included in the conceptual model in Figs. 2.1, 3-11.2. The estimation
29

Assessing eutrophication
of their changes due to eutrophication is rough, but some general traits are found in
Table 2.1.
2.1.7 Macrovegetation
The benthic macrovegetation plays an important regulating role in shallow areas. The
single perennial brown algae in the northern Baltic Sea, Fucus vesiculosus, and the
aquatic vascular plant, Zostera marina, can be regarded as key-species in the Baltic as
they host and protect various amounts of other species. Both species are adapted to
oligotrophic ecosystems (ANON. 1991), and nutrient over-enrichment affects them
negatively through decreased light penetration and stronger competition with
filamentous fast-growing algae (WALLENTINUS 1981). An extreme growth of
epiphytes reduces the structural complexity of Z. marina and the plant is pressed
down onto the sediment by the weight of the filamentous algae. This may further lead
to reduced water circulation, which may cause local anoxia (PIHL et al. 1995, BADEN
& BOSTRÖM 2001). According to BERGSTRÖM (2005), the adaptation of some
macroalgae to low salinity may infer with the capacity to utilize nutrients, which
indicates that effects of eutrophication cannot be assessed uniformly for the whole
Baltic Sea. Negative effects of eutrophication on different life stages of F. vesiculosus
are presented in BERGER et al. (2004).
A literature review of changes in the benthic macrovegetation in various parts
of the Baltic Sea is presented in DAHLGREN & KAUTSKY (2002).
2.1.8 Drifting algal mats Eutrophication favours the growth of filamentous algae. Mechanical loss of algal
material is transported to benthic systems where they aggregate and form loose-lying
mats (ÓLAFSSON 1988, BONSDORFF 1992). The mats may be over a hectare in size and
consist of several different algal species (BONSDORFF 1992, BONSDORFF et al. 1995,
NORKKO & BONSDORFF 1996a, b, c). When light conditions are sufficient, the algal
mats are productive and may provide habitat and food for benthic organisms
(NORKKO et al. 2000). The decomposition of the algae is rapid and may induce
hypoxia, anoxia and even hydrogen sulphide in the sediment below the algal mats
(NORKKO & BONSDORFF 1996a, b, c, VAHTERI et al. 2000).
The drifting algae mats in the northern Baltic Sea are dominated by the brown
algae Pilayella littoralis and Ectocarpus siliculosus (NORKKO & BONSDORFF 1996a,
30

Assessing eutrophication
MARTIN et al. 2003). In the Kattegat green algae, such as Cladophora glomerata, are
common also (HÅKANSSON 2003). P. littoralis has an active growth period from
February to December in areas without sea ice, resulting in drifting algae also during
winter. In cold, offshore water the detached algae may remain intact for long periods,
when the microbial activity is low and the colonisation of invertebrates slow. Thus,
the over-wintering capacity is good in favourable conditions. Algal degradation by
mesograzers is negligible in the northern Baltic Sea (SALOVIUS & BONSDORFF 2004).
2.1.9 Zoobenthos Knowledge of species composition and biomass of the zoobenthic community gives
valuable information of the state of eutrophication. This ecological parameter is
central as the species differ in sensitivity and act differently to the supply of organic
matter, oxygen conditions and presence of hydrogen sulphide in the bottom water and
the sediments (CEDERWALL & ELMGREN 1980, 1990).
The temporal and spatial changes of the benthic fauna in the Baltic Sea due to
eutrophication and oxygen deficiency are comprehensively described in KARLSON et
al. (2002). A functional analysis of zoobenthos throughout the Baltic Sea gradient is
presented in BONSDORFF & PEARSON (1999), and some specific species distribution
patterns are shown in LAINE (2003).
2.1.10 Ichthyofauna
The fish-catches in the Baltic Sea started to increase in the early 1950s, partly due to
an intensification of the fishery and the decreased predation by seals, and partly due to
eutrophication (HANSSON & RUDSTAM 1990, ROSENBERG et al. 1990). Today,
overfishing is a global problem (ELLIOTT 2002b, HJERNE 2003), and the
eutrophication has changed the fish stock abundances and community compositions
(OJAVEER, H. 2002). Of the economically most important species in the Baltic Sea –
cod (Gadus morhua), herring (Clupea harengus membras) and sprat (Clupea sprattus)
– cod is the most vulnerable to eutrophication. The cod eggs need a salinity of 11 psu
and an oxygen concentration > 2 ml l-1 for successful hatching (HANSSON & RUDSTAM
1990, NISSLING & WESTIN 1991).
According to HJERNE & HANSSON (2002), the fishery in the Baltic counteracts
eutrophication by removing approximately 15.000 t nitrogen and 3000 t phosphorus
31

Assessing eutrophication
every year. On the other hand, the fishes sequester high quantities of phosphorus
(HJERNE & HANSSON 2002). The environmental impact on the Baltic fish and fishery
is reviewed in OJAVEER, H. (2002). Reproductive disturbances in Baltic Sea fish is the
theme for the special issue of Ambio 23 (no. 1), 1999.
---
Various publications about the Baltic Sea and eutrophication, from refereed scientific
papers to regional environmental reports, are never-ending sources of information.
The papers analysed in Chapters 3-11 are therefore subjective in the sense that they
are the results of my requests to scientists and authorities in the Baltic region, and
otherwise accessible in scientific journals and on the Internet (all the web-sites quoted
were, with a few exceptions, available in December 2004). The language is another
aspect of priority, and this work is based on literature in English, Danish, Finnish,
German, and Swedish. Hence, any limitations to this work are set by the sources of
information used.
32

Gulf of Bothnia
3. THE GULF OF BOTHNIA The Gulf of Bothnia has two major basins, the Bothnian Sea (60.5°N-63.5°N), and the
Bothnian Bay (63.5°N-66°N). The Bothnian Sea has an average depth of 68 m, and
the average depth of the Bothnian Bay is 43 m. These two basins are separated by the
Northern Quark, a shallow sill of only 20 m (Fig. 3.1). The maximum depth in the
Bay and in the Sea is 147 and 230 m, respectively. The Finnish coast to the Gulf of
Bothnia slopes gently towards the central, deeper section, whereas the Swedish coast
is more steep. The land elevation in the Bothnian Bay is 8-9 mm per year and 5-8 mm
in the Bothnian Sea (HELCOM 1996, HÅKANSSON et al. 1996).
The inflow of fresh water from the rivers, together with the precipitation, gives
the Bothnian Bay its estuarine character (HELCOM 1996). The rivers discharging into
the Bothnian Bay are still classified as pristine (SCHERNEWSKI & NEUMANN 2005).
The Bothnian Bay has a three times higher freshwater discharge per volume compared
to the Bothnian Sea (SANDBERG et al. 2004). The brackish water from the surface of
the Baltic proper promotes more “marine” conditions in the Bothnian Sea (HELCOM
1996). Fig. 3.1. The Gulf of Bothnia sub-region.
33

Gulf of Bothnia
The annual ice-sheet is a specific character for the Gulf of Bothnia. The ice
thickness is approximately 0.8-1.0 m in the northern Bothnian Bay. The general
freezing period lasts for about 120 days, from January to April/May. In the Bothnian
Sea an ice cover of ~ 0.4 m is normally formed a month later and lasts for
approximately 60 days (HÅKANSSON et al. 1996). The upper 60 m water layer in the
Gulf of Bothnia turns over every spring and autumn, which promotes good oxygen
concentrations in the entire water column throughout the year (HELCOM 1996,
HUMBORG et al. 2003). The natural year-to-year variation make trends for the Gulf of
Bothnia hard to assess (KAJRUP 1999).
Many industries are situated along the coast and shipping is intense all year
round, despite the ice-cover during the winter period (HÅKANSSON et al. 1996). In
February 2004, only the mining waste from the Swedish River Dalälven is classified
as a HELCOM hot spot in the Gulf of Bothnia (HELCOM-HOTSPOTS 2004).
3.1 Secchi depth The Bothnian Bay is the only sub-region in the Baltic Sea with a stable trend in water
transparency. The high N:P ratio does not induce cyanobacterial blooms and the high
amount of humic substances causes a natural turbidity (ANDERSSON & WIKNER 2004,
LAAMANEN et al. 2004). Resuspended material and humus affect the Secchi
recordings negatively in the Bothnian Bay, therefore Secchi depth is not a reliable
indicator for eutrophication in this area (JOHAN WIKNER pers. com.). However, the
mean recordings for August in 1986-2000 were 5.7 m (KVARKEN COUNCIL 2003).
In the Bothnian Sea the transparency has decreased by 35 % during the last
one-hundred years (LAAMANEN et al. 2004). In the offshore areas and in the outer
archipelago, the visibility in the water lays in the range of 3-7 m in August. In coastal
areas, the Secchi depth in late summer varies from < 1 to 2.5 m, according to the
degree of eutrophication (BERGSTRÖM & BERGSTRÖM 1999, ÅDJERS & SANDSTRÖM.
1999, DANILOV & EKELUND 2001, SANDSTRÖM & KARÅS 2002, KVARKEN COUNCIL
2003).
3.2 Salinity
The salinity in the Gulf of Bothnia is relatively stable. The salinity varies from 5-7
psu in the Bothnian Sea to 3-4 psu in the Bothnian Bay (HÅKANSSON et al. 1996,
34

Gulf of Bothnia
WULFF et al. 1996, HELCOM 2002, FONSELIUS & VALDERAMA 2003). The proportion
of freshwater outside the river mouths is high (HÅKANSSON et al. 1996).
In the Bothnian Bay, the salinity trend is slightly decreasing since the mid
1980s. The surface salinities declined from 3.5 psu in 1985 to 2.8 psu in 2002, and the
bottom salinities from 4.5 to 3.5 psu (STOCKHOLM UNIVERISTY 2004a, AXE &
BJERKEBÆK LINDBERG 2004).
In the well-mixed, upper 50 m of the Bothnian Sea, the salinity variations are
small (HELCOM 1996, HÅKANSSON et al. 1996). A slight decrease was seen in the
period 1980 to 1995, to about 6.2 psu in the bottom water and 5.5 psu in the surface
layer (STOCKHOLM UNIVERSITY 2004a, AXE & BJERKEBÆK LINDBERG 2004). In 1999
the salinity in the southern Bothnian Sea was 0.5 psu lower than the long-term mean
(KAJRUP 2000). The salinity rose somewhat in 2001 in both basins of the Gulf of
Bothnia (AXE & BJERKEBÆK LINDBERG 2004).
3.3 Oxygen The thermohaline convection in the Gulf of Bothnia gives a good oxygen situation
(ANDERSSON & WIKNER 2000, FONSELIUS & VALDERAMA 2003). This together with
the low BOD activity and the fact that cold and low saline water solve oxygen more
easily, makes the oxygen situation good in the Bothnian Bay (AXE & BJERKEBÆK
LINDBERG 2004). The oxygen has been stable between 7.5 and 9.0 ml l-1 during the
last century (FONSELIUS & VALDERAMA 2003). The oxygen saturation in the bottom
water in the Bothnian Bay varies between 80 and 95 % (ANDERSSON & WIKNER
2000).
The oxygen conditions in the deep waters of the Bothnian Sea have decreased
with about 0.13 ml l-1 per year since the 1960s (WIKNER 1994, HELCOM 1996), even
if the situation is not alarming. The long-term mean oxygen concentration in the
Bothnian Sea is 6.2 ml l-1 (KAJRUP 2000). The oxygen values in 2003 ranged between
5.4 and 6.8 ml l-1 (AXE & BJERKEBÆK LINDBERG 2004). The lowest oxygen value in
the northern Bothnian Sea is recorded in late summer 1999; 4.6 ml l-1 (KAJRUP 2000).
The oxygen saturation is 70-95 % in the bottom water (ANDERSSON & WIKNER 2000).
Laminated sediments are found between 15 and 25 m in the Bothnian Sea. The
lamination is due to natural conditions in the ecosystem; e.g. the land elevation and
35

Gulf of Bothnia
the amount of material transported via the river, and is not eutrophication-induced
(JONSSON 2003).
3.4 Nutrients The concentrations of phosphorus and nitrogen (especially DIN) in the Gulf of
Bothnia are twice as high as in the early 1970s. During the 1980s, the values stabilised
at a relatively high level (HELCOM 1996, WULFF et al. 1996). There is no direct sign
of eutrophication in the open sea areas of the Gulf of Bothnia. In the coastal zones
long-term measurements are lacking, but areas with a high nutrient load in
combination with low water exchange show clear symptoms of eutrophication
(HELCOM 1996, WIKNER 1999).
In the Bothnian Sea, the N:P ratio varies seasonally from 10:1 to 40:1. The
ratio also shows variation between areas. Generally, the Bothnian Sea is N-limited,
but some coastal areas at the Swedish side of the Northern Quark are P-limited
(ANDERSSON et al. 1996, WIKNER 1999). The trends for both inorganic phosphorus
and nitrogen in the deep water in the Bothnian Sea have increased three times since
the 1930s (FONSELIUS & VALDERAMA 2003). The tot-N and tot-P in late summer were
measured to 240 µg l-1 and 12 µg l-1 respectively in the offshore area in the beginning
of the 2000s (HUMBORG et al. 2003, KVARKEN COUNCIL 2003).
A weaker vertical stability may influence the increasing phosphorus
concentration (HELCOM 1996). The high nitrogen concentration may be due to a
higher freshwater supply from rivers and an inflow of P-rich water from the Baltic
proper along the Finnish coast (HELCOM 1996, WULFF et al. 1996, WIKNER 1999).
The total amount of nutrients in the Bothnian Sea in autumn 2002 was ~ 60.000 t
phosphorus and 1.000.000 t nitrogen (SMHI 2004).
The Bothnian Bay is during the whole growth season clearly phosphorus-
limited (ANDERSSON et al. 1996, HELCOM 1996, WULFF et al. 1996, KIRKKALA
1998). The concentration of phosphate is lower and that of nitrate is higher in the
Bothnian Bay than in the Bothnian Sea (SANDBERG et al. 2004). In the deep water of
the Bothnian Bay, the trend for phosphate is relatively stable, while the inorganic
nitrogen is increasing since the 1960s onwards (FONSELIUS & VALDERAMA 2003).
The late summer concentrations for tot-N is 260-270 µg l-1 and for tot-P 6.0-6.5 µg l-1
in the Bothnian Bay (HUMBORG et al. 2003, KVARKEN COUNCIL 2003), which is
classified as very low to low (Table 2.1). Lower salinities in the surface water may
36

Gulf of Bothnia
slightly decrease the tot-P, which is seen between 1985 and 2000 in the Bothnian Bay
(AXE & BJERKEBÆK LINDBERG 2004). The total amount of phosphorus in the
Bothnian Bay in autumn 2002 was 8000 t (SMHI 2004).
Almost all rivers discharging into the Bothnian Bay have somewhat lower
concentrations of DIN than the open sea area outside the river mouth during the
growth period. In the Bothnian Sea, the discharging rivers have slightly lower DIP
concentrations compared to the nearby open sea area during winter. Thus, the
estuaries in the Gulf of Bothnia are ineffective as sinks for riverborne nutrients and
organic material. In the southern Baltic the estuarine sediments are richer in nutrients
compared to offshore areas (HUMBORG et al. 2003).
3.5 Primary production and chlorophyll a Naturally, the concentrations of chlorophyll a are highest during the spring bloom,
around 8 µg l-1 in the Bothnian Sea, and 3-4 µg l-1 in the Bothnian Bay. The summer
values in the Bothnian Sea have doubled since the 1990s (HELCOM 1996). The
chlorophyll a content in the open sea areas of the Gulf is still low, not reaching a
mean value over 1.5 µg l-1 in August (DANILOV & EKELUND 2001, KVARKEN COUNCIL
2003).
The primary production has decreased in the entire Gulf of Bothnia in the
period 1991-2001. Recently, an increase in the Bothnian Sea and the Northern Quark
is seen, to the same levels as in 1998 (ANDERSSON & WIKNER 2004). In the northern
Bothnian Bay, the average value for the primary production is 48 g C m-2 yr –1
(WIKNER 1994), which is four times lower than that in the Bothnian Sea (ANDERSSON
et al. 1996).
3.6 Phytoplankton and algal blooms The dominating phytoplankton groups in the Gulf of Bothnia are generally diatoms
and dinoflagellates. Cyanobacteria account for 25 % of the phytoplankton biomass. In
late summer, unicellular cyanobacteria in open sea areas in the Bothnian Sea may
reach mass occurrences (SANDBERG et al. 2004).
The phytoplankton biomass in the Bothnian Bay is only one third compared to
the amounts in the Bothnian Sea. The limitation by phosphorus reduces the
phytoplankton production in the Bothnian Bay (ANDERSSON & WIKNER 2004). The
37

Gulf of Bothnia
spring bloom is also a month delayed compared to the southern Gulf of Bothnia.
Cyanobacteria are almost totally lacking in the Bothnian Bay (WIKNER 1994, 1995).
In the southern Bothnian Sea, the concentration of especially Aphanizomenon
flos-aquae has increased, probably due to increased concentrations of phosphorus in
the deep water (WIKNER 1994, HELCOM 1996, HAJDU et al. 2003). The nitrogen load
in the Bothnian Sea has increased due to the cyanobacteria (HAJDU et al. 2003). A.
flos-aquae has advantages to Nodularia spp in the Bothnian Sea. A. flos-aquae has
ability to store phosphorus and grow in cold temperature, low salinity and bad light
condition. The weak stratification takes the cells deeper, which is a disadvantage for
Nodularia spp. (HAJDU et al. 2003).
The potentially toxic dinoflagellate Dinophysis acuminata may cause
extensive algal blooms in the Bothnian Sea, as in the summer 1993 along the Finnish
coast (WIKNER 1994).
3.7 Macrovegetation So far, no drastic changes in macrovegetation in the Gulf of Bothnia seem to be
eutrophication-related. In the northern Bothnian Bay, both vegetation and fauna
communities are poor with low abundances and biomasses (KAUTSKY & FOBERG
2001). Although, according to KAUTSKY & FOBERG (2001), the biomass has increased
in the Råneå archipelago compared to earlier investigations. The perennial vegetation
in the Bothnian Bay consists of the green algae Cladophora aegagrophila and the
water moss Fontinalis spp (DAHLGREN & KAUTSKY 2002).
At the Finnish side of the Northern Quark, 40 different algal taxa are recorded.
The dominating species are the brown algae Fucus vesiculosus, Pilayella littoralis and
Sphacelaria arctica, and the green algae Cladophora glomerata (BERGSTRÖM &
BERGSTRÖM 1999). At the Swedish coast in the northern Bothnian Sea, F. vesiculosus
had a depth distribution to 10.5 m in 1998, which indicates a good water quality
(KAUTSKY & FOBERG 1999).
Drifting algal mats have occurred in coastal areas both on the Finnish and
Swedish side of the Bothnian Sea. At the Finnish coast, south of the river mouth of
Eurajoki, mats of Enteromorpha intestinalis were found on shallow bottoms in 1993-
1997. The thickness of the mats varied between 5 and 20 cm, and H2S was
occasionally present beneath the mats (BÄCK et al. 2000). In the northern Bothnian
38

Gulf of Bothnia
Sea at the Swedish coast, smaller occurrences of drifting algae were observed in
August 2000 (Minnhagen 2001 in DAHLGREN & KAUTSKY 2002).
3.8 Zoobenthos Generally, the diversity of macrofauna decreases from south to north in the Gulf of
Bothnia. This is due to the shorter productive season and decreasing salinity in the
Bothnian Bay. Freshwater fauna gives a higher species diversity in the northernmost
parts of the Gulf. Therefore, the zoobenthos in the Bothnian Sea are more similar to
the fauna in the northern Baltic proper (ELMGREN et al. 1984).
The deep bottoms in the Gulf of Bothnia are dominated by the crustaceans
Monoporeia affinis and Saduria entomon (LAINE 2003). About five species colonise
the deep areas in the Bothnian Sea and only two in the Bothnian Bay (ELMGREN et al.
1984). The crustaceans are the most important group in the Bothnian Bay, in lack of
bivalves (LAINE 2003). The macrobenthic biomass has increased significantly, 4-5
times, in the Bothnian Sea since the 1920s (ELMGREN et al. 1984, CEDERWALL &
BLOMQVIST 1991). Significant changes in the zoobenthic communities are observed in
the entire Gulf of Bothnia during the latest years. The invasive polychaete
Marenzelleria viridis has continued to increase since the mid 1990s, the populations
of M. affinis have decreased and molluscs have shell damages (KARLSSON &
LEONARDSSON 2004). M. affinis increased in the 1990s, probably due to an increase in
nutrients (LAINE & KANGAS 2004), but the reason for the decline is not clear
(KARLSSON & LEONARDSSON 2004).
In coastal areas the benthic communities consist of few marine species, and
the majority are of freshwater origin. In 2000, three archipelago areas at the Finnish
side of the Gulf of Bothnia were investigated. In the areas in the Bothnian Sea and
Northern Quark, 28 and 31 species were found, respectively. Macoma balthica, S.
entomon and M. viridis were most abundant. The archipelago area in the Bothnian
Bay was poorer with 18 species. M. affinis, M. viridis and oligochaets were most
common (WESTBERG & LAX 2003).
3.9 Ichthyofauna The number of fish species decreases to the north in the Gulf of Bothnia. Cold water
species as herring (Clupea harengus membras), whitefish (Coregonus spp) and
39
Gulf of Bothnia
vendace (Coregonus albula) dominate in the Bothnian Bay (BOTHNIAN BAY LIFE
2004). In the Bothnian Sea, perch (Perca fluviatilis), roach (Rutilus rutilus) and ruffe
(Acerina cernua) are the dominating species (WIKNER 1995, ÅDJERS et al. 2001,
HOLMQVIST et al. 2003). Ruffe is eutrophication-favoured, but there is no clear
explanation for the increasing ruffe stock in some areas during the 1990s (WIKNER
1995). Other eutrophication-favoured species are lacking or occur sparsely (SVEDÄNG
et al. 1997). The catches of perch, pike (Esox lucius), pikeperch (Sander lucioperca)
and whitefish have decreased, but an increase in vendace is seen during the latest
years (ÅDJERS et al. 2001, SÖDERBERG & GÅRDMARK 2004).
The fisheries for salmon (Salmo salar), herring, sprat (Clupea sprattus) and cod
(Gadus morhua) are limited in the Gulf of Bothnia (SÖDERBERG & GÅRDMARK 2004).
3.10 The present situation and suggestions for measurements The Gulf of Bothnia is the only sub-region in the Baltic Sea with no clear sign of
eutrophication. The concentrations of nutrients have increased to some extent in the
open sea areas during the latest decades. Point sources have caused eutrophication on
a local level in coastal areas. Agricultural productivity in combination with many
small rivers, a flack landscape and enclosed embayments favour local eutrophication
along the Finnish coast. The Swedish coast to the Gulf of Bothnia is more open and
steep and the large rivers are mainly oligotrophic, which makes local eutrophication
more rare (BOTHNIAN BAY LIFE 2004). The eutrophication model for the Gulf of
Bothnia (Fig. 3.2) only indicates some increasing tendencies, which hopefully can act
as warning signals for prevention of more serious changes in the ecosystem.
According to HELCOM (2003a), the average riverine load of nitrogen and
phosphorus to the Gulf of Bothnia and the Archipelago region in the year 2000 was
140.000 t y-1 and 6500 t y-1, respectively. The background load stands for 55 % of the
N and 62 % of the P. The diffuse load origins to 37 % from N and 35 % from P, the
rest (8 % N and 3 % P) are point source load (HELCOM 2003a). The majority of the
phosphorus sources to the Bothnian Bay from Finland come from natural leaching,
forestry and agriculture. In the Bothnian Sea, agriculture, natural leaching and
scattered dwellings are the main P-sources. For nitrogen, natural leaching, agriculture
and atmospheric deposition are of most importance in both areas (KAUPPILA & BÄCK
2001).
40

Gulf of Bothnia
BERNET (2000a) recommends measures in nitrogen reduction in sewage plants
and in diffuse loads from the agriculture and scattered dwellings for the Finnish side
of the Gulf. The risks for flooding should also be taken into consideration and
prevented. The river systems in the Gulf of Bothnia have a human impact in
hydrological alterations, or river dams (HUMBORG et al. 2000). Only the three
northernmost rivers in Sweden are unregulated (HUMBORG et al. 2003). Thus,
according to HUMBORG et al. (2003), most estuaries draining into the Gulf of Bothnia
may behave differently from well-studied nutrient enriched estuaries in the southern
Baltic Sea. Information on flooding in Swedish rivers and probable risk areas are
found at SMHI (2004).
The database of the Finnish and Swedish co-operation project, BOTHNIAN BAY
LIFE (2004), gives accurate information on monitoring data from several sampling
stations in the Gulf of Bothnia.
Fig. 3.2. The present eutrophication situation in the Gulf of Bothnia (see Table 2.1 and Fig. 2.2 for explainations).
41

Archipelago region
4. THE ARCHIPELAGO REGION; Archipelago Sea, Åland
Islands and Stockholm archipelago The Archipelago Sea (SW Finland), the archipelago of the Åland Islands (Finland),
the Åland Sea and the Stockholm archipelago (Sweden) are here included in the
Archipelago region (Fig. 4.1). In e.g. HELCOM reports, this area is a part of the Gulf of
Bothnia, but I have separated these two areas, as the characteristics and state of
eutrophication clearly differ in the Bothnian Sea and Bothnian Bay from the
archipelago areas south of the Southern Quark.
The Finnish side of the Åland Sea (59°45´-60°30´N, 19°30´-23°00´E) is
characterised by some 30.500 islands (total area ~ 2500 km2, the mainland of Åland
not included), forming a mosaic of more or less distinct zonation ranging from the
innermost sheltered coastal zones to the open sea areas in the middle of the
Archipelago Sea (JUMPPANEN & MATTILA 1994, BONSDORFF et al. 1997b, KIRKKALA
1998). Average water depth is 23 m (the deepest trench: 146 m) with a shoreline of
over 20.000 km (JUMPPANEN & MATTILA 1994, BONSDORFF et al. 1997b).
Fig. 4.1. The Archipelago re-gion consists of the Archipelago Sea, the Åland Islands, Åland Sea and the Stockholm ar-chipelago.
The Stockholm archipelago (58°50´-60°30´N, 18°00´-19°30´E) is the
collective term for the 100 km wide and 200 km long area from the inner city of
Stockholm to the islet Svenska Björn in the Åland Sea, and from the town of
Öregrund (1500 inh.) to the town of Nynäshamn (13.000 inh.) in the north-south
direction. The archipelago consists of more than 10.000 islands (total area ~ 500 km2)
with a total coastline of 10.000 km. The southern part of the Stockholm archipelago is
flat with long and narrow bays. The northern part is characterised by a few, deep
channels, sandy bottoms and moraine islands. The coastline to the Åland Sea is
42

Archipelago region
straight and open (KAUTSKY et al. 2000) steeping down to the depths of the Åland Sea
(max. depth: 294 m).
The water has an eastward net transport from the Baltic proper and the Gulf of
Finland to the Gulf of Bothnia through the Archipelago Sea. The Skiftet Strait with an
average mean depth of 40 m forms a corridor in a north-south direction (ERKKILÄ &
KALLIOLA 2004). From the Gulf of Bothnia, the water has a southward transport
through the deep Åland Sea.
Eutrophication is the main environmental problem in the Archipelago region
(BONSDORFF et al. 1997a, KIRKKALA 1998). A high background load in combination
with the increased nutrient concentrations accumulates in shallow archipelagos and
coastal waters. Archipelagos act as filters for nutrients, which incorporate in
organisms and sedimentate, therefore the eutrophication is accelerating much faster in
enclosed areas than in the open sea (MATTILA 2000). For example, the outflow from
Lake Mälaren is important for the state of the environment in the inner Stockholm
archipelago, whereas the outer archipelago is under the influence of the Baltic proper
(LÄNNERGREN 2001).
According to latest list of HELCOM-HOT SPOTS (2004), the agricultural runoff
from SW Finland is the only environmental hot spot in the Archipelago region.
4.1 Secchi depth In the Archipelago Sea, the transparency in the middle and outer areas has changed
from > 10 m in the 1950s (JUMPPANEN & MATTILA 1994) to 2-5 m at the end of the
1990s (ERKKILÄ & KALLIOLA 2004). The Secchi depth is gradually increasing from
the inner coastal bays towards the offshore areas (KIRKKALA 1998, ERKKILÄ &
KALLIOLA 2004). During the period 1999-2003, the innermost areas in the northern
Archipelago Sea had the lowest transparency, 0.9-2 m, while the rest of the inner
archipelago had values of 2-3 m. The best transparency values were found in the
southern archipelago and offshore, 4-4.5 m (SW FINLAND REGIONAL ENVIRONMENT
CENTRE 2004). The Secchi depth has decreased with 0.3-1.4 m in the outer and
middle archipelago zones since the early 1990s, but in the inner areas the situation is
stable (SUOMELA 2001).
The Secchi depth has a significantly decreasing trend in the Åland
archipelago, from 8 m in 1984 to 4.3 m in 1994 (BONSDORFF et al. 1997b, ÖSTMAN &
43

Archipelago region
BLOMQVIST 1997). The highest values are found offshore in the Åland Sea or south of
the mainland; 7 m in summer 2003. In the NW Åland, the outer archipelago had a
transparency of 4 m and the middle area 1.5-2 m in the summer 2003 (HUSÖ
BIOLOGICAL STATION 2004).
In the outer areas of the Stockholm archipelago, the water transparency has
decreased from 8 m in the 1940s (WÆRN 1952) to 7 m in the beginning of the 1980s
(KAUTSKY et al. 1986). In the inner archipelago zone, the Secchi depth has increased
since the 1960s, after the introduction of biological treatment and phosphorus
reduction in the sewage treatment plants in the Stockholm area (BRATTBERG 1986,
LÄNNERGREN 1995, LÄNNERGREN et al. 2003). The Secchi depths in the Stockholm
archipelago were good in the summer of 2003; ~ 4 m in the inner, 5 m in the middle
and 6-8 m in the outer areas (LÄNNERGREN et al. 2003). According to ANON. (1999a)
and LÄNNERGREN et al. (2003), the situation is classified as good to very good in the
whole archipelago zone.
4.2 Salinity The deep layer of the Archipelago region and the Gulf of Bothnia receives saline
water primarily from the Baltic proper surface layer. The deep water salinity trend has
been decreasing, from 7.2 psu in 1980 to 5.8 psu in 1994 (HELCOM 1996, VUORINEN
et al. 1998). Since then, a slight increase has taken place. In 2000, the salinity in the
Åland Sea was 6.5 psu in the bottom water (FONSELIUS & VALDERAMA 2003).
In the Stockholm archipelago, the changes in salinity are most obvious in the
innermost part. The salinity decreased in a step-like manner, from nearly 6 psu in the
beginning of the 1980s to about 5 psu at the end of the 1990s (LÄNNERGREN &
ERIKSSON 2000), due to fluctuations in received freshwater (KAUTSKY et al. 2000). In
the outer archipelago, the salinity is rather stable, varying from 5.2-5.8 in the northern
parts and 6-7 in the southern area (KAUTSKY et al. 2000, LÄNNERGREN et al. 2003).
4.3 Oxygen The oxygen content in the bottom water in the inlet to the town of Turku/Åbo has
decreased dramatically since the 1970s, even though the improvement in sewage
treatment has had a positive effect on the oxygen situation outside the urban areas
(JUMPPANEN & MATTILA 1994). The inner areas, except for the inlet to Åbo, also
44

Archipelago region
show a clear decrease in oxygen concentrations from the late 1990s to 2002. In the
rest of the Archipelago Sea, no changes in oxygen have occurred since the late 1990s
(LAIHONEN et al. 2003). The middle archipelago area had oxygen concentrations in
the ranged 3-6 ml l-1 in the summer 2000. In the outer archipelago and offshore, the
oxygen situation was good (SUOMELA 2001). One exception is the south-eastern part
of the Archipelago Sea, which is influenced by nutrient-rich water from the Gulf of
Finland together with loads from the local fish farms (JUMPPANEN & MATTILA 1994).
In 2000, oxygen concentrations of 1.5-3 ml l-1 were recorded (SUOMELA 2001).
Around the Åland Islands a non-significant decreasing trend is seen in the
minimum oxygen saturation at deep bottoms from 1904 to 2000 (FONSELIUS &
VALDERAMA 2003). In shallow bays and in deeper areas, where the water exchange is
poor, hypoxia and anoxia are common features. The situation is worst in late summer
due to stagnant water (ÖSTMAN & BLOMQVIST 1997).
The oxygen situation was good in the inner Stockholm archipelago the whole
productive season of 2003, with values over 4 ml l-1 (LÄNNERGREN et al. 2003). The
concentration is comparable with 0.2-0.8 ml l-1 in 1994-1998, and 2 ml l-1 in 1999
(LÄNNERGREN & ERIKSSON 2000). The oxygen concentration in summer is highly
related to the outflow from Lake Mälaren in spring (LÄNNERGREN 2001). In the
southern part of the Stockholm archipelago, the condition in the bottom water has
been poor and the concentrations of H2S have periodically been high. Since 1994, the
situation has improved and H2S seldom exceeds 20 µg l-1 (LÄNNERGREN & ERIKSSON
2000). In 2003, the oxygen situation in the middle and outer areas were good,
generally, but H2S was present from August to November at some localities
(LÄNNERGREN et al. 2003).
The amount of laminated bottoms in the Stockholm archipelago has steadily
increased during the 20th century until 1990. In the inner and middle archipelago, no
improvements are seen, even if there have been clear reductions in the sewage
treatment. In the outer archipelago, the laminated sediments were first observed in the
1950s-80s, depending on area (JONSSON 2003).
4.4 Nutrients The nutrient conditions in the Archipelago Sea and the Gulf of Bothnia clearly differ.
The general level and the annual variation of nitrogen and phosphorus concentrations,
45

Archipelago region
as well as the primary production, are much higher in the archipelago area. The
Archipelago Sea receives nutrient-rich surface water from the northern Baltic proper
and the Gulf of Finland. Besides, the complex geomorphology restricts the vertical
mixing in the water mass (HELCOM 1996).
In the 1980s, signs of eutrophication were detected in the outer archipelago
and the Åland area, while the inner Archipelago Sea already suffered from local
eutrophication in the 1960s (JUMPPANEN & MATTILA 1994). The nutrient
concentrations have increased significantly in most parts of the Archipelago Sea since
the 1970, even if better sewage treatment has lead to decreased loads of both nitrogen
and phosphorus (JUMPPANEN & MATTILA 1994, KIRKKALA 1998, KIRKKALA et al.
1998, HÄNNINEN et al. 2000).
The total nitrogen was higher in 2001 in the northern part of the Archipelago
Sea compared to the first half of the 1990s, while the situation was more or less the
same in the rest of the area. In the innermost areas even a decrease has taken place
(SUOMELA 2001). In the summers of 2003-2004, tot-N offshore gradually increased
from 275-300 µg l-1 (low value; Table 2.1) to 350-400 µg l-1 (high value; Table 2.1)
near the coast (SW FINLAND REGIONAL ENVIRONMENT CENTRE 2004). The northern
and south-western parts of the Archipelago Sea have the lowest phosphorus
concentrations. However, phosphorus has increased especially in the northern areas.
Also the internal phosphorus loading has increased during the latest years (SUOMELA
2001, SW FINLAND REGIONAL ENVIRONMENT CENTRE 2004). In the summer of 2004,
the outer and middle archipelago areas in the northern part had tot-P values of 20-24
µg l-1 (medium high; Table 2.1), while the values in the same type of area in the
southern Archipelago Sea was 28-32 µg l-1 (high-very high; Table 2.1, SW FINLAND
REGIONAL ENVIRONMENT CENTRE 2004).
Outside the town of Åbo, the total concentrations of nutrients were 850 µg l-1
for tot-N and 26 µg l-1 for tot-P (SUOMELA 2001, SW FINLAND REGIONAL
ENVIRONMENT CENTRE 2004). The concentrations can be comparable with the tot-N
values of 20 µg l-1 in late 1960s and 25-45 µg l-1 in early 1990s, and tot-P
concentrations of 300 µg l-1 in late 1960s and 400-900 µg l-1 in early 1990s
(JUMPPANEN & MATTILA 1994, KIRKKALA 1998, HÄNNINEN et al. 2000).
Since the late 1980s, the concentrations of nutrients have increased in the
Åland archipelago. The increase in the outer archipelago is higher for nitrogen than
for phosphorus (NUMMELIN 2000). Phosphorus has a decreasing trend with distance
46

Archipelago region
from land (ÖSTMAN & BLOMQVIST 1997). The most eutrophied areas in the
archipelago of Åland are outside the town of Mariehamn (11.000 inh.) and the
archipelago area of Föglö, south-east of the mainland. The westernmost areas next to
the Åland Sea have the best water conditions (APPELGREN & MATTILA 2002). In the
summer of 2003, tot-N and tot-P were ~ 400 µg l-1 and ~35 µg l-1 respectively in an
inner archipelago station in the NW. The concentrations in the outer archipelago were
250-300 for tot-N and 16-20 µg l-1 for tot-P (HUSÖ BIOLOGICAL STATION 2004).
The nutrient concentrations in the Stockholm archipelago had a peak in the
beginning of the 1970s (BRATTBERG 1986). Since then the concentrations of both
phosphorus and nitrogen have decreased in the drainage area of Lake Mälaren. The
amount of phosphorus was about 85-90 µg l-1 in 1970 and 25 µg l-1 in 1994. For
nitrogen the values were about 1220 µg l-1 in 1976 and 500 µg l-1 in 1994
(LÄNNERGREN 1995). In the inner archipelago, near the Stockholm city, tot-P and tot-
N have decreased with 20 % and 50 % respectively since 1990 (LÄNNERGREN et al.
2003). The nutrient concentrations in the summer of 2003 in the inner archipelago
were classified as very high-high (tot-P: 35 µg l-1, tot-N: 800 µg l-1), declining
successively to low-very low (tot-P: 15 µg l-1, tot-N: 280 µg l-1) in the outermost
areas. The annual internal phosphorus load in inner archipelago is estimated to 30-60
tons (LÄNNERGREN et al. 2003).
The discharges of waste water in the Stockholm inner archipelago cause a
nutrient-rich out-flowing current in the deep water. This results in the total-P
concentrations in the surface water being highest 7-12 km from Stockholm, in the
outer archipelago. The gradient for nitrogen is sharper. The concentration of tot-N has
slightly risen, when the surplus of inorganic nitrogen is unutilised in the phosphorus
limited inner archipelago (BRATTBERG 1986, LÄNNERGREN 1995).
4.5 Primary production and chlorophyll a The open Archipelago Sea has a spatial distribution of chlorophyll a in the range 2-4
µg l-1 (ERKKILÄ & KALLIOLA 2004). In the early 1990s, the limit for 3 µg l-1 moved 5-
10 km further out from the coastline (KIRKKALA 1998). During the last decade, the
concentrations of chlorophyll have increased in the innermost and northern parts of
the Archipelago Sea, whereas no changes or improvements have been detected in the
middle archipelago (SUOMELA 2001). The highest, 3-5 µg l-1 (high; Table 2.1),
47

Archipelago region
chlorophyll values are found in the south eastern part of the Archipelago Sea, in
comparison with 2-3 µg l-1, or medium high (Table 2.1), in the inner and middle areas
(KIRKKALA 1998, ERKKILÄ & KALLIOLA 2004, SW FINLAND REGIONAL
ENVIRONMENT CENTRE 2004). In the coastal areas, the range is 5-10 µg l-1, which is
very high (SW FINLAND REGIONAL ENVIRONMENT CENTRE 2004).
In the deep Åland Sea the values of both chlorophyll a and primary production
capacity show a slightly increasing tendency during the 1980s (HELCOM 1990).
During the 1990s, chlorophyll a has slightly decreased in the Åland archipelago, e.g.
in the NW part from about 2.3 µg l-1 to 1.8 µg l-1 (NUMMELIN 2000). In the summer
of 2003, the chlorophyll values in NW Åland were 2-6 µg l-1 in the inner archipelago
and 1-3 µg l-1 in the outer (HUSÖ BIOLOGICAL STATION 2004). The trend for the
primary production is similar, the concentration was 4.5 mg C m–3 h-1 in 1979
and increased to 8.5 mg C m–3 h-1 in 1987 (HELCOM 1990, SCHULZ et al. 1992).
In the 1970s, the chlorophyll a concentration in the Stockholm archipelago
indicated a eutrophic system with > 30 µg l-1 15 km out from the city of Stockholm,
which slightly decreased to < 10 µg l-1 offshore. Until 1985 the situation had
improved remarkably, when the concentrations were halved (BRATTBERG 1986). The
mean chlorophyll content in the period 1999-2003 was 5.7 µg l-1, and the inner,
middle and outer archipelago zones are classified to very high, high-very high and
low-medium high, respectively (LÄNNERGREN et al. 2003).
4.6 Phytoplankton and algal blooms According to JUMPPANEN & MATTILA (1994), the amount of phytoplankton in the
inlet to the town of Åbo was low in the 1970s and 1980s. During the 1990s the
amount of phytoplankton started to increase. The most common species in the
Archipelago Sea and Åland archipelago are Aphanizomenon spp and Anabaena spp.
In late summer Nodularia spp is abundant (JUMPPANEN & MATTILA 1994, ÖHMAN
1995). In the warm summers of 1997 and 1999, the inner and middle regions of the
whole Archipelago Sea suffered from dense algal blooms (ref. in RÖNNBERG 2001). In
late summer 2004, visible plankton accumulations were observed in the north-west
and south Åland as well as in the deep areas of the Archipelago Sea (BALTIC SEA
PORTAL 2004, SW FINLAND REGIONAL ENVIRONMENT CENTRE 2004).
In the inner parts of the Stockholm archipelago, Planktothrix agardhii has
been a frequently occurring cyanobacteria since the 1970s onwards (KAUTSKY et al.
48

Archipelago region
2000). In the summer of 2003, Aphanizomenon spp was the dominating cyanobacteria
(LÄNNERGREN et al. 2003).
4.7 Macrovegetation The Fucus vesiculosus belt in the Archipelago Sea declined drastically during the
1970s. Instead the amount of annual filamentous algae, e.g. Pilayella littoralis,
Cladophora glomerata and Ceramium tenuicorne, increased (RÖNNBERG 1981). In the
early 1980s the areas with apparently weakened Fucus-vegetation was estimated to be
3500 km². The decline occurred mainly in the middle and outer archipelago zones,
which are directly influenced by water from the open Baltic Sea (RÖNNBERG et al.
1985). An increased turbidity and sedimentation, together with the increased
production of filamentous algae are considered as the direct reasons for the
impoverished Fucus-vegetation (RÖNNBERG 1981). An increase in the occurrence of
F. vesiculosus was seen in the early 1990s (BÄCK et al. 1993), but aerial photography
from the summer 2000 shows a decreasing trend at the same places (HELMINEN et al.
2000). According to KOHONEN et al. (2004), the Fucus-belts further decreased in
width in the outer areas of the Archipelago Sea in the 1990s.
In the Åland waters, long-term changes are observed both in the eastern
archipelago areas and offshore. The macrovegetation in the 1970s and the turn of the
millennium were compared in ROOS et al. (2004). In the 1970s, 26 species of
macroalgae were recorded (RÖNNBERG 1981); three decades later, six species had
disappeared and two were new, which means a total turn-over of 31 %. The increasing
amount of filamentous algae seems to have out-competed more long-lived species
(ROOS et al. 2004).
Around the Åland mainland, 37 species of macrovegetation were detected in
the end of the 1990s. The filamentous algae Cladophora glomerata and Pilayella
littoralis dominated the biomass and abundance together with Chara aspera and
Potamogeton pectinatus (BERGLUND et al. 2003). South of the Åland islands, the
macrophytes at an offshore locality were studied in 1956 and 1993. In almost 40
years, the changes were of a minor extent compared with the studies from the
Archipelago Sea. However, fewer species were recorded in the 1990s. A decline in
the number of perennial deep-water algae and the depth distribution of the most
diverse vegetation has declined with about 8 m (RÖNNBERG & MATHIESEN 1998).
49

Archipelago region
At the Swedish side of the Åland Sea, the distribution of F. vesiculosus has
changed significantly the last century. The maximum depth for attached Fucus- plants
decreased with 3 m from the 1940s to 1984 (KAUTSKY et al. 1986). In the 1940s, the
maximum depth for F. vesiculosus varied between 8.8 and 11.5 m (WÆRN 1952), in
1984 and 1996 between 6.5 and 9 m (KAUTSKY et al. 1986, ERIKSSON et al. 1998).
Plausible reasons to the decline are all related to eutrophication: increased
sedimentation, overgrowth by epiphytic annual algae and increased shading by
plankton (ERIKSSON et al. 1998). According to ERIKSSON et al. (1998), light stress for
both young and mature plants and/or establishment problems for zygotes may be the
reason. The reduced Fucus-belt also corresponds to the declining Secchi depth during
the same period. After 1984 the situation has slightly improved (WULFF & HALLIN
1994). In ERIKSSON et al. (2004), the negative effects of recreational boating and
small ferryboats on the macrovegetation in the Stockholm archipelago are illustrated.
However, F. vesiculosus is positively favoured in that the wave actions keep the
bottoms free from sedimented material (ERIKSSON et al. 2004).
The state of shallow bays in the Stockholm archipelago, Åland Island and
western Gulf of Finland is presented in WALLSTRÖM et al. (2000). That report gives
recommendations for measurements of underwater vegetation and zoobenthos in
shallow areas.
4.8 Ephemeral algae and drifting algal mats Increased phytobenthic production in the archipelago has lead to an increase in
benthic drifting algal mats, presently covering large areas of intermediate depths.
These mats, with an average biomass of 300 g dry weight m-2, or 2000 g wet weight
m-2 (in 1995), are highly oxygen-demanding, and have serious effects on both
zoobenthos and fish (BONSDORFF 1992, NORKKO 1997).
In the Archipelago Sea and in the archipelago of Åland, drifting algal mats
have frequently occurred during the 1980s and 1990s (NORKKO 1997). The drifting
algal masses in the Archipelago Sea range from 1.5 m down to 35 m, with the
thickest, totally anaerobic mats deepest. The drifting algal masses consist mainly of
Cladophora glomerata, Pilayella littoralis and Ceramium tenuicorne. The occurrence
of drifting algal masses was most abundant in the SE corner of the Archipelago Sea.
This is due of the high nutrient load from the Gulf of Finland, good water
transparency and substrates suitable for algal growth (VAHTERI et al. 2000).
50

Archipelago region
The soft-bottoms in the archipelago of NW Åland were periodically, totally or
partly, covered with drifting algal mats at about 70 % of the bottoms down to 10 m
(HOLMSTRÖM 1998). In 1997-2000, mats of drifting algae occurred frequently in the
Åland archipelago (BERGLUND et al. 2003, ROOS et al. 2004). However, the regular
and strong water movements near ferry routes keep the bottoms free from sediments
and drift algae (ROOS et al. 2004).
4.9 Zoobenthos Better waste water treatment improved the situation for the zoobenthos in inner parts
of the Archipelago Sea from the 1950s to the 1980s. Since then the state of the bottom
fauna has reversed. The amphipod Monoporeia affinis has decreased remarkably and
the Macoma-Nereis communities have replaced the former Macoma-Monoporeia
communities. Temperature, dissolved oxygen and sediment organic carbon controls
the zoobenthos. High oxygen concentrations and a good food supply favour
communities dominating by M. affinis. High organic content in combination with
shallow and warmer waters are more suitable for M. balthica (MATTILA 1993,
JUMPPANEN & MATTILA 1994, HÄNNINEN & VUORINEN 2001, BONSDORFF et al. 2003,
O´BRIEN et al. 2003).
In the middle and outer parts studies are scarce, but in some areas both
abundance and biomass have decreased since the 1960s, mostly near fish farming
localities. In the same areas, an increase of the polychaete Marenzelleria viridis has
taken place (HÄKKILÄ et al. 1993, HÄNNINEN & VUORINEN 2001, BONSDORFF et al.
2003, O’BRIEN et al. 2003).
Between the early 1970s and the early 1990s the number of species has
decreased in the Åland archipelago, while faunal abundance and biomass have
increased above 30 m. Between 20 and 40 m depths, the trend has been similar in
inner areas, while the outer, more exposed areas have been in better condition. About
40 % of the species composition has changed since the 1970s and a shift from
suspension feeders to deposit feeders has taken place. M. balthica has increased while
M. affinis has decreased. The distribution of M. affinis has moved further towards the
open sea. (BONSDORFF et al. 1990, 1991, 1997b, NORKKO & BONSDORFF 1994). In the
1990s, the species abundances have been stable, except for the middle archipelago,
where the number of M. viridis and gastropods has increased (PERUS & BONSDORFF
51

Archipelago region
2004). On shallow bottoms drifting algae has caused problems for the fauna, by
inducing hypoxia (NORKKO et al. 2000).
Dead bottoms were found in the Stockholm archipelago since the 1970s
(LINDAHL et al. 1993). The extent of dead bottoms in the end of the 1990s was around
20 % in the inner archipelago (LÄNNERGREN & ERIKSSON 2000). In 1991, Beggiatoa-
mats were reported in inner areas of the Stockholm archipelago between 9 and 50 m
and the evidence for surface or subsurface faunal activity was sparse (ROSENBERG &
DIAZ 1993). The total biomass in the inner archipelago increased in the end of the
20th century (LÄNNERGREN & ERIKSSON 2000). Benthic fauna has been found down
to 20-30 m depths in the inner parts and to 40-60 m depths in the outer parts. The
fauna was dominated of small sized M. balthica, Saduria entomon, Potamopyrgus
antipodarum, M. affinis, oligochaetes and chironomides. M. viridis has increased up
to 10 times since 1996 (STEHN & DROMBERG 1999). According to LÄNNERGREN &
ERIKSSON (2000), the majority of the Stockholm inner archipelago was in good
condition down to 10 m.
4.10 Ichthyofauna The production of fish has increased in the Archipelago region as a consequence of
eutrophication. The catches of perch (Perca fluviatilis), pikeperch (Sander lucioperca)
and cyprinids have increased since the 1980s, also in outer areas both in the
Archipelago Sea and around Åland (JUMPPANEN & MATTILA 1994, ÅDJERS et al.
1997, 2001, HUSÖ BIOLOGICAL STATION 2004). During the same time, the catches of
flounder (Platichthys flesus) have increased compared with the situation in the early
1990s. However, the variations in catches are large, and the results are not significant
(ÅDJERS et al. 2001).
Eutrophication may influence spawning ground for fish negatively, which
seems to be the case for the three spined stickleback (Gasterosteus aculeatus) in the
Archipelago Sea (KOHONEN et al. 2004). Also the economically important Baltic
herring (Clupea harengus membras) today spawns in the outer archipelago instead of
the more eutrophied inner areas (KÄÄRIÄ 1999). In the 1980s, herring spawned down
to 6 m, and in 2000 the spawning depths had decreased to 0.5-2.5 m (VAHTERI &
VUORINEN 2001).
52

Archipelago region
Increases in turbidity and phytoplankton biomass together with a reduced
coverage of submerged vegetation have influenced the fish communities. Ruffe
(Gymnocephalus cernuus) and cyprinids are able to forage in turbid and dim
environment, e.g. in a eutrophied inlet on the Swedish coast of the Archipelago region
(SANDSTRÖM & KARÅS 2002). The recruitment of pike (Esox lucius) has decreased in
the outer archipelago of Åland Island, probably due to the diminishing Fucus
vesiculosus communities (LEHTONEN et al. 2000).
Fish farms (mainly Oncorhynchus mykiss) affect the aquatic ecosystem by a
constant, year-round input of nutrients, which prolongs the season for primary
production and eliminates the natural nutrient limitation (BONSDORFF et al. 1997a).
The distribution of fish farms in the archipelago of SW Finland and Åland cover the
entire area concentrated to the middle and outer regions (HAMMER 2000). According
to the SW FINLAND REGIONAL ENVIRONMENT CENTRE (2004), the annual loads of
nutrients from the ~100 aquacultures in SW Finland and Åland are approximately 274
t nitrogen and 35 t phosphorus. A reduction in production and number of farms, more
environmental friendly policy and development of the feeding system are factors
contributing to a 50 % nominal reduction in loads compared with the beginning of the
1990s (SW FINLAND REGIONAL ENVIRONMENT CENTRE 2004). In the Stockholm
archipelago the fish farms are only about ten and are on average small-scaled
(HAMMER 2000).
4.11 The present situation and suggestions for measurements
The Archipelago region is well studied, which makes the detection of eutrophication-
related changes relatively easy. Based on the available literature, the assessment of
eutrophication in the Archipelago region is presented in Fig. 4.2. Different changes in
macrovegetation can be considered as the most severe problem in the region. In
comparison with the state of chlorophyll a and the phytoplankton production in the
end of the 1990s and today, the situation has improved. The transparency indicates
that the area is in poor condition, which is primary based on the data from the
Archipelago Sea. The situation for the Stockholm archipelago alone would indicate a
“green box” (Fig. 4.2), or moderate changes.
The total load of phosphorus to the Archipelago Sea and the Åland
archipelago in the 1990s was 550 t yr-1 and derivered mainly from the agriculture (50
53

Archipelago region
%), aquaculture (20 %), and scattered dwellings (10 %). The corresponding value for
nitrogen is 7030 t yr-1 and the major sources area agriculture (45 %), municipalities
(25 %), natural leaching (25 %), and aquaculture (10 %; KAUPPILA & BÄCK 2001). In
the Archipelago Sea, the areas near the coast and in closeness to larger islands are
mostly influenced by agriculture. In the central archipelago, the fish farms are the
major source to the nutrient loads (HÄNNINEN et al. 2000). The annual production of
aquaculture in the Åland archipelago stands for 31 % of the local nitrogen load and 65
% of that from phosphorus (ANON. 2003). The environmental conflict and debate of
eutrophication and fish farming industry in the Archipelago Sea, SW Finland are
analysed from an sociological perspective in SALMI & NORDQUIST (2003), PEUHKURI
(2004) and SALMI et al. (2004). The results show a need for a balanced integration of
environmental, cultural and socio-economic factors to benefit water protection
(PEUHKURI 2004).
Fig. 4.2. The conceptual model of eutrophication in the Archipelago region. An improvement in the amount of phytoplankton is detected since 2001 (see Table 2.1 and Fig. 2.2 for explainations).
54

Archipelago region
Dumping and dredging in the Åbo harbour have had serious consequences for
the zoobenthos in the inlet to the town. A shift from suspension to deposit feeders has
taken place (HÄNNINEN & VUORINEN 2001). The intense ferry traffic in the region
causes extra mixing of water, especially in shallow areas. The consequence is an
occasional sedimentation of nutrients, and the material is more available for primary
production (SUOMELA et al. 2000). According to HÄNNINEN et al. (2000), the situation
in the outer Archipelago Sea could, on a long term basis, be improved by international
agreements for the Baltic proper. In the middle archipelago, restrictions for
aquaculture is the simplest measure to decrease local or regional nutrient input. Non-
point source loading from rivers is the main eutrophication inducing factor in the
coastal zones (HÄNNINEN et al. 2000).
The city of Stockholm is the main contributor of wastewater on the Swedish
side. In 2003, the discharges from waste water treatment plants to the Stockholm
archipelago were 1560 t of nitrogen and 23 t of phosphorus, which are less than in
previous years (LÄNNERGREN et al. 2003). Both the methods of cleaning and sewage
treatment need an increase in capacity. KAUTSKY et al. (2000) suggest surveys of the
local loads and long-range circulation planning in every municipality in the
Stockholm archipelago. This is a reasonable goal also for the Archipelago Sea and the
Åland Islands. The water circulation pattern in the Stockholm archipelago is found in
ENGQVIST (2002), and for parts of the Åland archipelago in EILOLA (2002).
55
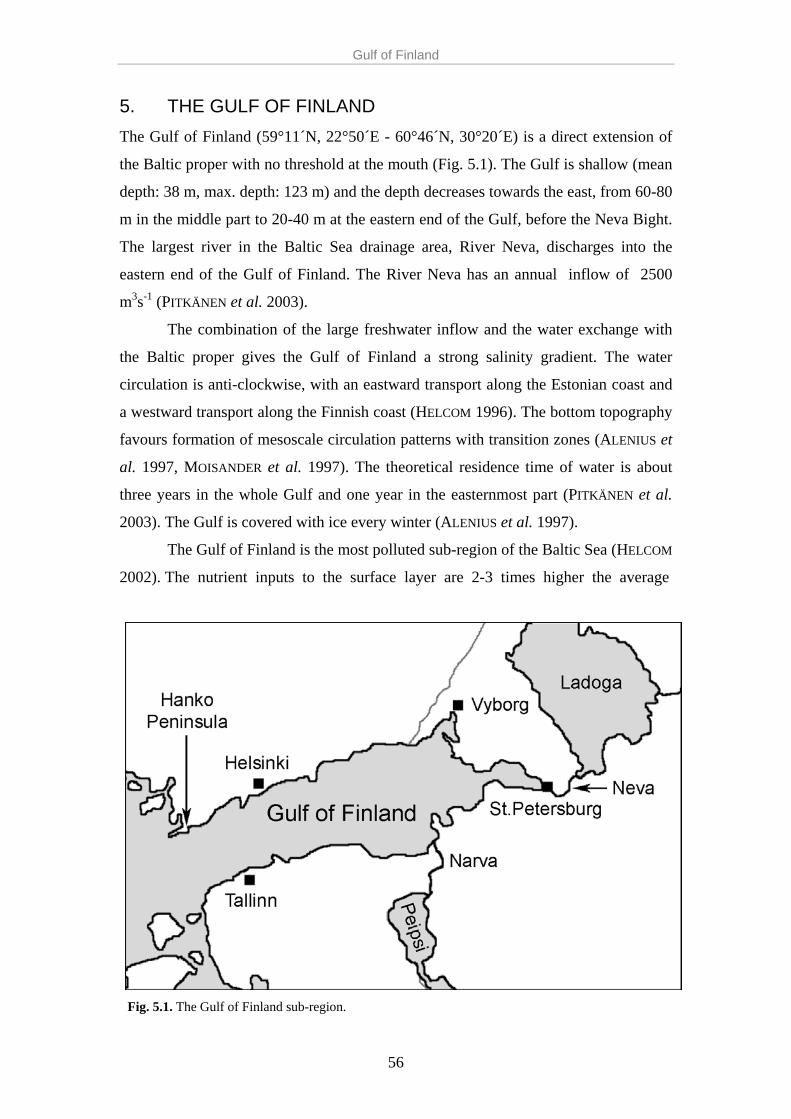
Gulf of Finland
5. THE GULF OF FINLAND The Gulf of Finland (59°11´N, 22°50´E - 60°46´N, 30°20´E) is a direct extension of
the Baltic proper with no threshold at the mouth (Fig. 5.1). The Gulf is shallow (mean
depth: 38 m, max. depth: 123 m) and the depth decreases towards the east, from 60-80
m in the middle part to 20-40 m at the eastern end of the Gulf, before the Neva Bight.
The largest river in the Baltic Sea drainage area, River Neva, discharges into the
eastern end of the Gulf of Finland. The River Neva has an annual inflow of 2500
m3s-1 (PITKÄNEN et al. 2003).
The combination of the large freshwater inflow and the water exchange with
the Baltic proper gives the Gulf of Finland a strong salinity gradient. The water
circulation is anti-clockwise, with an eastward transport along the Estonian coast and
a westward transport along the Finnish coast (HELCOM 1996). The bottom topography
favours formation of mesoscale circulation patterns with transition zones (ALENIUS et
al. 1997, MOISANDER et al. 1997). The theoretical residence time of water is about
three years in the whole Gulf and one year in the easternmost part (PITKÄNEN et al.
2003). The Gulf is covered with ice every winter (ALENIUS et al. 1997).
The Gulf of Finland is the most polluted sub-region of the Baltic Sea (HELCOM
2002). The nutrient inputs to the surface layer are 2-3 times higher the average
Fig. 5.1. The Gulf of Finland sub-region.
56
Gulf of Finland
amount of inputs to the whole Baltic (PITKÄNEN et al. 1997, 2001). The largest loads
of nutrients and organic matter deriver from the River Neva and the town of St.
Petersburg in Russia (~ 5 million inh.; PITKÄNEN et al. 1993, 1997, LEPPÄNEN et al.
1997). The Neva Estuary acts as an effective trap for nutrients and autochthonous
POM, thus regulating the trophic conditions in the whole Gulf (PITKÄNEN 1991,
CONLEY et al. 1997, PANOV et al. 2002). In the beginning of the 20th century, the
Neva Estuary was an oligotrophic system (TELESH et al. 1999). The intensification of
the agriculture started later in the eastern Baltic Sea region and the population density
was low (SCHERNEWSKI & NEUMANN 2005). Although, according to references in
PITKÄNEN et al. (1993), effects of eutrophication were suggested during spring bloom
already in the 1910s.
Besides the St. Petersburg area, other nutrient sources in the Gulf of Finland
are the Helsinki/Helsingfors region (~ 1 million inh.), River Kymijoki/Kymmene älv
and the town of Kotka (60.000 inh.) region in Finland, the town of Vyborg (80.000
inh.) in Russia, and the town of Tallinn (400.000 inh.) and the River Narva, including
the waste water from the town of Narva (80.000 inh.), in Estonia (PITKÄNEN et al.
1993).
On the HELCOM list of environmental hot spots in the Baltic Sea catchment
area in February 2004, the Gulf of Finland is represented with 14 hot spots. The
sources are mainly municipal waste from the Helsinki region and industrial and
municipal pollution from four hot spots in Estonia and nine hot spots in the St.
Petersburg region (HELCOM-HOT SPOTS 2004).
5.1 Secchi depth The water transparency in the Gulf of Finland has decreased linearly with 40 %, from
approximately 8 to 5 m during the period 1905-2004 (LAAMANEN et al. 2004). In the
western Gulf, east of the Hanko peninsula, the average transparency in the early 1990s
was 4 m (KIIRIKKI 1996), which is classified as good (Table 2.1). According to
references in JUMPPANEN & MATTILA (1994), the Secchi depth in the same area in
1914-1939 had an average value of 9 m.
Along the Finnish coast at the end of the 1990s, the Secchi depth in the inner
archipelago was 1-3 m, and 3-5 m in the outer archipelago. In the innermost bay in
Helsinki, the water transparency in summer 1998 varied between 0.1 and 0.5 m.
57

Gulf of Finland
(PELLIKKA & VILJAMAA 1999). The Secchi depth in the Vyborg Bay in 1996 was 1 m
in the inner areas and increased to 2.5-3.5 m further out (LEHVO & BÄCK 2000).
Recordings from the Neva Estuary in 2000 gave a transparency around 2 m
(NIKULINA 2003).
5.2 Salinity The salinity has strong horizontal and vertical gradients in the Gulf of Finland,
forming horizontal density fronts. Fronts are important convergence areas where
material accumulates and affects the redistribution of discharged material in the sea
(ALENIUS et al. 1997).
The surface salinity in the Gulf of Finland varies from 0 to 6.5 psu from east to
west (PITKÄNEN et al. 1993, ALENIUS et al. 1997). In August 2002, an inward flow of
saline water from the Baltic proper gave salinities of 9-10 psu in the deepest bottoms
in the south-western Gulf. In the shallower northern coast, the bottom salinity was 6-7
psu (PITKÄNEN et al. 2003).
The larger salt water intrusion to the Baltic Sea in the winter 2002/2003 was
still not recognised in the Gulf of Finland in the summer 2004 (SYKE 2005). The
influx in 1993 increased the salinity in the Gulf of Finland during the period 1995-
1998, which coincided with a decrease in oxygen and increase in phosphate
concentrations (KAHRU et al. 2000).
Vertical mixing during autumn storms may break the salinity stratification
down to the bottom in the deep parts of the eastern Gulf (PITKÄNEN et al. 1993, 2003).
5.3 Oxygen The general trend for the deep water oxygen in the period 1970s-1990s was increasing
from late summer concentrations of 3-5 ml l-1 to 7-9 ml l-1 (PITKÄNEN & VÄLIPAKKA
1997). There were no advectional inflows of saline water, which gave a weaker
stratification in the deep layers (ANDERSIN & SANDLER 1991).
The trend ceased in the 1990s, when a strong stratification of the water column
caused reduced conditions in an extended area in the Gulf of Finland. Large quantities
of nutrients, especially phosphorus, were released from the bottoms (PITKÄNEN et al.
2001, LEHTORANTA 2003). In PITKÄNEN et al. (1993) the lowest values (30-50 %)
were measured in the semi-enclosed basins in the Finnish archipelago. In August
58

Gulf of Finland
1998, the oxygen saturation in the waters off Helsinki varied between 75 and 100 %
in the innermost areas and declined further out to 25-50 % (PESONEN 1999). In the
summer of 1996, anoxic bottoms were partly present in the Finnish archipelago (~300
km²). The situation was probably similar in the whole central basin of the eastern
Gulf, in areas deeper than 40 m (~3000 km²) and in the deep parts of the outer Neva
Estuary (PITKÄNEN & VÄLIPAKKA 1997, KAUPPILA & BÄCK 2001).
Surveys of the bottom conditions in the Finnish coastal waters of the Gulf of
Finland show very poor oxygen condition during the latest years. In 2001, 17 % of the
investigated stations had oxidised sediments. After a mixing event in the autumn of
2001, 53 % of the investigated bottoms were oxidised in August 2002. In the summer
of 2003, the situation was again reversed, and 73 % of the bottoms were reduced
(HELCOM 2003b, KANGAS et al. 2003, HAAHTI & KANGAS 2004). The oxygen
conditions have further deteriorated, and in 2004 only 13 % of the investigated
bottoms were oxidised. However, hydrogen sulphide was recognised only in the inlet
to the Gulf of Finland, whereas H2S occurred at all the deep bottoms in 2003 (SYKE
2005).
Variations in bottom water oxygen concentrations are likely to have large
effects on nutrient recycling processes in the Gulf of Finland (CONLEY et al. 1997).
Under good oxygen conditions, the eastern Gulf of Finland can effectively retain land
based nutrient fluxes. Thereby the nutrient input to the rest of the Gulf and the Baltic
proper is reduced (PITKÄNEN et al. 1993, PITKÄNEN & TAMMINEN 1995). The deeper
western Gulf is more sensitive to reduced conditions since it is under direct influence
of the deep saline inflow from the Baltic proper (PITKÄNEN et al. 2003).
5.4 Nutrients The winter concentrations of nutrients in the Gulf of Finland are among the highest in
the whole Baltic Sea area (HELCOM 2002). The nutrient concentrations in the Neva
Estuary are two times higher (tot-N: 600 µg l-1, tot-P: 40 µg l-1) compared to the open
eastern Gulf of Finland. Concentrations of both nutrients decrease from east to west
already in the inner estuary. Dissolved fractions of nutrients are stored below the
mixed surface layer (PITKÄNEN et al. 1993).
In August 2002, the south western part of the Gulf of Finland had high values
of both inorganic nitrogen and phosphorus. The extreme concentrations of ammonium
59

Gulf of Finland
(400-800 µg l-1) were found in the north west, along the Finnish coast, while nitrate
and nitrite were highest (200-400 µg l-1) in the Neva Estuary. Phosphate has the
highest concentrations (400-800 µg l-1) in the coastal zone of the Finnish part of the
Gulf (PITKÄNEN et al. 2003). The following summer, 2003, the nitrogen
concentrations were stable or had slightly increased, but the phosphorus values in the
bottom water had further increased. The southern coast of the Gulf had medium high
values, 19-25 µg l-1, and the northern coast high values, 25-31 µg l-1. Since the end of
the 1990s, the increase is about 60 % (HAAHTI & KANGAS 2004, BALTIC SEA PORTAL
2004).
Nitrogen is the limiting factor for primary production in the Gulf of Finland
(PITKÄNEN 1991). The N:P ratio of the benthic nutrient fluxes is low in the coastal
Gulf of Finland (PITKÄNEN et al. 2001). The external load of phosphorus to the Gulf
of Finland has decreased by 30 %, or 3400 tons, in the 1990s (LEHTORANTA 2003).
The interannual change in the phosphate content was 11.000 t in the winter 2001-
2002, whereas the estimated annual net influx of phosphorus is about 8000 t to the
Gulf of Finland (PITKÄNEN et al. 2003). However, the concentration of P in the water
has increased, due to the high degree of internal phosphorus released from the
sediment under reduced conditions. The concentrations in the bottom water are high,
especially in late summer. The P-rich water is generated to the rest of the water
column during the next spring bloom (LEHTORANTA & HEISKANEN 2003). According
to LEHTORANTA & HEISKANEN (2003), the biogeochemical processes of phosphorus
play an important role for the trophic state of the Gulf of Finland, especially for the
summer bloom of cyanobacteria.
The total amount of phosphorus and nitrogen off the coast of Helsinki in the
late 1990s are high to very high (Table 2.1) in the innermost areas and medium high
in the open sea. In the inner areas, the tot-P and tot-N reached levels of 29-110 µg l-1
and 370-1400 µg l-1, respectively. Further out, in the open sea, the tot-P was 22 µg l-1
and the tot-N was 320 µg l-1 (PELLIKKA & VILJAMAA 1999, PESONEN 1999). In the
1970s, the water quality off Helsinki varied between fair to poor in inner areas and
between satisfactory and good in the open sea (PESONEN 1999).
60
Gulf of Finland
5.5 Primary production and chlorophyll a The chlorophyll a concentrations in the coastal waters usually range between 4 and 10
µg l-1, and in the open waters below 4 µg l-1. High chlorophyll a concentrations (> 10
µg l-1) are regularly measured in the inner bay areas off the towns of Helsinki,
Porvoo/Borgå and Vyborg. In the more open and deep Estonian coast, chlorophyll a
concentrations vary around 5 µg l-1 in summer but in shallow bays the concentrations
may be higher (LEPPÄNEN et al. 1997). MOISANDER et al. (1997) found that changes
in the concentration of chlorophyll a coincided with the salinity fronts in a transect
from Helsinki and westwards to the Baltic proper.
In 2004, the content of chlorophyll a in the open Gulf was 2-4 µg l-1 and in the
Finnish archipelago 4-6 µg l-1 (BALTIC SEA PORTAL 2004), which is classified as
medium high to very high (Table 2.1). The concentrations were higher compared to
year 2003 (SYKE 2005). An increasing gradient from the eastern Gulf of Finland
towards the Neva Estuary is seen, with values from 5.3 to 14.7 µg l-1 (PITKÄNEN et al.
1993, TELESH et al. 1999). Chlorophyll a concentrations in Neva Bay were lowest in
the north eastern part and highest in the southern part, averaging at 9.7 (±5.2) µg l-1
for the whole Neva Bay. In the southern Neva Bay, the chlorophyll a concentration
has increased with 40 % since the early 1980s (TELESH et al. 1999). Increased values
were measured also from the Kymijoki Estuary and some other loaded inner bays
(PITKÄNEN et al. 1993).
The primary production of plankton in the Neva Bay in 1982-1996 was
0.7±0.2 g C m-2d-1, in the eastern Gulf of Finland 0.3-0.7 g C m-2d-1. In general,
primary production of plankton in the Neva Bay in 1996 was 2.7 times higher than in
the 1980s (TELESH et al. 1999). Even if the planktonic primary production is almost
doubled in the inner than in the outer Estuary, the rate of decomposition of organic
matter is the same (GOLUBKOV et al. 2003). In the open Gulf of Finland, the level of
in vitro phytoplankton primary productivity varied from 5 to 8 mg C m-3h-1 in the late
summer 1990. Elevated values, generally from 10-20 mg C m-3h-1, were measured in
the Neva Estuary and in the Finnish archipelago (PITKÄNEN et al. 1993).
5.6 Phytoplankton and algal blooms Cyanobacteria are favoured in stratified waters (KANOSHINA et al. 2003). In the Gulf
of Finland, the dominant phytoplankton groups are cyanobacteria, dinoflagellates and
61

Gulf of Finland
flagellates (HELCOM 1990, 1996). The horizontal salinity gradient determines the
distribution of the species, but the marine species are few with low biomasses even in
the open Gulf (KAUPPILA et al. 1995). Aphanizomenon spp and Nodularia spumigena
are the most common species of cyanobacteria in the western part of the Gulf
(MOISANDER et al. 1997), while the limnic Planktothrix agardhii dominates in the
eastern part (KAUPPILA et al. 1995, HELCOM 1996). Blooms are formed in late
summer and autumn, but in the Neva Estuary dense phytoplankton aggregates are
found during the entire growth season (MOISANDER et al. 1997). In the Neva Bay,
most of the phytoplankton species have their origin in Lake Ladoga (KAUPPILA et al.
1995).
Russian monitoring data indicated an increase of cyanobacterial blooms in the
eastern Gulf of Finland (excluding the Neva Bay) in the late 1980s. Especially the
filamentous, non-heterocystic Planktothrix spp increased (KAUPPILA et al. 1995). The
cyanobacterial blooms were exceptionally intense in the Gulf of Finland in the
summers of 1997 and 1999. Due to the wind directions and upwelling, the northern
Gulf of Finland suffered the most in 1997, while the largest algal aggregates occurred
in the southern Gulf in 1999 (KANOSHINA et al. 2003). In 2002, a strong bloom of A.
flos-aquae occurred in the inner Neva Estuary (NIKULINA 2003). The algal biomass in
the summer 2004 was over the long-term average, the bloom was most intense in the
inlet to the Gulf of Finland (BALTIC SEA PORTAL 2004, SYKE 2005).
5.7 Macrovegetation The eutrophicated water in Tallinn Bay has caused changes in the species composition
of the bottom vegetation. Compared to the 1970s, the share of green algae has
increased two to three times. The share of the epiphytic brown algae Pilayella
littoralis has increased as well. In the same area the amount of Fucus vesiculosus has
declined. The red algae make up less than 35 % of the total amount of algae. Their
share decrease towards the east, due to the salinity. The percentage of both brown and
green algae increases eastwards (KUKK et al. 1997).
F. vesiculosus has a salinity range between 3 and 6 psu from the Virolahti Bay
in the east to the Hanko peninsula in the west in the Gulf of Finland. The optimum
depth for Fucus was 2 m. The maximum depth, 6.5 m, was reached outside the Hanko
peninsula in the western Gulf (BÄCK & RUUSKANEN 2000). The eelgrass, Zostera
62
Gulf of Finland
marina, occurs at its limit of distribution (5-7 psu) in the western Gulf of Finland. The
species creates patches of 1-10 m in diameter outside the Hanko peninsula, where Z.
marina is the dominating macrophyte since the Fucus-belt has declined during the
latest decades (BOSTRÖM et al. 2002).
In the coastal waters east of Helsinki, the amount of eutrophication favoured
algal species has increased from 1984 to 1997, but the total number of species has
been reduced, probably due to the eutrophication process in the eastern Gulf of
Finland (SAARNIO 1998, LEHVO & BÄCK 2001). The species, which are referred to, are
Polysiphonia violacea, Furcellaria lumbricalis, Chorda filum, Dictyosiphon
chordaria and Cladophora rupestris (SAARNIO 1998).
5.8 Ephemeral algae and algal mats In the summer of 1996 small patches - maximum size 10 m², 2-30 cm thick - of
drifting algae were found at about 30 localities at 1-10 m depth between Helsinki and
eastwards to the Vironlahti Bay in the coastal area in the northern Gulf of Finland.
(LEHVO & BÄCK 2001).
In the Neva Bay, decaying macrophytes have accumulated on the shores after
the construction of a storm-surge barrier in the early 1990s, which changed the
hydrodynamics in the bay. Cladophora glomerata is the dominant filamentous algae
in the Neva Estuary. Excessive amounts (recordings of 2 tons wet weight per 100 m
shoreline) of decaying C. glomerata spoiled on the beaches, cause serious recreational
problems in the Resort District of St. Petersburg. These algal mats enhance the growth
of macrophyte beds on the beaches (PANOV et al. 2002, ref. in GOLUBKOV et al.
2003).
5.9 Zoobenthos The benthic communities at a shallow (3 m) and a deeper (35 m) station off the Hanko
peninsula in the western Gulf of Finland were studied by Segerstråle in 1928 and
revisited in 2000 (LAINE et al. 2003). In 70 years, the snapshots of the benthos show
more similarity between the shallow and deep station in 2000 than in the 1920s. The
shallow station has changed from a Corophium volutator-Macoma balthica-
Chironomidae dominating community to a community only dominated by M.
balthica. The total abundance has declined, and of 14 species recorded in 1928, only
63

Gulf of Finland
three was found in 2000. The total species number in 2000 was 8. At the deeper
station, the Monoporeia affinis community had changed to a dominance of M.
balthica. In 1928, 90 % of the abundance consisted of M. affinis, compared to less
than 5 % in 2000. Of 7 species found in 1928 and 5 in 2000, 4 of them were common
(LAINE et al. 2003).
Except for the central part of the Gulf of Finland, in the 1960s and 1970s the
faunal abundances in the Gulf of Finland were generally low. The benthic
communities were dominated by Pontoporeia femorata and M. balthica. Below 70 m
the bottoms were more or less devoided of fauna (ANDERSIN et al. 1978, LAINE et al.
1997). The conditions for the zoobenthos improved considerably during the period
1987-1994, and P. femorata and M. affinis dominated the communities at 60-80 m. In
1996-1997, the fauna collapsed due to hypoxia (LAINE et al. 1997, LAINE &
ANDERSIN 1998). In the end of the 1990s, 7 species were found in the deep bottoms of
the Gulf (LAINE 2003).
In August 2001, most of the investigated stations at the Finnish-Russian
boarder in the Gulf of Finland lacked macrofauna (PITKÄNEN et al. 2003). M. affinis
and P. femorata occurred in small numbers compared to the densities in the early
1990s, found in LAINE et al. (1997). According to references in PITKÄNEN et al.
(2003), the benthos recolonisated the deeper areas of the central and eastern Gulf of
Finland in 2002. However, in a survey along the Finnish coast in the summer 2004
only 5 of 45 stations have rich and diverse benthic communities (SYKE 2005). The
fauna associated in Zostera marina meadows in the north western Gulf of Finland has
increased three times in abundance compared to the 1970s, which also indicate a
serious degree of nutrient over-enrichment in the Gulf (BOSTRÖM et al. 2002).
In the Neva Estuary, oligochaetes and chrionomides dominate in the inner
estuary, and the crustaceans M. affinis and Saduria entomon in the outer (GOLUBKOV
et al. 2003).
5.10 Ichthyofauna In the eastern part of the Gulf of Finland, 53 species of fishes and cyclostomes are
recorded, 19 of which are marine and only 5 are considered commercial (KUDERSKY
1997). The catches of herring (Clupea harengus membras) in the Gulf of Finland have
decreased in the beginning of the 2000s. After a peak in the sprat (Clupea sprattus)
64
Gulf of Finland
catches in 1999, they have decreased too (HAAHTI & KANGAS 2004). Declining
salinity, which influences abundances of marine zooplankton and cod, affects the
herring stock in the Gulf of Finland (RÖNKKÖNEN et al. 2004).
The stocks of whitefish (Coregonus lavaretus), pike (Esox lucius) and
flounder (Platichthys flesus) have also decreased, especially in the other archipelago
areas (LEHTONEN et al. 2000, LAPPALAINEN et al. 2001, PITKÄNEN 2004). On the
contrary, the roach (Rutilus rutilus) stock has increased in the western Gulf of Finland
during the last 20 years. Roach and perch (Perca fluviatilis) are the dominating fresh
water species in the inner archipelago. The abundance of perch has been stable since
the 1970s, while roach has strongly increased in the outer archipelago (LAPPALAINEN
et al. 2001).
5.11 The present situation and suggestions for measurements The main problems and consequences of the eutrophication process in the Gulf of
Finland are shown in Fig. 5.2. The high external and internal nutrient loads give a
high phytoplankton production and a high rate of sedimentation. The transparency and
oxygen condition in the bottom water are harmed, which leads to consequences for
macrovegation, invertebrates and fish. The availability for harmful algal blooms is
also enhancing. In the spring of 1992, toxic cyanobacteria are thought to have caused
mass extinctions in seabirds in the eastern Gulf of Finland (KAUPPI 1993). The decline
of the zoobenthos has continued since the assessment made in 2001 (RÖNNBERG
2001).
The load of nutrients to the Gulf of Finland is 2-3 times higher than in the
entire Baltic Sea. In the easternmost Gulf, the factor is 5 (PITKÄNEN et al. 1997,
2001). The annual external nutrient load to the Gulf of Finland is 6400 tons of total
phosphorus and 120.000 tons of total nitrogen. About 70 % of the phosphorus and 50
% of the nitrogen are derivered from the easternmost part of the Gulf (KIIRIKKI et al.
2003). However, the nutrient loads to the Gulf of Finland have decreased with 30 %
and the load of organic material with 50 % since the 1980s (PITKÄNEN et al. 1997).
Political and economic changes in the 1990s in Russia and Estonia decreased
the agricultural and industrial production and thereby the amounts of nutrients. The
use of fertilizers and amount of animals in livestock breeding decreased abruptly.
Also in Finland the use of fertilizers has decreased since the early 1990s (PITKÄNEN et
65

Gulf of Finland
al. 1997, KIIRIKKI et al. 2003). In the late 1990s, the main anthropogenic source for
nutrients (36 % of P, 20 % of N) in the Gulf of Finland was derivered from
municipalities (PITKÄNEN et al. 1997). The further reduction in Estonia is mostly due
to the improvement of the waste water treatment plant in Tallinn (PITKÄNEN 2004).
According to LÄÄNE et al. (2002), only a small part of the measures was due to an
active water protection. A historic view of the development of the wastewater
treatment in Helsinki is found in LAAKKONEN (2001) and LAAKKONEN & LEHTONEN
(1999).
Since the late 1980s, the loads to the Gulf of Finland from Finland are stable
(~800 t P, ~30.000 t N in 2000). The Russian and Estonian loads are decreasing (for
Russia: ~5000 t P, ~75.000 t N, for Estonia: ~500 t P, 10.000 t N in 2000). In the
Fig. 5.2. The Gulf of Finland is most serious eutrophied of the sub-regions of the Baltic Sea (see Table 2.1 and Fig. 2.2 for explainations).
66

Gulf of Finland
period 1997-2000, the load from Russia was stable, while loads from Estonia
decreased and the Finnish loads increased slightly. The atmospheric load decreased
slightly since the 1980s, and was ~17.000 tons in 2000 (KIIRIKKI et al. 2003). St.
Petersburg is still the largest source for bioavailable phosphorus and the River Neva
the largest source for bioavailable nitrogen in the Gulf (PITKÄNEN et al. 2001).
Models that examine ecosystem processes for the Helsinki sea area is presented in
KORPINEN et al. (2004), and for the Gulf of Finland in KIIRIKKI et al. (2001, 2003).
The nutrients from the Neva River and St. Petersburg area are mainly
derivered from municipalities and industries. The town of St Petersburg had three
major waste water treatment plants partly in function in 2000. The main industrial
sectors are metal and machine building. Only 11 % of the rural area outside St.
Petersburg is used for farming (KIIRIKKI et al. 2003). The resort area in the shallow
northern part of the Neva Estuary and but also hydraulic constructions have a heavy
anthropogenic impact of the state of the environment (NIKULINA 2003). According to
PANOV et al. (2002), the nuisance growth of Cladophora glomerata is an appropriate
indicator for the effectiveness of the management action in the Neva Estuary.
Together with the eutrophication, oil spills and ecosystem effects of
introduced species are other urgent problems for the Gulf of Finland (TELESH et al.
1999, PANOV et al. 2002). A significant increase in oil pollution after the construction
of new ports can also be a very serious problem, The capacities of the ports in the
Neva Estuary will increase in the near future and are estimated to exceed 100 million
ton yr-1 by 2010 (ref. in PANOV et al. 2002). In 2003, 40 oil spills were detected.
However, the sea traffic is increasing and the oil transportation probably will double
until 2010 (HAAHTI & KANGAS 2004).
5.12 Multiple use of monitoring data; case studies from the Gulf
of Finland The nutrient over-enrichment and its effects are well-studied in the Gulf of Finland.
However, much of the research has been concentrated either to the open sea area (e.g.
PERTTILÄ et al. 1995, CONLEY et al. 1997) or to the easternmost part and the Neva
Estuary (e.g. TELESH et al. 1999, PITKÄNEN et al. 2001, LEHTORANTA et al. 2004).
The eutrophication in small estuaries along the Finnish coastline is described and
analysed using limnological models in MEEUWIG et al. (2000) and KAUPPILA et al.
(2003). The archipelago area, which is an important transition zone between the coast
67

Gulf of Finland
and the open sea, has been studied less thoroughly. The topography, circulation
patterns and local anthropogenic inputs affect the archipelago ecosystem directly on a
local scale (BONSDORFF et al. 1997a). Therefore, the coastal zone is not comparable
with the open sea, but its functions are vital for a complete understanding of the
aquatic ecosystem.
Multivariate techniques have been used to detect long-term trends and overall
assessments of environmental data in e.g. ZITKO (1994) and PARK & PARK (2000).
These methods identify patterns in long-term water quality data in a way where actual
relationships among independent variables appear (ZITKO 1994). By following the
principles of APPELGREN & MATTILA (2002), data from the environmental monitoring
programme from the Finnish coast to the Gulf of Finland is used in paper IV in order
to detect local and regional patterns in the eutrophication process. Long-term (1980-
2002) data from 23 sampling localities, which cover an area from the town of
Hamina/Fredrikshamn (60º15´N 27º15´E) to the archipelago west of the Hanko
peninsula (59º52´N 22º52´E; paper IV), are studied. The aim was to see how the
physico-chemical and biological parameters in the waterbody formed zonation
patterns in space and time.
The results indicate that the eutrophication has been an accelerating process in
the study area during the entire period studied. Only a few exceptions, where point-
source nutrient reductions from land have been effective, were noted. Both in time
and space, the innermost areas of the Finnish coast to the Gulf of Finland are more
negatively affected to eutrophication than the outer archipelago areas. The oxygen
concentration is the driving element in the current analyses. A clear zonation pattern
from the coastal regions towards the open sea is evident, whereas differences between
the eastern and western coastal areas of the Finnish part of the Gulf of Finland were
non-existent.
Proposeful environmental monitoring is an essential tool to determine status,
detect trends and take accurate measures against threats to the aquatic environment.
However, it is important to remember that heterogeneity and variability in the data
material may mask changes in both trends and analyses (BOESCH 2000).
Environmental data has some characteristic properties that make it difficult for
analysing and modelling. Monitoring programmes usually consist of heterogeneous
and large data sets with a range of uncertainty. By using a fuzzy logic approach
68

Gulf of Finland
uncertain knowledge is allowed. Fuzzy rules allow a combination of linguistic
statements and numerical data (CHEN & MYNETT 2003, ADRIAENSSENS et al. 2004).
An attempt to use a fuzzy logic rule-based approach to interpret monitoring
data from the Gulf of Finland is currently under calibration. This test is a co-operation
between marine biologists and computer scientists. By fuzzy-clustering, the data set is
placed within a number of clusters according to degree of membership (BEXDEK
1974). Briefly: the clusters are based on rules of the type: if (input variables), then
(fuzzy conclusion; SUGENO & YASUKAWA 1993). In this case the input criteria are a
number of physico-chemical water quality data (total phosphorus and nitrogen in the
surface water, tot-P in the bottom water, oxygen concentration in the bottom water,
turbidity and chlorophyll a). We have primarily tested bottom water oxygen as the
output variable, but chlorophyll a is another alternative. We have used the input
values from year x-1 and the output value from year x, i.e. the output value is
measured from the year after the input values. The data is finally defuzzyfied
(membership function computed from the rule bases) to deliver an output signal,
which can be compared with the true value, in this example the oxygen concentration
a given year. Based on this model, the defuzzification can be used for any water
quality data. The output is equivalent to a prediction value.
Our experience from testing the data set from paper IV indicates that precise
prediction values are difficult to obtain. But in a managemental opinion the certainty
with exact predictions on a 0.1 decimal level are not of interest. Rather, an appropriate
classification of the output values seem to be of priority. In predicting the oxygen
situation for the forthcoming summer, classes such as 0-2 ml O2 l-1, 2-4 ml l-1, 4-6
ml l-1, and > 6 ml l-1 could be suitable for management. If the model can give
successful predictions in a short-term perspective, it would be a simple tool for
decision-makers to forecast the water quality situation the following summer; i.e. to
provide a service to local inhabitants.
Ecological data are complicated to utilise. It is impossible to consider all
factors that influence e.g. the oxygen condition. Besides the input variables given
above, currents, water circulation, precipitation and discharges from land, as well as
wind and temperature conditions are examples of aspects that may govern oxygen
conditions. Predictions always include a degree of uncertainty, and the decision-
makers sometimes have to rely on the best educated guesses of the experts (ELLIOTT
2002a). But it is better to be aware of the uncertainty than to believe the real world is
69

Gulf of Finland
artificially precise (ENEA & SALEMI 2001). For successful results, we need large data
sets with high variability in the material. If the model can deliver reliable estimates, it
could be an additional tool in MARE´S NEST (MARE 2005).
70

Gulf of Riga
6. THE GULF OF RIGA The Gulf of Riga (57°00´-59°00´N, 22°00´-24°30´E) is semi-enclosed, situated inside
the Estonian Saaremaa island, and connected to the Baltic proper by the Muhu (Suur
Sound) and Irbe Sounds (Fig. 6.1). The Irbe Sound is wide and about 20 m deep,
while the Muhu Sound is narrower. The volume of the Gulf is 424 km³, which
corresponds to 2.1 % - the smallest sub-basin - of the Baltic Sea. The Gulf of Riga has
an open coastline and few islands and banks (BERZINSH 1995). The mean depth is 26
m, and maximum depth is > 60 m (BERZINSH 1995, HELCOM 1996, WASSMANN &
TAMMINEN 1999a). The annual inflow of fresh-water to the Gulf is estimated at 36.2
km3 yr-1 (LAZNIK et al. 1999). The River Daugava flows into the Gulf through the
town of Riga. Other rivers discharging to the Gulf of Riga are Lielupe, Gauja, Pärnu
and Salaca (BERZINSH 1995, LAZNIK et al. 1999, WASSMANN & TAMMINEN 1999a).
The water from the Baltic proper enters cyclonically into the Gulf along the
southern side of the Irbe Sound and flows along the eastern coast towards the north.
During summer the situation may be the opposite (BERZINSH 1995, ANON. 1999b).
The small water volume and the restricted water exchange make the Gulf of Riga
sensitive to pollution (STÅLNACKE & WASSMANN 2000).
Fig. 6.1. The Gulf of Riga sub-region.
71

Gulf of Riga
There is good long-term data from the Gulf of Riga, beginning with Russian
hydrochemical investigations in 1908 (SUURSAAR 1995). In 1993-1997, the Gulf of
Riga was thoroughly studied within the Gulf of Riga Project, which is published in
WASSMANN & TAMMINEN (1999b).
Urbanisation and intense industrial and agricultural activities in the catchment
area started in the 1950s, and have caused an elevated anthropogenic loading
(OJAVEER 1995, YURKOVSKIS 1998). Recent studies have shown that the nutrient
loads to the Gulf of Riga have been relatively stable during the 1990s. The political
changes in the countries surrounding the Gulf of Riga have altered and reduced both
land use and industrial production. The Gulf of Riga has also a large buffering
capacity. The flat landscape and the large wetland areas together with a long retention
time in soil and groundwater prevent the nutrients from directly entering the Baltic
(STÅLNACKE & WASSMANN 2000, STÅLNACKE et al. 2000). In HELCOM-HOT SPOTS
(2004), 10 hot spots are found in the catchment area of the Gulf and two on the
western Estonian coast, north of the Muhu Sound. All the hot spots are either derived
from industries or municipalities (HELCOM-HOT SPOTS 2004).
6.1 Secchi depth The water transparency in the Gulf of Riga has decreased significantly from 1963 to
1990. In 1963, the average Secchi depth in August was over 5 m in the open part of
the Gulf and declined to 4 m in 1990 (BERZINSH 1995). According to BERZINSH
(1995), maximum transparencies are found in the centre of the Gulf, in the deep-water
zone in the northern region and in the Irbe Sound. In the shallow zone of the southern
Gulf and in the inner Pärnu Bay, the Secchi depth values are lowest. In May 2000, the
open Gulf of Riga had an average transparency of 3.7 m. Near the river mouths, the
visibility was only 1 m (UNIVERSITY OF LATVIA 2003).
6.2 Salinity The Gulf of Riga has no halocline and the vertical salinity distribution in the water
column is usually uniform (OJAVEER 1995). A slow outflow of surface water along
the northern part of the Irbe Sound and a deep inflow of Baltic proper surface water
along the southern part of the sound create a slow current system. This system is
72

Gulf of Riga
separated by a salinity front, also called the Irbe Front, which makes the mean salinity
1.5-2.0 psu lower than the surface water in the Baltic proper (BERZINSH 1995).
The amplitude of the annual salinity in the Gulf varies from 5.2 psu in the end
of the 1920s to 6.4 psu in 1977 (BERZINSH 1995). According to KOTTA et al. (2004),
the average salinity in Pärnu Bay has gradually decreased from 6.3 psu 1972 to 5.5
psu in 1989. In 1994-1997 the salinity ranged from 4.8 to 5.7 psu (OJAVEER et al.
1999), and was around 5 psu in 2000 (UNIVERSITY OF LATVIA 2003).
Changes in the salinity influence the Gulf both directly and indirectly. If the
salinity is high enough for presence of e.g. cod (Gadus morhua), the interactions
between species may change the structure of the whole ecosystem (OJAVEER 1995).
6.3 Oxygen Strong currents, regular water exchange with adjacent sea areas, and weak
stratification in the Gulf of Riga, have guaranteed good aeration of the bottom water
layers. The environment in the Gulf has generally not suffered from anoxic
conditions, which has granted possibilities for the adaptation of species requiring high
oxygen concentrations. During the recent decades, under anthropogenic influence,
oxygen content in the bottom layers has shown a clear decreasing tendency in the
autumn, but the formation of H2S has not been observed (BERZINSH 1995, OJAVEER
1995).
In the deepest part of the Gulf, the oxygen decline was significant in 1963-
1984; the mean decrease during summer was about 0.07 ml l-1 yr-1 (HELCOM 1990).
The oxygen concentration in the deepest layer, at 30-50 m, had a value of about 6.7
ml l-1 in 1964 and about 4.3 ml l-1 in 1990 (BERZINSH 1995). Both in August 1999 and
May 2000, the oxygen content in the bottom waters in the northern Gulf of Riga was
above the long-term average (UNIVERSITY OF LATVIA 2003).
6.4 Nutrients The trophic level of the Gulf of Riga has increased in general during the last 20 years,
and the consequences of anthropogenic eutrophication are evident (SUURSAAR 1995).
From 1974 to 1990, the tot-P increased almost 1.4-fold and the trend for
nitrate was even steeper, with a two-fold increase (YURKOVSKIS 1998). The nitrate
content in the 1950s was about 56 µg l-1 and has since then increased to about 210-
73
Gulf of Riga
280 µg l-1 in the 1990s (SUURSAAR 1995). A decline in nitrate concentrations took
place 1990-1996, followed by a new enrichment phase in 1996-2000. Phosphate has
constantly increased from 1975 to 2000 (YURKOVSKIS & MÜLLER-KARULIS 2003).
In July 1994, the average tot-P value was 18.3 µg l-1 and tot-N 320 µg l-1
(TAMMINEN & SEPPÄLÄ 1999), which are considered as low values (Table 2.1). The
highest values were found in the southern part of the Gulf (TAMMINEN & SEPPÄLÄ
1999). In spring 2000, the nutrient concentrations were slight above the long-term
average in the open Gulf of Riga, from 22-84 µg l-1 tot-P, low to very high values, and
434-588 µg l-1 tot-N, medium high to high values (Table 2.1, UNIVERSITY OF LATVIA
2003).
The Gulf of Riga has a high rate of denitrification. Therefore, the stored
nitrogen has decreased together with the decline in nutrient inputs during the 1990s.
Phosphorus is only lost by export to the Baltic proper (YURKOVSKIS & MÜLLER-
KARULIS 2003). The pool of nutrients has a seasonal variation in the Gulf of Riga, but
the water mass is mainly nitrogen-limited (WASSMANN 2004).
6.5 Chlorophyll a and primary production The average chlorophyll a concentration in the surface layer of the Gulf varied
broadly each season, during the period 1972-1991: 4.6-24.6 µg l-1 in spring, 0.9-5.2
µg l-1 in summer, and 1.1-15.2 µg l-1 in autumn (JANSONE 1995). According to ANON.
(1999a), values exceeding 5 µg l-1 in August are considered very high. From 1992 the
chlorophyll concentrations began to decrease (HELCOM 1996, YURKOVSKIS 1998,
KOTTA et al. 2004). The chlorophyll a levels in the surface area of River Daugava has
remained high (TAMMINEN & SEPPÄLÄ 1999). The summer chlorophyll a
concentration started to increase again in 1997, and had a mean value of 5 µg l-1 in
2000 (LATVIAN ENVIRONMENT AGENCY 2004). In August 2002, the central Gulf of
Riga had a chlorophyll a content of 4 µg l-1, which corresponded to the average for
the period 1992-2001 (HELCOM 2003a).
The Gulf of Riga has a high primary production, 350 g C m-2yr-1, due to an
efficient regeneration of nutrients in a relatively shallow area with weak vertical
stratification (ANON. 1999b). The productivity is highest near the mouths of the
Rivers Daugava and Pärnu, and near the coast of Saaremaa Island, where waters of
different salinities meet (OJAVEER 1995, SUURSAAR 1995). The daily plankton
74

Gulf of Riga
productivity had an average of 1353 mg C m-2d-1 during July-August in the southern
and central Gulf of Riga in 1991-1997 (WASMUND et al. 2001).
6.6 Phytoplankton and algal blooms “Blooming of water” was described for the first time in the Gulf of Riga in 1847
(Eichwald 1847, 1852 in KUKK 1995). Cyanobacteria blooms have became frequent
in the Gulf of Riga since the end of the 1980s (KAHRU et al. 1994, TENSON 1995,
YURKOVSKIS 1998). The N2-fixation by cyanobacteria is about 6900 tons per year
(ANDRUSHAITIS et al. 1995) and the phytoplankton biomass has increased from 8.2 %
in 1979-1990 to 20.3 % in 1991-1996 (YURKOVSKIS 1998). However, the renewal is
fast in the free water masses in the Gulf and the algal blooms are therefore more
limited compared with other eutrophicated areas (STÅLNACKE & WASSMANN 2000).
The community of cyanobacteria in the Gulf is dominated by the potentially
toxic Aphanizomenon flos-aquae and to a lesser degree of Nodularia spumigena
(TENSON 1995, YURKOVSKIS 1998). References in TENSON (1995) mention that
already in the 1910s, A. flos-aquae occurred in amounts which resembled of “green
porridge”, but still in the 1960s the species was not frequent in the area. The
dinoflagellate Dinophysis acuminata and the diatom Actinocyclus octonarius are
examples of other dominant phytoplankton species in the Gulf of Riga (HELCOM
1996, YURKOVSKIS et al. 1999).
The long-term changes in species structure of phytoplankton in summer seem
to be mostly determined by nutrient availability. When the concentration of inorganic
nitrogen declined in the early 1990s, the abundance of N2-fixing cyanobacteria rose
(YURKOVSKIS et al. 1999). According to YURKOVSKIS (1998), the cyanobacteria
blooms are either a cause or a consequence of high summer values of phosphorus in
the surface layer. In 2002, the occurrences of cyanobacteria in the Gulf of Riga were
low compared to other regions in the Baltic (HELCOM 2003a).
6.7 Macrovegetation The southern Gulf of Riga has poorer vegetation than the northern area, partly due to
the sandy bottom substrate (KUKK 1995, MARTIN 1999). Except for the Pärnu Bay
and areas in the southern Gulf of Riga, the phytobenthic community is in good
condition (KAUTSKY et al. 1999). Furcellaria lumbricalis is the most frequent red
75

Gulf of Riga
algae in the Gulf, and among brown and green algae, Pilayella littoralis and
Cladophora glomerata are dominating (KUKK 1995, HELCOM 1996, KOTTA & ORAV
2001).
However, several species have disappeared when conditions in the 1980s were
compared to investigations in the 1920s, and even in the early 1970s (KUKK 1995,
HELCOM 1996, ANON. 1999b). For example in the northern part of the Pärnu Bay, the
number of phytobenthos taxa has decreased with 11 species since the 1950s (KUKK
1995, HELCOM 1996, MARTIN 2000). In 2001, no perennial vegetation was found in
the Pärnu Bay. In the southern coast of Saaremaa Island, the Fucus-population has
started to recover again (MARTIN et al. 2003).
In the west Estonian archipelago, north of the Gulf of Riga, Fucus vesiculosus
and Zostera marina have naturally sparse occurrences (MARTIN & TORN 2004).
6.8 Ephemeral algae and drifting algal mats Filamentous green algae have increased intensively in the Gulf of Riga, and the
overgrowing of algae by epiphytes has increased as well (KUKK 1995, HELCOM 1996,
MARTIN 2000). The occurrences are mainly found in areas with high industrial and
municipal pollution load (KUKK 1995). Close to the River Daugava, KAUTSKY et al.
(1999), have only observed annual plants. During the 1990s, Fucus vesiculosus has
been replaced by filamentous brown algae in the northern Gulf (MARTIN 2000).
Drifting algal mats, in patches of 10-20 cm in diamter, are observed at least in
1997 and 2000 in the west Estonian archipelago after mass growth of Pilayella
littoralis (MARTIN et al. 2003).
North of the Gulf of Riga, in the Kassari Bay (the southern Hiiumaa Island),
unique, loose-lying communities of the red algae Furcellaria lumbricalis and
Coccotylus truncatus occur on shallow soft-bottoms since the early 1960s (MARTIN &
KUKK 1999, MARTIN & PAALME 2003). In the latest years, the loose-lying algae have
formed a secondary substrate for filamentous algae, such as P. littoralis (MARTIN &
KUKK 1999, KOTTA & ORAV 2001).
6.9 Zoobenthos The abundance of benthos in the Gulf of Riga had increased four times in 10-15 years,
when the period 1958-1963 and the 1970s were compared. Especially worms and
76

Gulf of Riga
crustaceans increased (ANDRUSHAITIS et al. 1995, CEDERWALL et al. 1999). In the
central Gulf, there has been a sharp decline in abundance during the latest decade,
from 8207 ind. m-2 in 1989 to 6 ind. m-2 in in 2000. For the coastal areas, the trend is
opposite: 546 ind. m-2 in 1991 and 3249 ind. m-2 in 2000 (LATVIAN ENVIRONMENT
AGENCY 2004). According to KOTTA et al. (2003), 6 species of zoobenthos were
found in the Pärnu Bay in 2001.
The increase in the biomass is a consequence of the increase of Monoporeia
affinis, Macoma balthica and Marenzelleria viridis. M. affinis was the dominating
zoobenthos species during the 1980s, but has since then decreased in abundance. The
non-indigenous species M. viridis was first found in 1988 and became the most
important species during the 1990s (ANDRUSHAITIS et al. 1995, CEDERWALL et al.
1999). The Gulf of Riga has generally a lower benthic biomass compared to the Baltic
proper, as the bivalve Mytilus edulis is lacking. Close to River Daugava, the low
animal biomass is dominated by omnivores (KAUTSKY et al. 1999).
Changes in the faunal communities seem, at least partly, to follow prevailing
oxygen concentrations. The observed increase in biomass during 1950-1980 is likely
an effect of eutrophication (ANDRUSHAITIS et al. 1995, CEDERWALL et al. 1999).
Together with the nutrient enrichment, the climate may also influence the benthos in
the Gulf of Riga (DIPPNER & IKAUNIECE 2001).
6.10 Ichthyofauna The Gulf of Riga has been one of the most important fishing areas in the Baltic Sea.
The surface area constitutes only about 4 % of the whole Baltic Sea, but in the 1960s
the fish catches were 12 % (50.000-90.000 tons) of the total catches in the Baltic. In
the 1990s the share had decreased to 3 % (20.000-30.000 tons). Altogether more than
70 fish and cyclostome species have been found in the Gulf of Riga. About 35 species
are abundant, 17 are rare (OJAVEER, E. 1995, 2002, OJAVEER & GAUMIGA 1995).
The Baltic spring spawning herring (Clupea harengus membras) is the best
adapted marine fish in the Gulf of Riga. However, due to the eutrophication, the
herring has started to spawn at lower depths, probably because of higher turbidity and
lower oxygen concentrations in the bottom water, which has lead to changes in
structure and decrease in the vegetation that serve as substrates for the eggs (OJAVEER
& GAUMIGA 1995, GAUMIGA et al. 1997, OJAVEER, E. 2002).
77

Gulf of Riga
Further examples where the deterioration of oxygen and other pollution effects
have affected the fish populations are eelpout (Zoarches viviparus) and smelt
(Osmerus eperlanus). The reproduction and nursery areas of the eelpout have been
disturbed since the 1980s, and the fishery was forbidden. Since the 1990s, a limited
annual catch quota is allowed. Toxic pollution of a Soviet air base in the River Pärnu
resulted in mortality in the smelt population. After the closure of the base the
abundance of smelt larvae has increased (OJAVEER & GAUMIGA 1995, GAUMIGA et al.
1997, OJAVEER, E. 2002).
The abundance and catches of the adaptable and relatively pollution tolerant
perch (Perca fluviatilis), have increased (OJAVEER & GAUMIGA 1995, GAUMIGA et al.
1997). However, the stocks of pikeperch (Sander lucioperca) and perch have recently
been overexploited, and an increase in abundance of their prey organisms are seen
(OJAVEER, E. 2002).
Besides eutrophication, the coastal fishery influences the state of the ichthyo-
fauna in the Gulf of Riga (ATIS et al. 2003). According to ATIS et al. (2003), changes
in age structure of commercially important species are more a result of the fishery
than of eutrophication. An increase in cormorants (Phalacrocorax carbo) in the
northern Gulf of Riga is also a potential pressure for the fish stocks (OJAVEER, E.
2002).
6.11 The present situation and suggestions for measurements The Gulf of Riga has been regarded as one of the most eutrophic sub-basins in the
Baltic Sea. After the “Gulf of Riga Project” in 1993-1997, the statement seems to be
false. The environmental status in the Gulf of Riga is not worse than in the Baltic Sea
in general (STÅLNACKE & WASSMANN 2000, WASSMANN 2004). This is indicated by
comparisons of the nutrient concentrations in the Gulf of Riga and other regions in the
Baltic (LAZNIK et al. 1999, TAMMINEN & SEPPÄLÄ 1999). The buffering capacity
limits occurrences of excessive cyanobacterial blooms (WASSMANN 2004).
The present situation in the Gulf of Riga in relation to the eutrophication is
exemplified in Fig. 6.2. Based on my assessment of recent published data, the state of
the Gulf of Riga has improved since the end of the 1990s. Better oxygen conditions as
well as recoveries in macrovegetation and fish stocks are evident.
78

Gulf of Riga
However, the nutrient loads from the rivers, mainly Daugava and Lielupe, still
contribute to an overall eutrophication in the area (WASSMANN 2004). LAZNIK et al.
(1999) estimated the average annual riverine load of nutrients to the Gulf of Riga in
1977-1995 to 113.300 tons of N and 2050 tons of P, which corresponds to 80 % N
and 68 % P of the total load of respective substance. According to LATVIAN
ENVIRONMENT AGENCY (2004), approximately 12 % of the nitrogen and 8 % of the
phosphorus that enter the Gulf of Riga reach the Baltic proper.
Fig. 6.2. The conceptual model of the Gulf of Riga. In the recent years, improvment in the oxygen condition and the state for the fishes have occurred (see Table 2.1 and Fig. 2.2 for explainations).
About 40 % of the drainage area is used for agricultural production, with the
centre in the rural areas around the Lielupe and Pärnu Rivers (LAZNIK et al. 1999).
The agricultural production and the use of fertilizers had a sharp decrease in the
drainage area after the collapse of the Soviet era in 1989 (HELCOM 1996, LÄÄNE et al.
79

Gulf of Riga
2002). According to STÅLNACKE & WASSMANN (2000), the breakdown and
reconstruction of the agriculture in Estonia, Latvia, Lithuania and Russia is the most
remarkable in the modern history of Europe. These countries have achieved a point-
source reduction between 40 and 80 % from 1980 to 1995 (LÄÄNE et al. 2002).
Besides the reduction in fertilizers, declines in the use of manure, pesticides, and milk
and meat production are seen in the agriculture. The development in the industry is
similar. On the other hand, the maritime traffic and the numbers of cars have
increased (BERNET 2000b, JUHNA & KLAVINS 2001). For example in Latvia, the
numbers of cars increased from 66 per 1000 inhabitants in 1980 to 214 in 1999
(JUHNA & KLAVINS 2001).
Improvements and extensions of the biological and chemical treatment in the
wastewater purification plant in Riga were ready in 1991 (JUHNA & KLAVINS 2001).
In BERNET (2000b), only 25 % of the wastewater in the county of Pärnu is treated
according to standard.
Except for Russia, the drainage area of the Gulf of Riga is now under the
legislations of the European Union. The same practises for an environmentally
sustainable development should be followed as in the rest of the EU. However, there
are also worries that the agriculture and forestry will start to increase again, which
will lead to higher loads of nitrogen to the Gulf of Riga (BERNET 2000a, STÅLNACKE
& WASSMANN 2000). A drastic numerical experiment, run for 15 years with a 50 %
reduction in terrestrial nutrients loads to the Gulf of Riga, showed that the primary
production would decrease by only 20 % in 12 years. Reduction of only phosphorus
resulted in a 6 % decrease in primary production. On the other hand, a reduction in P
would lead to a decline in cyanobacteria blooms and a export of phosphorus to the
Baltic proper (SAVCHUK 2002).
80

Gulf of Gdansk
7. THE GULF OF GDANSK REGION, including the Curonian and
Vistula Lagoons The Gulf of Gdansk is an open bay in the southern Baltic Sea. The lagoons of Vistula
and Curonia are connected to the Gulf of Gdansk by narrow and shallow straits
(54°20´-55°40´N, 18°30´-21°15´E) (Fig. 7.1).
In the western part of the Gulf of Gdansk, the Puck Bay (surface area: 104
km², mean depth: 3 m, max. depth: 9 m) is situated (CISZEWSKI et al. 1991, 1992a).
The shallow bay is sheltered from the open Baltic by a sand spit, the Hel peninsula.
Within the Puck Bay a sandbar and its shallow, underwater extension create the Puck
Lagoon. The Lagoon has a permanent connection with the rest of the Bay. The well-
mixed Vistula Lagoon (surface area: 838 km², mean depth: 2.6 m) is found in the
eastern part of the Gulf of Gdansk, on the Polish-Russian boarder (ANDRULEWICZ
1996, KWIATKOWSKI et al. 1997).
The Curonian Lagoon (surface area: 1610 km², mean depth is 3.8 m), north of
the Vistula Lagoon, is situated on the boarder between Lithuania and Russia. The
Lagoon is limnic except for the northernmost part, which is affected by water from the
Baltic during stormy inflows through the Klaipeda Strait (OLENINA & KAVOLYTE
1997, SHTUKOVA & JASHINSKAITE 1997). The Klaipeda Strait is also the outlet of the
River Nemunas/Njemen, which accounts for 98 % of the river water discharge to the
Curonian Lagoon (OLENIN et al. 1999).
Fig. 7.1. The Gulf of Gdansk sub-region with the most impor-tant geographic names.
81

Gulf of Gdansk
The Gulf of Gdansk drainage basin covers an area of 323.200 km² and is the
catchment areas of several rivers, mainly Vistula/Wisła and Pregel (ANDRULEWICZ
1996). The River Vistula has the second largest drainage basin among the Baltic
rivers. The majority of the catchment area lies in Poland, the rest in Belarus, the
Slovak Republic and Ukraine (KWIATKOWSKI et al. 1997). The River Vistula
transports approximately 75 % of the pollutants that enter the Baltic Sea from Poland
(ANDRULEWICZ 1996). The biggest cities round the Gulf of Gdansk are Gdansk
(462.000 inhabitants) and Gdynia (255.000 inh.) in Poland and the Russian
Kaliningrad (435.000 inh.). The drainage area to the Gulf of Gdansk is heavily
industrialised, which the number of HELCOM hot spots gives evidence of. A total of 43
hot spots of industrial and municipal wastes and agricultural runoff are listed from the
Nemunas and Vistula river basins and the coasts of Lithuania, Kaliningrad and Poland
(HELCOM-HOT SPOTS 2004). Together with waste from municipalities and industries,
mineral fertilizers used in agriculture are the main problem in the Kaliningrad area.
From the Polish coast there is no agricultural land draining into the Gulf of Gdansk,
even if 60 % of the area is used for agriculture (RUDLICKA et al. 2003). The Gulf of
Gdansk region is thus regarded as a highly eutrophicated area, with the large-scale
growth of filamentous brown algae and high concentrations of chlorophyll a as main
indicators (KRUK-DOWGIALLO 1996, OLENINA & KAVOLYTE 1997).
7.1 Secchi depth The water transparency in the Gulf of Gdansk and the Curonian Lagoon in the late
1990s can be classified as low to very low (Table 2.1), with variations between 0.6
and 2.5 m (OCHOCKI et al. 1995, OLENIN et al. 1999). The water is most turbid in the
Curonian Lagoon during summer algal blooms (OLENIN et al. 1999). The Puck
Lagoon has the most transparent water in the region, even if it is influenced by
discharges from the River Vistula (MATCIAK 1997). In the period 1971-1987, the
Puck Lagoon had an average Secchi depth of 5.5 m, which means sight down to the
bottom (CISZEWSKI et al. 1991, RENK et al. 1991).
7.2 Salinity Trends for long-term salinity in the Gulf of Gdansk and the Gdansk Deep show an
increase in salinity from the beginning of the 20th century to the end of the 1970s.
82

Gulf of Gdansk
After the 1970s, periods with decline in salinity and density are due to long-lasting
stagnations. Since the 1990s, the salinity has been unstable due to, on one hand, the
oceanic inflows in 1993 and 2003 and, on the other, freshwater inflows and increased
precipitation (CYBERSKA & KRZYMINSKI 1996, HELCOM 2003b, RUDLICKA et al.
2003). The salinity in the surface layer in the Gdansk Basin varies between 4 and 7.5
psu, with small or no changes since the 1980s (ANDRULEWICZ 1996, CYBERSKA &
KRZYMINSKI 1996).
In the Curonian Lagoon the salinity is more unstable, depending on wind
speed and direction, intensity of the outflow from the Lagoon and water level
fluctuations. The value can change rapidly, from > 6.5 to < 0.5 psu (reference in
OLENIN et al. 1999), and the average annual salinity is 3.6 psu (OLENINA &
KAVOLYTE 1997, OLENIN et al. 1999).
7.3 Oxygen The Gulf of Gdansk suffers from oxygen deficiency especially in late summer-early
autumn. During the stagnation period in 1977-1992 the halocline weakened and
atmospheric oxygen penetrated into the deep water layers, which improved the
oxygen situation (RUDLICKA et al. 2003). In 1989-1993 the oxygen content ranged
from 10 % in shallow waters of the Gulf and increased further out to the Gdansk
Deep. The oxygen concentration in the intermediate water layer decreased from 80-90
% in the end of the 1970s to 40-50 % in the early 1990s (TRZOSINSKA & ŁYSIAK-
PASTUSZAK 1996). The Gdansk Deep was free from hydrogen sulphide in 1989-1994.
During the 1990s, the oxygen conditions in the surface water of the Gulf of Gdansk
were considered good (CISZEWSKI et al. 1991, RUDLICKA et al. 2003). In the bottom
water layers in late summer the oxygen concentration has been alarmingly poor since
the 1970s. From the 1990s onwards the oxygen trend has been significantly negative
(ŁYSIAK-PASTUSZAK et al. 2004). According to OLENIN et al. (1999) the Klaipeda
Strait is generally normoxic, but oxygen deficiency may occur during calm and warm
days in the harbour inlet.
During the period 1998-2001, strong oxygen depletion was recorded annually
in all regions of the Polish coastal zone. The minimum oxygen concentration had a
mean value around 2 ml l-1 in the Vistula Lagoon and 1.5 ml l-1 in the Gulf of Gdansk
(RUDLICKA et al. 2003). Extremely warm water with a little content of oxygen in the
83

Gulf of Gdansk
summer of 2002 removed all hydrogen sulphide from the Gdansk Basin within some
months. Consequences of the saline inflows in the beginning of year 2003 were
detectable in the Gdansk Deep during the spring of 2003. However, severe oxygen
deficiency occurred in the bottom waters in the inner Gulf of Gdansk in August 2003
(HELCOM 2003b and references therein).
7.4 Nutrients In late 1980s, the concentrations of nutrients in the Puck Lagoon were rather low
compared to data from the rest of the Gulf of Gdansk or the open Baltic Sea.
CISZEWSKI et al. (1991) gives the values of 189 µg l-1 for tot-N and 30 µg l-1 for tot-P.
According to Table 2.1, the tot-N can be considered as normal, but the concentration
for tot-P is high. Outside the Curonian Lagoon, the concentrations of tot-N varied
from 140 to 2950 µg l-1 in late summer during the early 1990s (OLENINA &
KAVOLYTE 1997). Overall, the total phosphorus in the Gulf of Gdansk reached a peak
in 1991 with 50 µg l-1, but has thereafter decreased drastically and is relatively stable.
The summer concentration in 2000 was 16 µg l-1 on the contrary, the total nitrogen
has increased since the beginning of the 1990s and was 280 µg l-1 in 2000 (RUDLICKA
et al. 2003). A decreasing trend in winter nutrient concentrations is also detectable
(ŁYSIAK-PASTUSZAK et al. 2004).
According to budget calculations for the Gulf of Gdansk in WITEK et al.
(2003), the water residence time in the area is only 15 days, which makes the system
insensitive to long-term trends and variations in river loads. The removal of tot-N and
–P was thus estimated to 20 and 35 %, respectively (WITEK et al. 2003).
7.5 Chlorophyll a and primary production The Gulf of Gdansk is a productive area with an annual primary production of 200
g C m-2 or higher (LORENZ et al. 1991, OCHOCKI et al. 1995, KWIATKOWSKI et al.
1997, WITEK et al. 1999). The chlorophyll a concentrations have decreased
considerably since the end of the 1980s (LATALA 1997). The highly polluted Vistula
Estuary has got the highest chlorophyll a concentration in the Gulf of Gdansk with
values between 60 and 120 µg l-1 (KWIATKOWSKI et al. 1997). The semi-enclosed
inner Puck Bay is isolated from the rest of the Gulf, and has thus the lowest
chlorophyll a levels (LATALA 1997). The chlorophyll a concentration in the Curonian
84

Gulf of Gdansk
Lagoon varies between 10 and 100 µg l-1 (OLENINA & KAVOLYTE 1997).
Concentrations over 5 µg l-1 are considered as very high (Table 2.1). The mean annual
chorophyll a concentration in the high sea of the southern Baltic was only 1.8 µg l-1 in
1999, and 2 µg l-1 in 2000. In 2001 a further increase was recorded (RUDLICKA et al.
2003).
7.6 Phytoplankton and algal blooms The growing season of spring phytoplankton species in the Gulf of Gdansk begins in
March (HELCOM 1996, TRZOSINSKA & ŁYSIAK-PASTUSZAK 1996). Dominating
cyanobacteria species are Aphanothece clathrata, Nodularia spumigena and
Aphanizomenon flos-aquae. In the northern part of the Gulf of Gdansk region, the
species composition is very similar to that found in the Gdansk Deep (CISZEWSKI et
al. 1992b, WRZOLEK 1996). The summer 2003 had strong occurrences of
cyanobacterial blooms in vast areas of the Baltic proper, and especially the Gulf of
Gdansk (HELCOM 2003b).
In the Curonian Lagoon, including the Klaipeda harbour area, algal blooms is
a regular phenomenon. The peak in phytoplankton biomass was recorded in October
1999 with 252 mg l-1 in the open waters of the lagoon, and nearly 2000 mg l-1 as
extreme value (OLENINA & OLENIN 2002). Usually the blooms begin in May and
consist of diatoms. In June-July the cyanobacteria start to bloom, the most abundant
species is A. flos-aquae and the bloom may last to the end of October (OLENIN et al.
1999). Blooms of Nodularia spumigena were exceptional in the summers of 2001 and
2002. During the twenty latest summers, the biomass of A. flos-aquae reached
hyperbloom condition (> 100 mg l-1) seven times in the Curonian Lagoon. These
events co-incided with intense use of fertlisers and the sharp drop in the use of
fertlisers in post-Soviet time (OLENINA & OLENIN 2002).
6.7 Macrovegetation The Gulf of Gdansk, and especially the Puck Lagoon with its geomorphological and
hydrological conditions, is a unique biotope for macrophytes (CISZEWSKI et al.
1992a). The number of plant taxa in the Puck Lagoon in the 1950s was 80, with the
brown algae Fucus vesiculosus and Furcellaria lumbricalis as dominants (CISZEWSKI
et al. 1991, 1992b, KRUK-DOWGIALLO & PEMPKOWIAK 1997). According to KRUK-
85

Gulf of Gdansk
DOWGIALLO (1996), between 1957 and 1971, 60 % of the biomass in the bottom
vegetation consisted of these two species and the eelgrass Zostera marina. However,
increasing discharges from land resulted in a continuous deterioration of the bottom
vegetation, and in the end of the 1970s the former dominating species started to be
replaced by filamentous brown algae. In the period 1977-1992, the number of taxa
decreased to 28, and species of Ectocarpus and Pilayella covered 70 % of the bottom
(CISZEWSKI et al. 1991, 1992b, KRUK-DOWGIALLO 1996, KRUK-DOWGIALLO &
PEMPKOWIAK 1997, and references therein).
In 1996-2000, 36 species of macrovegetation were noted in the Gulf of
Gdansk, 16 species of which were Chlorophytes, 5 Phaeophytes, 7 Rhodophytes and 8
vascular plants. The dominant species was Ectocarpus siliquosus followed by
Cladophora species and P. littoralis. The occurrence of F. vesiculosus and the red
algae Polysiphonia violacea increased during the time period (PLIŃSKI & JÓŹWIAK
2004). In the Puck Bay, 19 plant species was present in 2001. Rhodophyceae and
Chlorophyceae formed the largest groups, four species of Fucophyceae were found
(RUDLICKA et al. 2003).
The meadows of vascular plants have also changed significantly, the very best
example being Zostera marina. In 1950s Z. marina formed meadows in the Puck Bay
down to 10 m. In the period 1969-1971 the meadows were still dense, but in the 1980s
the coverage was largely reduced (CISZEWSKI et al. 1992b). Today Z. marina still
prevails in a small area in the northern Puck Bay (KRUK-DOWGIALLO 1996 and
references therein). It is not only the species composition that has changed, also the
total phytobenthos biomass has decreased, and in 1979-1987 the reduction was 15 %
(KRUK-DOWGIALLO 1996 and references therein).
A project, lead by professor Lena Kautsky, Stockholm University, tried to
reintroduce the F. vesiculosus vegetation in Puck Bay faster by transplantation. Poor
transparency, dense growth of filamentous algae and turbulence in the water were
factors that made the project not succeeded. Only 10 % of 750 transplanted plants in
1999-2000 remained one year later (BERGER 2001).
Occurrences of drifting algal mats have not been reported from the Gulf of
Gdansk region so far.
86

Gulf of Gdansk
7.8 Zoobenthos According to a recent report, the muddy bottoms of the Gulf of Gdansk have a
diversity of 3-14 species of macrozoobenthos (RUDLICKA et al. 2003). Irregular
variations in species number are mainly due to the state of oxygen and presence of
hydrogen sulphide (JANAS et al. 2004).
In the mid 1990s, the sediments were inhabited by 10-18 species of fauna in
the coastal zone down to 30 m despite the presence of H2S. Bivalves were the general
dominants (OSOWIECKI 1991, OSOWIECKI & WASZOCHA 1996, JANAS et al. 2004). In
the end of the 1990s the abundance and biomass decreased both at shallow and deep
stations. Bivalves, such as Macoma balthica and oligochaetes, the polychaete Nereis
diversicolor, snails of Hydrobia spp and the crustacean Diastylis rathkei are found
annually since the beginning of the 1980s, even if the abundance of M. balthica is
heavily reduced. Saduria entomon and Corophium volutator appear very infrequently
and only in small numbers (RUDLICKI et al. 2003, JANAS et al. 2004).
In the northern and central hydrodynamically active parts of the Curonian
Lagoon, the fauna is both abundant and diverse according to OLENIN (1996). The area
is structured of Dreissena polymorpha and Valvata spp communities. In the southern
stagnated area of the Lagoon an impoverished macrofauna community was found
between 1980 and 1992, represented by deposit feeders, primarily chironomids and
oligochaetes (OLENIN 1996).
7.9 Ichthyofauna In the mid-1960s, eel (Anguilla anguilla) represented 45 % of the fish caught in the
Puck Bay. Pike (Esox lucius) was the second most caught fish during that time.
During the latest years of the 1960s, the catches of those species decreased, and today
they correspond only to some percent of the total sum (CISZEWSKI et al. 1992b).
Roach (Rutilus rutilus) was the substitute, and had an enormous increase in the end of
the 1970s when it contributed to over 90 % of the catches (CISZEWSKI et al. 1992b).
The number of three-spined stickleback (Gasterosteus aculeatus) also reached mass
occurrences (CISZEWSKI et al. 1991).
The changes in the fish communities can be seen as a consequence of the
reduction in the underwater meadows in the Puck Bay. In the 1980s, mass mortalities
of eel and flatfish took place (CISZEWSKI et al. 1991, 1992b). However, during the last
87

Gulf of Gdansk
years, small improvements in the ichthyofauna have been recorded in the Gulf of
Gdansk, most probably due to the construction of new wastewater treatment plants.
Species as mackerel (Scomber scombrus), sword fish (Xiphias gladius) and sole
(Solea solea) that have been disappeared are found more frequently. Even sturgeon
(Acipenser sturio) has been observed in Latvian waters after a break of over 50 years
(RUDLICKA et al. 2003).
The sandy bottoms in the Puck Lagoon and the open coastline of the Gulf of
Gdansk are ideal habitats for gobiid species. A new gobiid for the Baltic Sea, the
round goby Neogobius melanostomus, was first recorded near the Hel peninsula in
1990. The species has its origin in the Caspian Sea, and has spread to the entire Gulf
of Gdansk (HORACKIEWICZ & SKORA 1998). The goby feeds on herring spawn, which
may become a threat to the herring stock in the area (RUDLICKA et al. 2003). In the
summer of 2003, the round goby was the dominant species together with perch (Perca
fluviatilis) in the Puck Bay. Outside Hel, flounder (Platichthys flesus) dominated the
biomass (ALMQVIST et al. 2003).
7.10 The present situation and suggestions for measurements The state of the eutrophication situation for the Gulf of Gdansk is presented in the
model in Fig. 7.2. The Vistula River, Vistula Lagoon, wastewater treatment plants,
industries in Gdansk and Gdynia, and atmospheric deposition are the main sources of
nutrient pollution in the Gulf of Gdansk (ANDRULEWICZ & WITEK 2002). In 2001, the
annual load of total nitrogen from the Odra, Vistula and other coastal river basins to
the Baltic Sea was 183.171 tons, and 12.281 tons for phosphorus. A decline of 12 %
and 21 %, respectively, has taken place since 1997. Hence, a slight improvement of
the water quality in the Polish rivers is seen, even if the low river runoff also is a
reason for the decrease. The discharges of heavy metals, chlorides and sulphates have
also decreased in comparison with the loads in 1990 (RUDLICKA et al. 2003).
According to ANDRULEWICZ et al. (2004a), the main actions for a further
improvement of the water quality are found in an overall reduction of nutrients loads
and effective sewage treatment in the Gulf of Gdansk drainage area, as well as
restoration of the underwater meadows and reintroduction of lost macrovegetation in
the Puck Lagoon.
88

Gulf of Gdansk
The reappearance of many fish species is an indication for an improvement of
the environment. Also the sanitary conditions on Polish beaches are better. In 2000-
2001 all beaches at the coast of central and western Poland were open. Despite the
positive signs in the water quality in the Gulf of Gdansk and overall the Polish coastal
waters, the concentrations of nutrients are still high. The most serious is the situation
in the lagoons and bays. Poland is one of the countries with the highest output of
mineral resources and fossil fuel. The hard coal mining industry is the single most
important polluter of the surface water (RUDLICKA et al. 2003). In the mid-1990s, still
860 towns in Poland lacked a sewage treatment plant and only 100 towns had
mechanical treatment. The situation for the industries was similar. The poor quality of
Fig. 7.2. The conceptual model for the Gulf of Gdansk. Hypoxia and damages to macrovegetation are the main problems for the area (see Table 2.1 and Fig. 2.2 for explainations).
89

Gulf of Gdansk
the water in Poland is mainly a result of the untreated water from the industry
(POLAND´S MINISTRY OF ENVIRONMENT, 1997). However, today 80 % of the beaches
of the Polish coast to the Gulf of Gdansk are open for bathing, compared to none in
the 1980s (ANDRULEWICZ & WITEK 2002).
In the beginning of the 1990s, as a consequence of the end of the communistic
era, the Polish agriculture collapsed, which has lead to clear reductions in the input of
nutrients to the Baltic Sea (BERNET 2000a). The use of energy, management of water
and raw material, and reductions in emissions has improved since the 1990s
(RUDLICKA et al. 2003). When the agricultural and forestry production will increase, it
is important to apply environmentally sustainable practises of measures in
legalisations, technology and economy (BERNET 2000a, RUDLICKA et al. 2003). Since
Poland is now a member of the European Union, the Polish legislation system has to
be standardised with the EU. Achievements for reducing the outlets to the Baltic Sea
are of special priority (BERNET 2000b). The engine and vehicle fuel consumption have
on the other hand increased (RUDLICKA et al. 2003).
The Kaliningrad area is densely populated and highly urbanized (BERNET
2000b). Since the beginning of the 1990s there has been a decline in the agricultural
production and the use of fertlisers, the wastewater load decreased with 60 %, and
total phosphorus with 70 % from 1994 to 1999 (BERNET 2000b, OLENINA & OLENIN
2002). However, the total phytoplankton abundance within the last two decades in the
central part of the Curonian Lagoon has increased (OLENINA & OLENIN 2002).
Introduction of biological treatment in the municipal treatment systems, clean
technology in pulp and paper industries and improved methods for wastewater,
manure and cattle burial grounds in the agriculture are examples of measures to be
taken (BERNET 2000b).
90

Swedish East-Coast
8. THE SWEDISH EAST-COAST; from the Himmerfjärden Bay
to the Hanö Bay The coastal region along the Swedish coast to the central Baltic Sea is here separated
to a region of its own. The assessment of the Swedish east-coast is mainly based on
data from the Himmerfjärden Bay, south of Stockholm, and the Hanö Bay inside the
Bornholm Basin. The St. Anna´s Archipelago and areas of the Kalmar Sound also
represent this region (Fig. 8.1).
The Himmerfjärden (area: 174 km², mean depth: 17 m) is well studied due to
its closeness to the nearby field station Askö laboratory, belonging to Stockholm
Marine Research Centre, and a sewage treatment plant, in work since 1976 (ELMGREN
& LARSSON 1997). The Hanö Bay has an archipelagic northern part and an open coast
in the south. The area is important as reproduction and nursery grounds for many fish
species such as cod, herring and flounder (ANDERSSON 1997).
The only HELCOM-hot spot found in this region belongs to the Swedish
agricultural programme with runoff to the Hanö Bay (HELCOM-HOT SPOTS 2004).
Fig. 8.1. The sub-region for the Baltic coast of Sweden.
91

Swedish East-Coast
8.1 Secchi depth The Secchi depth measurements in the outermost Himmerfjärden Bay increased from
the 1970s to the end of the 1980s, with 6 m as minimum value. In 1996-1997 the
transparency had the same value as 1976-1977; 8 m (LARSSON et al. 1998, 1999). In
August 2004, Secchi depths of 3.7 and 5.5 m were recorded at two stations outside the
Himmerfjärden (STOCKHOLM UNIVERSITY 2004b). In the Kvädöfjärden Bay, south of
St. Anna’s archipelago, the transparency was 3.5 m in summer 2000 (ÅDJERS et al.
2001). In the Kalmar Sound, the transparency increased from 4.8 m in 1995 to 8 m in
1999 (ANDERSSON, J. et al. 2000). The Secchi depths in the Hanö Bay have been
stable during the latest years, from 4 to 8 m (TOBIASSON et al. 2002, 2003). The
transparency in the region may therefore be classified as medium good to very good
(Table 2.1).
8.2 Salinity In the northern parts of the region, the salinity has fluctuated during the period 1975
to 2004 (SJÖBERG & LARSSON 1996, STOCKHOLM UNIVERSITY 2004a). In 1979, the
salinity was about 7.1 psu (SJÖBERG & LARSSON 1996), in August 2004 5.8 psu
(STOCKHOLM UNIVERSITY 2004a). The Kalmar Sound has a relatively stable salinity
of 6.5 psu (ANDERSSON, J. et al. 2000, MALM et al. 2004).
The salinity has an economically importance for the Hanö Bay area, since cod
is the most valuable fish species in the area. Cod requires a salinity of at least 11-12
psu for a successful reproduction (ANDERSSON 1997). In the coastal parts of the Hanö
Bay, the salinity is about 7 psu (TOBIASSON et al. 2002, 2003).
8.3 Oxygen In the end of the 1970s, hypoxia was a regular phenomenon in the Himmerfjärden
Bay. In the end of the 1980s, windy summers improved the turbulence of the water
and oxygen deficiency has been avoided since (ELMGREN & LARSSON 1997). In
August 2004, the oxygen conditions in the outer Himmerfjärden ranged between 2.0-
4.5 ml l-1 (STOCKHOLM UNIVERSITY 2004b). In the St. Anna’s Archipelago, the
number of hypoxia and anoxia suffering bottoms has increased since the 1950s to the
mid 1980s, which indicates a long-term eutrophication process. Better wind
92

Swedish East-Coast
turbulence during the 1990s seems to have improved the bottom situation in the area
(OLSSON 1999). In the Kalmar Sound, no oxygen concentrations below 8 ml l-1 were
found in 2001 (MALM et al. 2004).
The summer 2001 shows a more stable oxygen situation for the Hanö Bay
compared to the period 1991-2000. Minimum value in 2001 was 3.2 ml l-1, but most
stations had values > 6 ml l-1 (TOBIASSON et al. 2002). However, the oxygen situation
in the Hanö Bay is more related to stagnation of bottom water than a consequence of
eutrophication (ANDERSSON, L. et al. 2000). After the saline influx in January 2003,
the mean oxygen concentration in August 2003 was 7.9 ml l-1, or extremely good
(TOBIASSON et al. 2003).
8.4 Nutrients Long-term nutrient trends for the eastern coast of Sweden show that the increasing
nutrient curve was broken in the end of the 1980s (LARSSON et al. 1998). In the
Himmerfjärden area, the tot-N concentration has increased significantly from 250 to
300 µg l-1 during the period 1977-1990. After that, the concentrations have slightly
decreased, being relatively stable around 280 µg l-1 since the beginning of the 1990s
(LARSSON 1994, ELMGREN & LARSSON 1997, HAJDU et al. 2000, STOCKHOLM
UNIVERSITY 2004b), which is classified as low in Table 2.1. The tot-P has gradually
increased from 20 to 25 µg l-1 in 1977-1992 (ELMGREN & LARSSON 1997). The peak
was reached in 1989, 31 µg l-1 and very high (Table 2.1). Since then the value has
declined again, and in June 2004 the amount was 20 µg l-1 (STOCKHOLM UNIVERSITY
2004b).
In the St. Anna’s Archipelago, the nutrient concentrations have increased from
the 1970s to the mid 1980s, and then declined slowly again (OLSSON 1999).
Considering the criteria in Table 2.1, the nutrient values in 1993-1995 were medium
to very high. In 1996-1998 the situation had changed to the classification low (Table
2.1). In shallow bays in the Kalmar Sound area in 1999-2000, the total phosphorus
varied between 29 and 45 µg l-1 and total nitrogen between 200 and 360 µg l-1
(DAHLGREN & KAUTSKY 2004). This is low-medium high for nitrogen and high-very
high for phosphorus (Table 2.1).
In the Hanö Bay, a decreasing trend for phosphorus is seen from 1996 to 2001.
For nitrogen a similar trend started in 1990 (TOBIASSON et al. 2002). In August 2003
93

Swedish East-Coast
the tot-P was 23 µg l-1 and tot-N 330 µg l-1 (TOBIASSON et al. 2003), both medium
high (Table 2.1).
8.5 Chlorophyll a and primary production There is no clear long-term tendency for increasing chlorophyll a concentration at the
eastern coast of Sweden during the period 1977-1997 (LARSSON et al. 1998). In the
Himmerfjärden area the chlorophyll a content shows a linear relationship with the
Secchi depth and the concentration of tot-N (ELMGREN & LARSSON 1997). The
chlorophyll had a low value in August 2004, 2.5 µg l-1 (STOCKHOLM UNIVERSITY
2004b).
The chlorophyll a increased to > 4 µg l-1 in the Kalmar Sound in the beginning
of the 1990s, but decreased to a concentration of 3.5 µg l-1 in 1999 (ANDERSSON, J. et
al. 2000). In 2000, the value varied from 2 to 7 µg l-1 in shallow bays in the area
(DAHLGREN & KAUTSKY 2004). In the Hanö Bay the chlorophyll trend is decreasing
since 1993 (SOUTH COAST´S WATER CONSERVATION ASSOCIATION, 2002). The
concentrations in late summer are generally low, 0.8 µg l-1 in 2003 (TOBIASSON et al.
2003).
8.6 Phytoplankton and algal blooms According to ELMGREN & LARSSON (1997), the Prymnesiophycae Chrysochromulina
spp has occurred regularly in the Himmerfjärden area. During the 1990s, the
dinoflagellate Heterocapsa triquetra has been abundant in the coastal waters of
Sweden and caused dense and lengthy blooms. The reason for this seems to be found
in hydrographical and meteorological situations due to annual variations, and not as a
consequence of eutrophication (LARSSON et al. 1999). In the summer of 2002,
cyanobacteria occurred at the Swedish east coast, but no mass occurrences were
reported (SOUTH COAST’S WATER CONSERVATION ASSOCIATION, 2002).
8.7 Macrovegetation Outside the Himmerfjärden, the plant biomass decreased radically between 1974 and
1990. The main reason was the disappearance of Fucus vesiculosus. In 1993, the
biomass increased again, but the new dominators were ephemeral algae such as
Furcellaria lumbricalis and Pilayella littoralis (WULFF & HALLIN 1994). The mean
94

Swedish East-Coast
growth depth of F. vesiculosus decreased with 1 m from the 1970s to the 1990s.
Between the years 1995 and 1996, a decline of 0.5 m was recorded. This change is
eutrophication related, due to decreased Secchi depths (KAUTSKY 1999).
The Fucus-belts increased in the Kalmar Sound in the 1980s, but declined in
the end of the 1990s due to intense grazing of the isopod Idothea balthica. A recovery
phase was observed in 1999-2000, but the growth depth has decreased (JOHANSSON
1999, ENGKVIST et al. 2002, NILSSON et al. 2004a).
In the Hanö Bay region, 90 % of the F. vesiculosus, Fucus serratus and F.
lumbricalis cover are lost on exposed localities since 1990. The amount of epiphytes
has increased and the filamentous P. littoralis is now dominating. The changes seem
not to be in relation to the location of point-sources, since no changes or recovery of
perennial macrophytes are seen at sheltered places (ENGKVIST et al. 2002, TOBIASSON
et al. 2002, 2003, NILSSON et al. 2004a). The biomass and the number of shoots for
Zostera marina have slightly decreased, according to SOUTH COAST’S WATER
CONSERVATION ASSOCIATION (2002).
8.8 Ephemeral algae and drifting algal mats An increase of perennial and ephemeral algae is seen outside the Himmerfjärden area
compared with the 1970s, most probably due to eutrophication (KAUTSKY 1999).
According to KAUTSKY (1999), drifting algal mats at thicknesses of some dm´s have
been found in the area with occurrences of hypoxia below them.
During the 1990s, large quantities of drifting red algae, mainly Polysiphonia
fucoides, have been an increasing problem along the coasts of the Öland Island
(MALM & ENGKVIST 2001, MALM et al. 2004). Filamentous algae such as Cladophora
glomerata, has a dominating role in small bays in the Kalmar Sound area (DAHLGREN
& KAUTSKY 2004). High occurrences of attached and loose lying filamentous algae
are also observed in the Hanö Bay (SOUTH COAST’S WATER CONSERVATION
ASSOCIATION 2002).
8.9 Zoobenthos In the inner part of the Himmerfjärden, the biomass of macrobenthos increased
rapidly from 1972 until the end of the decade, when all animals died due to hypoxia.
The recolonisation crashed again in 1985, and a new recovery process started. In the
95

Swedish East-Coast
middle and outer areas of the bay, the biomass has increased since the beginning of
the 1970s, and the fauna has only temporarily been reduced during shorter periods of
hypoxia. Macoma balthica and Harmothoë sarsi are dominating, while the number of
oxygen-sensitive species such as Monoporeia affinis and Pontoporeia femorata has
diminished. Outside the Himmerfjärden Bay, the increased organic enrichment has
changed the composition of the benthic fauna. The total biomass increased from 1971
to 1991, due to the increased abundance of M. balthica, while the total abundance
decreased during the same period (CEDERWALL 1996, 2003, ELMGREN & LARSSON
1997, SAVAGE et al. 2002). The lower depth limit for macroscopic life changed from
125 m in 1996 to 71 m in 2001 (CEDERWALL 2003).
The zoobenthos in the St. Anna’s archipelago has been affected by expansion
of laminated sediments since the 1960s. As a consequence of the improved oxygen
conditions in the 1990s, a recolonisation of macrofauna is seen (PERSSON & JONSSON
2000, JONSSON 2003). In the Kalmar Sound, the abundance and extension of
chironomidae and the biomass of M. balthica have increased since the end of the
1980s, related to the increased eutrophication in the area (ANON. 1996, 1998). M.
balthica and Nereis diversicolor were most abundant in 2001 (MALM et al. 2004).
In the Hanö Bay, only slight changes in the zoobenthic communities are
observed during the last 5 years. M. balthica is dominating and the abundances of
oligochaets have increased. The number of Pygospio elegans and M. affinis has
decreased (TOBIASSON et al. 2002, 2003).
8.10 Ichthyofauna The lack of cyanobacteria in the Himmerfjärden has lead to larger amounts of fish
inside the bay than in areas nearby. This is the situation especially for the young of the
year herring (Clupea harengus membras; ELMGREN & LARSSON 1997). In the
Kvädöfjärden Bay, south of the St. Anna’s archipelago, perch (Perca fluviatilis) and
roach (Rutilus rutilus) dominate. Perch has increased significantly in the inner
archipelago, but roach has decreased in the outer areas in Kvädöfjärden. Marine
species are only caught in small numbers (ÅDJERS et al. 2001).
In the Kalmar Sound, high mortalities of 4-5 year old perch have been a
problem since the mid 1990s. The stock of stickleback (Gasterosteus aculeatus) is
also reduced and pike (Esox lucius) has suffered from recruitment problems. The
96

Swedish East-Coast
probable reason is a combination of pollutants, algal toxins, eutrophication, and
predation by the increasing stock of cormorants (Phalacrocorax carbo) in the Kalmar
Sound area (KARÅS 1998, JOHANSSON 1999, ANDERSSON, J. et al. 2000, SAULAMO et
al. 2001, NILSSON et al. 2004b).
An inventory of the fish communities in the northern Hanö Bay in 2001
showed a dominance of perch and roach on shallow bottoms. The catches were
overall small compared to the mid-1990s, mainly due to lower temperatures. In 1995,
ruffe (Gymnocephalus cernuus), flounder (Platithythys flesus) and cod (Gadus
morhua) were the most abundant species. In 2001, no cod was found in the area
(ANDERSSON 2001).
8.11 The present situation and suggestions for measurements
The Swedish east coast is a region in the Baltic Sea where the problems with
eutrophication is evident, but not serious. Changes are mainly seen in reduced
communities of Fucus vesiculosus and diminished living condition for zoobenthos on
deeper bottoms (Fig. 8.2).
The reasons to the eutrophication in this region are mainly found in the
agriculture, and somewhat in municipal sewage plants, industries, and outlets from
scattered dwellings (JANSSON 1998). For example, in the Hanö Bay the discharges of
nutrients were 4787 t nitrogen and 135 t phosphorus in 2001 (TOBIASSON et al. 2002).
The leakage of phosphorus from agriculture has decreased with a stricter use of
fertilizers. Reductions in nitrogen are not as significant (JANSSON 1998). According to
ELMGREN & LARSSON (1997), the best solution for the eutrophication problem in the
Himmerfjärden is reductions of nitrogen discharges together with regulations of
phosphorus discharges in order to get a balanced nutrient situation in the innermost
part of the bay.
Other pressures on the state of the environment, such as heavy metals and
toxins from point source industries, have damaged the local survival and conditions of
fish in this area (ANDERSSON, T. et al. 1988, KARÅS et al. 1991).
97

Swedish East-Coast
Fig. 8.2. The conceptual model for the east coast of Sweden (see Table 2.1 and Fig. 2.2 for explainations).
98

Central Baltic
9. THE CENTRAL BALTIC SEA The Central Baltic Sea, the Baltic proper, is the largest sub-region (51 %) of the Baltic
Sea. The surface area is 211.069 km2 and the volume 13.045 km3. The Landsort Deep
in the Northern Baltic proper is the deepest point in the Baltic Sea at 459 m. The
Central Baltic is the open sea area from the Darss Sill in the south west to the Åland
Sea, the Archipelago Sea and the Gulf of Finland in the north (Fig. 9.1). Topographic
features subdivide the Central Baltic into six basins: the Arkona, Bornholm and
Gdansk Basins, the Eastern and Western Gotland Basins and the Northern Baltic
proper (HELCOM 1996). The basins with volumes and maximum depths are presented
in Table 9.1.
Fig. 9.1. The sub-region of the Central Bal-tic. This region covers the open Baltic Sea area.
A halocline at 60 m stratifies the Baltic Sea. The upper part is well-mixed in
winter, but during summer a termocline is formed (ENGEL et al. 2002). The Central
Baltic, as well as the whole Baltic Sea, is dependent on inflows of saline and
oxygenated water from the North Sea. The topography with narrow channels and
shallow sills restricts the circulation. Water stagnation for periods of several years in
99

Central Baltic
the central deeps are common (MATTHÄUS & SCHINKE 1999). Hence, oxygen
depletion in the deep basins is both a natural phenomenon and a consequence of
eutrophication.
After a long stagnation period with no larger inflows since the winter 1993-
1994, 200 km3 highly saline water entered the Baltic Sea in January 2003. The cold
inflow was mixed with the local water in the Arkona and Bornholm Basins, and the
mixed water spread further to the Gdansk Basin. In May 2003 it reached the Gotland
Deep, which was detected by a decrease in temperature and increases in salinity and
oxygen concentrations (NAUSCH et al. 2003, PIECHURA & BESZCZYŃSKA-MÖLLER
2003).
Table 9.1. The names, volumes and maximum depths for the basins in the Central Baltic (after HELCOM 1996). Basin Boundary Volume (km3) Deepest point (m) Arkona east of 12°00´E 36 53; Arkona Deep west of 14°20´E Bornholm east of 14°20´E 306 105; Bornholm Deep west of 17°00´E Gdansk east of 17°00´E 426 108; Gdansk Deep south of 55°50´E Eastern Gotland north of 55°50´E 1195 249; Gotland Deep south of 57°50´E Western Gotland west of 19°00´E 657 Northern Gotland east of 19°00´E 863 459; Landsort Deep west of 22°00´E north of 57°50´E
9.1 Secchi depth According to RENK et al. (1991), the mean annual Secchi depth is 8.2 m in the
Gdansk Deep, 9.6 m in the Bornholm Deep, and 9.9 m in the southern part of the
Gotland Deep. In the Gdansk Deep, the most extreme variations in transparency are 3
m in summer and 15 m in winter (RENK et al. 1991). The annual mean transparency in
the Landsort Deep shows a declining curve from 10.5 m in 1990 to about 7.8 m in
1997 (LARSSON et al. 1998).
Long-term trends for the Secchi depth during the last century are decreasing in
all sub-regions of the Baltic Sea. In twenty years, from 1980 to 2000, the transparency
decreased drastically in the Central Baltic. The reason is probably found in the
100

Central Baltic
increase in algal biomass and occurrence of cyanobaterial blooms (LAAMANEN et al.
2004).
9.2 Salinity The average annual salinity in the bottom water of the Arkona Basin in 1960-1980
was 16 psu (OJAVEER & ELKEN 1997). After marine influxes, the salinity exceeds 20
psu in the Arkona Basin, like in spring 2003 (FEISTEL et al. 2003). The flow of saline
water from the Bornholm Basin northwards is limited due to the narrow Slupsk Sill
(HELCOM 1996). According to CYBERSKA & KRZYMINSKI (1996), the bottom salinity
in the Gdansk Deep was lower than 10.5 psu in 1989-1992. In 2002 it was measured
to 11 psu and in surface layer to 7 psu (FEISTEL et al. 2003).
The salinity in the Gotland Deep in the beginning of the 2000s was recorded to
12 psu (FONSELIUS & VALDERAMA 2003, NAUSCH et al. 2003). Earlier short-term
trends in salinity from the Eastern Gotland Basin are found in NEHRING (1991), LAINE
et al. (1997), LAINE & ZORITA (1999) and ZORITA & LAINE (2000). The salinity in the
Northern Baltic proper has been decreasing since 1990. The bottom water salinity in
the Landsort Deep is about 10 psu (LAINE et al. 1997, FONSELIUS & VALDERAMA
2003).
Long-term trends from the 1960s to 2001 for the deeps in Bornholm and
Eastern Gotland Basins and the Northern Baltic proper are found at STOCKHOLM
UNIVERSITY (2004a).
9.3 Oxygen In Unverzagt (2001) the areas with hypoxic and anoxic bottoms in the Baltic Sea are
estimated to 77.000 and 14.000 km2, respectively.
The Darss Sill had oxygen concentrations of 1-4 ml l-1 in the summer of 2002.
In the Bornholm Basin, no anoxia was recorded in winter-spring of 2003 (FEISTEL et
al. 2003). However, fluctuations may temporarily be strong and the concentrations
may quickly increase from anoxic levels to ~ 8 ml l-1 (CEDERWALL & SJÖBERG 1995).
The mean oxygen content in the Gdansk Deep is about 2 ml l-1. In the deep water,
oxygen varies from ~ 8 ml l-1 to anoxia and presence of hydrogen sulphide
(CYBERSKA & KRZYMINSKI 1996, HELCOM 1996). In the whole productive season of
2002, H2S was detected below 85 m in the Gdansk Deep (FEISTEL et al. 2003).
101

Central Baltic
During the period 1981-1993, oxygen was totally lacking and the
concentrations of hydrogen sulphide were high in the Gotland Deep (NEHRING 1991,
LAINE et al. 1997, MATTHÄUS & SCHINKE 1999, STOCKHOLM UNIVERSITY 2004a). A
reoxygenation took place in the mid-1990s, and oxygen concentrations of 3 ml l-1
– the highest since the 1930s – were measured. During that period, all the bottom
water in the whole Baltic Sea was oxygenated (CEDERWALL & SJÖBERG 1995,
STOCKHOLM UNIVERSITY 2004a). In 1998-2002, the oxygen trend has again been
decreasing with anoxia and presence of H2S, but in 2003 the concentration increased
to 4 ml l-1 (FONSELIUS & VALDERAMA 2003, NAUSCH et al. 2003). The western part of
the Eastern Gotland Basin was still anoxic in 2003 (HELCOM 2003b).
Anoxic conditions prevailed in the deep layer of the Northern Baltic proper in
periods during the 1980s. In the beginning of the 1990s, a decreased vertical
stratification facilitated a more intense mixing and even the deep layers became oxic
(HELCOM 1996). Thereafter the trend is again decreasing and hydrogen sulphide was
recorded in 1999 (ANDERSSON, L. et al. 2000, FONSELIUS & VALDERAMA 2003).
Long-term trends from the 1960s to 2001 for the deeps in Bornholm and
Eastern Gotland Basins and the Northern Baltic proper are found at STOCKHOLM
UNIVERSITY (2004a).
9.4 Nutrients The trends for phosphate and inorganic nitrate have been increasing since the 1960s in
the Central Baltic, either in the bottom water or in the entire water column
(FONSELIUS & VALDERAMA 2003). In the beginning of the 1990s, the concentration of
tot-P in the surface layer in the Central Baltic decreased with 20 % since late 1980s.
At the same time, the concentration of tot-N first started to increase, but declined to
the same level as in the late 1980s (LARSSON & ANDERSSON 1999). According to
LARSSON et al. (2001) the average concentration of tot-N increased with about 28
µg l-1 during the summer months in all the basins of Central Baltic, except for the
Bornholm Basin, where the increase was even higher; ~ 45 µg l-1. The co-incidents
with H2S and the increased amounts of carbon and phosphorus in the sediments are
evident for the Eastern Gotland Basin. In the Arkona and Bornholm Basins, the larger
fluxes of the deep-water have caused less burial of nutrients in the sediments (EMEIS
et al. 2000).
102

Central Baltic
The total amounts of nitrogen in the whole water column have been relatively
stable for all sub-basins of the Central Baltic since 2000. In the Bornholm, Gdansk
and Eastern Gotland Basins phosphorus has decreased, while in the Western Gotland
Basin and Northern Baltic proper increases have taken place (SMHI 2004). However,
since the year 2000, the concentration of nitrogen is decreasing in the surface water,
while the phosphorus amount has started to increase. These changes are caused by
internal biogeochemical processes and the supply of oxygen in the deep water, not by
the discharges from land. During the winter 2004, the highest phosphate
concentrations in the surface water were recorded since the end of the 1950s. On the
contrary, the winter concentrations of nitrate were halved and are now back at the
same level as in the 1970s. As an example, the Landsort Deep has a surface value of
28 µg l-1 for phosphate and 42 µg l-1 for nitrate (LARSSON & ANDERSSON 2004).
According to Table 2.1, the concentrations are high for both nutrients.
9.5 Chlorophyll a and primary production Comparing the chlorophyll a concentrations in different regions of the Central Baltic
from 1979 to 1998, a slight increase is seen (SCHULZ et al. 1997, HELCOM 2002). In
the Arkona and Gotland Basins the average summer chlorophyll a concentrations has
increased from 2 to 2.8 µg l-1 since the 1980s (HELCOM 1996, ENGEL et al. 2002,
WASMUND &UHLIG 2003), which is regarded as medium-high levels (Table 2.1). In
the Bornholm Basin, the concentration decreased from over 3 µg l-1 in 1980 to 1 µg l-1
in 1989, and then again increased significantly until 1997. A similar trend is seen in
the values from Eastern Gotland Basin (HELCOM 1996, WASMUND & UHLIG 2003). In
the Landsort Deep, the chlorophyll a varied between 1.4 and 2.3 µg l-1 in the 1990s
(LARSSON & HAJDU 1997), values that can be classified as low (Table 2.1).
On average of all the annual measurements for primary production in HELCOM
(1996) between 1979 and 1993, a slight increase is seen. The mean primary
production in the Arkona Basin had a summer peak at 10-20 mg C m-3h-1. The
Bornholm Basin had lower spring and autumn concentrations but the summer
productivity was about the same as in the Arkona Basin. In the Eastern Gotland Basin,
summer and autumn productivity ranged between 15 and 25 mg C m-3h-1 in 1979-
1993. Data of primary production in the Northern Gotland Basin is too scarce for
trend lines or to give a clear average picture (HELCOM 1996).
103

Central Baltic
9.6 Phytoplankton and algal blooms According to LARSSON et al. (2001), the total fixation in the Central Baltic Sea is
estimated to 180.000-430.000 tons N annually, 30-90 % of which correspond to the
pelagic net community production during the summer months. This corresponds to
25-50 % of the annual nitrogen load via rivers and the atmosphere (HAJDU et al.
2003). Strong algal blooms are often caused by high concentrations of phosphorus
during the winter-spring and high temperatures in the spring and summer (HAJDU et
al. 2003, LARSSON & ANDERSSON 2004).
The most abundant phytoplankton in the Central Baltic Sea is filamentous
cyanobacteria, diatoms and dinoflagellates (ENGEL et al. 2003). Of the cyanobacteria
Aphanizomenon flos-aquae, Nodularia spp and Anabaena spp are dominating in all
basins of the Central Baltic. Aphanizomenon spp occurs throughout the growth
season, while the others appear only in the warmer months (KONONEN & LEPPÄNEN
1997, LARSSON et al. 1998, 2001).
The cyanobacterial blooms were intense in the Central Baltic in the summers
of 1997-1999. In the summer of 2000, the situation was better, but the surface
occurrences covered the entire Baltic Sea, except for the Bothnian Bay. The situation
in August 2002 was serious compared to the mean value for the period 1992-2001
(HELCOM 2003a). Nodularia spp occurred in the highest concentrations in the areas
around the Gotland Island. The Northern Baltic proper had the longest duration of the
bloom, because of high water temperatures and calm weather conditions (HAJDU et al.
2003). The spring bloom in 2003 was intense – lasted for nearly 60 days in the
Northern Baltic proper. The cyanobacterial bloom in the summer of 2003 was strong
in the Central Baltic, except for the Northern Baltic proper (HELCOM 2003b).
The BALTIC SEA PORTAL (2004) gives accurate information of the algal
situation in different parts of the Baltic Sea. Predictions for the intensity of
cyanobacterial blooms are published in e.g. KIIRIKKI et al. (2003) for the Central
Baltic and the Gulf of Finland.
9.7 Macrovegetation In the southern Bornholm Basin, on the Slupsk Bank, 16 macroalgal species were
found attached to the stones in 1999 between 8.5 and 16.5 m depth (ANDRULEWICZ et
al. 2004b). The red algae Delesseria sanguinea was reported from this area already in
104

Central Baltic
1929, and was still present in 1999 (HELCOM 1996, ANDRULEWICZ et al. 2004b).
Furcellaria lumbricalis had the highest biomass, but Pilayella littoralis and
Ectocarpus spp were also common. The filamentous brown algae were attached on
shallower parts, but occurred free-floating deeper down (ANDRULEWICZ et al. 2004b).
South of the Gotland Island, at the Hoburg and Midsjö banks, attached brown
and red algae have been found from 8-29 m depth. Sphacelaria arctica and Ceramium
tenuicorne were most common at the Hoburg bank, while P. littoralis and Ectocarpus
spp dominated at the Midsjö bank. A photic zone down to 29 m indicates a good
water quality. Fucus vesiculosus and F. serratus were absent, most likely because of
unsuitable substrate and disturbance from waves. The undisturbed habitat at these
locations is unique in the Baltic Sea and has an important protection value (ALUTOIN
et al. 2001).
9.8 Zoobenthos Since the mid 1990s, the depth limit of macrofauna has risen with about 30 m in the
Central Baltic Sea and in the Gulf of Finland. In the Landsort area even with 45 m.
This corresponds to an area of 38.000 km2 of so called dead bottoms in 15 years and
an amount of 1-1.5 million tons wet weight of killed benthos (ANDERSIN &
CEDERWALL 2003).
In the end of the 1990s, from 48 to 236 m, 19 species of infauna and epifauna
were found in the Central Baltic and the Gulfs of Bothnia and Finland. Harmothoë
sarsi, Saduria entomon, Monoporeia affinis and Macoma balthica were most
abundant. Halicryptus spinulosus, Diastylis rathkei and Scloplos armiger had
important roles more locally. In the Eastern Gotland Basin, anoxia eliminated the
macrofauna at some of the sampling stations (LAINE 2003).
The Arkona and Bornholm Basins have faster turn-over rate of deep water
compared to the northern basins of the Central Baltic. Therefore, the oxygen is faster
consumed, which has influence for the zoobenthos. Two years after the saline flux in
1993-1994, no benthic life was found in the Bornholm Basin, while the same process
took four years in the Western Gotland Basin and three years in the Northern Baltic
proper (CEDERWALL 2003).
In the Arkona Basin reductions in macrofauna have occurred in periods. The
abundance and biomass increased in the mid 1990s, when the dominance switched
105

Central Baltic
from crustaceans to polychaetes (KUBE et al. 1996). The biomass decreased below the
halocline in the Bornholm Basin from 1950 to 1980. Alterations between lamellibrach
and polychaete dominating communities, in relation to the present oxygen situation
and variations between stagnant and influx periods are seen both in the Bornholm and
Gdansk Basins (TULKKI 1965, LEPPÄKOSKI 1969, 1971, ANDERSIN et al. 1978,
ROSENBERG 1980). In the Bornholm Deep, re-establishments of benthos were
observed in 1997 and 2001 (CEDERWALL 2003). Fluctuations in zoobenthos have
occurred above 60 m in the Gdansk Basin since the 1970. In the period 1989-1993, no
fauna was recorded at all (OSOWIECKI 1991, OSOWIECKI & WASZOCHZ 1996).
The fauna in the Eastern Gotland Basin and the Northern Baltic proper was
fairly diverse and dense below 100 m in the beginning of 1950s (SJÖBLOM 1955). In
the southern part of the Eastern Gotland Basin, the fauna has continuously decreased
since the late 1960s, and the community has become polychaete dominated. Above
the halocline, recolonisation is periodically allowed due the salt water flushes. In the
Northern Baltic proper, only sporadic observations of macrofauna are reported below
100 m during the period 1965-1994 (ANDERSIN et al. 1978, HELCOM 1996, 2002,
LAINE et al. 1997).
9.9 Ichthyofauna The economically most important fish species in the open sea in the Baltic is cod
(Gadus morhua), herring (Clupea harengus membras), sprat (Clupea sprattus),
salmon (Salmo salar) and species of flatfish. Changes in the fish stocks are a
combination of climatic variations, eutrophication, pollution and over-fishing
(OJAVEER, H. 2002). Top catches of the eastern Baltic cod were reached in the mid
1980s. The combination of changes in the physical environment and a high fishing
pressure has lead to drastically decimated stocks. In the end of the 1990s, the catches
were five times lower compared with 1985 (RADTKE 2003).
The open-sea system of the Central Baltic has change from a cod- to a clupeid-
dominated system (MÖLLMANN & KÖSTER 1999, OJAVEER & LEHTONEN 2001). The
stocks of herring and sprat are favoured by the eutrophication, but a strong over-
fishing has reduced the stocks to a minimum level in the Central Baltic. The catches
have decreased considerably since 1980, although the diminished cod populations
have positive effects for the production of herring and sprat (HANSSON 2001). The
106

Central Baltic
competition for food between sprat and herring has also increased (KORNILOVS et al.
2001). Decreased surface salinity has forced the big marine copepods southwards. As
they are the basic food item for herring, the stock in the Northern Baltic proper is
negatively affected (JANSSON & DAHLBERG 1999).
Some recovery in the cod stock has been detected in the southern and central
parts of the Baltic. North of the islands of Gotland and Öland, the catches are still
poor and show no signs of improvement (ANDERSSON et al. 1997). Hypoxia and
anoxia in the bottom water prevent the reproduction of cod (JANSSON & DAHLBERG
1999).
9.10 The present situation and suggestions for measurements
The total amount of nitrogen and phosphorus to the Central Baltic in 2003 is
estimated to 3.000.000 t and 400.000 t, respectively. Compared to the previous years,
a slight decrease is seen for both of the nutrients (LARSSON & ANDERSSON 2004).
The high concentration and frequency of phytoplankton and cyanobacterial
blooms, oxygen deficiency in the bottom water and poorer living conditions for
zoobenthos and fish may be regarded as the main problems for the deep water and
open sea areas in the Baltic Sea (Fig. 9.2). The problems are not only eutrophication-
related, but a combination with frequency of saline influxes and other direct human
influences, such as fishing and toxic pollution. All the effects of the last marine inflow
in 2003 have not yet been described.
Studies have shown that the amount of nutrients in the Central Baltic may
fluctuate strongly, even if the external land- and air-based loads are stable. The state
of the Central Baltic depends on legislation and reductions in emissions in other
regions before improvements can be seen. The international shipping also contributes
considerably to the airborne emissions of sulphur and nitrogen oxides at the surface
layer of the Baltic Sea (ANON. 2001b). However, the only solution is further
reductions of the discharges both via water and air, for example by natural uptake in
rivers and wetlands (LARSSON & ANDERSSON 2004). The central areas of the Baltic
Sea adapt slowly to changes in external loads, because reductions in phosphorus are
only depended on sedimentation. Nitrogen, on the other hand, has a faster adaptation,
as N-fixation and denitrification play roles together with the sedimentation
(SCHERNEWSKI & NEUMANN 2005).
107

Central Baltic
Fig. 9.2. In the Central Baltic, cyanobacterial blooms, oxygen deficiency and decreases or lack of zoobenthos are the most serious eutrophication-related problems (see Table 2.1 and Fig. 2.2 for explainations).
108

Belt Sea region
10. THE BELT SEA REGION, including Great Belt, Little Belt
and the Sound, Fehmarn Belt, and the Bights of Kiel,
Mecklenburg and Pomerania The narrow Great Belt, Little Belt and the Sound connect the Kattegat to the southern
Belt Sea, where Kiel Bight, Fehmarn Belt, and the Bights of Mecklenburg and
Pomerania are situated (Fig. 10.1). The area of the Belt Sea Region is about 24.000
km2 and holds a volume of 335 km3 (HELCOM 1996, FRANKOWSKI et al. 2002). The
water transport from Kattegat to the Baltic has a relationship of 7:3:1 for Great Belt,
Sound and Little Belt (RASK et al. 1999a). The maximum depth varies from 53 m in
the Sound to 80 m in Little Belt (MAGAARD & RHEINHEIMER 1974, GRANÉLI 1984).
The Kiel Bight is situated in the southern part of the Belt Sea and is connected to the
Mecklenburg Bight by the Fehmarn Belt. Kiel Bight has a mean depth of 17 m,
maximum depths in the channels and basins extend to about 30 m (BREUER &
SCHRAMM 1988, BABENERD 1991).
East of the Rügen Island, the Greifswalder Bodden and the Pomeranian Bight
are found. The Greifswalder Bodden is the largest inland sea area (514 km2) in
Germany (MESSNER & V. OERTZEN 1991) with a mean depth of 6 m (SCHIEWER
2002). The Pomeranian Bight is less than 20 m deep and the bottom consist mainly of
sandy sediments (MESSNER & V. OERTZEN 1991). The Szczecin Lagoon/Oderhaff,
which is situated south of the Pomeranian Bay, as well as other boddens or lagoons in
this region act as sediment traps for pollutants. The discharges from the River Odra/
Oder, on the border between Germany and Poland, are filtered and buffered before
entry to the Baltic Sea.
The river catchments of Odra and Vistula were early under intensified
anthropogenic influence, and the nutrient concentrations were high already in the
early 20th century (SCHERNEWSKI & NEUMANN 2005). Today, Odra is one of the most
polluted rivers in central Europe (PASTUSZAK et al. 1996, FRANKOWSKI et al. 2002).
About 35 % of the river water and 40 % of the waste water in Poland flow through
lagoons and coastal lakes before entering the sea, which reduces the direct pollution
load to the Baltic (PASTUSZAK et al. 1996). In the years 1996-2000, the annual load of
total P discharges from the Odra has decreased by 10 % (RUDLICKA et al. 2003).
However, an overloading of pollution may restrict the buffering capacity (MEYER-
REIL & KÖSTER 2000).
109

Belt Sea region
Fig. 10.1. The Belt Sea region.
According to HELCOM (2003a), Denmark (1862 kg km-2) and Germany (581
kg km-2) have the highest country specific loads for nitrogen in this region. For
phosphorus, the highest country specific loads originated from Denmark (83 kg km-2),
Poland (43 kg km-2) and Germany (35 kg km-2). The nitrogen load is mainly related to
agriculture, whereas the phosphorus in the first place is linked to high population
densities and industrial activity (HELCOM 2003a). At present, there are 16 HELCOM
hot spots in this area. Many point-sources from Poland and Germany have been
deleted from the list during the latest years (HELCOM-HOT SPOTS 2004). Reductions in
nutrients discharges from wastewater and cultivated land have taken place in
Denmark between 1989 and 2002 (ANDERSEN et al. 2004b), but the agricultural
runoff programme to the Sound and Belt Sea is still a hot spot for Denmark (HELCOM-
HOT SPOTS 2004).
110

Belt Sea region
10.1 Secchi depth In Great Belt, the transparency has increased from 5 m in 1977 to 6-10 m in 2002
(RASK et al. 1999a, FYNS AMT 2004a). The Secchi depth has increased in both fjords
and open waters in Denmark since the mid-1980s (ÆRTEBJERG et al. 2003).
The Pomeranian Bight had a transparency of 3-7 m in the period 1993-1997,
the Secchi depth was lower in the plume of River Swina (WASMUND et al. 2001). In
Greifswalder Bodden, Secchi depth during the summer algal bloom has decreased
from 2.5 m in 1938 to 1-1.5 m in 1955 and further to 0.2 m in 1988. This gives an
indication on the advancing eutrophication process during the past 50 years (MESSNER
& V. OERTZEN 1991).
10.2 Salinity The supply of freshwater into the Baltic Sea makes the sea level in the Southern Baltic
a few centimetres higher than the level in Kattegat, and the low salinity surface water
is therefore forced to the Kattegat through the Belt Sea (HELCOM 1996). Water masses
of different origin meet in the Belt Sea area; generally a surface layer of low-saline
Baltic water (10-15 psu) flows northwards to the Kattegat. A compensating stream of
high-saline Skagerrak water (25-33 psu) flows near the bottom into the Baltic Sea
(HELCOM 1996, RASK et al. 1999a). Due to turbulence, considerable mixing takes
place in the Great Belt, and the salinity of the surface water varies between 16 and 32
psu (HELCOM 1996, ÆRTEBJERG et al. 1998, RASK et al. 1999a). The Sound has a
strong halocline at about 15 m depth, and the total salinity range lies between 8 and 30
psu (GRANÉLI 1984, HELCOM 1996, ÆRTEBJERG et al. 1998).
The salinity in the Fehmarn Belt and the Mecklenburg Bight varies between
11 and 15 psu in the surface water (HELCOM 1990, PRENA 1994). In the Pomeranian
Bight and the Greifswalder Bodden, the salinity has a range of 6-12 psu (e.g.
MESSNER & V. OERTZEN 1991, FEUERPFEIL et al. 2004).
10.3 Oxygen Since 1981, incidents of oxygen depletion in the bottom water have been observed
almost annually in the southern Kattegat, the Sound and the Belt Sea. At least in Kiel
Bight, the decrease seems to have started in the late 1950s (HELCOM 1996). Overall,
the oxygen concentrations have declined in the Belt Sea area since the beginning of
111

Belt Sea region
the 1970s (ANON. 1991, AGGER & ÆRTEBJERG 1996). The oxygen concentrations in
the Great Belt fluctuated between 2 and 13 ml l-1 during 1976-1989 (ANON. 1991). In
the summers of 1997 and 1998, the oxygen varied between total anoxia and 7.3 ml l-1,
showing that the concentrations vary strongly among the sampling stations (RASK et
al. 1998, 1999a, b). The oxygen situation in the water around the Funen Island has
improved in the latest years compared with the total average for the period 1976-
1997. In 1997-1998 the oxygen concentration in the Little Belt varied between 0.6 and
8.6 ml l-1 (RASK et al. 1998, 1999a). According to AGGER & ÆRTEBJERG (1996), the
oxygen situation in the Sound has changed from > 3.5 ml l-1 in 1974 to < 2.5 ml l-1 in
1992.
The southern Belt Sea suffered from serious oxygen deficiency and formation
of hydrogen sulphide in 1981 and 1986 (MARKAGER et al. 1999), but the worst
oxygen depletion ever recorded in Danish coastal water took place in September
2002. Hypoxia and even anoxia occurred from the southern Kattegat to the Belt Sea
and the Pomeranian Bight. The reason is probably a combination of high nutrient
inputs and high precipitation in combination with warm water temperatures and lack
of wind (ANDERSEN et al. 2004b). The event is thoroughly described in ÆRTEBJERG et
al. (2003). Also in August 2003, serious oxygen depletion was observed in the same
area (ÆRTEBJERG et al. 2003). In the summer 2004, only the Belt Seas suffered from
serious and intense anoxia from July to September. The reason is found in a large
phytoplankton bloom in early summer, together with weak winds and repercussions of
the anoxic event in 2002 (NERI 2004).
In the other areas of the Belt Sea region a decline in the oxygen situation is
seen in the long-term perspective as well. The oxygen concentration in Kiel Bight was
measured to 3 ml l-1 in 1979 and to 2 ml l-1 in 1990 (HELCOM 1990). For the Fehmarn
Belt there is a decline from 4.5 ml l-1 in 1974 to < 3 ml l-1 in 1992 (AGGER &
ÆRTEBJERG 1996). The oxygen concentration in the Mecklenburg Bight had a
saturation of 75-110 % in 1977, and acute hypoxia was for the first time observed in
the southernmost Bight in the late 1980s. In 1990, the oxygen saturation had
decreased to a level of 45-75 % (PRENA 1994).
After 1990, a negative trend in the late summer oxygen concentration is
detectable in the Pomeranian Bight (ŁYSIAK-PASTUSZAK et al. 2004). The minimum
oxygen concentration in the bottom water in the period 1998-2001 was 2.7 ml l-1 in
Pomerania Bight and 2.9 ml l-1 in the Szczecin Lagoon (RUDLICKA et al. 2003).
112

Belt Sea region
10.4 Nutrients The water in the Belt Sea, as well as in Kattegat, has a short residence time; only one
or two months for the surface water. Together with strong horizontal gradients,
changes in nutrient concentrations are difficult to detect (HELCOM 1996). The
increased use of commercial fertilizers in Danish agriculture has resulted in high
losses of nitrogen since the 1960s.
The amount of tot-N in the Great Belt decreased after a peak of nearly
600 µg l-1 in 1977 to a relatively stable mean value of about 300 µg l-1 in 1988-1998
(ANON. 1991, RASK et al. 1999a). The trend for tot-P has been more fluctuating
during the same period, and the range is between 25-40 µg l-1 (ANON. 1991, RASK et
al. 1999a). In August 2003, tot-N had a value of 250 µg/l and tot-P 10 µg/l in the
waters around the island of Funen. These concentrations lay far below the mean
values during the period 1989-2002 (FYNS AMT 2004a). Both ANDERSEN et al.
(2004b) and FYNS AMT (2004a) show that the summer and winter mean
concentrations of total nitrogen are decreasing since 1994. For total phosphorus, the
mean summer values are decreasing, while the winter values have increased slightly
since 1997 (ANDERSEN et al. 2004b, FYNS AMT 2004a). Comparing these values in
Table 2.1 both tot-N and -P has decreased from a very high to a low level.
The nutrient conditions in the Pomeranian Bight are governed by the dynamics
in the Bight, the Szczecin Lagoon, as well as by the discharges from River Odra
(PASTUSZAK et al. 1996). The winter concentrations of phosphate increased rapidly in
the Pomeranian Bay during 1960s and 1970s. In the late 1980s, accumulation of
phosphate took place in the surface water. During the period from 1960 to 1990,
nitrite and nitrate increased in the surface layer. Since the 1990 a decrease in the
winter accumulation of nitrogen is observed in the Pomeranian Bight (ŁYSIAK-
PASTUSZAK et al. 2004). The summer concentration of tot-P in the surface water of the
Pomeranian Bight has variated from 39 µg l-1 in 1990 to 50 µg l-1 in 2000. For tot-N,
the summer concentrations fluctuated between 250 µg l-1 in 1990 and 350 µg l-1 in
2000 (RUDLICKA et al 2003). To summarise, the nitrogen values in the Pomeranian
Bight are considered medium high; the phosphorus values are very high, in
accordance with Table 2.1.
113

Belt Sea region
10.5 Chlorophyll a and primary production (N.B: The unity for primary production is given in mg C m-2 for the Danish waters and in mg C m-3 for
the rest of the areas).
The trends for chlorophyll a and primary production are decreasing, both in
Danish coastal and open waters. From the mid 1980s, the annual concentrations have
declined. However, the primary production has increased slightly since the year 2000
(ANDERSEN et al. 2004b). In Danish coastal waters, the concentrations of chlorophyll
a varied between 1.5-7.7 µg l-1 in 1975-1989 (ANON. 1991). From 1988 to 1997, the
chlorophyll a decreased from ~4 to 2 µg l-1 (ANON. 1991, RASK et al. 1998). In
August 2003 the chlorophyll a in the northern Great Belt reached a level of about 1.7
µg l-1, which lies under the mean value for the period 1989-2002 (FYNS-AMT 2004).
The present chlorophyll a situation in Danish waters can overall be considered as low
(Table 2.1).
The primary production in Great Belt had a summer mean value under 1000
mg C m-2d-1 in 1989-1997 (RASK et al. 1998, RASK et al. 1999a, FYNS-AMT 2004).
After that a rapid increase took place and the peak occurred 1999 with 1500
mg C m-2d-1. The concentration has declined again and was about 1000 mg C m-2d-1 in
August 2003. The trends for Little Belt and the Sound are similar (ANON. 1991, RASK
et al. 1998).
Both in Kiel Bight and Mecklenburg Bight a decrease in chlorophyll a
concentration was observed from 1986 to 1998 (HELCOM 1996, 2002). In both bays
chlorophyll a has increased from 2.5 µg l-1 in 1978 to 4.5 µg l-1 in 1988 (HELCOM
1990, SCHULZ et al. 1992). The overall level of primary production was lower in Kiel
Bight – 8 mg C m-3d-1 in 1978 and 36 mg C m-3d-1 in 1989 – compared to
Mecklenburg Bight – 200 mg C m-3d-1 in 1970 and 400 mg C m-3d-1 in 1988 (HELCOM
1990, SCHULZ et al. 1992). Table 2.1 classifies the increases of chlorophyll a from a
medium to a high level in both Kiel and Mecklenburg Bights.
The maximum chlorophyll a concentration, 87 µg l-1, in the Pomeranian Bight
was recorded in the outlet of the Szczecin Lagoon in September 1995 (WASMUND et
al. 2001). In 2001, the chlorophyll a concentration in the Pomeranian Bay was
7.58 µg l-1, which was the highest mean concentration in the coastal zone of Poland
(RUDLICKA et al. 2003). Chlorophyll a correlated significantly with both phosphate
and nitrate in the surface water of the inner parts of Pomeranian Bight (MASLOWSKI
2003). The content of chlorophyll a in the sediment indicates that the Szczecin
114

Belt Sea region
Lagoon can be classified as permanently eutrophic and the Pomeranian Bay as
mesotrophic, according to KOWALEWSKA et al. (2004).
10.6 Phytoplankton and algal blooms In Great and Little Belts, mass occurrences of cyanobacteria have been sparse, while
other toxic or potentially toxic phytoplankton species have bloomed frequently since
monitoring was initiated in 1976, according to RASK et al. (1999a). In 1988,
Chrysochromulina polylepis (Prymnesiophyceae) was the first toxic algae with mass
occurrence in the Belt Sea. The bloom did not cause direct damage to fish or benthic
fauna, but widespread oxygen depletion was detected in the coastal waters and this
was most likely related to the algal growth (ANON. 1991). Larger quantities of the
cyanobacteria Nodularia spumigena were first recorded in 1992 and 1995 in the
southern Belt Sea and the Sound (MARKAGER et al. 1999). In 1997 mass occurrences
of the toxic dinophyte Gyrodinium aureolum – also called “marine snow” – were
found both in Little and Great Belt, and caused extensive mortality of benthos in
waters north of Funen Island (RASK et al. 1998). In 2001, the average phytoplankton
biomass in Danish waters was lower than the long-term averages (ÆRTEBJERG et al.
2003).
In the open Kattegat and Belt Sea, the diatom biomass has decreased
significantly over the past 20 years and is now 50 % of that in 1980. In estuaries and
coastal areas no long-term trend in diatom biomass was found (ÆRTEBJERG et al.
2003). In the Greifswalder Bodden, the diatoms still represent 40 % of the
phytoplankton abundance (SCHIEWER 2002). Long-term data from the Odra estuary
indicate a shift and decrease in the diatom composition during the last century
(ANDRÉN 1999). In the end of the 1990s dinophytes were the dominat group in late
spring and early autumn, while cyanobacteria as Aphanizomenon flos-aquae and N.
spumigena associated with colony forming species were the most abundant species
during summer. The phytoplankton biomass was significantly lower outside the
Rügen Island than in the Pomeranian Bay (FEUERPFEIL et al. 2004).
10.7 Macrovegetation The Belt Sea region has suffered from changes in benthic macrovegetation since the
1970s. The enrichment of nitrogen is inversely related to the water transparency, and
115

Belt Sea region
hence to the depth distribution of macroalgae, and the typical development from
perennial to fast growing annual species are seen (HELCOM 1996, 1998).
For the Belt Sea, most of the macrophytobenthos investigations are made on
eelgrass, Zostera marina. The studies of Z. marina from Danish waters are unique,
starting from the beginning of the 20th century and give a good overview of the
situation before the eutrophication process seriously started (ÆRTEBJERG et al. 1998).
In 1901, Danish eelgrass meadows covered almost 7000 km2, or 15 % of the Danish
marine waters (Petersen 1901, 1914 in FREDERIKSEN et al. 2004a). The reduction in
the Zostera-stock began with the “eelgrass disease” in the beginning of the 1930s,
when about 90 % of the whole North European stock disappeared (ANON 1991, RASK
et al. 1998, LOMSTEIN 1999). Only 8 % of the level in 1901 was left in 1941 (Lund
1941 in FREDERIKSEN et al. 2004a). Increased nutrient loading has reduced the
vertical recovery and the depth distribution is therefore much shallower than before
(ANON. 1991, HELCOM 1996, LOMSTEIN 1999).
Decreases in depth distribution are seen in fjord areas from 6-8 m in 1900 to 2-
4 m in 1989-2002, and in the open areas from 9-10 m in 1900 to 4-6 m in 1989-2002
(ANON. 1991, RASK et al. 1998, LOMSTEIN 1999, RASK & BONDGAARD 2000,
ANDERSEN et al. 2004b). New data of Z. marina in Danish water is found in e.g.
NIELSEN et al. (2002a, b), BOSTRÖM et al. (2003), and FREDERIKSEN et al. (2004 a, b).
In the Kiel Bight, in the beginning of the 1960s, the red algae Furcellaria
lumbricalis was the dominant species at all depths. Laminaria saccharina and
Phycodrys rubens were important components of the vegetation below 10 m.
Shallower, at 6 m depth, Fucus serratus and Z. marina were dominating. About 30
years later, by the end of the 1980s, a combination of the epilithic Phyllophora
truncata and the epiphytic P. rubens dominated at all depths. L. saccharina was
sparsely found below 14 m, F. serratus and Z. marina were reduced to less than 2 m
depth, and Polysiphonia nigrescens was instead common in shallower areas. There
were, however, no significant changes observed for species such as Ceramium spp,
Rhodomela confervoides and Delesseria sanguinea. All these changes are
eutrophication related, primarily caused by reductions in light conditions (BREUER &
SCHRAMM 1988, HELCOM 1996).
Greifswalder Bodden in the Pomeranian Bight was mostly covered of red
algae in the 1930s, with zones of Z. marina and Potamogeton pectinatus along the
coasts. In 1955 only small patches of red algae were left. In 1988, almost all red algae
116

Belt Sea region
had disappeared, and the amounts of Zostera were also drastically reduced (MESSNER
& V. OERTZEN 1991). Even since the mid-1990s, the macrophyte coverage in the
Greifwalder Bodden decreased from 75 % to 15 %. The diversity of the vegetation is
still high, but the transparency is reduced (SCHIEWER 2002).
10.8 Ephemeral algae and drifting algal mats In the Great and Little Belts, the filamentous algae constitute the highest phytobenthic
biomass in early summer. In July they start to decompose and form drifting algal
mats, and Zostera marina regains its dominating role in the community. The
ephemeral algae have seasonal variations in Danish waters; in spring and early
summer Cladophora sericea and Pilayella littoralis are dominating, C. sericea is later
replaced by Ectocarpus siliculosus in deeper waters (3-6 m). Chaetomorpha linum is
the most frequent filamentous algae in late summer (ANON. 1991). According to
ANDERSEN et al. (2004b), the coverage of eutrophication-related algae has remained
stable during the period 1993-2002.
In Kiel Bight, larger amounts of ephemeral algae were reported for the first
time in 1977, when agglomerated Furcellaria lumbricalis drifted down to the
sublittoral slopes. Of all Furcellaria found, 40 % was loose lying, while Phyllophora
spp was mostly attached (BREUER & SCHRAMM 1988).
10.9 Zoobenthos The composition of the zoobenthos in the Great Belt and the Sound has changed since
the 1960s, even if typical species for polluted areas – Nereis diversicolor, Capitella
capitata and Scoloplos armiger – were dominating in the Sound at that time. Probably
because of changes in food supply, the crustaceans have decreased since the 1980s,
whereas the polychaetes, molluscs and echinoderms have increased. According to
investigations from the Little Belt in 1910-1933, areas deeper than 30 m had sparse
fauna. In 1973-1988 it was evident that areas less than 20 m were affected too.
Species tolerant to hypoxia have increased by a factor of 2-5 in this area (HENRIKSSON
1969, ÆRTEBJERG et al. 1998, MARKAGER et al. 1999). The biomass and abundance
of zoobenthos had extremely low values during the period 1998-2001 (ÆRTEBJERG et
al. 2003), and the events with serious oxygen depletion in 2002 and 2003 have
resulted in mass mortality of benthos in the affected areas (ANDERSEN et al. 2004b,
117

Belt Sea region
FYNS-AMT 2004). Bivalves used to be the dominating class in the Great Belt.
However, in the summer 2003, the bristleworm Scalibregma inflatum dominated the
abundance in the water north of Funen Island, and C. capitata was most abundant
south of Funen (FYNS-AMT 2004).
Macrofauna tolerant to organic pollution in the Kiel Bight have increased
since 1981. In the late summer of 1981, hypoxia below the halocline (> 20 m) caused
mass mortality among the 60 recorded faunal species in the Bight. The fauna
recolonised rapidly after the event, but a new similar crash occurred in 1983
(WEIGELT & RUMOHR 1986, WEIGELT 1990). The sandy bottoms of Greifswalder
Bodden are dominated by molluscs and ostracods (SCHIEWER 2002).
In the innermost part of the Pomeranian Bight, near the mouth of Swina River,
the macrofauna biomass consists to 80 % of the bivalves Mya arenaria and Macoma
balthica (MASLOWSKI 2003). Further out in the Bight, Mytilus edulis dominates,
followed by Corophium volutator, Marenzelleria viridis and Nereis sp (FEUERPFEIL et
al. 2004).
10.10 Ichthyofauna The Belt Sea region is an important fishery area especially for flatfish, eel (Anguilla
anguilla), herring (Clupea harengus) and cod (Gadus morhua). After a period with
large catches and an increased fishery activity in the 1960s, the general tendency has
been diminishing catches of herring and plaice (Pleuronectes platessa), particularly
since the beginning of the 1980s (ANON. 1991). From 1990 to 1997, the catches of
cod, flounder (Platichthys flesus) and plaice increased, but thereafter especially the
cod catches started to decrease. It is hard to assess the real situation for the fish stocks
from the size of the catches, but the trends give at least some hints (ANON. 2001c).
The poor oxygen concentrations in the Belt Sea may have a negative impact
on fish spawning, and have lead to restrictions in commercial trawl fishery, allowing
it only in the period from December to April. Cod, plaice, and flounder spawn from
February to April in this area, when the oxygen conditions normally are better.
Therefore, hypoxia-related problems do not affect the survival of the eggs and larvae
of these species (HELCOM 1990). Altered patterns in phytoplankton spring bloom due
to eutrophication has, however, had a negative impact on the food sources for fish,
especially for survival of the young spring-spawning species such as cod (references
118
Belt Sea region
in ANON. 1991). The worst occasions with fish kills happened in 1981 and 2002. The
direction of the wind forced the upwelling of hypoxic or H2S-containing anoxic
bottom water to the coastal zone where the fishes get trapped (ÆRTEBJERG et al.
2003).
In the Boddens on the German coast and in the Szczecin Lagoon, the annual
catches of freshwater species have doubled during the last century, which partly
seems to be due to eutrophication. The stocks of herring, pike (Esox lucius) and
pikeperch (Sander lucioperca) are eutrophication-favoured. Pike has been negatively
affected during the latest years due to the declines in macrophytes, which are needed
for a successful reproduction. The catches of roach (Rutilus rutilus) and bream
(Abramis brama) have declined during the 1990s. Blooms of the Chrysophyte
Prymnesium spp have caused local fish mortalities along the German and Polish
coasts (WINKLER 2002).
10.11 The present situation and suggestions for measurements
The Belt Sea region is a widespread area with coastlines to four different countries,
and therefore the assessment of the eutrophication situation differs within the region.
The state of the Secchi depth and the oxygen situation in Fig. 10.2 is assessed for the
Danish waters, whereas the situation for zoobenthos in the Polish and German areas
has affected the result in Fig. 10.2. The oxygen situation and its concequences, and
the state of macrovegetation are, however, the main problems in the whole area.
In Poland a clear reduction in pollution load is seen as a consequence of the
switch to a market economy in the 1990s. There was a decrease in agricultural
production and a modernisation or closing of factories. Since the mid 1990s, most of
the towns around the Szczecin Lagoon have got wastewater treatment plants
(WEILGAT 2002). Szczecin with over 400.000 inhabitants is, according to WEILGAT
2002, still an exception. Despite the nutrient reductions, any improvement in the water
quality in the coastal zone of Germany and Poland is not seen, due to the external load
of phosphorus (MEYER-REIL & KÖSTER 2000).
The water quality planning and environmental legislation system are relatively
well developed in both Denmark and Germany. Until 2002, the discharges of nitrogen
and phosphorus in Denmark have been reduced by 77 % and 91 %, respectively
119

Belt Sea region
Fig. 10.2. The conceptual model for the Belt Sea region. Hypoxia and damages to macrovegetation are the main problems for the area (see Table 2.1 and Fig. 2.2 for explainations).
(ANDERSEN et al. 2004b). Great reductions in nutrient loads in Denmark are
succeeded by the “Action Plan and Aquatic National Monitoring Programme”, started
in 1988 (RASK et al. 1999a, CONLEY et al. 2000, 2002, ÆRTEBJERG et al. 2003). The
Action Plan has shown positive results in the Danish waters already after a few years
(RASK et al. 1999a, CONLEY et al. 2002). Denmark is a specialized and highly
productive agricultural country. Animal farms dominate in western Denmark and
cereal production in the eastern part. Legislations for point source inputs and changes
in agricultural practices together with an effective sewage treatment have reduced the
nutrient load to Danish waters during the last decade (BERNET 2000b, CONLEY et al.
2000).
The county of Schleswig-Holstein in Germany has restrictions in the
agriculture in the use of fertilizers, collection of manure, and avoiding of direct run-
120

Belt Sea region
off. The industries have emission standards, and only 10 % of the households are
outside the central wastewater treatment system (BERNET 2000b). The external load
from both manure and fertilizers in the coastal area in Germany has decreased
(MEYER-REIL & KÖSTER 2000). For both Denmark and Germany further reductions in
nutrient loads seem to be the remaining problem. The fields of concern are the
agriculture, scattered dwellings and deprivations of streams, lakes and wetland
meadows (BERNET 2000a, ANDERSEN et al. 2004b). New facilities for aquaculture are
not permitted in the coastal waters of Denmark (BERNET 2000b).
Information of status of the aquatic environment is continuous and of high
quality in Denmark. The National Environmental Research Institute of Denmark
(NERI 2004) together with environmental research in the Danish counties (e.g. FYNS
AMT 2004b) give accurate information on the situation and trends in the Danish
coastal waters.
121
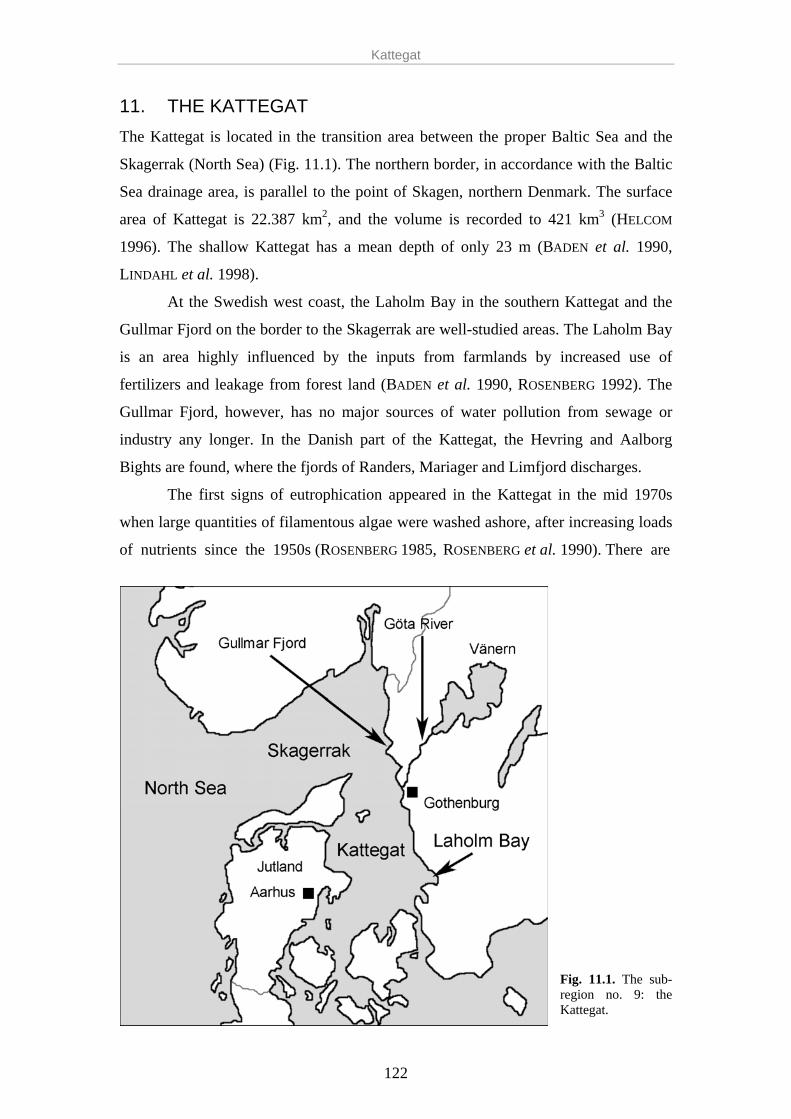
Kattegat
11. THE KATTEGAT The Kattegat is located in the transition area between the proper Baltic Sea and the
Skagerrak (North Sea) (Fig. 11.1). The northern border, in accordance with the Baltic
Sea drainage area, is parallel to the point of Skagen, northern Denmark. The surface
area of Kattegat is 22.387 km2, and the volume is recorded to 421 km3 (HELCOM
1996). The shallow Kattegat has a mean depth of only 23 m (BADEN et al. 1990,
LINDAHL et al. 1998).
At the Swedish west coast, the Laholm Bay in the southern Kattegat and the
Gullmar Fjord on the border to the Skagerrak are well-studied areas. The Laholm Bay
is an area highly influenced by the inputs from farmlands by increased use of
fertilizers and leakage from forest land (BADEN et al. 1990, ROSENBERG 1992). The
Gullmar Fjord, however, has no major sources of water pollution from sewage or
industry any longer. In the Danish part of the Kattegat, the Hevring and Aalborg
Bights are found, where the fjords of Randers, Mariager and Limfjord discharges.
The first signs of eutrophication appeared in the Kattegat in the mid 1970s
when large quantities of filamentous algae were washed ashore, after increasing loads
of nutrients since the 1950s (ROSENBERG 1985, ROSENBERG et al. 1990). There are
Fig. 11.1. The sub-region no. 9: the Kattegat.
122

Kattegat
three HELCOM hot spots in the Kattegat catchment area, derived from agricultural
runoff programmes in both Sweden and Denmark, and municipal wastes from the
town of Gothenburg, Sweden (HELCOM-HOT SPOTS 2004).
11.1 Secchi depth According to SMHI (2001), the Secchi depth east of the Anholt island (56°40´N,
12°07´E) in the southern Kattegat varied between 6 and 17 m in August during the
period 1985-1999. In the summer of 2003, the Aalborg Bight had a mean transparency
of 9.5 m, which is significantly higher than the mean value for the period 1985-2003
(ANON. 2004). Similar trend is seen in the Aarhus Bight in the northern Belt Sea
(AARHUS AMT 2004).
11.2 Salinity In the Kattegat, outflowing surface water from the Baltic Sea meets high saline ocean
water from the Skagerrak, which forms the so called Kattegat-Skagerrak front (BADEN
et al. 1990, JAKOBSEN 1997, LINDAHL et al. 1998). The water is therefore strongly
stratified in two generally persistent layers, separated of a halocline at 15 m depth.
Mixing between the layers is restricted to strong winds. Since the tidal amplitude is
less than 20 cm, the water exchange occurs slowly (PIHL et al. 1995, JAKOBSEN 1997).
The Kattegat surface water increases from 8-14 psu near the sills to 25-27 psu in the
border to the Skagerrak. The deep-water salinity varies between 31 and 34 psu
(RASMUSSEN & GUSTAFSSON 2003).
11.3 Oxygen The Kattegat is regarded as an eutrophication-sensitive area; the strong halocline
enhances the primary production and makes the sedimentation of organic material
slower, causing hypoxia in the bottom waters (BADEN et al. 1990). The oxygen
concentrations have been decreasing in the Kattegat since 1970. During the
productive period, an estimated decreasing trend of 0.05-0.1 µg l-1 yr-1 has occurred in
the Kattegat deep water during the period 1970-1995. In the southern Kattegat, the
oxygen saturation in 1973 was 60 %, in 1995 it had decreased to 45-50 % (AGGER &
ÆRTEBJERG 1996, HELCOM 1996).
123
Kattegat
Hypoxia was observed for the first time in the south eastern Kattegat in 1981,
and re-occurred every summer and autumn during the rest of the 1980s (BADEN et al.
1990, AGGER & ÆRTEBJERG 1996, HELCOM 1996, ÆRTEBJERG et al. 1998). Serious
and extended oxygen deficiency periods took place in the Kattegat and the Belt Sea
both in 2001 and 2002, which is described in ÆRTEBJERG et al. (2003). The
development of the depletion started already in June, and in 2002 it continued until
October. Especially the open sea areas and the southern Kattegat were affected and in
September 2002 an area of 16.000 km2 suffered from hypoxia, of which 5500 km2 had
concentrations below 2 ml l-1 (ÆRTEBJERG et al. 2003). In the Hevring Bight, oxygen
concentrations < 4 ml l-1 have occurred in totally 9 years since 1989, for Aarhus Bight
three of the last 13 years. Warm water temperature in the summer 2003 caused serious
oxygen depletion in both Bights in August-September (ANON. 2004). Except for the
Aarhus Bight, the oxygen situation was relatively good along the Kattegat coast in
August-September 2004 (AARHUS AMT 2004).
11.4 Nutrients Changes in nutrient concentrations in the Kattegat are hard to detect, due to the strong
horizontal gradients and the short residence time of the surface water (1-2 months)
(HELCOM 1996). Dense nutrient-rich water from the Skagerrak causes net transport of
dissolved inorganic nutrients towards the Baltic Sea during the summer period. The
transport may reverse during winter when the surface concentrations of DIN and DIP
increase (RASMUSSEN & GUSTAFSSON 2003). A remarkable increase in inputs of
nutrients to the Kattegat took place during the 20th century. Nitrogen has increased by
a factor of 6, and phosphorus by a factor > 10 (ROSENBERG 1992, ROSENBERG et al.
1992). According to RASMUSSEN & GUSTAFSSON (2003), the pools of phosphorus
(both DIP and tot-P) have decreased since the 1980s, while nitrogen pools have been
more variable. In the 1990s the transport between the Kattegat and the Skagerrak
decreased, but the Belt Sea continued to export DIN to the Kattegat (RASMUSSEN &
GUSTAFSSON 2003).
The inorganic forms of nitrogen and phosphorus increased from 1968 until a
peak was reached during the period 1979-1988 (HELCOM 1990, 1996, STOCKHOLM
UNIVERSITY 2004a). Since the beginning of the 1990s, both total nitrogen and
phosphorus started to decrease. In the western part of the Kattegat the declines are
124

Kattegat
significant. Tot-N has changed from a annual mean concentrations of 600 µg l-1 in
1991 to 200 µg l-1 in 2003, for tot-P the annual mean concentrations of 35 µg l-1 in
1993 can be compared to 15 µg l-1 in 2003 (ANON. 2004). According to the
assessment in Table 2.1, both nitrogen and phosphorus have changed from a very high
to a very low class during the last 15 years.
Better wastewater treatment has lowered the output of phosphorus, and low
precipitation and runoff in the beginning of the 1990s have lead to reductions in the
output of nitrogen (AGGER & ÆRTEBJERG 1996). The total amount of phosphorus in
the Kattegat has been stable in the last four years; 6000-7000 tons in the summer
period. For nitrogen the corresponding value lies between 100.000-120.000 tons
(SMHI 2004). According to ROSENBERG et al. (1990), the best way to reverse the
eutrophication in the Kattegat is reducing the supply of nitrogen.
11.5 Chlorophyll a and primary production The chlorophyll a in Kattegat has increased from a mean value of 1 µg l-1 in 1970 to 2
µg l-1 in 1988 (SCHULZ et al. 1992, JOSEFSON et al. 1993). Maximum values around
20 µg l-1 may be measured during summers (HELCOM 1996). From 1989 to 2002, the
growing season mean concentration of chlorophyll a seems to be around 2 µg l-1 in
offshore areas of the eastern part of the Kattegat, while Swedish inshore waters are
around 2.5 µg l-1. Even higher concentrations are observed near the mouth of
freshwater sources, as the Göta River. The northern Kattegat also seems to have
higher levels than the offshore areas in the central and southern regions (HÅKANSSON
2003, CARSTENSEN et al. 2004). The chlorophyll a recording from the Danish Bights
of the Kattegat in 2003 was higher than the mean for 1989-2002 in February, June and
December, but lower for the rest of the months (ANON. 2004).
The mean annual primary production for the Kattegat during the years 1981-
1985 was 144 g C m-2, and indicated an increase with 25-30 % compared with the
1970s (ROSENBERG 1992 and references therein). In the Gullmar Fjord, the primary
production has undergone three phases: a “background” level of 100 g C m-2a-1 before
1950, an increasing period to values > 200 g C m-2a-1 from 1960s to mid-1980s due to
the eutrophication, and since then a slight increase (close to 250 g C m-2a-1) due to
climate forcing (strong positive NAO index; RICHARDSON & HEILEMANN 1995,
HÅKANSSON 2003). In relation to other nutrient-rich areas, the primary production in
125

Kattegat
the Kattegat is not high, according to BADEN et al. (1990). The annual primary
production for 2003 in the Aalborg Bight was 140 g C m-2, which lies under the mean
production of 157-224 g C m-2 for the period 1998-2002 (ANON. 2004).
11.6 Phytoplankton and algal blooms Phytoplankton blooms in the Kattegat are generally caused by mass occurrences of
dinoflagellates, chrysophyceans and prymnesiophyceans, while blooms of
cyanobacteria are a rarely occurring phenomenon (ROSENBERG et al. 1990, SCHULZ et
al. 1992). The first mass occurrences of cyanobacteria in Danish waters were
recordings of Nodularia spp in Aarhus Bight in 1975 (ÆRTEBJERG et al. 1998).
The highest bloom frequencies during the 1990s were observed along the
Danish coast and in the southern Kattegat that is influenced by the outflow from the
Baltic Sea. The blooms are generally local in nature (CARSTENSEN et al. 2004). The
dinoflagellates have increased in abundance (SCHULZ et al. 1992), for example the
potentially toxic Gyrodinium mikimotoi has been observed as blooms since 1960, and
is now a common species in the Kattegat (KAAS et al. 1999). In 1988, dense blooms
of the Prymnesiophyceae Chrysochromulina polylepis caused problems in the
Kattegat-Skagerrak area (see Chapter 10: Belt Sea region; ROSENBERG et al. 1990,
KAAS et al. 1999). The Raphidophyceae Chattonella spp formed blooms in the spring
of 1998 and 2001. The algae may cause damage on fish gills and the occurrence in the
Kattegat-Skagerrak is believed to be eutrophication-related (HÅKANSSON 2003).
Overall, non-harmful diatoms as the genus Rhizosolenia spp and Ceratium spp
represented more than half of the bloom observations according to CARSTENSEN et al.
(2004). Toxic algae caused no damages in Kattegat in 2003 (ANON. 2004).
11.7 Macrovegetation The salinity gradient plays a major role in the distribution patterns of benthic
macroalgae in the Kattegat, where the eulittoral vegetation is more similar to the
Skagerrak and the North Sea. The flora and fauna have higher species richness due to
the higher salinity, and no single algal species may dominate as in the Baltic Sea. The
number of registered macroalgal species in the northern Kattegat is 325 (HELCOM
1996, DAHLGREN & KAUTSKY 2002).
126

Kattegat
Long-term measurements show a decline in Fucus species since the end of the
19th century, especially in the central and southern Kattegat (ROSENBERG et al. 1990,
NIELSEN & DAHL 1992, HELCOM 1996). Changes in species composition, new depth
distributions and narrower ranges are observed both on the Swedish and Danish coasts
(ROSENBERG et al. 1990, ÆRTEBJERG et al. 1998, HÅKANSSON 2003). The depth
distribution of Zostera marina in the Danish Kattegat water was 8.5-11 m in 1900
(ÆRTEBJERG et al. 1998). In 2001-2003 the mean depth was 3 m and maximum depth
5 m for Z. marina in the Hevring Bight (ANON. 2004). Along the Swedish Skagerrak
coast a decline in eelgrass up to 60 % is observed in the last 10-15 years (BADEN et al.
2003).
11.8 Ephemeral algae and drifting algal mats Macroalgae favoured by the increase in nutrient supply in the Kattegat are species
such as the Rhodophyceae Erythrotrichia spp, the Phaeophyceae Ectocarpus spp and
Pilayella spp and the Chlorophyceae Chaetomorpha spp, Cladophora spp and Ulva
spp (HÅKANSSON 2003). The species composition of the ephemeral algae may differ
(PIHL et al. 1995). The filamentous green algae have increased in dominance since the
1970s along the Swedish Kattegat coast (BADEN et al. 1990, ROSENBERG et al. 1990,
HELCOM 1996). According to estimations in the mid-1990s, 30-40 % of all the soft-
bottoms along the Swedish Kattegat coast were covered by filamentous algae and
over 90 % of the algal biomass was found drifting (PIHL et al. 1995, 1999). Drifting
algae are also reported from stone reefs in the southern Kattegat, but the relation to
eutrophication is not clear (NIELSEN & DAHL 1992).
A European Commission supported project in 1996-2000 studied harvesting of
filamentous and drifting algae in shallow bays. The experimental areas were the
Swedish Kattegat-Skagerrak coast and the Åland archipelago in Finland. Results are
presented at COUNTY ADMINISTRATION VÄSTRA GÖTALAND, SWEDEN (2001).
11.9 Zoobenthos The macrofauna in the open Kattegat has undergone clear reductions when benthic
biomasses from 1911-1912 and 1984 are compared. The former dominating groups,
echinoderms and molluscs, have been replaced by ophiuroids and polychaetes. Also
the size of the species has diminished (JOSEFSSON & JENSEN 1992). However,
127

Kattegat
ROSENBERG et al. (2004), classified the environmental quality in the northern and
offshore Kattegat to a high level in 1990 according to the benthic status. Along the
Swedish coast some stations were classified as poor (ROSENBERG et al. 2004).
Hypoxia has caused severe reductions in the benthic fauna in the Laholm Bay,
where especially crustaceans, e.g. Norway lobster, Nephrops norvegicus, have been
affected (BADEN et al. 1990, PEARSON & ROSENBERG 1992). A recovery of fauna was
seen in the period 1993-1998, but a new decline was reported in 1999-2001
(GÖRANSSON 1999, HÅKANSSON 2003). Monitoring along the Swedish west coast in
2002 showed no signs of oxygen depletion. The ophiuroids Amphiura filiformis and
A. chiajei dominated at both shallow and deep bottoms. At bottoms deeper than 50 m,
the polychaets Heteromastus filiformis and Scalibregma inflatum were also abundant,
probably due to high nutrient levels. The bivalve Mysella bidentata was a common
species at shallow localities (AGRENIUS 2003).
Events of oxygen depletion at the Danish Kattegat-coast have caused crashes
of the zoobenthic community, but the periods of recolonisations seem to be relatively
short (FELLESEN 1992, KAAS et al. 1996). The hypoxic-anoxic period in 2002 caused a
40 % reduction in species number in 2003 in the Danish Hevrings Bight and for
example the former common echinoderms totally disappeared. Also the abundances
were reduced, for the polychaets with almost 90 %. The stable stocks of the sea urchin
Echinocardium cordatum in 1998-2001 give a sign of good oxygen condition before
the collapse in 2002. In 1991 and 1998, the toxic dinoflagellate Gyrodinium aureolum
reduced the zoobenthos (ANON. 2004). For the summer 2004, a period with oxygen
deficiency took place in Aarhus Bight, but AARHUS AMT (2004) reports no changes in
the stock of E. cordatum.
11.10 Ichthyofauna On the Swedish west coast, over 50 fish species are recorded on shallow bottoms
(PIHL & WENNHAGE 2002). Flatfish and cod (Gadus morhua) have been the
dominating demersal species in the Kattegat. The total catches of these species in the
open sea have decreased by 40 % since the 1970s and by 70 % since the 1960s
(BADEN et al. 1990). According to HÅKANSSON (2003), there is no clear link to a
deterioration in the environment. However, close to the coast, a positive correlation
128

Kattegat
between increased catch yield and eutrophication during the 1990s is seen, but not
proven (SANDSTRÖM 2000).
Cod usually spawn close to the shore and the spawning area in the Kattegat
has been concentrated to the south eastern part until the 1980s, when the spawning
stock was reduced in biomass and spread to the whole southern Kattegat (BADEN et
al. 1990). Hypoxic bottom cause this escape reaction, and has happened irregularly in
the Laholm Bay since 1959 (BADEN et al. 1990, HELCOM 1990). The areas with
hypoxia and the amounts of suffering fishes have extended during the past two
decades (BADEN et al. 1990) and fish mortality due to hypoxia is reported
(ROSENBERG et al. 1990). Filamentous algae in shallow areas have also impact on the
recruitment of fish larvae (SANDSTRÖM 2000). Therefore, the spawning areas in the
North Sea have become more important for the fish recruitment in the Kattegat-
Skagerrak area (HÅKANSSON 2003). The Laholm Bay has remained as the main
nursery area for flatfish in the Kattegat (BADEN et al. 1990, PIHL et al. 1995).
11.11 The present situation and suggestions for measurements
The anthropogenic loads have started to diminish already in the 1970s (HELCOM
1996), but the improvements are slow. The Kattegat is still affected of the over-
enrichness of nutrients. However, the input of phosphorus and nitrogen has decreased
since the late 1990s, which is indicated in Fig. 11.2. Excessive growth of filamentous
algae, occurrences of hypoxia and anoxia, as well as elimination and changes in
habitats and conditions for zoobenthos and fish, are still nuisances of special concern
in the Kattegat region. Toxic cyanobacterial blooms are not a problem for the region,
but algae species producing neuron toxins may cause for example ASP (amnesic
shellfish poisoning; ANON. 2004).
The nutrient loads are mainly derivered from the agriculture and the
atmosphere. The atmospheric deposition stands for > 30 % of the nitrogen load
(HELCOM 2003a). The deposition of total nitrogen is reduced by 12 % in 1996-2000
compared to 1991-1995 (HELCOM 2003a). Measurements in the reduction of direct
nutrient loads are the most important way to diminish the eutrophication problem
even further (BERNET 2000a, KARLSON et al. 2002). According to CARSTENSEN et al.
(2003), a 50 % reduction in the external nitrogen inputs to the Kattegat would
correspond to a 20 % reduction in the net primary production.
129

Kattegat
Fig. 11.2. The conceptual model for the Kattegat. Hypoxia and its consequences for zoobenthos and fish, togehter with excess growth of filamentous algae are the main problems for the area (see Table 2.1 and Fig. 2.2 for explainations).
The measures taken in Sweden include restrictions in agricultural methods,
e.g. limits on animal densities, manure management and taxes on fertilizers. Single
households outside the sewage treatment net have nowadays infiltration and other
more effective methods than the former sludge-reduction (BERNET 2000b). The action
programme in Denmark and its progress is already discussed in Chapter 10: The Belt
Sea Region.
130

Conclusions
12. CONCLUSIONS
Eutrophication is a serious problem in the whole Baltic Sea area. The same physico-
chemical drivers are involved in the process of the nutrient over-enrichness, but the
degree of change varies within and between sub-regions, as well as the primary and
secondary effects and consequences.
In Fig. 12.1 the conceptual models (Fig. 3-11.2) from the Baltic sub-regions
are summarised. Based on the Fig. 12.1, the sub-areas may be divided into three
groups: the Gulf of Bothnia and the Swedish coastline towards the Baltic proper are
the healthiest parts of the Baltic Sea. The Archipelago region, the Gulf of Riga and the
Belt Sea region are all severely affected by eutrophication, but the situation also
shows some improvement, compared to the late 1990s. However, a national
assessment of the state of the Finnish coastal waters, published in January 2005,
indicates a deterioration of the water quality in the inner archipelago of the
Archipelago Sea, compared to the situation in 1993-1997 (SYKE 2005). The positive
changes in fish stocks in the Gulf of Riga and the increased Secchi depth in the Belt
Fig. 12.1. A summary of the conceptual models in Fig. 3-11.2 for the nine sub-regions of the Baltic Sea. The changes in relation to eutrophication are explained with: white dot – no changes, green – small-moderate changes, yellow – severe changes, and red – very serious changes. A combination of two alternatives is expressed with a two-coloured dot. The black circles indicate parameters where the assessment of change differs from RÖNNBERG (2001). The state in 1990s-2001 is presented in the first dot; the second shows the present status, i.e. in almost all cases a slight improvement for the most recent period.
131

Conclusions
Sea area can clearly be seen as positive consequences of measures taken to combat the
eutrophication.
The Gulf of Finland, the Gulf of Gdansk, the Central Baltic and the Kattegat
are the most seriously eutrophied areas in the Baltic Sea region. The Gulfs of
Finland and Gdansk are both extensions of the Baltic proper and are not buffered by
archipelago areas. The annually occurring events of harmful algal blooms at the
surface and the areas with oxygen deficiency in the bottom water may be considered
as the largest problems. In the Gulf of Gdansk positive signs in both the input of
nutrients and the state of the fish community have been seen in the recent years. The
Gulf of Finland is the only sub-region where the eutrophication process has been
aggravated since my previous assessment in RÖNNBERG (2001). The hypoxic bottom
conditions have even further damaged the benthic fauna in the Gulf of Finland. This is
in accordance with the assessment of the water quality in the Finnish aquatic areas,
where the Gulf of Finland has changed from good status in the open sea and
satisfactory in the coastal areas in 1993-1997, to an overall satisfactory level in 2000-
2003 (SYKE 2005).
In the Kattegat the situation is somewhat different. As the Kattegat, together
with the Skagerrak, forms a transition area between the Baltic Sea and the North Sea,
the natural conditions influence the sensitivity to eutrophication. The large-scale water
current systems cause strong stratification in the water column, which reduces the
vertical transport of oxygen (ÆRTEBJERG et al. 2003). Therefore, periods with oxygen
depletion are almost an annual occurring phenomenon.
Large-scale, basin wide calculations and predictions for the Baltic Sea is an
important framework for reducing the eutrophication problem. For example, the
decision-support system presented in the MARE’S NEST (MARE 2005; the NEST
programme, including manual, is available on the Internet), shows how reductions in
one sub-region may influence the entire Baltic Sea system. The programme can also
provide cost-effective strategies to counteract the Baltic eutrophication.
On the other hand, the differences and degree of effects in the various sub-
regions indicate the need for area-specific measurements to reach positive reductions
both spatially and temporally in a small-scale perspective. The knowledge achieved at
the small-scale level is a valuable background for large-scale modelling. Adequate
and integrated monitoring programmes are important sources of data information. For
example, long-term monitoring data of physcio-chemical parameters provides
132

Conclusions
background trends and patterns of eutrophication, both in time and space. The same
data may also be used in attempts to roughly predict the oxygen situation on a year to
year basis, by using fuzzy logical methods.
To achieve a sustainable aquatic environment and suppress the eutrophication
process, the physico-chemical and ecological effects must link directly to socio-
economy. The human demands are an extremely important aspect, when the carrying
capacity of an ecosystem is discussed (DUNLAP 1993). All factors that control and
influence the effects and consequences of the eutrophication-process modify the
ecosystem. Regardless of whether this happens on a small- or large-scale level,
permanently or episodically, the process is complex. A conceptual model is a useful
tool to explain the network of events. An essential aim for science is to reach out to
the public, managers and politicians. To quote ELLIOTT & DE JONGE (1996): “if
scientists do not help to provide the answers then the managers and politicians will
provide them anyway”. A challenge for science is to learn to be better at explaining
threats, solutions and predictions for a mutual trust with the general public and a
fruitful interdisciplinary co-operation with other scientists.
The DPSIR-approach is another framework which indicates the
interdisciplinary interrelations of the eutrophication-process. In Fig. 12.2 an attempt to
show how this thesis supports and provides information for the DPSIR thinking is
presented. Beside the five corner-stones in the framework, two more boxes are added
to the model. Institutional barriers may prevent or delay the socio-economic drivers or
the environmental pressure, which are a factor to consider in the process. All
pressures on the environment are not of anthropogenic origin. The external variability
and uncertainty in nature, such as climate change, sea-level rise and storm events, is
another aspect of a dynamic ecosystem (TURNER 2000, MEE 2004).
The eutrophication-related changes must also be considered in relation to other
pressures and threats to the health of the ecosystem. The interaction with other
environmental problems, such as toxic compounds, erosion, over-fishing and invasive
species, influence the state and resilience of an aquatic system. Integration of several
complex problems in an ecosystem will lead to an even further intricate
horrendogram.
This thesis shows that in spite of being a highly complex problem,
eutrophication in the Baltic Sea can be reduced by combining approaches from small-
scale local effects to international large-scale measures.
133

Conclusions
Fig. 12.2. A schematic figure of the DPSIR-framework, where the contribution from this thesis is included in brackets (modified from MEE 2004).
134

Acknowledgement
13. ACKNOWLEDGEMENT
A bunch of thanks goes to my supervisor, Erik Bonsdorff. Without your engagement and inspiration, perhaps this work had never went through its metamorphosis from boring project report to licentiate thesis and further to a doctoral one?!? Throughout the process, you have always guaranteed that we can work every problem out. The discussions on science as well as on life in general have been pleasurable. I send my co-authors, besides Erik, Kati Aarnio, Malin Lönnroth and Mikael von Numers, lots of thanks. It has been interesting working with you, because it seems to be a myriad of ways to study the same eutrophication phenomenon. I am also glad to being a part of the MARE network. The programme is a good multidisciplinary micro-cosm, and I feel fine to be a little cog in the decisions-support machinery. I do not either forget all friendly MARE meetings with excellent food and perfect opportunities to come together with both same level and senior (even real celebrities in biological research!) colleagues. The long and winding road to a PhD exam has also been much lighter and easier in good company. Therefore, I direct a collective thank to the colleagues and students at the Environmental and Marine Biology. Special thanks to Johan Lindholm for help with the maps in this thesis in particular and for assistance with various computer issues in general, and to Malin Lönnroth and Britt-Marie Jakobsson, my first two graduate students. It is something special to supervise and be supervised at the same time. All kind persons almost across the universe that have delivered me with scientific papers, reports and other information are acknowledged. Without you it had been much harder summarising the state of knowledge in the Baltic sub-regions. The warmest thanks to Sif Johansson at Sweden’s Environment Protection Agency and Dan Conley at NERI in Denmark for spending time at hard days´ nights and Easter holiday to review the thesis and for given me the most positive, valuable and constructive criticism. And what is life without a little help from my friends! To the best girls, both “biolog-flickorna” and others, thank you for listening, joy and friendship! From me to You, the deepest thanks to my “biology”-family! My parents Birgitta and Ola have unconsciously, without any pressure, raised me to be what I am today. I should have known better when brother Peter chose the same field of study... Finally, kisses to Mats, my greatest supporter. Thank You for giving me a taste of honey even on a rainy day, being my perfect popular-science referee, and for your important role at the Big Reference Control for this thesis. I look forward to our Magical Mystery Tour in August! I will also remember the Åbo Akademi University and the MARE project that have financed this work. Åbo in April 2005
135

References
14. REFERENCES AARHUS AMT, 2004. The county of Arhus, Denmark. News from sea and fjord (in
Danish). URL: http://www.aaa.dk/aaa/index/serviceomraader/nm/nm-vand/nm-havfjord.htm (Acc 04/12/31).
ADRIAENSSENS, V., B. DE BAETS, P.L.M. GOETHALS & N. DE PAUW, 2004. Fuzzy rule-based models for decision support in ecosystem management. Sci. Total Environ. 319: 1-12.
ÆRTEBJERG, G., J.H. ANDERSEN & O.S. HANSEN (eds.), 2003. Nutrients and eutrophication in Danish marine waters. A challenge for science and management. National Environmental Research Institute, 126 pp.
ÆRTEBJERG, G., J. CARSTENSEN, P. AXE, J-N. DRUON & A. STIPS, 2003. The 2002 oxygen depletion event in the Kattegat, Belt Sea and western Baltic. Baltic Sea Environ. Proc. No. 90, 64 pp. URL: http://www.dmu.dk/ (Acc 04/12/31).
ÆRTEBJERG, G., J. CARSTENSEN, D. CONLEY, K. DAHL, J. HANSEN, A. JOSEFSON, H. KAAS, S. MARKAGER, T.G. NIELSEN, B. RASMUSSEN, D. KRAUSE-JENSEN, O. HERTEL, H. SKOV & L.M. SVENDSEN, 1998. Open marine waters – the state of the environment, annual summary and development. Danish National Environmental Research Institute, report no. 254, 248 pp (in Danish with English summary).
AGGER, C. T. & G. ÆRTEBJERG, 1996. Longterm development of autumn oxygen concentrations in the Kattegat and Belt Sea area. In: Andrushaitis, A. (ed.), Proc. 13th Baltic Marine Biologists, Inst. Aqautic Ecology, University of Latvia, pp. 29-32.
AGRENIUS, S. 2003. Monitoring of the softbottom fauna along the Swedish west coast. Unpublished report, Swedish Environmental Protection Agency, Göteborg University and Kristineberg Marine Research Station, 39 pp. (in Swedish with an English summary). URL: http://www.kmf.kva.se/pdf-files/rapport2002.pdf (Acc 04/12/31).
ALENIUS, P., K. MYRBERG & A. NEKRACOV, 1997. Hydrodynamics in the Gulf of Finland. In: Sarkkula, J. (ed.) Proceedings of the final seminar of the Gulf of Finland year 1996, March, 1997, Helsinki. Finnish Environment Institute, report no. 105, pp. 331-340.
ALMQVIST, G., M. APPELBERG & S. HANSSON, 2003. Non-indigenous fish in the Baltic Sea – is the Round goby an impending risk? Poster at Baltic Sea Science Congress, Helsinki, Finland, August 2003.
ALUTOIN, S., H. KAUTSKY & M. BORGIEL, 2001. Pilot study for the establishment of marine protected areas on the Hoburg and Northern Midsjö Banks. Unpublished report for WWF, Sweden, 26 pp.
ANDERSEN, J.H., D.J. CONLEY & S. HEDAL, 2004a. Paleoecology, reference conditions and classification of ecological status: the EU Water Framework Directive in practice. Mar. Poll. Bull. 49: 283-290.
ANDERSEN, J.M., S. BOUTROUP, L.M. SVENDSEN, J. BØGESTRAND, R. GRANT, J.P. JENSEN, T. ELLERMANN, M.B. RASMUSSEN, L.F. JØRGENSEN & K.D. LAURSEN, 2004b. Aquatic Environment 2003. State and trends - technical summary. National Environmental Research Institute, Technical report no. 500, 52 pp. URL: http://www.dmu.dk/ (Acc 04/12/31).
ANDERSIN, A-B. & H. CEDERWALL, 2003. Macrobenthic fauna in the deep Baltic proper after the saline inflow 1993-94. Abstract at Baltic Sea Science Congress, Helsinki, Finland, August 2003.
136

References
ANDERSIN, A.-B. & H. SANDLER, 1991. Macrobenthic fauna and oxygen deficiency in the Gulf of Finland. Memoranda Soc. Fauna Flora Fennica 67: 3-10.
ANDERSIN, A.-B., J. LASSIG, L. PARKKONEN & H. SANDLER, 1978. The decline of macrofauna in the deeper parts of the Baltic proper and Gulf of Finland. Kieler Meeresforschungen, 4: 23-52.
ANDERSSON, A. & J. WIKNER, 2000. Pelagic biology. The Gulf of Bothnia 1999, annual report from the marine environmental control programme. Umeå Marine Research Centre, Sweden, pp. 9-12 (in Swedish).
ANDERSSON, A. & J. WIKNER, 2004. Pelagic biology. The Gulf of Bothnia 2003, annual report from the marine environmental control programme. Umeå Marine Research Centre, Umeå, Sweden, pp. 11-13 (in Swedish).
ANDERSSON, A., S. HAJDU, P. HÆCKY, J. KUPARINEN & J. WIKNER, 1996. Succession and growth limitation of phytoplankton in the Gulf of Bothnia (Baltic Sea). Mar. Biol. 126: 791-801.
ANDERSSON, I. 1997. Focus on the Hanö Bight. The Baltic Sea 1996, Swedish report on the environmental state of the Baltic proper, Stockholm Marine Research Institute, Sweden, pp. 18-19 (in Swedish).
ANDERSSON, J. 2001. Inventory of the fish communities at Tromtö, county of Blekinge, SE Sweden in August 2001, 14 pp (in Swedish). URL: http://www.k.lst.se/version1/miljo/miljoovo/index.htm (Acc 04/12/31).
ANDERSSON, J., E. LINDESJÖÖ & A. BIGNERT, 1997. Fish and fishery. The Baltic Sea 1996, Swedish report on the environmental state of the Baltic proper, Stockholm Marine Research Institute, Sweden, pp. 39-41 (in Swedish).
ANDERSSON, J., J. DAHL, A. JOHANSSON, P. KARÅS, J. NILSSON, O. SANDSTRÖM & A. SVENSSON, 2000. Recruitment failure and decreasing fish stocks in the coastal areas of Kalmar sound. National Board of Fisheries, Sweden, report 5, 42 pp. (in Swedish with English summary).
ANDERSSON, L., B. SUNDELIN, A-K. ERIKSSON WIKLUND & E. HÅKANSSON, 2000. Bottom water and soft bottom fauna. The Baltic Sea 1999, Swedish report on the environmental state of the Baltic proper, Stockholm Marine Research Institute, Sweden, pp 23-27 (in Swedish with English summary).
ANDERSSON, T., L. FÖRLIN, J. HÄRDIG & Å. LARSSON, 1988. Physiological disturbances in fish living in coastal water polluted with bleached kraft pulp mill effluents. Can. J. Fish. Aquat. Sci. 45(9): 1525-1536.
ANDRÉN, E. 1999. Changes in the composition of the diatom flora during the last century indicate increased eutrophication of the Oder estuary, south-western Baltic Sea. Est. Coast. Shelf Sci. 48: 665-676.
ANDRULEWICZ, E. 1996. The regional characteristics of the Gdansk Basin. Oceanological Studies XXV: 11-16.
ANDRULEWICZ, E. & Z. WITEK, 2002. Anthropogenic pressure and environmental effects on the Gulf of Gdansk: recent management efforts. In: Schernewski, G. & U. Schiewer (eds.), Baltic coastal ecosystems, structure, function and coastal zone management. Central and Eastern European Development Studies, Springer Verlag, Berlin, pp. 119-139.
ANDRULEWICZ, E., L. KRUK-DOWGIALLO & A. OSOWIECKI, 2004a. An expert judgement approach to designating ecosystem typology and assessing the health of the Gulf of Gdansk. In: Schernewski, G. & N. Löser (eds.), Managing the Baltic Sea. Coastline Reports 2, pp. 53-61.
137

References
ANDRULEWICZ, E., L. KRUK-DOWGIALLO & A. OSOWIECKI, 2004b. Phytobenthos and macrozoobenthos of the Slupsk Bank stony reefs, Baltic Sea. Hydrobiol. 514: 163-170.
ANDRUSHAITIS, A., Z. SEISUMA, M. LEGZDINA & E. LENSHS, 1995. River load of eutrophying substances and heavy metals into the Gulf of Riga. In: Ojaveer, E. (ed.), Ecosystem of the Gulf of Riga between 1920 and 1990. Estonian Academy Publishers, Tallinn, pp. 32-40.
ANON. 1991. Eutrophication of coastal waters. Coastal water quality management in the county of Fyn, Denmark, 1976-1990. Legislation – nutrient loads and eutrophication effects – causes and trends. Funen County Council, Department of Technology and Environment, 288 pp.
ANON. 1996. Kalmar, control of coastal waters. The county board of Kalmar, Sweden, 41 pp. (in Swedish).
ANON. 1998. Kalmar, control of coastal waters. The county board of Kalmar, Sweden, 73 pp. (in Swedish).
ANON. 1999a. Coasts and seas. Environmental Quality Criteria. Swedish Environmental Protection Agency, report 4914, 134 pp. (in Swedish with English summary).
ANON. 1999b. Nordic Environmental Research Programme for 1993-1997. Final report. Nordic Council of Ministers, TemaNord 1999:531, 163 pp. (in Swedish with English summary).
ANON. 2000. Directive 2000/60/EC of the European Parliament and of the council of the 23 October 2000 establishing a framework for community action in the field of water policy. Official Journal of the European Communities, L. 327/1, 72 pp.
ANON. 2001a. Nitrogen fixation in the Baltic Sea. Brief guide for environmental managers. Dept of Biology and Environmental Science, University of Kalmar, report 1:2001, 20 pp.
ANON. 2001b. Environmental quality in Swedish coast and sea, official statistics of Sweden. Swedish Environmental Protection Agency, Statistics Sweden, Db Grafiska, Örebro, 98 pp. (in Swedish).
ANON. 2001c. Aquatic environment of Fyn, Denmark, 1976-2000. Funen County Council, Nature Management and Water Environment, 148 pp.
ANON. 2003. Åland´s government and administrative board. Suggestions for an action plan for the water protection 2004-2007, 42 pp (in Swedish) URL: http:www.ls.aland.fi//.composer/upload/handl_prog_vattenvard.pdf (Acc 04/12/ 31).
ANON. 2004. Western Kattegat and surrounding fjords 2003. State and development. The county boards of Aarhus and North Jutland, Denmark, 112 pp. (in Danish). URL:http://www.nja.dk/Serviceomraader/NaturOgMiljoe/HavOgFjord/ (Acc 04/12/ 31).
APPELGREN, K., MATTILA, J. 2002. A proposal for quality standards for the archipelago of the Åland Islands. Unpublished report, Husö biological station, Åbo Akademi University and Åland´s government and administrative board, 38 pp. (in Swedish). URL: http://www.ls.aland.fi/socialomiljo/publikationer.pbs (Acc 04/12/31).
ATIS, M., M. PLIKSHS & D. USTUPS, 2003. Recent changes in the fish community structure of the southern part of the Gulf of Riga: effects of fishery or eutrophication? Poster at Baltic Sea Science Congress, Helsinki, Finland, August 2003.
138

References
AXE, P. & A.E. BJERKEBÆK LINDBERG, 2004. Hydrography/hydrochemistry. The Gulf of Bothnia 2003, annual report from the marine environmental control programme. Umeå Marine Research Centre, Sweden, pp. 8-10 (in Swedish).
BABENERD, B. 1991. Increasing oxygen deficiency in Kiel Bay (Western Baltic). A paradigm of progressing coastal eutrophication. Meeresforsch. 33: 121-140.
BADEN, S. P. & C. BOSTRÖM, 2001. The leaf canopy of seagrass beds: faunal community structure and function in a salinity gradient along the Swedish coast. In: Reise, K. (ed.), Ecological comparisons of sedimentary shores, Ecological Studies 151, Springer-Verlag, Berlin, pp. 213-236.
BADEN, S. P., L.-O. LOO, L. PIHL & R. ROSENBERG, 1990. Effects of eutrophication on benthic communities including fish: Swedish west coast. Ambio 19: 113-122.
BADEN, S., M. GULLSTRÖM, B. LUNDÉN, L. PIHL & R. ROSENBERG, 2003. Vanishing seagrass (Zostera marina, L.) in Swedish coastal waters. Ambio 32: 374-377.
BALTIC SEA PORTAL, 2004. Information on the Baltic Sea. Finnish Institute of Marine Research. URL: http://www.balticseaportal.fi (Acc 04/12/31).
BERGER, R. 2001. Factors affecting the reproductive ecology of Baltic Fucus vesiculosus – emphasis on the two reproductive strategies. Licentiate thesis, University of Kalmar, Sweden, 27 pp.
BERGER, R., L. BERGSTRÖM, E. GRANÉLI & L. KAUTSKY, 2004. How does eutrophication affect different life stages in Baltic Fucus vesiculosus? – a conceptual model. Hydrobiol. 514: 243-248.
BERGLUND, J., J. MATTILA, O. RÖNNBERG, J. HEIKKILÄ & E. BONSDORFF, 2003. Seasonal and inter-annual variation in occurrence and biomass of rooted macrophytes and drift algae in shallow bays. Est. Coast. Shelf Sci. 56: 1167-1175.
BERGSTRÖM, L. 2005. Marine macroalgae in the brackish Baltic Sea – responses to low salinity and nutrient enrichment. Ph.D. thesis, Umeå University, Sweden, 40 pp. + appendices.
BERGSTRÖM, L. & U. BERGSTRÖM, 1999. Species diversity and distribution of aquatic macrophytes in the Northern Quark, Baltic Sea. Nordic J. Bot. 19: 375-384.
BERNES, C. 1988. Sweden´s marine environment – ecosystems under pressure. National Swedish Environment Protection Board, 207 pp.
BERNET, 2000a. Aquatic Monitoring and Assessment. Volume I, Synthesis Baltic Eutrophication Regional Network (BERNET) Theme Report. Fyn County, Denmark, 50 pp.
BERNET, 2000b. Water Quality Planning. Baltic Eutrophication Regional Network (BERNET) Theme Report. Fyn County, Denmark, 156 pp.
BERZINSH, V. 1995. Hydrology. In: Ojaveer, E. (ed.), Ecosystem of the Gulf of Riga between 1920 and 1990. Estonian Academy Publishers, Tallinn, pp. 7-31.
BEXDEK, J.C. 1974. Cluster validity with fuzzy sets. J. Cybernetics 3: 58-73. BIANCHI, T.S., P. WESTMAN, C. ROLFF, E. ENGELHAUPT, T. ANDRÉN & R. ELMGREN,
2000. Cyanobacterial blooms in the Baltic Sea: natural or human-induced? Limnol. Oceanogr. 45: 716-726.
BLANC, I., D. FRIOT, M. MARGNI & O. JOLLIET, 2004. How to assess the environmental state of EU regions with the global concept of sustainability. 18th International Conference Informatics for Environmental Protection, Sh@ning, October 2004, Geneva, Switzerland, 11 pp. URL: http://www.enviroinfo2004.org (Acc 05/01/12).
139

References
BLOMQVIST, S., A. GUNNARS & R. ELMGREN, 2004. Why the limiting nutrient differs between temperate coastal seas and freshwater lakes: A matter of salt? Limnol. Oceanogr. 49: 2236-2241.
BOESCH, D.F. 2000. Measuring the health of the Chesapeake Bay: toward integration and prediction. Environ. Res. Section A 82: 134-142.
BOESCH, D.F. 2002. Challenges and opportunities for science in reducing nutrient over-enrichment of coastal ecosystems. Estuaries 25: 886-900.
BOING, 2005. Baltic On-line Interactive Geographical and Environmental Information Service. URL: http://www.boing.fimr.fi/index.html (Acc 05/01/12).
BONSDORFF, E. 1992. Drifting algae and zoobenthos – effects on settling and community structure. Neth. J. Sea Res. 30: 57-62.
BONSDORFF, E. & T. H. PEARSON, 1999: Variation in the sublittoral macrozoobenthos of the Baltic Sea along environmental gradients; a functional-group approach. Aust. J. Ecol. 24: 312-326.
BONSDORFF, E., K. AARNIO & A. LINDELL, 1990. Zoobenthos and hydrography in the Åland archipelago 1972-1990: Mariehamn and Eckerö 1990, and the overall situation in relation to eutrophication. Husö biological station, Åbo Akademi University, Finland, research report no. 75, 31 pp. (in Swedish with English summary).
BONSDORFF, E., K. AARNIO & E. SANDBERG, 1991. Temporal and spatial variability of zoobenthic communities in archipelago waters of the northern Baltic Sea - consequences of eutrophication. Int. Rev. ges. Hydrobiol. 76, 433-450.
BONSDORFF, E., A. NORKKO & C. BOSTRÖM, 1995. Recruitment and population maintenance of the bivalve Macoma balthica (L.) – factors affecting settling success and early survival in shallow sandy bottoms. Proc. 28th EMBS, Olsen & Olsen, Fredensborg, pp. 253-260.
BONSDORFF, E., E.M. BLOMQVIST, J. MATTILA & A. NORKKO, 1997a. Coastal eutrophication: causes, consequences and perspectives in the Archipelago areas of the northern Baltic Sea. Estuar. Coast. Shelf Sci. 44: 63-72.
BONSDORFF, E., E.M. BLOMQVIST, J. MATTILA & A. NORKKO, 1997b. Long-term changes and coastal eutrophication. Examples from the Åland islands and the Archipelago Sea, northern Baltic Sea. Oceanol. Acta 20: 319-329.
BONSDORFF, E., A.O. LAINE, J. HÄNNINEN, I. VUORINEN & A. NORKKO, 2003. Zoobenthos of the outer archipelago waters (N. Baltic Sea) – the importance of local conditions for spatial distribution patterns. Bor. Env. Res. 8: 135-145.
BOSTRÖM, C., S.P. BADEN & D. KRAUSE-JENSEN, 2003. The seagrasses of Scandinavia and the Baltic Sea. In: Green, E.P. & F.T. Short (eds.), World atlas of seagrasses. UNEP World Conservation Monitoring Centre. University of California Press, Berkley, USA, pp. 27-37.
BOSTRÖM, C., E. BONSDORFF, P. KANGAS & A. NORKKO, 2002. Long-term changes of a brackish-water eelgrass (Zostera marina L.) community indicate effects of coastal eutrophication. Est. Coast. Shlef Sci. 55: 795-804.
BOTHNIAN BAY LIFE, 2004. The Bothnian Bay Life data base. URL: http://www.ymparisto.fi/perameri (Acc 04/12/31).
BRATTBERG, G. 1986. Decreased phosphorus loading changes phytoplankton composition and biomass in the Stockholm archipelago. Vatten 42: 141-153.
BREUER, G. & W. SCHRAMM, 1988. Changes in macroalgal vegetation of Kiel Bight (Western Baltic Sea) during the past 20 years. Kieler Meeresforsch., Sonderh. 6: 241-255.
140

References
BRICKER, S. B., C. G. CLEMENT, D. E. PIRHALLA, S. P. ORLANDO & D. R. G. FARROW, 1999. National estuarine eutrophication assessment: Effects of nutrient enrichment in the nation´s estuaries. NOAA, National Ocean Service, Special projects office and the national centers for coastal ocean science. Silver Spring, MD: 71 pp.
BÄCK, S. & A. RUUSKANEN, 2000. Distribution and maximum growth depth of Fucus vesiculosus along the Gulf of Finland. Mar. Biol. 136: 303-307.
BÄCK, S., J. EKEBOM & P. KANGAS, 2002. A proposal for a long-term baseline phytobenthos monitoring programme for the Finnish Baltic coastal waters: monitoring submerged rocky shore vegetation. Environ. Monit. Assess. 79: 13-27.
BÄCK, S., A. LEHVO & J. BLOMSTER, 2000. Mass occurrence of unattached Enteromorpha intestinalis on the Finnish Baltic Sea coast. Ann. Bot. Fennici 37: 155-161.
BÄCK, S., A. MÄKINEN, J. RISSANEN & O. RÖNNBERG, 1993. Phytobenthos monitoring. Two case studies from the Finnish Baltic coast in summer 1993. Memorandum 1, Ministry of the Environment, 24 pp.
CARSTENSEN, J., D.J. CONLEY & P. HENRIKSEN, 2004. Frequency, composition and causes of summer phytoplankton blooms in a shallow coastal ecosystem, the Kattegat. Limnol. Oceanogr. 49: 190-201.
CARSTENSEN, J., D. CONLEY & B. MÜLLER-KARULIS, 2003. Spatial and temporal resolution of carbon fluxes in a shallow coastal ecosystem, the Kattegat. Mar. Ecol. Prog. Ser. 252: 35-50.
CEDERWALL, H., 1996. Soft bottomfauna. The Baltic Sea 1995, Swedish report on the environmental state of the Baltic proper, Stockholm Marine Research Institute, Sweden, pp. 32-35 (in Swedish).
CEDERWALL, H. 2003. Anoxic conditions in the deep. Swedish report on the environmental state of the Baltic proper 2003, Stockholm Marine Research Institute, pp. 56-58 (in Swedish with English summary). URL: http://www.smf.su.se (Acc 04/12/31).
CEDERWALL, H. & M. BLOMQVIST, 1991. Long term changes in soft bottom macrofauna in the Gulf of Bothnia - a sign of eutrophication. Acta Ichthyologica et Piscatoria, XXI Suppl. (Proc. 11th Baltic Marine Biologists), pp. 39-40.
CEDERWALL, H. & R. ELMGREN, 1980. Biomass increase of benthic macrofauna demonstrates eutrophication of the Baltic Sea. Ophelia, Supp. 1:287-304.
CEDERWALL, H. & R. ELMGREN, 1990. Biological effects of eutrophication in the Baltic Sea, particularly the coastal zone. Ambio 19: 109-112.
CEDERWALL, H. & B. SJÖBERG, 1995. Baltic marine bottomfauna after the inflow of saline water in 1993-94. The Baltic Sea 1994, Swedish report on the environmental state of the Baltic proper, Stockholm Marine Research Institute, Sweden, (in Swedish).
CEDERWALL, H., V. JERMAKOVS & G. LAGZDINS, 1999. Long-term changes in the soft-bottom macrofauna of the Gulf of Riga. ICES Journal of Marine Sciences, 56 Suppl.: 41-48.
CHEN, Q. & A.E. MYNETT, 2003. Integration of data mining techniques and heuristic knowledge in fuzzy logic modelling of eutrophication in Taihu Lake. Ecol. Model. 162: 55-67.
CISZEWSKI, P., L. KRUK-DOWGIALLO & E. ANDRULEWICZ, 1991. A study on pollution of the Puck Lagoon and possibility of restoring the Lagoon´s original ecological
141

References
state. Acta Ichthyologica et piscatoria, XXI Supp. (Proc. 11th Baltic Marine Biologists), pp. 29-37.
CISZEWSKI, P., L. KRUK-DOWGIALLO & L. ZMUDZINSKI, 1992a. Deterioration of the Puck Bay and biotechnical approaches to its reclamation. In: Bjørnestad, E., L. Hagerman & K. Jensen (eds.), Proc. 12th Baltic Marine Biologists, Olsen & Olsen, Fredensborg, pp. 43-46.
CISZEWSKI, P., I. CISZEWSKA, L. KRUK-DOWGIALLO, A. OSOWIECKI, D. RYBICKA, J. WIKTOR, M. WOLSKA-PYS, L. ZMUDZINSKI & D. TROKOWICZ, 1992b. Trends of long-term alterations of the Puck Bay ecosystem. Studia imaterialy oceanologiczne nr. 60, Marine biology 8: 33-84.
CLOERN, J. E. 2001. Our evolving conceptual model of the coastal eutrophication problem. Mar. Ecol. Prog. Ser. 210: 223-253.
CONLEY, D.J., H. KAAS, F. MØHLENBERG, B. RASMUSSEN & J. WINDOLF, 2000. Characteristics of Danish Estuaries. Estuaries 23: 820-837.
CONLEY, D.J., S. MARKAGER, J. ANDERSEN, T. ELLERMANN & L.M. SVENDSEN, 2002. Coastal eutrophication and the Danish National Aquatic Monitoring and Assessment Program. Estuaries 25: 848-861.
CONLEY, D. J., A. STOCKENBERG, R. CARMAN, R.W. JOHNSTONE, L. RAHM & F. WULFF, 1997. Sediment-water nutrient fluxes in the Gulf of Finland, Baltic Sea. Estuar. Coast. Shelf Sci. 45: 591-598.
COSTANZA, R. 1996. Ecological economics: reintegrating the study of humans and nature. Ecol. Applic. 6: 978-990.
COUNTY ADMINISTRATION VÄSTRA GÖTALAND, SWEDEN, 2001. Algae in excess - harvesting for life, EU-Life Algae. URL: http://www.o.lst.se (Acc 04/12/31).
CYBERSKA, B. & W. KRZYMINSKI 1996. Thermohaline conditions in the Gdansk Basin. Oceanological Studies XXV: 17-39.
DAHLGREN, S. & L. KAUTSKY, 2002. Distribution and recent changes in benthic macrovegetation in the Baltic Sea basins – literature review. Dept of botany, Stockholm University, Sweden, 36 pp.
DAHLGREN, S. & L. KAUTSKY, 2004. Can different vegetative states in shallow coastal bays of the Baltic Sea be linked to internal nutrient levels and external nutrient load? Hydrobiol. 514: 249-258.
DANILOV, R.A. & N.G.A. EKELUND, 2001. Comparative studies on the usefulness of seven ecological indices for the marine coastal monitoring close to the shore on the Swedish east coast. Environ. Monit. Assess. 66: 265-279.
DE GALAN, S., M. ELSKENS, L. GOEYENS, A. POLLENTIER, N. BRION & W. BAEYENS, 2004. Spatial and temporal trends in nutrient concentrations in the Belgian continental area of the North Sea during the period 1993-2000. Est. Coast. Shelf Sci. 61: 517-528.
DE JONGE, V.N., M. ELLIOTT & E. ORIVE, 2002. Causes, historical development, effects and future challenges of a common environmental problem: eutrophication. Hydrobiol. 475/476: 1-19.
DE JONGE, V.N., W. BOYNTON, C.F. D´ELIA, R. ELMGREN & B.L. WELSH, 1994. Responses to developments in eutrophication in four different North Atlantic estuarine systems. In: Dyer, K. R . & R. J. Orth (eds.), Changes in fluxes in estuaries. ECSA 22/ERF, Olsen & Olsen, Fredensborg, pp. 179-196.
DIAZ, R.J. & R. ROSENBERG, 1995. Marine benthic hypoxia: a review of its ecological effects and the behavioural responses of benthic macrofauna. Oceanogr. Mar. Biol. Annu. Rev. 33: 245-303.
142

References
DIPPNER, J.W. & A. IKAUNIECE, 2001. Long-term zoobenthos variability in the Gulf of Riga in relation to climate variability. J. Mar. Syst. 30: 155-164.
DUNLAP, R.E. 1993. From environmental to ecological problems. In: Calhoun, C. & G. Ritzer (eds.), Social problems, McGraw-Hill, New York, pp. 707-738.
DUNLAP, R.E. & W.R. CATTON, JR., 2002. Which function(s) of the environment do we study? A comparison of environmental and natural resource sociology. Soc. Nat. Resour. 15: 239-249.
EILOLA, K. 2002. Modeling of the water quality: Åland archipelago. Ocean Origo, Marine Systems Analysis, Göteborg, Sweden, report: 2002-07-31, 21 pp. (in Swedish).
ELLIOTT, M. 2002a. The role of the DPSIR approach and conceptual models in marine environmental management: an example for offshore wind power. Mar. Poll. Bull. 44: iii-vii.
ELLIOTT, M. 2002b. An overview of the status, study and management of fishes in estuaries. In: Elliott, M. & K.L. Hemingway (eds.), Fishes in estuaries, Blckwell Science, Oxford, pp. 555-575.
ELLIOTT, M. & V.N. DE JONGE, 1996. The need for monitoring the monitors and their monitoring. Mar. Poll. Bull. 32: 248-249.
ELLIOTT, M. & V.N. DE JONGE, 2002. The management of nutrients and potential eutrophication in estuaries and other restricted water bodies. Hydrobiol. 475/476: 513-524.
ELMGREN, R. & U. LARSSON (eds.), 1997. The Himmerfjärden bay. Changes in a nutrient enriched coastal ecosystem in the Baltic Sea. Swedish Environmental Protection Agency, report no. 4565, 197 pp. (in Swedish with English summary).
ELMGREN, R. & U. LARSSON, 2001. Eutrophication in the Baltic Sea area: integrated coastal management issues. In: von Bodungen, B. & R. K. Turner (eds.), Science and integrated coastal management, Dahlem University Press, Berlin, pp. 15-35.
ELMGREN, R. R. ROSENBERG, A-B. ANDERSIN, S. EVANS, P. KANGAS, J. LASSIG, E. LEPPÄKOSKI & R. VARMO, 1984. Benthic macro- and meiofauna in the Gulf of Bothnia (Northern Baltic). Finnish Marine Research, 250: 3-18.
ELOFSSON, K. 2002. Economics of marine pollution. Ph.D. thesis, Acta Universitatis Agriculturae Sueciae, Agraria 348, Swedish University of Agricultural Sciences, 41 pp. + appendices.
EMEIS, K-C., U. STRUCK, T. LEIPE, F. POLLEHNE, H. KUNZENDORF & C. CHRISTIANSEN, 2000. Changes in the C, N, P burial rates in some Baltic Sea sediments over the last 150 years – relevance to P regeneration rates and the phosphorus cycle. Mar. Geol. 167: 43-59.
ENEA, M. & G. SALEMI, 2001. Fuzzy approach to the environmental impact evaluation. Ecol. Model. 135: 131-147.
ENGEL, A., M. MEYERHÖFER & K. VON BRÖCKEL, 2002. Chemical and biological composition of suspended particles and aggregates in the Baltic Sea in summer (1999). Est. Coast. Shelf Res. 55: 729-741.
ENGQVIST, A. 2002. The water exchange in the Stockholm archipelago, a graphic overview. Report from The Coastal Water Protection Board in Svealand and Stockholm University, Sweden, 18 pp. (in Swedish).
ENGKVIST, R., J. NILSSON & S. TOBIASSON, 2002. Temporal and geographical patterns of distribution of the brown macroalgae Fucus vesiculosus and Fucus serratus in the counties of Blekinge and Kalmar, SE Sweden. Dept of biology and environmental science, University of Kalmar, Sweden, report 2002:4, 31 pp. +
143

References
appendices (in Swedish with English summary). URL: http://www.k.lst.se/ version1/miljo/miljoovo/index.htm (Acc 04/12/31).
ERIKSSON, B.K., G. JOHANSSON & P. SNOEIJS, 1998. Long-term changes in the sublittoral zonation of brown algae in the southern Bothnian Sea. Eur. J. Phycol. 33: 241-249.
ERIKSSON, B.K., A. SANDSTRÖM, M. ISÆUS, H. SCHREIBER & P. KARÅS, 2004. Effects of boating activities on aquatic vegetation in the Stockholm archipelago, Baltic Sea. Est. Coast. Shelf Sci. 61: 339-349.
ERKKILÄ, A. & R. KALLIOLA, 2004. Patterns and dynamics of coastal waters in multi-temporal satellite images: support to water quality monitoring in the Archipelago Sea, Finland. Est. Coast. Shelf Sci. 60: 165-177.
FALANDYSZ, J., A. TROZOSINSKA, P. SZEFER, J. WARZOCHA & B. DRAGANIK, 2000. The Baltic Sea, especially southern and eastern regions. In: Sheppard, C. (ed.), Seas at the millennium, an environmental evaluation. Volume I, Regional Chapters: Europe, the Americas and West Africa. Pergamon, Elsevier Sciences, Oxford, pp. 99-120.
FEISTEL, R., G. NAUSCH, V. MOHRHOLZ, E. ŁYSIAK-PASTUZAK, T. SEIFERT, W. MATTHÄUS, S. KRÜGER & I. SEHESTED HANSEN, 2003. Warm waters of summer 2002 in the deep Baltic Proper. Oceanologia 45: 571-592.
FELLESEN, G., 1992. How sewage discharge, terrestrial run-off and oxygen deficiencies affect the bottom fauna in Århus Bay, Denmark. In: Colombo, G., I. Ferrari, V.U. Ceccherelli & R. Rossi (eds.), Marine eutrophication and population dynamics. Olsen & Olsen, Fredensborg, pp. 29-33.
FEUERPFEIL, P., T. RIELING, S.R. ESTRUM-YOUSEFF, J. DEHMLOW, T. PAPENFUß, A. SCHOOR, U. SCHIEWER & H. SCHUBERT, 2004. Carbon budget and pelagic community composition at two coastal areas that differ in their degree of eutrophication, in the southern Baltic Sea. Mar. Poll. Bull. 61: 89-100.
FINNI, T., K. KONONEN, R. OLSONEN & K. WALLSTRÖM, 2001. The history of cyanobacterial blooms in the Baltic Sea. Ambio 30: 172-178.
FLINKMAN, J., E. ARO, I. VUORINEN & M. VIITASALO, 1998. Changes in northern Baltic zooplankton and herring nutrition from 1980s to 1990s: top-down and bottom-up processes at work. Mar. Ecol. Prog. Ser. 165: 127-136.
FOLKE, C., C.S. HOLLING & C. PERRINGS, 1996. Biological diversity, ecosystems and the human scale. Ecol. Applic. 6: 1018-1024.
FONSELIUS, S. & J. VALDERAMA, 2003. One hundred years of hydrographic measurements in the Baltic Sea. J. Sea Res. 49: 229-241.
FRANKOWSKI, L., J. BOLAŁEK & A. SZOSTEK, 2002. Phosphorus in bottom sediments of Pomeranian Bay (southern Baltic-Poland). Est. Coast. Shelf Sci. 54: 1027-1038.
FREDRIKSEN, M., D. KRAUSE-JENSEN, M. HOLMER & J.S. LAURSEN, 2004a. Long-term changes in area distribution of eelgrass (Zostera marina) in Danish coastal waters. Aquat. Bot. 78: 167-181.
FREDRIKSEN, M., D. KRAUSE-JENSEN, M. HOLMER & J.S. LAURSEN, 2004b. Spatial and temporal variation in eelgrass (Zostera marina) landscapes: influence of physical setting. Aquat. Bot. 78: 147-165.
FYNS AMT, 2004a. Coastal water 2003. Report of the aquatic environment in the Funen region, Denmark. Funen County Council, Denmark, 275 pp (in Danish). URL: http://www.fyns-amt.dk/wm114941 (Acc 04/12/31).
FYNS AMT, 2004b. The Funen region county in Denmark. URL:http://www.funen county.dk/ (Acc 04/12/31).
144

References
GAUMIGA, R., V. BERZINSH & E. URTANS, 1997. Impact of environmental factors on the fish community of the Gulf of Riga. In: Andrushaitis, A. (ed.): Proc. 13th Baltic Marine Biologists, Inst. Aquatic Ecology, University of Latvia, pp. 205-210.
GOLUBKOV, S.M., A.F. ALIMOV, I.T. TELESH. L.E. ANOKHINA, A.A. MAXIMOV, V.N. NIKULINA, E.B. PAVELEVA, V.E. PANOV, 2003. Functional response of midsummer planktonic and benthic communities in the Neva Estuary (eastern Gulf of Finland) to anthopogenic stress. Ocenaologia 45: 53-66.
GRANÉLI, E. 1984. Algal growth potential and limiting nutrients for phytoplankton production in Öresund water of Baltic and Kattegat origin. Limnologica 15: 563-569.
GRAY, J.S., R.S.S. WU & Y.Y. OR, 2002. Effects of hypoxia and organic enrichment on the coastal marine environment. Mar. Ecol. Prog. Ser. 238: 249-279.
GRIDA 2001. UNEP/GRID-Arendal. Baltic Environment Atlas. URL: http//www. grida.no/baltic/ (Acc 05/01/18).
GUNDERSEN, K. 2002. The Baltic Sea plankton distribution. Unpublished report within the MARE programme, 101 pp.
GUSTAFSSON, B. & P. WESTMAN, 2002. On the causes for salinity variations in the Baltic Sea during the last 8500 years. Paleoceanography 17 (3): 14 pp.
GÖRANSSON, P., 1999. Zoobenthos at two sampling stations in the southern Kattegat. Fauna och Flora 94: 125-138 (in Swedish).
HAAHTI, . & P. KANGAS (eds.), 2004. The state of the Gulf of Finland 2003. Meri - Report Series of the Finnish Institute of Marine Research No. 51: 20 p.
HAJDU, S., U. LARSSON & L. ANDERSSON, 2000. Surface water and phytoplankton. Baltic Sea 1999, Swedish report on the environmental state of the Baltic proper, Stockholm Marine Research Institute, pp. 17-22 (in Swedish with English summary).
HAJDU, S., U. LARSSON & J. WALVE, 2003. Diazotrophs – an important nitrogen source. Swedish report on the environmental state of the Baltic proper 2003, Stockholm Marine Research Institute, pp. 48-51 (in Swedish with English summary). URL: http://www.smf.su.se (Acc 04/12/31).
HAMMER, M. 2000. Fishery and fish farming in the archipelago, an ecosystem approach. In: Numers, von M., Environment in the archipelago – state, problems and possibilities. Kirjapaino Grafia Oy, Turku, pp. 33-40 (in Swedish).
HANSSON, S. 2001. Fish in the Baltic Sea – fishery and eutrophication. Fauna och Flora 95(4): 169-176.
HANSSON, S. & L. G. RUDSTAM, 1990. Eutrophication and the Baltic fish communities. Ambio 19: 123-125.
HEEMSKERK, M., K. WILSON & M. PAVAO-ZUCKERMAN, 2003. Conceptual models as tools for communication across disciplines. Conserv. Ecol. 7(3): 8, 13 pp. URL: http://www.consecol.org/vol7/iss3/art8 (Acc 05/01/12).
HEISKANEN, A-S. 1998. Factors governing sedimentation and pelagic nutrient cycles in the northern Baltic Sea. Ph.D. thesis, University of Helsinki, Monographs of Bor. Env. Res. 8, 80 pp.
HELCOM, 1990. Second periodic assessment of the state of the marine environment of the Baltic Sea, 1984-1988; background document. Baltic Sea Environ. Proc. No. 35B: 432 pp.
HELCOM, 1996. Third periodic assessment of the state of the marine environment in the Baltic Sea 1989-1993; background document. Baltic Sea Environ. Proc. No. 64B, 252 pp.
145

References
HELCOM 1998. Red list of marine and coastal biotopes and biotope complexes of the Baltic Sea, Belt Sea and Kattegat. Baltic Sea Environ. Proc. No. 75, 115 pp.
HELCOM, 2002. Environment of the Baltic Sea area 1994-1998. Baltic Sea Environ. Proc. No. 82B, 215 pp.
HELCOM, 2003a. The Baltic Marine Environment 1999-2002. Baltic Sea Environ. Proc. No. 87, 46 pp.
HELCOM, 2003b. Helsinki Commission, state of the Baltic Sea in 2003. URL: http//www.helcom.fi/ (Acc 04/12/31).
HELCOM-HOT SPOTS, 2004. Helsinki Commission, list of hot spots in the Baltic Sea. URL: http://www.helcom.fi/pollution/hotspots.html (Acc 04/12/31).
HELMINEN, U., A. MÄKINEN & O. RÖNNBERG, 2000. Aerial survey of recent changes in the occurrences of Fucus vesiculosus in the Archipelago Sea, SW Finland. Abstract at Nessling foundation symposium “Man and the Baltic Sea”, Helsinki, Finland, October 2000.
HENRIKSSON, R., 1969. Influence of pollution on the bottom fauna of the Sound (Öresund). Oikos 20: 507-523.
HERBST, R. 2002. The state of the Chesapeake Bay. A report to the citizens of the bay region. U.S. Environmental Protection Agency, Chesapeake Bay Program Office, 65 pp. URL: http://www.chesapeake.net (Acc 05/01/11).
HJERNE, O. 2003. Fisheries management in an ecological context – examples from the Baltic Sea. Ph.D. thesis, Stockholm University, Sweden, 27 pp. + appendices.
HJERNE, O. & S. HANSSON, 2002. The role of fish and fisheries in Baltic Sea nutrient dynamics. Limnol. Oceanogr. 47: 1023-1032.
HOLMQVIST, M., M. APPELBERG & G. FORSGREN, 2003. Strategy for co-ordinated regional/national monitoring of the coastal fish fauna in the Gulf of Bothnia. Poster at the Baltic Sea Science Congress, Helsinki, Finland, August 2003.
HOLMSTRÖM, A. 1998. Occurrence, species composition, biomass and decomposition of drifting algae in the northwestern Åland archipelago, N. Baltic Sea. M.Sc. thesis, Åbo Akademi University, Finland, 69 p. (In Swedish with English abstract).
HORACKIEWICZ, J. & K. E. SKORA, 1998. A seasonal pattern of occurrence of gobiid fish (Gobiidae) in the shallow littoral zone (0-1 m depth) of Puck Bay. Oceanological Studies 27, no. 3: 3-17.
HUMBORG, C., Å. DANIELSSON, B. SJÖBERG & M. GREEN, 2003. Nutrient land-sea fluxes in oligotrophic and pristine estuaries of the Gulf of Bothnia, Baltic Sea. Est. Coast. Shelf Sci. 56: 781-793.
HUMBORG, C., D. J. CONLEY, L. RAHM, F. WULFF, A. COCIASU & V. ITTEKKOT, 2000. Silicon retention in river basins: far-reaching effects on biogeochemistry and aquatic food webs in coastal marine environments. Ambio 29: 45-50.
HUSÖ BIOLOGICAL STATION, 2004. The water environment around the Åland islands, 2003, updated version (in Swedish). URL: http://www.abo.fi/fak/mnf/biol/huso/ (Acc 04/12/31).
HÅKANSSON, B. 2003 (ed.). Swedish national report on eutrophication status in the Kattegat and the Skagerrak. OSPAR assessment 2002. Swedish Meteorological and Hydrological Institute, Reports Oceanography no. 31, 79 pp. URL: http://www.smhi.se (Acc 04/12/31).
HÅKANSSON, B., P. ALENIUS & L. BRYDSTEN, 1996. Physical environment in the Gulf of Bothnia. Ambio special report 8: 5-12.
146

References
HÄKKILÄ, S., M. PUHAKKA, M. RAJASILTA & P. BACH, 1993. Spatial and temporal changes of the benthic communities in the SW archipelago of Finland. Aqua Fennica 23: 187-191.
HÄNNINEN, J. & I. VUORINEN, 2001. Macrozoobenthos structure in relation to environmental changes in the Archipelago Sea, northern Baltic Sea. Bor. Env. Res. 6: 93-105.
HÄNNINEN, J., I. VUORINEN, H. HELMINEN, T. KIRKKALA & K. LEHTILÄ, 2000. Trends and gradients in nutrients concentrations and loading in the Archipelago Sea, Northern Baltic, in 1970-1997. Estuar. Coast. Shelf Sci. 50: 153-171.
JAHN, D. & K. KUITTO, 2005. Environmental pollution and economic performance in the Baltic Sea region. Working-paper, GOVCOM-project, BIREME (Baltic Sea research programme), Academy of Finland.
JAKOBSEN, F. 1997. Hydrographic investigation of the Northern-Kattegat front. Cont. Shelf Res. 17. 533-554.
JANAS, U., J. WOCIAL & A. SZANIAWSKA, 2004. Seasonal and annual changes in the macrozoobenthic populations of the Gulf of Gdansk with respect to hypoxia and hydrogen sulphide. Oceanologica 46: 85-102.
JANSONE, B. 1995. Phytoplankton and primary production. Concentrations of chlorophyll a in the Gulf of Riga. In: Ojaveer, E. (ed.), Ecosystem of the Gulf of Riga between 1920 and 1990. Estonian Academy Publishers, Tallinn, pp. 127-130.
JANSSON, B-O. 1997. The Baltic Sea: current and future status and impact of agriculture. Ambio 26: 424-431.
JANSSON, B-O. & K. DAHLBERG, 1999. The environmental status of the Baltic Sea in the 1940s, today, and in the future. Ambio 28: 312-319.
JANSSON, B-O. & H. VELNER, 1995. The Baltic: the sea of surprises. In: Gunderson, L. H., C. S. Holling & S. S. Light (eds.), Barriers and bridges to the renewal of ecosystems and institutions, Columbia University Press, New York: 292-372.
JANSSON, T. 1998. Coast and watercourse, the state of environment in the county of Kalmar in 1998. Administrator Board of Kalmar County, Sweden, report 19:1998, 34 pp, (in Swedish). URL: http://www.h.lst.se (Acc 04/12/31).
JOHANSSON, A. 1999. Early problems. Baltic Sea 1998, Swedish report on the environmental state of the Baltic proper, Stockholm Marine Research Institute, pp. 15-17 (in Swedish).
JONSSON, P. (ed.), 2003. The archipelago bottoms. A compilation of sediment studies 1992-1999 in the archipelago areas along the Swedish east coast. Swedish Environmental Protection Agency, report 5212, 112 pp (in Swedish with English summary).
JOSEFSON, A.B. & J.N. JENSEN, 1992. Effects of hypoxia on soft-sediment macrobenthos in southern Kattegat. In: Colombo, G., I. Ferrari, V.U. Ceccherelli & R. Rossi (eds.), Marine eutrophication and population dynamics, Proc. 25th EMBS. Olsen & Olsen, Fredensborg, pp 21-28.
JOSEFSON, A.B., J.N. JENSEN & G. ÆRTEBJERG, 1993. The benthos community structure anomaly in the late 1970s and early 1980s – a result of a major food pulse. J. Exp. Mar. Biol. Ecol. 172: 31-45.
JUHNA, T. & M. KLAVINS, 2001. Water-quality changes in Latvia and Riga 1980-2000: possibilities and problems. Ambio 30: 306-314.
JUMPPANEN, K. & J. MATTILA, 1994. The development of the state of the Archipelago Sea and the environmental factors affecting it. South-West Finland Water Protection Board, report 82, 206 pp. (In Finnish, with English summary).
147

References
JØRGENSEN, B.B. & K. RICHARDSON (eds.), 1996. Eutrophication in coastal marine ecosystems. Coastal and Estuarine Studies 52, American Geophysical Union, Washington DC, 272 pp.
KAAS, H., Ø. MOESTRUP, J. LARSEN & P. HENRIKSEN, 1999. Toxic algae and algal blooms. National Environmental Research Institute in Denmark, 64 pp. (in Danish).
KAAS, H., F. MØHLENBERG, A. JOSEFSON, B. RASMUSSEN, D. KRAUSE-JENSEN, H.S. JENSEN, L.M. SVENDSEN, J. WINDOLF, A.L. MIDDLEBOE, K. SAND-JENSEN & M. FOLDAGER PEDERSEN, 1996. Marine areas. Danish inlets - state of the environment, trends and causal relations. National Environmental Research Institute in Denmark, report no. 179, 206 pp. (in Danish with English summary).
KAHRU, M., U. HORSTMANN & O. RUD, 1994. Satellite detection of increased cyanobacteria blooms in the Baltic Sea: natural fluctuation or ecosystem change? Ambio 23: 469-472.
KAHRU, M., J-M. LEPPÄNEN, O. RUD & O.P. SAVCHUK, 2000. Cyanobacteria blooms in the Gulf of Finland triggered by saltwater inflow into the Baltic Sea. Mar. Ecol. Prog. Ser. 207: 13-18.
KAJRUP, N. 1999. Hydrography and hydrochemistry. The Gulf of Bothnia 1998, annual report from the marine environmental control programme. Umeå Marine Research Centre, Sweden, pp. 8-9 (in Swedish).
KAJRUP, N. 2000. Hydrography and hydrochemistry. The Gulf of Bothnia 1999, annual report from the marine environmental control programme. Umeå Marine Research Centre, Sweden, pp. 7-8 (in Swedish).
KANGAS, P., S. KNUUTTILA, A. LAINE, J. LEHTORANTA, H. PITKÄNEN, H. PELTONEN, P. VÄLIPAKKA & L. VILLA, 2003. On the state of bottom sediments and macrofauna along the northern archipelago of the Gulf of Finland in 1999-2003. Poster at Baltic Sea Science Congress, Helsinki, Finland, August 2003.
KANOSHINA, I., U. LIPS & J-M. LEPPÄNEN, 2003. The influence of weather conditions (temperature and wind) on cyanobacterial bloom development in the Gulf of Finland (Baltic Sea). Harmful Algae 2: 29-41.
KARLSON, K., R. ROSENBERG & E. BONSDORFF, 2002. Temporal and spatial large-scale effects of eutrophication and oxygen deficiency on benthic fauna in Scandinavian waters – a review. Oceanogr. Mar. Biol. Annu. Rev. 40: 427-489.
KARLSSON, A. & K. LEONARDSSON, 2004. Soft zoobenthos. The Gulf of Bothnia, annual report from the marine environmental control programme. Umeå Marine Research Centre, Sweden, pp. 14-16 (in Swedish).
KARÅS, P. 1998. Low recruitment of fish in the Kalmar sound. Baltic Sea 1997, Swedish report on the environmental state of the Baltic proper, Stockholm Marine Research Institute, pp. 25 (in Swedish).
KARÅS, P., E. NEUMAN & O. SANDSTRÖM, 1991. Effects of a pulp mill effluent on the population dynamics of perch, Perca fluviatilis. Can. J. Fish. Aquat. Sci. 48(1): 28-34.
KAUPPI. L. (ed.) 1993. Mass mortalities of seabirds in the eastern Gulf of Finland in spring 1992. Publications of the Water and Environment Administration – Series A 142, 46 pp. (in Finnish with an English summary).
KAUPPILA, P. & S. BÄCK, 2001. The state of Finnish coastal waters in the 1990s. The Finnish Environment 472, Finnish Environment Institute, Helsinki, 134 pp.
KAUPPILA, P., J.J. MEEUWIG & H. PITKÄNEN, 2003. Predicting oxygen in small estuaries of the Baltic Sea: a comparative approach. Est. Coast. Shelf Sci. 57: 1115-1126.
148
References
KAUPPILA, P., G. HÄLLFORS, P. KANGAS, P. KOKKONEN & S. BASOVA, 1995. Late summer phytoplankton species composition and biomasses in the eastern Gulf of Finland. Ophelia 42: 179-191.
KAUTSKY, H. 1999. Changes in vegetative bottoms. Baltic Sea 1998, Swedish report on the environmental state of the Baltic proper, Stockholm Marine Research Institute, pp.6-10 (in Swedish).
KAUTSKY, H. & M. FOBERG, 1999. Inventory of shores and shallow, vegetative bottoms in the outer archipelago of Vågön-Ulvöarna-Storön, Höga Kusten, Sweden in July-August 1998. Unpublished report (in Swedish).
KAUTSKY, H. & M. FOBERG, 2001. Coastal vegetation and fauna communities in shallow bays in the Råneå archipelago, N. Sweden in 1999. The County Board of Norrbotten, Sweden, report series 8/2001. URL: http://www.bd.lst.se (Acc 04/12/ 31).
KAUTSKY, H., G. MARTIN, A. MÄKINEN, M. BORGIEL, P. VAHTERI & J. RISSANEN, 1999. Structure of phytobenthic and associated animal communities in the Gulf of Riga. Hydrobiol. 393: 191-200.
KAUTSKY, L. & N. KAUTSKY, 2000. The Baltic Sea, including Bothnian Sea and Bothnian Bay. In: Sheppard, C. (ed.), Seas at the millennium, an environmental evaluation. Volume I, Regional Chapters: Europe, the Americas and West Africa. Pergamon, Elsevier Sciences, Oxford, pp.121-134.
KAUTSKY, L., Y. NORBERG, G. ANEER & A. ENGQVIST, 2000. Under the surface in the Stockholm archipelago. Administration Board of Stockholm County, 142 pp. (in Swedish).
KAUTSKY, N., H. KAUTSKY, U. KAUTSKY & M. WÆRN, 1986. Decreased depth penetration of Fucus vesiculosus (L.) since the 1940s indicate eutrophication of the Baltic Sea. Mar. Ecol. Prog. Ser. 28: 1-8.
KERN, K. & T. LÖFFELSEND, 2004. Governance beyond the nation state in the Baltic Sea region. Local Environ. 9: 451-467.
KIIRIKKI, M. 1996. Dynamics of macroalgal vegetation in the northern Baltic Sea – evaluating the effects of weather and eutrophication. Ph. D. thesis, University of Helsinki, Finland, Walter and Andrée de Nottbeck foundation scientific reports No. 12, 15 pp. + appendices.
KIIRIKKI, M., A. INKALA, H. KUOSA, H. PITKÄNEN, M. KUUSISTO & J. SARKKULA, 2001. Evaluating the effects of nutrient load reductions on the biomass of toxic nitrogen-fixing cyanobacteria in the Gulf of Finland, Baltic Sea. Bor. Env. Res. 6: 131-146.
KIIRIKKI, M., P. RANTANEN, R. VARJOPURO, A. LEPPÄNEN, M. HILTUNEN, H. PITKÄNEN, P. EKHOLM, E. MOUKHAMETSHINA, A. INKOLA, H. KUOSA & J. SARKKULA, 2003. Cost effective water protection in the Gulf of Finland, focus on St. Petersburg. The Finnish Environment No. 632, Finnish Environment Institute, Helsinki, Finland, 55 pp.
KINZIG, A. & D. STARRETT et al. 2003. Coping with uncertainty: a call for a new science-policy forum. Ambio 32: 330-335.
KIRKKALA, T. 1998. How are the Archipelago Sea? Sout-West Finland´s Regional Environment Centre, 70 pp. (in Finnish or Swedish).
KIRKKALA, T., H. HELMINEN & A. ERKKILÄ, 1998. Variability of nutrient limitation in the Archipelago Sea, SW Finland. Hydrobiol. 363: 117-126.
KOHONEN, T., P. VAHTERI, U. HELMINEN, M. SIHVONEN & I. VUORINEN, 2004. Reproduction areas of fishes in the Archipelago Sea. Seili Archipelago Research Institute Publications 2, University of Turku, Finland, 109 pp. (in Finnish).
149

References
KONONEN, K. 2001. Eutrophication, harmful algal blooms and species diversity in phytoplankton communities: examples from the Baltic Sea. Ambio 30: 184-189.
KONONEN, K. & J-M. LEPPÄNEN, 1997. Patchiness, scales and controlling mechanisms of cyanobacterial blooms in the Baltic Sea: application of a multiscale research strategy. In: Kahru, M. & C. W. Brown (eds.), Monitoring algal-blooms: new techniques for detecting large-scale environmental change, Landes Bioscience, Austin, pp: 63-84.
KONONEN, K., S. HÄLLFORS, M. KOKKONEN, H. KUOSA, J. LAANEMETS, J. PAVELSON & R. AUTIO, 1998. Development of a subsurface chlorophyll maximum at the entrance to the Gulf of Finland, Baltic Sea. Limnol. Oceanogr. 43: 1089-1106.
KORNILOVS, G., L. SIDREVICS & J.W. DIPPNER, 2001. Fish and zooplankton interaction in the Central Baltic Sea. J. Mar. Sci. 58: 579-588.
KORPINEN, P., M. KIIRIKKI, J. KOPONEN, H. PELTONIEMI & J. SARKKULA, 2004. Evaluation and control of eutrophication in Helsinki sea area with the help of a nested 3D-ecohydrodynamic model. J. Mar. Syst. 45: 255-265.
KOTTA, J. & H. ORAV, 2001. Role of benthic macroalge in regulating macrozoobenthic assemblages in the Väinameri (north-eastern Baltic Sea). Ann. Zool. Fennici 38: 163-171.
KOTTA, I., H. ORAV-KOTTA, J. KOTTA, 2003. Macrozoobenthos assemblages in highly productive areas of the Estonian coastal sea. Proc. Estonian Acad. Sci. Biol. Ecol. 52: 149-165.
KOTTA, J., M. SIMM, I. KOTTA, I. KANOŠINA, K. KALLASTE & T. RAID, 2004. Factors controlling long-term changes of the eutrophicated ecosystem of Pärnu Bay, Gulf of Riga. Hydrobiol. 514: 259-268.
KOWALEWSKA, G., B. WAWRZYNIAK-WYDROWSKA & M. SZYMCZAK-ŻYŁA, 2004. Chlorophyll a and its derivatives in sediments of the Odra estuary as a measure of its eutrophication. Mar. Poll. Bull. 49: 148-153.
KRUK-DOWGIALLO, L. 1996. The role of filamentous brown algae in the degradation of the underwater meadows the Gulf of Gdansk. Oceanological Studies XXV (1-2): 125-135.
KRUK-DOWGIALLO, L. & J. PEMPKOWIAK, 1997. Macrophytes as indicators of heavy metal contamination in the Puck Lagoon (southern Baltic). In: Ojaveer, E. (ed.), Proc. 14th Baltic Marine Biologists, Estonian Academy Publishers, Tallinn, pp: 86-100.
KUBE, J., M. POWILLEIT & J. WARZOCHA, 1996. The importance of hydrodynamic processes and food availability for the structure of macrofauna assemblages in the Pomeranian Bay (Southern Baltic Sea). Arch. Hydrobiol., 138: 213-228.
KUDERSKY, L. A. 1997. Changes in the fish crop in the eastern part of the Gulf of Finland as a result of natural and man-induced factors´ impact. In: Sarkkula, J. (ed.) Proceedings of the final seminar of the Gulf of Finland year 1996, March, 1997, Helsinki. Helsinki. Finnish Environment Institute, report, no. 105: 261-278.
KUKK, H. 1995. Phytobenthos. In: Ojaveer, E. (ed.), Ecosystem of the Gulf of Riga between 1920 and 1990. Estonian Academy Publishers, Tallinn, pp. 131-138.
KUKK, H., G. MARTIN & I. KOTTA, 1997. Species composition of the benthic littoral communities of Naissaar Island. EMI Report Series 8: 11-17.
KUPARINEN, J. & L. TUOMINEN, 2001. Eutrophication and self-purification: counteractions forced by large-scale cycles and hydrodynamic processes. Ambio 30: 190-194.
KVARKEN COUNCIL, 2003. Monitoring of the Quark region online. URL: http://wwwp.ymparisto.fi/miljo/miljo.htm (Acc 04/12/31).
150

References
KWIATKOWSKI, J., E. KOCH RASMUSSEN, E. EZHOVA & B. CHUBARENKO, 1997. The eutrophication model of the Vistula Lagoon. Oceanological Studies XXVI (1): 5-33.
KÄÄRIÄ, J. 1999. Reproduction of the Baltic herring (Clupea harengus membras L.): factors affecting the selection of spawning beds in the Archipelago Sea, in SW Finland. Ph.D. thesis, University of Turku, Finland, Annales Universitatis Turkuensis, 116, 24 pp. + appendices.
LAAKKONEN, S. 2001. The origins of water protection in Helsinki in 1878-1928. Ph.D. thesis, University of Helsinki, Finland, 309 pp. (in Finnish with English summary).
LAAKKONEN, S. & P. LEHTONEN, 1999. A quantitative analysis of discharges into the Helsinki urban sea area in 1850-1995. European Water Management vol. 2, no 4: 30-39.
LAAMANEN, M., V. FLEMING & R. OLSONEN, 2004. Water transparency in the Baltic Sea between 1903 and 2004. Finnish Institute of Marine Reasearch and HELCOM. URL: http://helcom.navigo.fi/environment/indicators2004/secchi/en_ GB/transparency/ (Acc 04/12/31).
LAIHONEN, P., J. SUOMELA & T. SUOMINEN, 2003. The state of the Archipelago Sea in 2002, summary March 2003. The South-West Finland´s Regional Environment Centre, 4 pp. (in Finnish).
LAINE, A.O. 2003. Distribution of soft-bottom macrofauna in the deep open Baltic Sea in relation to environmental variability. Est. Coast. Shelf Sci. 57: 87-97.
LAINE, A. O. & A-B. ANDERSIN, 1998. Stratification induced hypoxia as a structuring factor of macrozoobenthic communities in the open Gulf of Finland (Baltic Sea). Poster at ICES symp., Crete, Greece, October 1998.
LAINE, A. & P. KANGAS, 2004. The state of the bottomfauna in the open sea and in the coastal waters. In: Pitkänen, P. (ed.), The state of the coastal and open sea areas at the turn of the new millenium; the background documents of the Finland´s Programme for the Protection of the Baltic Sea. The Finnish Environment Institute, The Finnish Environment 669, pp. 18-21.
LAINE, A. O. & E. ZORITA, 1999. Low-frequency evolution of hydrographic variables in the Baltic Sea and its relationship to the atmospheric circulation. GKSS Forschungzentrum Geesthacht GmbH Geesthacht, 36 pp.
LAINE, A.O., K. LUODEKARI, M. POIKONEN & M. VIITASALO, 2003. A comparison between 1928 and 2000 indicates major changes in the macrozoobenthos species composition and abundance on the SW coast of Finland (Baltic Sea). Proc. Estonian Acad. Sci. Biol. Ecol. 52: 3-16.
LAINE, A.O., H. SANDLER, A-B. ANDERSIN & J. STIGZELIUS, 1997. Long-term changes of macrozoobenthos in the Eastern Gotland Basin and the Gulf of Finland (Baltic Sea) in relation to the hydrographical regime. J. Sea Res. 38: 135-159.
LAPPALAINEN, A., M. RASK, H. KOPONEN & S. VESALA, 2001. Relative abundance, diet and growth of perch (Perca fluviatilis) and roach (Rutilus rutilus) at Tvärminne, northern Baltic Sea, in 1975 and 1997: responses to eutrophication? Bor. Env. Res. 6:107-118.
LARSSON, U. 1994. Variations in nutrients and weather conditions. Baltic Sea 1993, Swedish report on the environmental state of the Baltic proper, Stockholm Marine Research Institute, pp. 10-13 (in Swedish).
LARSSON, U. & L. ANDERSSON, 1999. Nutrients in the surface water in the basins of the Baltic Sea. Baltic Sea 1998, Swedish report on the environmental state of the Baltic proper, Stockholm Marine Research Institute, pp. 2-5 (in Swedish).
151

References
LARSSON, U. & L. ANDERSSON, 2004. The reason why phosphorus increases and nitrogen decreases in the surface water of the Baltic proper. The Swedish Meteorological and Hydrological Institute (in Swedish). URL: http://www.smhi. se (Acc 04/12/31).
LARSSON, U. & S. HAJDU, 1997. Monitoring in the Baltic proper. Baltic Sea 1996, Swedish report on the environmental state of the Baltic proper, Stockholm Marine Research Institute, pp. 28-31 (in Swedish).
LARSSON, U., R. ELMGREN & F. WULFF, 1985. Eutrophication and the Baltic Sea: causes and consequences. Ambio 14: 9-14.
LARSSON, U., S. HAJDU, L. ANDERSSON & L. EDLER, 1998. The pelagic water mass. Baltic Sea 1997, Swedish report on the environmental state of the Baltic proper, Stockholm Marine Research Institute, pp. 28-33 (in Swedish).
LARSSON, U., S. HAJDU, J. VALVE & R. ELMGREN, 2001. Baltic nitrogen fixation estimated from the summer increase in upper mixed layer total nitrogen. Limnol. Oceanogr. 46: 811-820.
LARSSON, U., S. HAJDU, L. ANDERSSON, L. EDLER, B. SUNDELIN & A-K. ERIKSSON, 1999. Surface water and phytoplankton. Baltic Sea 1998, Swedish report on the environmental state of the Baltic proper, Stockholm Marine Research Institute, pp. 27-32 (in Swedish).
LATALA, A. 1997. Concentration and distribution of chlorophyll a in the Gdansk Bay. In: Andrusaitis, A. (ed.), Proc. 13th Baltic Marine Biologists, Inst. Aquatic Ecology, University of Latvia, pp. 47-52.
LATVIAN ENVIRONMENT AGENCY, 2004. Environmental indicators in Latvia 2002. URL: http://www.lva.gov.lv/lea/03produkt/01parskati (Acc 04/12/31).
LAZNIK, M., P. STÅLNACKE, A. GRIMWALL & H. B. WITTGREN, 1999. Riverine input of nutrients to the Gulf of Riga – temporal and spatial variation. J. Mar. Syst. 23: 11-25.
LEHTONEN, H., J. KJELLMAN & R. SELÉN, 2000. Are the coastal pike disappearing? Fiskeritidskrift för Finland 1/2000: 8-11 (in Swedish).
LEHTORANTA, J. 2003. Dynamics of sediment phosphorus in the brackish Gulf of Finland. Ph.D. thesis, University of Helsinki, Finland. Monographs of the Bor. Env. Res. No. 24, 58 pp. + appendices.
LEHTORANTA, J. & A-S. HEISKANEN, 2003. Dissolved iron:phosphate ratio as an indicator of phosphate release to oxic water of the inner and outer coastal Baltic Sea. Hydrobiol. 492: 69-84.
LEHTORANTA, J., A-S. HEISKANEN & H. PITKÄNEN, 2004. Particulate N and P characterizing the fate of nutrients along the estuarine gradient of the River Neva (Baltic Sea). Est. Coast. Shelf Sci. 61: 275-287.
LEHVO, A. & S. BÄCK, 2000. Notes on the phytobenthos, northeastern Gulf of Finland. Memoranda Soc. Flora Fauna Fennica 76: 7-13.
LEHVO, A. & S. BÄCK, 2001. Survey of macroalgal mats on southeastern coast of Finland. Aquatic Conserv: Mar. Freshw. Ecosyst. 11: 11-18.
LEPPÄKOSKI, E. 1969. Transitory return of the benthic fauna of the Bornholm basin after extermination of oxygen insufficiency. Cahiers de Biologie Marine, X: 163-172.
LEPPÄKOSKI, E. 1971. Benthic recolonization of the Bornholm basin (Southern Baltic) in 1969-71. Thalassia Jugoslavica, 7: 171-179.
LEPPÄKOSKI, E. & E. BONSDORFF, 1989. Ecosystem variability and gradients. Examples from the Baltic Sea as a background for hazard assessment. In:
152

References
Landner, L. (ed.), Chemicals in the aquatic environment. Springer-Verlag, Berlin, pp. 6-58.
LEPPÄNEN, J-M., H. PITKÄNEN, O. SAVCHUK, S. BASOVA, V. DRABKOVA, V. GRAN, A-S. HEISKANEN, J. KOPONEN, I. SHPAER & N. SILINA, 1997. Eutrophication and its effects in the Gulf of Finland. In: Sarkkula, J. (ed.) Proceedings of the final seminar of the Gulf of Finland year 1996, March, 1997, Helsinki. Finnish Environmental Institute, report, no. 105: 31-49.
LINDAHL, A.H., G. PERSSON & H. OLSSON, 1993. Eutrophication of coastal areas in Sweden and surrounding seas: state, development and effect. Swedish Environmental Protection Agency, report no. 4151, 85 pp. (in Swedish).
LINDAHL, O., A. BELGRANO, L. DAVIDSSON & B. HERNROTH, 1998. Primary production, climatic oscillations, and physico-chemical processes: the Gullmar Fjord time-series data set (1985-1996). ICES J. Mar. Sci. 55: 723-729.
LOMSTEIN, B. A. (ed.), 1999. The marine environment at the turn of the millennium. Olsen & Olsen, Fredensborg, 176 pp. (in Danish).
LORENZ, Z., J. NAKONIECZNY, S. OCHOCKI & H. RENK, 1991. Primary production and chlorophyll in the Gulf of Gdansk in 1987-1988. Acta Ichthyologica et piscatoria, XXI Supp. (Proc. 11th Baltic Marine Biologists), pp. 118-124.
ŁYSIAK-PASTUSZAK, E., N. DRGAS & Z. PIĄTKOWSKA, 2004. Eutrophication in the Polish coastal zone: the past, present status and future scenarios. Mar. Poll. Bull. 49: 186-195.
LÄNNERGREN, C. 1995. The Stockholm archipelago. Baltic Sea 1994, Swedish report on the environmental state of the Baltic proper, Stockholm Marine Research Institute (in Swedish).
LÄNNERGREN, C. 2001. Outflow from Lake Mälaren. Swedish report on the environmental state of the Baltic proper 2000, Stockholm Marine Research Institute, pp. 9-13. (in Swedish with English summary). URL: http://www.smf.su. se (Acc. 04/12/31).
LÄNNERGREN, C. & B. ERIKSSON, 2000. Inventory in the Stockholm archipelago in 1999. Stockholm Vatten, report: MV-00115 (in Swedish).
LÄNNERGREN, C., B. ERIKSSON & A. STEHN, 2003. Studies in the Stockholm archipelago 2003. Text, figures, data compilations and plankton. 2004-03-25, MV-04168. Stockholm Vatten (in Swedish). URL: http://www.stockholmvatten. se (Acc 04/12/31).
LÄÄNE, A., H. PITKÄNEN, B. ARHEIMER, H. BEHRENDT, W. JAROSINKI, S. LUCANE, K. PACHEL, A. RÄIKE, A. SHEKHOVTSOV, L.M. SVENDSEN & S. VALATKA, 2002. Evaluation of the implementation of the 1988 Ministerial Declaration regarding nutrient load reductions in the Baltic Sea catchment area. The Finnish Environment Institute, The Finnish Environment 524, Helsinki, 195 pp.
MAGAARD, L. & G. RHEINHEIMER (eds.), 1974. Marine science in the Baltic Sea. Springer Verlag, Heidelberg, 269 pp. (in German).
MALM, T. & R. ENGKVIST, 2001. Drifting algae mats – threat to tourism and fishery. Havsutsikt, Göteborg University Marine Research Institute, Sweden, no. 2/2001, pp. 6-7 (in Swedish).
MALM, T., S. RÅBERG, S. FELL & P. CARLSSON, 2004. Effects of beach cast cleaning on beach quality, microbial food web, and littoral macrofaunal biodiversity. Est. Coast. Shelf Sci. 60: 339-347.
MARE, 2005. Marine Research on Eutrophication – a scientific base for cost-effective measures for the Baltic Sea. Stockholm University, Sweden. URL: http://www. mare.su.se (Acc 05/01/12).
153

References
MARKAGER, S., T. GISSEL NIELSEN, J. CARSTENSEN, D. CONLEY, K. DAHL, J. HANSEN, P. HENRIKSEN, A. JOSEFSON, M.M. LARSEN, B. PEDERSEN, B. RASMUSSEN, J. STRAND & G. ÆRTEBJERG, 1999. Marine areas – environmental status in 1998. Danish National Environmental Research Institute, report no. 290, 164 pp. (in Danish with English summary).
MARTIN, G. 1999. Distribution of phytobenthos biomass in the Gulf of Riga (1984-1991). Hydrobiol. 393: 181-190.
MARTIN, G. 2000. Phytobenthic communities of the Gulf of Riga and the inner sea of the West-Estonian archipelago. Ph. D. thesis, Univeristy of Tartu, Estonia, Dissertationes Biologicae Universitatis Tartuensis 64, 41 pp. + appendices.
MARTIN, G. & H. KUKK, 1999. Environmental factors forcing the dynamics and the structure of loose Furcellaria lumbricalis-Coccotylus truncatus community in Kassari Bay, the inner sea of west Estonian archipelago, NE Baltic Sea. Abstract at the 34th EMBS, Ponta Delgada, Azores, September 1999.
MARTIN, G. & T. PAALME, 2003. Production rate of loose-lying and attached forms of red algae Furcellaria lumbricalis and Coccotylus truncatus in Kassari Bay, west Estonian archipelago sea. Poster at Baltic Sea Science Congresss, Helsinki, Finland, August 2003.
MARTIN, G. & K. TORN, 2004. Classification and description of phytobenthic communities in the waters of the West-Estonian archipelago sea. Hydrobiol. 514: 151-162.
MARTIN, G., K. TORN, J. KOTTA & H. ORAV-KOTTA, 2003. Estonian marine phytobenthos monitoring programme: preliminary results and future perspectives. Proc. Estonian Acad. Sci. Biol. Ecol. 52: 112-124.
MASŁOWSKI, J. 2003. Effects of trophic conditions on benthic macrofauna in the victinty of the River Świna mouth (Pomeranian Bay; southern Baltic Sea). Oceanologica 45: 41-52.
MATCIAK M. 1997. Estimation of the attenuation of the visible light in the waters of the Gulf of Gdansk with the use of Secchi transparency. Oceanological Studies 26: 35-40.
MATTHÄUS, W. & H. FRANCK, 1992. Characteristics of major Baltic inflows: a statistical analysis. Cont. Shelf Res. 12: 1375-1400.
MATTHÄUS, W. & H. SCHINKE, 1999. The influence of river runoff on deep water conditions of the Baltic Sea. Hydrobiol. 393: 1-10.
MATTILA, J. 1993. Long term changes in the bottom fauna along the Finnish coast of the southern Bothnian Sea. Aqua Fennica 23: 143-152.
MATTILA, J. 2000. Eutrophication in the archipelago. In: Numers, von M.: Environment in the archipelago – state, problems and possibilities. Kirjapaino Grafia Oy, Turku, pp. 15-24 (in Swedish).
MEE, L.D. 1992. The Black Sea in crisis: a need for concerted international action. Ambio 21: 278-286.
MEE, L. 2004. Assessment and monitoring requirements for the adaptive management of Europe´s regional seas. In: Vermaat, J., L. Bouwer, R.K. Turner & W. Salomons (eds.), Managing European coasts: past, present and future. Springer Verlag, Berlin, xx pp.
MEEUWIG, J.J., P. KAUPPILA & H. PITKÄNEN, 2000. Predicting coastal eutrophication in the Baltic: a limnological approach. Can. J. Fish. Aquat. Sci. 57: 844-855.
MESSNER, U. & J.A. VON OERTZEN, 1991. Long-term changes in the vertical distribution of macrophytobenthic communities in the Greifswalder Bodden. Acta
154

References
Ichthyologica et Piscatoria, XXI Suppl. (Proc. 11th Baltic Marine Biologists), pp. 135-143.
MEYER-REIL, L-A. & M. KÖSTER, 2000. Eutrophication of marine waters: effects on benthic microbial communities. Mar. Poll. Bull. 41: 255-263.
MOISANDER, P. H., E. RANTAJÄRVI, M. HUTTUNEN & K. KONONEN, 1997. Phytoplankton community in relation to salinity at the entrance to the Gulf of Finland, Baltic Sea. Ophelia 46: 187-203.
MÖLLMANN, C. & F. W. KÖSTER, 1999. Food consumption by clupeids in the Central Baltic: evidence for top-down control? ICES J. Mar. Sci. 56 supp.: 100-113.
NAUSCH, G., W. MATTHÄUS & R. FEISTEL, 2003. Hydrographic and hydrochemical conditions in the Gotland Deep area between 1992 and 2003. Oceanologia 45: 557-569.
NEHRING, D. 1991. Recent nutrient trends in the western and central Baltic Sea, 1958-1989. Acta Ichthyologica et Piscatoria XXI, suppl. (Proc. 11th Baltic Marine Biologists), pp. 153-162.
NERI, 2004. National Environment Research Institute in Denmark. URL: http://www.dmu.dk/ (Acc 04/12/31).
NEUMANN, T. & G. SCHERNEWSKI, 2005. An ecological model evaluation of two nutrient abatement strategies for the Baltic Sea. J. Mar. Syst. in print.
NIELSEN, R. & K. DAHL, 1992. Macroalgae at Briseis Flak, Schultzs Grund and Store Middelgrund, stone reefs in the southern and eastern part of Kattegat, Denmark. In: Bjørnestad, E., L. Hagerman & K. Jensen (eds.), Proc. 12th Baltic Marine Biologists symp., Olsen & Olsen, Fredensborg, pp. 109-118.
NIELSEN, S.L., K. SAND-JENSEN, J. BORUM & O. GEERTZ-HANSEN, 2002a. Phytoplankton, nutrients and transparency in Danish coastal waters. Estuaries 25: 930-937.
NIELSEN, S.L., K. SAND-JENSEN, J. BORUM & O. GEERTZ-HANSEN, 2002b. Depth colonization of eelgrass (Zostera marina) and macroalgae as determined by water transparency in Danish coastal waters. Estuaries 25: 1025-1032.
NIEMI, Å. 1979. Blue-green algal blooms and N:P ratio in the Baltic Sea. Acta Bot. Fenn. 110: 57-61.
NIKULINA, V.N. 2003. Seaonal dynamics of phytoplankton in the inner Neva Estuary in the 1980s and 1990s. Oceanologica 45: 25-39.
NILSSON, J., R. ENGKVIST & L-E. PERSSON, 2004a. Long-term decline and recent recovery of Fucus populations along the rocky shores of southeast Sweden, Baltic Sea. Aquat. Ecol. 38: 587-598.
NILSSON, J., J. ANDERSSON, P. KARÅS & O. SANDSTRÖM, 2004b. Recruitment failure and decreasing catches of perch (Perca fluviatilis L.) and pike (Esox lucius L.) in the coastal waters of southeast Sweden. Bor. Env. Res. 9: 295-306.
NISSLING, A. & L. WESTIN, 1991. Egg mortality and hatching rate of Baltic cod (Gadus morhua) in different salinities. Mar. Biol. 111: 29-32.
NIXON, S. W. 1995. Coastal marine eutrophication: A definition, social causes, and future concerns. Ophelia 41: 199-219.
NORKKO, A. 1997. The role of drifting macroalgal mats in structuring coastal zoobenthos. Ph. D. thesis, Åbo Akademi University, Finland, 41 pp.+ appendices.
NORKKO, A. & E. BONSDORFF, 1994. Zoobenthos and hydrography in the transition-zone between the shallow coastal bottoms and the open sea in the Åland archipelago, N. Baltic Sea. Husö biological station, Åbo Akademi University, Finland, research report no. 91, 44 pp. (in Swedish with English summary).
155

References
NORKKO, A. & E. BONSDORFF, 1996a. Rapid zoobenthic community responses to accumulations of drifting algae. Mar. Ecol. Prog. Ser. 131: 143-157.
NORKKO, A. & E. BONSDORFF, 1996b. Population responses of coastal zoobenthos to stress induced by drifting algal mats. Mar. Ecol. Prog. Ser. 140: 141-151.
NORKKO, A. & E. BONSDORFF, 1996c. Altered benthic prey-availability due to episodic oxygen deficiency caused by drifting algal mats. P.S.Z.N.I: Mar. Ecol. 17: 355-372.
NORKKO, J. & E. BONSDORFF & A. NORKKO, A., 2000. Drifting algal mats as an alternative habitat for benthic invertebrates: species specific responses to a transient resource. J. Exp. Mar. Biol. Ecol. 248: 79-104.
NUMMELIN, C. 2000. The water environment of the Åland Islands – state of the environment in 1999. Husö biological station, Åbo Akademi University and the Åland´s Government and Administrative Board, 28 pp. (in Swedish).
O´BRIEN, K., J. HÄNNINEN, T. KANERVA, L. METSÄRINNE & I. VUORINEN, 2003. Macrozoobenthic zonation in relation to major environmental factors across the Archipelago Sea, northern Baltic Sea. Bor. Env. Res. 8: 159-170.
OCHOCKI, S., J. NAKONIECZNY, H. CHMIELOWSKI, M. ZALEWSKI, 1995. The hydrochemical and biological impact of the river Vistula on the pelagic system of the Gulf of Gdansk in 1994. Part 2. Primary production and chlorophyll a. Oceanologica 37: 207-226.
OJAVEER, E. 1995. Large-scale processes in the ecosystem of the Gulf of Riga. In: Ojaveer, E. (ed.), Ecosystem of the Gulf of Riga between 1920 and 1990. Estonian Academy Publishers, Tallinn, pp. 268-277.
OJAVEER, E. 2002. Problems in fisheries and management of fish resources in the Gulf of Riga. In: Schernewski, G. & U. Schiewer (eds.), Baltic coastal ecosystems, structure, function and coastal zone management. Central and Eastern European Development Studies, Springer Verlag, Berlin, pp. 157-169.
OJAVEER, E. & J. ELKEN, 1997. On regional subunits in the ecosystem of the Baltic Sea. In: Ojaveer, E. (ed.), Proc. 14th Baltic Marine Biologists, Estonian Academy Publishers, Tallinn, pp. 156-169.
OJAVEER, E. & R. GAUMIGA, 1995. Cyclostomes, fishes and fisheries. In: Ojaveer, E. (ed.), Ecosystem of the Gulf of Riga between 1920 and 1990. Estonian Academy Publishers, Tallinn, pp. 212-267.
OJAVEER, E. & H. LEHTONEN, 2001. Fish stocks in the Baltic Sea: finite or infinite resource? Ambio 30: 217-221.
OJAVEER, H. 2002. Environmental impacts on fish and ecosystem effects of fishing in the Baltic Sea. Estonian Marine Institute Report Series No. 11, Tallinn, 52 pp.
OJAVEER, H., A. LANKOV, M. EERO, J. KOTTA, I. KOTTA & A. LUMBERG, 1999. Changes in the ecosystem of the Gulf of Riga from the 1970s to the 1990s. ICES J. Mar. Sci. 56, suppl.: 33-40.
ÓLAFSSON, E.B. 1988. Inhibition of larval settlement to a soft bottom benthic community by drifting algal mats: an experimental test. Mar. Biol. 97: 571-574.
OLENIN, S., 1996. Comparative community study of the south-eastern Baltic coastal zone and the Curonian Lagoon bottom. In: Andrusaitis, A. (ed.), Proc. 13th Baltic Marine Biologists. Institute of Aquatic Ecology, University of Latvia, pp. 153-161.
OLENIN, S., I. OLENINA, D. DAUNYS & Z. GASIUNAITE, 1999. The harbour profile of Klaipeda, Lithuania. In: Gollasch, S & E. Leppäkoski (eds.), Initial risk assessment of alien species in Nordic coastal waters. Nordic council of ministers, Nord 1999, 8: 185-202.
156

References
OLENINA, I. & R. KAVOLYTE, 1997. Phytoplankton, chlorophyll a and the environmental conditions in the southeastern coastal zone of the Baltic Sea. In: Andrusaitis, A. (ed.), Proc. 13th Baltic Marine Biologists, Inst. Aquatic Ecology, University of Latvia, pp. 53-61.
OLENINA, I. & S. OLENIN, 2002. Environmental problems of the south-eastern Baltic coast and the Curonian Lagoon. In: Schernewski, G. & U. Schiewer (eds.), Baltic coastal ecosystems, structure, function and coastal zone management. Central and Eastern European Development Studies, Springer Verlag, Berlin, pp. 149-156.
OLSSON, H. 1999. The nutrient status in the S:t Anna archipelago. Baltic Sea 1998, Swedish report on the environmental state of the Baltic proper, Stockholm Marine Research Institute, pp. 22-24 (in Swedish).
OSOWIECKI, A., 1991. Changes in macrozoobenthos of the southern Baltic in 1979-1988. Acta Ichthyologica et Piscatoria, XXI Suppl. (Proc. 11th Baltic Marine Biologists), pp. 193-210.
OSOWIECKI, A. & J. WASZOCHA, 1996. Macrozoobenthos of the Gdansk, Gotland and Bornholm basins in 1978-1993. Oceanological Studies, 1-2: 137-149.
PANOV, V.E., A.F. ALIMOV, S.G. GOLUBKOV, M.I. ORLOVA & I.V. TELESH, 2002. Environmental problems and challenges for coastal zone management in the Neva Estuary (eastern Gulf of Finland). In: Schernewski, G. & U. Schiewer (eds.), Baltic Coastal Ecosystems. Structure, function and coastal zone management. Central and Eastern European Developement Studies, Springer Verlag, Berlin, pp. 171-184.
PARK, S.G. & S.Y. PARK, 2000. Long-term trends and temporal heterogeneity of water quality in tidally mixed estuarine waters. Mar. Poll. Bull. 40: 1201-1209.
PASTUSZAK, M., K. NAGEL & G. NAUSCH, 1996. Variability in nutrient distribution in the Pomeranian Bay in September 1993. Oceanologia 38: 195-225.
PEARSON, T. H. & R. ROSENBERG, 1992. Energy flow through the SE Kattegat: a comparative examination of the eutrophication of a coastal marine ecosystem. Neth. J. Sea Res. 28: 317-334.
PELLIKKA, K. & H. VILJAMAA, 1999. Monitoring of the sea areas off Helsinki in 1998. The City of Helsinki, Finland, Environment Centre, report 2/99, 14 pp + appendices (in Finnish).
PERSSON, J. & P. JONSSON, 2000. Historical development of laminated sediments - an approach to detect soft sediment ecosystem changes in the Baltic Sea. Mar. Poll. Bull. 40: 122-134.
PERTTILÄ, M., L. NIEMISTÖ & K. MÄKELÄ, 1995. Distribution, development and total amounts of nutrients in the Gulf of Finland. Est. Coast. Shelf Sci. 41: 345-360.
PERUS, J. & E. BONSDORFF, 2004. Long-term changes in macrozoobenthos in the Åland archipelago, northern Baltic Sea. J. Sea Res. 52: 45-56.
PERUS, J., S. BÄCK, H-G. LAX, V. WESTBERG, P. KAUPPILA & E. BONSDORFF, 2004. Coastal marine zoobenthos as an ecological quality element: a test of environmental typology and the European Water Framework Directive. In: Schernewski, G. & M. Wielgat (eds.), Towards a typology for the Baltic Sea, Coastline Reports 4: 27-38.
PESONEN, L. (ed.) 1999. Inspection of the sea areas of the towns of Helsinki and Espoo in 1998. The City of Helsinki, Finland, Environment Centre, report 5/99 (in Finnish).
PEUHKURI, T. 2004. Roles of knowledge in environmental conflict. Debate and decision making concerning eutrophication and fish farming industry in the
157

References
Archipelago Sea region, in southwest Finland. Ph.D. thesis, Annales Universitatis Turkuensis, Ser. C 220, University of Turku, Finland, 271 pp. (in Finnish with English abstract).
PIECHURA, J. & A. BESZCZYŃSKA-MÖLLER, 2003. Inflow waters in the deep regions of the southern Baltic Sea – transport and transformations. Oceanologia 45: 593-621.
PIHL, L. & H. WENNHAGE, 2002. Structure and diversity of fish assemblages on rocky and soft bottom shores on the Swedish west coast. J. Fish Biol. 61: 148-166.
PIHL, L., I. ISAKSSON, H. WENNHAGE & P-O. MOKSNES, 1995. Recent increase of filamentous algae in shallow Swedish bays: effects on the community structure of epibenthic fauna and flora. Neth. J. Aquatic Ecol. 29: 349-358.
PIHL, L., A. SVENSON, P.-O. MOKSNES & H. WENNHAGE, 1999. Distribution of green algal mats throughout shallow soft bottoms of the Swedish Skagerrak archipelago in relation to nutrient sources and wave exposure. J. Sea Res. 41: 281-294.
PITKÄNEN, H. 1991. Nutrient dynamics and trophic conditions in the eastern Gulf of Finland; the regulatory role of the Neva Estuary. Aqua Fennica 21: 105-115.
PITKÄNEN, H. (ed.), 2004. The state of coastal and open sea areas at the turn of the new millenium; the background documents of the Finland´s Programme for the Protection of the Baltic Sea. The Finnish Environment No. 669, Finnish Environment Institute, Helsinki, Finland, 104 pp.
PITKÄNEN, H. & P. KANGAS, 1987. Monitoring of the Finnish coastal waters: evaluation of nutrient data. Baltic Sea Environ. Proc. 19: 115-130.
PITKÄNEN, H. & T. TAMMINEN, 1995. Nitrogen and phosphorus as production limiting factors in the estuarine waters of the eastern Gulf of Finland. Mar. Ecol. Prog. Ser. 129: 283-294.
PITKÄNEN, H. & P. VÄLIPAKKA, 1997. Extensive deep water oxygen deficit and benthic phosphorous release in the eastern Gulf of Finland in late summer 1996. In: Sarkkula, J. (ed.) Proceedings of the final seminar of the Gulf of Finland year 1996, March 1997, Helsinki. Finnish Environment Institute, report no. 105: 51-60.
PITKÄNEN, H., J. LEHTORANTA & A. RÄIKE, 2001. Internal nutrient fluxes counteract decreases in external load: the case of the estuarial eastern Gulf of Finland, Baltic Sea. Ambio 30: 195-201.
PITKÄNEN, H., S. KONDRATYEV, A. LÄÄNE, V. GRAN, P. KAUPPILA, E. LOIGU, I. MARKOVETS, K. PACHEL & V. RUMYANTSEV, 1997. Pollution load on the Gulf of Finland from Estonia, Finland and Russia in 1985-1995. In: Sarkkula, J. (ed.) Proc. of the final seminar of the Gulf of Finland year 1996, March 1997, Helsinki. Finnish Environment Institute, report no. 105: 9-18.
PITKÄNEN, H., T. TAMMINEN, P. KANGAS, T. HUTTULA, K. KIVI, H. KUOSA, J. SARKKULA, K. ELOHEIMO, P. KAUPPILA & B. SKAKALSKY, 1993. Late summer trophic conditions in the north-east Gulf of Finland and the River Neva Estuary, Baltic Sea. Estuar. Coast. Shelf Sci. 37: 453-474.
PITKÄNEN, H., J. LEHTORANTA, H. PELTONEN, A. LAINE, J. KOTTA, I. KOTTA, P. MOSKALENKO, A. MÄKINEN, P. KANGAS, M. PERTTILÄ & M. KIIRIKKI, 2003. Benthic release of phosphorus and its relation to environmental conditions in the estuarial Gulf of Finland, Baltic Sea, in the early 2000s. Proc. Estonian Acad. Sci. Biol. Ecol. 52: 173-192.
PLÍNSKI, M. & T. JÓSŹWIAK, 2004. The distribution of water vegetation on the Polish coast of the Baltic Sea in 1996-2000. Oceanol. Hydrol. Studies 33: 29-40.
158

References
POLAND´S MINISTRY OF ENVIRONMENT, 1997. State of environment in Poland, Surface water & Baltic Sea. URL: http://www.mos.gov.pl/soe (Acc 04/012/31).
PRENA, J. 1994. Oxygen depletion in Wismar Bay (Western Baltic Sea) 1988. Arch. Fish. Mar. Res. 42: 77-87.
RABALAIS, N.N, R.E. TURNER, Q. DORTCH, D. JUSTIC, V.J. BIERMAN JR. & W.J. WISEMAN JR., 2002. Nutrient-enhanced productivity in the northern Gulf of Mexico: past, present and future. Hydrobiol. 475/476: 39-63.
RADTKE, K. 2003. Evaluation of the exploitation of Eastern Baltic cod (Gadus morhua callarias L.) stock in 1976-1997. J. Mar. Sci. 60: 1114-1122.
RAPPORT, D.J., R. COSTANZA & A.J. MCMICHAEL, 1998. Assessing ecosystem health. Trends Ecol. Evol. 13: 397-402.
RASK, N. & E. J. BONDGAARD, 2000. Eelgrass – changes in distribution and growth dynamics in relation to oxygen deficiency. Abstract at 11th Danish marine research meeting, January 2000 (in Danish).
RASK, N., S. E. PEDERSEN & M. H. JENSEN, 1999b. Response to lowered nutrient discharges in the coastal waters around the island of Funen, Denmark. Hydrobiol. 393: 69-81.
RASK, N., E. GLOB, M. HJORT JENSEN, S. LARSEN, M.M. MØLLER & F. NØRGAARD,. 1998. Coastal water 1997. Monitoring of coastal waters: open coast. The county of Funen, Denmark, 228 pp. (in Danish with English summary).
RASK, N., E. GLOB, M. HJORT JENSEN, F. NØRGAARD, G. RASMUSSEN, I. HOUSTED HOLM & S. LARSEN, 1999a. Coastal water 1998. Monitoring of coastal waters. The county of Funen, Denmark, 190 pp. (in Danish).
RASMUSSEN, B. & B.G. GUSTAFSSON, 2003. Computation of nutrient pools and fluxes at the entrance to the Baltic Sea, 1974-1999. Cont. Shelf Res. 23: 483-500.
READ, S., M. ELLIOTT, V.N. DE JONGE, S. ROGERS & R. PARKER, 2001. Strategic framework for assessing the risks of ecological impact from nutrient enrichment in the nearshore marine environment in the UK. Institute of Estuarine and Coastal Studies, Report Z117-F-2001, University of Hull, UK, 68 pp.
RENK, H., J. NAKONIECZNY, S. OCHOCKI, Z. LORENZ, R. MAJCHROWSKI & D. FICEK, 1991. Secchi depth-chlorophyll relationship in the Baltic. Acta Ichthyologica et Piscatoria XXI Supp. (Proc. 11th Baltic Marine Biologists), pp. 203-211.
RICHARDSON, K. & J. P. HEINEMANN, 1995. Primary production in the Kattegat: past and present. Ophelia 41: 317-328.
RICHARDSON, K. & B.B. JØRGENSEN, 1996. Eutrophication: definition, history and effects. In: Jørgensen, B.B. & K. Richardson (eds.), 1996. Eutrophication in coastal marine ecosystems. Coastal and Estuarine Studies 52, American Geophysical Union, Washington DC, pp. 1-20.
ROOS, C., J. BERGLUND, A. ALM & O. RÖNNBERG, 2004. Long-term changes in macroalgal communities along ferry routes in a northern Baltic archipelago. Nord. J. Bot., 23: 247-259.
ROSENBERG, R. 1980. Effects of oxygen deficiency on benthic macrofauna in fjords. In: Freeland, H. J., D. M. Farmer, C. D. Levings (eds.), Fjord Oceanography. Plenum Publishing Corp., New York, pp. 499-514.
ROSENBERG, R. 1985. Eutrophication – the future marine coastal nuisance? Mar. Poll. Bull. 16: 227-231.
ROSENBERG, R. 1992. Eutrophication-related marine ecosystem studies in western Sweden. In: Colombo, G., I. Ferrari, V.U. Ceccherelli & R. Rossi (eds.), Marine eutrophication and population dynamics, Proc. 25th EMBS, Olsen & Olsen, Fredensborg, pp. 17-20.
159
References
ROSENBERG, R. & R. D. DIAZ, 1993. Sulfur bacteria (Beggiatoa spp.) mats indicate hypoxic conditions in the inner Stockholm Archipelago. Ambio 22: 32-36.
ROSENBERG, R., L-O. LOO & P. MÖLLER, 1992. Hypoxia, salinity and temperature as structuring factors for marine benthic communities in an eutrophic area. Neth. J. Sea Res. 30: 121-129.
ROSENBERG, R., M. BLOMQVIST, H.C. NILSSON, H. CEDERWALL & A. DIMMING, 2004. Marine quality assessment by use of benthic species-abundance distributions: a proposed new protocol within the European Union Water Framework Directive. Mar. Poll. Bull. 49:728-739.
ROSENBERG, R., R. ELMGREN, S. FLEISCHER, P. JONSSON, G. PERSSON & H. DAHLIN, 1990. Marine eutrophication case studies in Sweden. Ambio 19: 102-108.
RUDLICKA, A., W. KRZYMIŃSKI & E. ŁYSIAK-PASTUSZAK, 2003. The Baltic Sea and its coastal zone. In: Zareba, K. (ed.), The state of environment in Poland 1996-2001. Report. Inspection of environmental protection, Environmental monitoring library, Warsaw, pp. 143-263. URL: http//www.poland.pl/nature/protection/ statistics/ (Acc 04/12/31).
RUMOHR, H., E. BONSDORFF & T. H. PEARSON, 1996. Zoobenthic succession in Baltic sedimentary habitats. Arch. Fish. Mar. Res. 44: 179-214.
RYDIN, H., P. SNOEIJS & M. DIEKMANN, 1999. Swedish plant geography. Acta Phytogeographica Suecica 84, Uppsala, Sweden, 238 pp.
RÖNKKÖNEN, S., E. OJAVEER, T. RAID & M. VIITASALO, 2004. Long-term changes in Baltic herring (Clupea harengus membras) growth in the Gulf if Finland. Can. J. Fish Aquat. Sci. 61: 219-229.
RÖNNBERG, C. 2001. Effects and consequences of eutrophication in the Baltic Sea – specific patterns in different regions. Licentiate thesis, Åbo Akademi University, Finland, 132 pp. + appendices.
RÖNNBERG, O. 1981. Traffic effects on rocky-shore algae in the Archipelago Sea, SW Finland. Ph. D. thesis, Åbo Akademi University, Finland, Acta Academiae Aboensis 41: 86 pp.
RÖNNBERG, O. & L. MATHIESEN, 1998. Long-term changes in the marine macroalgae of Lågskär, Åland Sea (N Baltic). Nord. J. Bot. 18: 379-384.
RÖNNBERG, O., J. LEHTO & I. HAATELA, 1985. Recent changes in the occurrence of Fucus vesiculosus in the Archipelago Sea, SW Finland. Ann. Bot. Fennici 22: 231-244.
SAARNIO, S-P. 1998. The rocky-shore underwater vegetation in the eastern areas of Helsinki in 1997 compared to the years 1984, 1988 and 1993. The City of Helsinki, Finland, Environment Centre, report 8/98, 82 pp. + appendices (in Finnish).
SALMI, P. & J. NORDQUIST, 2003. On whose conditions is fishing water used? The view of ownership and interest groups on fishing water in the Nagu area, SW Finland. Kala- ja riistaraporteja 285, Finnish Game and Fisheries Research Institute, Helsinki, 36 pp. (in Finnish).
SALMI, J., J. NORDQUIST, T. MÄKINEN & P. SALMI, 2004. Fish farming for living in the archipelago. The view of fish farming and sustainable development of the holiday makers in the Archipelago Sea and Åland islands, SW Finland. Kala- ja riistaraporteja 317, Finnish Game and Fisheries Research Institute, Helsinki, 31 pp. + appendices (in Finnish).
SALOVIUS, S. & E. BONSDORFF, 2004. Effects of depth, sediment and grazers on the degradation of drifting filamentous algae (Cladophora glomerata and Pilayella littoralis). J. Exp. Mar. Biol. Ecol. 298: 93-109.
160

References
SANDBERG, J., A. ANDERSSON, S. JOHANSSON & J. WIKNER, 2004. Pelagic food web structure and carbon budget in the northern Baltic Sea: potential importance of terrigenous carbon. Mar. Ecol. Prog. Ser. 268: 13-29.
SANDÉN, P. & B. HÅKANSSON, 1996. Long-term trends in Secchi depth in the Baltic Sea. Limnol. Oceanogr. 41: 346-351.
SANDSTRÖM, A. 2000. The effects of eutrophication on coastal fish communities at the Swedish west coast. Review and analysis for the possibilities for a monitoring programme. The Swedish Fisheries Board, 14 pp, (in Swedish).
SANDSTRÖM, A. & P. KARÅS, 2002. Effects of eutrophication on young-of-the-year fresh-water fish communities in coastal areas of the Baltic. Environ. Biol. Fishes 63: 89-101.
SAULAMO, K., J. ANDERSSON & G. THORESSON, 2001. Cormorant and fish at the Baltic coast of Sweden. Information from the National Board of Fisheries, Sweden, FinFo 2001:07, 21 pp. (in Swedish with English summary). URL: http://www.fiskeriverket.se (Acc 04/12/31).
SAVAGE, C., R. ELMGREN & U. LARSSON, 2002. Effects of sewage-derived nutrients on an estuarine macrobenthic community. Mar. Ecol. Prog. Ser. 243: 67-82.
SAVCHUK, O.P, 2002. Nutrient biogeochemical cycles in the Gulf of Riga: scaling up field studies with a mathematical model. J. Mar. Syst. 32: 253-280.
SAVCHUK, O. & F. WULFF, 2001. A model of the biogeochemical cycles of nitrogen and phosphorus in the Baltic. In: Wulff, F., L. Rahm and P. Larsson (eds.), A system analysis of the Baltic Sea. Ecological Studies 148, Springer Verlag, Berlin, pp. 373-415.
SCHERNEWSKI, G. & T. NEUMANN, 2002. Perspectives on eutrophication abatement in the Baltic Sea. Littoral 2002, The changing coast, Eurocoast/EUCC, Porto, Portugal, pp. 503-511.
SCHERNEWSKI, G. & T. NEUMANN, 2005. The trophic state of the Baltic Sea a century ago: a model simulation study. J. Mar. Syst. 53: 109-124.
SCHERNEWSKI, G. & U. SCHIEWER (eds.), 2002. Baltic coastal ecosystems. Structure, function and coastal zone management. Central and Eastern European Development Studies, Springer Verlag Berlin, 397 pp.
SCHIEWER, U. 2002. Recent changes in northern German lagoons with special reference to eutrophication. In: Schernewski, G. & U. Schiewer (eds.), Baltic coastal ecosystems, structure, function and coastal zone management. Central and Eastern European Development Studies, Springer Verlag, Berlin, pp. 19-30.
SCHULZ, S., W. KAISER & G. BREUEL, 1997. Long-term investigations on some Baltic plankton variables during summer (1976-1992). In: Ojaveer, E. (ed.), Proc. 14th Baltic Marine Biologists, Estonian Academy Publishers, Tallinn, pp. 260-268.
SCHULZ, S., G. ÆRTEBJERG, G. BEHRENDS, G. BREUEL, P. CISZEWSKI, U. HORSTMANN, K. KONONEN, E. KOSTRICHKINA, J-M. LEPPÄNEN, F. MØHLENBERG, O. SANDSTRÖM, M. VIITASALO & T. WILLÉN, 1992. The present state of the Baltic Sea pelagic ecosystem – an assessment. In: Colombo, G., I. Ferrari, V.U. Ceccherelli & R. Rossi (eds.), Marine eutrophication and population dynamics. Proc. 25th EMBS, Olsen & Olsen, Fredensborg, pp. 35-44.
SEGERSON, K. & D. WALKER, 2002. Nutrient pollution: an economic perspective. Estuaries 25: 797-808.
SHTUKOVA, Z. & A. JASHINSKAITE, 1997. Environmental conditions and long-term bacterioplankton dynamics in the Kursiu Marios Lagoon. In: Ojaveer, E. (ed.), Proc. 14th Baltic Marine Biologists, Estonian Academy Publishers, Tallinn, pp. 269-279.
161

References
SJÖBERG, B. & U. LARSSON, 1996. Hydrography and nutrients. Baltic Sea 1995, Swedish report on the environmental state of the Baltic proper, Stockholm Marine Research Institute, pp. 18-25 (in Swedish).
SJÖBLOM, V. 1955. Bottom fauna. Finnish Institute of Marine Research, report 166, pp. 37-51 (in Swedish).
SMAYDA, T.J. 2004. Eutrophication and phytoplankton. In: Wassmann, P. & K. Olli (eds.), Drainage basin nutrient inputs and eutrophication: an integrated approach. University of Tromsø, Norway & Tartu University, Estonia, pp. 89-98 URL: http://www.ut.ee/~olli/eutr/ (Acc 04/12/31).
SMHI, 2001. Swedish Meteorological and Hydrological Institute. Map of stations in the Shark-data base. URL: http://www.smhi.se (Acc 01/12/01).
SMHI, 2004. Swedish Meteorological and Hydrological Institute. Oceanography, information and data reports. URL: http://www.smhi.se (in Swedish, acc 04/12/31).
SOUTH COAST´S WATER CONSERVATION ASSOCIATION, 2002. Annual report. URL: http://www.vattenvardsyd.com (Acc 04/12/31).
STEHN, A. & P. DROMBERG, 1999. Inventory in Stockholm archipelago in 1998. Phytoplankton and zoobenthos. Stockholm Vatten, report no. MV-99573, 42 pp. (in Swedish).
STOCKHOLM UNIVERSITY, 2004a. The Marine Ecosystem Modeling Group, Dept of Systems Ecology. Long-term evolution of oceanographic parameters in the Baltic Sea. URL: http://data.ecology.su.se/baltic/ (Acc 04/12/31).
STOCKHOLM UNIVERSITY, 2004b. Department of systems ecology, Himmerfjärden eutrophication study. URL: http://www.ecology.su.se/dbhfj/hfjsmall.htm (Acc04/ 12/31).
STÅLNACKE, P. 1996. Nutrient loads to the Baltic Sea. Ph. D. thesis, Linköping University, Sweden, Studies in Arts and Science, No 146, Sweden, 78 pp.
STÅLNACKE, P. & P. WASSMANN, 2000. The Gulf of Riga – cleaner than expected. Forskning och framsteg 6: 34-39 (in Swedish).
STÅLNACKE, P. & P. WASSMANN, V. JANSONS & A. ANDRUSHAITIS, 2000. The Gulf of Riga – cleaner than expected. WWF Baltic Bulletin 2/2000: 21-23.
SUGENO, M. & T. YASUKAWA, 1993. A fuzzy-logic-based approach to qualitative modeling. IEEE Trans. Fuzzy Syst. 1: 7-31.
SUOMELA, J. 2001. The environmental status of the Archipelago Sea in the turn of the new millenium. The SW Finland Regional Environment Centre, report 20/2001, 99 pp. (in Finnish).
SUOMELA, J., T. KIRKKALA, H. HELMINEN, K. HÄKKILÄ, H. KOTILAINEN & P. LAIHONEN, 2000. The role of nitrogen and phosphorus in the eutrophication process off Mariehamn, Åland. Rollen av kväve och fosfor vid eutrofieringen av Mariehamns havsområde. The SW Finland Regional Environment Centre, report 169, 37 pp. (in Swedish).
SUURSAAR, Ü. 1995. Hydrochemistry. Nutrients in the Gulf of Riga. In: Ojaveer, E. (ed.), Ecosystem of the Gulf of Riga between 1920 and 1990. Estonian Academy Publishers, Tallinn, pp. 41-50.
SW FINLAND REGIONAL ENVIRONMENT CENTRE, 2004. The state of the water quality in the Archipelago Sea in summer 2004 (in Finnish). URL: http://www. ymparisto.fi/default.asp?contentid=94699&lan=fi (Acc 04/12/31).
SVEDÄNG, H., A. BIGNERT & E. LINDESJÖÖ, 1997. Fish ecology and physiology. The Gulf of Bothnia 2003, annual report from the marine environmental control programme. Umeå Marine Research Centre, Sweden, pp. 17-18 (in Swedish).
162

References
SYKE, 2005. Finnish Environment Institute URL: http://www.environment.fi (Acc 05/01/24).
SÖDERBERG, K. & A. GÅRDMARK, 2004. Coastal fishes and fishery. The Gulf of Bothnia, annual report from the marine environmental control programme. Umeå Marine Research Centre, Umeå, Sweden, pp. 19-21 (in Swedish).
TAMMINEN, T. & J. SEPPÄLÄ, 1999. Nutrient pools, transformations, ratios, and limitation in the Gulf of Riga, the Baltic Sea, during four successional stages. J. Mar. Syst. 23: 83-106.
TELESH, I.V., A.F. ALIMOV, S.M. GOLUBKOV, V.N. NIKULINA & V.E. PANOV, 1999. Response of aquatic communities to anthropogenic stress: a comparative study of Neva Bay and the eastern Gulf of Finland. Hydrobiol. 393: 95-105.
TENSON, J. 1995. Phytoplankton and primary production. History of investigation. Phytoplankton of the Pärnu Bay. In: Ojaveer, E. (ed.), Ecosystem of the Gulf of Riga between 1920 and 1990. Estonian Academy Publishers, Tallinn, pp. 104-126.
TOBIASSON, S., R. ENGKVIST, S. LINDAHL & A. SJÖLIN, 2003. The Hanö Bay, coastal water environment. The water conservation union in the county of Blekinge and the water conservation union in the western Hanö Bay, 45 pp (in Swedish). URL: http://www.hanobukten.org (Acc 04/12/31).
TOBIASSON, S., R. ENGKVIST, B. JUHLIN, O. LJUNGMAN & K. WICKSTRÖM, 2002. Annual report 2001. The water conservation union in the county of Blekinge and the water conservation union in the western Hanö Bay. Dept of biology and environmental science, University of Kalmar, report no. 2002:5, 72 pp. (in Swedish). URL: http://www.k.lst.se/version1/miljo/miljoovo/index.htm (Acc 04/12/31).
TROZOSINSKA, A. & E. ŁYSIAK-PASTUSZAK, 1996. Oxygen and nutrient in the southern Baltic Sea. Oceanological Studies XXV, 1-2: 41-76.
TULKKI, P. 1965. Disappearance of the benthic fauna from the basin of Bornholm (southern Baltic) due to oxygen deficiency. Cahiers de Biologie Marine, VI: 455-463.
TURNER, R.K., 2000. Integrating natural and socio-economic science in coastal management. J. Mar. Syst. 25: 447-460.
TURNER, R.K., S. GEORGIOU, I-M. GREN, F. WULFF, S. BARRETT, T. SÖDERQVIST, I.J. BATEMAN, C. FOLKE, S. LANGAAS, T. ŻYLICZ, K-G. MÄLER & A. MARKOWSKA, 1999. Managing nutrient fluxes and pollution in the Baltic: an interdisciplinary simulation study. Ecol. Econ. 30: 333-352.
UNIVERSITY OF LATVIA, 2003. Institute of aquatic ecology, marine monitoring centre. Monitoring cruise report (2), May 2000. URL: http//hydroecology.lv (Acc 04/12/31).
UNVERZAGT, S. 2001. Spatial and temporal changes in oxygen deficiency and hydrogensulphide in the deep waters of the Baltic Sea. Ph.D. thesis, Ernst-Moritz-Arndt- Universität, Germany, Greifswalder Geographische Arbeiten 19, 123 pp. (in German).
WÆRN, M. 1952. Rocky shore algae in the Öregrund archipelago. Acta phytogeogr. Suec. 30: 1-298.
VAHTERI, P. & I. VUORINEN, 2001. The crash in Baltic herring (Clupea harengus membras L.) reproduction – a case study in the northern Airisto spawning grounds, Archipelago Sea S-W Finland. Abstract at Baltic Sea Science Congress, Stockholm, Sweden, November 2001.
163

References
VAHTERI, P., A. MÄKINEN, S. SALOVIUS & I. VUORINEN, 2000. Are drifting algal mats conquering the bottom of the Archipelago Sea, SW Finland? Ambio 29: 338-343.
WALLENTINUS, I. 1981. Phytobenthos. In: Melvasalo, T., J. Pawlak, K. Grasshoff, L. Thorell & A. Tsiban (eds.), Assessment of the effects of pollution on the natural resources of the Baltic Sea. Baltic Sea Environ. Proc. 5B: 322-342.
WALLSTRÖM, K., J. MATTILA, E. SANDBERG-KILPI, K. APPELGREN, C. HENRICSON, J. LILJEKVIST, R. MUNSTERHJELM, T. ODELSTRÖM, P. OJALA, J. PERSSON & H. SCHREIBER, 2000. The state of the environment in shallow bays. Descriptions of shallow bays in the counties of Uppsala and Stockholm, Sweden, Åland Islands and the archipelago of western Nyland, Finland. Assessment of inventory methods for benthic vegetational and fauna communities in shallow bays. Upplandsstiftelsen, report no. 18, 114 pp. + appendices (in Swedish).
WALTERS, C. 1997. Challenges in adaptive management of riparian and coastal ecosystems. Conserv. Ecol. (online) 1 (2):1, 21 pp. URL: http//www.consecol.org /vol1/iss2/art1 (Acc 05/01/12).
VAN BEUSEKOM, J.E.E. & V.N. DE JONGE, 2002. Long-term changes in Wadden Sea nutrient cycles: importance of organic matter import from the North Sea. Hydrobiol. 475/476: 185-194.
WASMUND, N. & S. UHLIG, 2003. Phytoplankton trends in the Baltic Sea. ICES J. Mar. Sci. 60: 177-186.
WASMUND, N., A. ANDRUSHAITIS, E. ŁYSIAK-PASTUSZAC, B. MÜLLER-KARULIS, G. NAUSCH, T. NEUMANN, H. OJAVEER, I. OLENINA, L. POSTEL & Z. WITEK, 2001. Trophic status of the south-eastern Baltic Sea: a comparison of coastal and open areas. Est. Coast. Shelf Sci. 53: 849-864.
WASSMANN, P. 2004. Pelagic eutrophication in the Gulf of Riga. In: Wassmann, P. & K. Olli (eds.), Drainage basin nutrient inputs and eutrophication: an integrated approach. University of Tromsø, Norway & Tartu University, Estonia pp. 250-265. URL:http://www.ut.ee/~olli/eutr/ (Acc 05/01/11).
WASSMANN, P. & K. OLLI (eds.), 2004. Drainage basin nutrient inputs and eutrophication: an integrated approach. University of Tromsø, Norway & Tartu University, Estonia, 309 pp. URL: http://www.ut.ee/~olli/eutr/ (Acc 05/01/11).
WASSMANN, P. & T. TAMMINEN, 1999a. Pelagic eutrophication and sedimentation in the Gulf of Riga: an introduction. J. Mar. Syst. 23: 1-10.
WASSMANN, P. & T. TAMMINEN (eds.), 1999b. Pelagic eutrophication and sedimentation in the Gulf of Riga. Special issue of J. Mar. Syst. 23, 283 pp.
WECKSTRÖM, K., S. JUGGINS & A. KORHOLA, 2004. Quantifying background nutrient concentrations in coastal waters: a case study from an urban embayment of the Baltic Sea. Ambio 33: 324-327.
WEILGAT, M. 2002. Compilation of nutrient loads for the Szczecin Lagoon (southern Baltic). In: Schernewski, G. & U. Schiewer (eds.), Baltic coastal ecosystems, structure, function and coastal zone management. Central and Eastern European Development Studies, Springer Verlag, Berlin, pp. 75-92.
WEIGELT, M. 1990. Oxygen conditions in the deep water of Kiel Bay and the impact of inflowing salt-rich water from the Kattegat. Meeresforsch., 33: 1-22.
WEIGELT, M. & H. RUMOHR, 1986. Effects of wide-range oxygen depletion on benthic fauna and demersal fish in Kiel Bay 1981-1983. Meeresforsch., 31: 124-136.
WESTBERG, V. & H-G. LAX, 2003. the soft bottom macrozoobenthos in three archipelago areas in the northern Gulf of Bothnia. West Finland Regional Environment Centre, Regional Environment Publication 318, 84 pp.
164

References
WIKNER, J. 1994. Evaluating year 1993. Gulf of Bothnia 1993, annual report from the marine environmental control programme. Umeå Marine Research Centre, Sweden, pp. 18-30 (in Swedish).
WIKNER, J. 1995. Evaluating year 1994. Gulf of Bothnia 1994, annual report from the marine environmental control programme. Umeå Marine Research Centre, Sweden, pp. 11-26 (in Swedish).
WIKNER, J. 1999. The Gulf of Bothnia – two different systems. The research data base, University of Umeå, Sweden. URL: http://www.info.umu.se/Forsknings databas/Projekt.asp?DokumentID=143 (Acc 04/12/31).
WINKLER, H.M. 2002. Effects of eutrophication on fish stocks in Baltic lagoons. In: Schernewski, G. & U. Schiewer (eds.), Baltic coastal ecosystems, structure, function and coastal zone management. Central and Eastern European Development Studies, Springer Verlag, Berlin, pp. 65-74.
WITEK, Z., C. HUMBORG, O. SAVCHUK, A. GRELOWSKI & E. ŁYSIAK-PASTUSZAK, 2003. Nitrogen and phosphorus budgets of the Gulf of Gdansk (Baltic Sea). Est. Coast. Shelf Sci. 57: 239-248.
WITEK, Z., S. OCHOCKI, J. NAKONIECZNY, B. PODGORSKA & A. DRGAS, 1999. Primary production and decomposition of organic matter in the epipelagic zone of the Gulf of Gdansk, an estuary of the Vistula. ICES J. Mar. Sci. 56 supp: 3-14.
WRZOLEK, L. 1996. Phytoplankton of the Gdansk Basin in 1979-1993. Oceanological Studies XXV (1-2): 87-100.
WULFF, F. & A-K. HALLIN, 1994. Nutrients and hydrography. Baltic Sea 1993, Swedish report on the environmental state of the Baltic proper, Stockholm Marine Research Institute, pp.17-20 (in Swedish).
WULFF, F., M. PERTTILÄ & L. RAHM, 1996. Monitoring, mass balance calculation of nutrient and the future of the Gulf of Bothnia. Ambio special report 8: 28-35.
WULFF, F., L. RAHM & P. LARSSON (eds.), 2001b. A systems analysis of the Baltic Sea. Ecological Studies 148, Springer Verlag, Berlin, 455 pp.
WULFF, F., L. RAHM, A-K. HALLIN & J. SANDBERG, 2001c. A nutrient budget model of the Baltic Sea. In: Wulff, F., L. Rahm and P. Larsson (eds.), A system analysis of the Baltic Sea. Ecological Studies 148, Springer Verlag, Berlin, pp. 353-372.
WULFF, F., E. BONSDORFF, I-M. GREN, S. JOHANSSON & A. STIGEBRANDT, 2001a. Giving advice on cost effective measures for a cleaner Baltic Sea: a challenge to science. Ambio 30: 254-259.
VUORINEN, I., J. HÄNNINEN, M. VIITASALO, U. HELMINEN & H. KUOSA, 1998. Proportion of copepod biomass declines with decreasing salinity in the Baltic Sea. ICES J. Mar. Sci. 55: 767-774.
YURKOVSKIS, A. 1998. Course and environmental consequences of eutrophication in the Gulf of Riga. Proc. Latvian Acad. Sci. Section B, 52: 56-61.
YURKOVSKIS, A. & B. MÜLLER-KARULIS, 2003. Effects of riverine inputs and local processes on nutrification of the Gulf of Riga. Poster at the Baltic Sea Science Congress, Helsinki, Finland, August 2003.
YURKOVSKIS, A, E. KOSTRICHKINA & A. IKAUNIECE, 1999. Seasonal succession and growth in the plankton communities of the Gulf of Riga in relation to long-term nutrient dynamics. Hydrobiol. 393: 83-94.
ZITKO, V. 1994. Principal component analysis in the evaluation of environmental data. Mar. Poll. Bull. 28: 718-722.
ZORITA, E. & A. LAINE, 2000. Dependence of salinity and oxygen concentrations in the Baltic Sea on large-scale atmospheric circulation. Climate Research 14: 25-41.
165

References
ÅDJERS, K. & O. SANDSTRÖM, 1999. Fish ecology. Gulf of Bothnia 1994, annual report from the marine environmental control programme. Umeå Marine Research Centre, Sweden, pp. 15-16 (in Swedish).
ÅDJERS, K., P. BÖHLING, M. KANGUR & E. NEUMAN, 1997. Monitoring in Baltic coastal references areas 1996 – composition of fish communities. – Kala- ja riistarapportteja 90, Finnish Game and Fisheries Research Institute, Helsinki, 21 pp.
ÅDJERS, K., M. APPELBERG, R. ESCHBAUM, A. LAPPALAINEN & L. LOZYS, 2001. Coastal fishing monitoring in Baltic reference area 2000. Kala- ja riistaraporteja 229, Finnish Game and Fisheries Research Institute, Helsinki, 14 pp + appendix.
ÖHMAN, P. 1995. Monitoring of phytoplankton development, with emphasis on cyanobacteria, in drinking water reservoirs and archipelago waters on Åland in the summer of 1995. Husö biological station, Åbo Akademi University, Finland, research report no. 92, 61 pp. (in Swedish with English summary).
ÖSTMAN, M. & E. M. BLOMKVIST, 1997. The state of the archipelago waters of the Åland Islands – a survey of the situation in the 1980s and 1990s, long-term changes and a proposal for parameters of water quality to be used in the legislation of water protection. Husö biological station, Åbo Akademi University, Finland, research report no. 95,46 pp. (in Swedish with English summary).
166