european union industrial energy use with a focus on
TRANSCRIPT

CIEP BRIEFING PAPER 2017 | 03
BRIEFING PAPER
EUROPEAN UNION INDUSTRIAL ENERGY USE WITH A FOCUS ON NATURAL GAS
BY IULIA PISCA

CIEP is affiliated to the Netherlands Institute of International Relations ‘Clingendael’.
CIEP acts as an independent forum for governments, non-governmental organizations,
the private sector, media, politicians and all others interested in changes and
developments in the energy sector.
CIEP organizes lectures, seminars, conferences and roundtable discussions. In addition,
CIEP members of staff lecture in a variety of courses and training programmes. CIEP’s
research, training and activities focus on two themes:
• European energy market developments and policy-making;
• Geopolitics of energy policy-making and energy markets
CIEP is endorsed by the Dutch Ministry of Economic Affairs and Climate, the Dutch Ministry
of Foreign Affairs, the Dutch Ministry of Infrastructure and Water Management, BP Europe
SE- BP Nederland, Coöperatieve Centrale Raiffeisen-Boerenleenbank B.A. ('Rabobank'),
ENGIE Energie Nederland N.V., ENGIE E&P Nederland B.V., Eneco Holding N.V., EBN B.V.,
Esso Nederland B.V., GasTerra B.V., N.V. Nederlandse Gasunie, Heerema Marine Contractors
Nederland B.V., ING Commercial Banking, Nederlandse Aardolie Maatschappij B.V., N.V. NUON
Energy, TenneT TSO B.V., Oranje-Nassau Energie B.V., Havenbedrijf Rotterdam N.V., Shell
Nederland B.V., Statoil ASA, TAQA Energy B.V.,Total E&P Nederland B.V., Koninklijke Vopak
N.V., Uniper Benelux and Wintershall Nederland B.V.
CIEP Briefing Papers are published on the CIEP website: www.clingendaelenergy.com/
publications

TITLE
European Union Industrial Energy Use with a Focus on Natural Gas
AUTHOR
Iulia Pisca
COPYRIGHT
© 2017 Clingendael International Energy Programme (CIEP)
NUMBER
Briefing paper 2017 | 03
EDITOR
Heather Montague
DESIGN Studio Maartje de Sonnaville
PUBLISHED BY
Clingendael International Energy Programme (CIEP)
ADDRESS
Clingendael 12, 2597 VH The Hague, The Netherlands
P.O. Box 93080, 2509 AB The Hague, The Netherlands
TELEPHONE
+31 70 374 67 00
WEBSITE
www.clingendaelenergy.com

BRIEFING PAPER
EUROPEAN UNION INDUSTRIAL ENERGY USE WITH A FOCUS ON NATURAL GAS

7
CONTENTS
FOREWORD
INTRODUCTION
1 EU INDUSTRIAL PRODUCTION A. Distribution of Industrial Activity across EU Member States
– National Level
B. Distribution of Industrial Activity across EU Member States
– Sub-National Level
2 EU INDUSTRIAL ENERGY CONSUMPTION A. EU Industrial Energy Consumption by Industrial Sector
B. EU Industrial Energy Consumption by Energy Source
C. EU Industrial Energy Consumption by Energy Function
3 EU INDUSTRIAL GAS CONSUMPTION A. EU Gas Consumption by Economic Sector
B. EU Industrial Gas Consumption
C. EU Industrial Gas Consumption by Sector
D. EU Industrial Gas Consumption by Member State
9
11
13
13
15
1919
20
21
2525
26
27
28

8 EUROPEAN UNION INDUSTRIAL ENERGY USE WITH A FOCUS ON NATURAL GAS BRIEFING PAPER
LIST OF FIGURESFigure 1 EU production value of industry by sector
Figure 2 EU industrial energy consumption by industrial sector, corresponding
to 2015 industrial production
Figure 3 EU industrial energy consumption by energy source, corresponding
to 2015 industrial production
Figure 4 EU Industrial energy consumption by energy function
Figure 5 Industrial energy consumption by energy functions and heat grades
Figure 6 The mix of heat grades, specific for each of the eight main industrial
sectors analysed
Figure 7 Development of EU natural gas consumption by economic sector
between 2000 and 2015
Figure 8 Sankey diagram describing the industrial energy and non-energy
consumption of EU manufacturing
Figure 9 EU industrial natural gas consumption by industrial sector
Figure 10 EU industrial gas consumption by Member State
LIST OF MAPSMap 1 Distribution of industrial production (euro value) by industrial sector,
across EU Member States
Map 2 Distribution of industrial production (euro value) by industrial sector,
across EU Member States in a sub-national breakdown
LIST OF TABLESTable 1 List of typical temperature ranges at which the main industrial
processes run
14
19
20
21
22
24
25
26
27
28
15
17
23
9
FOREWORD
In the 2016 study on EU gas demand1, it was clear that projections of gas demand in
the next decade vary widely. These variations are due to the assessment of the role of
natural gas in energy transition, in particular, demand in the power sector in the EU.
In many such projections of future gas demand, gas demand in the industrial sector
is assumed to be very stable, in essence forming the bedrock of gas demand. With
the formulation of the 2030 energy and climate policies of the EU member states
now underway, sectors other than the power sector come into view with respect to
energy transition. In addition to the power sector, transportation, particularly
passenger cars, as well as the residential heating sector, come under closer national
policy scrutiny for their decarbonisation potential. In some member states, a more
integrated energy system approach to energy transition, in Germany referred to as
‘sektor kopplung’, is gaining some traction. At some point in these discussions,
energy use of the industrial sector will also become an issue.
Due to the long investment cycles in industry and the benefits of being in the vicinity
of energy grids that serve the various demand functions in an economy,
understanding the special needs of industrial energy demand becomes important
when discussing the potential to increase energy and carbon efficiency, whilst
maintaining competitiveness. Already, the emergence of new energy technologies in
the energy system, particularly those with a variable production profile, increases the
need to either store electric energy in batteries of some sort or convert electrons into
(clean) molecules. These molecules could also find their way into industrial energy
demand. At the same time, the logic, layout and economics of the current energy
system will change when new energy technologies are introduced at a sufficient
scale. This will also impact industrial energy consumers, which are connected to the
same grids as other consumers. It is clear that we are moving and need to be moving
from a sector by sector understanding of energy transition to a more comprehensive
one that involves the entire energy system.
Very little information is publicly available to understand industrial energy and in
particular industrial gas demand in the EU. In this briefing paper we attempt to do
1 Iulia, Pisca, Outlook for EU Gas Demand and Import Needs to 2025, CIEP 2016.

10 EUROPEAN UNION INDUSTRIAL ENERGY USE WITH A FOCUS ON NATURAL GAS BRIEFING PAPER
just that by presenting some facts. What are the energy needs of the industrial
sector, how are they met now, and the question that led to this research, what is the
position of natural gas in meeting this industrial energy demand? The latter is
important for understanding how stable industrial gas demand is (and why) against
the background of the proposed energy transition pathways, also with regard to the
complexities involved in energy transition when looking at industry. Some industries
rely quite heavily on natural gas for their energy consumption and feedstock needs,
while other industries might have more options to fulfil that demand with alternative
sources. Some industries also greatly benefit from the clustered geography in their
energy choices, while others have a different set of resources optionality.
Coby van der Linde, Director CIEP

11
INTRODUCTION
Industry is an important part of the EU economy in terms of gross value added and
energy consumption. Industry contributes nearly 20% to the EU gross value added
and consumes about a third of EU energy. Because industrial production involves
several grades of processing, industrial outputs become industrial products only after
they have undergone a few processing steps. These processing steps each have their
own energy requirements, which are often served by particular energy sources.
The EU industrial base produced more than €6 trillion worth of industrial products in
2015. Both in terms of euro value creation and geographic spread, the distribution
of industry is uneven and concentrated mainly in Western EU Member States. More
than three quarters of the euro production value takes place there. Germany, Italy,
France, Spain and the Netherlands, the largest industrial producers, have been
historically strong industrial centers in Europe, and over the past two decades, they
have consolidated their manufacturing position through specialisation and
integration. Peripheral EU Member States, such as Eastern European countries2, have
modest industrial activity generating about a tenth of the EU euro production value
in 2015. The distribution of industrial production value between Western Member
States and Eastern EU Member States can be paralleled to their associated energy
consumption. About 70% of the EU industrial energy consumption takes place in
the 7 most industrialized countries of Western Europe3, and 15% in Eastern EU
Member States.
Due to the long investment cycles in industry, the next phase of decarbonisation
will include thinking about how industry can also contribute to reducing CO2
emissions. Furthermore, the industrial energy transition should take existing
rigidities built-in the system into account. They include long investment cycles
and complex material and energy flows between industrial processes, whose
premature and/or uncoordinated alteration could put pressure on the
competitiveness of the EU industrial base.
In this paper, the relative size and geography of the main EU industrial sectors is
mapped to get a better understanding of industrial energy consumption and
2 Notably: Poland, Czech Republic, Slovakia, Hungary, Romania and Bulgaria.
3 Germany, France, Italy, UK, Spain, Belgium and The Netherlands.

12 EUROPEAN UNION INDUSTRIAL ENERGY USE WITH A FOCUS ON NATURAL GAS BRIEFING PAPER
infrastructure clusters. We then look at the composition of industrial energy use
and the industrial energy mix in order to understand the position of natural gas in
industry. In the last sector, the natural gas use of industry is analysed per member
state, to finalise the understanding of the main industrial gas markets in the EU.
Industrial energy use, also representing a substantial share of natural gas
consumption, receives much less attention in energy debates than discussions
about the power sector, in part because demand has been so stable.
Natural gas delivers about a third of industry’s energy needs by supplying the
medium and high-temperature heat for energy-intensive industries. The role of
natural gas in industry becomes important in the current energy mix, as the
substitution of the energy-dense molecule is currently uneconomic and its
electrification is technically unfeasible for the mid and high end of the temperature
range. In this regard, natural gas enjoys a rather stable position in the EU industrial
energy mix. This is a different situation compared to the EU residential and power
sector, where the position of natural gas is less certain.
In this paper, the relative size and geography of the main EU industrial sectors is
mapped to get a better understanding of industrial production at Member State
level and sub-national clusters (Chapter 1). We then look at the composition of
industrial energy consumption using three ways in which energy is consumed
(Chapter 2). These breakdowns show the positioning of natural gas in industry
which is then detailed in the last chapter. Chapter 3 presents natural gas
consumption in industry, analysed per Member State and industrial sector, to
finalise the understanding of the main industrial gas markets in the EU.
13
1 EU INDUSTRIAL PRODUCTION
A. DISTRIBUTION OF INDUSTRIAL ACTIVITY ACROSS EU MEMBER STATES – NATIONAL LEVEL
The construction of the industry production value for the European Union is based
on 2015 Eurostat data. The aim of the EU industrial production map is to represent
manufacturing production in a comprehensive manner across the largest European
Member States and industrial sectors (Map 1). The monetary (euro) value of
production is the chosen comparison unit because the produced volumes and
production specs could not be translated otherwise to a comparable unit.
The Eurostat database provides the in euro denominated production value4 for
each manufacturing activity described in the Eurostat statistical classification of
economic activities (NACE), at the Member State level. The main industrial
sectors selected from NACE are the following: primary metals (steel and non-
ferrous metals), petrochemicals (refining and chemicals), construction materials
(non-metallic minerals), machinery, paper and food. The share of the value
production of an industrial sector in a Member State is graphically represented in
the map by a dot. Dot sizes are clustered in 4 brackets: above 20% production
share in EU total, between 10-20% production share in EU total, between 3-10%
production share in EU total and below 3% production share in EU total. For
example, German machinery accounts for more than 20% of the total production
value of EU machinery production.
Two additional notes should be made with regard to data accuracy. First, there is
the issue of missing production value data. Production value data in some specific
industries and/or Member States can be sensitive information, and is thus kept
confidential. Missing production value data was replaced with proxy-based
estimates5. Second, the production value is expressed in 2015 euros. In 2015,
only 19 of the 28 EU Member states were using the euro currency. An annual
4 Production value measures the amount actually produced by the unit, based on sales, including changes in stocks and the
resale of goods and services. The production value is defined as turnover, plus or minus the changes in stocks of finished
products, work in progress and goods and services purchased for resale, minus the purchases of goods and services for
resale, plus capitalised production, plus other operating income (excluding subsidies). Income and expenditure classified
as financial or extra-ordinary in company accounts is excluded from production value.
5 The main proxies used for the euro production value estimates are production capacity and utilisation rate, corrected with
the average of previous years. In some cases, missing production value data was checked against industry association
reports.

14 EUROPEAN UNION INDUSTRIAL ENERGY USE WITH A FOCUS ON NATURAL GAS BRIEFING PAPER
exchange rate vis-à-vis other EU national currencies was used to align the
industry production value estimates.6
Figure 2 shows the relative position of each EU Member State in one of the eight
main industrial sectors, compared to the EU total. The highest concentration of
industrial production at the EU level takes place in Germany whose euro
production value in industrial sectors, such as primary metals, machinery and
non-metallic minerals, is higher than 20% of the EU total. Other Member States
with significant industrial production are Italy, the Netherlands, Belgium, France,
Spain and the United Kingdom. Their individual contribution to the EU euro
production value across industrial sectors is lower than Germany’s (ranges
between 3-20% of EU total) and each of them excels cumulatively in fewer
industrial sectors than Germany. Furthermore, modest industrial performance is
recorded by peripheral EU Member States with sectoral contributions generally
lower than 3% of the EU total.
Showing the distribution of industrial production (by production value) in the EU is
functional for a number of reasons. It shows, for instance, that more than 75% of
industrial production (in euro value) is concentrated in Western European Member
States.7 The remaining 25% of industrial production (in euro value) is distributed
in small shares among the remaining Member States, often representing national
champion types of industries. Examples include the pulp and paper industry in
Sweden and Finland, steel in Poland and primary metals in Austria.
In absolute terms the production value of EU industry in 2015 was 6.1 trillion
euros (Figure 1). In monetary terms, machinery, petrochemicals and food
represent more than 75% of EU industrial production. Unsurprisingly, these are
the EU’s main export products to international markets according to the EU
international trade balance.8 Nonetheless, such a value dwarfs the cumulative
monetary contribution of primary metals, construction materials and paper, which
are generally domestically traded industrial commodities.
FIGURE 1 – EU PRODUCTION VALUE OF INDUSTRY BY SECTOR. SOURCE: EUROSTAT, CIEP.
6 The exchange rate list is available in the Eurostat production value metadata and Eurostat Structural Business Statistics
for industry.
7 Notably Germany, the Netherlands, Belgium, UK, France, Spain and Italy.
8 Eurostat – Euro Indicators (September, 2017).

15
MAP 1 – DISTRIBUTION OF INDUSTRIAL PRODUCTION (EURO VALUE) BY INDUSTRIAL SECTOR,
ACROSS EU MEMBER STATES. BASED ON 2015 EUROSTAT DATA. DOT SIZES ARE RELEVANT
WITHIN THEIR RESPECTIVE SECTOR.
B. DISTRIBUTION OF INDUSTRIAL ACTIVITY ACROSS EU MEMBER STATES – SUB-NATIONAL LEVEL
The distribution of EU Member State industrial production by industrial sector, in
Map 1, serves as an illustration for the relative industrial size (by euro production
value) of Member States’ economies relative to the EU total. Industrial production
is often unevenly distributed across Member States. A more realistic approach to
visualise the share of industrial production is to use a sub-national (regional)
break-down to show these geographic concentrations.

16 EUROPEAN UNION INDUSTRIAL ENERGY USE WITH A FOCUS ON NATURAL GAS BRIEFING PAPER
The starting point for a sub-national inventory is the national inventory, again
based on Eurostat data. Sub-national industrial production figures were extracted
from national statistics and industry association reports. The result, Map 2, shows
the distribution of industrial production (in relative terms) across the main sub-
national breakdowns.
A consequence of displaying sub-national levels of industrial production is that the
individual shares (dot sizes) become smaller. This required the adjustment of the
dot size brackets to the following: above 10% production share in EU total, between
5-10% production share in EU total, between 1-5% production share in EU total
and below 1% production share in EU total. For example, over 10% of the European
non-ferrous metal production (by euro value) takes place in Northern Italy.
The distribution of industrial production at sub-national EU level is illustrative for a
number of reasons.
• The location decision for many industrial activities is evident from the sub-
national EU industrial production. For industries such as primary metals, non-
metallic minerals and paper, whose processes of converting raw materials into
products takes place in the vicinity of the extraction sites, proximity to raw
materials and access to energy is the main driver for their location decision.9 For
most refining and chemical industries, it is important to have access to logistic
chains for input-output product flows.10
• Moreover, industrial sectors are often connected to each other through material
and energy flows. The classic example is that of the machinery industry which
uses various grades of material inputs from the steel and non-ferrous metal
industries. Similarly, the chemical industry is dependent on the refining industry
for some of its input materials. These interdependencies advance the
development of industrial clusters which favor scale economies, foster innovation
and favor the development of inter-sector synergies. Among the few industrial
clusters in the EU, most are concentrated in Western Europe (Mid-Rhine,
Antwerp-Rotterdam-Amsterdam, Northern Italy, UK central belt). Smaller clusters
exist in regions such as Bohemia, Silesia and Northern Spain. Although their
share in the total EU industrial production value is dwarfed by the large clusters,
they are significant for the economy of their respective Member States.
9 Examples include industrial regions such as Rhine-Ruhr, Bohemia and Silesia which are the resource base for a significant
part of primary metal industries, and biomass-rich inland Finland and Sweden which accommodate the highest
concentration of pulp and paper mills in the EU.
10 Over 60% of the EU refining capacity is located in coastal areas, and has access to downstream logistic chains (inland
waterways, petrochemical pipelines) to facilitate the uptake of their product output. See also Michiel Nivard and Maurits
Kreijkes, The European Refining Sector: A Diversity of Markets?, CIEP, (2017).

17
• Aside from industrial production, the distribution of industrial activity by relative
size is a useful proxy for where industrial energy consumption takes place in the
EU.
MAP 2 –DISTRIBUTION OF INDUSTRIAL PRODUCTION (EURO VALUE) BY INDUSTRIAL SECTOR,
ACROSS EU MEMBER STATES IN A SUB–NATIONAL BREAKDOWN. BASED ON 2015 EUROSTAT
DATA.
19
2 EU INDUSTRIAL ENERGY CONSUMPTION
Industry is one of the largest energy consuming sectors in the EU economy,
together with transportation and the residential sector. This section looks into EU
industrial energy consumption associated with industrial production presented in
the previous section. The scope is to show three ways of looking at industrial
energy consumption based on the way energy is employed.
A. EU INDUSTRIAL ENERGY CONSUMPTION BY INDUSTRIAL SECTOR
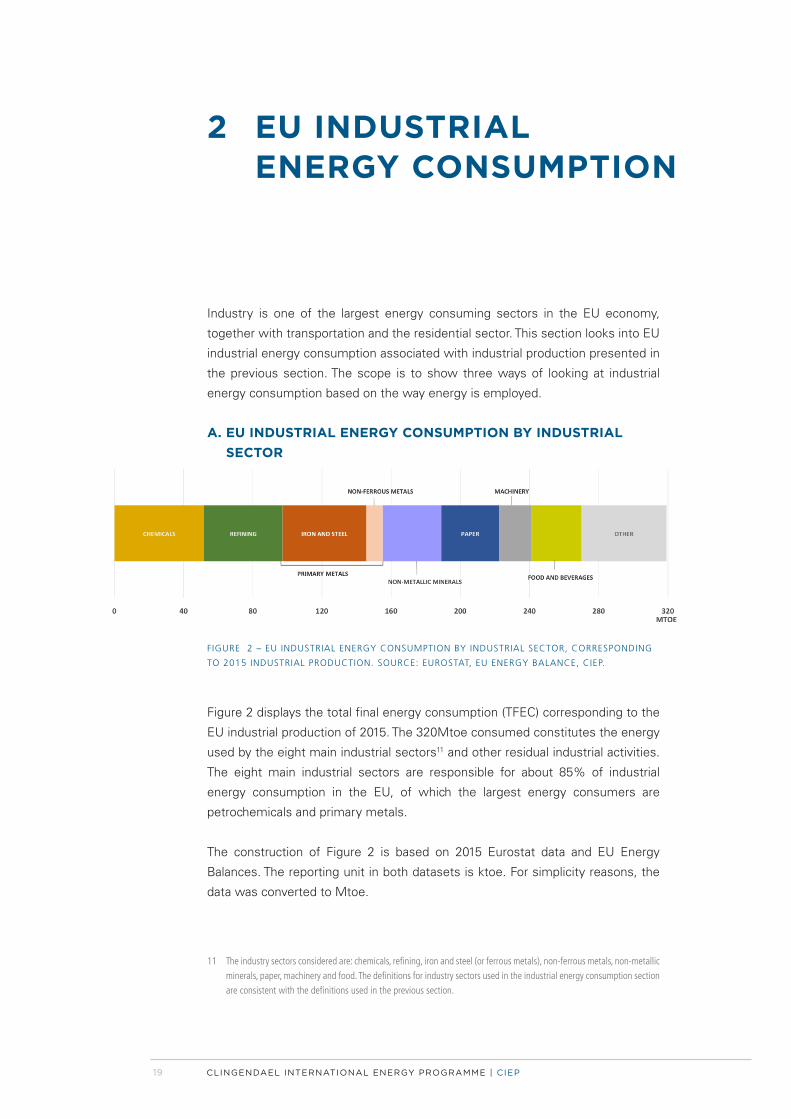
FIGURE 2 – EU INDUSTRIAL ENERGY CONSUMPTION BY INDUSTRIAL SECTOR, CORRESPONDING
TO 2015 INDUSTRIAL PRODUCTION. SOURCE: EUROSTAT, EU ENERGY BALANCE, CIEP.
Figure 2 displays the total final energy consumption (TFEC) corresponding to the
EU industrial production of 2015. The 320Mtoe consumed constitutes the energy
used by the eight main industrial sectors11 and other residual industrial activities.
The eight main industrial sectors are responsible for about 85% of industrial
energy consumption in the EU, of which the largest energy consumers are
petrochemicals and primary metals.
The construction of Figure 2 is based on 2015 Eurostat data and EU Energy
Balances. The reporting unit in both datasets is ktoe. For simplicity reasons, the
data was converted to Mtoe.
11 The industry sectors considered are: chemicals, refining, iron and steel (or ferrous metals), non-ferrous metals, non-metallic
minerals, paper, machinery and food. The definitions for industry sectors used in the industrial energy consumption section
are consistent with the definitions used in the previous section.
20 EUROPEAN UNION INDUSTRIAL ENERGY USE WITH A FOCUS ON NATURAL GAS BRIEFING PAPER
While the graph displaying industrial energy consumption by sector is illustrative
on its own, analysing it in connection to the EU industrial production value (Map
1) offers an indication of the energy intensity of each sector. Energy intensity,
defined as the energy per value created (expressed in ktoe per euro), is the
closest to a standardised unit for a cross sector comparison of this type. In the
case of the EU industrial base, manufacturing of steel and non-metallic minerals
has the highest energy consumption per value of product created. Their energy
intensity is nearly double that of non-ferrous metal production, and about three
times as much as machinery.12
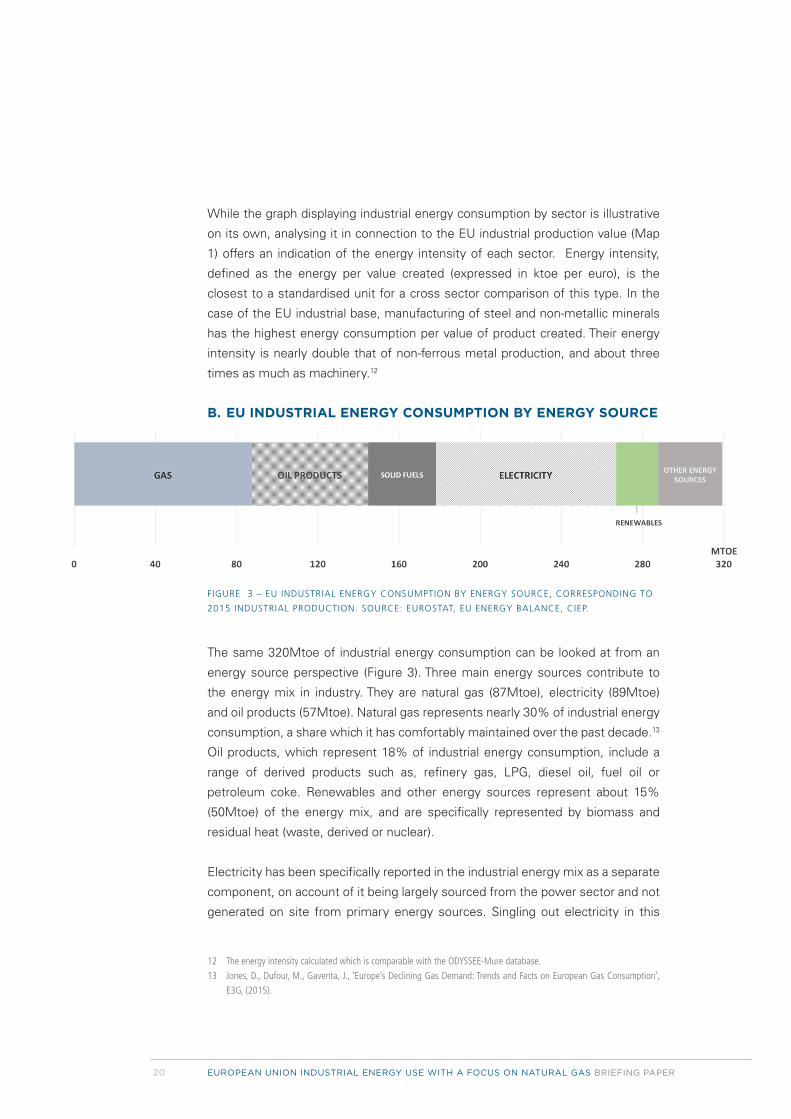
B. EU INDUSTRIAL ENERGY CONSUMPTION BY ENERGY SOURCE
FIGURE 3 – EU INDUSTRIAL ENERGY CONSUMPTION BY ENERGY SOURCE, CORRESPONDING TO
2015 INDUSTRIAL PRODUCTION. SOURCE: EUROSTAT, EU ENERGY BALANCE, CIEP.
The same 320Mtoe of industrial energy consumption can be looked at from an
energy source perspective (Figure 3). Three main energy sources contribute to
the energy mix in industry. They are natural gas (87Mtoe), electricity (89Mtoe)
and oil products (57Mtoe). Natural gas represents nearly 30% of industrial energy
consumption, a share which it has comfortably maintained over the past decade.13
Oil products, which represent 18% of industrial energy consumption, include a
range of derived products such as, refinery gas, LPG, diesel oil, fuel oil or
petroleum coke. Renewables and other energy sources represent about 15%
(50Mtoe) of the energy mix, and are specifically represented by biomass and
residual heat (waste, derived or nuclear).
Electricity has been specifically reported in the industrial energy mix as a separate
component, on account of it being largely sourced from the power sector and not
generated on site from primary energy sources. Singling out electricity in this
12 The energy intensity calculated which is comparable with the ODYSSEE-Mure database.
13 Jones, D., Dufour, M., Gaventa, J., ‘Europe’s Declining Gas Demand: Trends and Facts on European Gas Consumption’,
E3G, (2015).
21
way makes it easier to discuss the decarbonisation of industrial energy
consumption. Most of the emissions associated with industrial energy
consumption come from gas, oil products and solid fuels, which supply more
than half of the energy needs of the sector. Although electricity used by various
industries can be (and probably is) generated using also fossil fuels, the task of
decarbonising those electrons falls on the power sector. Under the Renewable
Energy Directive, power producers are mandated with reducing the carbon
emissions associated with electricity production.
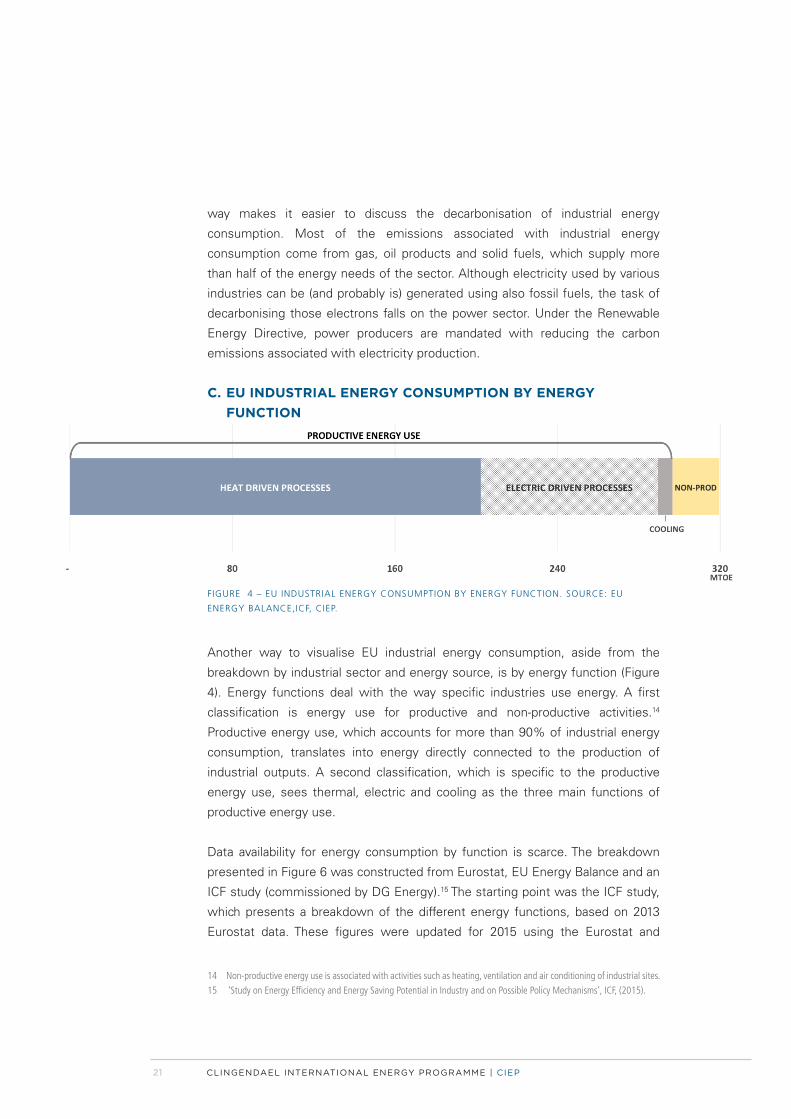
C. EU INDUSTRIAL ENERGY CONSUMPTION BY ENERGY FUNCTION
FIGURE 4 – EU INDUSTRIAL ENERGY CONSUMPTION BY ENERGY FUNCTION. SOURCE: EU
ENERGY BALANCE,ICF, CIEP.
Another way to visualise EU industrial energy consumption, aside from the
breakdown by industrial sector and energy source, is by energy function (Figure
4). Energy functions deal with the way specific industries use energy. A first
classification is energy use for productive and non-productive activities.14
Productive energy use, which accounts for more than 90% of industrial energy
consumption, translates into energy directly connected to the production of
industrial outputs. A second classification, which is specific to the productive
energy use, sees thermal, electric and cooling as the three main functions of
productive energy use.
Data availability for energy consumption by function is scarce. The breakdown
presented in Figure 6 was constructed from Eurostat, EU Energy Balance and an
ICF study (commissioned by DG Energy).15 The starting point was the ICF study,
which presents a breakdown of the different energy functions, based on 2013
Eurostat data. These figures were updated for 2015 using the Eurostat and
14 Non-productive energy use is associated with activities such as heating, ventilation and air conditioning of industrial sites.
15 ‘Study on Energy Efficiency and Energy Saving Potential in Industry and on Possible Policy Mechanisms’, ICF, (2015).

22 EUROPEAN UNION INDUSTRIAL ENERGY USE WITH A FOCUS ON NATURAL GAS BRIEFING PAPER
Energy Balance datasets. It involved the adjustment of energy consumption and
industrial production between 2013 and 2015.16
Electric driven processes use about 30% of industrial energy and are sourced
mainly from the power grid. The thermal function accounts for more than 60% of
the entire industrial energy consumption. It is derived on site and it is subject to
industrial process characteristics. Although heat is a generic term for all thermal
processes used in industry, the temperature at which they operate ranges from
100°C to 1650°C. A breakdown by three temperature grades is generally used to
differentiate thermal processes based on industrial heat needs:
(i) Low temperature heat - Between 100°C and 250°C
(ii) Mid temperature heat - Between 250°C and 600°C
(iii) High temperature heat - Above 600°C.
The temperature grades presented above were applied to the data underlying
Figure 4, and presented in Figure 5. Of the 320Mtoe industrial energy
consumption, 202Mtoe are used in heat driven processes. Within industrial heat
consumption, 94Mtoe were used to generate low temperature heat, 39Mtoe for
mid temperature heat and 69Mtoe for high temperature heat.
FIGURE 5 – INDUSTRIAL ENERGY CONSUMPTION BY ENERGY FUNCTIONS AND HEAT GRADES.
SOURCE: EU ENERGY BALANCE,ICF, CIEP.
16 Change in energy consumption between 2013 and 2015. The figure used in the 2013 energy use assessment is 322Mtoe.
By 2015 it came down by less than 1%, to 320Mtoe. Because the difference between 2013 and 2015 industrial energy
consumption is marginal, it was unproblematic to apply the conversions for energy functions from 2013 to 2015. Minor
adjustments were applied for energy efficiency improvements of industrial processes and industrial production. The
Eurostat database records a 2.5% energy efficiency improvement and an industrial production index growth of 1.8%. The
production growth was recorded only in some industrial sectors, which received the necessary adjustment.
23
The thermal function of industrial energy consumption can be related to both the
energy sources and industrial sectors, presented in Figure 2 and Figure 3.
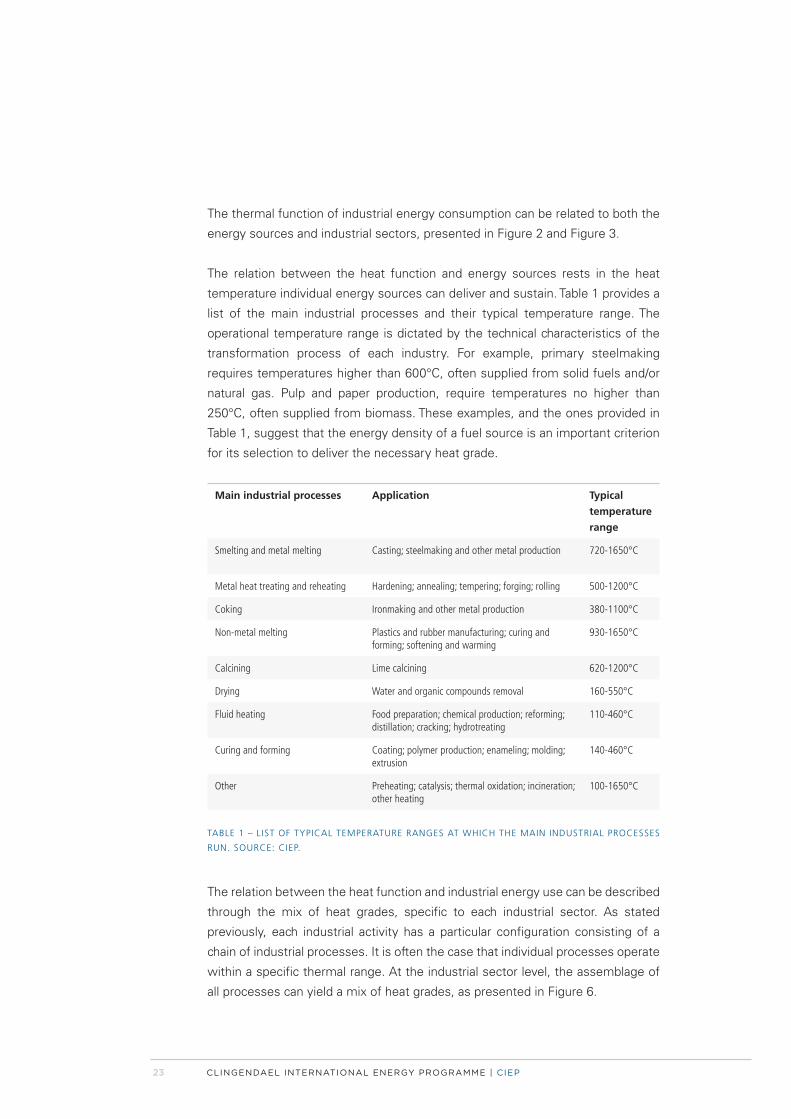
The relation between the heat function and energy sources rests in the heat
temperature individual energy sources can deliver and sustain. Table 1 provides a
list of the main industrial processes and their typical temperature range. The
operational temperature range is dictated by the technical characteristics of the
transformation process of each industry. For example, primary steelmaking
requires temperatures higher than 600°C, often supplied from solid fuels and/or
natural gas. Pulp and paper production, require temperatures no higher than
250°C, often supplied from biomass. These examples, and the ones provided in
Table 1, suggest that the energy density of a fuel source is an important criterion
for its selection to deliver the necessary heat grade.
Main industrial processes Application Typical
temperature
range
Smelting and metal melting Casting; steelmaking and other metal production 720-1650°C
Metal heat treating and reheating Hardening; annealing; tempering; forging; rolling 500-1200°C
Coking Ironmaking and other metal production 380-1100°C
Non-metal melting Plastics and rubber manufacturing; curing and forming; softening and warming
930-1650°C
Calcining Lime calcining 620-1200°C
Drying Water and organic compounds removal 160-550°C
Fluid heating Food preparation; chemical production; reforming; distillation; cracking; hydrotreating
110-460°C
Curing and forming Coating; polymer production; enameling; molding; extrusion
140-460°C
Other Preheating; catalysis; thermal oxidation; incineration; other heating
100-1650°C
TABLE 1 – LIST OF TYPICAL TEMPERATURE RANGES AT WHICH THE MAIN INDUSTRIAL PROCESSES
RUN. SOURCE: CIEP.
The relation between the heat function and industrial energy use can be described
through the mix of heat grades, specific to each industrial sector. As stated
previously, each industrial activity has a particular configuration consisting of a
chain of industrial processes. It is often the case that individual processes operate
within a specific thermal range. At the industrial sector level, the assemblage of
all processes can yield a mix of heat grades, as presented in Figure 6.

24 EUROPEAN UNION INDUSTRIAL ENERGY USE WITH A FOCUS ON NATURAL GAS BRIEFING PAPER
FIGURE 6 - THE MIX OF HEAT GRADES, SPECIFIC FOR EACH OF THE EIGHT MAIN INDUSTRIAL
SECTORS ANALYSED. SOURCE: EUROSTAT, EU ENERGY BALANCE, ICF, CIEP.
Because of its complexity, the breakdown of industrial energy consumption by
energy function is one of the most challenging aspects to describe regarding
industrial energy consumption. It is also the most rewarding, as it provides a
foundation for discussing any major structural shifts in industrial energy
consumption, such as electrification and the energy efficiency improvement
potential. Moreover, it can be the starting point for assessments regarding the
decarbonisation potential of individual industrial sectors.

25
3 EU INDUSTRIAL GAS CONSUMPTION
A. EU GAS CONSUMPTION BY ECONOMIC SECTORNatural gas is used widely across a range of economic sectors in the EU. While in
the power sector it is in close competition with alternative sources and in the
residential sector it is subject to weather induced seasonal variation, industrial
gas consumption has been regarded as a stable natural gas demand sector.
FIGURE 7 – DEVELOPMENT OF EU NATURAL GAS CONSUMPTION BY ECONOMIC SECTOR
BETWEEN 2000 AND 2015. SOURCE: EUROSTAT, CIEP.
On the whole, EU natural gas consumption experienced an overall volume decline
since 2000 (Figure 7). Between 2000 and 2008, gas consumption in the EU grew
from 472Bcm to 500Bcm supported by buoyant economic activity. In the period
that followed, EU gas consumption was subject to two depressions. The first
was in the wake of the economic and financial crisis (2009) and was caused by a
dip in economic activity. The second materialised in the period from 2011-2014, as
natural gas was gradually pushed out of the power mix when cheap coal and low
carbon prices coincided to push natural gas further down the merit order. EU
natural gas consumption reached a record low (since 2000) consumption level in
2014 (414Bcm). Throughout this period, industrial gas consumption retained a
relatively stable volume consumption.
26 EUROPEAN UNION INDUSTRIAL ENERGY USE WITH A FOCUS ON NATURAL GAS BRIEFING PAPER
The data presented in Figure 9 was constructed using Eurostat data. For
consistency, the industry sector definitions used in the previous chapters were
used here as well. The reporting units (ktoe) were converted to Mtoe and Bcm.
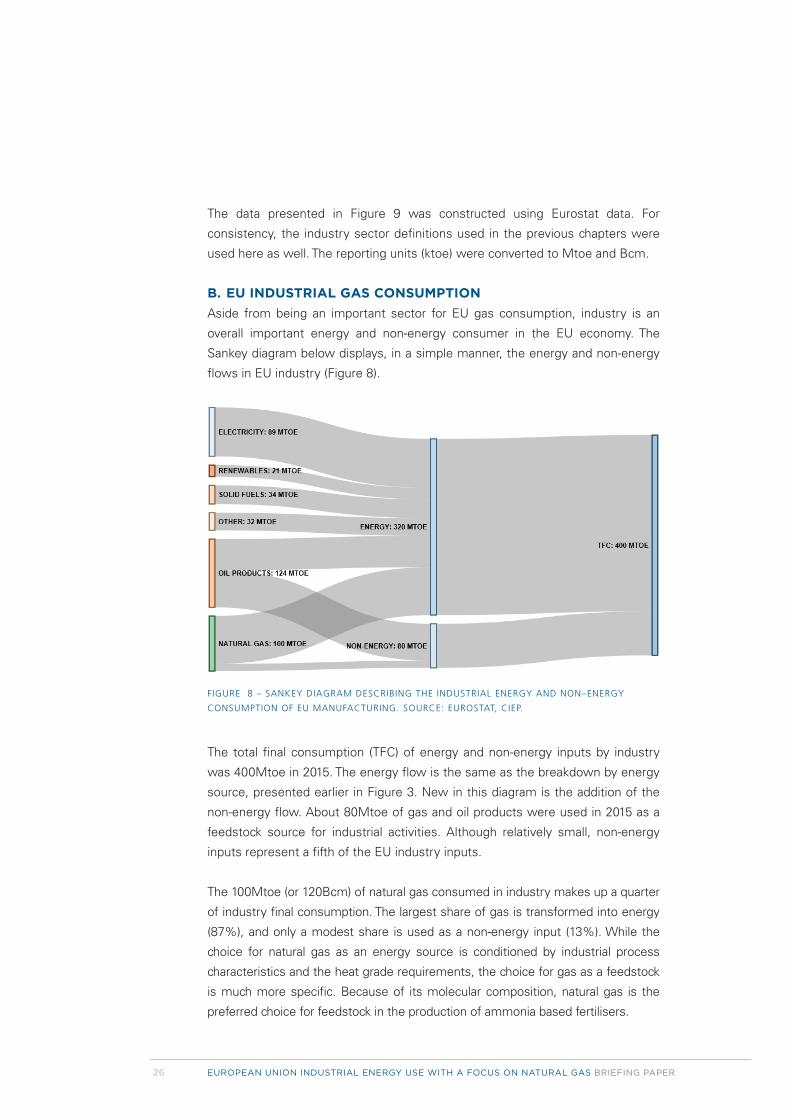
B. EU INDUSTRIAL GAS CONSUMPTIONAside from being an important sector for EU gas consumption, industry is an
overall important energy and non-energy consumer in the EU economy. The
Sankey diagram below displays, in a simple manner, the energy and non-energy
flows in EU industry (Figure 8).
FIGURE 8 – SANKEY DIAGRAM DESCRIBING THE INDUSTRIAL ENERGY AND NON–ENERGY
CONSUMPTION OF EU MANUFACTURING. SOURCE: EUROSTAT, CIEP.
The total final consumption (TFC) of energy and non-energy inputs by industry
was 400Mtoe in 2015. The energy flow is the same as the breakdown by energy
source, presented earlier in Figure 3. New in this diagram is the addition of the
non-energy flow. About 80Mtoe of gas and oil products were used in 2015 as a
feedstock source for industrial activities. Although relatively small, non-energy
inputs represent a fifth of the EU industry inputs.
The 100Mtoe (or 120Bcm) of natural gas consumed in industry makes up a quarter
of industry final consumption. The largest share of gas is transformed into energy
(87%), and only a modest share is used as a non-energy input (13%). While the
choice for natural gas as an energy source is conditioned by industrial process
characteristics and the heat grade requirements, the choice for gas as a feedstock
is much more specific. Because of its molecular composition, natural gas is the
preferred choice for feedstock in the production of ammonia based fertilisers.
27
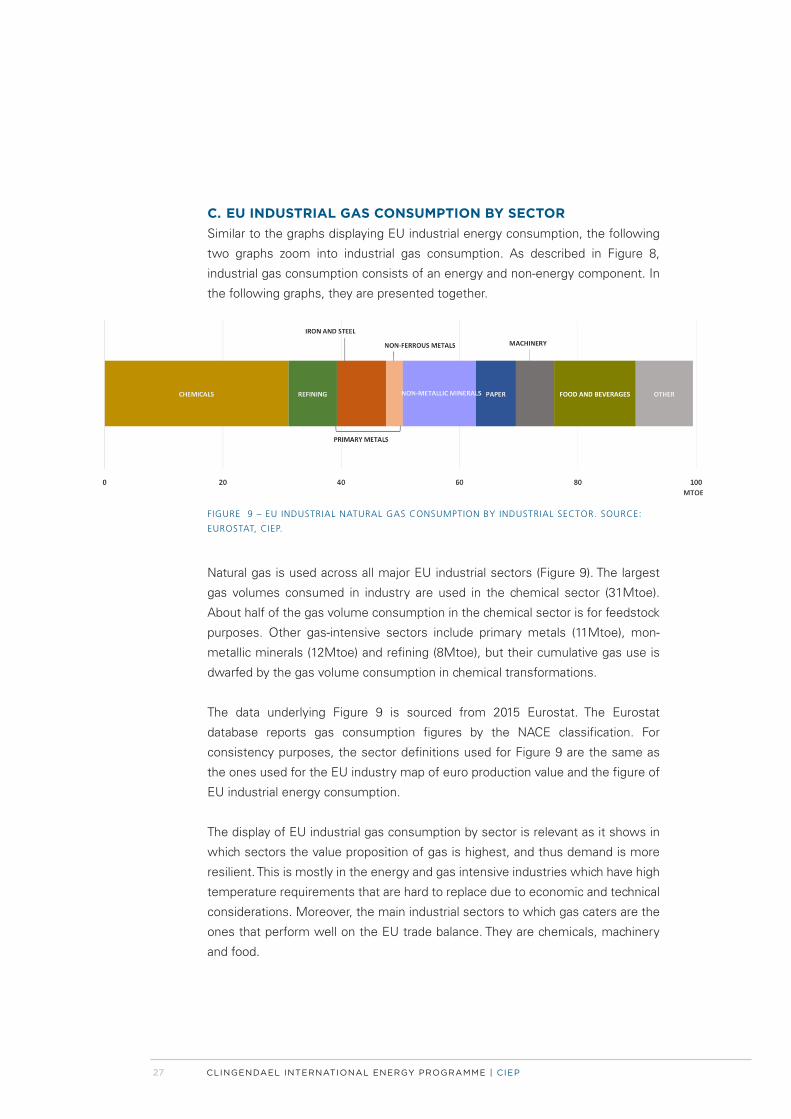
C. EU INDUSTRIAL GAS CONSUMPTION BY SECTOR Similar to the graphs displaying EU industrial energy consumption, the following
two graphs zoom into industrial gas consumption. As described in Figure 8,
industrial gas consumption consists of an energy and non-energy component. In
the following graphs, they are presented together.
FIGURE 9 – EU INDUSTRIAL NATURAL GAS CONSUMPTION BY INDUSTRIAL SECTOR. SOURCE:
EUROSTAT, CIEP.
Natural gas is used across all major EU industrial sectors (Figure 9). The largest
gas volumes consumed in industry are used in the chemical sector (31Mtoe).
About half of the gas volume consumption in the chemical sector is for feedstock
purposes. Other gas-intensive sectors include primary metals (11Mtoe), mon-
metallic minerals (12Mtoe) and refining (8Mtoe), but their cumulative gas use is
dwarfed by the gas volume consumption in chemical transformations.
The data underlying Figure 9 is sourced from 2015 Eurostat. The Eurostat
database reports gas consumption figures by the NACE classification. For
consistency purposes, the sector definitions used for Figure 9 are the same as
the ones used for the EU industry map of euro production value and the figure of
EU industrial energy consumption.
The display of EU industrial gas consumption by sector is relevant as it shows in
which sectors the value proposition of gas is highest, and thus demand is more
resilient. This is mostly in the energy and gas intensive industries which have high
temperature requirements that are hard to replace due to economic and technical
considerations. Moreover, the main industrial sectors to which gas caters are the
ones that perform well on the EU trade balance. They are chemicals, machinery
and food.

28 EUROPEAN UNION INDUSTRIAL ENERGY USE WITH A FOCUS ON NATURAL GAS BRIEFING PAPER
D. EU INDUSTRIAL GAS CONSUMPTION BY MEMBER STATE
FIGURE 10 – EU INDUSTRIAL GAS CONSUMPTION BY MEMBER STATE. SOURCE: EUROSTAT, CIEP.
The map of EU industrial activity by euro production value demonstrates, among
other things, that manufacturing is concentrated in a few Member States. This
pairs with industrial gas consumption, of which 75% takes place in Germany,
Italy, France, the United Kingdom, the Netherlands, Spain and Belgium. Eastern
European Member states, such as the Visegrad+2 group, account for about 15%
of the EU industrial gas consumption.
The data underlying Figure 10 has been extracted from the same Eurostat database
as Figure 9.
The industrial production map of EU Member States presents the geographic
distribution of industrial value creation by industrial sector. What comes out of
Map 1 is that seven, geographically close, EU Member States account for nearly
80% of manufacturing euro production value, while consuming 70% of EU
industrial energy, and 75% of EU industrial gas. Moreover, the Western European
states benefit from a wide network of energy and feedstock infrastructure and
have developed over time a powerful logistical foundation. It is safe to argue that
this is the core of EU industrial energy and gas consumption.

VISITING ADDRESS Clingendael 12
2597 VH The Hague
The Netherlands
POSTAL ADDRESS
P.O. Box 93080
2509 AB The Hague
The Netherlands
TEL +31 (0)70 - 374 67 00
www.clingendaelenergy.com