european semester thematic factsheet
TRANSCRIPT

Page 1 |
1. INTRODUCTION
The services sector is the main contributor
to growth and employment in the EU, accounting for about two thirds of both EU
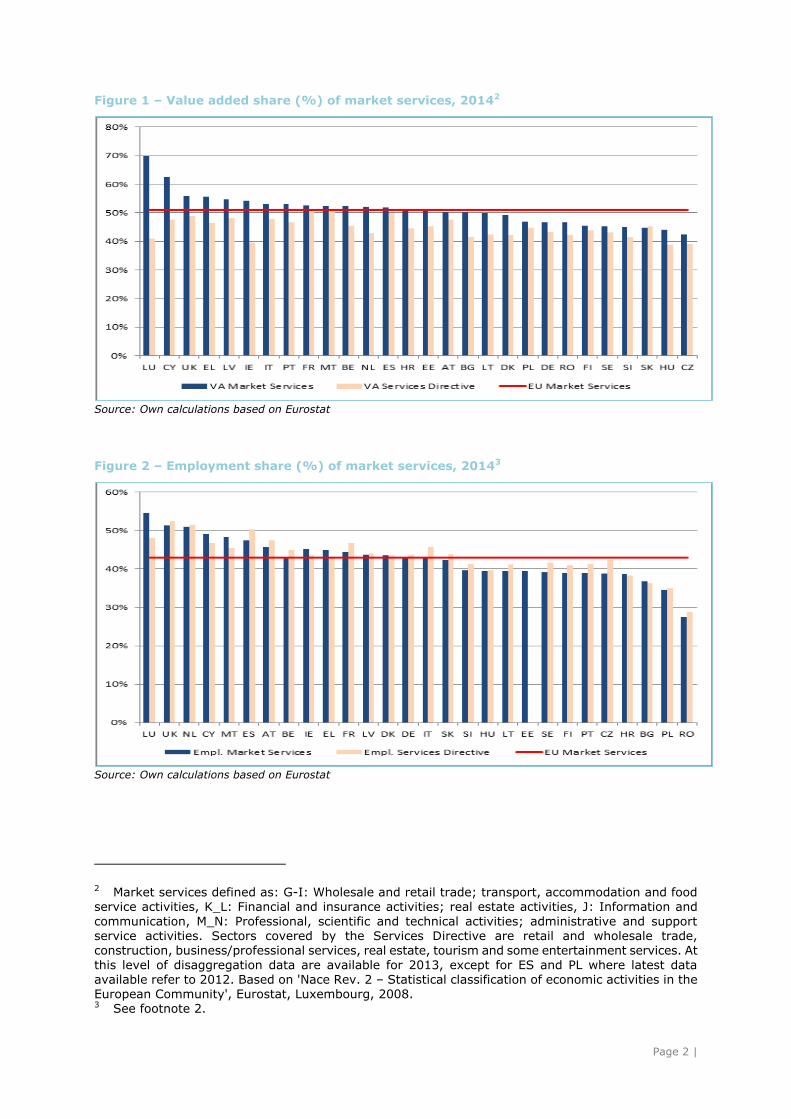
employment and value added1. Figure 1 depicts the value added share of market
services (NACE sectors G to N) in Member States as well as the average value added
share in the EU28 in 2014. Luxembourg
(70%), Cyprus (62%), United Kingdom (60%) and Greece (55.6%) are among the
countries with the highest value added generated by market services. On the
other extreme are the Czech Republic (42.6%) and Hungary (44%) and to a
lesser extent Germany (48.5%) when compared to other MS and the EU.
The Services Directive, approved in 2006, provides a horizontal framework which
covers 46% of EU GDP (including business services, wholesale and retail and
construction). The share of total value added stemming from services covered by
the Services Directive varies among
Member States, from around 50% in France, the UK, Latvia, Cyprus, Italy, and
Austria, to approximately 40% in Ireland, Hungary and Czech Republic.
While value added share provides an
output-based measure on the importance
of a particular sector in the economy, employment share provides further
information from the input side. Figure 2
1 Measured as gross value added (GVA), here used as an approximation of gross domestic product (GDP). The relationship between GVA
and GPD is: GVA + taxes on products – subsidies on products = GDP.
displays the 2014 aggregate employment share of market services as well sectors
covered by the Services Directive
(measured as persons employed), which shows considerable variation across
countries. Around 45% of EU employment is generated by the sectors covered by the
Services Directive, with Member States' shares spanning from close to 50% in
Luxembourg to around 29% in Romania. In particular, the activities covered by the
Services Directive made up more than
52% of employment in the UK, the Netherlands, Malta and Cyprus and less
than 39% in Poland, Bulgaria, Hungary and Ireland.
Due to the nature of service provision, the
sector has strong interlinkages also to
other economic sectors, such as manufacturing. The interlinkages, or
mutual dependencies, are visible in two ways. Firstly, they are important as
services industries are customers or users of other sectors' inputs (backward
linkages). Secondly, services industries also serve as suppliers or inputs into the
production process of other sectors
(forward linkages). The increasing forward and backward linkages are part of the
trend of blurring borders between services and manufacturing, sometimes known as
servitisation or servicification.
EUROPEAN SEMESTER THEMATIC FACTSHEET
SERVICES
Page 2 |
Figure 1 – Value added share (%) of market services, 20142
Source: Own calculations based on Eurostat
Figure 2 – Employment share (%) of market services, 20143
Source: Own calculations based on Eurostat
2 Market services defined as: G-I: Wholesale and retail trade; transport, accommodation and food service activities, K_L: Financial and insurance activities; real estate activities, J: Information and
communication, M_N: Professional, scientific and technical activities; administrative and support
service activities. Sectors covered by the Services Directive are retail and wholesale trade, construction, business/professional services, real estate, tourism and some entertainment services. At
this level of disaggregation data are available for 2013, except for ES and PL where latest data available refer to 2012. Based on 'Nace Rev. 2 – Statistical classification of economic activities in the European Community', Eurostat, Luxembourg, 2008. 3 See footnote 2.

Page 3 |
Demand spillovers (backward linkages) generated by services sectors are large
and for selected sectors of a similar order
of magnitude of the spillovers generated by manufacturing. These backward
linkages show the total production generated, directly and indirectly, to
satisfy one euro of final demand for services.
The range of the value of multipliers for
services in the EU27 is 1.6 (real estate) to
2.5 (air transport) and are important for the priority sectors of construction (2.3),
business services (1.9) and retail services (1.8)4.
The role of services as intermediate inputs
into the production of all goods and
services produced in the economy is analysed by calculating forward linkages.
The value of a services industry's forward linkages is an indication of how much of its
production contributes to the production of other industries.
It includes both services' share as direct inputs into the production of other goods
and services, as well as indirect inputs via other industries (feedback effect).
The larger this feedback effect, the larger
the spillovers generated by well-
functioning services sectors as efficiency gains are transmitted to the rest of the
economy via their role in the production process.
For EU27 the share (%) of the various
services sectors in the total value of
intermediate inputs used in the economy stand at: Business services (5.5),
wholesale trade (3.0), retail trade (2.3), construction (2.2) and hotels and
restaurants (1.3). In particular the former thus constitute key inputs into other parts
of the economy5.
Given the importance of the performance
and functioning of the EU services market for the overall EU economy, a well-
functioning services market is a key component in the Commission's focus on
4 Source: World Input-Output Database (WIOD) (www.wiod.org). 5 Source: WIOD (www.wiod.org).
boosting job, growth and investment, while ensuring a deeper and fairer internal
market.
Despite previous attempts to lower the
barriers to the cross-border provision of services, obstacles remain mainly as a
result of diverging national rules and procedures.
Such obstacles stifle economic growth while leading to an inefficient allocation of
resources across/within EU economies, lower competitive pressures and less
cross-border trade. Removing such obstacles would provide both services
providers and customers with greater opportunities to make full use of the
potential of the internal market.
In the 2015 Digital Single Market Strategy
(DSM) and the Single Market Strategy (SMS), the Commission announced
initiatives aimed at removing obstacles hampering the growth in the EU services
market, be it on-line or off-line. These
initiatives include:
Collaborative economy: A June 2016 Commission communication providing
legal guidance and orientation to public authorities, market operators
and interested citizens for the
balanced and sustainable development of the collaborative economy.
Geo-blocking: A May 2016 Commission proposal for a regulation seeking to
clarify the grounds on which access to a service can be denied depending on
residence or nationality, providing increased certainty to customers and
companies alike.
European Services e-card: A forthcoming legislative proposal
introducing a European services e-card facilitating the provision of services in
the single market. Notification procedure: A forthcoming
legislative proposal aimed at strengthening the procedure under the
Services Directive, whereby the Member
States notify changes in national services rules.
Proportionality tests: An initiative to improve the assessment of
proportionality of national regulatory measures.

Page 4 |
Reform guidance: A guidance for regulation of professional services at
national level6.
Retail: Commission initiative setting out best practices for facilitating retail
establishment and reducing operational restrictions in the Single Market.
This note is structured as follows.
Section 1 provides an overview of economic input (value added) and output
(employment) indicators highlighting the
importance of the services sector for the EU wide economy. Section 2 contains
performance indicators which summarise the policy challenges facing the services
sector. Section 3 identifies policy levers to address these challenges. Section 4
provides good policy examples used by Member States to address challenges.
2. POLICY CHALLENGES
Despite the importance of the EU services sector overall, a number of challenges
continue to face EU services provision to
the detriment of the sector's growth potential.
These challenges include slow productivity
growth, inefficient resource allocation, low competitive pressure and cross-border
services integration.
2.1. Slow productivity growth
Despite some improvements in labour
productivity per person employed in 2008
to 2013 in some countries (notably those that joined the EU in 2004), labour
productivity growth in the EU services sector has been outperformed by other
economic sectors, including manufac-turing
7.
6 For further discussion, see the European Semester thematic factsheet on regulated
professions. 7 See Commission SWD(2015) 203, 'Report on Single Market Integration and Compe-
titiveness in the EU and its Member States', accompanying the Communication COM(2015) 550, 'Upgrading the Single Market: more opportunities for people and business'.
OECD data8 shows average annual labour
productivity growth (2001-2013) in manufacturing of 2,6%, whereas most
service sectors experienced growth below 1% or even decline over this period.
Also, when comparing to average annual labour productivity growth in the US, research
9 estimates that EU services over
the period 2007-2010 underperformed in several sectors such as construction (-
3,45% vs. 2,55%), IT services (-0,72% vs. 4,24%) and retail (2,02% vs. 2,94%).
Reducing this productivity growth gap is key for the competitiveness of the
European services sectors and the growth and jobs it can create.
Figure 3 compares labour productivity growth in the EU across market services
and the manufacturing sector in two periods of time. Since the crisis labour
productivity in the manufacturing sector has grown at higher rates in comparison
with the services sector.
It is important to note that business
services displayed a negative labour productivity growth during the first years
of the crisis. Even if during the adjustment years (2012-2014) their productivity has
recovered, it still grew at a slow pace.
8 See OECD statistics on Productivity and ULC
by main economic activity (http://stats.oecd.org/Index.aspx?DataSetCode=PDBI_I4). 9 Source: WIOD (www.wiod.org).

Page 5 |
Figure 3 – Sectoral productivity growth since the crisis in market services
Source: Commission services' calculations based on Eurostat
In terms of the relation between labour
productivity developments and labour compensation, recent evidence10 shows
that labour productivity in market servi-ces has only outpaced labour compen-
sation in countries such as Portugal, Spain, Cyprus and Greece
11, which have
experienced strong market pressures
and which have been undergoing major competitiveness adjustments. Figure 4
compares Unit labour costs (ULC) at sec-
toral level, before and during the crisis.
The figure shows that in the period
before the crisis wage compensation were growing faster than labour produ-
ctivity. Indeed, losses of competitiveness in the pre-crisis were driven by large unit
labour costs increases in the services sectors (mainly business services, real
estate activities and wholesale and retail
activities). And since the crisis, some services sectors still show some resis-
tance to adjustment, this is particularly the case of business services and retail.
10 'Quarterly Report on the Euro Area', Volume 14, No 2, European Commission, 2015. 11 Though the strong wage adjustment in Greece has not been accompanied by improvements in labour productivity in services.
3,2%
0,2%
1,9%
2,3%
-1,1%
-2,0% -1,0% 0,0% 1,0% 2,0% 3,0% 4,0%
C - Manufacturing
G-I - Wholesale and retail trade, transport, accomodation and food serviceactivities
J - Information and communication
L - Real estate activities
M_N - Professional, scientific and technical activities; administrative and supportservice activities
Avg. annual change in %, 2008-2011
1,0%
0,5%
0,3%
0,4%
0,4%
0,0% 0,2% 0,4% 0,6% 0,8% 1,0% 1,2%
C - Manufacturing
G-I - Wholesale and retail trade, transport, accomodation and food serviceactivities
J - Information and communication
L - Real estate activities
M_N - Professional, scientific and technical activities; administrative andsupport service activities
Avg. annual change in %, 2012-2014

Page 6 |
Figure 4 – Sectoral ULC before and during the crisis, EU28 (average annual change in %)
Source: Commission services' calculations based on Eurostat
2.2. Inefficient allocation of
resources
Services sectors are in general - and also when comparing to manufacturing - not
showing an efficient flow of resources to
their most competitive firms. This is illus-trated by the allocative efficient index (AE)
12 which captures the extent to which
more productive firms have higher mar-ket shares
13. An analysis across Member
States comparing AE for manufacturing
sector with professional services shows that the manufacturing sector displays a
positive relation between labour
productivity and market share of companies (see Figure 5). The interpre-
tation is the following. For example, in the Belgium manufacturing sector, the
actual allocation of resources implies a 23% higher productivity (compared with
a theoretical benchmark where all
resources would be allocated uniformly across firms). For professional services,
the allocative efficiency is typically negative, implying that firms with
relatively low productivity have above-average market shares.
12 'Product Market Review 2013 – Financing the real economy'; European economy 8/2013, European Commission. 13 Approximating market shares with the employment of the firms in a size class.
-0,8%
1,4%
-1,9%
2,7%
2,2%
-3,0% -2,0% -1,0% 0,0% 1,0% 2,0% 3,0%
C- Manufacturing
G-I Wholesale and retail trade, transport, accomodation and food services activities
J- Information and communication
L- Real estate activities
M_N Professional, scientific and technical activities; administrative and supportservices activities
Sectoral ULC before the crisis, EU 28 (2001-2007, avg annual change in %)
0,7%
1,5%
0,1%
0,0%
2,0%
-0,5% 0,0% 0,5% 1,0% 1,5% 2,0% 2,5%
C- Manufacturing
G-I Wholesale and retail trade, transport, accomodation and food services activities
J- Information and communication
L- Real estate activities
M_N Professional, scientific and technical activities; administrative and supportservices activities
Sectoral ULC since the crisis, EU 28 (2008-2014, avg annual change in %)

Page 7 |
Figure 5 – Allocative efficiency, 2013 (%). Manufacturing and professional services
Source: ECFIN's calculation based on Eurostat. Data for MT are not available. Data are also missing for BG, EE,
LT and LV for professional services.
* Data for IE and PL relate to 2012.
Other service sectors (including retail,
construction and accommodation and food services) too have negative alloca-
tive efficiency index values, showing that there is an inverse relation between
productivity and market share of services companies. This sub-optimal resource
allocation constrains the productivity of
these sectors and hampers their competitiveness.
2.3. Low competitive pressure
There are several channels through which competition can drive productivity.
For example by ensuring that over time less productive firms are replaced by
productive new ones, or by creating incentives for firms to invest in the
reduction of costs and in innovative new products that boosts productivity. Two
indicators that can be used as proxies for
competition forces are market churn rates
14 and gross operating rates
15.
Churn rates and profit rates
disaggregated by service sectors vary significantly between Member States and
services sectors. Large differences in churn rates or profit rates between
Member States hint at varying degrees of competitive pressure. A more integrated
market would be expected to see a
convergence of these indicators between Member States.
The link between churn rates, profit rates
and allocative efficiency is also important to highlight. In a study on the effect of
regulatory barriers on four regulated
professions (legal, accounting, architec-tural and engineering) it has been shown
with econometric modelling that the entry and exit of firms have a significant
effect on the profit rates and allocative efficiency for the professional services sector
16.
14 Market churn rates are defined as the sum of birth and death rates expressed as percentage of the total number of active firms in an industry. 15 The gross operating rate is defined as the ratio of gross operating surplus to turnover and is a proxy for profits. 16 E. Canton, D. Ciriaci and I. Solera, 'The Economic Impact of Professional Services Liberalisation', European Economy. Economic Papers. 533, DG ECFIN, European Commission, September 2014.
-0,3
-0,2
-0,1
0
0,1
0,2
0,3
0,4
0,5
AT BE BG CY CZ DE DK EE EL ES FI FR HR HU IE* IT LT LU LV NL PL* PT RO SE SI SK UK
Manufacturing Professional services

Page 8 |
A reduction of the regulatory barriers in the sectors has been shown to increase
sector-specific churn rates, which in turn
increase allocative efficiency and decrease profitability – substantiating the theoreti-
cal assumption that more dynamic mar-kets put stronger competitive pressure on
profit rates while contributing to a more efficient use of production factors.
2.4. Cross-border services
integration
Trade integration can be used as a
measurement of the extent to which business are able to access potential
customers in other Member States. At 6%, the trade integration
17 of services across
the EU lags considerably behind that of
goods (22%).
Cross-border investments18
in services
stands at 11% and is also
disproportionately low compared to goods (17%).
While some of the differences are due to
the lower tradability of services, the figures indicate that service providers are
unable to make full use of the potential
offered by the Single market.
3. POLICY LEVERS TO ADDRESS THE POLICY CHALLENGES
The challenges described above are to a significant extent a result of the regulatory
and administrative policies of the EU Member States.
Resolving these challenges will unlock a
significant number of positive effects. A
number of policy levers can be pursued to advance the modernisation of services
regulations across the EU.
17 Defined by the average of intra-EU imports and export divided by GDP (2012, EU-27). (Source: Eurostat). 18 Share of value added generated by
enterprises controlled by another EU Member State – secondary establishment. Nace Rev. 2
service sectors included are D-J, L-N and S95 (source: Eurostat). No data is available on cross-border provision without prior establishment.
3.1. Potential policy levers
3.1.1. Country-specific
recommendations
Economic evidence shows that there is a significant scope for services reforms
beyond the minimum legal requirements
of the Services Directive. To reap the full potential benefits offered by the Services
Directive, numerous Country-specific Recommendations (CSRs) have been
adopted by Council to ensure more dynamic and competitive services
markets. In 2016, Council approved recommendations in the area of services
addressed to ten different Member States. CSRs serve the aim of achieving an EU
services market with fewer barriers for
providing and receiving services, in particular in areas where the acquis does
not categorically outlaw certain practices and leaves it up to Member States to
assess the justification and proportionality of national regulation.
3.1.2. New targeted EU-level policy initiatives
As described in section 1, the Commission
is committed to putting forward new initiatives aimed at improving the
functioning of the EU services market in
priority areas. Initiatives promoting the balanced development of the collaborative
economy, ensuring that consumers have access to goods and services without
being unjustifiably discriminated, reducing the barriers in cross-border provision with
the help of the European services e-card, making the notification procedure under
the Services Directive more efficient,
introduce proportionality tests for regulatory measures and provide reform
guidance for regulation of professional services and for particular sectors (retail)
all serve to make it easier for services providers and recipients to make use of
the internal market for services.
3.1.3. Enforcement and
implementation
Enforcement of the existing requirements under the Services Directive remains an
important instrument in achieving that the
full potential of the services market liberalisation is realised.

Page 9 |
In its 2012 Communication19
, the
Commission announced a zero tolerance policy with respect to Member States not
complying with the Services Directive. In 2013, the Commission initiated struc-
tured dialogues with Member States in 16 cases related to the Services Directive
and in 2014 there were 17 new cases.
In June 2015 the Commission launched
six infringement procedures in order to address excessive and unjustified obsta-
cles relating to the use of legal form and shareholding requirements for regulated
professions. In November 2016 decisions
on a package of 10 cases concerning key sectors in the scope of the Services
Directive were adopted.
The Commission also initiated structured dialogues with ten Member States over
the performance of their Points of Single
Contact and the electronic procedures they must offer under the Services
Directive to allow services providers to complete administrative procedures
online.
3.2. Beneficial effects of addressing identified challenges
Following the adoption of the Services Directive in 2006, Member States
undertook substantial reform efforts adopting more than thousand laws in
order to abolish existing barriers. In 2012 a Commission assessment found
that the reforms undertaken up to that point would yield a 0.8% GDP increase over the coming year
20.
The assessment also found that if Member States would pursue a more
ambitious implementation (where Member States would reach the average
of the 5 least restrictive Member States) the additional growth potential was
estimated at 1.8% of EU GDP.
Considering this significant untapped
growth potential, the Commission, the European Parliament and the Council in
2012 all called for a more ambitious implementation of the Services Directive.
Figure 6 – Estimated EU level GDP impact from services reforms
Source: European Commission SWD(2015) 202, 'A Single Market Strategy for Europe – Analysis and Evidence'
19 European Commission COM (2012) 261, 'A Partnership for new growth in services 2012-2015'. 20 J. Monteagudo, A. Rutkowski and D. Lorenzani 'The economic impact of the Services Directive: A first assessment following implementation', European Commission economic paper 456, 2012.
0,8%
0,1%
1,7%
GDP growth from reforms until 2012
GDP growth from reforms 2012-2014
Remaining potential

Page 10 |
In an updated assessment in 2015, estimating the impact of reform efforts
during 2012-2014, it was found that only
a fraction (0.1%) of the 1.8% GDP potential has been realised (illustrated in
Figure 6). These results are not surprising as reform effort during this period has
been uneven, with reforms mainly having taken place in Member States subject to
financial assistance programmes or implementing comprehensive national reform programmes
21.
According to the World Bank study
published in the fall of 2016, limiting
service sector restrictions to the level of the three least regulated Member States
(the UK, Denmark and Sweden) would increase productivity of firms that operate
in services and manufacturing by up to 5.3% within two years of implementation
22.
The successful removal of identified
barriers would give rise to a number of
positive effects:
A more competitive services sector. Increased competitive pressures following
a reduction in market barriers leads to more firms entering and exiting the
market, thereby driving up overall
productivity. This is supported by 2014 Commission study
23 which assessed the
economic impact of national reforms
lowering regulatory burden for selected regulated professions. The study shows
that reducing regulatory barriers in such professions by 1 point
24 increases churn
21 European Commission SWD(2015) 202, 'A
Single Market Strategy for Europe – Analysis and Evidence'. 22 'Growth, jobs and integration: Services to
the rescue', World Bank EU Regular Economic Report, Fall 2016. (http://pubdocs.worldbank.org/en/930531475587494592/EU-RER-3-Services-to-the-
Rescue.pdf). 23 'The economic impact of the professional services liberalisation', Economic Paper
533/2014, European Commission. 24 Professional Services regulation measured by the OECD PMR indicator, an index developed
by the OECD which quantifies the level of restrictiveness per Member State and sector (from 0 to 6 with a low value corresponding to a light regulatory burden) (source:
rates25
on average by 1.75%, leading to a
better allocation of resources, as a result of which allocative efficiency is increased
by 5.7%. A related Commission assessment from 2015 of the barrier for
key business services found that a reduction of the current barrier level would
increase the number of companies providing such services by up to 18%
26.
This means that reducing regulatory
restrictiveness opens up markets to
competition, which leads to a more dynamic and productive services sector
27.
Positive spill-over effects, including to the manufacturing sector. Services are
increasingly interconnected with other sectors of the economy both as user of
input from other sectors (backward linkages) and as input for the production
process in other sectors (forward
linkages). Many services companies are fully integrated in the European value
chain as they use inputs produced by other parts of the economy and provide
inputs to other sectors. A productivity increase in one service sector will
therefore have considerable multiplication effects across the economy
28. As the
manufacturing industry is an important
consumer of business services, increased competition and productivity gains in
business services would entail important
benefits for the manufacturing industry. This is supported by research by IMF
which quantifies the impact of these multiplication effects
29. The study shows in
https://www.oecd.org/eco/growth/indicatorsofproductmarketregulationhomepage.htm). 25 See note 14 for the definition of market
churn rates. 26 European Commission SWD(2015) 202, 'A Single Market Strategy for Europe – Analysis
and Evidence'. 27 See also 'Market Reforms at work in Italy, Spain, Portugal and Greece'; European Economy 5/2014, European Commission. 28 For a more detailed analysis of the role of services sectors in international value chains see 'International value chains intra- and
extra-EU', background study for the 2014
annual single market integration report, European Commission, 2013. 29 See E. Fernández Corugedo and E. Pérez Ruiz, 'The EU Services Directive: Gains from Further Liberalization', IMF Working Paper, 2014. The results in this study are based on

Page 11 |
particular that increasing the total factor productivity in the other business activities
sector (mainly including business services)
would lead to significant economy-wide spill-overs. Also in retail and wholesale,
acting as distribution channels for manufacturing, efficiency can boost
demand with a positive effect on manufacturing value chains.
Benefits for consumers. National reforms
reducing barriers and integrating the
single market for services entail considerable economic benefits for
consumers. Firstly, stronger competition leads on average to lower prices. The
above mentioned European Commission study shows that reducing regulatory
barriers in selected highly regulated professions moderates the observed
larger-than-average profits caused by lack
of competition. The observed effect of competition-friendly reforms undertaken in
Member States supports this notion, e.g. reforms in the Spanish business services
sector have seen decreased margins from 28% to 18% over the past 15 years,
leading to increased purchasing power for consumers
30. Overall consumption levels
will also increase, given that firms will set
prices closer to competitive levels. Secondly, a more competitive and
integrated services market will offer
consumers on average more choice and better quality of services. E.g. an analysis
of the effect of deregulating tourist guides and notaries in Poland found no negative
impact on the quality of services provided (while it did find evidence of new and cheaper services
31). Furthermore, evidence
shows that consumers evaluate more integrated markets as better performing
the impact of further liberalisation on the French economy. 30 'The effects of reforms of regulatory
requirements to access professions: country-based case studies', DG GROW, European Commission, 2015
(http://ec.europa.eu/growth/tools-
databases/newsroom/cf/itemdetail.cfm?item_id=8525&lang=en). 31 M. Rojek and M. Rosior 'The effects of reforms liberalising professional requirements in Poland', report funded by European Commission, Warsaw, 2016.
markets32
. In addition, the Product Market
Regulation Indicator (OECD) shows negative correlations with the extent that
markets meet consumers' expectations, which suggests that in countries in which
there are less barriers to competition and entrepreneurship, consumers' satisfaction is somewhat higher
33.
4. CROSS-EXAMINATION OF POLICIES: STATE OF PLAY
4.1. Persistent barriers in the
services markets
Even though Member States have
complied with the obligations relating to the transposition of the Services Directive,
providers in several service sectors still face a wide array of barriers when they
want to establish in another Member State or provide services on a temporary cross-
border basis.
Taking the example of business services,
the largest services sector falling under the Services Directive, accounting for
almost 12% of both EU GDP and employment, the administrative and
regulatory burden varies significantly
between Member States. Figure 7 shows the overall restrictions in four key
professions forming part of business services – accountants, architects,
engineers and lawyers, based on a study of barriers in business services performed
in 201534
.
32 The Consumer Markets Scoreboard results show consistently a strong negative correlation between the variance in Market Performance Index (MPI) registered between countries and
the actual MPI scores on aggregate level. 33 Consumer Markets Scoreboard, 12th scoreboard edition 2016, European Union
(http://ec.europa.eu/consumers/consumer_evi
dence/consumer_scoreboards/index_en.htm). 34
'Business services – Assessment of barriers
and their economic impact', European Commission, 2015 (http://ec.europa.eu/DocsRoom/documents/13328/attachments/1/translations).

Page 12 |
Figure 7 – Overall restrictiveness scores per Member State (business services)
Source: 'Business services – Assessment of barriers and their economic impact', European Commission, 2015
This assessment took into account several requirements which service providers need
to respect when going cross-border:
Authorisations required from
businesses to offer their services may serve public interest objectives, but
must be proportionate to achieving them so as not to restrict competition
unduly. Important reforms aiming to
abolish authorisations or replacing
them by lighter notification or declaration obligations have taken
place in many Member States. Yet
there is a scope for further reforms in many other Member States and
sectors. The Services Directive stipulates that Member States may not
duplicate requirements which are equivalent to those to which the
provider was already subject in another Member State. This principle
0 1 2 3 4 5 6
SE
UK
FI
NL
DK
IE
EE
LT
LV
BG
SK
ES
FR
SI
PL
RO
HU
CZ
BE
HR
EL
PT
CY
IT
DE
MT
AT
LU
Accountants
Architects
Engineers
Lawyers

Page 13 |
however is insufficiently applied in practice, as service providers often
face the same requirements as
domestic companies, irrespective of the fact that they may already have
complied with equivalent or similar requirements in their home country.
Legal form and shareholding requirements are important obstacles
to the freedom of establishment in the business services sector. A peer review
on legal form and shareholding showed that these requirements have an
impact on both primary and secondary
establishment. They limit investment possibilities, reduce choices for
business models and may render the creation of multi-disciplinary
professional practices and secondary establishment difficult or even
impossible. There is a significant diversity in legal form and
shareholding requirements across
Member States, showing the scope for
further proportionality assessments35
.
Companies offering professional
services or construction services experience great difficulties in
obtaining legally required professional indemnity insurance cover when
seeking to offer their services in another Member State. In most
Member States, cross-border insurance cover is not easily available for service
providers from other Member States
which severely restricts the ability of service providers to either provide
services cross-border on a temporary basis or to establish a branch or a
subsidiary in another Member State. There is still a lack of clarity in national
legislation as to the rules that are applicable to businesses providing
services cross-border on a temporary
basis. This is notably the case where sectoral laws have not been amended
to make a clear distinction between requirements applicable to companies
seeking to establish and those seeking to provide services cross-border
temporarily. As a result of the ensuing uncertainty, authorities often apply
35 For further discussion, see the European Semester thematic factsheet on regulated professions.
authorisation requirements intended for service providers established in a
Member State also to businesses
providing services cross-border. The resulting disproportionate regulatory
requirements can make it de facto very difficult to provide services cross-
border. This is particularly the case given that not all Points of Single
Contact (PSCs) established by Member States provide information on all
applicable rules and allow for the relevant procedures to be completed
online.
4.2. Specific barriers in the retail
sector
Retail services are key for the EU
economy, representing 4.5% of total EU value added and employing 8.6% of the
workforce. The sector is particularly important for youth employment with a
significant representation of employees in the 15-24 age range. Over 3.5 million
companies in the retail sector act as intermediaries between thousands of
product suppliers and millions of
consumers.
Performance, market conditions and specific barriers differ between physical
and on-line retail as well as between different retail sub-sectors.
Brick-and-mortar retail is characterised by cross-border expansion of companies
opening physical stores in other Member States. Retailers wanting to establish in
other Member States often face regulatory restrictions. Member States impose
requirements relating to the size of retail
outlets or to their location which may result in market entry barriers for certain
store formats or business models and may affect secondary establishment. Such
restrictions can have a negative impact on market structure and dynamics36.
In addition to establishment restrictions, retailers face operational restrictions
influencing their day-to-day business activities. As regards such restrictions,
36 European Commission SWD(2015) 202, 'A Single Market Strategy for Europe – Analysis and Evidence'.

Page 14 |
there is a worrying trend in some Member States to introduce measures affecting in
particular foreign retailers.
Reforms leading to a reduction of both
types of restrictions have been found to increase firm entry and investment in the
retail sector37. In addition, reducing conduct barriers and barriers to entry in
services leads to increased firm-level productivity38.
Brick and mortar shops dominate mostly in grocery retailing. Given the specificities
of this sub-sector, physical presence is likely to play a relatively important role
also in the future. Integration will therefore continue to happen to a large
extent through establishment across
borders. The respect of the free movement of goods and the freedom of
establishment is crucial to enable businesses to fully reap the benefits of the
Single Market in this area.
Growing at a rate of 22% a year, e-
commerce provides opportunities and challenges to traditional retail. It has
increased the potential market for retailers and the scope of products
available to consumers.
37 'The Economic Impact of Selected Structural Reform Measures in Italy, France, Spain and Portugal', Institutional paper 023, European
Commission, 2016. 38 'Growth, jobs and integration: Services to the rescue', World Bank EU Regular Economic
Report, Fall 2016 (http://pubdocs.worldbank.org/en/930531475587494592/EU-RER-3-Services-to-the-Rescue.pdf).
In 2015 19.1% of companies in the retail sector sold online, against 17% for the EU
economy as a whole. This share has been
steadily increasing since 2010, when it stood at 11.7%. The value of online sales
has more than doubled between 2010 and 2015, reaching EUR 209 billion in 2015.
However e-commerce is still only a fraction of the retail market. The value of
store-based sales in 2015 was over EUR 2,500 billion, 12 times the value of online
sales.
E-commerce is changing the market
conditions in particular for non-grocery retail. Here integration often happens
through cross-border retail sales. What is needed to support this trend are
regulatory frameworks friendly to the development of e-commerce which at the
same time fairly address both physical
and on-line retail.
Date: 22.11.2016

Page 15 |
5. USEFUL RESOURCES
Europa webpage on services: http://ec.europa.eu/growth/single-
market/services/services-directive/
Europa webpage on implementation of the Services Directive:
https://ec.europa.eu/growth/single-market/services/services-
directive/implementation_en
Summary of economic analysis regarding the functioning of the EU Single Market for
services: http://ec.europa.eu/growth/single-market/services/economic-analysis_en
Single Market Strategy: https://ec.europa.eu/growth/single-market/strategy_en
OECD Product Market Regulation indicator: http://www.oecd.org/eco/growth/indicatorsofproductmarketregulationhomepage.htm
'Growth, jobs and integration: Services to the rescue', World Bank EU Regular Economic Report, Fall 2016:
http://pubdocs.worldbank.org/en/930531475587494592/EU-RER-3-Services-to-the-Rescue.pdf