european insurers: pressures on capital efficiency and expansion into emerging markets
TRANSCRIPT

2015 Insurance Market Briefing -Europe
etc.venues St.Paul’s, London
04 November 2015

Disclaimer
2015 Insurance Market Briefing - Europe 4 November 2015 5
© AM Best Company (AMB) and/or its licensors and affiliates. All rights reserved. ALL INFORMATION CONTAINED HEREIN IS PROTECTED BY
COPYRIGHT LAW AND NONE OF SUCH INFORMATION MAY BE COPIED OR OTHERWISE REPRODUCED, REPACKAGED, FURTHER
TRANSMITTED, TRANSFERRED, DISSEMINATED, REDISTRIBUTED OR RESOLD, OR STORED FOR SUBSEQUENT USE FOR ANY SUCH
PURPOSE, IN WHOLE OR IN PART, IN ANY FORM OR MANNER OR BY ANY MEANS WHATSOEVER, BY ANY PERSON WITHOUT AMB’s PRIOR
WRITTEN CONSENT. All information contained herein is obtained by AMB from sources believed by it to be accurate and reliable. Because of the
possibility of human or mechanical error as well as other factors, however, all information contained herein is provided “AS IS” without warranty of any
kind. Under no circumstances shall AMB have any liability to any person or entity for (a) any loss or damage in whole or in part caused by, resulting from,
or relating to, any error (negligent or otherwise) or other circumstance or contingency within or outside the control of AMB or any of its directors, officers,
employees or agents in connection with the procurement, collection, compilation, analysis, interpretation, communication, publication or delivery of any
such information, or (b) any direct, indirect, special, consequential, compensatory or incidental damages whatsoever (including without limitation, lost
profits), even if AMB is advised in advance of the possibility of such damages, resulting from the use of or inability to use, any such information. The credit
ratings, financial reporting analysis, projections, and other observations, if any, constituting part of the information contained herein are, and must be
construed solely as, statements of opinion and not statements of fact or recommendations to purchase, sell or hold any securities, insurance policies,
contracts or any other financial obligations, nor does it address the suitability of any particular financial obligation for a specific purpose or purchaser.
Credit risk is the risk that an entity may not meet its contractual, financial obligations as they come due. Credit ratings do not address any other risk,
including but not limited to, liquidity risk, market value risk or price volatility of rated securities. NO WARRANTY, EXPRESS OR IMPLIED, AS TO THE
ACCURACY, TIMELINESS, COMPLETENESS, MERCHANTABILITY OR FITNESS FOR ANY PARTICULAR PURPOSE OF ANY SUCH RATING OR
OTHER OPINION OR INFORMATION IS GIVEN OR MADE BY AMB IN ANY FORM OR MANNER WHATSOEVER. Each credit rating or other opinion
must be weighed solely as one factor in any investment or purchasing decision made by or on behalf of any user of the information contained herein, and
each such user must accordingly make its own study and evaluation of each security or other financial obligation and of each issuer and guarantor of, and
each provider of credit support for, each security or other financial obligation that it may consider purchasing, holding or selling.

Disclaimer
2015 Insurance Market Briefing - Europe 4 November 2015 6
US Securities Laws explicitly prohibit the issuance or maintenance of a credit rating where a person involved in the
sales or marketing of a product or service of the CRA also participates in determining or monitoring the credit rating, or
developing or approving procedures or methodologies used for determining the credit rating.
No part of this presentation amounts to sales / marketing activity and A.M. Best’s Rating Division employees
are prohibited from participating in commercial discussions.
Any queries of a commercial nature should be directed to A.M. Best’s Market Development function.

2015 Insurance Market Briefing -Europe
2015 Insurance Market Briefing - Europe 4 November 2015 58
Carlos Wong-FupuySenior Director, Analytics, A.M. Best
European Insurers:Pressures on Capital Efficiency and Expansion into Emerging
Markets
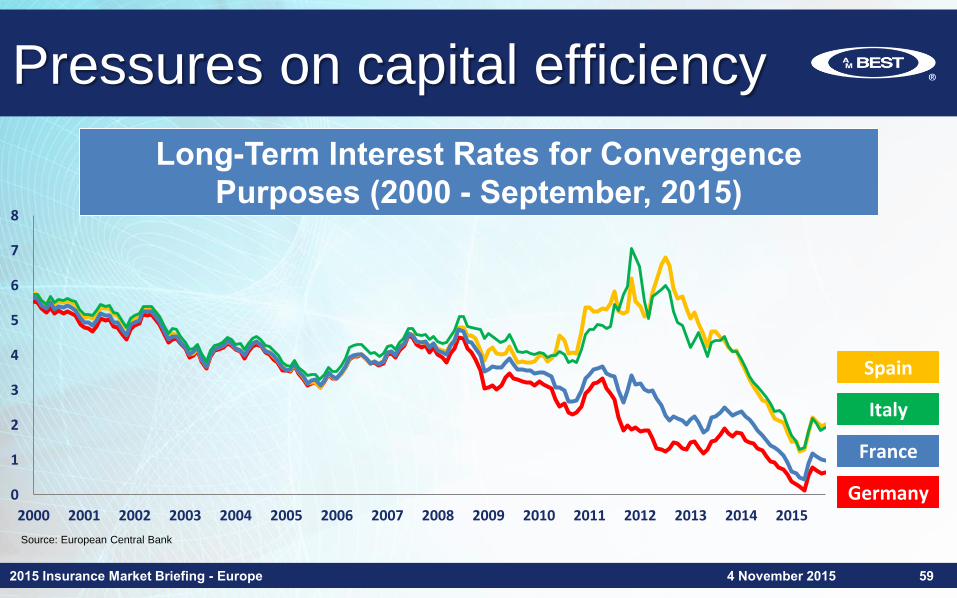
0
1
2
3
4
5
6
7
8
2000 2001 2002 2003 2004 2005 2006 2007 2008 2009 2010 2011 2012 2013 2014 2015
Source: European Central Bank
Italy
Spain
France
Germany
Pressures on capital efficiency
2015 Insurance Market Briefing - Europe 4 November 2015 59
Long-Term Interest Rates for Convergence Purposes (2000 - September, 2015)

Pressures on capital efficiency
2015 Insurance Market Briefing - Europe 4 November 2015 60
-8
-6
-4
-2
0
2
4
62008 2009 2010 2011 2012 2013 2014
%
Source: International Monetary Fund, World Economic Outlook Database, April 2015
Western Europe - Percentage Change in GDP for Selected Countries (2008-2014)
Italy
Spain
France
Germany
UK

Pressures on capital efficiency
2015 Insurance Market Briefing - Europe 4 November 2015 61
• Mature markets: penetration
• Regulation
• Complexity / capital intensity
• Competition
• Long-term opportunities:
– Shrinking role of the State
– Ageing populations
– Investment / infrastructure projects

2015 Insurance Market Briefing - Europe
Pressures on capital efficiency
4 November 2015 62
Country
Gross Domestic
Product
(USD billions)
Real GDP
per Capita
(USD)
Change in
Real GDP
(%)
Insurance Market
Penetration
(%)
France 2,847 44,538 0.36% 9.5%
Germany 3,860 47,590 1.61% 6.6%
Italy 2,148 35,823 -0.42% 9.1%
Spain 1,407 30,278 1.39% 5.1%
United Kingdom 2,945 45,653 2.55% 11.9%
Sources: International Monetary Fund, World Economic Outlook Database, April 2015; Swiss Re, sigma; A.M. Best data and research
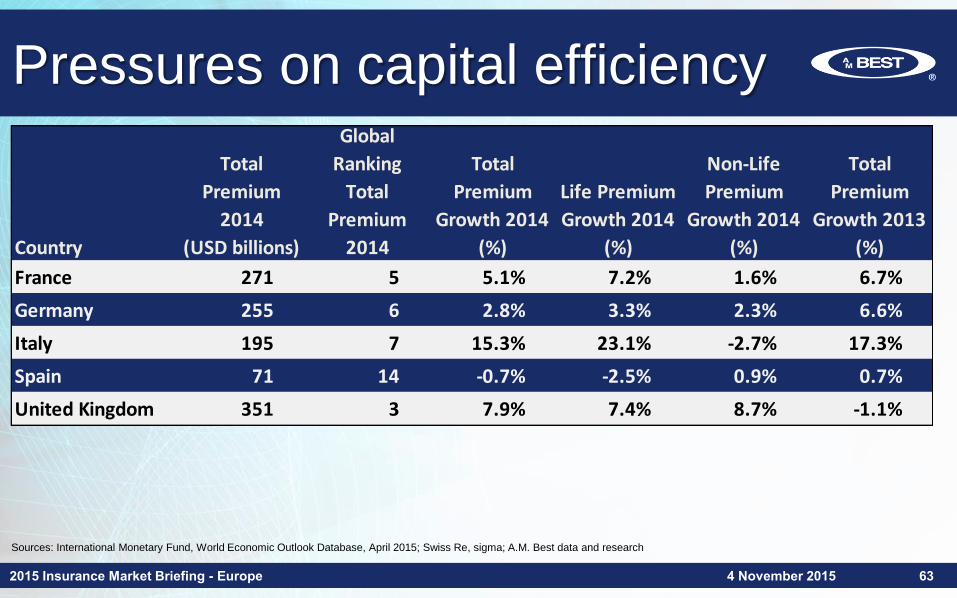
Pressures on capital efficiency
2015 Insurance Market Briefing - Europe 4 November 2015 63
Country
Total
Premium
2014
(USD billions)
Global
Ranking
Total
Premium
2014
Total
Premium
Growth 2014
(%)
Life Premium
Growth 2014
(%)
Non-Life
Premium
Growth 2014
(%)
Total
Premium
Growth 2013
(%)
France 271 5 5.1% 7.2% 1.6% 6.7%
Germany 255 6 2.8% 3.3% 2.3% 6.6%
Italy 195 7 15.3% 23.1% -2.7% 17.3%
Spain 71 14 -0.7% -2.5% 0.9% 0.7%
United Kingdom 351 3 7.9% 7.4% 8.7% -1.1%
Sources: International Monetary Fund, World Economic Outlook Database, April 2015; Swiss Re, sigma; A.M. Best data and research

Strategic actions
2015 Insurance Market Briefing - Europe 4 November 2015 64
• Returning capital to shareholders, e.g. re-insurers
• Partnering with alternative capital providers
• Mergers and acquisitions
• Groups’ legal re-structuring
• Re-insurance centralisation
• Cost management
• Gradually riskier investment portfolios: real assets
and/or
• International expansion

2015 Insurance Market Briefing - Europe
BRICS challenges
4 November 2015 65
• Decoupled from
advanced
economies?
• Sliding currencies
• Sudden capital
flight?
• Globalised capital
markets
Brazil
Russia
India
China
South Africa
-10
-5
0
5
10
15
2008 2009 2010 2011 2012 2013 2014
%
Percentage Change in GDP (2008-2014)
Source: International Monetary Fund, World Economic Outlook Database, April 2015

BRICS challenges
2015 Insurance Market Briefing - Europe 4 November 2015 66
• Fiscal imbalances
• Heavy commodity reliance
Credit ratings downgrades
• High unemployment
• Economic recession
• Unstable government
• Low oil prices
• High inflation / devaluation
• International sanctions
• Foreign investment flight
• Geopolitical tensions
• Stock market turmoil
• Yuan devaluation
• Decrease in exports
• Shift from infrastructure
investments to domestic
consumption
• Less dependence on
China
• Oil importer
• Fragile banking system /
bad debts
• Rigid labour laws
• State level legislation• Smallest of all BRICS
• Lagged behind during
commodity boom
• High unemployment
• Poor energy infrastructure
• Underinvestment in state
owned utilities

Selective growth
2015 Insurance Market Briefing - Europe 4 November 2015 67
• Key territories:Asia Pacific, Lat Am,Eastern Europe, Turkey
• Exit or downsizing in particular areas:
– Russia:Allianz, Zurich - GI retail
– India:RSA - GI, ING – Life
• Development costs or corrective actions in place:
– Turkey:Ergo, AXA – Motor
– Brazil:Allianz, Zurich
• Regulatory changes (ownership) / political sanctions

Volatile emerging markets
2015 Insurance Market Briefing - Europe 4 November 2015 68
Sources: International Monetary Fund, World Economic Outlook Database, April 2015; Swiss Re, sigma; A.M. Best data and research
Country
Gross Domestic
Product
(USD billions)
Real GDP
per Capita
(USD)
Change in
Real GDP
(%)
Insurance Market
Penetration
(%)
Brazil 2,353 11,604 0.15% 3.6%
Chile 258 14,477 1.84% 4.2%
China 10,380 7,589 7.36% 3.2%
Colombia 385 8,076 4.55% 2.5%
India 2,050 1,627 7.17% 3.4%
Mexico 1,283 10,715 2.13% 2.1%
Poland 547 14,379 3.30% 3.2%
Russia 1,857 12,926 0.62% 1.4%
Turkey 806 10,482 2.90% 1.4%

Volatile emerging markets
2015 Insurance Market Briefing - Europe 4 November 2015 69Sources: International Monetary Fund, World Economic Outlook Database, April 2015; Swiss Re, sigma; A.M. Best data and research
Country
Total
Premium
2014
(USD billions)
Global
Ranking
Total
Premium
2014
Total
Premium
Growth 2014
(%)
Life Premium
Growth 2014
(%)
Non-Life
Premium
Growth 2014
(%)
Total
Premium
Growth 2013
(%)
Brazil 85 13 3.3% 2.8% 3.8% 0.5%
Chile 11 40 -6.8% -8.4% -4.5% 4.2%
China 328 4 17.3% 15.4% 19.5% 14.1%
Colombia 10 41 -5.6% -21.2% 3.2% 13.4%
India 70 15 7.2% 6.4% 10.4% -1.0%
Mexico 27 25 -0.4% 1.0% -1.7% 13.9%
Poland 17 33 -4.7% -11.0% 0.7% -6.0%
Russia 26 27 -9.4% 6.1% -11.0% 9.2%
Turkey 12 39 -6.9% -16.2% -5.4% 14.6%

Significant growth in emerging markets (examples)
2015 Insurance Market Briefing - Europe 704 November 2015
0%
50%
100%
150%
200%
250%
300%
350%
Mapfre Talanx Pru
0%
20%
40%
60%
80%
2004 2009 2014
Mapfre (Intl) Talanx (Int) Pru (Asia)
Growth in key areas(percentage of total premiums)
Total assets 2014 / 2004(percentage)

Expansion becoming moreselective
2015 Insurance Market Briefing - Europe 4 November 2015 71
1: Out of EUR 30bn, international business was EUR 4bn from six countries (namely European countries and Japan). Source: Company accounts, A.M.Best data and research
Rank Company
Country of
Domicile
Gross Premium
Written (2014)
(EUR millions)
Asia
Pacific
Central
Eastern
Europe
Latin
America Turkey
1 AXA S.A. France 86,267
2 Allianz SE Germany 73,883
3 Assicurazioni Generali S.p.A. Italy 66,236
4 Zurich Insurance Group Ltd. Switzerland 45,068
5 Prudential plc UK 41,959
6 CNP Assurances France 30,643
7 Credit Agricole Assurances1 France 29,377
8 Talanx AG Germany 27,903
9 Aviva plc UK 27,694
10 MAPFRE S.A. Spain 22,401

Potentially higher margins but not without some challenges
2015 Insurance Market Briefing - Europe 4 November 2015 72
HGM: High Growth Markets. Based on 2014 year figures Source: Company accounts, A.M.Best data and research
Company
P/C
Share
HGM (%)
Combined
Ratio
HGM (%)
Combined
Ratio
Total (%)
Life
Share
HGM (%)
Life
Margin
HGM (%)
Life
Margin
Total (%)
AXA S.A. 16.0% 98.7% 97.6% 17.5% 49.0% 34.0%
Allianz SE 9.0% 111.3% 94.3% 15.1% 3.6% 2.4%
Generali S.p.A. 14.8% 96.9% 93.8% 5.9% 21.9% 24.0%
Zurich Insurance Group Ltd. 12.3% 104.6% 97.3% 33.2% 26.5% 22.1%
Prudential plc n/a n/a n/a 48.1% 52.0% 46.0%
CNP Assurances n/a n/a n/a 14.7% 32.1% 11.9%
Credit Agricole Assurances n/a n/a n/a n/a n/a n/a
Talanx AG 34.4% 96.4% 101.7% 18.6% 6.9% 1.9%
Aviva plc 10.2% 7.6% 4.1%
MAPFRE S.A. 48.8% 95.3% 95.7% 47.7% 17.7% 12.0%

Emerging Markets Challenges
2015 Insurance Market Briefing - Europe 4 November 2015 73
• Lack of scale/fragmented regions
• Dominance of compulsory lines
• Dependence on regulation
• Ownership and investment restrictions
• Loss leader behaviour/focus on market share
• Underperformance/management and integration issues
• Difficult target company valuations/private ownership

Conclusions
2015 Insurance Market Briefing - Europe 4 November 2015 74
• Focus on efficient re-deploying of capital
• Expansion is becoming more selective
• Increased efforts in turning around existing businesses
• Groups have moved to a more centralised approach to manage their risks.

Q & A
2015 Insurance Market Briefing - Europe 4 November 2015 75
Carlos Wong-FupuySenior Director, Analytics, A.M. Best
European Insurers:Pressures on Capital Efficiency and Expansion into Emerging
Markets