european energy market reform country profile: netherlands...plus the consumption of fossil fuels...
TRANSCRIPT

European energy market reformCountry profile: Netherlands

To start a new section, hold down the apple+shift keys and click
to release this object and type the section title in the box below.
Contents
Current situation 1
Energy consumption and trade balance 1
Power generation 2
Power market: main actors 3
Power prices 4
Targets for 2020 5
Energy efficiency targets 5
Renewable energy targets 7
CO2 emissions and targets 8
Road ahead and main challenges: the way to 2030 and beyond 10
Long-term energy priorities but few tangible targets 10
Gas production under pressure 10
Renewables and nuclear power 11
Climate change 11
Conclusion 11
Selected bibliographic references 12

To start a new section, hold down the apple+shift keys and click
to release this object and type the section title in the box below.
Current situation
Energy consumption and trade balanceIn 2012, the Netherlands’ energy consumption1 totalled 82 Mtoe,marking a continuous increase since 1990. In fact, consumption rose 13% from 1990 to 2000, and almost 8% between 2000 and 2012. More than 90% of this energy came from fossil fuels, mainly petroleum products and gas.
Fossil fuels make up more than 90% of gross inland energy consumption.The Netherlands is one of the most carbon-intensive countries in the EU. Petroleum products and natural gas accounted for more than 80% of the gross inland consumption in 2012.
The Netherlands is the fifth largest natural gas exporter in the world, but is a net importer of other fossil fuels.The country depends on coal and oil imports, but is an historical exporter of natural gas. By 2025, the country is expected to shift from a net exporter of gas to a net importer.
1 For Eurostat, the gross inland energy consumption is equal to the primary energy consumption plus the consumption of fossil fuels for non-energy purposes
2 Eurostat (nrg_100a)
The transportation, energy and industrial sectors each accounted for 18% of the country’s gross inland consumption or 53% all together. While the energy sector’s volume has remained stable since 1990, transportation sector consumption increased by 50% between 1990 and 2012, while the industrial sector has seen a 7% decrease since 2012. The additional growth of 6 Mtoe between 2000 and 2012 is attributable to non-energy consumption, which includes increasing use of natural gas as a raw material in the expanding petrochemical industry.
The country is historically an exporter of natural gas, but has a growing dependence on oil imports. Oil net imports (crude and refined) reached 46 Mtoe in 2012 and have been steadily increasing during the last 20 years, mainly driven by the petrochemical industry. Natural gas net exports amounted to 25 Mtoe in 2012, 76% of the Netherlands’ gas production. As far as power is concerned, in 2013 the Netherlands exported 13 TWh globally and imported 33 TWh (almost exclusively from Germany).
Key figures: Population (2013): 16.8 million
GDP (2013): 603 bn €
GDP/capita (2013): 35,900 €
GDP/PEC (2012): 8.8 €/kgoe
PEC/capita (2012): 4.03 toe/cap
Figure 1. Gross inland consumption in 2012 (82 Mtoe)2
10%
42%
5%
1%
41%
1%
Solid fuels Petroleum products
Natural gas Nuclear
Renewable energies Waste (non-renewable)
Figure 2. Gross inland consumption by sector (in Mtoe)2
Energy Sector Transports Residential
Industry Services Non-energyconsumptionAgriculture Others
0
20
40
60
80
100
201220001990
15
10
10
10
12
6
67 Mtoe
15
15
10
15
14
9
82 Mtoe
15
14
10
10
7
15
7
76 Mtoe
Figure 3. Energy trade balance (Mtoe)1
1990 2000 2012
-50
-40
-30
-20
-10
0
10
20
30
Electrical energyGasTotal petroleum productsSolid fuels
-9 -8 -7
-31-41
-46
24
-1 -2 -1
1725
1European energy market reform Country profile: Netherlands

To start a new section, hold down the apple+shift keys and click
to release this object and type the section title in the box below.
Power generation The Netherlands has one of the most carbon-intensive electricity generation mixes in Europe, with more than 80% stemming from gas and coal.
3 IEA (2014) – Energy Policies of IEA Countries – The Netherlands
4 CBS (Central Bureau voor de Statistik)
83% of electricity production comes from fossil fuels, 64% being delivered from natural gas.The Netherlands relies on domestic gas resources for electricity generation. Renewable energies account- up for only 10% of electricity capacity, more than 80% coming from wind.
Figure 4. Electricity capacity – 28 GW (2012)3
0.0
0.30.1
2.3
4.2
19.8
0.6
0.3
0.5
Nuclear energy Coal Fuel oil
Gas Other non-RES Hydro
Wind PV Other RES
RES: 2.8
Figure 5. Electricity production – 112 TWh (2012)3
7
5
21
72
3
4
Nuclear energy Coal Fuel oil
Gas Other non-RES Hydro
Wind PV Other RES
RES: 12
In 2012, gas accounted for 70% of the country’s generation capacity mix (19.8 GW) and delivered 64% of its power (72 TWh). Coal was the second source of generation; it represented 15% of installed capacity and produced 21 TWh (19%) of electricity. Renewable energy sources made up only 10% of electricity generation, or 12 TWh, mainly derived from wind (82%).
Solar and other renewable energy sources represented a minor part of installed capacity, with 0.1 GW and 0.3 GW respectively.
The Netherlands experienced strong growth in generation capacity during the last few years (44% since 2000 and 12% since 2010). The 9 GW of additional capacity realized since 2000 came mainly from gas combined cycle units. 2 GW of new wind capacity have been added since 2000, representing almost 85% of total added renewable energy source (RES) capacity.
Figure 6. Electricity capacity change from 2000 to 2012 (in GW)4
-3
-2
-1
0
1
2
3
4
5
6
7
8
OtherPVWindHydroNuclearGasturbines
Combinedcycle units
Steamturbines
Internalcombustion
2.0
-2.2
6.6
0.3 0.1 0.0 0.02.0 0.4
2

To start a new section, hold down the apple+shift keys and click
to release this object and type the section title in the box below.
Power market: main actors
5 Calculation based on company data publications
6 A similar company GTS/Gasunie exists for the high pressure gas grid
A moderately concentrated power market at the generation level.Dutch power generation is dominated by four players, which manage 55 % of the installed power capacity.
At the transmission and distribution level, TenneT is the only TSO and is regulated by the state, whereas retail is completely liberalized.
The Dutch power generation market is moderately concentrated, with four major players: Nuon/Vattenfall, Essent/RWE, E.ON and Electrabel/GDF SUEZ. Together, they managed 55% of installed power capacity in 2013.5
The Dutch electricity market has been fully open to competition since 2004 (2002 for industrial consumers).
The liberalization of the market led to the entry of large European vertically integrated companies (E.ON, Vattenfall, RWE, GDF SUEZ), which purchased assets from former national generation and distribution companies such as Nuon and Essent, now owned, respectively, by Vattenfall and RWE.
The Netherlands opted for a system of full ownership unbundling, which is designed to completely split power generators from network owners. TenneT is the single national electricity TSO.6 It is controlled and owned by the Dutch state.
The electricity (low voltage electricity) distribution network is operated by eight distribution companies, through concession agreements. Enexis, Liander, Delta and Stedin manage more than 90% of the distribution network in terms of connections. Enexis and Liander are fully independent, directly owned by provincial and local governments. Delta and Stedin are independently governed and are parts of, respectively, Delta and Eneco. To date, these two companies have resisted full unbundling and legal procedures are currently underway regarding this issue.
Five mainactors
Optional1 TSO8 DSOs
100%liberalised
Generation
Nuon (Vattenfall),Essent (RWE), E.ON,
Eneco, Delta
Electricity Law (1998) Cross-border markets
Regulator: Authority for Consumers and Markets (ACM)
Regulated(Ministry of Finance100% shareholder)
100% IPPs
ProducersTraders
Power Market Transmission & Distribution Retail
Figure 7. Market mechanism
DeregulatedAPX
ICE ENDEX
OTC(60%)
Bilateralcontracts
TenneT
BalancingMarket
Interconnection:BE, DE, NO, UK,
DK (planned)
Consumerscan choose
Market offers
3European energy market reform Country profile: Netherlands
To start a new section, hold down the apple+shift keys and click
to release this object and type the section title in the box below.
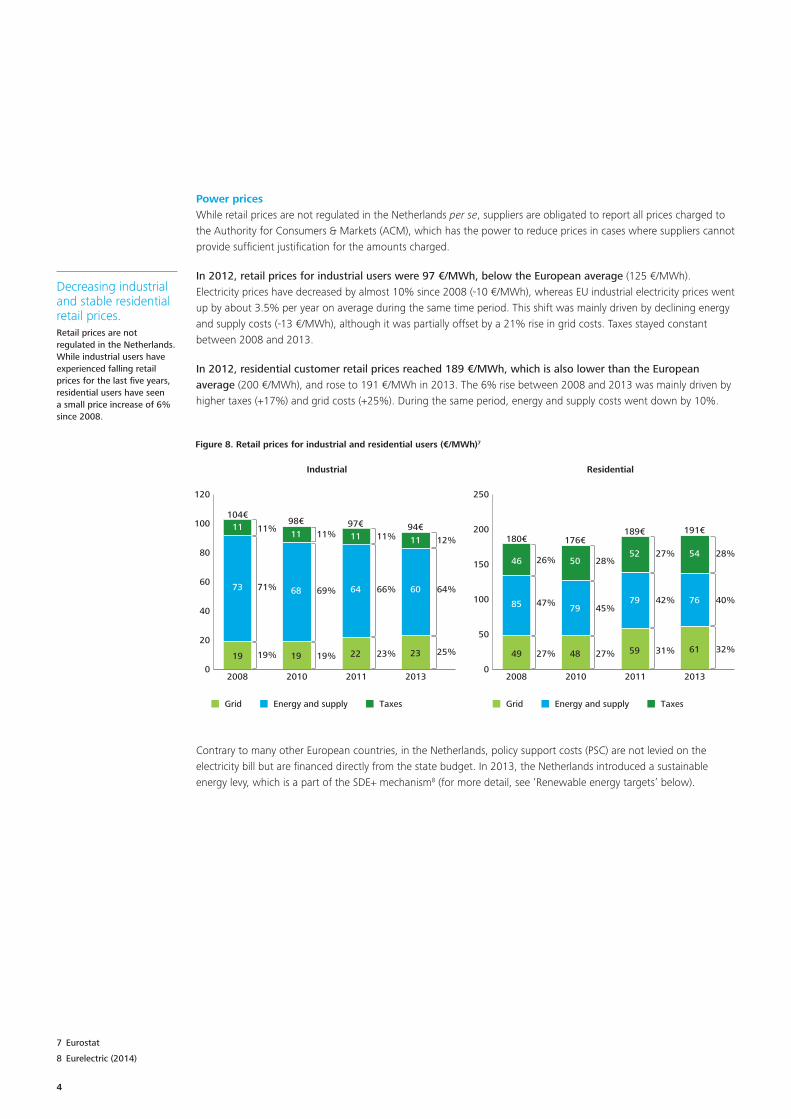
Power pricesWhile retail prices are not regulated in the Netherlands per se, suppliers are obligated to report all prices charged to the Authority for Consumers & Markets (ACM), which has the power to reduce prices in cases where suppliers cannot provide sufficient justification for the amounts charged.
In 2012, retail prices for industrial users were 97 €/MWh, below the European average (125 €/MWh). Electricity prices have decreased by almost 10% since 2008 (-10 €/MWh), whereas EU industrial electricity prices went up by about 3.5% per year on average during the same time period. This shift was mainly driven by declining energy and supply costs (-13 €/MWh), although it was partially offset by a 21% rise in grid costs. Taxes stayed constant between 2008 and 2013.
In 2012, residential customer retail prices reached 189 €/MWh, which is also lower than the European average (200 €/MWh), and rose to 191 €/MWh in 2013. The 6% rise between 2008 and 2013 was mainly driven by higher taxes (+17%) and grid costs (+25%). During the same period, energy and supply costs went down by 10%.
Decreasing industrial and stable residential retail prices.Retail prices are not regulated in the Netherlands. While industrial users have experienced falling retail prices for the last five years, residential users have seen a small price increase of 6% since 2008.
Contrary to many other European countries, in the Netherlands, policy support costs (PSC) are not levied on the electricity bill but are financed directly from the state budget. In 2013, the Netherlands introduced a sustainable energy levy, which is a part of the SDE+ mechanism8 (for more detail, see ‘Renewable energy targets’ below).
7 Eurostat
8 Eurelectric (2014)
Figure 8. Retail prices for industrial and residential users (€/MWh)7
0
20
40
60
80
100
120
2013201120102008
11
73
19
104€
11
68
19
98€
11
64
22
97€
11
60
23
94€11%
71%
19%
11%
69%
19%
11%
66%
23%
12%
64%
25%
0
50
100
150
200
250
2013201120102008
46
85
49
180€
50
79
48
176€
52
79
59
189€
54
76
61
191€
26%
47%
27%
28%
45%
27%
27%
42%
31%
28%
40%
32%
Grid Energy and supply Taxes Grid Energy and supply Taxes
Industrial Residential
4

To start a new section, hold down the apple+shift keys and click
to release this object and type the section title in the box below.
9 Eurostat (nrg_ind_334a)
Targets for 2020
In 2013, the Dutch government passed the Energy Agreement for Sustainable Growth, setting key actions to reach its 2020 energy and climate targets. The Agreement aims to reduce final energy consumption by an average of 1.5% per year and sets a 14% renewable energy target by 2020 for final energy consumption. Furthermore, the Agreement calls for an improved and properly functioning EU ETS to reduce overall emissions.
Energy efficiency targetsThe Netherlands has made energy efficiency one of its main priorities, as set out in several national plans, including the Energy Agreement for Sustainable Growth (September 2013), the Environmental Management Act (Wet milieubeheer) and the third Dutch National Energy Efficiency Action Plan (third NEEAP, 2014).
The Netherlands’ set targets are expressed both:
• in absolute terms (final energy consumption of 52 Mtoe in 2020); and
• in relative terms – energy savings of 482 PJ (11.5 Mtoe) by 2020 compared to 2007, introduced by the third NEEAP in 2014.
According to the Energy Agreement (2013), the 2020 goal defines an indicative target for final energy consumption of 52 Mtoe, which is 2% higher than it was in 2012 and is equivalent to 2005 energy consumption. Projections are based on national statistics and evaluation models, and any increase in energy consumption derived from GDP growth has to be compensated by equivalent savings across different sectors.
20-20-20 EU targets: what is the Netherlands committed to?• Energy savings: average
reduction in final energy consumption of 1.5% per year.
• 14% renewable energy in 2020 final energy consumption.
• 21% reduction in ETS emissions as compared to the 2005 level.
• 16% reduction in non-ETS emissions as compared to the 2005 level.
Energy efficiency: while an important share of energy savings remains to be realized, the indicative final energy target for 2020 was already attained in 2012.The Netherlands chose to focus its national target on gross final energy consumption, for which the target in absolute terms was met in 2012.
However, the main goal is to reach 482 PJ (11.5 Mtoe) of cumulative final energy savings by 2020. In 2010, 85% of the target remained to be achieved. Nevertheless, the Netherlands is making good progress to reach the interim 2016 target of 4.9 Mtoe of cumulative energy savings.
Figure 9. Final energy consumption (Mtoe)9
0
10
20
30
40
50
60
20202012201020051990
41
5254
51 52
Figure 10. Final energy consumption in 2012, per sector9
51 Mtoe
27%
20%
7%
17%
29%
Industry Transport Households
Services Agriculture
5European energy market reform Country profile: Netherlands

To start a new section, hold down the apple+shift keys and click
to release this object and type the section title in the box below.
10 http://www.government.nl/issues/energy-policy/saving-energy
Table 1. Cumulative savings in final energy consumption 2010, 2016 and 2020, as compared to 2007
Savings 2010 Expected savings 2016 Expected savings 2020
Sector GWh Mtoe GWh Mtoe Mtoe
Built environment 9,912 0.85 31,317 2.69 NA
Industry and SMEs 1,548 0.13 5,576 0.48 NA
Transportation 2,172 0.19 10,639 0.91 NA
Agriculture and horticulture 5,706 0.49 9,750 0.84 NA
Total 19,338 1.66 57,282 4.93 11.5
The third NEEAP (2014) was more ambitious than the EU target (average reduction of final energy consumption of 1.5% per year until 2020). The following table shows savings realized in 2010 compared to 2007, and savings expected in 2016 and 2020 as communicated in the 2014 NEEAP:
More than 50% of the total savings are expected to come from buildings. The Environmental Management of Non-Residential Buildings Act requires the implementation of energy-saving measures with a payback period of five years or less. Further measures related to energy efficiency in buildings include:10
• Low interest loans for energy-saving measures.
• € 400 million for energy-saving measures in the subsidized rental sector.
• An energy saving fund for landlords.
• A guaranteed fund for energy-saving measures by homeowners’ associations.
• Stricter energy efficiency requirements for new homes.
• An agreement to make rental homes more energy efficient.
• More energy-efficient heating and ventilation systems.
• A Dutch government plan to make new buildings energy-neutral by 2020.
Around 28% of the savings are expected to come from industry and SMEs. Industry has agreed to improve its energy efficiency by 2% per year. The Dutch government has put in place a so-called Green Deal program, which provides non-financial government support for environmentally-friendly measures and initiatives that will have positive effects on the Dutch economy but may encounter barriers threatening the initiatives’ feasibility. Several tax incentive programs (MIA and VAMIL) also aim to encourage businesses to use environmentally-friendly equipment.
The Netherlands set several targets regarding energy efficiency, some of which are more ambitious than the initial European-level targets. The Netherlands is partly on track to meet its 2020 energy efficiency targets: while it already reached its absolute final energy consumption target for 2020, important energy savings have yet to be realized.
6

To start a new section, hold down the apple+shift keys and click
to release this object and type the section title in the box below.
Renewable energy targetsThe Energy Agreement for Sustainable Growth set a target of 14% of final energy consumption to come from renewable energies by 2020, going up to 16% by 2023, compared to 4.4% in 2012. These targets seem ambitious, since the Netherlands already missed the 5.1% expected trajectory for 2011– 2012, set up in its National Renewable Energy Action Plan (NREAP).11
However, if these energy efficiency targets (52 Mtoe of final energy consumption in 2020) are reached, 7.3 Mtoe of final energy consumption should come from renewables by 2020, compared to 2.3 Mtoe in 2012. This means an additional 5 Mtoe will still be required by 2020.
The major policy measure incentivizing the development of renewable energy is the SDE+ scheme (Sustainable Energy Incentive12), which is funded by the state budget. This market-based scheme covers the price difference between fossil energy and sustainable energy for different periods (five, 12 or 15 years), depending on the technology. The SDE+ fixes one yearly budget for all renewables categories (€ 3.5 billion in 2014) and is opened sequentially in six phases during the year.
Additionally, the Netherlands has support schemes (tax deductions) to further incentivize renewable development. For example, companies can use Energy Investment Allowances (EIA) to invest in energy-efficient technologies (including renewables) and deduct 41.5% of investment costs from the taxable profits.
11 EEA Report No 10/2013 – Trends and projections in Europe 2013
12 http://english.rvo.nl/sites/default/files/2014/04/Brochure%20SDE%2B%202014.pdf
13 Eurostat (t2020_31)
14 EEA – Renewable Energy Projections as Published in the National Renewable Energy Action Plans of the European Member States, 2011
0
20
40
60
2020201220082004
Figure 11. Renewable energy share of final energy use (2012)13
Final Energy Consumption (Mtoe) Share of Renewables (%)
2%
53
3%
54
5%
51 52
14%
0%
5%
10%
15%
Figure 12. Renewable energy share of final energy use by type, in 2005 and 2010, and target for 2020, in %14
0%
2%
4%
6%
8%
10%
12%
14%
16%
TotalBiofuelsOther heatingsectors
Heatpumps
Solidbiomass
Other electricitysectors
WindHydro
2005 2010 2020
7European energy market reform Country profile: Netherlands

To start a new section, hold down the apple+shift keys and click
to release this object and type the section title in the box below.
15 EWEA Wind in power – 2013 European statistics
16 CBS – Statistics Netherlands
17 EEA 2014a
18 EEA 2014b
In 2013, biomass accounted for the largest share of all renewable energy production, followed by wind power. In the same year, the Netherlands had 2.7 GW of installed wind power capacity,15 0.3 MW of which were installed in 2013. The Energy Agreement aims at scaling up offshore wind power to 4.45 GW in 2020, operational in 2023. In the case of onshore wind power, targeted new capacities are 6 GW by 2020 and 7 GW by 2023.
Renewable target: in 2012, 69% of the country’s target will remain to be achieved. Wind is expected, but unlikely, to close the gap.With 4.4% renewables in the mix, the Netherlands is still far from its 2020 target (14%). The government has set up ambitious plans to close the gap (especially for onshore and offshore wind), but the effectiveness and timeliness of these policies remain to be proven.
Figure 13. Planned offshore wind capacities (in GW)
0
1
2
3
4
5
201920182017201620152014
11.45
2.052.75
3.55
4.45
According to the Energy Agreement, the annual budget to promote renewable energy will increase progressively to € 3.8 billion in 2020.
Reaching the target of 14% renewables in 2020 depends heavily on the development of onshore and offshore wind power over the next six years. Since the planned capacities will require substantial investment, it is questionable if the Netherlands will be able to ramp up its capacities in the remaining time.
CO2 emissions and targetsGreenhouse gas emissions (GHG) have been decreasing since 2010, but the Netherlands remains one of the most fossil fuel- and CO2-intensive economies among EU Member States. In 2013, the energy sector was responsible for the largest share of CO2 emissions (35%), followed by transportation (20%) and the non-energy industry (19%).16
0
50
100
150
200
250
2020201220102005
Figure 14. GHG emissions and target for 2020 (Mt CO2eq)17
ETS Non-ETS ETS target Non-ETS target
The ETS sector is making good progress toward its target (66 Mt CO2eq in 2020, -17 Mt CO2eq compared to 2005 or -21%). In 2012, its GHG emissions already declined by 8 Mt CO2eq (75 Mt CO2eq vs. 83 Mt CO2eq in 2005) or half of its objectives.
For non-ETS sectors, the Netherlands has committed to reduce its emissions by 16% between 2005 and 2020 (i.e. -21 Mt CO2eq), which means that 11 Mt CO2eq remain to be reduced from 2012 to 2020 (52%). It should be noted that emissions dropped from 117 to 108 Mt CO2eq between 2012 and 2013.18
8

To start a new section, hold down the apple+shift keys and click
to release this object and type the section title in the box below.
19 http://www.emissieregistratie.nl/erpubliek/erpub/nec.aspx
20 For a detailed list, please refer to the latest Biennial Report under the UNFCCC
21 http://iepd.iipnetwork.org/policy/fiscal-schemes-environmentally-friendly-investment-mia-and-vamil
22 http://www.iea.org/policiesandmeasures/pams/netherlands/name-21089-en.php
Table 2. Examples of climate policies20
Sector Energy Industry Transport Waste Housing Agriculture
Examples of measures
SDE+ and other financial incentives of RES
Energy efficiency agreements for non-ETS companies (MJA3-covenant)
Incentives for the use of biofuels
Landfill policy
Implementation of the Ecodesign Directive
Methane emission regulation (BEMS)
Measures for green investment such as MIA, VAMIL or EIA21
Emission standards
Energy Performance Standard (EPN)22
Size of cattle stock and manure management
Estimated cumulative mitigation impact in Mt CO2eq. (2005-2020)
74 17.1 3.6 2.8 2.8 5.5
GHG emission targets: in 2012, the Netherlands had met 47% of its 2020 target (with similar progress in the ETS and non-ETS sectors) and seems to be on track to reach its 2020 targets.
National measures outside the ETS address all sectors (transportation, housing, waste disposal, agriculture and forestry, aquaculture and some parts of industry) through CO2 emission ceilings19 or other measures. A few examples are shown in the table below:
Major savings are expected to come from the energy and the industrial sectors.
As of 2012, the Netherlands was halfway towards its 2020 emission targets, as compared to 2005. If additional measures are implemented as planned and prove to be effective, the country is likely to reach its 2020 CO2 targets.
9European energy market reform Country profile: Netherlands

To start a new section, hold down the apple+shift keys and click
to release this object and type the section title in the box below.
23 http://www.government.nl/news/2014/01/17/natural-gas-production-reduced-and-funds-earmarked-for-groningen.html
24 GATE is a joint venture between Vopak (a tank terminal operator) and Gasunie
25 http://www.economist.com/blogs/charlemagne/2014/04/netherlands-lng-terminal
26 http://www.government.nl/issues/energy-policy/natural-gas
Long-term priorities are set until 2050, but concrete targets and pathways are missing after 2020.
Changing from a gas net exporter to a net importer may raise several issues, due to an increasing dependency on fossil fuel imports and declining state revenues.
Road ahead and main challenges: the way to 2030 and beyond
Long-term energy priorities but few tangible targetsEvery four years, the Dutch Ministry of Economic Affairs, Agriculture and Innovation publishes an Energy Report that sets out the core energy policies for the country. The 2011 Energy Report focuses on three core long-term priorities:
1. Transition to a cleaner supply of energy, achieving a low carbon-emission economy by 2050;
2. Support the economic goals of the energy sector through green growth; and
3. Ensure a reliable supply of energy through a balanced mix of grey and green energies coming from national and international sources.
The Dutch government approaches these policies through five key objectives:
1. Pursuing a modern industrial policy focused on grey and green energy, which consists of a mix of fossil fuels and renewables;
2. Expanding the share of renewable energies in the short (2020) and long terms (2050);
3. Providing scope for all energy options towards 2050;
4. Supporting Green Deals as a way to encourage private-public partnerships and remove non-economic barriers in the energy sector; and
5. Investing in a sound European energy market with a good infrastructure.
While these objectives provide a framework for energy policies, concrete pathways and targets have not been well articulated. In 2013, the Energy Agreement provided greater detail for a pathway to 2020, but did not set out similar details past that date.
Gas production under pressureThe Netherlands, with its vast Groningen gas fields, is the second largest gas producer in Europe, after Norway. Gas production from the large Groningen field is declining and the outlook for domestic unconventional gas remains uncertain. Currently a gas exporter, the Netherlands is likely to become a gas importer by around 2025. The government emphasizes that gas will keep playing a key role in the Dutch energy mix, but this will mark a significant transition as, in 2012, 64% of final energy consumption relied on natural gas.
The Netherlands faces several challenges when it comes to the future role of gas. Due to multiple earthquakes in the Netherlands' most northern province of Groningen, the Dutch Minister of Economic Affairs decided in early 2014 to cut the annual output to 40 bcm by 2016 (the previous outlook was around 49 bcm per year until 2020) and reserves are declining. The expected reduction in government revenue will be € 600 million in 2014, € 700 million in 2015 and € 1 billion in 2016.23
As far as shale gas is concerned, the government is examining if and where it could be extracted in the Netherlands. A decision is expected in 2015.
Other current market developments that might influence the long-term vision of natural gas in the Netherlands are cheap coal imports (mainly from the US) and German wind electricity that may force gas-fired power plants to close down. The shift from being a gas net exporter to a net importer will likely have significant implications on the whole energy system, requiring investments and long-term decisions.
With the GATE24 Liquefied Natural Gas (LNG) terminal, which came online in 2011, the government wants to counterbalance this trend. In 2014, the terminal only operated at around 10% of its capacity, due to high LNG prices.25 However, depending on future geopolitical developments – particularly with regard to the relationship between Europe and Russia – LNG may assume a more important role. To secure revenues in the future, the government is currently promoting the establishment of a ‘gas roundabout’ for north-western Europe, encompassing26 gas pipelines, with Gasunie Transport Services (GTS), gas trading through the virtual marketplace’s Title Transfer Facility (TTF), ICE Endex and others, and gas storage (e.g. in the Bergermeer gas field).
10

To start a new section, hold down the apple+shift keys and click
to release this object and type the section title in the box below.
27 http://www.world-nuclear-news.org/NN-Mixed_news_on_Netherlands_new_build-2301124.html
Renewables and nuclear powerAccording to the Energy Agreement for Sustainable Growth, renewable energies will play an important role in the future energy mix of the Netherlands, driven mainly by onshore and offshore wind power. The high-scale development of offshore wind farms is still rather recent and there are still uncertainties around the real costs (maintenance and depreciation) and benefits (power generation) of these farms. Precise post-evaluation of these costs and benefits in the next few years will enable a more effective assessment on the share of the energy mix that can be covered by this technology.
However, the long-term outlook is unclear, since no concrete targets have been set for after 2023. Given that it will already be challenging to reach the 2020 target of a 14% share of renewables in the energy mix, the 16% target for 2023 remains questionable.
For the time being, the Netherlands has only one commercial nuclear reactor (Borssele) in operation, producing 4% of total electricity. However, the Dutch government is in favor of constructing new power plants in the future, subject to strict safety and environmental conditions that are being verified and reinforced in the aftermath of the Fukushima Daiichi accident in March 2011. In 2012, Delta announced that it would postpone any decision to start building a second nuclear power plant by two or three years. The reason behind the decision was “a combination of the financial crisis, the high investment required for a nuclear power plant, the current investment climate and overcapacity in the electricity market combined with low energy prices.”27 So far, no concrete plans have been presented and the Energy Agreement of 2013 was silent on the future of nuclear.
Climate changeThe Dutch government supports an EU-wide reduction in GHG emissions of at least 40% by 2030. It considers this 40% goal as a minimum and generally asks for tighter European agreements to reduce GHG emissions through an improved ETS. However, here again, no concrete targets have yet been announced by the government and decisions will be needed to define the pathway to decarbonize the energy mix beyond 2020.
As far as transport is concerned, the Dutch government wants to cap the transportation sector’s GHG emissions at 25 Mt CO2eq by 2030, 17% lower than it was in 1990; and from 2035, all new passenger cars will have to run CO2 free.
ConclusionThe Netherlands finds itself on an historical transition path to a new energy mix. After having relied heavily on its natural gas production for many years, it has to significantly evolve its energy mix to adapt to declining gas outputs and the need to become a gas importer in the next decade. Its path forward may be twofold: a shift back to its centuries-old traditional energy – wind, combined with a move forward to more nuclear power. As of today, key challenges remain to be addressed by 2020, if the Dutch government wants this transition to succeed. Developing wind may be costly and time consuming, while the development of nuclear remains in limbo. The ability to make this transition in an energy-efficient manner while hitting GHG emission targets may require more significant policy adjustments.
The Energy Agreement of 2013 gives the direction, but will ultimately need enforcement. The energy mix will certainly remain dominated by fossil fuels in the coming decades. However, the Dutch government has also set ambitious targets to increase the share of renewables to 16% by 2023 and to fully support the European climate policy. It will be the success or failure of the implementations of the 2020 policies that will determine the longer-term policies that remain to be defined.
Ambitious on wind and a blank page for the future of nuclear. The two main types of energy the Netherlands has decided to develop are wind and nuclear. While the target and trajectory are rather clear for wind, nuclear development still remains in limbo.
High ambition regarding climate change, but a lack of specific targets.
11European energy market reform Country profile: Netherlands

To start a new section, hold down the apple+shift keys and click
to release this object and type the section title in the box below.
Selected bibliographic references
IEA (2014) – Energy Policies of IEA Countries – The Netherlands 2014 Review
European Commission (2014) – Progress Report on energy efficiency in the European Union SWD(2013) 541 final
SER (2013) – Energy Agreement for Sustainable Growth (Energieakkoord voor duurzame groei)
Second National Energy Efficiency Action Plan for the Netherlands (2011)
Third National Energy Efficiency Action Plan for the Netherlands (2014)
European Commission, Energy Markets in the European Union in 2011, Country fiche Netherlands.
EEA Report (2013) – Trends and projections in Europe 2013 – Tracking progress towards Europe's climate and energy targets until 2020.
EEA Report (2014a) – Annual European Union greenhouse gas inventory 1990 – 2012 and inventory report 2014.
EEA (2014b), Trends and projections in Europe 2014
ECN (2013) – Toegevoegde waarde van de elektriciteitssector voor de Nederlandse economie
SEO (2012) – Energy policy after 2020
Ecologic Institute (2014) – Assessment of climate change policies in the context of the European Semester Country Report: The Netherlands
Concerted Action Energy Efficiency Directive (2014) D9: EED implementation in The Netherlands.
PBL Netherlands Environmental Assessment Agency (2013) – Non-ETS emission targets for 2030.
Eurostat
http://statline.cbs.nl
Eurelectric (2014), Analysis of European Power Price Increase Drivers
12