european defence monitoring (edm) - swp- · pdf filecase studies on current and future...
TRANSCRIPT

Working Paper Research Division International Security European and Atlantic Security Stiftung Wissenschaft und Politik German Institute for International and Security Affairs
Christian Mölling, Marie-Louise Chagnaud, Torben Schütz, Alicia von Voss
European Defence Monitoring (EDM)
FG3-WP No 01 January 2014 Berlin


SWP-Berlin European Defence Monitoring
January 2014
1
Table of Contents
1. EU Defence: State of Play and Perspectives .................... 4 2. European Defence Monitoring (EDM): Generating a
European Picture ................................................................ 6 3. Defence Economics and Policies ....................................... 7 4. Capabilities ....................................................................... 10 5. Procurement Prospects .................................................... 15 6. EDTIB: A European Vision - Almost Gone .................... 17 7. Case Studies on Current and Future Potentials of
Helicopters and UAS ........................................................ 30 8. Defence Cooperation ........................................................ 34 9. Annex ................................................................................. 37
SWP Stiftung Wissenschaft und Politik German Institute for International and Security Affairs Ludwigkirchplatz 34 10719 Berlin Phone +49 30 880 07-0 Fax +49 30 880 07-100 www.swp-berlin.org [email protected] SWP Working Papers are online publications of SWP's research divisions which have not been formally reviewed by the Institute. Please do not cite them without the permission of the authors or editors. Dr. Christian Mölling is an Associ-ate in SWP’s International Secu-rity Division. Marie-Louise Chagnaud, Torben Schütz and Alicia von Voss are Project Assistants in SWP’s Inter-national Security Division. The authors are members of the EDA project “European Defence Monitoring”.
This working paper is based on reports delivered to EDA under Framework contract No 11.CAP.OP.166 (the framework
contract with a duration of 4-years has a total value of 400,000 EUR).
The opinions expressed are those of the authors and do not represent EDA’s official position.

SWP-Berlin European Defence Monitoring January 2014
2
List of Figures
Figure 1: EU28 Defence Budgets, 2012-2017 (€ bn), current prices ................................................................................. 8Figure 2: EU28 Defence Budgets, 2012-2017 (€ bn), constant 2011 prices .................................................................... 8Figure 3: Latest Conceptual Revision of National Defence Documents and Changes in LoA .................................. 9Figure 4: Fighter Ground Attack (FGA)/Fighter (FTR) 2012 (units) ................................................................................ 11Figure 5: Ratio Modern vs. Other MBT 2011/2012 .............................................................................................................. 12Figure 6: Fragmentation of Equipment: Overview 2012 .................................................................................................. 13Figure 7: Air Combat Operations-Chain 2012 ..................................................................................................................... 14Figure 8: Projection of FGA until 2025-2030 ........................................................................................................................ 16Figure 9: Development of Armoured Vehicles until 2020-2025 .................................................................................... 16Figure 10: Political Vision of EDTIB ........................................................................................................................................ 17Figure 11: Status Quo .................................................................................................................................................................. 18Figure 12: Potential Future ....................................................................................................................................................... 18Figure 13: Total and Military Turnover 28 EU Defence Companies 2010-2012 (€m) .............................................. 21Figure 14: Illustration: Sectoral Assessment ........................................................................................................................ 24Figure 15: EU Companies in Land Sector: Relative Sector Size ..................................................................................... 24Figure 16: EU Companies in Aerospace Sector: Relative Sector Size ........................................................................... 25Figure 17: EU Companies in Naval Sector: Relative Sector Size ................................................................................... 26Figure 18: EU Companies in Electronics Sector: Relative Sector Size .......................................................................... 27Figure 19: Cross-Sector Assessment 2012 .............................................................................................................................. 29Figure 20: Numbers and Shares of Helicopters EU28 (2013) ........................................................................................... 30Figure 21: Helicopters: Change in Effective Quantities EU28 ........................................................................................ 31Figure 22: Potential Future UAS Fragmentation ................................................................................................................ 32Figure 23: World UAS Budget Forecast, R&D and Procurement (in USD bn) ............................................................. 33
List of Tables
Table 1: Overview Equipment by Type (units) ..................................................................................................................... 10Table 2: Overview Forces by Role 1999-2012 (CCE) ............................................................................................................. 12Table 3: Proportions of Procurement Projects along Supply Types .............................................................................. 15Table 4: FGA Types Ordered (partly delivered) (March 2013) .......................................................................................... 16Table 5: Destinations (Regions) of Top Ten Suppliers (% of national exports 2007-2012 of major conventional weapons) ............................................................................................................................................................... 21Table 6: Overview Defence Sectors Assessment 2012 ........................................................................................................ 22Table 7: Grouping of Helicopter Roles Across EU28 in 2013 .......................................................................................... 31Table 8: Regional and Bilateral P&S Frameworks 2010-2013 .......................................................................................... 35Table 9: Defence Budgets EU28 (in € bn) .............................................................................................................................. 37Table 10: Changes in Budgets and Expenditures ............................................................................................................... 38Table 11: Levels of Ambitions EU28 ........................................................................................................................................ 39

SWP-Berlin European Defence Monitoring
January 2014
3
List of Abbreviations A&D Aerospace and defence
AEW Airborne early warning
AEW&C Airborne early warning & control
AIFV Armoured infantry fighting vehicle
APC Armoured personnel carrier
ARV Armoured recovery vehicle
ASW Anti-submarine warfare
AT Austria
ATK Attack/ground attack
BE Belgium
BENELUX Belgium, The Netherlands and Luxembourg
BG Battlegroup
BG Bulgaria
Big 3 France, Germany, UK
Bn Battalion/billion
C2 Command and control
CCE Calculated company equivalent
Cdo Commando
CSDP Common Security and Defence Policy
CSS Combat service support
CY Cyprus
CZ Czech Republic
DE Germany
DK Denmark
DoI Declaration of Intent
DTIB Defence Technological and Industrial Base
EATC European Air Transport Command
EDA European Defence Agency
EDM European Defence Monitoring
EDTIB European Defence Technological and Industrial Base
EE Estonia
ELINT Electronic intelligence
ES Spain
EU European Union
EW Electronic warfare
FGA Fighter ground attack
FI Finland
FR France
FTR Fighter
GR Greece
HALE High-altitude long endurance
Hel Helicopter
HQ Headquarters
HR Croatia
HU Hungary
IE Ireland
IED Improvised explosive device
IISS International Institute for Strategic Studies
Inf Infantry
ISR Intelligence, surveillance and reconnaissance
IT Italy
LC(x) Landing craft
LoA Level of Ambition
LoI Letter of Intent
LS (X) Landing ship
LT Lithuania
LU Luxembourg
LV Latvia
MALE Medium-altitude long endurance
MBT Main battle tank
MC (X) Mine countermeasure
MH (X) Mine hunter
ML Minelayer
MoD Ministry of Defence
MP Maritime patrol/military police
MRH Multirole helicopter
MS Member States
MS (X) Mine sweeper
MT Malta
Mtn Mountain
MTOW Maximum take-off weight
NL Netherlands
NORDEFCO Nordic Defence Cooperation
NRF NATO response force
OPV Offshore patrol vessel
P&S Pooling & Sharing
PL Poland
PPV Protected patrol vehicle
PT Portugal
R&D Research and development
Recce Reconnaissance
RF Radio frequency
RO Romania
SALIS Strategic airlift interim solution
SAR Search and rescue
SATCOM Satellite communication
SDV Swimmer delivery vehicles
SE Sweden
SEAD Suppression of enemy air defence
SI Slovenia
SIPRI Stockholm Int'l. Peace Research Institute
SK Slovakia
SME Small and medium enterprises
SoS Security of Supply
SSBN Nuclear-powered ballistic-missile submarine
SSK Attack submarine with ASW capability
SSN Nuclear-powered attack submarine
SSW Midget submarine
TKR Tanker
TPT Transport
TUAS Tactical unmanned aerial syste,
UAS Unmanned aerial system
UAV Unmanned aerial vehicle
UCAS Unmanned combat aerial system
UK United Kingdom
V4 Visegrád Group / Visegrád 4
VTOL Vertical take-off and landing

SWP-Berlin European Defence Monitoring January 2014
4
1. EU Defence: State of Play and Perspectives1
The cooperation imperative needs to be taken up by governments as a leading principle of action in defence.
1. The defence-economic and cooperation imperative implies structural adjustments in budg-ets and the entire defence sector. So far, states have made ad hoc cuts. After the first wave of cut-backs many nations announced long-term budgetary planning for a decrease in defence budgets. However, these plans collide with political priorities, the perceived need for sup-port of the national defence industries or existing contractual obligations that could only be altered with enormous financial costs. Capitals should take such decisions with more con-sultation with other European states: the number of capabilities and personnel strength is shrinking, while states still wish to keep the full range of military capacities.
2. Additionally, neither the current budget cuts nor the future plans allow for financial buff-ers necessary to account for a potential increase in procurement costs or other budgetary risks. Budget deficits have to be compensated on an ad hoc basis. Such developments do not, however, take away doubts that states are getting a grip on their budgets and that current austerity measures are sufficient to settle their debts in the longer term.
Cooperation has generally been accepted as the best solution but EU Member States need to do more.
3. Although promising examples are available, like the air-to-air-refuelling project, results are not yet adequate given the size of the problems. New efforts like the Ghent initiative too of-ten rely on traditional methods of multinational defence cooperation.
4. The idea that individual states can initiate successful projects to improve collective capabili-ties for defence (bottom-up-approach) has so far not delivered the step-change needed in de-fence cooperation. Even in the face of a possible defence bankruptcy governments hold up the premise of national sovereignty. Thus, states are limiting joint projects to particular military capabilities they are interested in, instead of facing the question which contribu-tion to common objectives they could make.
5. In cases where states do co-operate they often do not sufficiently seek for broader collabora-tive solutions at European level. In the Franco-British Lancaster House Treaty both states agreed on considerable dependencies. But old limits are apparent: joint acquisitions or im-ports from the partner remain exceptions. National capital is invested in favour of the na-tional industry. This would be blocking future common projects like the development of UAS.
1 We would like to thank Anja Dahlmann for her support in editing this paper.

SWP-Berlin European Defence Monitoring
January 2014
5
The adherence to national prerogatives leads to greater dependencies and less military capacity to act.
6. Defence planning seems more and more detached from reality. While states are rhetorically adhering to military autonomy, reality is catching up: specialisation is increasing in an un-controlled way. At the same time, with their national budget cuts they are creating what they fear the most: dependency. To be able to intervene militarily European states are more dependent on each other than ever before. Due to a missing concept for military burden sharing that would frame these developments, every state chooses to specialize in the area it can afford. Expensive capabilities like aircraft, helicopters and satellites are likely to become less and less available. The uncontrolled cutting of military capabilities also reduces the possibilities of cooperation among all. It creates more collective capability gaps but at the same time keeps surplus material in other areas. Even though states are affected to different degrees and their reactions also differ, no state can elude itself from the effects of the cur-rent austerity period.
7. EU Member States are more dependent on each other than ever before – at the same time the defence crisis is increasingly driving them apart. Their national measures have centrifu-gal implications for the EU as a political and military community. From the definition of a common defence policy to its implementation Member States are increasingly growing apart. There are important differences in the style and size of the budgetary cuts concerning resources, personnel and modernization. Those states which are not able to keep up their military development are losing the capacity to take part in multilateral actions and joint EU and NATO operations. This reduces the interoperability and increases the capability and modernisation gap. This could result in a solidarity gaps: many states can only make mar-ginal contributions to international capability packages. This would reduce their capacity to define and implement a common defence policy. Moreover, since 2011 we can observe that some states are practically unable to hold up their defence contributions.
A “Europe without defence” can be prevented if EU States seize the opportunities ahead
8. A further weakening of capabilities and even larger capability gaps can already be envisaged – in spite of some modernization programmes. If Europe continues ignoring the conse-quences of the defence-economic cooperative imperative, it will run the danger of damaging operational military capabilities through an unguided structural shift in the armed forces and defence industry.
9. It remains in the hands of Member States to continue and intensify the P&S efforts. In-creased military effectiveness and economic efficiency can surface if Member States pursue long-term commitments and build sustainable structures of cooperation. Efforts at the con-ceptual infrastructure of defence cooperation have already reached a new level: EDA’s Code of Conduct on P&S and Council Conclusions concerning greater cooperation in defence and security issues can support P&S initiatives and strengthen existing cooperation frameworks. The Conclusions of the Council of the European Union in November 2013 and of the Euro-pean Council in December 2013 offer the opportunity to launch a European Defence Re-view. Such a Review could also inform a Strategic Defence Roadmap as it would offer a clearly defined point of departure and outline future avenues for European defence coop-eration.
SWP-Berlin European Defence Monitoring January 2014
6
2. European Defence Monitoring (EDM): Generating a European Picture
EDM Reports: Answering Three Questions on European Defence
10. While the impact of the financial crisis amounts to be the most important strategic factor driving European defence for now and the years to come, EU Member States (MS) can hardly estimate its impact, nor can they easily determine the appropriateness of their current and future reactions. Therefore MS asked the European Defence Agency (EDA) to find common solutions on how to deal with the impact of the financial crisis, to explore new areas for Pooling & Sharing (P&S) and make recommendations to the MS to implement them. The EU Council on Foreign Affairs and Defence of December 1st, 2011, has underlined this: “The Council stresses the need to further examine the impact of reduced defence spending on capabilities, including its possible impact on key industrial and technological capacities to be maintained and developed in Europe.”
11. The task of the “European Monitoring Project” is to support Member States’ understanding of current and future challenges and opportunities related to the EU defence sector and its Defence Industrial and Technological Base (EDTIB). It aims to support decision making by providing empirical knowledge on current and projectable developments in European De-fence indicated by three key questions:
• What is the state of European defence and cooperation within this realm? • How may it develop in the future? • What are the implications for P&S and the decisions on its implementation and fur-
ther development?
Open Sources Allow for Verifiable and Reproducible Results
12. The project only deals with unclassified information that is publicly available. This ensures that results are verifiable and reproducible as well as traceable in the research process. The main sources for the EDM Database are The International Institute for Strategic Studies (IISS), The Military Balance, Peer Review and various kinds of other open source material. Open source information prefers official Ministry of Defence (MoD) documents, statements, press releases and interviews given by officials. In addition, academic or research institu-tions provide data and insights as does the plethora of press publications (journals, maga-zines, newspapers). The EDM Database is subject to continuous addition of information and therefore to a continuous revision of figures. The study team does, in addition, benefit from a corona of regional experts who are able to put data in the respective national contexts and to check their reliability.
Robust Methods to Grasp Change on the European Level
13. The primary task of the EDM- Project is to grasp change in the defence landscape over time. To generate a European picture of change the project is not interested in assessing trees but forests – i.e. we are assessing the European landscape with broad categories e.g. of forces and equipment, not taking into account national particularities. This landscaping takes place in five main areas, which also make up the chapters of the EDM-Reports: (1) Defence econom-ics, (2) national defence policies; (3) capabilities; (4) developments in existing defence coop-eration; (5) EDTIB - Defence industry. Building on the experience of the first reports, we ad-ditionally have conducted in-depth assessments of specific areas of equipment: Helicopters and UAS; further such assessments are foreseen for the next reports.
14. As the assessment had to become more elaborate, the methods and categories of assessment had to become more elaborate as well. Hence the EDM-Reports use specifically- developed metrics like the Criticality- Index, the Fragmentation- Index or the Calculated Company Equivalent (CCE), all explained in this working paper, either in course of the text or in the annex.

SWP-Berlin European Defence Monitoring
January 2014
7
3. Defence Economics and Policies
15. The financial crisis has put a strain on defence budgets across the EU28. As public debts are likely to remain high, further cost cutting measures are to be introduced in many EU Mem-ber States to cope with the on-going financial pressure.
Constant Proportions but Growing Divergence
16. However, the effects of the financial crisis on Member States‘ defence budgets differ signifi-cantly across the EU28. There are several reasons that could explain these differences. For one, countries differ both in how strong the remedies are they must take to deal with the crisis, and also if defence will be particularly affected in the process. On the other hand, the spread could also be the result of different prioritisation of defence among EU Member States: In some states, defence has gained in importance, whereas other Member States ei-ther attribute less importance to it or are forced to commit fewer funds to defence due to severe economic conditions.
17. Taking a closer look at EU Member States, there are three groups of spenders, defined by their traditional contributions to EU defence budgets: the “Big Three” spenders France, Germany, and the UK; a group of middle rate spenders and the “lower 16”, i.e. those 16 countries who in absolute terms contribute the smallest portion.2
Budgets are not Expenditures
The main shift has oc-curred in the “Lower 16” countries. Their share in the EU28 defence budget has decreased from 9% in 2008 to 7% in 2013. As a result, the dependency on the other states could in-crease. Additionally, the wider the spread in defence budgets across EU28, the more difficult common P&S projects will become. For instance, joint procurement programs could turn out to be more difficult to accomplish if there is a significant difference and divergence be-tween Member States’ defence budgets. Furthermore the defence budget change spanning from about +40% to -40% between 2008 and 2013 suggests regional differences.
18. However, significant differences exist between defence budgets and expenditure. Hence, it is likely that even if the data for defence budgets does not show major changes, the data on expenditure could reveal more significant cuts. This is documented in Table 10 in the an-nex.
Budget Futures: Bloomy vs. Gloomy Perspectives
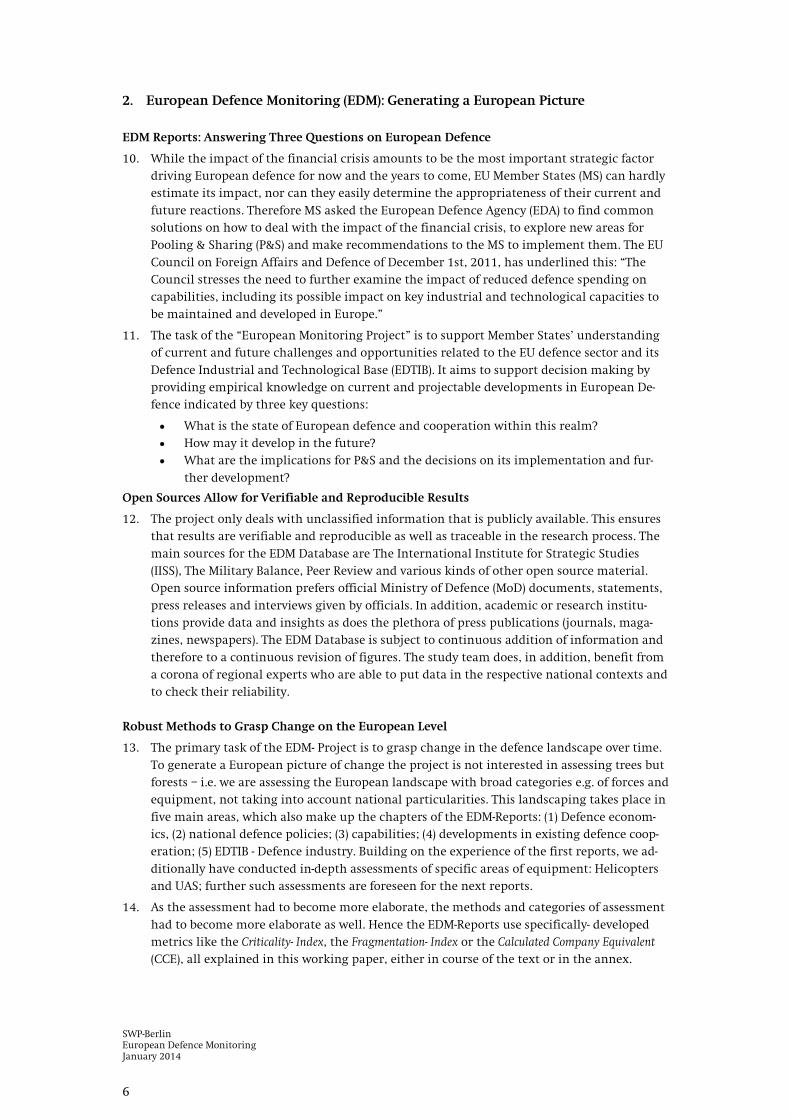
19. While the fiscal crisis has continued to impact on the actual expenditures, Member States paint a positive picture for the future. After a brief decline until 2014, they plan to increase their budgets again. Three factors are not part of the Member States’ calculations but turn this picture in another direction: (a) short-term fiscal pressures as well as decent long-term growth rates may reduce the money available a priori, (b) general inflation takes up the marginal annual increase, and (c) defence inflation impacting on the investment part of de-fence budgets3
2 Big Three: countries with a defence budget in 2012 over €30 bn; Middle Spenders: countries with a defence
budget in 2012 between €2.5 bn and €30 bn; Lower 16: countries with a defence budget in 2012 lower than €2.5 bn.
. The alternative scenarios (cf. Figures 4 and 5) below take these different fac-tors into account.
3 The defence inflation assumes a 10 percent annual rate of increase in the price of military equipment. The defence inflation rate is thus usually higher than the overall economic inflation rate (see: W.J. Chao, G. Sand-ers & G. Ben-Ari (04/2008), Trends in European Defence Spending, 2001-2006: A report of the CSIS Defense-Industrial Ini-tiatives Group, Center for Strategic & International Studies (CSIS), retrieved 18/02/2013 from: http://csis.org/files/media/csis/pubs/080424-chao-europeandefense.pdf). However, data on defence inflation is not available for every EU member state. For an example of defence inflation rate in an EU country, see RUSI’s discussion on UK’s defence inflation: M. Chalmers, J. Dowdy, D. Kirkpatrick & R. Laird (06/2009),
SWP-Berlin European Defence Monitoring January 2014
8
Figure 1: EU28 Defence Budgets, 2012-2017 (€ bn), current
prices
Source: SWP EDM Database
Figure 2: EU28 Defence Budgets, 2012-2017 (€ bn), constant
2011 prices
Source: SWP EDM Database
Defence Policies: A Widespread Conceptual Reaction
20. In the period 2008-2012, many EU countries initiated defence reforms in order to take the long-term effects of the financial crisis into account. MoDs focus on a reduction of personnel and the restructuring of armed forces. These efforts are, however, driven by national cir-cumstances and do not display a more conceptual, coordinated approach to European de-fence. In spite of the recognition that the financial crisis poses a longer-term dilemma to armed forces, many MoDs have not adapted the capability development to the budgetary challenges of the future.
21. A majority of EU Member States have now updated important elements of their defence policies over the past five years; twelve countries have adapted their levels of ambition (LoA) between 2008 and 2013. Out of those twelve, six countries have reduced their LoA since 2012.
Defense Inflation: Reality or Myth? In: RUSI Defense Systems, p. 12-21, retrieved 18/02/2013 from: <http://www.rusi.org/downloads/assets/Comment_Defence_Inflation_Myth_or_Reality.pdf>.
140
150
160
170
180
190
200
2012 2013 2014 2015 2016 2017
€bn
Year
EU 27+1 Future Budgets Projections
Scenario 1: D/F -1bn
Scenario 2: av growth 1999-2011
Scenario 3: av growth 2008-2011
140
150
160
170
180
190
200
2012 2013 2014 2015 2016 2017
€bn
Year
EU 27+1 Future Budgets Projections
Scenario 1: D/F -1bn
Scenario 2: av growth 1999-2011
Scenario 3: av growth 2008-2011
Assumed Defence Inf lation 3,5% Scenario 3

SWP-Berlin European Defence Monitoring
January 2014
9
Figure 3: Latest Conceptual Revision of National Defence Documents and Changes in LoA4
Source: SWP EDM Database
Saving Potentials in Defence
22. As defence spending plans remain high despite financial pressure, the impression is that military planning has not caught up with this pressure, and EU Member States do not see themselves faced with a defence budgetary crisis. However, deviations of defence expendi-tures from planned budgets are generally growing, thereby reducing the reliability of budget forecasts. Moreover, the volatility of spending has increased over the last years, showing that budgetary planning is often countered by overriding short-term policy deci-sions.
23. Finally, defence economics is also about the saving potentials in defence. The sum of envis-aged spending of €190bn is no small money, after all. It appears to permit the existing 28 defence decision centres to execute their business “as usual”. Financial pressure does not seem to be big enough – by far – to drive MoDs down the path of coordinating and sharing in any visible, let alone spectacular, way. Adaptation trumps deeper reform. Recent aca-demic or consultants’ publications, however, insist upon considerable savings potential in Europe’s collective efforts at strengthening CSDP instruments. But a coordinated “Revolu-tion in EU Military Affairs” towards more economical defence postures is still not on the ho-rizon.
4 No information was available for Cyprus and Croatia. Therefore they are not displayed in the figure.
1996 1998 2000 2002 2004 2006 2008 2010 2012 2014
No change in LoA
GR
IT
SK
NL
LU BE
FI
PL
PT
SE
RO
SI
EE
MT
LT
DK
FR
ES
AT
LV
HU
UK
DE
BG
IE
CZChange in LoA
SWP-Berlin European Defence Monitoring January 2014
10
4. Capabilities
Large Quantities Still Available
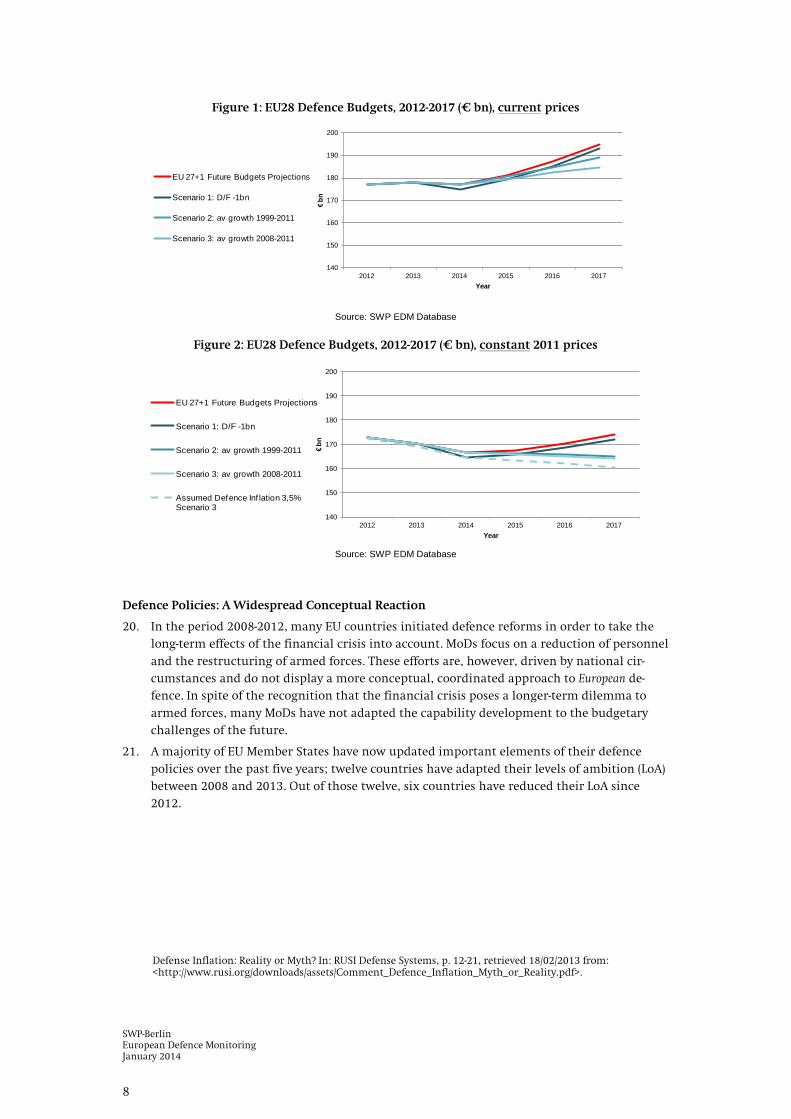
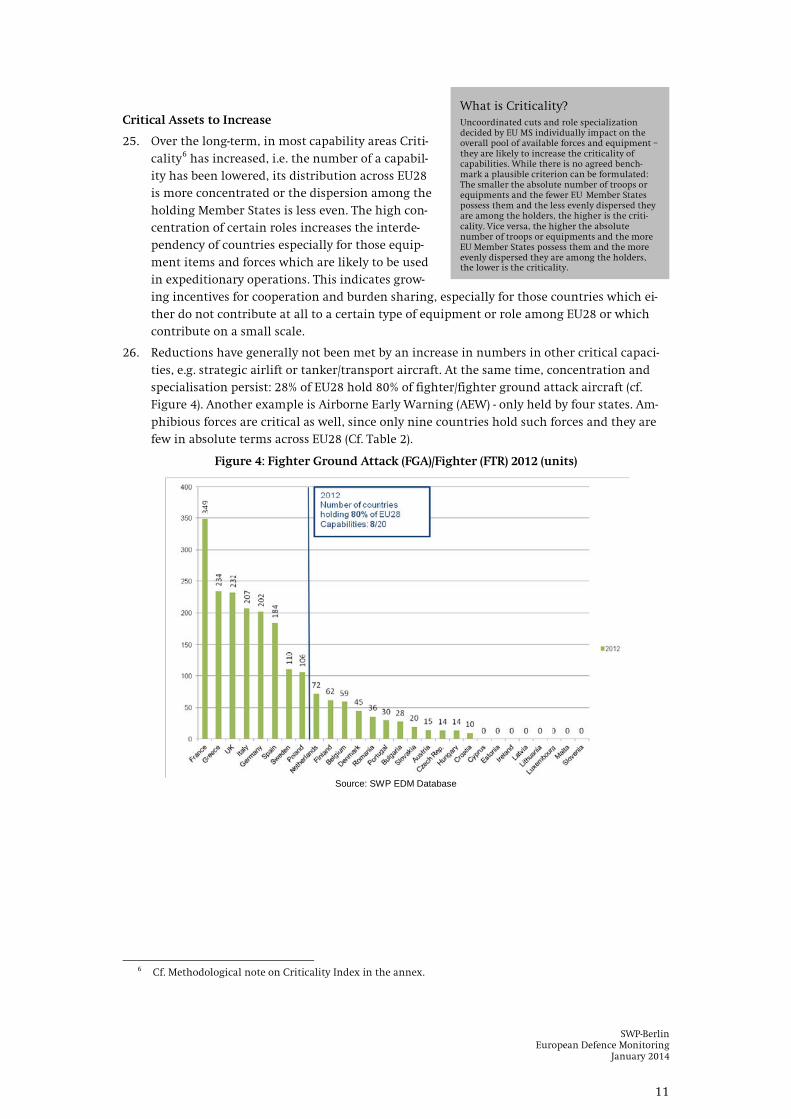
24. The legacy of the Cold War is still visible: Classical frontline equipment and roles are wide-spread and exist in highest quantities: As Table 1 shows, EU MS hold more than 32,000 ar-moured vehicles, more than 2,000 fighter aircraft, more than 2,700 helicopters, more than 130 large combat ships.
Table 1: Overview Equipment by Type (units)5
Source: EDM Database
5 *) These columns contain the number of EU28 countries that have fielded a certain equipment type. **) Figures for 1999 are very rough in terms of types and roles within the EDM Database. They serve as a base-
line for the analysis over time. We further have to note, that especially the data for 1999 is not able to say anything about operability of displayed units. It is unknown to which extend these units were able to oper-ate.
***) IISS Military Balance has changed their categorization of helicopter types over the period 1999-2012 (i.e. support helicopters are not listed at all anymore). Therefore, a comparison of data between 1999 and 2011/2012 is to be treated with circumspection. Figures do not include SAR helicopters.
1999** 2011 2012Change
2011-2012(%)
Change1999-2012
(%)1999 2011 2012
50,331 35,828 32,663 -8.8 -35.110,024 6,169 6,387 3.5 -36.3 19 19 20
APCAPC w heeled & tracked; PPV; ARV
24,676 23,602 21,058 -10.8 -14.7 26 26 26
15,631 6,057 5,218 -13.9 -66.6 23 22 22Aircraft 4,760 3,158 3,117 -1.3 -34.5
FGA; FTR 3,856 1,985 2,029 2.2 -47.4 21 20 20ATK 0 81 66 -18.5 0.0 0 3 3AEW; AEW&C 23 19 20 5.3 -13.0 3 4 4ELINT; EW; EW/SEAD; ISR 22 102 110 7.8 400.0 7 9 11
ASW; MP 99 92 84 -8.7 -15.2 7 7 8TPT 690 814 740 -9.1 7.2 23 26 27TKR; TKR/TPT 70 65 68 4.6 -2.9 5 7 7
Helicopters*** 3,146 2,648 2,776 4.8 -11.8 MRH; MRH/TPT; TPT 1,914 2,300 2,446 6.3 27.8 24 27 27ATK 1,232 348 330 -5.2 -73.2 17 13 12
Amphibious 582 434 491 13.1 -15.6Principal amphibious ships 18 18 19 5.6 5.6 5 5 5
LS(X), LC(X) 564 416 472 13.5 -16.3 13 14 14
2,307 1,928 2,369 22.9 2.7Principal surface combatants
Frigates; Destroyers; Aircraft Carriers 180 129 132 2.3 -26.7 12 13 13
Submarines SDV; Strategic SSBN; Tactical SSK; SSN; SSW
89 62 61 -1.6 -31.5 14 11 11
Mine w arfare / mine countermeasures
MC(X); MH(X); ML; MS(X) 272 194 194 0.0 -28.7 17 18 18
Patrol and coastal combatants
Corvettes; Patrol Boats; Patrol Crafts; Off-shore Patrol Vessels
1,457 1,002 1,220 21.8 -16.3 25 24 24
309 541 762 40.9 146.6 19 21 21UAS 57 107 119 11.2 108.8
All types 57 107 119 11.2 108.8 5 13 12
Distribution among EU28*
EU 28 n° of items
Maritime capacities
MBT
Maritime logistic & support
AIFV
Armoured capacities
Equipment type Specification
Change
SWP-Berlin European Defence Monitoring
January 2014
11
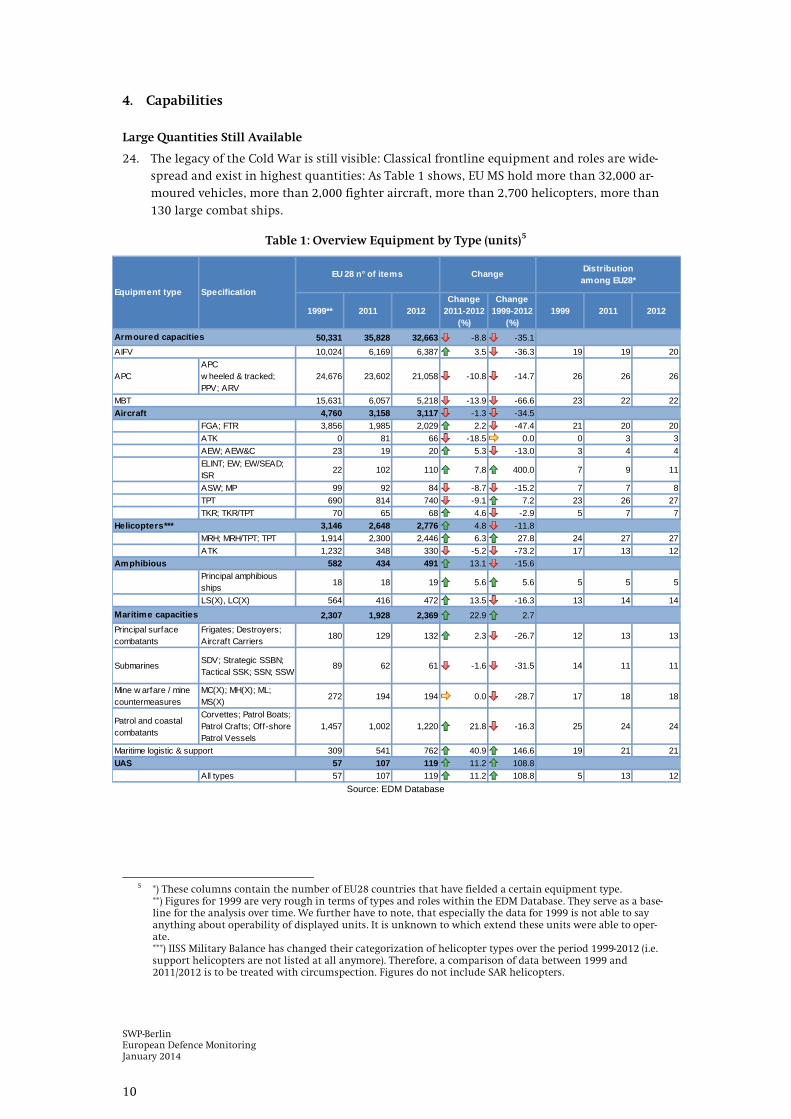
What is Criticality? Uncoordinated cuts and role specialization decided by EU MS individually impact on the overall pool of available forces and equipment –they are likely to increase the criticality of capabilities. While there is no agreed bench-mark a plausible criterion can be formulated: The smaller the absolute number of troops or equipments and the fewer EU Member States possess them and the less evenly dispersed they are among the holders, the higher is the criti-cality. Vice versa, the higher the absolute number of troops or equipments and the more EU Member States possess them and the more evenly dispersed they are among the holders, the lower is the criticality.
Critical Assets to Increase
25. Over the long-term, in most capability areas Criti-cality6
ity has been lowered, its distribution across EU28 has increased, i.e. the number of a capabil-
is more concentrated or the dispersion among the holding Member States is less even. The high con-centration of certain roles increases the interde-pendency of countries especially for those equip-ment items and forces which are likely to be used in expeditionary operations. This indicates grow-ing incentives for cooperation and burden sharing, especially for those countries which ei-ther do not contribute at all to a certain type of equipment or role among EU28 or which contribute on a small scale.
26. Reductions have generally not been met by an increase in numbers in other critical capaci-ties, e.g. strategic airlift or tanker/transport aircraft. At the same time, concentration and specialisation persist: 28% of EU28 hold 80% of fighter/fighter ground attack aircraft (cf. Figure 4). Another example is Airborne Early Warning (AEW) - only held by four states. Am-phibious forces are critical as well, since only nine countries hold such forces and they are few in absolute terms across EU28 (Cf. Table 2).
Figure 4: Fighter Ground Attack (FGA)/Fighter (FTR) 2012 (units)
Source: SWP EDM Database
6 Cf. Methodological note on Criticality Index in the annex.

SWP-Berlin European Defence Monitoring January 2014
12
Table 2: Overview Forces by Role 1999-2012 (CCE)7
Source: SWP EDM Database
27. Developments in forces by role (cf. Table 2) show that while there is a general trend towards decreasing availability of many roles such as armoured but also amphibious forces, recon-naissance (recce) and communications (comms) units have been built up significantly. Only a few countries have invested heavily into expanding highly deployable forces since the turn of the century. Air mobile and special forces recently saw an increase in total numbers. Nev-ertheless, the long-term development shows that the absolute number of units has de-creased by 22.8%. They are still critical due to their higher concentration: eight countries provide for 80% of EU28.
Modernisation Slow, Fragmentation Persistent
28. Against the expected development, the EU28 reduction of assets in Main Battle Tanks (MBT) does not go along with modernisation. The holdings for some countries are highly frag-mented with several different basis types of both modern and other MBTs.
Figure 5: Ratio Modern vs. Other MBT 2011/2012
2011 2012
Total: 6,057 Total: 5,218
Source: SWP EDM Database
7 CCE: Calculated Company Equivalent (Cf. Annex Para. 103).
Role
1999 2011 2012
Change2011-2012(%)
Change1999-2012(%)
1999 2011 2012
Highly Deployable 600 434 463 6.7 -22.8 26 32 33Air Mobile Forces+Special Forces 400 278 335 20.5 -16.3 17 21 22Amphibious F 200 156 128 -17.9 -36.0 9 11 11Other RolesArmoured (Inf. Cav., Recce)+Anti Tank 1,006 450 428 -4.9 -57.5 19 19 18Artillery (incl Mortars) 1,010 569 547 -3.9 -45.8 24 22 23Air to Ground:AH Helic, Air to Air + Air to Ground 314 245 236 -3.7 -24.8 20 20 19Comm's, C2 /incl EW) + ISR 264 398 391 -1.8 48.1 9 25 24Ground to Air /Air Defence 587 335 314 -6.3 -46.5 20 22 23Infantry (incl mech + mtn Inf) 3,768 2,135 1,965 -8.0 -47.9 27 28 28Recce/Cdo 128 224 208 -7.1 62.5 21 16 19Tactical Air Transp (incl H/C) + SAR 294 310 294 -5.2 0.0 19 23 23UAS 0 14 14 0.0 n.a. 0 4 4
Distribution among EU28
Number of Units EU 28 Change
Modern65%
Others35%
Modern64%
Others36%
Others
-244
Modern
-595

SWP-Berlin European Defence Monitoring
January 2014
13
Fragmentation A military capability is often delivered by a similar but not necessarily by the same type of equipment platform (basis type), thus making maintenance, repair and modernisation more expensive for every nation. Within the EU this fragmentation can span from twelve nations using four different attack helicopters to one nation using three different basis types of armoured personnel carriers. Fragmentation measures how many countries own how many different basis types of equip-ment. The light blue lines in Figure 6 indicate the ratio between the number of basis types of a certain equipment category (x-axis) and the number of countries (y-axis).
29. EU28 have more types than holders for Armoured Personnel Carriers (APC). They are an example of the high fragmentation of existing types and the lack of coordination among EU Member States (cf. Figure 6). In the period 2011/2012, tactical air transport and search & rescue (SAR), as well as air-to-ground and amphibious forces have been re-duced across the EU28.
Figure 6: Fragmentation of Equipment: Overview 2012
Source: SWP EDM Database
Cooperation: Opportunities to Grasp
30. Cooperation may, at least in the short-term, arrive more from user groups (states using the same type of equipment) than from political frameworks. Both currently operate in parallel realities. While user groups can offer cooperation opportunities down to maintenance, they seldom meet with political frameworks that allow for little more than coordination in com-bined operations. Exceptions are, to some extent, NORDEFCO and Visegrád countries for MBT and BENELUX for FGA/FTR.
AIFV
APC
MBT
FGA/FTR
ATK
AEW
ELINT, EW, EW/SEAD, ISR
ASW/MP
TPT AC
TKR/TPT Ac
MRH, MRH/TPT, TPT
ATK HEL
LS(X), LC(X)
Principal Amphibious Ships
Principal surface combatants
Submarines
Mine Warfare/Mine Countermeasures
TUAS, MALE
0
5
10
15
20
25
0 10 20 30 40 50 60 70 80
Num
ber o
f Cou
ntrie
s
Number of Basis Types
3:1
2:11:1
1:5
AC Aircraft AEW Airborne early warning AIFV Armoured infantry fighting vehicle APC Armoured personnel carrier
ASW/MP Anti-submarine warfare/Maritime Patrol
ATK Attack ATK Hel Attack Helicopter ELINT Electronic intelligence EW Electronic warfare
EW/SEAD Electronic warfare/supression of enemy air defence
FGA/FTR Fighter ground attack/fighter
ISR Intelligence, surveillance, reconnaissance
LC(x)/LS(x) Landing craft /ship MALE Medium-altitude long endurance MBT Main battle tank MRH, MRH/TPT Multi-role helicopter
TKR/TPT Tanker/Transport TPT Transport TUAS Tactical unmanned aerial system

SWP-Berlin European Defence Monitoring January 2014
14
Air Combat Operations Chain The air combat operation chain reflects those three capabilities needed for every modern type of air operation: Fighter / Fighter Ground Attack (FGA) Electronic Warfare (EW) Tanker and Transport Aircraft (TKR/TPT)
31. The air combat operation chain shows incentives for cooperation through dependence: The majority of countries can offer FGA/FTR. But if it comes to enablers for air operations – tankers and Elec-tronic Warfare (EW) capabilities – these countries need the bigger Member States or contributions of frameworks. Only they can make the chain solid (cf. Figure 7 below).
Figure 7: Air Combat Operations-Chain 2012
Source: SWP EDM Database
32. Another cooperation incentive derives from the unequal distribution of forces by role across EU28. The uneven distribution of roles and persistently high levels of traditional capabilities within individual countries suggest that the aim of defence transformation is not fully achieved. Three challenges and the individual answers to them will drive the future EU ca-pability portfolio: almost all states face resource consuming traditional structures and role conceptions for forces; for smaller states: specialisation should focus on areas in which countries can deliver added value in multinational cooperation; for bigger states: how to lower LoAs while keeping the right level and portfolio of forces.
33. The diverging challenges do not need to pose a problem as long as the answers to specialisa-tion and reduction in size lead to complementary structures. This would best be ensured by a coordinated approach by all EU countries. Isolated decisions may add less needed or re-dundant capabilities to the EU portfolio, turning resources into a waste rather than an in-vestment. EU partners will then become even more dependent on those capabilities that are really needed, but offered by ever fewer countries.
Fighter/Ground Attack
ElectronicWarfareAir-to-Air
Tanker FranceGermany
ItalySpain
SwedenUK
Netherlands
Austria DenmarkBelgium HungaryCroatia PolandCzech Rep. Slovakia
BulgariaFinlandGreece
PortugalRomania

SWP-Berlin European Defence Monitoring
January 2014
15
5. Procurement Prospects
Old Procurement Habits Persist
34. Europe will soon have modernized many of its major platforms - most contracts for major systems have already been signed, e.g. TPT aircraft, NH90 helicopters or AIFV. A very impor-tant exception is the new generation of UAS. The legacy of traditional procurement habits, which give preference to national industries, will obviously be maintained over the coming years. On the one hand, some projects have started decades ago and their procurement runs its course. But for new projects change can also not be identified. 64% of the documented projects are either domestic or multinational purchases, which regularly include juste re-tour arrangements for the buyers. Only 19% of the assessed 216 procurement contracts are signed with suppliers outside the EU (foreign non-EU) and 4% on a multinational non-EU ba-sis.
Table 3: Proportions of Procurement Projects along Supply Types
Supply Type % of total cases Nr of cases
Domestic/National 34% 73
Multinational EU 29% 64
Foreign EU 19% 41
Foreign non-EU 14% 30
Multinational non-EU 4% 8
TOTAL 100% 216
Source: SWP EDM Database
Specialisation – an Opportunity for Pooling and Sharing
35. Member States phase out or reduce in their procurement programmes in very disparate ways. Some countries choose to cut down procurement in several equipment types and to a certain extent. But they try to stick to the given width of capabilities or equipment type. Others specialize through their cuts and put modernisation on hold.
36. The demand for capabilities to be delayed, dismissed or reduced still exists. This may open up options for a more cost effective approach by pooling or sharing of equipment. Moderni-sation of individual countries’ arsenals should be weighed against such international op-tions. The frequency of delays and postponement opens windows of opportunities for both off-the-shelf solutions and P&S. The latter can be classified into two principal groups: pre-procurement and procurement. In pre-procurement, cooperation can focus on the pooling of demand. In procurement, the emphasis shifts towards the sharing of equipment and lo-gistics. As procurement implies existing contracts and cuts concern mainly existing mate-rial, cooperation or P&S has to concentrate on maintenance and operation.
Fighters: Cooperation in User Groups?
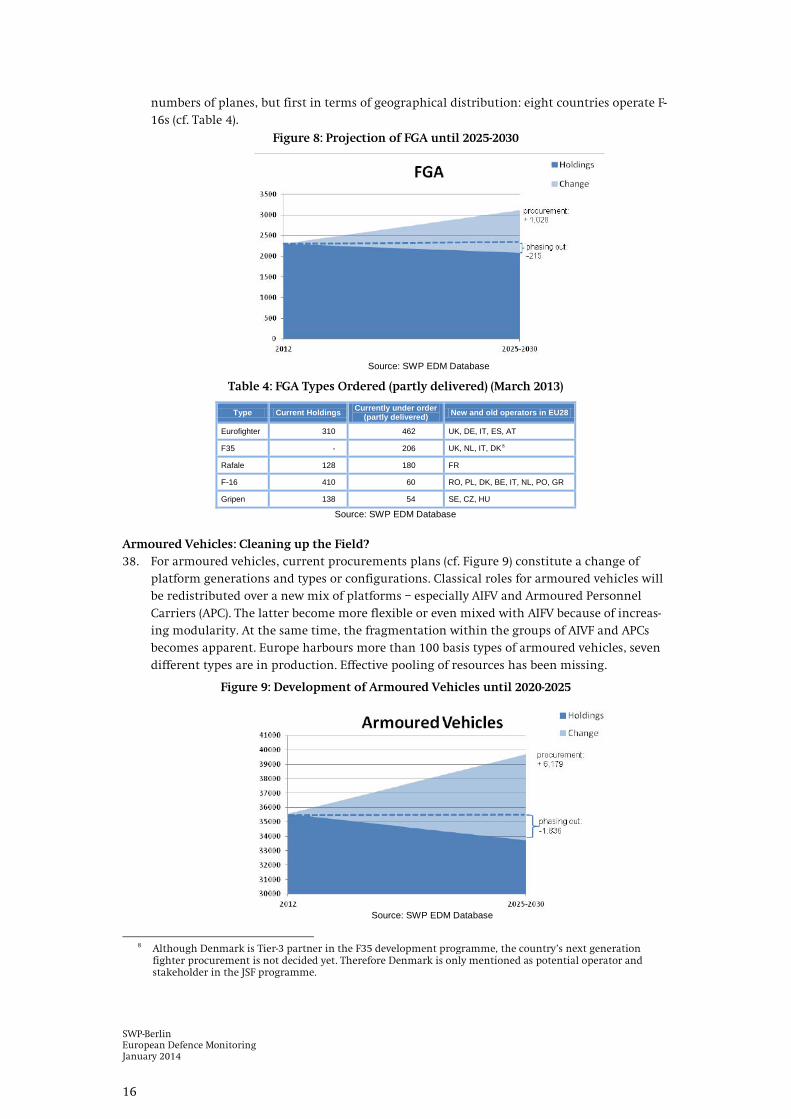
37. Once the current orders of FGA-jets are delivered around 2030, the EU28 will own about 3,100 FGA, an increase of 35%. This includes 1,028 fourth and fifth generation FGA aircraft more than before (cf. Figure 8). While the majority of fighter/ground attack aircraft are European, the US-defence industry will maintain a serious presence within the EDTIB for the next 30 years with the incoming F-35 Lightning. While Eurofighter will create the big-gest fleet with about 460 planes, all F-35 sum up to 206 airplanes. With a total number of 454 planes the US-built F-16 family ranks second after the Eurofighters in terms of total
SWP-Berlin European Defence Monitoring January 2014
16
numbers of planes, but first in terms of geographical distribution: eight countries operate F-16s (cf. Table 4).
Figure 8: Projection of FGA until 2025-2030
Source: SWP EDM Database
Table 4: FGA Types Ordered (partly delivered) (March 2013)
Type Current Holdings Currently under order (partly delivered) New and old operators in EU28
Eurofighter 310 462 UK, DE, IT, ES, AT
F35 - 206 UK, NL, IT, DK8
Rafale
128 180 FR
F-16 410 60 RO, PL, DK, BE, IT, NL, PO, GR
Gripen 138 54 SE, CZ, HU
Source: SWP EDM Database
Armoured Vehicles: Cleaning up the Field? 38. For armoured vehicles, current procurements plans (cf. Figure 9) constitute a change of
platform generations and types or configurations. Classical roles for armoured vehicles will be redistributed over a new mix of platforms – especially AIFV and Armoured Personnel Carriers (APC). The latter become more flexible or even mixed with AIFV because of increas-ing modularity. At the same time, the fragmentation within the groups of AIVF and APCs becomes apparent. Europe harbours more than 100 basis types of armoured vehicles, seven different types are in production. Effective pooling of resources has been missing.
Figure 9: Development of Armoured Vehicles until 2020-2025
Source: SWP EDM Database
8 Although Denmark is Tier-3 partner in the F35 development programme, the country’s next generation
fighter procurement is not decided yet. Therefore Denmark is only mentioned as potential operator and stakeholder in the JSF programme.
SWP-Berlin European Defence Monitoring
January 2014
17
6. EDTIB: A European Vision – Waiting for Implementation
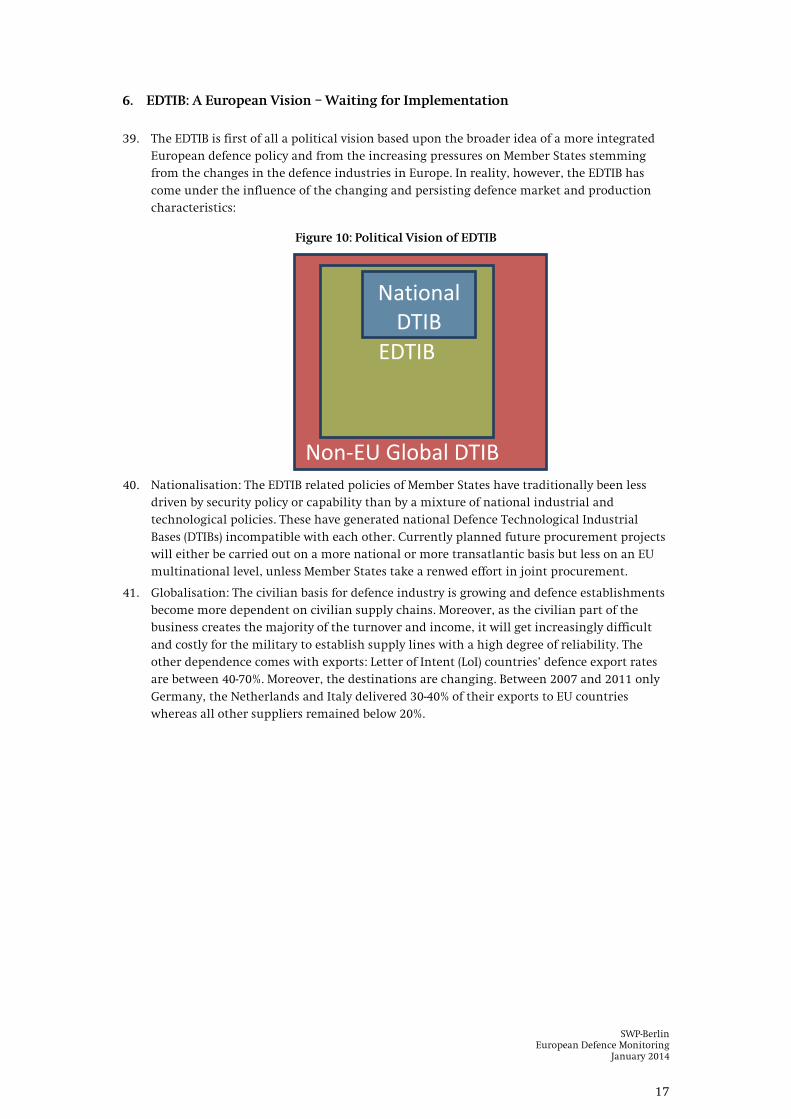
39. The EDTIB is first of all a political vision based upon the broader idea of a more integrated European defence policy and from the increasing pressures on Member States stemming from the changes in the defence industries in Europe. In reality, however, the EDTIB has come under the influence of the changing and persisting defence market and production characteristics:
Figure 10: Political Vision of EDTIB
40. Nationalisation: The EDTIB related policies of Member States have traditionally been less
driven by security policy or capability than by a mixture of national industrial and technological policies. These have generated national Defence Technological Industrial Bases (DTIBs) incompatible with each other. Currently planned future procurement projects will either be carried out on a more national or more transatlantic basis but less on an EU multinational level, unless Member States take a renwed effort in joint procurement.
41. Globalisation: The civilian basis for defence industry is growing and defence establishments become more dependent on civilian supply chains. Moreover, as the civilian part of the business creates the majority of the turnover and income, it will get increasingly difficult and costly for the military to establish supply lines with a high degree of reliability. The other dependence comes with exports: Letter of Intent (LoI) countries’ defence export rates are between 40-70%. Moreover, the destinations are changing. Between 2007 and 2011 only Germany, the Netherlands and Italy delivered 30-40% of their exports to EU countries whereas all other suppliers remained below 20%.
Non-EU Global DTIB
EDTIB
National DTIB

SWP-Berlin European Defence Monitoring January 2014
18
Figure 11: Status Quo
42. Given the current trends it seems likely that the European DTIB is trapped between the
national and global DTIB developments: The European demand is in decline. National de-mand is declining as well, whilst global demand is growing, pointing towards further glob-alisation of the DTIBs by market shifts and the internationalisation of production. As a con-sequence, the EDTIB would shrink even more and the national DTIBs would become more integrated into the global DTIB. Purely national DTIBs will become increasingly more diffi-cult to sustain.
Figure 12: Potential Future
Government Industry Relations and Domestic DTIB: Continued Nationalization
43. The DTIBs of LoI countries9 and Poland employ about 520,000 people. This only represents 0,024% of all employees in EU Member States.10 The LoI countries and Poland’s turnover may well account for 90% of the defence (industrial) turnover: roughly €81 bn.11
9 France, Germany, Italy, Spain, Sweden and the UK.
10 EUROSTAT: Key figures on European business, p. 34: Non-financial business economy <http://epp.eurostat.ec.europa.eu/cache/ITY_OFFPUB/KS-ET-11-001/EN/KS-ET-11-001-EN.PDF>.
11 This subchapter has significantly benefitted from the input of the peer institutes SWP cooperates with in the EDM Project.
Non-EU Global DTIB
EDTIB
National DTIBs
Globalisation Nationalisation

SWP-Berlin European Defence Monitoring
January 2014
19
44. While the European Commission has, in its defence package, introduced important regula-tory conditions in the defence market, all LoI countries still put their national DTIB first. The British, who build their carrier at home to give jobs to a structurally problematic region in the UK; or the Swedish who are considering buying a new version of Gripen to keep the national production line up, even if this takes up most of the defence budget.
45. As long as the product can be produced nationally, LoI states procure the vast majority of defence goods at home. The national DTIB has a strategic dimension for all Lol countries. This implies the idea of security of supply. Governments continue to orientate their deci-sion-making towards national capacities in technology and industry. Especially for France and the UK, the national defence industry represents a key sector that has a beneficial im-pact on the entire national economy.
46. The DTIBs show very different characteristics with almost no area where two DTIBs have a high degree of commonality: While France, Germany and the UK all have a very dispersed and broadly developed DTIB, France harbours national champions, German land and naval sectors show perpetuated duopolies and the UK has traditionally internationalized widely, having several major international companies. In terms of company size, the French and British companies are comparable, while German companies are less close. Italy plays in the same league as Germany, France and the UK, but has two major prime companies which are also government controlled: Finmeccanica and Fincantieri. The smaller defence industrial players (Spain, Poland, and Sweden) have similar integration structures: they have one ma-jor company at the prime contractor/system integrator level. In addition, all LoI states have diverging perceptions on the utility of state influence in the defence industry. They have hence organized their government-industry relations very differently.
Industrial Consolidation and Concentration
47. Political and industrial reasons are impacting on the consolidation as a key to more effi-ciency in EU defence industrial matters. For all industrial capabilities and competences, there are regional or national centres, but no European ones. Politically, especially mergers have a rough going due to diverging national industrial conceptions, as highlighted by the failed EADS-BAE Systems merger. At the same time market processes lead to a deconcentra-tion of defence industrial activities especially in the US - big is no longer always beautiful. However, there is still room for Mergers & Acquisitions especially in Europe’s land and naval domains. Neither is the financial situation for individual companies in Europe improving nor is cross border integration gaining ground. Europe may see a further shrinking of the EDTIB since domestic consolidation into national champions prevents further Europeaniza-tion and acquisitions of niche companies by US- buyers take away a European strength.
Multiple Industrial Dependencies: More Global Dependencies than ever
48. Dependencies are often understood as a one- dimensional issue in which the state wants to keep a national industrial base in order to remain militarily independent. This ignores that industries themselves have developed multifaceted (inter-)dependencies that undermine the perception of a purely national industrial base.
SWP-Berlin European Defence Monitoring January 2014
20
Import Dependencies: The Example of Non-European Semiconductors
49. Globalized supply chains have made industries dependent on imports of technologies, com-ponents and material. These import dependencies increasingly reach beyond Europe and thus challenge the concept of the EDTIB as the future basis for security of supply (SoS).
50. While semiconductors and advanced radio frequency (RF) products play a key role in de-fence electronics, this is another area where Europe’s domestic supply has been in a state of slow decline since the mid-nineties. Europe’s monthly production capacity of commercial wafers and integrated circuits was surpassed by China in 2007, making Europe the lowest-producing region in the world. The massive growth of production in China, South Korea, and Taiwan has made East Asia the new manufacturing powerhouse of the commercial market for RF devices and microcomputers.
51. At the same time, such a regional concentration of production capability among very few suppliers can itself pose a serious risk to SoS. Natural disasters in 2011 (the tsunami in Japan and floods in Thailand) have almost halted the global production of semi-conductors and hard drives. ‘Western’ industry, many of them suppliers of defence equipment, quickly ran out of supply. This has forced civilian and military companies to rethink their just-in-time supply strategies on special components from Asia. The U.S. and Japan have led investments in sub-1/4-micron gallium-nitride (GaN), which is said to be the core of next-generation semiconductors. Once they reach a point of scalable production, they will most likely reap the benefits of broad demand among defence customers for the material’s application in EW and Improvised Explosive Device (IED) jammers as well as radiation-hardened satellite communication (SATCOM). As a result, Europe’s defence titans will have to rely heavily on U.S. semiconductor companies in order to remain competitive in these very critical seg-ments of the aerospace and defence (A&D) market.
52. The challenges of semiconductor supply in Europe also extend further upstream, where European wafer suppliers face two supply challenges of their own. First, leadership in ad-vanced semiconductors is dependent on a steady supply of raw materials. Gallium in par-ticular will likely become more expensive as demand for it grows among semiconductor suppliers. Also, much of the metal will come from mining facilities in China and parts of Central Asia, creating some potentially thorny resource security issues.12
Export Dependencies: Non-European Life-lines
53. Moreover, industries are dependent on exports. While the key defence industrial countries within the EU export at least half of the goods, 60-90% of these go to non-EU destinations. Due to the decline of domestic demand, there is an increasing need to boost exports to en-sure that production lines operate at full capacity and to maintain competitive per-unit prices via economies of scale. Thus, the shrinking markets in the EU have pushed the Euro-pean defence companies to look beyond Europe and to globalise their commercial strate-gies. Most national DTIBs considered in this study now mostly rely on foreign markets to survive. This tendency is likely to continue as long as investments in the domestic markets do not increase significantly. All top companies have successfully accessed new target mar-kets. While these companies may have their headquarters in Europe, they have long out-grown the European market and hence EU states as (main) customers. This is a trend that smaller companies increasingly follow.
12 Archer, J. (April 2013): “A Reality Check for the U.S. Semiconductor Industrial Base”, CSIS Washington no. 32,
p. 2.
SWP-Berlin European Defence Monitoring
January 2014
21
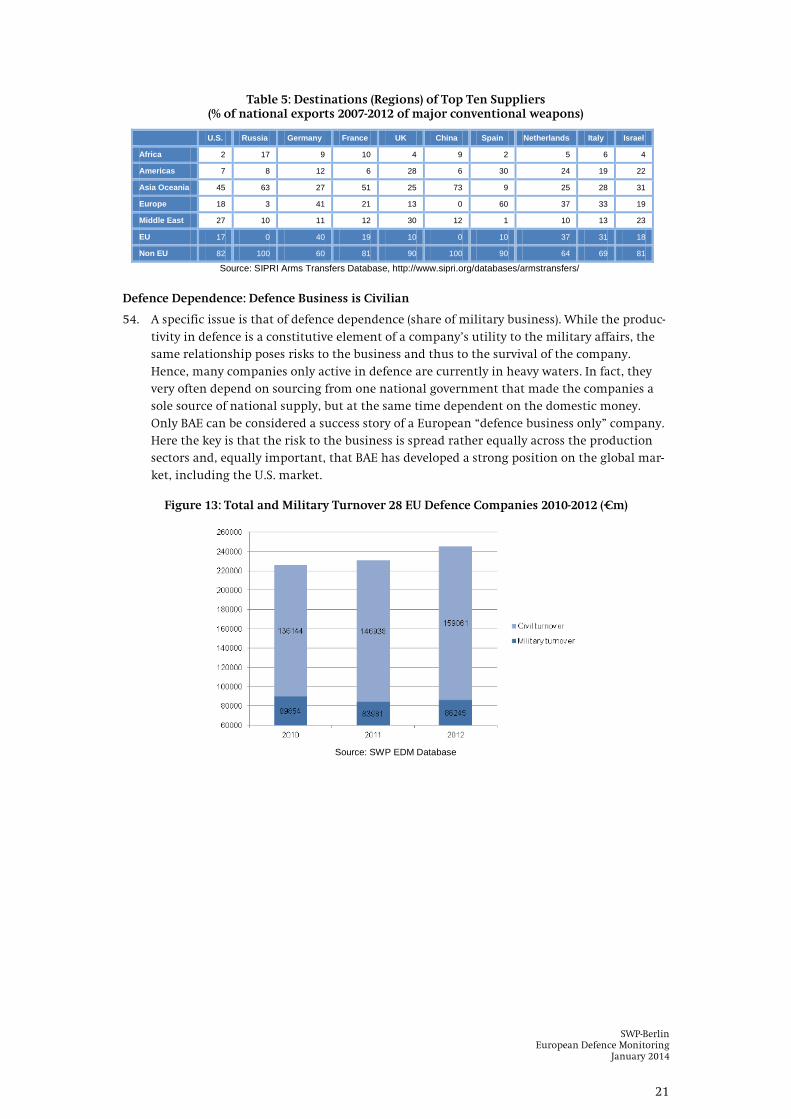
Table 5: Destinations (Regions) of Top Ten Suppliers (% of national exports 2007-2012 of major conventional weapons)
U.S. Russia Germany France UK China Spain Netherlands Italy Israel
Africa 2 17 9 10 4 9 2 5 6 4
Americas 7 8 12 6 28 6 30 24 19 22
Asia Oceania 45 63 27 51 25 73 9 25 28 31
Europe 18 3 41 21 13 0 60 37 33 19
Middle East 27 10 11 12 30 12 1 10 13 23
EU 17 0 40 19 10 0 10 37 31 18
Non EU 82 100 60 81 90 100 90 64 69 81
Source: SIPRI Arms Transfers Database, http://www.sipri.org/databases/armstransfers/
Defence Dependence: Defence Business is Civilian
54. A specific issue is that of defence dependence (share of military business). While the produc-tivity in defence is a constitutive element of a company’s utility to the military affairs, the same relationship poses risks to the business and thus to the survival of the company. Hence, many companies only active in defence are currently in heavy waters. In fact, they very often depend on sourcing from one national government that made the companies a sole source of national supply, but at the same time dependent on the domestic money. Only BAE can be considered a success story of a European “defence business only” company. Here the key is that the risk to the business is spread rather equally across the production sectors and, equally important, that BAE has developed a strong position on the global mar-ket, including the U.S. market.
Figure 13: Total and Military Turnover 28 EU Defence Companies 2010-2012 (€m)
Source: SWP EDM Database
SWP-Berlin European Defence Monitoring January 2014
22
The Sectoral Picture: Aerospace, Land, Naval and Electronics
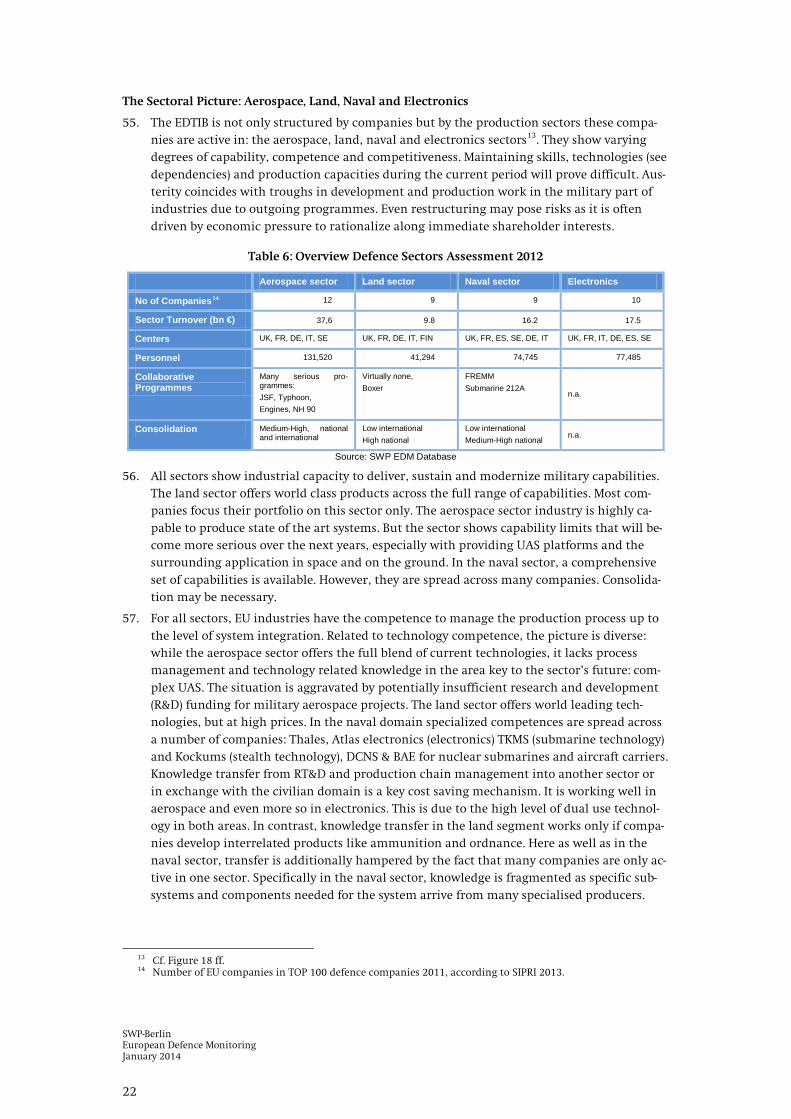
55. The EDTIB is not only structured by companies but by the production sectors these compa-nies are active in: the aerospace, land, naval and electronics sectors13
Table 6: Overview Defence Sectors Assessment 2012
. They show varying degrees of capability, competence and competitiveness. Maintaining skills, technologies (see dependencies) and production capacities during the current period will prove difficult. Aus-terity coincides with troughs in development and production work in the military part of industries due to outgoing programmes. Even restructuring may pose risks as it is often driven by economic pressure to rationalize along immediate shareholder interests.
Aerospace sector Land sector Naval sector Electronics
No of Companies14 12 9 9 10
Sector Turnover (bn €) 37,6 9.8 16.2 17.5
Centers UK, FR, DE, IT, SE UK, FR, DE, IT, FIN UK, FR, ES, SE, DE, IT UK, FR, IT, DE, ES, SE
Personnel 131,520 41,294 74,745 77,485
Collaborative Programmes
Many serious pro-grammes: JSF, Typhoon, Engines, NH 90
Virtually none, Boxer
FREMM Submarine 212A
n.a.
Consolidation Medium-High, national and international
Low international High national
Low international Medium-High national n.a.
Source: SWP EDM Database
56. All sectors show industrial capacity to deliver, sustain and modernize military capabilities. The land sector offers world class products across the full range of capabilities. Most com-panies focus their portfolio on this sector only. The aerospace sector industry is highly ca-pable to produce state of the art systems. But the sector shows capability limits that will be-come more serious over the next years, especially with providing UAS platforms and the surrounding application in space and on the ground. In the naval sector, a comprehensive set of capabilities is available. However, they are spread across many companies. Consolida-tion may be necessary.
57. For all sectors, EU industries have the competence to manage the production process up to the level of system integration. Related to technology competence, the picture is diverse: while the aerospace sector offers the full blend of current technologies, it lacks process management and technology related knowledge in the area key to the sector’s future: com-plex UAS. The situation is aggravated by potentially insufficient research and development (R&D) funding for military aerospace projects. The land sector offers world leading tech-nologies, but at high prices. In the naval domain specialized competences are spread across a number of companies: Thales, Atlas electronics (electronics) TKMS (submarine technology) and Kockums (stealth technology), DCNS & BAE for nuclear submarines and aircraft carriers. Knowledge transfer from RT&D and production chain management into another sector or in exchange with the civilian domain is a key cost saving mechanism. It is working well in aerospace and even more so in electronics. This is due to the high level of dual use technol-ogy in both areas. In contrast, knowledge transfer in the land segment works only if compa-nies develop interrelated products like ammunition and ordnance. Here as well as in the naval sector, transfer is additionally hampered by the fact that many companies are only ac-tive in one sector. Specifically in the naval sector, knowledge is fragmented as specific sub-systems and components needed for the system arrive from many specialised producers.
13 Cf. Figure 18 ff. 14 Number of EU companies in TOP 100 defence companies 2011, according to SIPRI 2013.

SWP-Berlin European Defence Monitoring
January 2014
23
58. Competitiveness: The competitiveness of all sectors shows strengths (quality, technology) and weaknesses (price). Europe offers high quality production and cutting edge technology and systems. However, products come at a very high price. This is because the price is a po-litical price: Member States often prioritize national over efficient purchase, thus accepting higher per unit costs or less than optimal effectiveness of the equipment. Competition among European suppliers as well as specialisation and consolidation face national barriers to non-domestic bidders. Governments have missed the opportunity in the 1980s and 1990s to use competition in Europe when they allowed three similar combat aircraft to be devel-oped. As a consequence, they now find themselves in fratricidal competition on the global market.
59. Governments and Industries hope to lower the price by exports. However, to win the compe-tition on world markets European companies have to compensate for the nationally gener-ated high prices by side deals (offsets). These regularly include technology transfer. However, with shrinking RT&D budgets technology transfer turns into a threat to European defence industries. It cannot uphold technological cutting edge as the resources to reinvest into technology are diminishing.
60. This problem appears especially in the naval industries, which have a very specialized mar-ket with only a few export segments. This is similar to the aerospace sector, where the U.S. companies realize huge economies of scale especially in the fighter segment. However, companies in this segment regularly participate in the international production chain on the civilian and military side, thus increase their competitiveness by learning. For the naval sector there is not only a high number of companies but also a sharp decline in demand coming up, further increasing the excess capacities. Companies or their (state-) customers have to pay for this. The land systems sector seems to be an area where the export markets can still absorb excess capacities.
61. Successful examples of European suppliers that manage to be very competitive in an ex-panding market without systematic offsets can be found in the area of helicopters and jet engines.

SWP-Berlin European Defence Monitoring January 2014
24
Figure 14: Illustration: Sectoral Assessment
Every diagram possesses information in three dimensions: The absolute turnover of the respective company in the respective sector in million EUR, expressed by both the number under the company name and the size of the bubble. The share of the company’s sector turnover on its total defence turnover, expressed by the position of the bubble on the vertical axis. The size of the market share of different companies, expressed by the relation of the bubble’s sizes. From left to right are market leaders to smaller market actors displayed.
The Land Sector15
62. Europe has about a dozen important companies in the land armament sector. Apart from Bumar, Iveco and Oto Melara, they are all listed among the SIPRI Top 100 defence compa-nies. The main production centres are in the UK, Germany and France. The main suppliers are BAE Systems and Rheinmetall (38% and 17% of the 2012 turnover). However, besides these big players, also much smaller companies like Krauss-Maffei Wegmann (KMW), Nexter and Patria (8-6% of the sector’s turnover) play a role as system integrators.
Land Sector
Cap
aciti
es Deliver, sustain and modernize military ca-
pabilities key to land warfare: including highly specialized productions. Major industrial capabilities concentrated in Germany, the UK and France.
Figure 15: EU Companies in Land Sector: Relative Sector Size
Com
pete
nces
Manage the production process including the system integration. World leading technologies. Knowledge transfer among the land sector relevant technologies: vehicles, ammunition. But limited transfer into civilian domain.
Com
petit
ive-
ness
Large number of exports across the globe. Too many producers with very small produc-tion lots. At the same time the markets are nationalized. Hence there is no competition among the producers on the EU markets but on the export markets.
Source: SWP EDM Database
15 Structure and variables of assessment are sourced by Bekkers, F. et al. (2009): “Development of a European De-
fence Technological and Industrial Base”, Main Report, <http://ec.europa.eu/enterprise/sectors/defence/files/edem_final_report_en.pdf>, retrieved 24.09.2013; Ikei/Industri All (November 2012): “Study on the Perspectives of the European Land Armament Sector, Final Summary Report”, Donostia-San Sebastian.
BAE Systems3,736
Rheinmetall1,703
Krauss-Maffei Wegmann
1,021
Chemring Group821
Nexter818
Patria552
Finmeccanica547
Diehl450
Thales180
0%
20%
40%
60%
80%
100%
Shar
e of
Tot
al M
il. T
urno
ver (
%)
Turnover in Land Sector (m €)

SWP-Berlin European Defence Monitoring
January 2014
25
The Aerospace Sector
63. The aerospace sector comprises five major system integrators: EADS, BAE, Finmeccanica, Dassault and Saab. There are also several important companies, which have specialised in components, such as Thales, Diehl, GKN and Chemring. The regional centres are the UK, It-aly and France. Moreover, EADS offers the important case of a trans-European company with a major footprint on Germany. Substantial parts of industrial capabilities are tied to na-tional sovereignty or industrial policy, e.g. Cassidian, Dassault, and Saab. There are even three companies - Dassault, Saab, Patria – which primarily support national demand.
64. The sector is an amalgamation of interlinked subsectors: fixed wing aircraft, helicopters, missiles, space and engines. Europe has inter alia two very strong companies in the special segment of helicopters, with Eurocopter and AgustaWestland. Both are under the roof of two major system integrators: EADS and Finmeccanica. This points towards a company structure within the European aerospace sector which is often very complex, with produc-tion elements in different branches.
65. Aerospace firms represent eight of the world’s top 10 defence companies. EU and U.S. aero-space companies only marginally differ in size. While BAE, EADS and Finmeccanica can keep up with their U.S. counterparts in sales and production, the smaller companies in Europe are smaller than their U.S. counterparts.
66. In terms of turnover, aerospace is the leading defence sector in the EU. In 2012, the turnover was €37.6bn, almost the same as in 2011. While European companies have managed to re-duce the gap between them and U.S. counterparts, there are still considerable opportunities for creating larger EU aerospace firms. For example, in the aero-engine sector both Rolls-Royce’s and SAFRAN’s arms sales are comparable to their U.S. rivals but the German and Italian engine companies (MTU and Avio) are smaller than their U.S. competitors.
Aerospace Sector
Cap
aciti
es
Deliver, sustain and modernize military capa-bilities limited to modern combat aircraft, strategic airlift and air tanker and important subsystems like missiles, engines. Serious capability gap when it comes to UAS, EU endogenous 5th generation aircraft (JSF-equal), strategic bombers, inter-continental ballistic missiles and anti-ballistic missile defence systems. Substantial parts of industrial capabilities exist due to national sovereignty or industrial policy
Figure 16: EU Companies in Aerospace Sector: Relative Sector Size
Com
pete
nces
Manage the production process including the system integration. Competent to deliver cutting-edge technology in the areas listed above. In UAS the sector is seriously lagging behind competitors Concerns about the future levels of R&D funding for the military aerospace sector and its continued national rather than EU-focus. Transfer of knowledge into other sectors is easily possible for almost all companies.
Com
petit
iven
ess
The industry has some world-class firms which participate in international production The competitiveness picture of the sector is rather mixed. Helicopters missiles and en-gines are strong on exports combat aircraft have a hard time struggling against US domi-nance Competitiveness suffers significantly due to the lesser economies of scale European producers generate due to small production lots.
Source: SWP EDM Database
EADS10,836
BAE Systems7,867
Finmeccanica6,017 Thales
4,434
Rolls-Royce3,963
Dassault Aviation1,144
Saab1,068
Cobham695
GKN639
Avio (Cinven)565
Diehl291
Patria110
0%
20%
40%
60%
80%
100%
Shar
e of
Tot
al M
il. T
urno
ver (
%)
Turnover in Aerospace Sector (m €)

SWP-Berlin European Defence Monitoring January 2014
26
The Naval Sector
67. The European naval sector comprises nine major companies: seven of them are system integrators BAE, DCNS, Babcock/VT, TKMS, Navantia, Fincantieri and Thales. There are also smaller companies in the Netherlands (Thales/Royal Schelde), Sweden (Kockums)16
68. The turnover in the naval sector as increased over the past two years. The 2012 turnover was €16.2bn. In 2011, the combined turnover of shipyards in the EU was €14.9bn which again was a slight increase of €0.5bn compared to 2010. Almost 75,000 personnel work for the top companies in the naval sector in Europe. The naval sector spends somewhat more on R&D than the land sector (about 10% of turn-over).
and in Greece. These are to a large extent involved only in maintenance or national licence production of foreign designs. Therefore, the re-gional centres are the UK, France, Italy, Germany and Spain. Except for the UK and Germany (in some respect), there is only one big naval shipyard left in each of the regional centres. EU countries also have a large number of small repair shipyards. The U.S. is the centre of global naval industries. The turnover in the U.S. is about five times bigger than in Europe.
Naval Sector
Cap
aciti
es
Deliver, sustain and modernize naval capa-bilities up to complex weapons systems Supplying industry is competent in producing important components like torpedoes, guns and sonars but also radar and combat man-agement systems. France and the UK are leading the sector Large excess capacity and too many small companies, the skills/specialisations are duplicated many times, while a competition is not taking place.
Figure 17: EU Companies in Naval Sector: Relative Sector Size
Com
pete
nces
Manage the production process including the system integration. Competences for specialized components may be distributed among very few compa-nies like Thales, Atlas electronics etc. Specific competences exist with TKMS (sub-marine technology) and Kockums (stealth technology), DCNS & BAE for nuclear sub-marines and aircraft carriers. The ability to transfer knowledge among sectors only exists for BAE.
Com
petit
iven
ess
Large number of exports. Especially Ger-many and France with modestly priced prod-ucts. Missing competitiveness of products has been balanced by offsets and technology transfer. Many national shipyards only supply national demand and have no export products. No export market for huge systems like warships and aircraft carriers.
Source: SWP EDM Database
16 Kockums designed (or is in the process of) the Visby-class corvette and the A26 submarine; Damen (NDL) designed and
produced the very competitive SIGMA-class corvettes, the Holland-class OPVs as well as Joint Support Ships. These com-panies may be small, but have a larger portfolio than only doing licence production or maintenance.
BAE Systems5,818
DCNS2,930
Babcock Int. Group2,271
Thales1,488
ThyssenKrupp1,187
Fincantieri1,005
Navantia872
Finmeccanica328
Saab298
0%
20%
40%
60%
80%
100%
Shar
e of
Tot
al M
il. T
urno
ver (
%)
Turnover in Naval Sector (m €)

SWP-Berlin European Defence Monitoring
January 2014
27
The Electronics Sector
69. The European electronics sector comprises five major companies: BAE, Finmeccanica, Safran, EADS and Thales. There are also smaller companies in the UK (Cobham and Ultra Electronics), Sweden (Saab), Germany (Rheinmetall) and Spain (Indra). Due to the presence of EADS as a transnational com-pany, the main regional centres are the UK, France, Italy, Germany and Spain.
70. The turnover in the sector increased slightly from €17bn in 2011 to €17.5bn in 2012. About 77,000 people are working in this sector. The expenditure on military R&D is difficult to estimate. This is be-cause of the two most important features of this sector: its high dual-use capacity and the fact that through the still ongoing information technology (r)evolution, electronics is by design the cross-cutting element of today’s defence industrial products. At the same time, there have only been a few studies that assessed electronics as part of defence and supposedly none that did so in the context of EDTIB.
Electronics17 Sector
Cap
aciti
es
Deliver, sustain and modernize highest qual-ity products and components be it air defence systems, radar, sonar, avionics but also C4I elements. Regional concentration in Western Europe.
Figure 18: EU Companies in Electronics Sector: Relative Sector Size
Com
pete
nces
System integrators have acquired the neces-sary level of competence to deal with de-fence electronics as a cross cutting technol-ogy. Some may outsources part of this to specialized companies. Transfer of knowledge into other sectors or into the civilian domain is easily possible for almost all companies.
Com
petit
iven
ess
Serious number of exports Competitiveness seems to exist but Euro-pean companies may have to struggle to close the gap between the traditional defence electronics and new applications that arrive from the link between civilian/security and military spheres.
Source: SWP EDM Database
17 The assessment of the electronics sector is based on a rather small amount of data available.
Safran4,339
Finmeccanica4,048
BAE Systems3,345
EADS1,148
Thales1,062
Saab918
Cobham776
Rheinmetall748
Ultra Electronics610
Indra471
0%
20%
40%
60%
80%
100%
Shar
e of
Tot
al M
il. T
urno
ver (
%)
Turnover in Electronics Sector (m €)
SWP-Berlin European Defence Monitoring January 2014
28
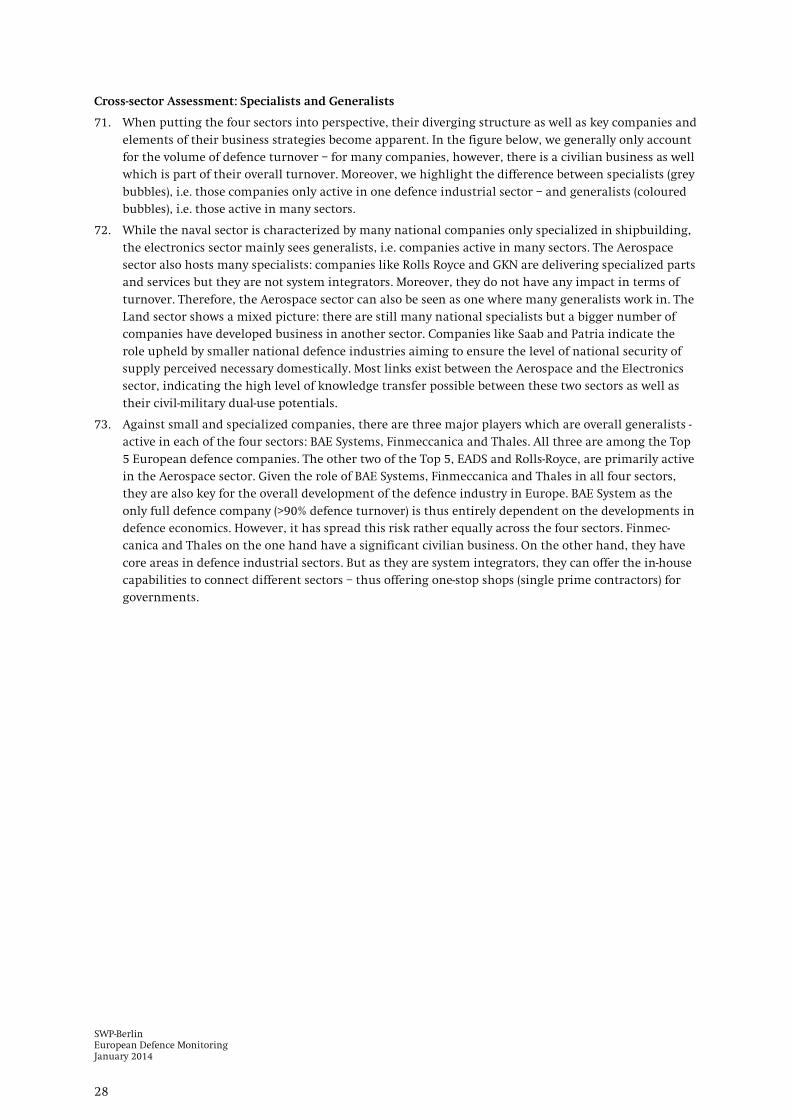
Cross-sector Assessment: Specialists and Generalists
71. When putting the four sectors into perspective, their diverging structure as well as key companies and elements of their business strategies become apparent. In the figure below, we generally only account for the volume of defence turnover – for many companies, however, there is a civilian business as well which is part of their overall turnover. Moreover, we highlight the difference between specialists (grey bubbles), i.e. those companies only active in one defence industrial sector – and generalists (coloured bubbles), i.e. those active in many sectors.
72. While the naval sector is characterized by many national companies only specialized in shipbuilding, the electronics sector mainly sees generalists, i.e. companies active in many sectors. The Aerospace sector also hosts many specialists: companies like Rolls Royce and GKN are delivering specialized parts and services but they are not system integrators. Moreover, they do not have any impact in terms of turnover. Therefore, the Aerospace sector can also be seen as one where many generalists work in. The Land sector shows a mixed picture: there are still many national specialists but a bigger number of companies have developed business in another sector. Companies like Saab and Patria indicate the role upheld by smaller national defence industries aiming to ensure the level of national security of supply perceived necessary domestically. Most links exist between the Aerospace and the Electronics sector, indicating the high level of knowledge transfer possible between these two sectors as well as their civil-military dual-use potentials.
73. Against small and specialized companies, there are three major players which are overall generalists - active in each of the four sectors: BAE Systems, Finmeccanica and Thales. All three are among the Top 5 European defence companies. The other two of the Top 5, EADS and Rolls-Royce, are primarily active in the Aerospace sector. Given the role of BAE Systems, Finmeccanica and Thales in all four sectors, they are also key for the overall development of the defence industry in Europe. BAE System as the only full defence company (>90% defence turnover) is thus entirely dependent on the developments in defence economics. However, it has spread this risk rather equally across the four sectors. Finmec-canica and Thales on the one hand have a significant civilian business. On the other hand, they have core areas in defence industrial sectors. But as they are system integrators, they can offer the in-house capabilities to connect different sectors – thus offering one-stop shops (single prime contractors) for governments.
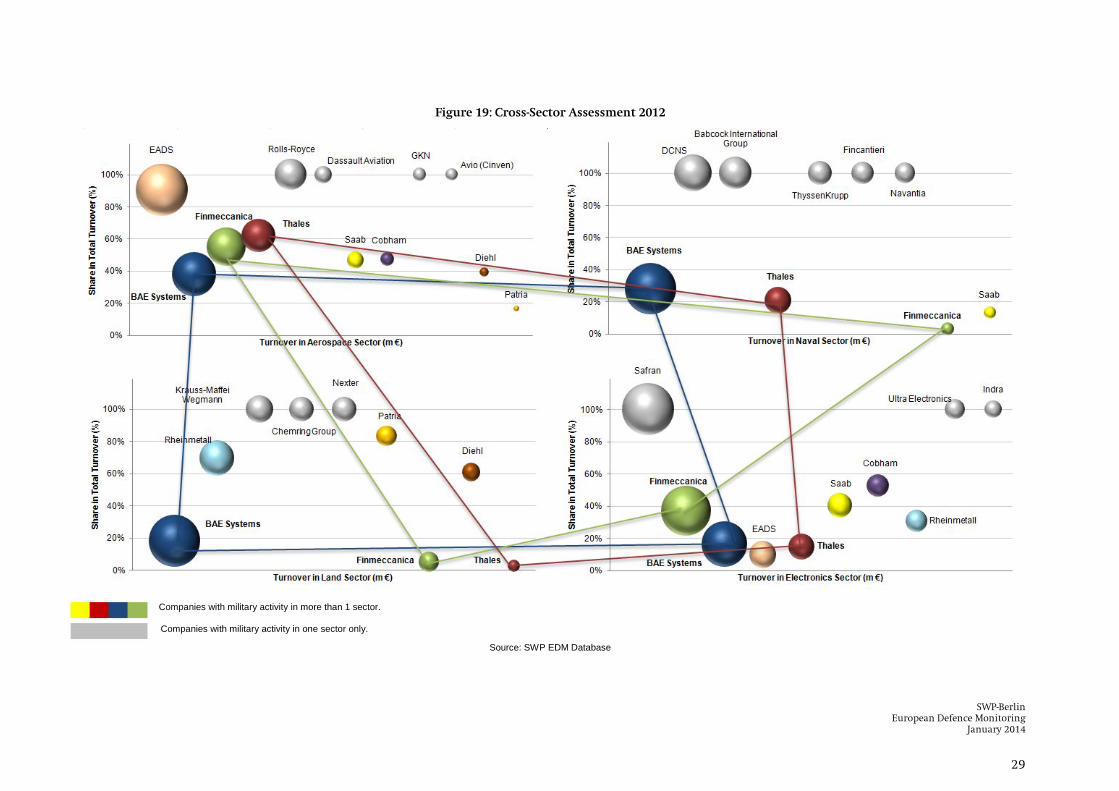
SWP-Berlin European Defence Monitoring
January 2014
29
Figure 19: Cross-Sector Assessment 2012
Companies with military activity in more than 1 sector.
Companies with military activity in one sector only.
Source: SWP EDM Database

SWP-Berlin European Defence Monitoring January 2014
30
7. Case Studies on Current and Future Potentials of Helicopters and UAS
Helicopters: Seven Member States hold 80% of EU Helicopters
74. Europe’s more than 2,830 helicopters come in 50 basis types or families and more than 140 different platform variants. Helicopter distribution shows a high level of criticality: more than 80% are held only by 1/4 of EU Member States (seven countries). The remaining 20 % are spread among 20 countries which hold between four and 80 helicopters. Only less than 50% of EU Member States are able to offer joint combat and transport capabilities through helicopters.
Figure 20: Numbers and Shares of Helicopters EU28 (2013)
Source: SWP Database on Helicopters
In 2030: Fewer Helicopters, but More Modern and Flexible Fleets
75. Despite ongoing procurements, the EU has reached its high point for helicopters now. For the future, we estimate that in 2030 Europe will have a much smaller helicopter fleet with about 1700 platforms, but also with an unprecedented modernisation status: about 53% will be younger than 20 years. All seven top holders except France will reduce their numbers of helicopters by 40-60%, especially light platforms and older multi-role helicopters.
76. Roles are flexible, yet platforms are stable: neither the platform itself nor its age determine their util-ity. The significant change of the strategic environment has not led to a drastic change in platforms but more to role adaptation of existing platforms.
Synchronisation and Standardisation possible
77. Helicopters are durable equipment: they do not die by aging but by successors. EU countries still oper-ate many first generation helicopters, i.e. those purchased at the beginning of the helicopter age in Europe from the 1960s on. The majority (almost 60%) of helicopters operated by EU Member States is more than 20 years old. Gazelle helicopters recently used by France during its Mali intervention are about 40 years old.
78. The combination of flexibility in role designation and durability of platform life has serious implica-tions for the synchronisation of the demand and supply cycles. Not only procurement programmes are stretched over one decade. Demand itself can be stretched and managed. For example, countries can close perceived gaps by off-the-shelf procurement or by lending (P&S). Building role families, i.e. countries who can work together on a specific role or offer it to others, may be an interesting option.

SWP-Berlin European Defence Monitoring
January 2014
31
Table 7: Grouping of Helicopter Roles Across EU28 in 2013
Transport Heavy Lift Greece, Germany, Italy, UK, Spain, Netherlands
Attack Bulgaria, Cyprus, Czech Rep., France, Germany, Greece, Hungary, Italy, Netherlands, Poland, Slovakia, Spain, UK
Search and Rescue Belgium, Cyprus, Estonia, France, Germany, Ireland, Italy, Malta, Poland, Sweden, UK
Anti-submarine Warfare18 Bulgaria, Denmark, France, Germany, Greece, Netherlands, Poland, Spain, UK, Italy
Source: SWP Database on Helicopters
79. Towards 2026, some defragmentation of platform types takes place. Their number shrinks from 36 to 28. In 2026, NH 90 and Tiger will, in qualitative terms, dominate the platform landscape. Industry and Member States should assess the degree of compatibility of the 23 NH90 variants and identify areas where joint MRO is possible and affordable.
Figure 21: Helicopters: Change in Effective Quantities EU28
Source: SWP Database on Helicopters
Suppliers: Growing Weight of European Companies
80. Today, the European industry has a strong presence in the military helicopter market with Eurocopter and AgustaWestland as the biggest helicopter manufacturers in Europe: their share is soon rising to 70% of the European market. However, U.S. suppliers are currently still present on the EU market. They remain relevant since they have strong distribution channels: Sikorsky is producing and selling its Blackhawks in Poland through PZL Mielec acquired in 2007. In addition, the delay of NH 90 heli-copters has allowed US suppliers to fill gaps, e.g. in Sweden.
81. Eurocopter and AgustaWestland are offering a broad range of multi-purpose platforms with produc-tion units in many European countries (France, Germany, Spain, Italy, Finland, Romania,), satisfying the juste retour demand of EU Member States. While numbers of helicopters are shrinking, the indus-trial consolidation and concentration of suppliers opens up new avenues for collaboration on service support. Future options for P&S should combine the military and industrial realities and potentials Europe has to offer. Moreover, the use of military platforms for civilian roles like disaster manage-ment should be considered as a viable reason for future R&D funding – as it has been in the past.
18 ASW: Anti-submarine Warfare. Due to missing data on some role attribution, some roles information differs from
Table 1.
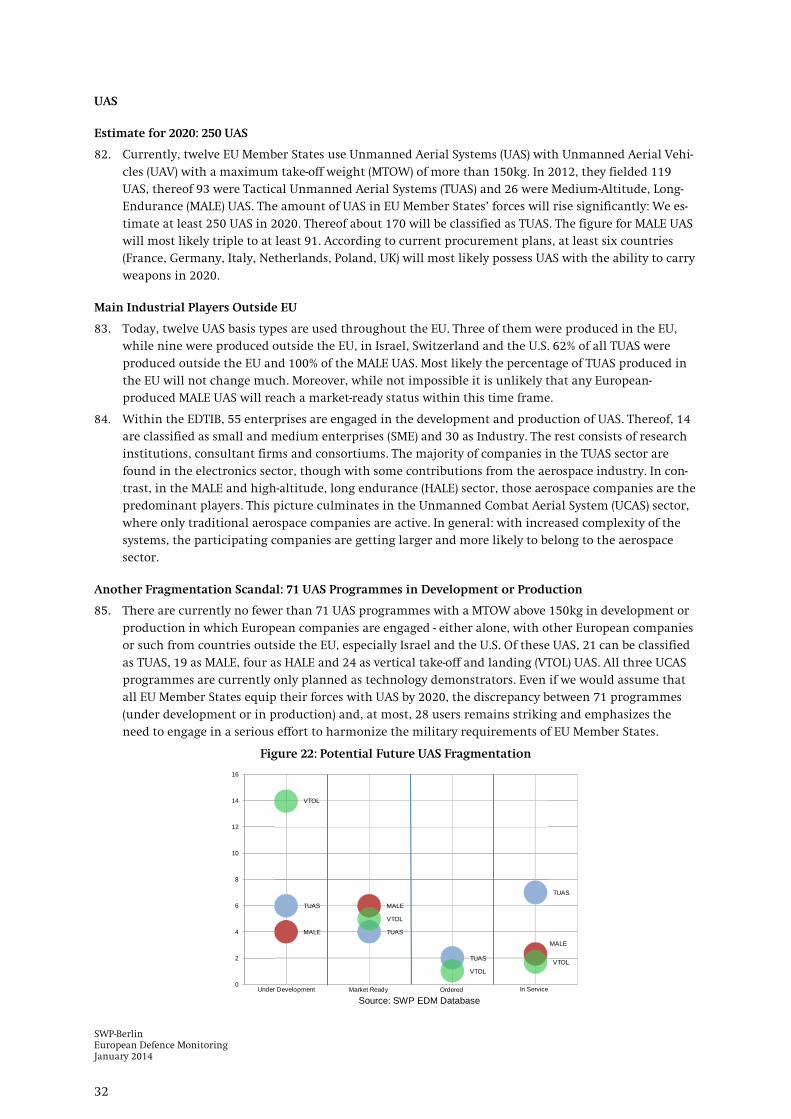
SWP-Berlin European Defence Monitoring January 2014
32
UAS
Estimate for 2020: 250 UAS
82. Currently, twelve EU Member States use Unmanned Aerial Systems (UAS) with Unmanned Aerial Vehi-cles (UAV) with a maximum take-off weight (MTOW) of more than 150kg. In 2012, they fielded 119 UAS, thereof 93 were Tactical Unmanned Aerial Systems (TUAS) and 26 were Medium-Altitude, Long-Endurance (MALE) UAS. The amount of UAS in EU Member States’ forces will rise significantly: We es-timate at least 250 UAS in 2020. Thereof about 170 will be classified as TUAS. The figure for MALE UAS will most likely triple to at least 91. According to current procurement plans, at least six countries (France, Germany, Italy, Netherlands, Poland, UK) will most likely possess UAS with the ability to carry weapons in 2020.
Main Industrial Players Outside EU
83. Today, twelve UAS basis types are used throughout the EU. Three of them were produced in the EU, while nine were produced outside the EU, in Israel, Switzerland and the U.S. 62% of all TUAS were produced outside the EU and 100% of the MALE UAS. Most likely the percentage of TUAS produced in the EU will not change much. Moreover, while not impossible it is unlikely that any European-produced MALE UAS will reach a market-ready status within this time frame.
84. Within the EDTIB, 55 enterprises are engaged in the development and production of UAS. Thereof, 14 are classified as small and medium enterprises (SME) and 30 as Industry. The rest consists of research institutions, consultant firms and consortiums. The majority of companies in the TUAS sector are found in the electronics sector, though with some contributions from the aerospace industry. In con-trast, in the MALE and high-altitude, long endurance (HALE) sector, those aerospace companies are the predominant players. This picture culminates in the Unmanned Combat Aerial System (UCAS) sector, where only traditional aerospace companies are active. In general: with increased complexity of the systems, the participating companies are getting larger and more likely to belong to the aerospace sector.
Another Fragmentation Scandal: 71 UAS Programmes in Development or Production
85. There are currently no fewer than 71 UAS programmes with a MTOW above 150kg in development or production in which European companies are engaged - either alone, with other European companies or such from countries outside the EU, especially Israel and the U.S. Of these UAS, 21 can be classified as TUAS, 19 as MALE, four as HALE and 24 as vertical take-off and landing (VTOL) UAS. All three UCAS programmes are currently only planned as technology demonstrators. Even if we would assume that all EU Member States equip their forces with UAS by 2020, the discrepancy between 71 programmes (under development or in production) and, at most, 28 users remains striking and emphasizes the need to engage in a serious effort to harmonize the military requirements of EU Member States.
Figure 22: Potential Future UAS Fragmentation
Source: SWP EDM Database
TUAS
TUAS
TUAS
TUAS
MALE
MALE
MALE
VTOL
VTOL
VTOLVTOL
0
2
4
6
8
10
12
14
16
Under Development Market Ready Ordered In Service
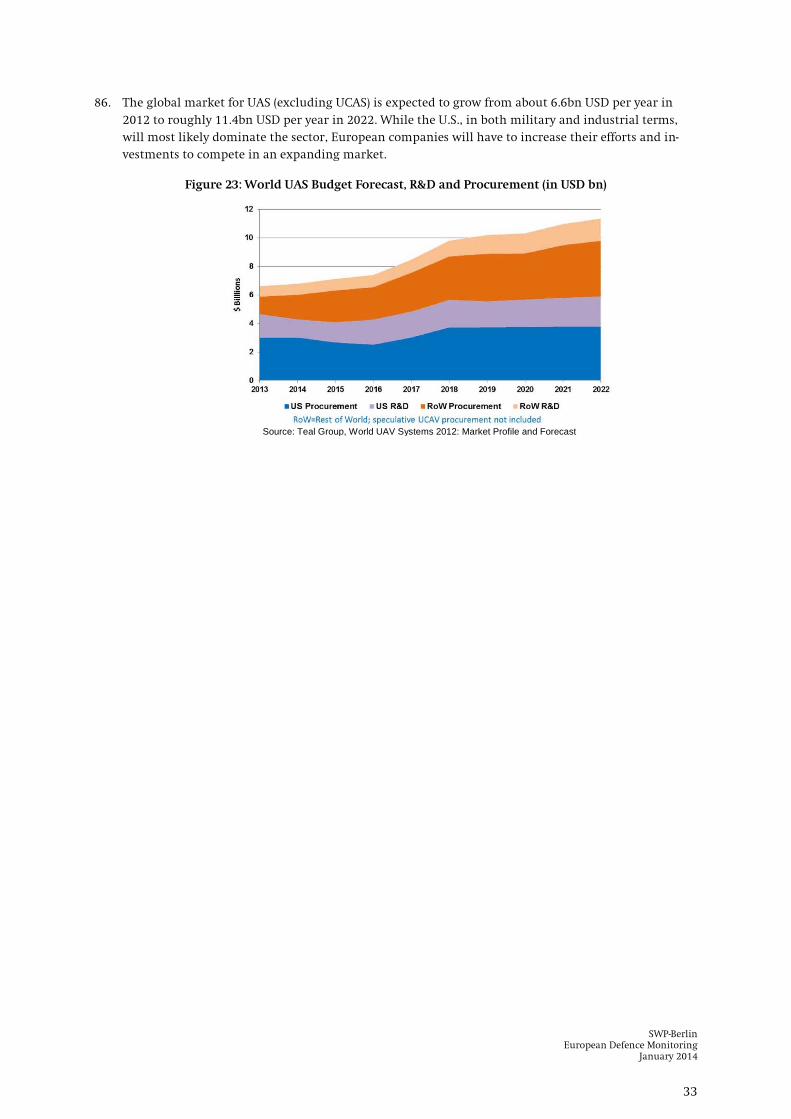
SWP-Berlin European Defence Monitoring
January 2014
33
86. The global market for UAS (excluding UCAS) is expected to grow from about 6.6bn USD per year in 2012 to roughly 11.4bn USD per year in 2022. While the U.S., in both military and industrial terms, will most likely dominate the sector, European companies will have to increase their efforts and in-vestments to compete in an expanding market.
Figure 23: World UAS Budget Forecast, R&D and Procurement (in USD bn)
Source: Teal Group, World UAV Systems 2012: Market Profile and Forecast

SWP-Berlin European Defence Monitoring January 2014
34
8. Defence Cooperation
Progress and Stagnation
87. EU Member States continue to engage in several bilateral and multilateral P&S initiatives, the latest example is the Dutch-German defence cooperation initiative of May 2013. Most initiatives build upon already existing cooperation frameworks. They can further be divided into regional clusters (NOR-DEFCO, Visegrád 4) and into clusters based on the Member States’ political inclination for cooperation (Lancaster House Treaty, Weimar Triangle). However, the depth of cooperation as well as the institu-tionalisation of cooperation practices and frameworks varies. Also the goals are often just vaguely de-fined and rarely provide a roadmap for the intensification of cooperation efforts. An overview of the most important cooperation initiatives and their evolution is provided in Table 8.
88. While some states readily engage in and deepen cooperation efforts, such as the NORDEFCO states, other ambitious cooperation frameworks seem to be buried in oblivion. At first glance, bilateralism may appear to fare better: The UK-FR Lancaster House Treaty is alive if not entirely up to its original ambition. The BENELUX countries have further deepened their cooperation. And some ambitious bi-lateral cooperation initiatives, such as the German-Polish maritime cooperation, have been initiated in 2013. Experience indicates that strong multilateral cooperation can build on successful bilateral cooperation. The latter does not suffice when huge efforts need to be made in terms of investment (UAVs), capabilities (C-17 Initiative/SALIS or EATC) or political solidarity (EUFOR Atalanta).
89. Efforts at the conceptual infrastructure of defence cooperation have reached a new level: EDA’s Code of Conduct on P&S is designed to underpin all Member States’ capability development activities with the perspective of coordination and cooperation as early and comprehensive as possible. The Code of Conduct takes up the 2010 Ghent Initiative and supports the December 2012 Conclusions on defence capabilities and industry.
The Future of Cooperation
90. It remains to be seen as to how far the Code of Conduct, proposed by the EDA, and Council Conclu-sions concerning greater cooperation in defence and security issues, can support P&S initiatives and strengthen existing cooperation frameworks.
91. It remains in the hands of Member States to continue and intensify the P&S efforts. Yet increased mili-tary effectiveness and economic efficiency can only surface if Member States pursue long-term com-mitments and build sustainable structures of cooperation. Yet there is also the possibility that Mem-ber States taking the current path of increasingly pursuing bilateral defence cooperation initiatives.
92. Finally, a more fundamental thought on defence cooperation in Europe would be related less to the-ory, and more to practical reality. Armed forces do cooperate on a daily basis in actual operations, as multinational contingents – from the Balkans to the Somali waters, from Libya to Afghanistan – share risks in armed conflicts. Yet this cooperation work often remains hidden from the radar of force plan-ners in capitals or capability developers in Brussels offices. A systematic analysis of lessons from op-erations, though important for training and equipping national militaries for combined combat, is not publicly available. Such analysis could, however, guide MoDs (and, hopefully, convince Finance Ministers) towards investing in coordinated acquisition and increased standardization of material, in sharing logistic assets and reducing the wasteful multiplicity of land, air and naval equipment.

SWP-Berlin European Defence Monitoring
January 2014
35
Table 8: Regional and Bilateral P&S Frameworks 2010-2013
Initiative (established) Goals Status as of 2010/11 Progress *) Status as of 2011/12 (May
2012) Progress Status of 2012/2013 (July 2013)
Weimar Triangle (1992): Germany, France, Poland
In the military realm: Battlegroups, Capability development Permanent integrated civil-military planning and com-mand capability
No concrete successes in terms of tangible coopera-tion projects achieved. Modest success as planning capability has been estab-lished.
↘
Weimar Battlegroups 2013 – had been agreed upon prior to the initia-tive. France has lost its interest in the initiative after the Polish EU Council Presidency 2011. None of the agreed upon goals has so far been reached.
↗/≈ French MoD Le Drian revived the initiative in 2012.
Weimar Plus (2012): Germany, France, Poland, Spain, Italy
Member States seek to support an ambitious European policy in the realm of security and defence. One of the major issues mentioned is to step up cooperation efforts on high added-value capacities, such as drones and air-to-air refuelling.
NORDEFCO (2009): Denmark, Sweden, Finland, Norway, Iceland
Joint training, common pro-curement, exercises, role sharing
Agreement on joint Nordic Exercise Strategy for mili-tary training and exercise (2012-2017); official pro-posal for Baltic States to join NORDEFCO.
↗/≈
Common procurement of new howit-zers (Norway and Sweden) and a common transport aircraft, talks about the use of the Finnish airspace for the training of Swedish pilots.
↗ Creation of Nordic Tactical Air Transport (NORTAT) wing. Potential amendment of NORDEFCO charter to add industrial cooperation dimension.
Franco-British Defence Coop-eration “Lancaster House Treaty” (November 2010): France, UK
Concrete measures in thirteen areas, among others expedi-tionary forces under alternat-ing command, common usage of aircraft carriers and nuclear research facilities; training and instruction of pilots, and maintenance of A400M, Development of UAS
Problems emerged regard-ing drones and armament projects, and the planned combined aircraft carrier capability.
↗
Expeditionary brigade trains together. Cooperation in nuclear testing has begun. Obvious problems regarding drones, joint sea based air power capability and armament projects.
≈ Successful training of French-British Combined Joint Expedi-tionary Brigade in October 2012. No joint development of aircraft carriers, therefore no interop-erability in this area. Joint development of UAS is on hold.
Visegrád Group (V4) (1991): Poland, Hungary, Slova-kia, Czech Rep
Cooperation in the defence sector
Agreement to set up Battle-group by 2016; slow steps towards formulating com-mon V4 defence and secu-rity policy.
≈
The V4 will put in place a Battlegroup in 2016. Talks about the joint procurement of machine guns, agreed upon coopera-tion in air operations, CBRN, training of helicopter pilots, cooperation regarding logistics and aircraft.
≈ Further talks on joint logistics, CBRN defence, helicopter pilot training, joint construction of armoured vehicles and munitions, integrated command and control systems.
Franco-German Defence Coop-eration (1963): Germany, France
Deepen cooperation in the defence sector Cooperation slowed down. ≈
Gained new momentum with the Declaration of the 6th of February 2012; signing of declaration of intent on cooperation in joint procurement of tanks and artillery, and potentially missile defence. Cooperation regard-ing CSAR and heavy helicopters planned.
≈
Proposal by Germany and France (July 2013) with view to preparing the European Council on Security and Defence in December 2013. Cluster 1: Increase the effectiveness, visibility and impact of CSDP; cluster 2: increase the development of military capabilities; cluster 3: strengthen Europe’s Defence Industry.

SWP-Berlin European Defence Monitoring January 2014
36
Initiative (established) Goals Status as of 2010/11 Progress *) Status as of 2011/12 (May
2012) Progress Status of 2012/2013 (July 2013)
South-Eastern Europe Defence Ministerial Proc-ess (1996): Bulgaria, Greece, Roma-nia, Cyprus
Cooperation in the defence sector
No new processes under-taken. ≈
Talks about exercises, pilot training, airspace policing, industrial coopera-tion.
n.a. ***
Nordic-Baltic Defence Coop-eration (2010): Germany, Poland, UK, the Netherlands, Baltic States, NORDEFCO States
Joint training and exercises, common procurement of equipment
Official proposal to Baltic States to join NORDEFCO. ≈
Meeting of the Baltic States with NORDEFCO, joint training of air forces.
≈ Official invitation to Baltic States to join NORDEFCO (January 2011), yet they still have to join. Estonia has participated in the Nordic Battlegroup in 2008 and 2011, in 2015 Latvia and Lithuania will also take part in it.
Italo-German Defence Agree-ment (2011): Germany, Italy
Cooperation in the develop-ment of submarines, precision ammunition and training of pilots
Defence industry associa-tions of Italy and Germany signed a cooperation deal in December 2011 covering UAS, unmanned ground vehicles, guided munitions, satellites and missiles.
≈ No new processes or initiatives undertaken. n.a. ***
Dutch-German Defence Coop-eration (2012): Netherlands, Germany
Integration of Air Mobile Brigade, intensify cooperation of ground-based air and missile defence units, knowl-edge-sharing on submarine construction
n.a. ≈ n.a. ↗ Ambitious roadmap for intensifying Army, Navy, Air Force cooperation.
*) ↗: new development or increase in cooperation, ≈: no new developments or stagnation in cooperation, ↘: decrease in or end of cooperation, ***: no information on changes available. Source: SWP EDM Database

SWP-Berlin European Defence Monitoring
January 2014
37
9. Annex
Defence Economics
Table 9: Defence Budgets EU28 (in € bn)
Budgets are expenditures estimated or intended for a given year. All budget data is based on Military Balance (2010-2013). The 2008 data for Austria, Cyprus, Finland, Ireland, Malta and Sweden was retrieved from EDA defence expenditure data (2008), as the Military Balance did not publish data on those countries for that given year. The same applies to the 2009 figure for Luxembourg. For the 2013 figures, no Military Balance data was available for Austria, Cyprus, Greece, Latvia, Luxembourg, Malta, and Spain. In those cases, the defence budget was assumed to be stable. The 2013 figure for UK excludes foreign economic aid; source: UK Public Spending (n.d.), <http://www.ukpublicspending.co.uk/year_spending_2013UKbn_13bc1n_30#ukgs302>, retrieved June 2013. France, Italy, Portugal, Poland, Bulgaria, Lithuania, Greece include spending on paramilitary forces such as French Gendarmerie and Italian Carabinieri. All non-Euro currencies have been converted to Euro, using http://www.oanda.com/lang/de/currency/average.
Source: SWP EDM Database
2008 2009 2010 2011 2012 2013% Change 2008/2013
% Change 2011/2012
% Change 2012/2013
Austria 2.56 2.11 2.12 2.47 2.50 2.50 -2.27 1.21 0.00
Belgium 2.85 2.85 2.74 2.82 2.77 2.82 -1.05 -1.77 1.81
Bulgaria 0.79 0.75 0.47 0.52 0.51 0.51 -35.48 -1.05 0.01
Croatia 0.74 0.70 0.65 0.56 0.63 0.58 -21.20 13.93 -7.80
Cyprus 0.30 0.65 0.64 0.38 0.35 0.35 15.80 -7.69 0.00
Czech Rep. 2.17 2.12 1.93 1.80 1.72 1.64 -24.67 -4.64 -4.97
Denmark 3.04 2.95 3.40 3.26 3.45 3.43 12.76 5.86 -0.57
Estonia 0.29 0.26 0.25 0.28 0.34 0.35 20.68 21.79 3.81
Finland 2.46 2.82 2.71 2.86 2.84 2.78 12.87 -0.70 -2.11
France 30.38 33.00 39.30 37.40 38.00 38.20 25.74 1.60 0.53
Germany 29.50 31.20 32.00 32.00 31.90 33.30 12.88 -0.31 4.39
Greece 4.16 7.82 6.09 6.12 6.02 6.02 44.71 -1.63 0.00
Hungary 1.41 1.16 1.01 0.96 0.81 0.80 -42.76 -15.54 -0.35
Ireland 1.08 1.03 0.95 0.73 0.68 0.69 -36.12 -6.34 1.33
Italy 16.40 15.50 16.50 20.20 18.70 19.10 16.46 -7.43 2.14
Latvia 0.37 0.24 0.21 0.21 0.20 0.20 -44.52 -2.86 -0.44
Lithuania 0.37 0.35 0.29 0.25 0.25 0.32 -12.07 -0.52 28.77
Luxembourg 0.12 0.18 0.20 0.20 0.20 0.20 70.00 1.49 0.00
Malta 0.04 0.08 0.10 0.09 0.10 0.10 151.33 2.50 0.00
Netherlands 8.09 8.70 8.51 8.38 8.24 7.78 -3.83 -1.67 -5.58
Poland 6.41 5.27 6.37 6.63 6.97 7.45 16.20 5.15 6.77
Portugal 1.79 1.82 2.27 2.07 2.05 2.09 16.76 -0.97 1.95
Romania 2.26 1.64 1.95 1.66 1.72 1.88 -16.65 3.33 9.40
Slovak Rep. 1.00 1.10 0.86 0.76 0.80 0.74 -26.21 4.59 -7.77
Slovenia 0.55 0.55 0.57 0.52 0.45 0.45 -18.60 -13.01 -0.45
Spain 8.14 7.84 10.60 10.90 9.30 9.30 14.25 -14.68 0.00
Sweden 4.03 3.43 4.25 4.43 4.64 4.75 17.94 4.80 2.32
UK 48.47 43.43 43.93 44.94 47.71 42.62 -12.06 6.17 -10.66
TOTAL 179.75 179.54 190.87 193.39 193.86 190.96
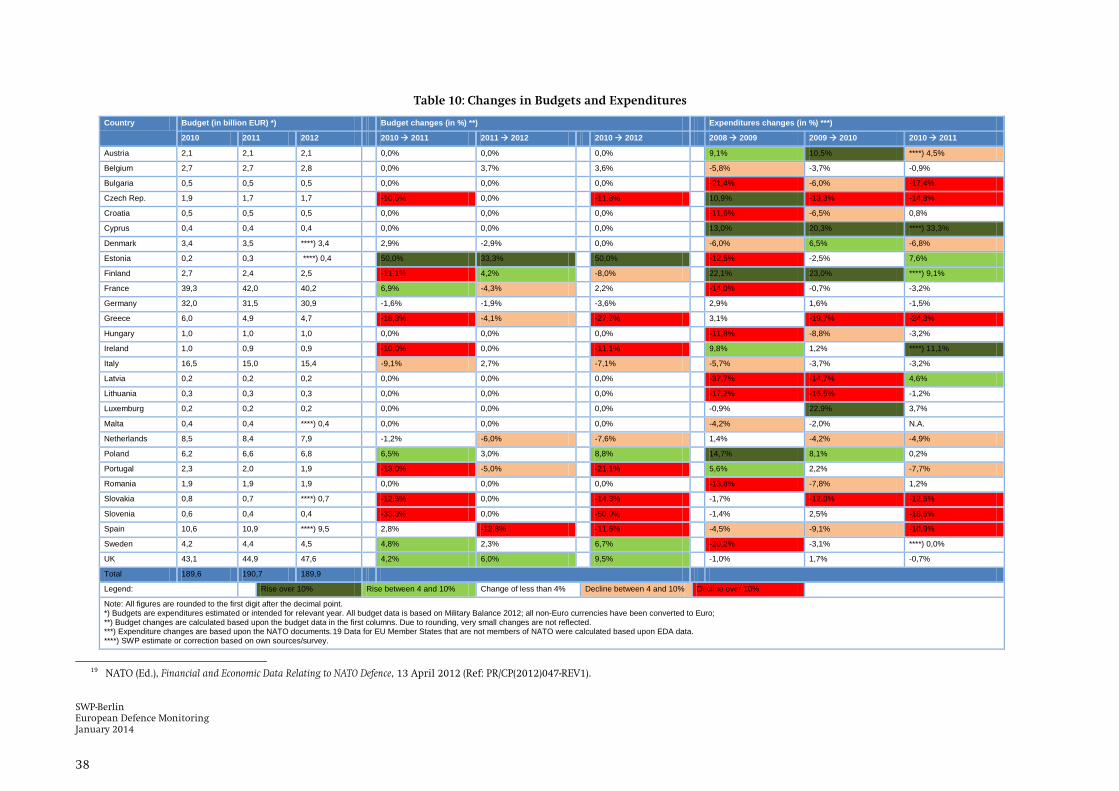
SWP-Berlin European Defence Monitoring January 2014
38
Table 10: Changes in Budgets and Expenditures
19 NATO (Ed.), Financial and Economic Data Relating to NATO Defence, 13 April 2012 (Ref: PR/CP(2012)047-REV1).
Country Budget (in billion EUR) *) Budget changes (in %) **) Expenditures changes (in %) ***)
2010 2011 2012 2010 2011 2011 2012 2010 2012 2008 2009 2009 2010 2010 2011
Austria 2,1 2,1 2,1 0,0% 0,0% 0,0% 9,1% 10,5% ****) 4,5%
Belgium 2,7 2,7 2,8 0,0% 3,7% 3,6% -5,8% -3,7% -0,9%
Bulgaria 0,5 0,5 0,5 0,0% 0,0% 0,0% -21,4% -6,0% -17,4%
Czech Rep. 1,9 1,7 1,7 -10,5% 0,0% -11,8% 10,9% -13,3% -14,8%
Croatia 0,5 0,5 0,5 0,0% 0,0% 0,0% -11,6% -6,5% 0,8%
Cyprus 0,4 0,4 0,4 0,0% 0,0% 0,0% 13,0% 20,3% ****) 33,3%
Denmark 3,4 3,5 ****) 3,4 2,9% -2,9% 0,0% -6,0% 6,5% -6,8%
Estonia 0,2 0,3 ****) 0,4 50,0% 33,3% 50,0% -12,5% -2,5% 7,6%
Finland 2,7 2,4 2,5 -11,1% 4,2% -8,0% 22,1% 23,0% ****) 9,1%
France 39,3 42,0 40,2 6,9% -4,3% 2,2% -14,0% -0,7% -3,2%
Germany 32,0 31,5 30,9 -1,6% -1,9% -3,6% 2,9% 1,6% -1,5%
Greece 6,0 4,9 4,7 -18,3% -4,1% -27,7% 3,1% -19,7% -24,3%
Hungary 1,0 1,0 1,0 0,0% 0,0% 0,0% -11,8% -8,8% -3,2%
Ireland 1,0 0,9 0,9 -10,0% 0,0% -11,1% 9,8% 1,2% ****) 11,1%
Italy 16,5 15,0 15,4 -9,1% 2,7% -7,1% -5,7% -3,7% -3,2%
Latvia 0,2 0,2 0,2 0,0% 0,0% 0,0% -37,7% -14,7% 4,6%
Lithuania 0,3 0,3 0,3 0,0% 0,0% 0,0% -17,2% -16,5% -1,2%
Luxemburg 0,2 0,2 0,2 0,0% 0,0% 0,0% -0,9% 22,9% 3,7%
Malta 0,4 0,4 ****) 0,4 0,0% 0,0% 0,0% -4,2% -2,0% N.A.
Netherlands 8,5 8,4 7,9 -1,2% -6,0% -7,6% 1,4% -4,2% -4,9%
Poland 6,2 6,6 6,8 6,5% 3,0% 8,8% 14,7% 8,1% 0,2%
Portugal 2,3 2,0 1,9 -13,0% -5,0% -21,1% 5,6% 2,2% -7,7%
Romania 1,9 1,9 1,9 0,0% 0,0% 0,0% -13,8% -7,8% 1,2%
Slovakia 0,8 0,7 ****) 0,7 -12,5% 0,0% -14,3% -1,7% -12,0% -12,5%
Slovenia 0,6 0,4 0,4 -33,3% 0,0% -50,0% -1,4% 2,5% -18,6%
Spain 10,6 10,9 ****) 9,5 2,8% -12,8% -11,6% -4,5% -9,1% -10,9%
Sweden 4,2 4,4 4,5 4,8% 2,3% 6,7% -20,2% -3,1% ****) 0,0%
UK 43,1 44,9 47,6 4,2% 6,0% 9,5% -1,0% 1,7% -0,7%
Total 189,6 190,7 189,9
Legend: Rise over 10% Rise between 4 and 10% Change of less than 4% Decline between 4 and 10% Decline over 10%
Note: All figures are rounded to the first digit after the decimal point. *) Budgets are expenditures estimated or intended for relevant year. All budget data is based on Military Balance 2012; all non-Euro currencies have been converted to Euro; **) Budget changes are calculated based upon the budget data in the first columns. Due to rounding, very small changes are not reflected. ***) Expenditure changes are based upon the NATO documents.19 Data for EU Member States that are not members of NATO were calculated based upon EDA data. ****) SWP estimate or correction based on own sources/survey.

SWP-Berlin European Defence Monitoring January 2014
39
Table 11: Levels of Ambitions EU28
Country Deployable troops / LoAs as of 2008 (only land forces)
Changes *)
Deployable troops / LoAs as of 2012 (only land forces) **)
Changes *) Deployable troops / LoA as of 2013 (only land forces)
*) ≈: stagnation, ↘: lowered to, ↗: increased to; **) LoA information is included where relevant data was available by early August 2012.; ***) No information on changes available.
Austria 4,400 deployable troops by 2012; as defined in 2005 ≈ Up to 5,000 for one year by 2016 ↘
2 battalions (bn) plus support forces for unlimited deployment on stabilization and reconstruction missions of low to medium intensity; framework brigade. Austria’s level of ambition has been reduced with the decision to give up, until 2016, the aim to be able to deploy a framework brigade at 30-day combat readiness, sustainable for a year (for high-end intensity missions).
Belgium Not precisely defined, relevant document: Modernisation Plan 2000-2015 of the Belgian armed forces (adopted in 2000)
≈ Approximately 1,200 military personnel deployable ≈ All forces will be reduced in size (personnel and equipment) but plans to further develop deploy-able and flexible forces. Level of Ambition of Belgian Land forces remains the same ≈ 1.200 troops.
Bulgaria 5,000 troops, by 2015 ↘ 1,000 with six-month rotation (one reinforced battalion, or a larger number of smaller units from different services)
≈ 1.000 troops in international missions, either as part of one battalion or several smaller units
Croatia ca. 1,000 troops deployable by 2015 ≈ *** ≈ ***
Cyprus Only marginal contribution ≈ *** ≈ ***
Czech Republic
3,000 for six months by 2006; as defined in the military strategy 2005
↘ Ministry of Defence (MoD) currently contemplates with a revision of LoA ↘
One land battalion task force rotated after a six-month period; as part of this deployment, possibility to provide a multinational task force command element for up to twelve months One company-size land or air task force rotated after a six-month period One battalion-size task force assigned for high readiness stand-by arrangements of NATO (NATO Response Force) or the EU (EU Battle Group) ≈ 1500 deployable troops
Denmark 2,000 troops sustainable, 5,000 short term ≈ MoD expects drastic reductions, also in capabili-
ties, but not in LoA regarding foreign deployments ≈ Continued cross-services prioritization Capacity to deploy a battalion combat command (300 - 800 soldiers) on short notice, either for short or sustained missions Deployable and sustainable capability of 2.000 troops ready for the full range of operations
Estonia 350 sustainable by 2010 ≈ 10% of ground forces deployable ≈ Aim to establish high readiness infantry brigades 2nd infantry brigade shall achieve its full operational capability by 2022 37% of Estonian ground forces deployable for operations abroad, sustain 10% of them in operations for extended periods of time .
Finland Maintain current level of de-ployments ≈ *** ≈ Law on crisis management: 2.000 soldiers can be deployed simultaneously.
Maintain Finland's military defence capabilities into the 2020s
France 50,000 short term, 30,000 sustainable + 5,000 for other deployments as of now
≈ 30,000 for up to one year + 5,000 for other simul-taneous deployments ↘
6,000 to 7,000 soldiers, sustainably deployable in up to three operations, in one of these as main contributor Simultaneously up to 15,000 soldiers for a major coercion operation, with command capability (limited duration)
Germany
14,000 sustainable, plus contri-butions to EU Battlegroup (BG) and NATO Response Force (NRF); distributed over maxi-mum of five area by 2010
↘ Two operations/theatres at the same time, Lead nation for one operation. 10.000 sustainable in stabilization operations, appropriate contribution to EU BG and NRF.
≈ Germany reiterated its goal to be able to deploy up to 10,000 soldiers in several operations simultaneously
*) ≈: stagnation, ↘: lowered to, ↗: increased to; **) LoA information is included where relevant data was available by early August 2012.; ***) No information on changes available.

SWP-Berlin European Defence Monitoring January 2014
40
Country Deployable troops / LoAs as of 2008 (only land forces)
Changes *)
Deployable troops / LoAs as of 2012 (only land forces) **)
Changes *) Deployable troops / LoA as of 2013 (only land forces)
Greece Up to 3,550 by 2007 ↘ Financial situation has led to limiting the LoA to the current status of personnel assigned to operations; increased assignment of forces will be considered on an ad hoc basis
≈ ***
Hungary 1,600 sustainable by 2010 ≈ *** ↘ 1000 troops For all types of (possibly simultaneous) international missions at a max. of 1.000 troops (26)
Ireland Up to 1,600 by 2010 ≈ *** ↘ 850 soldiers for international missions 850 soldiers on standby for international peacekeeping deployments Reduced contributions as a result of governments spending cuts
Italy Up to 13,000 by 2019 ≈ 12,500 full spectrum LoA ≈
According to the law approved in December 2012, by 2024 military personnel will be gradually cut by 18% (33.000) and civilian personnel by 33% (10.000); infrastructure costs will be cut by 33%. Savings are planned to be reinvested into MoD budget, particularly in the Investments and Maintenance and Operational Costs in order to maintain troops deployability and LoA. Participation in a large-scale military confrontation of the „hybrid“ type, i.e. involving both conven-tional military operations and information and cyber-domain operations. Deploy and sustain abroad 12.500 soldiers in three or four concurrent large-scale operations plus a number of minor operations
Latvia
Up to 1,000 sustainable by 2012, as defined in the Report on National Defence Policy and National Armed Forces Devel-opment in 2006
≈ 750-1.000 sustainable ↘ 8% (450) of all troops have to be able to be deployed in international operations at any given time
Lithuania 1,000 sustainable by 2015; as defined in the Guidelines of the Minister of National Defence 2007-2012
≈ At least 50% of the land forces deployable, and at least 10% planned for undertaking long-term operations at any given time
≈ Strengthen combat capabilities of the armed forces, especially Land Forces Develop the active reserve
Luxembourg Not clearly defined ≈ *** ≈ 40% of the defence forces are today classified as ‘deployable’, with 8% sustainably on multina-tional missions abroad
Malta Infantry platoon & HQ element for EU missions ≈ *** ≈ Deployable 159 troops, sustainable 30 troops (EDA data)
Netherlands
Brigade size; sustainable participation in three lower end crisis-management missions with task groups of battalion size; operate as lead-nation at brigade level in land operations.
↘ Austerity package will negatively affect Dutch combat readiness and ability to deploy its forces until 2014
≈ ***
Poland Up to 4,000 sustainable ≈ Around 3,800 sustainable Brigade-sized army unit or four battalion-size units able to support four different missions in a six-month rotation
≈ 3.200-3.800 sustainable troops Emphasis is on expanding deployable forces
Portugal Not officially defined but existing capability to deploy up to three battalions
≈ LoA: full spectrum forces ≈
Full spectrum forces Expeditionary capabilities of 1 battalion or equivalent naval and air components ≈ 700 troops Deepen participation in international missions
Romania 3,000 for up to one year by 2015; as defined in the National Security Strategy 2004
≈ *** ≈ ***
*) ≈: stagnation, ↘: lowered to, ↗: increased to; **) LoA information is included where relevant data was available by early August 2012.; ***) No information on changes available.
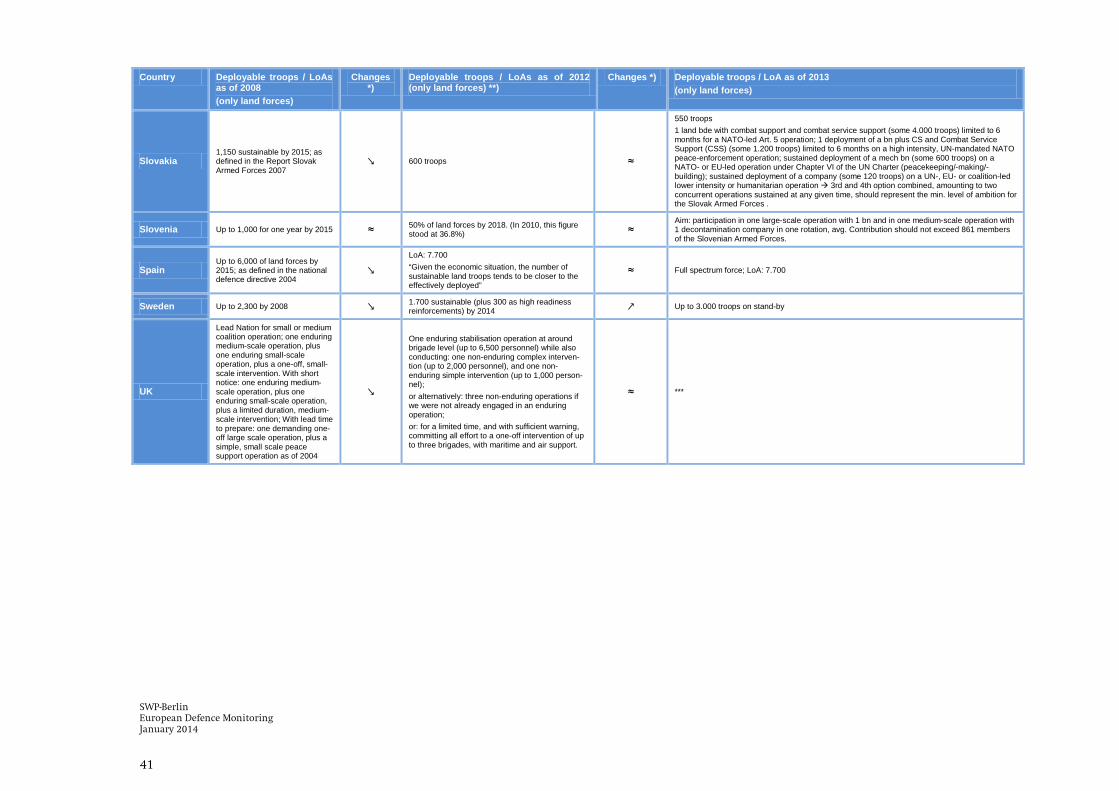
SWP-Berlin European Defence Monitoring January 2014
41
Country Deployable troops / LoAs as of 2008 (only land forces)
Changes *)
Deployable troops / LoAs as of 2012 (only land forces) **)
Changes *) Deployable troops / LoA as of 2013 (only land forces)
Slovakia 1,150 sustainable by 2015; as defined in the Report Slovak Armed Forces 2007
↘ 600 troops ≈
550 troops 1 land bde with combat support and combat service support (some 4.000 troops) limited to 6 months for a NATO-led Art. 5 operation; 1 deployment of a bn plus CS and Combat Service Support (CSS) (some 1.200 troops) limited to 6 months on a high intensity, UN-mandated NATO peace-enforcement operation; sustained deployment of a mech bn (some 600 troops) on a NATO- or EU-led operation under Chapter VI of the UN Charter (peacekeeping/-making/-building); sustained deployment of a company (some 120 troops) on a UN-, EU- or coalition-led lower intensity or humanitarian operation 3rd and 4th option combined, amounting to two concurrent operations sustained at any given time, should represent the min. level of ambition for the Slovak Armed Forces .
Slovenia Up to 1,000 for one year by 2015 ≈ 50% of land forces by 2018. (In 2010, this figure stood at 36.8%) ≈
Aim: participation in one large-scale operation with 1 bn and in one medium-scale operation with 1 decontamination company in one rotation, avg. Contribution should not exceed 861 members of the Slovenian Armed Forces.
Spain Up to 6,000 of land forces by 2015; as defined in the national defence directive 2004
↘ LoA: 7.700 “Given the economic situation, the number of sustainable land troops tends to be closer to the effectively deployed”
≈ Full spectrum force; LoA: 7.700
Sweden Up to 2,300 by 2008 ↘ 1.700 sustainable (plus 300 as high readiness reinforcements) by 2014 ↗ Up to 3.000 troops on stand-by
UK
Lead Nation for small or medium coalition operation; one enduring medium-scale operation, plus one enduring small-scale operation, plus a one-off, small-scale intervention. With short notice: one enduring medium-scale operation, plus one enduring small-scale operation, plus a limited duration, medium-scale intervention; With lead time to prepare: one demanding one-off large scale operation, plus a simple, small scale peace support operation as of 2004
↘
One enduring stabilisation operation at around brigade level (up to 6,500 personnel) while also conducting: one non-enduring complex interven-tion (up to 2,000 personnel), and one non-enduring simple intervention (up to 1,000 person-nel); or alternatively: three non-enduring operations if we were not already engaged in an enduring operation; or: for a limited time, and with sufficient warning, committing all effort to a one-off intervention of up to three brigades, with maritime and air support.
≈ ***
Source: SWP EDM Database

SWP-Berlin European Defence Monitoring January 2014
42
General Methodological Notes
Note on the “Capability Assessment Concept“20
93. The assessment of capabilities is based on a set of assumptions: First, the relativity of capabilities - their dependency upon the political and strategic contexts of the individual Member States - will be excluded from our assessments because we have to assume that capabilities for CSDP operations serve the same pur-poses in all Member States. Second, doctrine and training need to be treated neutral, i.e. we assume that all MS consider this factor to be adequately represented in their military establishments. Clearly, this assump-tion does not do justice to the reality of force capabilities. Our study cannot, however, include the enor-mously difficult and delicate evaluation of skills and training levels of military personnel.
94. What remains, then, as fundamental criteria of capabilities are the material and organisational assets of MS forces. The quantities of those and their evolution over time (changes i.e. deriving from budget devel-opments) give us indications and allow assessments of force capabilities.
95. The main sources for the EDM Database are IISS, The Military Balance, Peer Review and various kinds of other open source material. Open source information prefers official MoDs documents, statements, press releases and interviews given by officials. In addition, academic or research institutions provide data and insights as does the plethora of press publications (journals, magazines, newspapers). The EDM Database is subject to continuous addition of information and therefore to a continuous revision of figures. Data in the subsequent reports may therefore differ.
96. For 1999 figures, the Military Balance 2000 is the main source. It differs largely in its methodology from more recent volumes. The data that was retrieved for it may therefore be biased (cf. note on biased data). Furthermore, the basis types and specifications were not counted for.
97. The data on equipment by type and forces by role across holders do not contain information on the opera-tional availability or readiness of units21
Procurement - EDM Data Base
. This deficit is likely to affect the reliability of 1999 data more than the more recent data – which were revised by our peer reviewers.
98. The assessment of procurement aims to provide an overview regarding the ongoing and future procure-ment of EU Member States and to link the constantly collected data to the base line assessment that has been presented in the EDM projects first report from August 2012. Its methodology is therefore in princi-ple based on the methodology that has been set up in the first semester of the project. Some improvements have been introduced. These concern the types of equipment and the cooperation groups analysed as well as the database-framework for changes over time. All of these adjustments were discussed with EDA in ad-vance and were made in view of the continuity of data assessment and the forthcoming iterations of analy-sis steps.
99. The data base is constantly improving in both quantity and quality of information. The growing compre-hensiveness and depth of information and assessment that can be drawn from it will become visible with every future report of the EDM project.
20 Based on the collection of methodological notes in the EDM Reports to EDA. 21 Cf. Methodological Notes, Military Balance; EDM Note on the “Capability Assessment Concept“, EDM Report August 2012.
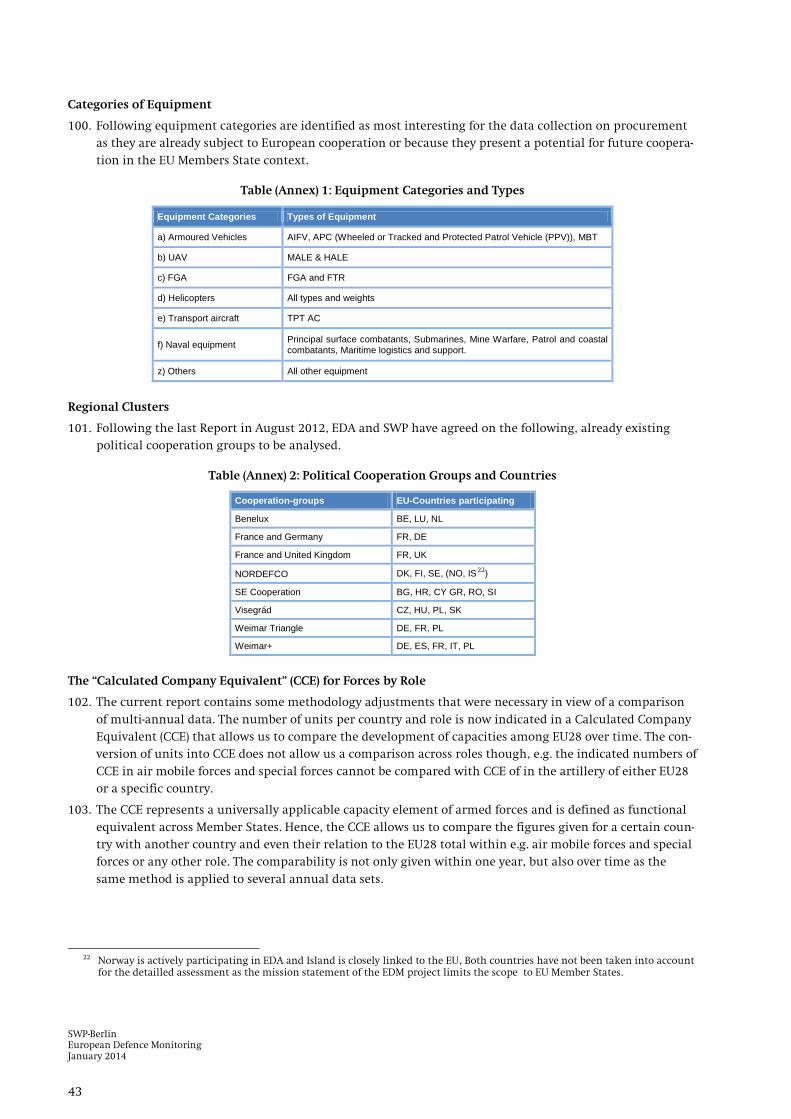
SWP-Berlin European Defence Monitoring January 2014
43
Categories of Equipment
100. Following equipment categories are identified as most interesting for the data collection on procurement as they are already subject to European cooperation or because they present a potential for future coopera-tion in the EU Members State context.
Table (Annex) 1: Equipment Categories and Types
Equipment Categories Types of Equipment
a) Armoured Vehicles AIFV, APC (Wheeled or Tracked and Protected Patrol Vehicle (PPV)), MBT
b) UAV MALE & HALE
c) FGA FGA and FTR
d) Helicopters All types and weights
e) Transport aircraft TPT AC
f) Naval equipment Principal surface combatants, Submarines, Mine Warfare, Patrol and coastal combatants, Maritime logistics and support.
z) Others All other equipment
Regional Clusters
101. Following the last Report in August 2012, EDA and SWP have agreed on the following, already existing political cooperation groups to be analysed.
Table (Annex) 2: Political Cooperation Groups and Countries
Cooperation-groups EU-Countries participating
Benelux BE, LU, NL
France and Germany FR, DE
France and United Kingdom FR, UK
NORDEFCO DK, FI, SE, (NO, IS22
SE Cooperation
)
BG, HR, CY GR, RO, SI
Visegrád CZ, HU, PL, SK
Weimar Triangle DE, FR, PL
Weimar+ DE, ES, FR, IT, PL
The “Calculated Company Equivalent” (CCE) for Forces by Role
102. The current report contains some methodology adjustments that were necessary in view of a comparison of multi-annual data. The number of units per country and role is now indicated in a Calculated Company Equivalent (CCE) that allows us to compare the development of capacities among EU28 over time. The con-version of units into CCE does not allow us a comparison across roles though, e.g. the indicated numbers of CCE in air mobile forces and special forces cannot be compared with CCE of in the artillery of either EU28 or a specific country.
103. The CCE represents a universally applicable capacity element of armed forces and is defined as functional equivalent across Member States. Hence, the CCE allows us to compare the figures given for a certain coun-try with another country and even their relation to the EU28 total within e.g. air mobile forces and special forces or any other role. The comparability is not only given within one year, but also over time as the same method is applied to several annual data sets.
22 Norway is actively participating in EDA and Island is closely linked to the EU, Both countries have not been taken into account
for the detailled assessment as the mission statement of the EDM project limits the scope to EU Member States.
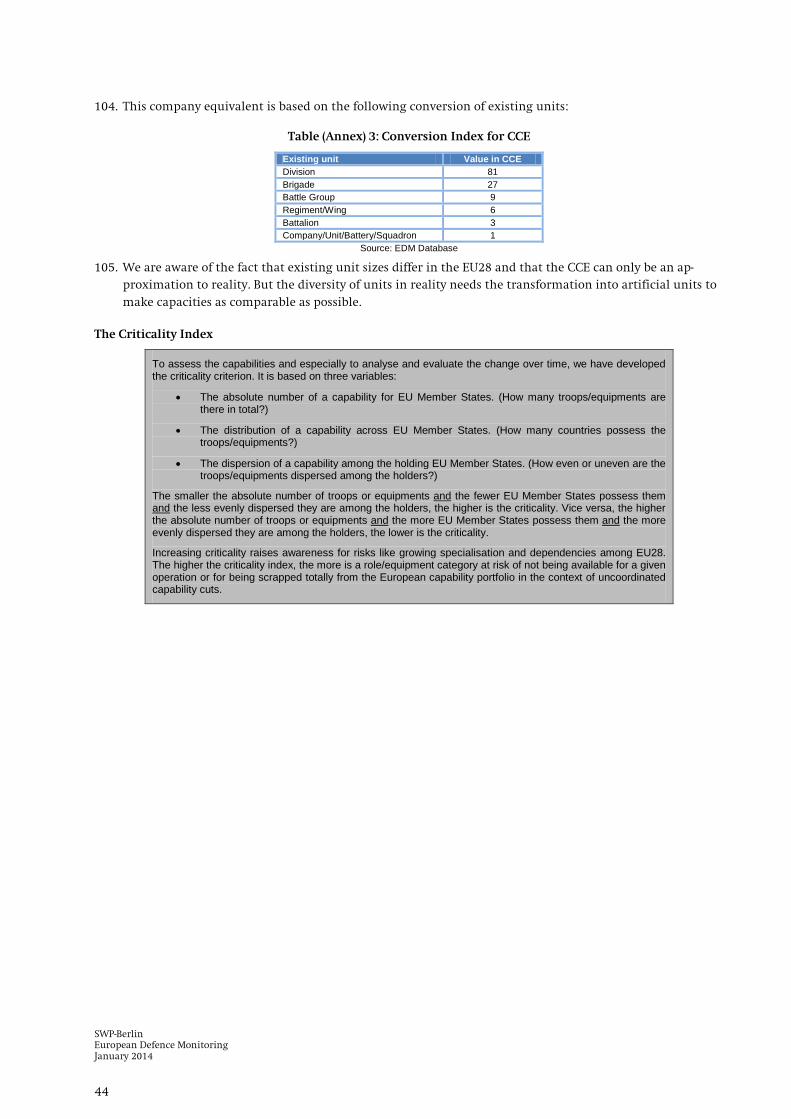
SWP-Berlin European Defence Monitoring January 2014
44
104. This company equivalent is based on the following conversion of existing units:
Table (Annex) 3: Conversion Index for CCE
Existing unit Value in CCE Division 81 Brigade 27 Battle Group 9 Regiment/Wing 6 Battalion 3 Company/Unit/Battery/Squadron 1
Source: EDM Database
105. We are aware of the fact that existing unit sizes differ in the EU28 and that the CCE can only be an ap-proximation to reality. But the diversity of units in reality needs the transformation into artificial units to make capacities as comparable as possible.
The Criticality Index
To assess the capabilities and especially to analyse and evaluate the change over time, we have developed the criticality criterion. It is based on three variables:
• The absolute number of a capability for EU Member States. (How many troops/equipments are there in total?)
• The distribution of a capability across EU Member States. (How many countries possess the troops/equipments?)
• The dispersion of a capability among the holding EU Member States. (How even or uneven are the troops/equipments dispersed among the holders?)
The smaller the absolute number of troops or equipments and the fewer EU Member States possess them and the less evenly dispersed they are among the holders, the higher is the criticality. Vice versa, the higher the absolute number of troops or equipments and the more EU Member States possess them and
Increasing criticality raises awareness for risks like growing specialisation and dependencies among EU28. The higher the criticality index, the more is a role/equipment category at risk of not being available for a given operation or for being scrapped totally from the European capability portfolio in the context of uncoordinated capability cuts.
the more evenly dispersed they are among the holders, the lower is the criticality.