european cultural values -...
TRANSCRIPT

Special Eurobarometer 278
European Cultural Values
Fieldwork February-March 2007
Report Publication September 2007
Spe
cial
Eur
obar
omet
er 2
78 /
Wav
e 67
. – T
NS
Opi
nion
& S
ocia
l
This survey was requested by Directorate General Education and Culture and coordinated by Directorate General Communication
This document does not represent the point of view of the European Commission. The interpretations and opinions contained in it are solely those of the authors.
European Commission
Cultural Values - 2007 DG EAC
1
INTRODUCTION............................................................................................ 3
1. CONCEPTS OF CULTURE AND ITS IMPORTANCE TO THE INDIVIDUAL....... 5
1.1. Associations with ‘Culture’ ................................................................. 5
1.2. Individual Importance of Culture ....................................................... 9
2. ENGAGEMENT IN CULTURAL ACTIVITIES................................................ 12
2.1. Involvement in General Cultural Activities ....................................... 12
2.2. Involvement in Artistic Activities...................................................... 19
2.3. Cultural Activities and the Internet .................................................. 24
2.4. Barriers to Accessing Culture ........................................................... 31
2.5. Views on the Trend Towards Free Cultural Access............................ 33
3. CULTURAL EXCHANGE ............................................................................ 35
3.1. The value of Cultural Exchange ........................................................ 35
3.2. The extent of cross-national contacts............................................... 41
3.3. Interest in meeting people from other European countries .............. 45
3.4. Willingness to learn new languages ................................................. 48
3.5. Actions to further cross-national understanding .............................. 54
3.6. Actors best placed to launch cultural initiatives ............................... 55
4. EUROPE AND CULTURE ........................................................................... 59
4.1. Interest in Culture: Europe and Beyond............................................ 59
4.2. Aspects of European Culture............................................................. 61
5. EUROPEANS, SOCIETY AND VALUES ....................................................... 77

Cultural Values - 2007 DG EAC
2
5.1. Key Societal Values .......................................................................... 77
5.2. Europe, the World and the Embodiment of Values ............................ 80
CONCLUSION.............................................................................................. 83
Cultural Values - 2007 DG EAC
3
INTRODUCTION
“Culture and creativity are important drivers for personal development, social cohesion and economic growth. Today's strategy promoting intercultural understanding confirms culture's place at the heart of our policies”1
So said European Commission President José Manuel Barroso, on the occasion of the launch of a Commission Communication on an agenda for the place of European culture in an ever-globalising world2.
This agenda has three objectives:
● The promotion of cultural diversity and intercultural dialogue in Europe ● The promotion of the culture as a driver of innovation and creative endeavour, bearing in mind the Lisbon Strategy for jobs and growth ● The placing of culture as a main element of the EU’s external relations, in order to foster understanding with other parts of the world. As part of the effort towards meeting these objectives, the Communication calls for ‘evidence-based policy-making’. In other words, the direction which policy takes is to be part monitored and part guided through the application of careful research. In this context, the Education and Culture Directorate-General of the European Commission has been keen to measure public opinion on culture and values within Europe, in order to ascertain both their opinions and behaviour in this area. As such, the current survey forms an important initial insight into the ways in which Citizens think and behave in this area, as well as providing benchmarks against which future evolutions can be tracked. The survey was carried out by TNS Opinion & Social, interviewing 26755 citizens in the 27 Member States. Interviewing was conducted between the 14th of February and the 18th of March 2007. The methodology used is that of Eurobarometer surveys as carried out by the Directorate General for Communication (Unit for Public Opinion and Media Monitoring). A technical note on the manner in which interviews were conducted by the Institutes within the TNS Opinion & Social network is appended as an annex to this report. This note indicates the interview methods and the confidence intervals. This report examines the following themes in turn: • How Europeans conceive of the idea of culture and its importance to them. • Europeans’ involvement in cultural and artistic activities, the place of the Internet in this, barriers towards cultural access and views on the trend towards free cultural access. • Issues of cultural exchange, specifically its value to society, the extent to which cross-cultural contact already occurs, the willingness of Europeans to meet people from other countries and to learn a new language, ways in which cross-cultural understanding can be enhanced and actors best placed to implement these measures.
1 http://ec.europa.eu/culture/eac/communication/comm_en.html 2 Communication from the Commission to the European Parliament, the Council, the European Economic and Social Committee and the Committee of the Regions on a European agenda for culture in a globalizing world {SEC(2007) 570} http://eur-lex.europa.eu/LexUriServ/site/en/com/2007/com2007_0242en01.pdf
Cultural Values - 2007 DG EAC
4
• Interest in culture both in Europe and beyond; views on whether there is indeed a European culture, its characteristics and the effects upon it of globalisation • Opinion on key values to be preserved and reinforced in society as well as whether these are seen as particularly European in nature For each of these points, we analyse the results in terms of the European average, before then considering the breakdown of results by country and by socio-demographic variables where relevant. In addition to this, we have – where relevant - cross-analysed the responses to all the questions with additional classification variables, specifically: • The personal importance to respondents of culture • Whether respondents see themselves as European or national in terms of identity ● The extent to which respondents feel fulfilled in their personal life. Finally, the reader is encouraged to see a qualitative study published last year, which deals with many similar themes to those analysed here3. This report is referred to at several points in the current work.
3 The Europeans, Culture and Cultural Values, Qualitative study by Optem for DG EAC, June 2006, pp.34-38. http://ec.europa.eu/culture/eac/sources_info/studies/pdf_word/report_synth_Cult_06_en.pdf

Cultural Values - 2007 DG EAC
5
1. Concepts of Culture and its Importance to the Individual In this short opening chapter we examine two issues which are important in understanding the area of cultural values. Firstly, we analyse the nature of ‘culture’ itself, as expressed by the Europeans polled in the survey when they were asked what concepts they associate with the word. Secondly, we look at culture as it relates to the individual through answers to a question posed on the importance it has to respondents personally. 1.1. Associations with ‘Culture’ Respondents were asked to carry out a word-association exercise, being asked what comes to mind spontaneously when thinking about culture4. The answers given here were recorded and then subsequently grouped into pre-defined categories along with other similar answers. In an exercise such as this it is very much the case that within a given category, the open-ended answers given by respondents still encompass a wide range of notions. As just one example, the category of ‘traditions/languages/customs and social/cultural communities’ encompasses both generalised references to the existence of multiple cultural communities existing in one country and narrower references to cultural customs specific to one community.
- Culture is most frequently defined in terms of the arts and literature -
Associations with the word 'Culture':-% EU27
39%
24%
24%
20%
18%
18%
13%
7%
5%
1%
2%
9%
9%
11%
13%
Arts (performance arts and visual arts - architecture,painting, art galleries, etc.)
Traditions, languages, customs and social or culturalcommunities
Literature, poetry, playwriting, authors
Education and family (upbringing)
Knowledge and science (research)
Life style and manners
Civilization (Western, Asian, African, Arab, etc.)
History
Museums
Leisure, sport, travels, fun
Values and beliefs (including philosophy and religion)
Not interested, not for me
Too elite, snobbish, posh, boring (negative things)
Other
DK
4 QA2: Please tell me what comes to mind when you think about the word ‘culture’.

Cultural Values - 2007 DG EAC
6
The chart above shows that at European level, ‘culture’ is very much associated with creative activity, whether that be in the form of the arts or literature and authors. As can be seen, the most common type of answer is that related to performance and visual arts5, with this being given by almost four-tenths (39%) of all surveyed. Related to this, literary output6 ranks in joint second with 24% mentioning this. We also see that the idea of culture defining social and cultural communities figures prominently. Just under a quarter (24%) mention traditions, languages and customs in this context, placing this category in joint second place. Slightly below this level, a fairly large proportion give answers that are related more to individual experience. Thus exactly one in five (20%) express ideas linked to education and upbringing, with 18% also mentioning life-style and manners. Whilst it is evident that culture is very much thought of in terms of the arts and literature, it is still the case that notions of knowledge and science (18%) are nonetheless tied up with the idea of culture to some extent. More generalised ideas figure towards the end of the list, such as ‘civilisation’ and ‘history’, which are both expressed by 13% and values/beliefs by 9%. Finally, but no less importantly, it is encouraging to note that negative reactions to the idea of culture, in the form of its dismissal as elitist or dull are extremely rare (1%). Furthermore, only 2% indicated that they are disinterested in culture, or that ‘it is not for me’.
- Differing national concepts of culture, particularly in the Mediterranean countries -
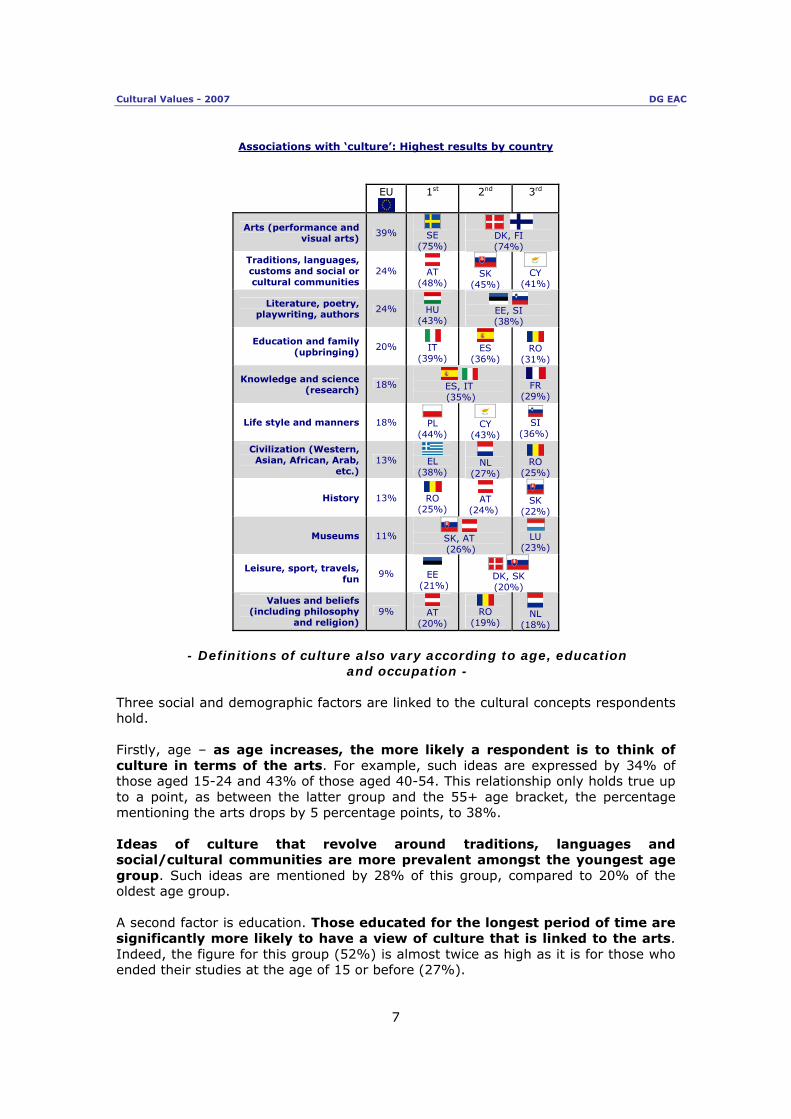
When country results are examined in detail, we see a wide range of divergence from the overall pattern, with particular concepts highly associated with culture in many of the Mediterranean countries. More specifically, these are: ● ‘Knowledge and science’ – mentioned by 35% in both Spain and Italy, compared to 18% across the EU. ● ‘Education and family upbringing’ – mentioned by 39% in Italy and 36% in Spain compared 20% at EU level. ● A high proportion of Cypriots associate culture with ‘life style and manners’ (43% vs. 18% at EU level) and ‘traditions, languages, customs and social or cultural communities’ (41% vs. 24% at EU level). ● ‘Civilisation’ is invoked by a low proportion of EU citizens (13%) but a high number of Greeks (38%). This is perhaps unsurprising given the role of ancient Greece in Europe’s cultural heritage.
5 Incorporating: Music, theatre, cinema, ballet, opera, etc. as ‘performance arts’ and architecture, painting, art galleries, etc as ‘visual arts’. 6 Defined as Literature, poetry, playwriting (but not performance) and authors.
Cultural Values - 2007 DG EAC
7
Associations with ‘culture’: Highest results by country
EU
1st
2nd 3rd
Arts (performance and visual arts)
39%
SE (75%)
DK, FI (74%)
Traditions, languages, customs and social or cultural communities
24%
AT (48%)
SK
(45%)
CY
(41%)
Literature, poetry, playwriting, authors 24%
HU
(43%)
EE, SI (38%)
Education and family (upbringing)
20%
IT (39%)
ES
(36%)
RO
(31%)
Knowledge and science (research) 18%
ES, IT (35%)
FR
(29%)
Life style and manners 18%
PL (44%)
CY
(43%)
SI
(36%)
Civilization (Western, Asian, African, Arab,
etc.) 13%
EL
(38%)
NL
(27%)
RO
(25%)
History 13%
RO (25%)
AT
(24%)
SK
(22%)
Museums 11%
SK, AT (26%)
LU
(23%)
Leisure, sport, travels, fun
9%
EE (21%)
DK, SK (20%)
Values and beliefs (including philosophy
and religion) 9%
AT
(20%)
RO
(19%)
NL
(18%)
- Definitions of culture also vary according to age, education
and occupation - Three social and demographic factors are linked to the cultural concepts respondents hold. Firstly, age – as age increases, the more likely a respondent is to think of culture in terms of the arts. For example, such ideas are expressed by 34% of those aged 15-24 and 43% of those aged 40-54. This relationship only holds true up to a point, as between the latter group and the 55+ age bracket, the percentage mentioning the arts drops by 5 percentage points, to 38%. Ideas of culture that revolve around traditions, languages and social/cultural communities are more prevalent amongst the youngest age group. Such ideas are mentioned by 28% of this group, compared to 20% of the oldest age group. A second factor is education. Those educated for the longest period of time are significantly more likely to have a view of culture that is linked to the arts. Indeed, the figure for this group (52%) is almost twice as high as it is for those who ended their studies at the age of 15 or before (27%).
Cultural Values - 2007 DG EAC
8
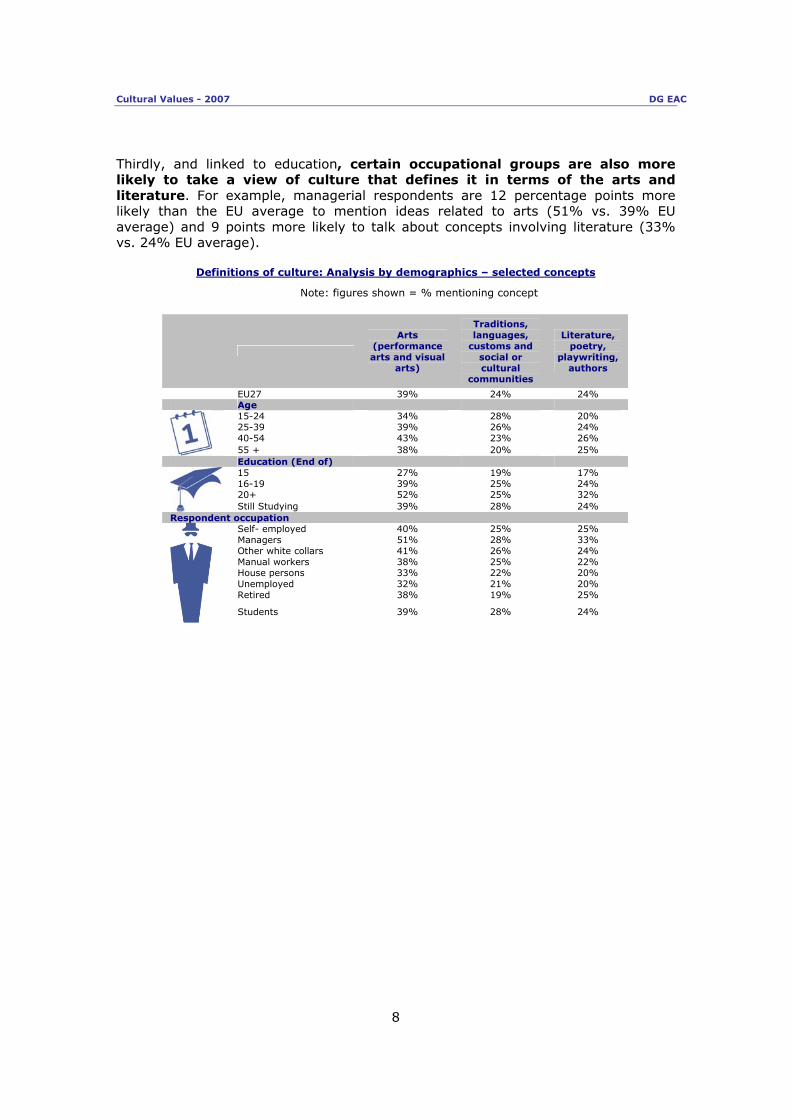
Thirdly, and linked to education, certain occupational groups are also more likely to take a view of culture that defines it in terms of the arts and literature. For example, managerial respondents are 12 percentage points more likely than the EU average to mention ideas related to arts (51% vs. 39% EU average) and 9 points more likely to talk about concepts involving literature (33% vs. 24% EU average).
Definitions of culture: Analysis by demographics – selected concepts
Note: figures shown = % mentioning concept
Arts (performance arts and visual
arts)
Traditions, languages,
customs and social or cultural
communities
Literature, poetry,
playwriting, authors
EU27 39% 24% 24% Age
15-24 34% 28% 20% 25-39 39% 26% 24% 40-54 43% 23% 26%
55 + 38% 20% 25% Education (End of)
15 27% 19% 17% 16-19 39% 25% 24% 20+ 52% 25% 32%
Still Studying 39% 28% 24% Respondent occupation
Self- employed 40% 25% 25% Managers 51% 28% 33% Other white collars 41% 26% 24% Manual workers 38% 25% 22% House persons 33% 22% 20% Unemployed 32% 21% 20% Retired 38% 19% 25%
Students 39% 28% 24%

Cultural Values - 2007 DG EAC
9
1.2. Individual Importance of Culture After being asked via the previous question to define culture in their own terms, respondents where then asked about the personal importance they accord to the concept7.
- A sizeable majority of Europeans say culture is important to them -
Personal Importance of Culture- % EU27
DK1%
Not at all important
5%
Fairly important46%
Not very important
17%Very important
31%
The answers here clearly indicate that culture – regardless of how it is defined – occupies an important role in the lives of many Europeans. Over three-quarters (77%) of all surveyed answer that culture is important to them, with this figure comprising of 31% who answer that culture is very important and 46% that it is fairly important. Of the 22% saying that culture is not important to them personally, only 5% say that it is not at all important.
7 QA3: How important is culture to you personally?

Cultural Values - 2007 DG EAC
10
The highest levels of importance are to be found in Cyprus, where over 9 in 10 (91%) say culture is important to them personally, with 59% saying it is very important – a level over twice as high as the 31% saying this in the EU as a whole. Other countries where an especially high share of the population say that culture is important to them are Italy and France (both 88%). Here though, the proportions answering ‘very important’ are somewhat lower than in Cyprus (37% in France and 36% in Italy). The countries where the lowest percentages say that culture is important to them are Austria (53%), followed by Germany (65%).
- Culture is important to an even higher proportion of those with the lengthiest educations-
A key socio-demographic factor in the personal importance of culture is length of education, with those educated to 20 and beyond (89%) considerably more likely than those who were educated up to the age of 15 (66%) to say culture is important to them. As a proxy of this, a higher proportion of certain occupational groups, such as managers (87%), express the same belief compared to groups such as manual workers and the unemployed (both 72%).
Cultural Values - 2007 DG EAC
11
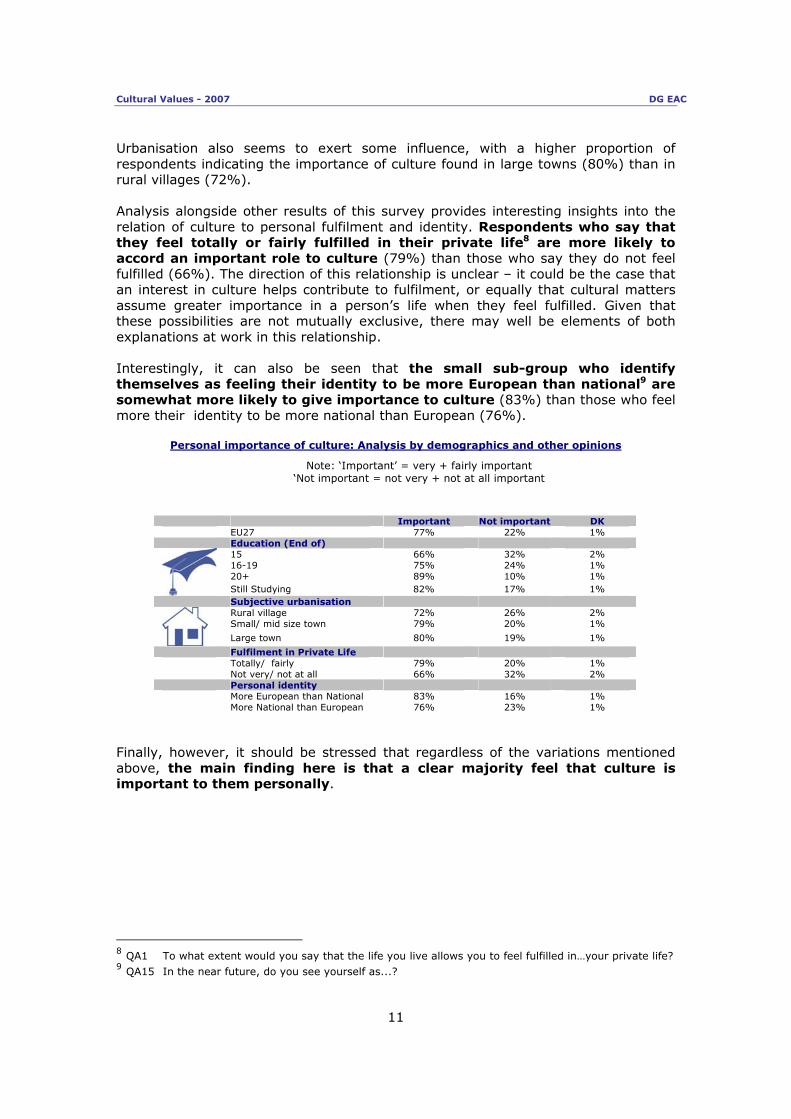
Urbanisation also seems to exert some influence, with a higher proportion of respondents indicating the importance of culture found in large towns (80%) than in rural villages (72%). Analysis alongside other results of this survey provides interesting insights into the relation of culture to personal fulfilment and identity. Respondents who say that they feel totally or fairly fulfilled in their private life8 are more likely to accord an important role to culture (79%) than those who say they do not feel fulfilled (66%). The direction of this relationship is unclear – it could be the case that an interest in culture helps contribute to fulfilment, or equally that cultural matters assume greater importance in a person’s life when they feel fulfilled. Given that these possibilities are not mutually exclusive, there may well be elements of both explanations at work in this relationship. Interestingly, it can also be seen that the small sub-group who identify themselves as feeling their identity to be more European than national9 are somewhat more likely to give importance to culture (83%) than those who feel more their identity to be more national than European (76%).
Personal importance of culture: Analysis by demographics and other opinions
Note: ‘Important’ = very + fairly important ‘Not important = not very + not at all important
Important Not important DK EU27 77% 22% 1% Education (End of)
15 66% 32% 2% 16-19 75% 24% 1% 20+ 89% 10% 1%
Still Studying 82% 17% 1% Subjective urbanisation
Rural village 72% 26% 2% Small/ mid size town 79% 20% 1%
Large town 80% 19% 1%
Fulfilment in Private Life Totally/ fairly 79% 20% 1% Not very/ not at all 66% 32% 2%
Personal identity More European than National 83% 16% 1% More National than European 76% 23% 1%
Finally, however, it should be stressed that regardless of the variations mentioned above, the main finding here is that a clear majority feel that culture is important to them personally.
8 QA1 To what extent would you say that the life you live allows you to feel fulfilled in…your private life? 9 QA15 In the near future, do you see yourself as...?

Cultural Values - 2007 DG EAC
12
2. Engagement in Cultural Activities In this chapter we analyse issues related to personal involvement in cultural activities. Firstly, this involves the quantification of participation in such activities, presenting data on the extent to which the European public engages in various cultural and artistic behaviours. We then move on to the matter of the internet and the extent to which this contributes to the ability to access culture. After this, we deal with barriers to accessing culture or taking part in cultural activities, before ending with an examination of opinions concerning the increasing trend towards free cultural access. 2.1. Involvement in General Cultural Activities Respondents were asked how many times, if at all, they had taken part in various cultural activities over the 12 months running up to their interview10. These activities are all distinguished by the fact that they involve ‘consuming’ cultural output generated by third parties (e.g. reading a book), as opposed to being actively involved in the generation of such output (e.g. writing a poem). Results for each item in this question are shown below in two aspects. The top bar shows the percentage who have been involved in the activity over the 12-month period, regardless of the frequency with which they have done so. The bottom bar shows the percentage of the total sample that have been involved in the activity more than five times over the year and are thus those who take part most frequently11.
Participation Rates: Total and High Frequency
-% EU27
78%
71%
54%
51%
41%
41%
35%
46%
37%
12%
17%
15%
7%
5%
16%
37%
32%
18%
4%
2%
Cultural program TV/Radio
Read book
Visited historical monument
Cinema
Sport event
Museum/ Gallery
Concert
Public Library
Theatre
Ballet/ Dance/ Opera
at least once a year
more than 5 times a year
10 QA4: How many times in the last twelve months have you…? 11 For full results on frequency of involvement for each activity, please see tables in annex
Cultural Values - 2007 DG EAC
13
- Cultural broadcasts and reading books are the most popular cultural activities -
Here results show a distinct hierarchy with regards to ‘consumption’ of culture. At the top, almost 8 in 10 (78%) say that they have, at some point over the 12 months before their interview, watched a cultural programme on television, or listened to such a broadcast over the radio. Of this figure, 46% fall into the ‘high frequency’ group, having done this more than five times during the period in question. These high figures are no doubt linked to the fact that listening to or watching such a broadcast is one of the most ‘passive’ ways of consuming culture, not requiring respondents to leave their homes. Also featuring prominently is reading books, with just over 7 in 10 (71%) having done this at least once in the 12 months. Over half of this group comprises of ‘high frequency’ readers, with 37% of the total sample saying they read a book more than five times a year. Below these two activities, we see two others where overall participation rates are slightly lower at around 1 in 2: Visiting historical monuments (54% at least once) and going to the cinema (51%). Of the two, frequency of participation is higher for the cinema (17% more than five times) than for monuments (12%). For visiting museums/galleries, the participation rate is 41%, with the proportion of high frequency respondents low at (7%). We may also consider sporting events to be a form of cultural activity. For attending such events, participation is at 41%, with a reasonable proportion of high frequency respondents (15%). Attending concerts (37% at least once) and the theatre (32%) are activities where a smaller minority take part and are also both low frequency activities (5% and 4% respectively taking part more than five times a year). Finally, of the activities presented to respondents in this exercise, seeing a ballet, dance performance or opera is the least common activity, with less than 2 in 10 (18%) doing this at least once, and just 2% five times or more. As we would perhaps logically predict, there is a clearly discernable relationship between overall participation rates and frequency of participation for the above activities. Thus, for example, over half of the vast majority of all respondents who have watched/listened to a cultural program on the television or radio, do over five times a year. Meanwhile, of the minority who attend ballet/dance/opera only a slim proportion do so over five times a year. Though the situation no doubt varies from one activity to the next, we may reasonably hypothesise that the same factors that lead to lower participation rates for certain activities also contribute to the lower frequency of participation amongst those who have an interest in that area.
Cultural Values - 2007 DG EAC
14
- Highest rates of cultural participation found in North European and Baltic countries -
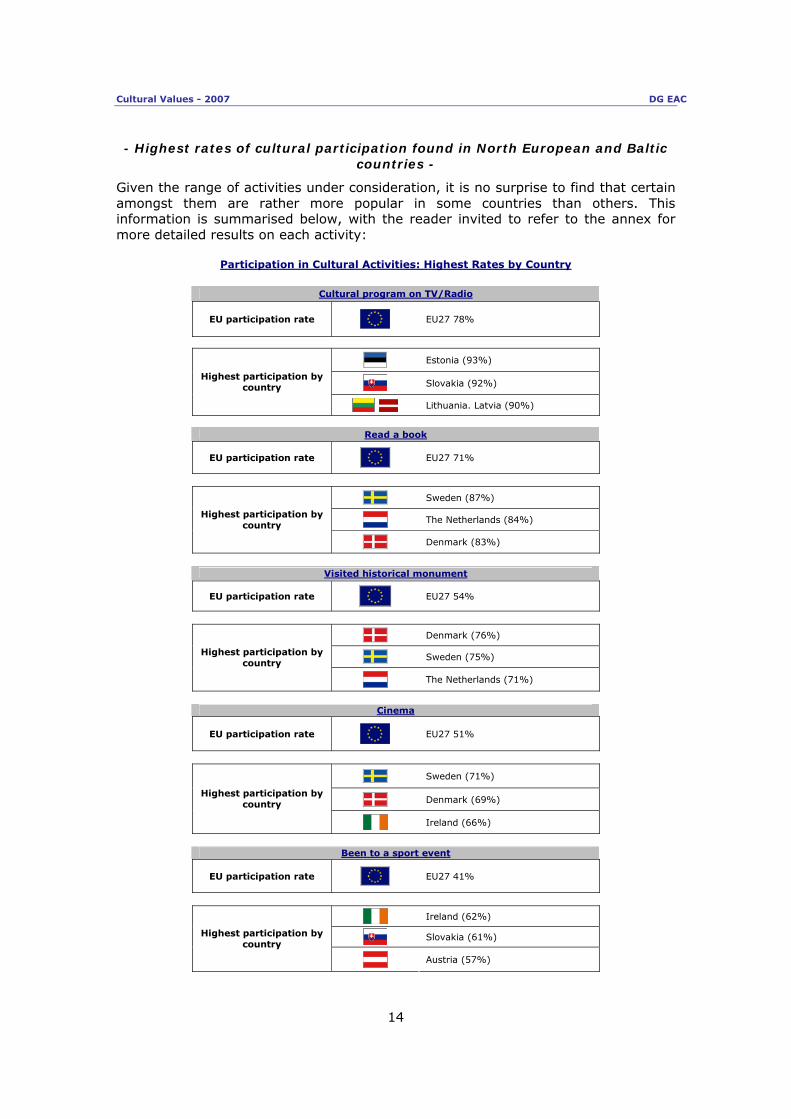
Given the range of activities under consideration, it is no surprise to find that certain amongst them are rather more popular in some countries than others. This information is summarised below, with the reader invited to refer to the annex for more detailed results on each activity:
Participation in Cultural Activities: Highest Rates by Country
Cultural program on TV/Radio
EU participation rate
EU27 78%
Estonia (93%)
Slovakia (92%) Highest participation by
country
Lithuania. Latvia (90%)
Read a book
EU participation rate
EU27 71%
Sweden (87%)
The Netherlands (84%) Highest participation by
country
Denmark (83%)
Visited historical monument
EU participation rate
EU27 54%
Denmark (76%)
Sweden (75%) Highest participation by country
The Netherlands (71%)
Cinema
EU participation rate
EU27 51%
Sweden (71%)
Denmark (69%) Highest participation by
country
Ireland (66%)
Been to a sport event
EU participation rate
EU27 41%
Ireland (62%)
Slovakia (61%) Highest participation by country
Austria (57%)
Cultural Values - 2007 DG EAC
15
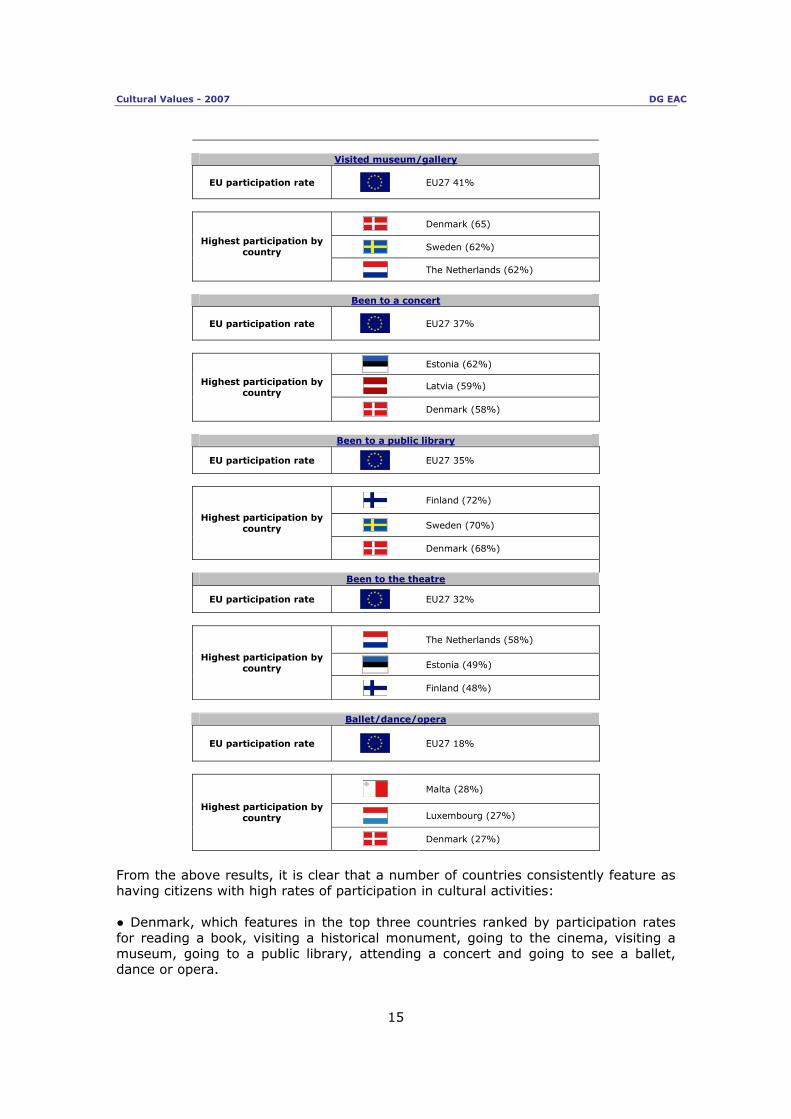
Visited museum/gallery
EU participation rate
EU27 41%
Denmark (65)
Sweden (62%) Highest participation by
country
The Netherlands (62%)
Been to a concert
EU participation rate
EU27 37%
Estonia (62%)
Latvia (59%) Highest participation by country
Denmark (58%)
Been to a public library
EU participation rate
EU27 35%
Finland (72%)
Sweden (70%) Highest participation by
country
Denmark (68%)
Been to the theatre
EU participation rate
EU27 32%
The Netherlands (58%)
Estonia (49%) Highest participation by
country
Finland (48%)
Ballet/dance/opera
EU participation rate EU27 18%
Malta (28%)
Luxembourg (27%) Highest participation by
country
Denmark (27%)
From the above results, it is clear that a number of countries consistently feature as having citizens with high rates of participation in cultural activities: ● Denmark, which features in the top three countries ranked by participation rates for reading a book, visiting a historical monument, going to the cinema, visiting a museum, going to a public library, attending a concert and going to see a ballet, dance or opera.

Cultural Values - 2007 DG EAC
16
● Sweden, where the same applies as for Denmark, but with the exceptions of attending a concert and going to see a ballet, dance or opera. ● The Netherlands, which features in the top three for reading a book, visiting a historical monument, visiting a museum or gallery and attending the theatre. ● Estonia, which has amongst the highest participation rates for going to a concert, watching a theatre performance and watching or listening to a cultural broadcast on the television or radio. Thus it is the case that citizens from Northern European countries feature particularly prominently with regards to participating in cultural activities. As an overall pattern, we also see that the Baltic countries – and especially Estonia – also show high participation rates for certain activities.
- Cultural participation highest amongst the youngest, educated and
urbanised respondents - Participation in such a wide range of activities varies, quite naturally, between socio-economic groups. The main factors at work here are gender, age, education and urbanisation. Gender has a particularly large influence on participation rates for watching sports, with this figure considerably higher amongst men (53% vs. 29% of women; 24 percentage points difference). To a lesser extent, women are more likely than men to have read a book (74% vs. 67% of men; 7 points difference), been to the theatre (34% vs. 29% of men; 5 points difference) and visited a public library (37% vs. 32% of men; 5 points difference) over the last year.
Participation Rates for Selected Activities: Analysis by Gender
Note: Ranked according to percentage point difference female - male
Male Female Difference: female-male
Book 67% 74% +7
Theatre 29% 34% +5
Public library 32% 37% +5
Sport 53% 29% -24
Cultural Values - 2007 DG EAC
17
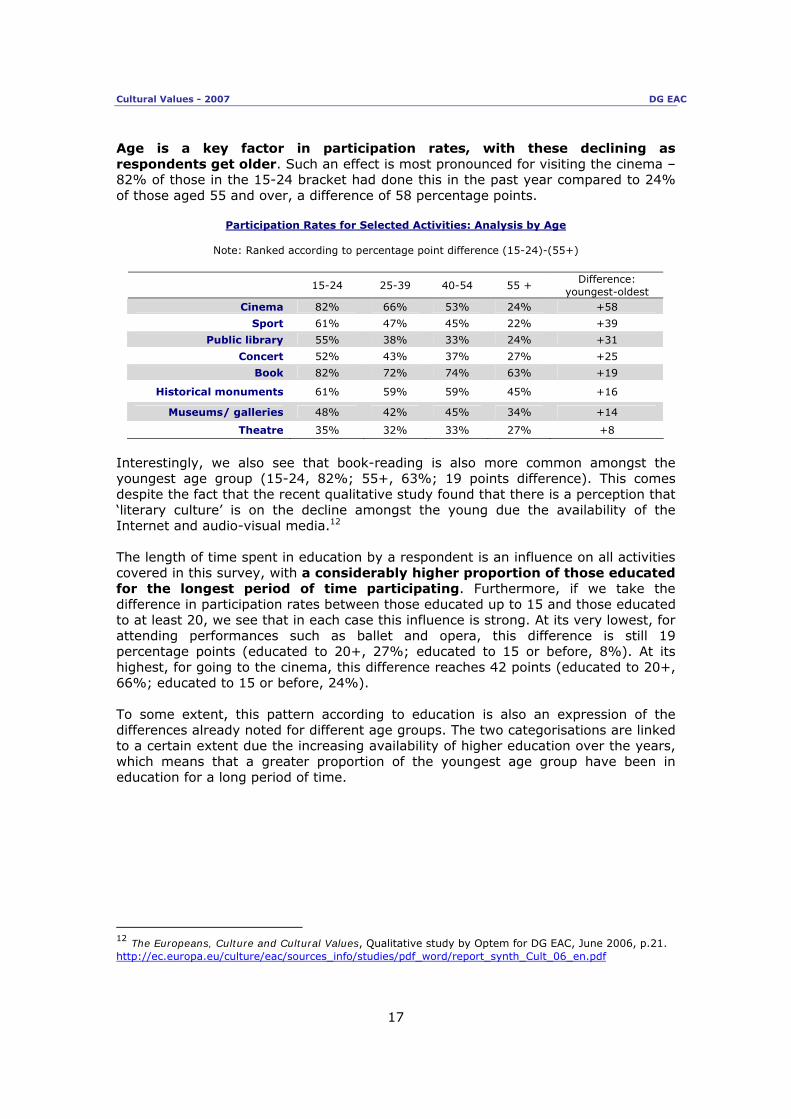
Age is a key factor in participation rates, with these declining as respondents get older. Such an effect is most pronounced for visiting the cinema – 82% of those in the 15-24 bracket had done this in the past year compared to 24% of those aged 55 and over, a difference of 58 percentage points.
Participation Rates for Selected Activities: Analysis by Age
Note: Ranked according to percentage point difference (15-24)-(55+)
15-24 25-39 40-54 55 + Difference:
youngest-oldest Cinema 82% 66% 53% 24% +58
Sport 61% 47% 45% 22% +39
Public library 55% 38% 33% 24% +31
Concert 52% 43% 37% 27% +25
Book 82% 72% 74% 63% +19
Historical monuments 61% 59% 59% 45% +16
Museums/ galleries 48% 42% 45% 34% +14
Theatre 35% 32% 33% 27% +8
Interestingly, we also see that book-reading is also more common amongst the youngest age group (15-24, 82%; 55+, 63%; 19 points difference). This comes despite the fact that the recent qualitative study found that there is a perception that ‘literary culture’ is on the decline amongst the young due the availability of the Internet and audio-visual media.12 The length of time spent in education by a respondent is an influence on all activities covered in this survey, with a considerably higher proportion of those educated for the longest period of time participating. Furthermore, if we take the difference in participation rates between those educated up to 15 and those educated to at least 20, we see that in each case this influence is strong. At its very lowest, for attending performances such as ballet and opera, this difference is still 19 percentage points (educated to 20+, 27%; educated to 15 or before, 8%). At its highest, for going to the cinema, this difference reaches 42 points (educated to 20+, 66%; educated to 15 or before, 24%). To some extent, this pattern according to education is also an expression of the differences already noted for different age groups. The two categorisations are linked to a certain extent due the increasing availability of higher education over the years, which means that a greater proportion of the youngest age group have been in education for a long period of time.
12 The Europeans, Culture and Cultural Values, Qualitative study by Optem for DG EAC, June 2006, p.21. http://ec.europa.eu/culture/eac/sources_info/studies/pdf_word/report_synth_Cult_06_en.pdf
Cultural Values - 2007 DG EAC
18
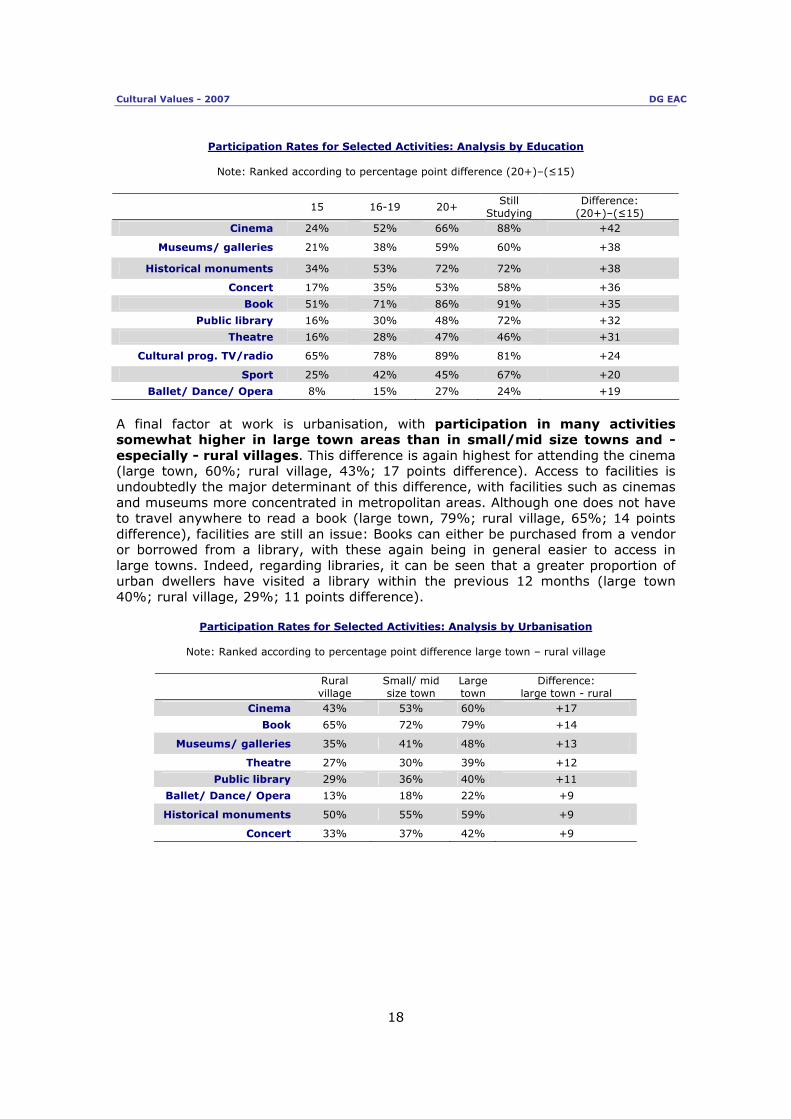
Participation Rates for Selected Activities: Analysis by Education
Note: Ranked according to percentage point difference (20+)–(≤15)
15 16-19 20+ Still
Studying Difference:
(20+)–(≤15) Cinema 24% 52% 66% 88% +42
Museums/ galleries 21% 38% 59% 60% +38
Historical monuments 34% 53% 72% 72% +38
Concert 17% 35% 53% 58% +36
Book 51% 71% 86% 91% +35
Public library 16% 30% 48% 72% +32
Theatre 16% 28% 47% 46% +31
Cultural prog. TV/radio 65% 78% 89% 81% +24
Sport 25% 42% 45% 67% +20
Ballet/ Dance/ Opera 8% 15% 27% 24% +19
A final factor at work is urbanisation, with participation in many activities somewhat higher in large town areas than in small/mid size towns and - especially - rural villages. This difference is again highest for attending the cinema (large town, 60%; rural village, 43%; 17 points difference). Access to facilities is undoubtedly the major determinant of this difference, with facilities such as cinemas and museums more concentrated in metropolitan areas. Although one does not have to travel anywhere to read a book (large town, 79%; rural village, 65%; 14 points difference), facilities are still an issue: Books can either be purchased from a vendor or borrowed from a library, with these again being in general easier to access in large towns. Indeed, regarding libraries, it can be seen that a greater proportion of urban dwellers have visited a library within the previous 12 months (large town 40%; rural village, 29%; 11 points difference).
Participation Rates for Selected Activities: Analysis by Urbanisation
Note: Ranked according to percentage point difference large town – rural village
Rural village
Small/ mid size town
Large town
Difference: large town - rural
Cinema 43% 53% 60% +17
Book 65% 72% 79% +14
Museums/ galleries 35% 41% 48% +13
Theatre 27% 30% 39% +12
Public library 29% 36% 40% +11
Ballet/ Dance/ Opera 13% 18% 22% +9
Historical monuments 50% 55% 59% +9
Concert 33% 37% 42% +9

Cultural Values - 2007 DG EAC
19
2.2. Involvement in Artistic Activities Following the question on cultural ‘consumption’, respondents were asked about their active involvement on an amateur basis in a range of artistic activities, whether that be on an individual basis, as part of a group or in classes. Unlike previously, they were not asked to indicate frequency of participation, but whether they had taken part at all over the 12 months before their interview13.
- Participation in artistic activities lower than cultural consumption - The most popular activity category of those presented to respondents is decorating, handicrafts or gardening, with this being selected by over a third (36%) of the sample. Photography/film making ranks in second with 27% and dancing in third with 19%. At the bottom end of the chart, we see that just 3% have acted within the past 12 months. Overall, participation rates are much lower here than those activities dealt with in section 2.1 and it is also notable that 38% have not taken part in any of the artistic activities presented to them, making this the most popular answer. Lower levels of participation here are to be expected given that the artistic activities in this section require a more active commitment than ‘consumption’-style activities.
Annual Participation Rates for Various Artistic Activites:-% EU27
36%
27%
19%
16%
15%
12%
3%
10%
1%
38%
1%
Done any decorating, handicrafts or gardening
Done some photography, made a film
Danced
Done any other artistic activities like sculpture, painting,drawing, creative computing such as designing a
website, etc.
Sung
Written something (a text, a poem, etc.)
Played a musical instrument
Acted
Other (SPONTANEOUS)
None (SPONTANEOUS)
DK
13 QA5: I am going to read out a list of artistic activities. Please tell me if, in the last twelve months, you have either on your own or as a part of an organised group or classes…? (not in a professional way – amateur activities).

Cultural Values - 2007 DG EAC
20
- Very high artistic participation in Sweden and Estonia -
A useful means of analysing differences in artistic participation between countries is to take the figures for those not taking part in any of the activities presented to them. A low percentage for this figure indicates high overall participation.
Proportions not participating in any artistic activity:-% by country
79%
73%
62%
61%
58%
56%
52%
43%
41%
38%
34%
32%
27%
26%
24%
23%
22%
22%
21%
20%
20%
18%
17%
16%
13%
7%
54%
49%
49%
47%
BG
PT
PL
EL
RO
LT
ES
HU
IT
MT
CY
LV
IE
UE27 EU27
AT
SI
CZ
UK
D-W
DE
BE
NL
DK
D-E
FR
FI
SK
LU
EE
SE Here it can be seen that participation is especially low in Bulgaria and Portugal, where 79% and 73% respectively say that they are not involved in artistic pursuits. These two countries are in stark contrast to Sweden and Estonia, where only 7% and 13% of respondents respectively indicate that they have not been involved in any of the artistic activities.

Cultural Values - 2007 DG EAC
21
The high participation rate in these two countries is further shown in the table below, presenting the highest country figures for each individual artistic activity. In particular, the Swedish results are striking in the consistently high figures recorded. For example, it is notable in this regard that 35% of Swedes are involved in creative writing, a figure almost three times as high as the EU average (12%).
Participation in Artistic Activities: Highest Rates by Country
Handicrafts/ decorating/ gardening
EU participation rate
EU27 36%
Sweden (77%)
France (63%) Highest participation by
country
Estonia, Luxembourg (62%)
Photography/ film-making
EU participation rate
EU27 27%
Sweden (65%)
Luxembourg (53%) Highest participation by
country
Denmark (51%)
Dancing
EU participation rate
EU27 19%
Slovakia (36%)
Sweden (36%) Highest participation by country
Estonia (33%)
‘Other’ artistic activities
EU participation rate
EU27 16%
Sweden (34%)
Netherlands (31%) Highest participation by
country
Denmark (29%)
Singing
EU participation rate
EU27 15%
Sweden (40%)
Slovakia (34%) Highest participation by country
Denmark, Finland (27%)
Cultural Values - 2007 DG EAC
22
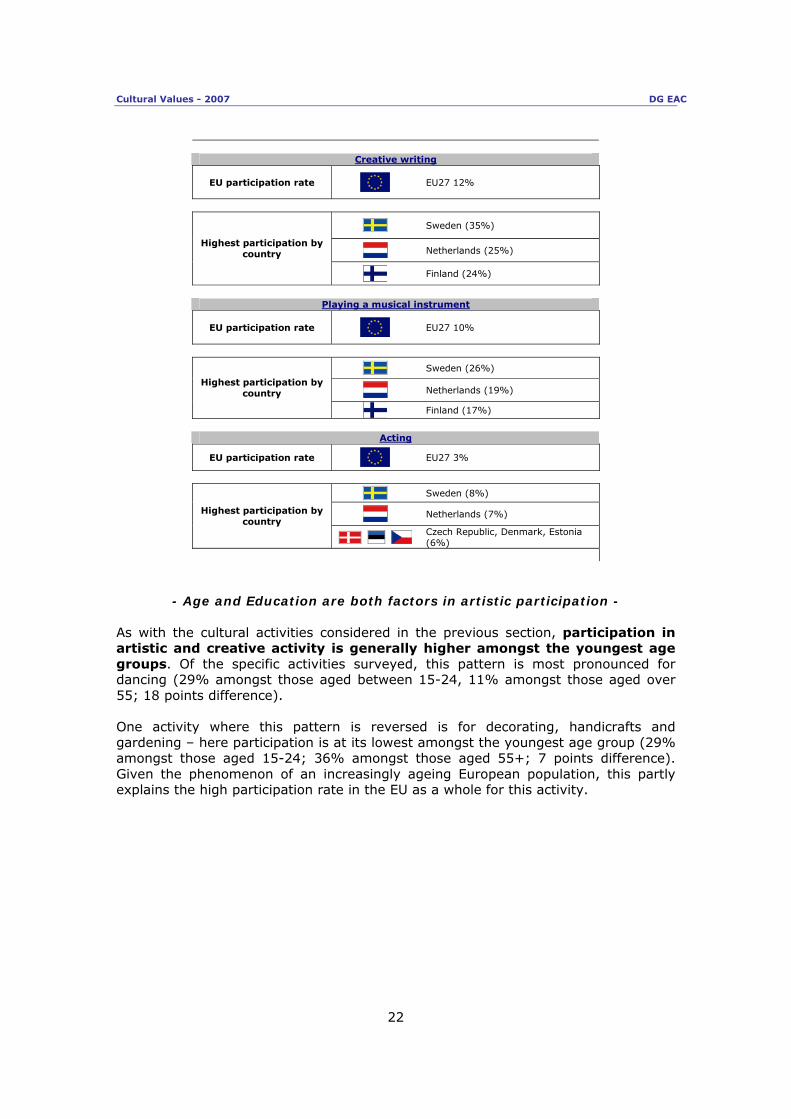
Creative writing
EU participation rate
EU27 12%
Sweden (35%)
Netherlands (25%) Highest participation by
country
Finland (24%)
Playing a musical instrument
EU participation rate
EU27 10%
Sweden (26%)
Netherlands (19%) Highest participation by
country
Finland (17%)
Acting
EU participation rate
EU27 3%
Sweden (8%)
Netherlands (7%) Highest participation by country
Czech Republic, Denmark, Estonia (6%)
- Age and Education are both factors in artistic participation - As with the cultural activities considered in the previous section, participation in artistic and creative activity is generally higher amongst the youngest age groups. Of the specific activities surveyed, this pattern is most pronounced for dancing (29% amongst those aged between 15-24, 11% amongst those aged over 55; 18 points difference). One activity where this pattern is reversed is for decorating, handicrafts and gardening – here participation is at its lowest amongst the youngest age group (29% amongst those aged 15-24; 36% amongst those aged 55+; 7 points difference). Given the phenomenon of an increasingly ageing European population, this partly explains the high participation rate in the EU as a whole for this activity.

Cultural Values - 2007 DG EAC
23
Participation Rates for Selected Activities: Analysis by Age
Note: Ranked according to percentage point difference (15-24)-(55+)
15-24 25-39 40-54 55 + Difference:
youngest-oldest ‘Other’ activities 28% 19% 16% 9% +19
Danced 29% 21% 20% 11% +18
Written something 24% 11% 11% 8% +16
Photography/film 31% 34% 30% 19% +12
Musical instrument 17% 12% 9% 7% +10
Sung 21% 15% 15% 12% +9
Acted 9% 3% 2% 1% +8
Decorating, handicrafts, gardening 29% 37% 41% 36% -7
None (SPONTANEOUS) 26% 34% 37% 47% -21
Education also has an impact here, in a similar manner to that seen for participation in cultural activities – i.e. the longer a respondent has spent in education, the more likely they are to have indulged in creative or artistic activity over the past year. This relationship is particularly pertinent when it comes to photography and film-making (educated to 20+, 39%; educated to 15 or before, 14%; 25 points difference).
Participation Rates for Selected Activities: Analysis by Education
Note: Ranked according to percentage point difference (20+)–(≤15)
15 16-19 20+ Still
Studying Difference:
(20+)–(≤15)
Photography/film 14% 27% 39% 35% 25%
Decorating, handicrafts, gardening 27% 38% 47% 28% 20%
Other activities 6% 14% 25% 32% 19%
Written something 4% 9% 19% 30% 15%
Musical instrument 5% 8% 16% 22% 11%
Danced 11% 19% 22% 29% 11%
Sung 9% 14% 19% 23% 10%
None (SPONTANEOUS) 54% 37% 26% 23% -28%
In the previous section we also noted that urbanisation has an impact on participation in a range of cultural activities. For those activities under consideration in this section, however, this is not a factor. The one area in which such issues do seem to have an effect is for gardening, handicrafts and decorating, where those living in a rural area are more likely to have done this over the previous year (41% vs. 30% in large towns; 11 points difference). This is quite logical given the fact that those living in heavily urbanised areas are more likely to live in apartment accommodation and thus not have access to a garden.

Cultural Values - 2007 DG EAC
24
2.3. Cultural Activities and the Internet The Internet has come to play an increasingly important role for many Europeans. Here we examine with the influence of the Internet in the cultural lives of individuals. Firstly, a preliminary question was asked to establish the extent and frequency of internet use14.
- Just over half of all EU citizens use the Internet in their free time -
Frequency of Leisure-time Internet Use- % EU27
Never46%
Every day26%
Once a week5%
Several times a week15%
1 to 3 times a month
3%
Less often5%
A slight majority (54%) of EU citizens use the Internet apart from in their professional capacity, with 26% doing so every day, 15% several times a week and 13% less frequently than this. Use rates vary considerably across countries - for example with 71% of Greeks saying that they never use the internet apart from in a professional capacity, a figure 5 times higher than the 14% of Dutch respondents who say the same.
- Leisure-time Internet use is highest amongst male, educated, young and town-dwelling respondents -
Use of the internet in one’s free time also varies across various socio-demographic lines: ● More men use the internet for leisure: Those who do not use the internet in their free time are more numerous amongst women (51%) than men (40%). ● A considerably higher share of the young use the internet in this way: Only 15% of those aged 15-24 say they do not use the internet in their free time, compared to 76% of those aged 55 and over. ● The more educated a respondent, the more likely they are to use the internet: Under a quarter (23%) of those educated to at least the age of 20 do not use the internet in their spare time compared to 8 in 10 (80%) of those who finished their studies at 15.
14QA6: How often do you use the Internet apart from your professional activity?

Cultural Values - 2007 DG EAC
25
● Leisure-time use of the internet is somewhat higher in urban areas: 37% of those in large towns do not engage in this, compared to 54% of those in rural villages. The group who use the Internet in a leisure capacity were then asked about the precise nature of such use15, with results shown below.
- Internet most commonly used for exchanging emails -
Purposes of Leisure-time Internet use:-% EU27 (all who use internet apart
from in professional capacity [=54% of sample])
68%
42%
42%
41%
39%
36%
28%
24%
22%
16%
14%
13%
13%
9%
9%
6%
1%
25%
26%
27%
30%
Exchanging e-mails
Information on cultural products/ events
Preparing/ considering a holiday
Information on sport/leisure activities
Reading newspaper articles online
Archiving/ sending/ receiving pictures
Buying cultural products online
Listening to radio/ music
Downloading free music
Exchanging files
Playing computer games
Visiting museum/library websites
Visiting chat rooms, forums
Downloading free movies/TV programmes
Communicating using a webcam
Making phone calls
Visiting blogs
Creating your own website or blog
Watching TV channels
Other (SPONTANEOUS)
DK
By a long distance, the most common activity is the exchange of emails with family, friends and colleagues, with 68% of leisure-time Internet users doing this. The Internet also plays a key role as a facilitator of cultural life, with 42% of all leisure-time users saying that they use the Internet to obtain information on cultural events and products. The Internet is thus very important in helping people to plan and prepare their cultural consumption. 15QA7: Apart from your professional activity, what do you use the Internet for?
Cultural Values - 2007 DG EAC
26
The Internet also forms an important virtual market-place, where consumers can purchase ‘cultural products’ such as books, CDs, DVDs and theatre tickets online. 30% of leisure-time users say that they use the Internet to do this. In the cultural context, we also see that the Internet has also come to assume the status of a direct media channel, for example with 28% of leisure-time users saying that they use the internet for listening to radio broadcasts and music online, making this a relatively popular activity. Clearly, the internet is changing the ways in which many people consume cultural content. We may also add finally here that almost a quarter of leisure-time users say that they access museum or library and other specialist websites, in order to boost their knowledge. Here the internet is making a cultural activity which involves access issues of travel, time and sometimes cost more easily available.
- Differing purposes of Internet use in certain countries- The Swedes, Dutch and Danish figure prominently as having the highest proportions of leisure-time use for many activities, In particular they are likely to use the internet to search for information about or prepare for an activity such as a holiday, sports or cultural event. We also observe that Estonian and Romanian respondents show especially high results for using the internet as a media channel, more frequently using it to access newspapers, radio and television. Here it may be that physical access issues mean that internet becomes a ‘cultural tool’ in its own right. Highest results according to individual countries are shown in the table on the following page.

Cultural Values - 2007 DG EAC
27
Purposes of Leisure-time Internet Use: Highest Rates by Country
EU
1st
2nd 3rd
Exchanging emails
68%
NL (86%)
SE
(85%)
DK, AT (83%)
Search cultural products/events
42%
SE (60%)
FR, DK (57%)
Preparing holidays
42%
SE (65%)
NL
(64%)
LU
(63%)
Search sport/leisure
41%
BE, NL (56%)
FR
(54%)
Newspaper articles
39%
SE (69%)
DK
(61%)
EE
(56%)
Archive, send, receive pictures
36%
NL (57%)
SE
(55%)
DK
(54%)
Buying Cultural Products
30%
SE (52%)
DK
(48%)
FR
(44%)
Listening to Radio or music
28%
LV (44%)
SE
(44%)
RO
(42%)
Downloading free music
27%
CY (57%)
EL (50%)
MT
(44%)
Exchanging files
26%
SI (42%)
DK
(36%)
NL
(35%) Playing
computer games
25%
EE (44%)
HU, AT (36%)
Specialised sites for knowledge
24%
DK (43%)
SK, NL SE
(40%)
Chat rooms, forums
22%
EE (50%)
RO
(39%)
SI
(37%)
Downloading free movies/ TV
16%
EE (38%)
RO
(34%)
LT
(31%)
Communicating with webcam
14%
EE (30%)
RO
(29%)
FR
(28%)
Making phone calls
13%
BG (36%)
EE
(31%)
SK
(26)
Visiting blogs 13%
LT (27)
EE
(26%)
FR
(25%)
Creating websites/ blogs
9%
EE (28%)
CY
(16%)
SE
(14%)
Watching TV channels 9%
EE
(35%)
DK
(21%)
SE
(18%)
Cultural Values - 2007 DG EAC
28
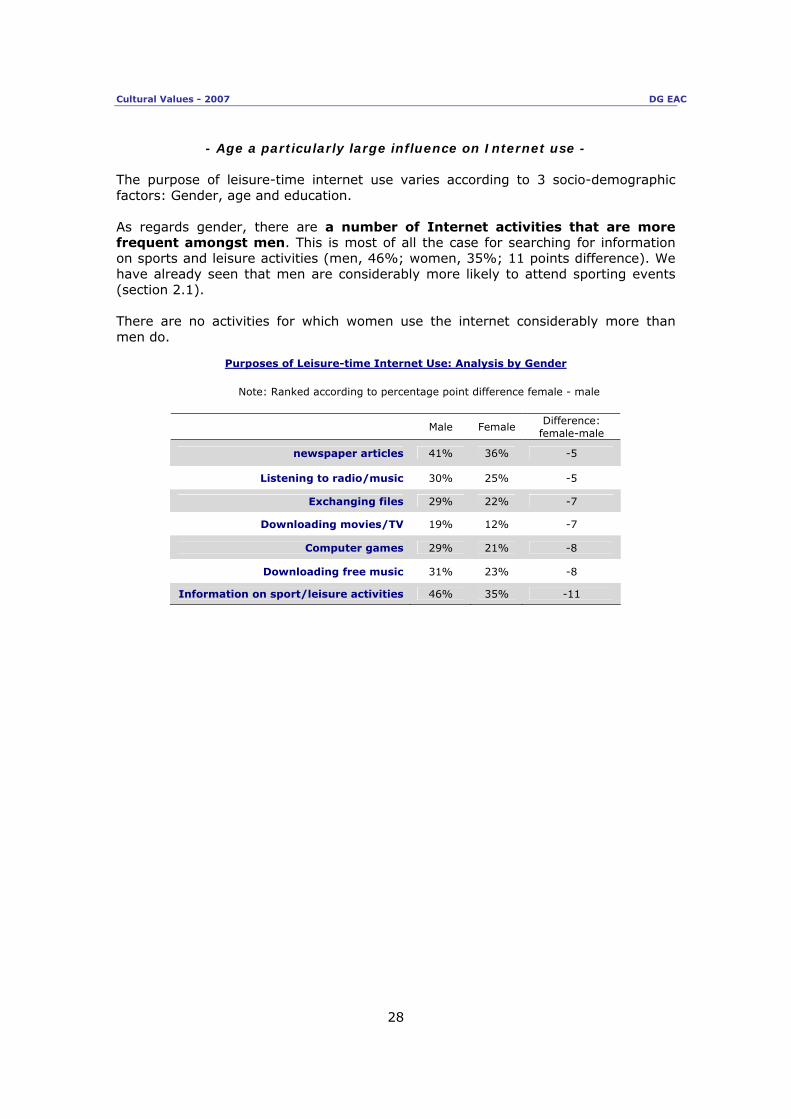
- Age a particularly large influence on Internet use - The purpose of leisure-time internet use varies according to 3 socio-demographic factors: Gender, age and education. As regards gender, there are a number of Internet activities that are more frequent amongst men. This is most of all the case for searching for information on sports and leisure activities (men, 46%; women, 35%; 11 points difference). We have already seen that men are considerably more likely to attend sporting events (section 2.1). There are no activities for which women use the internet considerably more than men do.
Purposes of Leisure-time Internet Use: Analysis by Gender
Note: Ranked according to percentage point difference female - male
Male Female Difference:
female-male
newspaper articles 41% 36% -5
Listening to radio/music 30% 25% -5
Exchanging files 29% 22% -7
Downloading movies/TV 19% 12% -7
Computer games 29% 21% -8
Downloading free music 31% 23% -8
Information on sport/leisure activities 46% 35% -11

Cultural Values - 2007 DG EAC
29
We have seen above that a much higher share of the youngest respondents use the internet in a leisure capacity. It is also the case that they are doing so for a wide range of purposes, as for many internet activities, results are higher for the youngest respondents and considerably so. The most striking example of this is downloading free music, where half (50%) of the internet-using 15-24 age group do this - a figure 42 points higher than the 8% registered amongst those who use the internet and are aged 55 and over. However, there are two activities where results run counter to this overall pattern. Firstly, a much higher share of the 55+ internet-using group prepare holidays online (48% vs. 28% of 15-24 internet users; 20 points difference). The same also true, although to a lesser extent, of searching for information on cultural products and events (55+, 45%; 15-24, 36%; 9 points difference).
Participation Rates for Selected Activities: Analysis by Age
Note: Ranked according to percentage point difference (15-24)-(55+)
15-24
25-39
40-54
55+ Difference: youngest -
oldest
Downloading free music 50% 29% 14% 8% +42
Chat rooms, forums 40% 23% 13% 6% +34
Listening to radio/music 42% 30% 19% 15% +27
computer games 40% 25% 16% 16% +24
Downloading movies/TV 28% 18% 8% 5% +23
Exchanging files 36% 27% 20% 16% +20
Communicating using a webcam 20% 16% 10% 8% +12
Visiting blogs 21% 13% 8% 9% +12
Archiving/sending/receiving pictures 42% 39% 32% 31% +11
Creating website or blog 14% 10% 5% 5% +9
Watching TV 13% 10% 6% 7% +6
Information on cultural products/events 36% 42% 46% 45% -9
Holiday preparation 28% 45% 48% 48% -20

Cultural Values - 2007 DG EAC
30
Finally, it is also the case that those respondents educated to the highest levels have a greater tendency to use the internet for most of the specific purposes under consideration here. As an illustration, 49% of those who studied until at least the age of 20 say that they read newspaper articles online, compared to 24% of those who finished school at 15 or before – a figure twice as low and representing a precise difference of 25 percentage points
Participation Rates for Selected Activities: Analysis by Education
Note: Ranked according to percentage point difference (20+)–(≤15)
15 16-19 20+ Still Studying
Difference: (20+)–(≤15)
Newspaper articles 24% 32% 49% 39% +25 points
Exchanging e-mails 52% 64% 75% 72% +23 points
Information on cultural products/events
30% 37% 51% 39% +21 points
Buying cultural products 19% 26% 40% 25% +21 points
Holiday preparation 33% 40% 53% 29% +20 points
Museum/library websites 13% 18% 32% 26% +19 points
Archiving/sending/receiving pictures
23% 32% 40% 45% +17 points
Listening to radio/music 16% 23% 28% 45% +12 points
information on sport/leisure activities
34% 38% 45% 41% +11 points
Exchanging files 18% 21% 27% 39% +9 points
Chat rooms, forums 11% 17% 20% 43% +9 points
Visiting blogs 6% 9% 14% 23% +8 points
Communicating using a webcam
8% 12% 15% 20% +7 points
Phone calls 10% 11% 16% 15% +6 points
Computer games 25% 23% 19% 41% -6 points

Cultural Values - 2007 DG EAC
31
2.4. Barriers to Accessing Culture Whilst the Internet is opening up new channels for accessing culture, it is nevertheless the case that for many people there are still obstructions to such access. This was addressed by a question that asked respondents which barriers, if any, they faced in accessing culture or taking part in cultural activities16.
- Most respondents experience barriers to accessing culture -
Barriers to Cultural Access:-% EU27
42%
29%
27%
17%
16%
13%
8%
1%
3%
Lack of time
Too expensive
Lack of interest
Lack of information
Limited choice or poorquality of cultural
activities in your area
Lack of knowledge orcultural background
Other (SPONTANEOUS)
None (SPONTANEOUS)
DK
The first point to note from the results shown above is that only 8% say that they face no barriers to access. In other words, over 9 in 10 find at least some difficulty in fulfilling their cultural lives. The single biggest reason given for this is lack of time, with this cited by 42%. After this, issues of expense are given by almost 3 in 10 (29%) with lack of interest mentioned by a similar figure (27%). Other reasons register much lower as barriers to access: 17% say lack of information is a problem, 16% that the choice and quality of activities in their area is poor and just 13% that a lack of cultural knowledge and background prevents access.
16QA8: Sometimes people find it difficult to access culture or take part in cultural activities. Which of the following, if any, are the main barriers for you?

Cultural Values - 2007 DG EAC
32
- Certain barriers especially problematic for specific countries and groups - Geographically we see that there are certain countries where a specific barrier evident at a level well above the EU average. These details are shown below:
Barriers to Cultural Access: Highest Rates by Country
EU
1st
2nd 3rd
Lack of time 42%
SE, SI, CY (52%)
Too expensive 29%
HU (49%)
BG, SK (45%)
Lack of interest 27%
AT (48%)
BE, SI (47%)
Lack of information
17%
EL (29%)
BE, FR (24%)
Lack of cultural knowledge
13%
BE (25%)
LU
(23%)
FR (21%)
Limited choice/ poor quality
16%
SK (34%)
BG
(29%)
CZ
(26%)
The barriers to accessing culture experienced by respondents differ according to various socio-demographic factors. It is not the case, however, that certain sectors of society are prone to experiencing many types of barrier, but more that certain isolated issues become especially important for particular groups: ● Men (30%) are more likely than women (23%) to cite lack of interest as a reason for non-participation. Women (31%) are more likely than men (26%) to say that expense is an issue. ● 44% of respondents aged 15-24 say that lack of time can prevent them from engaging in cultural activities – figure 20 percentage points higher than the 24% of those aged 55 and over who say the same. ● Lack of time is also a problem for more of the group receiving the lengthiest education (49%) than it is for those receiving the shortest education (30%). The latter group are more likely to express disinterest as being a factor (35%) than the former (20%). ● Familial responsibility seems to sometimes impede cultural engagement, most likely via the demands this places on a respondent’s time. We see this from the fact that 52% of those living in a household of 4 or more persons say that this can be a barrier, compared to 30% of those living alone. ● The availability and quality of local cultural facilities can be problematic for those living in rural areas: 23% of respondents living in such an area mentioned this as a problem, compared to 9% of those living in a large town. This very much ties in with the lower cultural participation rates in rural areas that were outlined in section 2.1.

Cultural Values - 2007 DG EAC
33
These findings tie in very much with the recent large-scale qualitative exercise, which found that a lack of both time and money can form barriers to cultural access for many. These two barriers are very much intertwined, as one Romanian participant put it: “The standard of living is very low, people have two jobs and run from one to the other. They become like robots. They need money and they have no free time left”17 2.5. Views on the Trend Towards Free Cultural Access We have seen in the previous section that for some people, issues of cost can prevent cultural access. Nonetheless, it remains the case that there is an increasing trend towards free access to cultural activities without cost. For example, free newspapers are now increasingly prevalent, whilst many public exhibitions and concerts are also free of charge. In order to ascertain views on these developments, respondents were presented with two arguments, one for and one against. The ‘for’ argument in question is that free access is ‘a good thing because it gives more people to opportunity to access culture’. The ‘against’ argument is that ‘this is not really a good thing because most of the offers available for free are of low cultural quality18’.
- Free cultural access is overwhelmingly welcomed- Views on Trend Towards Free Cultural Access
- % EU27
This is a good thing because it
gives more people the
opportunity to access culture
82%
None of these (SPONTANEOUS)
5%
This is not really a good thing
because most of the offers
available for free are of low
cultural quality9%
DK4%
Results show that the overwhelming majority of EU citizens fall into the ‘for’ camp, with 82% saying that this statement corresponds best to their own view. Only 9% opt for the contrary argument, with the remaining 9% saying that neither view corresponds to theirs or giving a ‘Don’t Know’ answer. The strength of the endorsement of this trend is largely universal across countries, only dipping below 7 in 10 in two cases – Ireland (69%) and Bulgaria (66%). In both cases this is due not to a greater number of ‘not really a good thing’ answers, but that more respondents give a ‘don’t know’ answers (17% in both cases).
17 The Europeans, Culture and Cultural Values, Qualitative study by Optem for DG EAC, June 2006, p.28. http://ec.europa.eu/culture/eac/sources_info/studies/pdf_word/report_synth_Cult_06_en.pdf 18 QA9: Today, an increasing number of cultural activities are free of charge. You may find free newspapers, go on the Internet for free, visit free public exhibitions, attend free concerts, etc. Which of the following statements corresponds best to your view?

Cultural Values - 2007 DG EAC
34
As for results according to country, there is not much variation in the overall positive view of free cultural access, when results are analysed according to socio-demographic groups. One factor that has some influence is education, with those respondents educated to a higher level even more likely to be in favour of free access. Thus 85% of those who studied until at least the age of 20 give this opinion, compared to 78% of those educated up to 15 (a difference of 7 points). This is quite logical given that, as we have seen, the former group are more likely to say culture is important to them personally and to take part in cultural and artistic activities. Linked to this, positive opinions account for a higher share of answers amongst those who say culture is important to them personally (85%) than amongst those who say it is not (72%).
Positive Views of Free Cultural Access: Analysis by demographics and importance of culture
This is a good thing because it gives more people the opportunity
to access culture EU27 82% Education (End of)
15 78% 16-19 82% 20+ 85%
Still Studying 86% Personal importance of culture Very/ fairly 85% Not very/not at all 72%

Cultural Values - 2007 DG EAC
35
3. Cultural Exchange In this section we examine the issue of cultural exchange. That globalisation has brought about increased contact between cultures is not in doubt. Within the European Union, increased mobility and the principle of free movement has facilitated the ease with which citizens of one country can experience the culture of others. First of all, the discussion focuses on opinion on the role and value of cultural exchange. After this, we examine issues related to personal cultural exchange: The type and extent of contact people have with those in other countries, their interest in meeting people from other European countries and their willingness to learn new languages. Finally, we examine how cultural exchange can be further encouraged – both in terms of actions that would bring this about and actors who are well-placed to do this. 3.1. The value of Cultural Exchange Respondents were asked to what extent they agree or disagree19 with three different statements related to the importance and role of culture/cultural exchange: On the place of these in the EU, on their role in developing understanding and tolerance globally and on Europe’s ability to contribute to this. The exact statements are as follows: ● ‘Culture and cultural exchanges should have a very important place in the EU so that citizens from different Member states can learn more from each other and feel more European’ ● ‘Culture and cultural exchanges can play an important role in developing greater understanding and tolerance in the world, even when there are conflicts or tensions’ ● ‘Europe, with its long standing culture and values is particularly well placed to contribute to greater tolerance in the world’
- Cultural exchange seen as fostering greater tolerance, learning and understanding, both in Europe and the world –
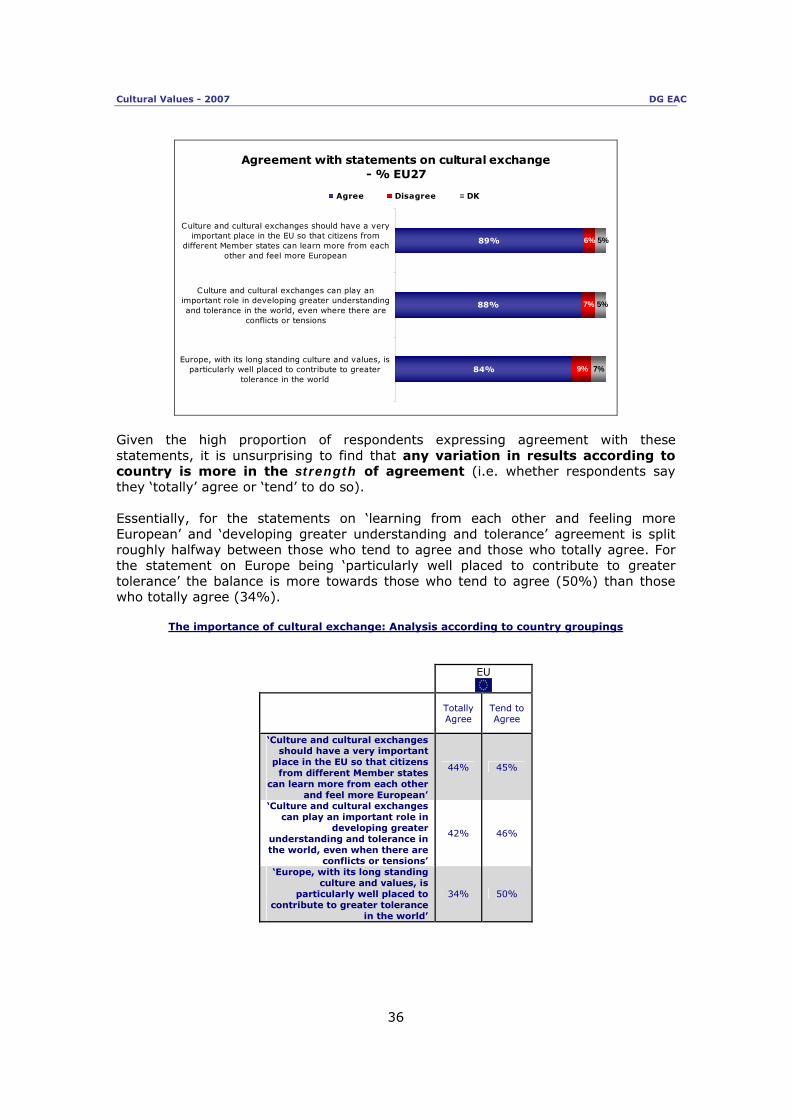
As can be seen from the chart on the following page, results show high levels of agreement with all three statements. Respectively, 89%, 88% and 84% agree with the first, second and third statements. These figures are roughly split between those saying they ‘totally agree’ and those saying they ‘tend to agree’, apart from for the last statement on Europe being well placed to contribute to greater tolerance, where 16 percentage points more say they tend to agree rather than totally agree.
19 QA18 : For each of the following opinions and statements, please tell me whether you totally agree, tend to agree, tend to disagree or totally disagree. [statements on value of cultural exchange]
Cultural Values - 2007 DG EAC
36
Agreement with statements on cultural exchange - % EU27
89%
88%
84%
6%
7%
9% 7%
5%
5%
Culture and cultural exchanges should have a veryimportant place in the EU so that citizens from
different Member states can learn more from eachother and feel more European
Culture and cultural exchanges can play animportant role in developing greater understandingand tolerance in the world, even where there are
conflicts or tensions
Europe, with its long standing culture and values, isparticularly well placed to contribute to greater
tolerance in the world
Agree Disagree DK
Given the high proportion of respondents expressing agreement with these statements, it is unsurprising to find that any variation in results according to country is more in the strength of agreement (i.e. whether respondents say they ‘totally’ agree or ‘tend’ to do so). Essentially, for the statements on ‘learning from each other and feeling more European’ and ‘developing greater understanding and tolerance’ agreement is split roughly halfway between those who tend to agree and those who totally agree. For the statement on Europe being ‘particularly well placed to contribute to greater tolerance’ the balance is more towards those who tend to agree (50%) than those who totally agree (34%).
The importance of cultural exchange: Analysis according to country groupings
EU
Totally Agree
Tend to Agree
‘Culture and cultural exchanges should have a very important
place in the EU so that citizens from different Member states
can learn more from each other and feel more European’
44% 45%
‘Culture and cultural exchanges can play an important role in
developing greater understanding and tolerance in the world, even when there are
conflicts or tensions’
42% 46%
‘Europe, with its long standing culture and values, is
particularly well placed to contribute to greater tolerance
in the world’
34% 50%

Cultural Values - 2007 DG EAC
37
Variation in the strength of feeling on the value of culture is evident when we examine results according to individual countries.
- Cypriot citizens especially enthusiastic about cultural exchange - For the statement on the importance of culture and exchange within the EU, a particularly high proportion of Cypriots ‘totally’ agree (71%) that these can help citizens to learn from each other and feel more European. This is over twice as high as the corresponding figure for Austria (30%), where over half (51%) give the more moderate ‘tend to agree’ answer.

Cultural Values - 2007 DG EAC
38
For the statement on the contribution of culture to greater understanding and tolerance, Cypriots are again the most enthusiastic (65% ‘totally agree’), closely followed by Swedes (62%). Once more, the pattern is somewhat different in Austria, where only 28% totally agree, with 51% saying they tend to agree.

Cultural Values - 2007 DG EAC
39
On the ability of Europe to contribute to global understanding and tolerance, agreement is slightly lower at EU level (34% totally agree vs. 42% and 44% for other two statements) and this is reflected in the fact that there are a number of countries where those totally agreeing falls to a quarter or thereabouts. Specifically, these are Sweden (22% totally agree), Latvia (25%) and the UK (27%).

Cultural Values - 2007 DG EAC
40
- Respondents educated for the longest are even keener on cultural exchange -
Though common amongst all socio-demographic groups, these views on the value of cultural exchange are most prevalent amongst those educated for the longest period of time. The difference in figures between those agreeing with the statements between this group and those studying only until 15 are of the same magnitude for each statement – i.e. 10 or 11 percentage points higher.
Benefits of cultural exchange: Analysis by education and importance of culture
Culture and cultural
exchanges should have important place in EU
Can contribute to
greater understanding and tolerance
Europe well placed to contribute to greater tolerance
EU27 89% 88% 84% Education (End of)
15 83% 81% 78% 16-19 90% 88% 85% 20+ 93% 92% 89%
Still Studying 92% 91% 83% Personal importance of
culture
Very/ fairly 92% 91% 87% Not very/not at all 78% 78% 74%
The idea that culture has an important part to play in Europe and beyond is also linked to the personal importance culture assumes in one’s life. Thus, for example, 92% of those who say culture is personally important also say that it should have an important place in the EU, compared to 78% of those who say culture is unimportant personally. However, this difference of 14 points is perhaps not the most important finding here – rather, we should stress the fact that the idea culture can play an important societal role is heavily supported, even amongst those who do not find it important in their own lives.

Cultural Values - 2007 DG EAC
41
3.2. The extent of cross-national contacts In the previous section we saw clear evidence of the importance accorded to cultural exchange, both in fostering a feeling of understanding and tolerance in general and more specifically in helping EU citizens to learn from each other and develop a European identity. Here we examine, in detail, the extent of the cross-national contact that EU citizens have. Respondents were given a number of statements on different types of such contact, and asked which apply to them20.
- Food forms the most common means of cross-cultural contact -
Types of cross-national contact-% EU27
45%
27%
27%
22%
19%
17%
14%
1%
27%
7%
9%
9%
15%
You enjoy eating foreign cuisine
You have traveled abroad at least three timesin the past three years, for leisure or business
You have friends who are from other Europeancountries
A member of your family or a relative lives inanother European country
You often watch TV programs or movies inforeign languages
You have friends who are from non Europeancountries
A member of your family or a relative lives inanother non European country
You often communicate with people in othercountries via the Internet or email
Your job involves contact with organisations orpeople in other countries
You sometimes read newspapers in foreignlanguages
You enjoy reading foreign books in theiroriginal language
None (SPONTANEOUS)
DK
As can be seen, the most common type of cross-national contact relates to food, with 45% of EU citizens saying that they enjoy eating foreign cuisine. After this, just over a quarter (27%) say that they travel abroad at least 3 times annually, whether that be for business or pleasure, with the same proportion saying that they have friends from other European countries. Related to this last item, 22% have a family member living in another European country. Figures then fall to less than 2 in 10 for all other types of contact, with the least applicable being those who enjoy reading foreign books in their original language (7%). Finally, it should be noted that quite a high proportion - 27% - say that none of the 11 items applies to them. 20 QA10 : Which, if any, of the following statements apply to you? [Statements on knowing people in other countries, eating foreign food etc.]
Cultural Values - 2007 DG EAC
42
- Respondents in Luxembourg, Denmark and Sweden experience high levels
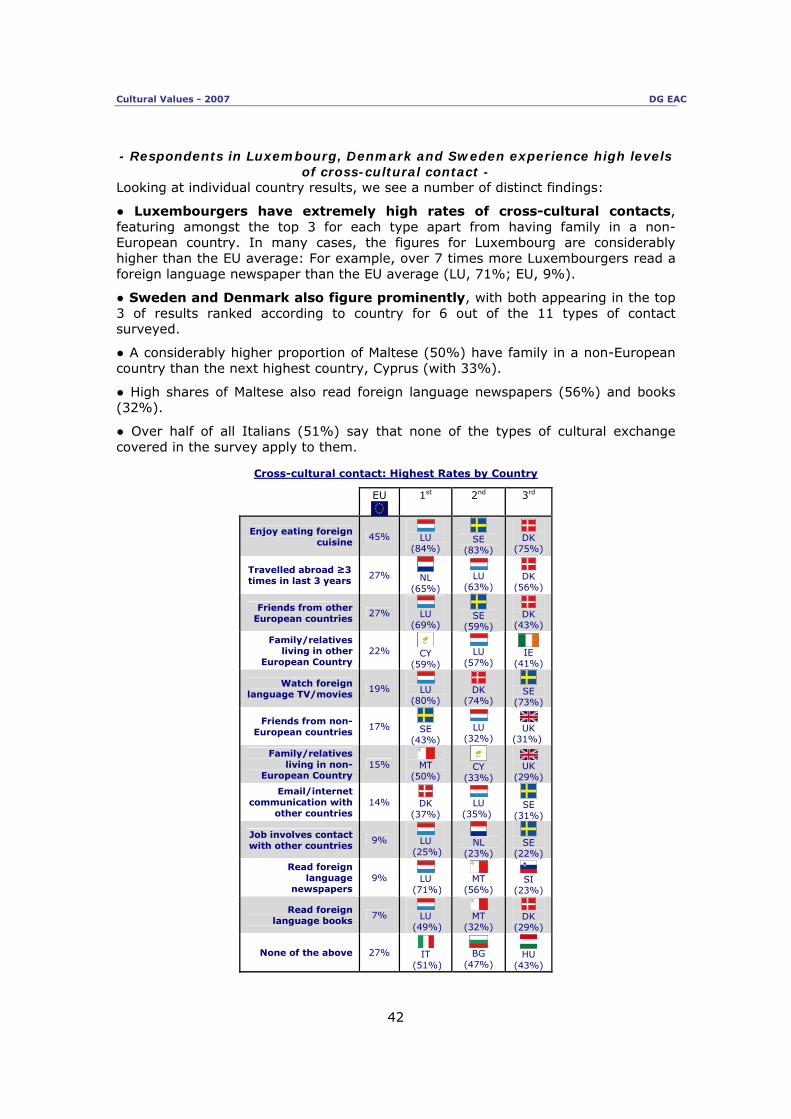
of cross-cultural contact - Looking at individual country results, we see a number of distinct findings: ● Luxembourgers have extremely high rates of cross-cultural contacts, featuring amongst the top 3 for each type apart from having family in a non-European country. In many cases, the figures for Luxembourg are considerably higher than the EU average: For example, over 7 times more Luxembourgers read a foreign language newspaper than the EU average (LU, 71%; EU, 9%). ● Sweden and Denmark also figure prominently, with both appearing in the top 3 of results ranked according to country for 6 out of the 11 types of contact surveyed. ● A considerably higher proportion of Maltese (50%) have family in a non-European country than the next highest country, Cyprus (with 33%). ● High shares of Maltese also read foreign language newspapers (56%) and books (32%). ● Over half of all Italians (51%) say that none of the types of cultural exchange covered in the survey apply to them.
Cross-cultural contact: Highest Rates by Country
EU
1st
2nd 3rd
Enjoy eating foreign cuisine
45%
LU (84%)
SE
(83%)
DK
(75%)
Travelled abroad ≥3 times in last 3 years
27%
NL (65%)
LU
(63%)
DK
(56%)
Friends from other European countries
27%
LU (69%)
SE
(59%)
DK
(43%)
Family/relatives living in other
European Country 22%
CY
(59%)
LU
(57%)
IE
(41%)
Watch foreign language TV/movies
19%
LU (80%)
DK
(74%)
SE
(73%)
Friends from non-European countries
17%
SE (43%)
LU
(32%)
UK
(31%)
Family/relatives living in non-
European Country 15%
MT
(50%)
CY
(33%)
UK
(29%)
Email/internet communication with
other countries 14%
DK
(37%)
LU
(35%)
SE
(31%)
Job involves contact with other countries
9%
LU (25%)
NL
(23%)
SE
(22%) Read foreign
language newspapers
9%
LU (71%)
MT
(56%)
SI
(23%)
Read foreign language books
7%
LU (49%)
MT
(32%)
DK
(29%)
None of the above 27%
IT (51%)
BG
(47%)
HU
(43%)

Cultural Values - 2007 DG EAC
43
- Cross-cultural contact higher amongst the young and most educated - Certain types of cross-national contact are more prevalent amongst younger respondents. This is especially true of eating foreign cuisine, for which 55% of those aged 15-24 say that they enjoy, compared to 32% of those aged 55 and above (a difference of 23 points).
Cross-cultural contact: Analysis by Age
Note: Ranked according to percentage point difference (15-24)-(55+)
15-24 25-39 40-54 55 + Difference:
youngest - oldest
Enjoy eating foreign cuisine 55% 51% 48% 32% +23 Email/internet communication
with other countries 23% 18% 14% 7% +16
Watch foreign language TV/movies 28% 22% 17% 13% +15
Friends from other European countries 33% 31% 28% 19% +14
Friends from non-European countries 21% 20% 18% 12% +9
Read foreign language newspapers 13% 11% 9% 6% +7
Read foreign language books 10% 9% 6% 4% +6
Family/relatives living in other European Country 25% 25% 22% 19% +6
Travelled abroad ≥3 times in last 3 years 28% 29% 29% 23% +5
None (SPONTANEOUS) 18% 21% 25% 39% -21
Chapter 2 demonstrated that cultural and artistic participation is highest amongst those who have spent the longest period of time in education. The same is also true of cross-cultural contact: For all types of contact under consideration, we see that these are higher among those who studied until 20 at the very earliest and lower amongst those who left education at the age of 15. This difference is most pronounced for those who say that they enjoy eating foreign cuisine (20+, 60%; 15, 27%; 33 points difference). It also exceeds 20 percentage points for travelling abroad, having friends from other European countries (both 27 points difference), communicating via Internet with people from other European countries and watching foreign language TV and movies (both 22%). A whole range of factors may be at work behind these statistical differences, such as the length of time spent studying languages at school/university, income levels and the fact that the most educated are more likely to have jobs involving travel.

Cultural Values - 2007 DG EAC
44
Cross-cultural contact: Analysis by Education
Note: Ranked according to percentage point difference (20+)–(≤15)
15 16-19 20+ Still Studying
Difference: up to 15- 20 and
above
Enjoy eating foreign cuisine 27% 45% 60% 55% +33 points
Travelled abroad ≥3 times in last 3 years 15% 24% 42% 31% +27 points
Friends from other European countries 14% 23% 41% 38% +27 points
Email/internet communication with other countries 4% 10% 26% 28% +22 points
Watch foreign language TV/movies 8% 14% 30% 34% +22 points
Friends from non-European countries 9% 14% 28% 22% +19 points
Job involves contact with other countries 3% 8% 20% 6% +17 points
Read foreign language newspapers 3% 5% 19% 17% +16 points
Read foreign language books 2% 4% 14% 14% +12 points
Family/relatives living in other European Country 18% 21% 27% 25% +9 points
Family/relatives living in non- European Country 13% 13% 19% 18% +6 points
None (SPONTANEOUS) 44% 27% 14% 17% -30 points
Finally, it is interesting to analyse results here according to whether respondents say that they feel more European or more belonging to their own country, in terms of their own identity. Here we see that having friends from other European countries is an especially important aspect of feeling European: 43% of those who express this identity say that they have friends in such countries, compared to 24% of those who self-identify as national (a difference of 19 points). European identifiers are also more likely than national identifiers to say that they enjoy eating foreign food (by a difference of 16 points) and that they read foreign language newspaper (by a difference of 14 points). Whether participating in such behaviour helps reinforce a feeling of being European, or whether feeling European predisposes one to these activities cannot be ascertained here, but as can be seen from the chart below, the link between the two is definite.

Cultural Values - 2007 DG EAC
45
Cross-cultural contact: Analysis by identity
Note: Ranked according to percentage point difference between those who feel more European and those who feel more national in identity.
More European
than National
More National
than European
Difference: More European -
national
Friends from other European countries 43% 24% +19 points
Enjoy eating foreign cuisine 59% 43% +16 points
You sometimes read newspapers in foreign languages 21% 7% +14 points
Travelled abroad ≥3 times in last 3 years 38% 25% +13 points
Email/internet communication with other countries 25% 13% +12 points
Watch foreign language TV/movies 29% 17% +12 points
Friends from non-European countries 27% 16% +11 points
Family/relatives living in other European Country 31% 21% +10 points
Read foreign language books 14% 6% +8 points
Job involves contact with other countries 15% 8% +7 points
Family/relatives living in non- European Country 19% 14% +5 points
None (SPONTANEOUS) 14% 29% -15 points
3.3. Interest in meeting people from other European countries As a measure of the potential for cultural exchange in the EU, respondents were asked how interested they are in meeting people from other European countries face-to-face21. - Over half are interested in meeting people from other European countries -
Interest in meeting people from other European countries- % EU27
Very interested19%
Not very interested
25%
Fairly interested44%
Not at all interested
10% DK2%
21 QA12: How interested would you say you are in meeting in person people from other European countries?
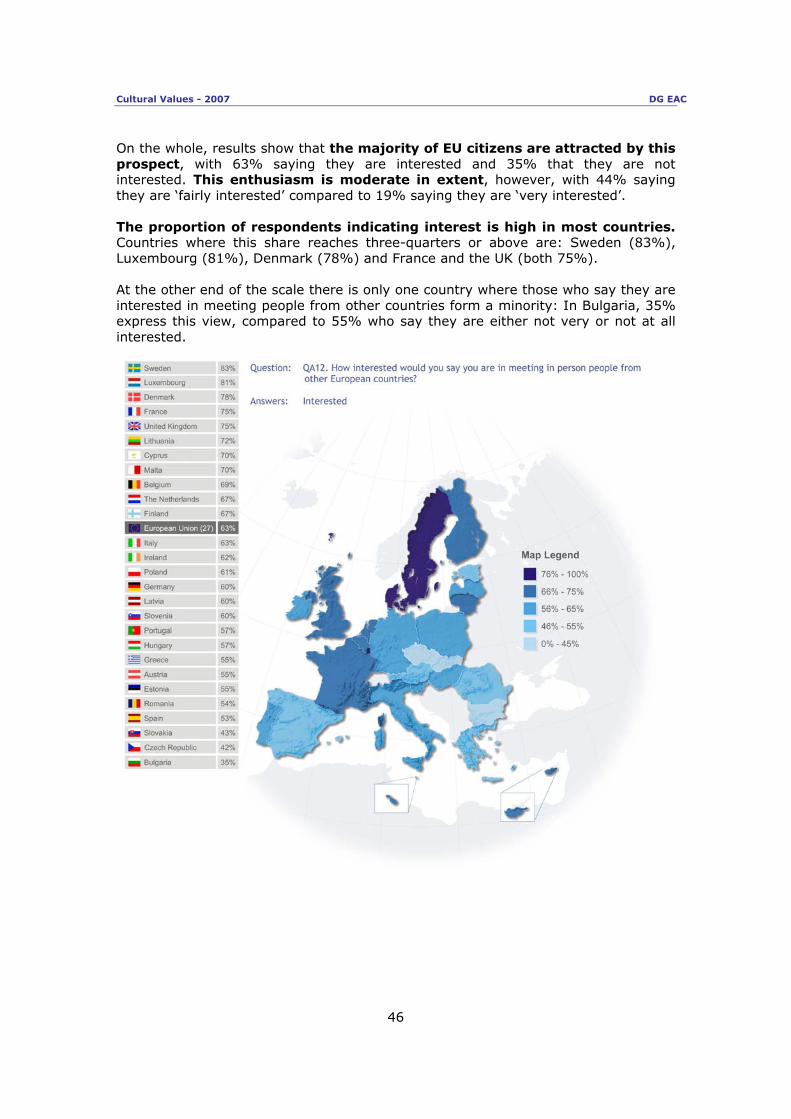
Cultural Values - 2007 DG EAC
46
On the whole, results show that the majority of EU citizens are attracted by this prospect, with 63% saying they are interested and 35% that they are not interested. This enthusiasm is moderate in extent, however, with 44% saying they are ‘fairly interested’ compared to 19% saying they are ‘very interested’. The proportion of respondents indicating interest is high in most countries. Countries where this share reaches three-quarters or above are: Sweden (83%), Luxembourg (81%), Denmark (78%) and France and the UK (both 75%). At the other end of the scale there is only one country where those who say they are interested in meeting people from other countries form a minority: In Bulgaria, 35% express this view, compared to 55% who say they are either not very or not at all interested.
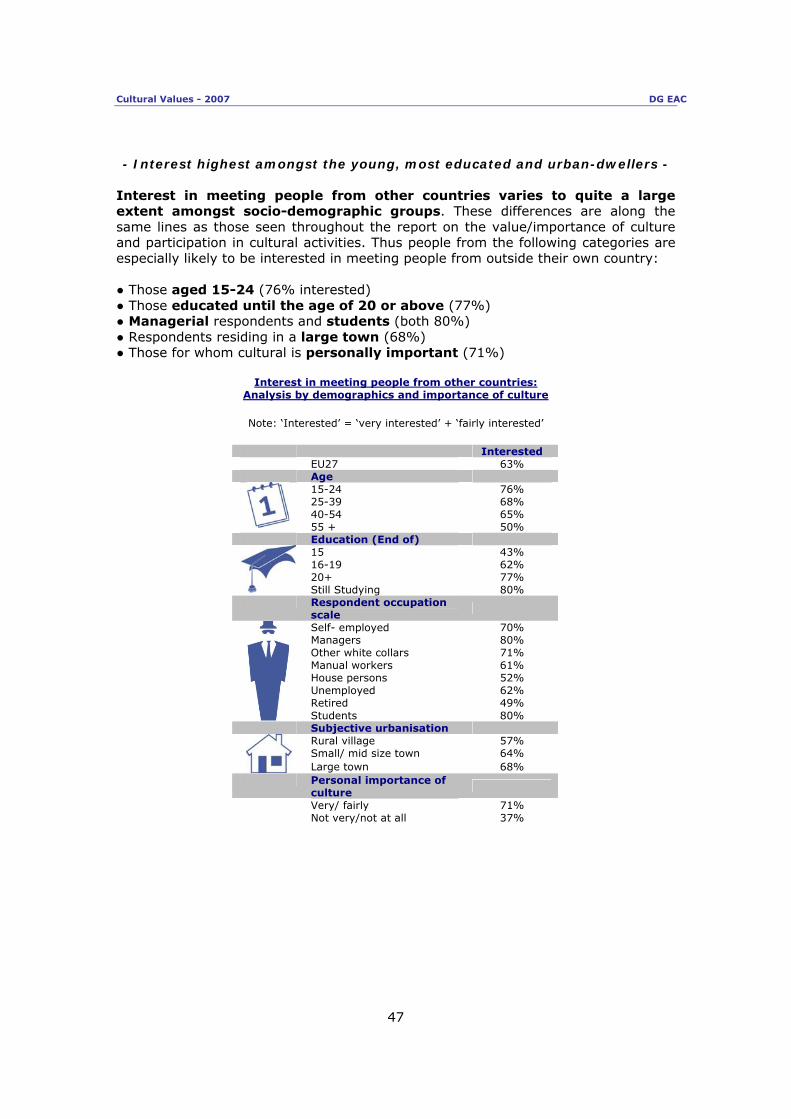
Cultural Values - 2007 DG EAC
47
- Interest highest amongst the young, most educated and urban-dwellers -
Interest in meeting people from other countries varies to quite a large extent amongst socio-demographic groups. These differences are along the same lines as those seen throughout the report on the value/importance of culture and participation in cultural activities. Thus people from the following categories are especially likely to be interested in meeting people from outside their own country: ● Those aged 15-24 (76% interested) ● Those educated until the age of 20 or above (77%) ● Managerial respondents and students (both 80%) ● Respondents residing in a large town (68%) ● Those for whom cultural is personally important (71%)
Interest in meeting people from other countries: Analysis by demographics and importance of culture
Note: ‘Interested’ = ‘very interested’ + ‘fairly interested’
Interested EU27 63% Age
15-24 76% 25-39 68% 40-54 65%
55 + 50% Education (End of)
15 43% 16-19 62% 20+ 77%
Still Studying 80% Respondent occupation
scale
Self- employed 70% Managers 80% Other white collars 71% Manual workers 61% House persons 52% Unemployed 62% Retired 49%
Students 80% Subjective urbanisation
Rural village 57% Small/ mid size town 64%
Large town 68% Personal importance of
culture
Very/ fairly 71% Not very/not at all 37%
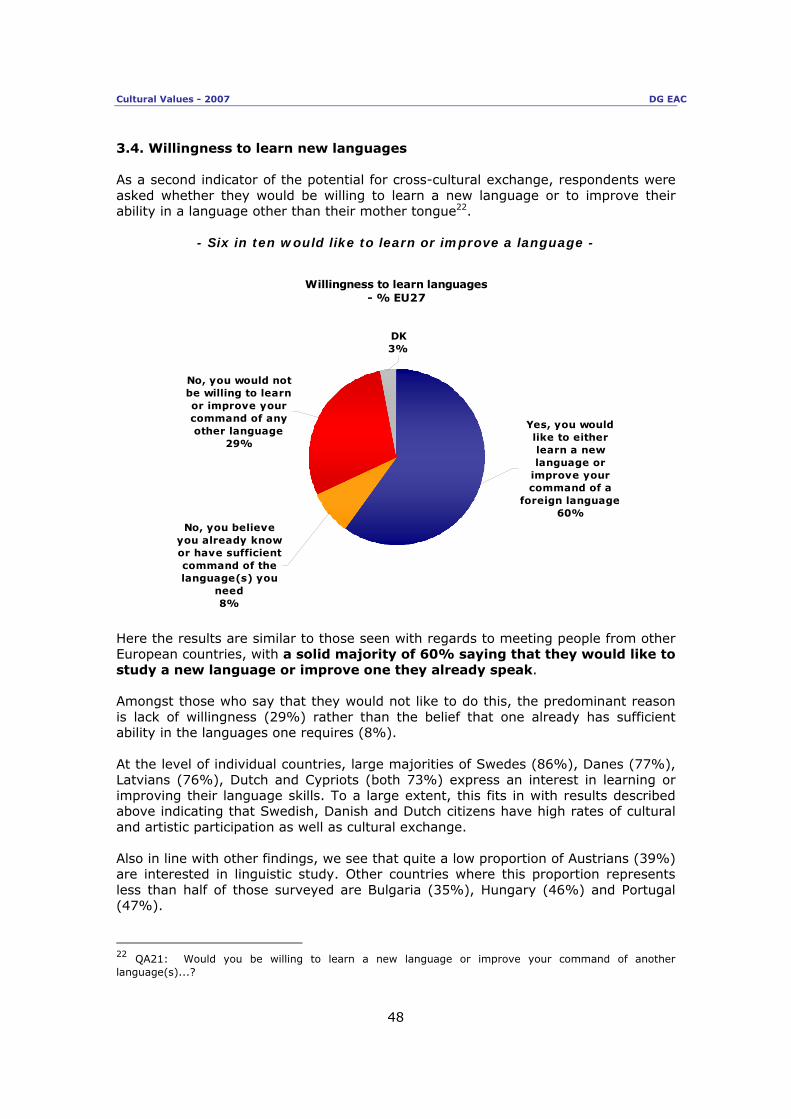
Cultural Values - 2007 DG EAC
48
3.4. Willingness to learn new languages As a second indicator of the potential for cross-cultural exchange, respondents were asked whether they would be willing to learn a new language or to improve their ability in a language other than their mother tongue22.
- Six in ten would like to learn or improve a language -
Willingness to learn languages- % EU27
Yes, you would like to either learn a new language or
improve your command of a
foreign language60%
No, you would not be willing to learn or improve your command of any other language
29%
No, you believe you already know or have sufficient command of the language(s) you
need8%
DK3%
Here the results are similar to those seen with regards to meeting people from other European countries, with a solid majority of 60% saying that they would like to study a new language or improve one they already speak. Amongst those who say that they would not like to do this, the predominant reason is lack of willingness (29%) rather than the belief that one already has sufficient ability in the languages one requires (8%). At the level of individual countries, large majorities of Swedes (86%), Danes (77%), Latvians (76%), Dutch and Cypriots (both 73%) express an interest in learning or improving their language skills. To a large extent, this fits in with results described above indicating that Swedish, Danish and Dutch citizens have high rates of cultural and artistic participation as well as cultural exchange. Also in line with other findings, we see that quite a low proportion of Austrians (39%) are interested in linguistic study. Other countries where this proportion represents less than half of those surveyed are Bulgaria (35%), Hungary (46%) and Portugal (47%).
22 QA21: Would you be willing to learn a new language or improve your command of another language(s)...?

Cultural Values - 2007 DG EAC
49
- Major differences in willingness for language study between social groups- Throughout the survey, we see that results fluctuate to a fair degree between different sectors of the population. This is perhaps true most of all when it comes to the matter of learning foreign languages, with the following substantial differences evident: ● The youngest group (83%) are almost two-and-a-half times more likely than the oldest (34%) to be interested in studying a foreign language. ● A similar gap is seen comparing those educated for the longest (77%) and the shortest (32%). ● Respondents born outside of Europe are especially likely (76%) to wish to improve or learn a language other than their own.

Cultural Values - 2007 DG EAC
50
● Respondents who work are more likely to want to improve their linguistic ability than those who do not. For example, 82% of managers would like to study a language, compared to 31% of the retired.
Willingness to study language(s): Analysis by demographics
Yes No DK EU27 60% 37% 3% Age
15-24 83% 15% 2% 25-39 77% 21% 2% 40-54 63% 34% 3%
55 + 34% 63% 3% Education (End of)
15 32% 65% 3% 16-19 61% 36% 3% 20+ 77% 21% 2%
Still Studying 87% 11% 2% Household composition
1 48% 49% 3% 2 52% 45% 3% 3 69% 29% 2%
4+ 71% 27% 2% Place of birth
Surveyed country 59% 38% 3% EU 67% 31% 2% Europe outside EU 64% 31% 5%
Outside Europe 76% 23% 1% Respondent occupation scale
Self- employed 68% 29% 3% Managers 82% 16% 2% Other white collars 74% 23% 3% Manual workers 64% 33% 3% House persons 48% 48% 4% Unemployed 65% 33% 2% Retired 31% 66% 3% Students 87% 11% 2%
Subjective urbanisation Rural village 55% 42% 3% Small/ mid size town 61% 36% 3%
Large town 64% 33% 3%
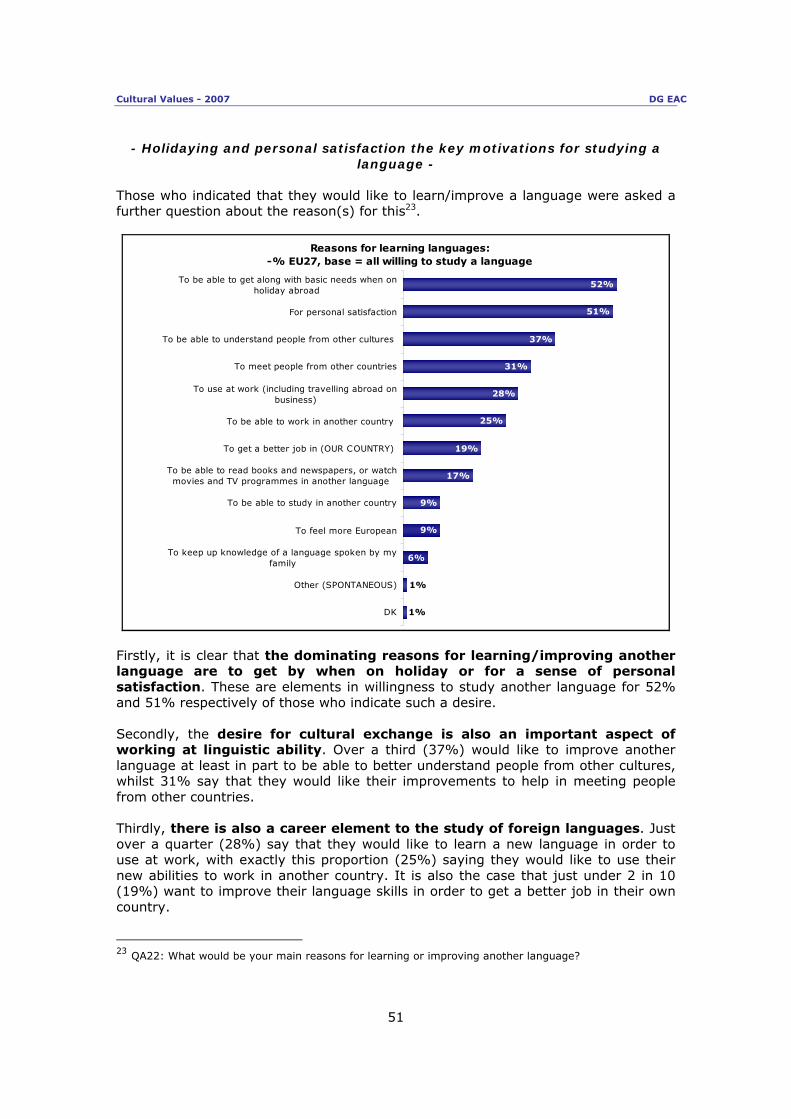
Cultural Values - 2007 DG EAC
51
- Holidaying and personal satisfaction the key motivations for studying a language -
Those who indicated that they would like to learn/improve a language were asked a further question about the reason(s) for this23.
Reasons for learning languages:-% EU27, base = all willing to study a language
52%
51%
37%
31%
28%
25%
17%
1%
1%
19%
9%
9%
6%
To be able to get along with basic needs when onholiday abroad
For personal satisfaction
To be able to understand people from other cultures
To meet people from other countries
To use at work (including travelling abroad onbusiness)
To be able to work in another country
To get a better job in (OUR COUNTRY)
To be able to read books and newspapers, or watchmovies and TV programmes in another language
To be able to study in another country
To feel more European
To keep up knowledge of a language spoken by myfamily
Other (SPONTANEOUS)
DK
Firstly, it is clear that the dominating reasons for learning/improving another language are to get by when on holiday or for a sense of personal satisfaction. These are elements in willingness to study another language for 52% and 51% respectively of those who indicate such a desire. Secondly, the desire for cultural exchange is also an important aspect of working at linguistic ability. Over a third (37%) would like to improve another language at least in part to be able to better understand people from other cultures, whilst 31% say that they would like their improvements to help in meeting people from other countries. Thirdly, there is also a career element to the study of foreign languages. Just over a quarter (28%) say that they would like to learn a new language in order to use at work, with exactly this proportion (25%) saying they would like to use their new abilities to work in another country. It is also the case that just under 2 in 10 (19%) want to improve their language skills in order to get a better job in their own country. 23 QA22: What would be your main reasons for learning or improving another language?

Cultural Values - 2007 DG EAC
52
In terms of individual country results, we note briefly the following: ● The prospect of working abroad is particularly a motivating factor for studying languages in the two newest entrants in the EU (Romania 47%, BG 46%). ● Linguistic skills are also especially seen as conferring better job possibilities on one’s home country in Hungary (42%) and Romania (40%). ● Motivation for learning languages takes on a multi-faceted nature in several countries. For example, in Sweden, being able to get by on holiday (62%), to meet people from other countries (49%) and to understand people from other cultures (47%) are all major motivations.
Reasons for studying language(s): Highest Rates by Country
EU
1st
2nd 3rd
Basic needs on holiday 52%
NL (67%)
DE
(66%)
BE, SE (62%)
Personal satisfaction 51%
MT (71%)
CY, LU (68%)
Understand people from other cultures
37%
AT (57%)
DK
(52%)
SE, EE
(47%)
Meet people from other countries
31%
SE (49%)
DK
(48%)
LU, FR
(40%)
To use at work 28%
EE (46%)
HU, SK (42%)
To be able to work in another country
25%
RO (47%)
BG
(46%)
SK
(44%)
To get a better job in own country
19%
HU (42%)
RO
(40%)
SK
(35%) To read
books/newspapers or watch TV/movies in
other language
17%
EE (34%)
SE
(32%)
FI
(30%)
To be able to study in another country
9%
EE (21%)
RO
(18%)
SK
(16%)
To feel more European 9%
BG, SK (16%)
LU
(15%)
To keep up knowledge of a family language
6%
LU (11%)
DK, BE (10%)

Cultural Values - 2007 DG EAC
53
- Work is also an important factor in the young studying languages -
Regarding age, it appears that the reason for the motivation for linguistic study of a greater share of the 15-24 age group is largely work and study related. Compared to those aged 55 and above, this youngest group is: ● 39 percentage points more likely to mention the possibility of working abroad ● 30 points more likely to say they could get a better job in their own country ● 27 points more likely to say they wish to use the language in their current employment ● 25 points more likely to say the language would be to help study abroad ● 15 points less likely to say that the purpose of improving a language would be for personal satisfaction
Selected reasons for studying language(s): Analysis by Age
Note: Ranked according to percentage point difference (15-24)-(55+)
15-24 25-39 40-54 55 + Difference: youngest -
oldest To be able to work in another
country 44% 28% 20% 5% 39%
To get a better job in own country
34% 24% 14% 4% 30%
To use at work 37% 33% 27% 10% 27%
To be able to study in another country 28% 6% 3% 3% 25%
Personal satisfaction 43% 50% 53% 58% -15%
That work is a key factor in linguistic needs can also be seen from results analysed according to respondents’ occupation. If we examine in particular the results for the unemployed and students, for whom future employability is a key concern, we can see that possession of linguistic skill is seen as conferring better job prospects, both at home and abroad. As an example, almost half (48%) of all students who wish to study another language would like to do so in order to be able to work in another country, with this figure much higher than other occupational groupings. Meanwhile 29% of the unemployed who wish to improve their language skills say that this would be to enhance their ability to get a better job in the country where they live. This figure is higher than for any other occupational group, apart from students (35%).
Selected reasons for studying language(s): Analysis by occupation
To use at work
To be able to work in another country
To get a better job
in own country
Self- employed 33% 23% 12% Managers 39% 23% 15% Other white collars 30% 20% 24% Manual workers 28% 28% 20% House persons 11% 14% 15% Unemployed 30% 35% 29% Retired 5% 6% 3% Students 39% 48% 35%

Cultural Values - 2007 DG EAC
54
3.5. Actions to further cross-national understanding The place of language in cross-cultural understanding is evident again when we examine results to a question where respondents asked in which ways Europeans could be helped to know each other better24.
- Education seen as the best way to help foster cross-national understanding within Europe -
Here the most frequently given answer is to develop the teaching of foreign languages at school, with this mentioned by over half (56%) of all asked. Education, it seems, is seen as the key to furthering understanding across borders as in addition to the teaching of languages at school, the second most popular answer, with 41%, is to increase exchange programmes - such as the Leonardo and Erasmus schemes - for students and teachers.
Ways in which Europeans could be helped to know each other better:-% EU27
56%
41%
31%
27%
23%
22%
17%
18%
8%
1%
6%
Develop the teaching of foreign languages atschool
Increase exchange programmes for students andteachers, such as Erasmus or Leonardo
Implement programmes enabling people who donot usually travel to meet one another
Support town twinning across Europe
Support the production of TV documentariesabout other EU member states
Help finance the preservation of historical,architectural and artistic heritage in Europe
Nominate an annual European Capital of Culture,in which many events are organized
Support exhibitions and live performances (suchas plays and concerts) to tour beyond national
borders
Support the distribution of movies originatingfrom other EU member states
Other (SPONTANEOUS)
DK
24 QA20: From the following list, please choose three actions that would best help Europeans get to know each other better.
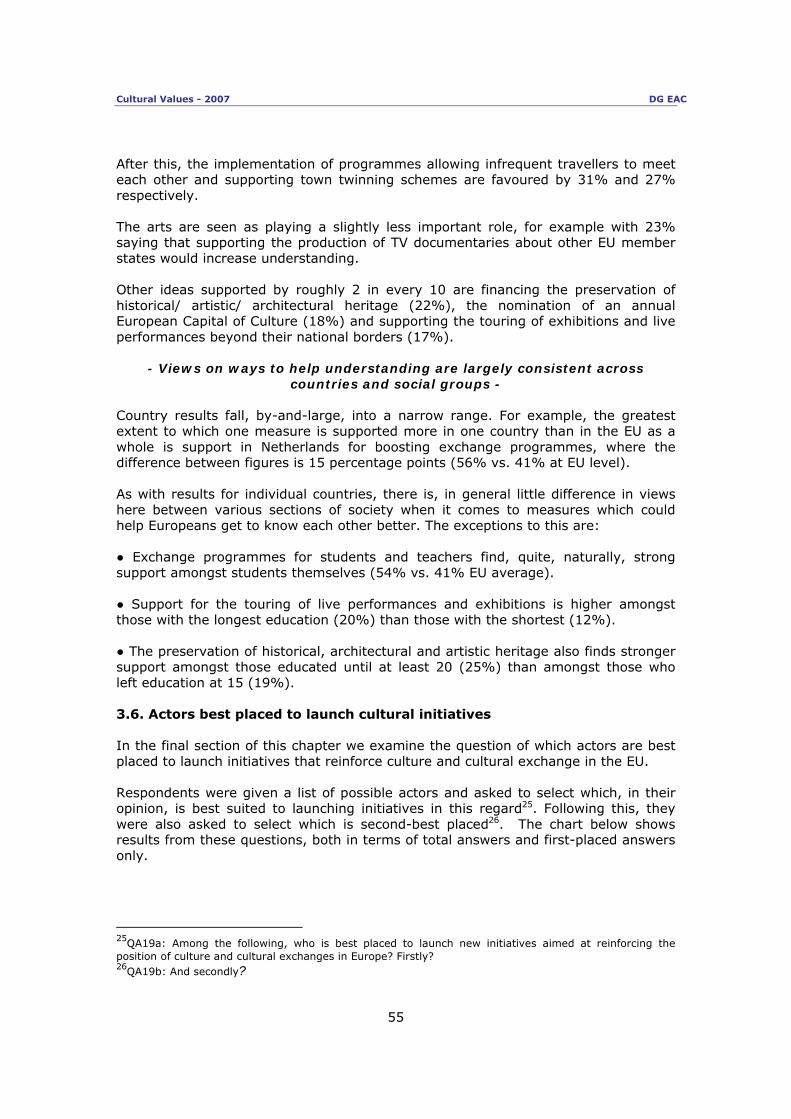
Cultural Values - 2007 DG EAC
55
After this, the implementation of programmes allowing infrequent travellers to meet each other and supporting town twinning schemes are favoured by 31% and 27% respectively. The arts are seen as playing a slightly less important role, for example with 23% saying that supporting the production of TV documentaries about other EU member states would increase understanding. Other ideas supported by roughly 2 in every 10 are financing the preservation of historical/ artistic/ architectural heritage (22%), the nomination of an annual European Capital of Culture (18%) and supporting the touring of exhibitions and live performances beyond their national borders (17%).
- Views on ways to help understanding are largely consistent across countries and social groups -
Country results fall, by-and-large, into a narrow range. For example, the greatest extent to which one measure is supported more in one country than in the EU as a whole is support in Netherlands for boosting exchange programmes, where the difference between figures is 15 percentage points (56% vs. 41% at EU level). As with results for individual countries, there is, in general little difference in views here between various sections of society when it comes to measures which could help Europeans get to know each other better. The exceptions to this are: ● Exchange programmes for students and teachers find, quite, naturally, strong support amongst students themselves (54% vs. 41% EU average). ● Support for the touring of live performances and exhibitions is higher amongst those with the longest education (20%) than those with the shortest (12%). ● The preservation of historical, architectural and artistic heritage also finds stronger support amongst those educated until at least 20 (25%) than amongst those who left education at 15 (19%). 3.6. Actors best placed to launch cultural initiatives In the final section of this chapter we examine the question of which actors are best placed to launch initiatives that reinforce culture and cultural exchange in the EU. Respondents were given a list of possible actors and asked to select which, in their opinion, is best suited to launching initiatives in this regard25. Following this, they were also asked to select which is second-best placed26. The chart below shows results from these questions, both in terms of total answers and first-placed answers only.
25QA19a: Among the following, who is best placed to launch new initiatives aimed at reinforcing the position of culture and cultural exchanges in Europe? Firstly? 26QA19b: And secondly?
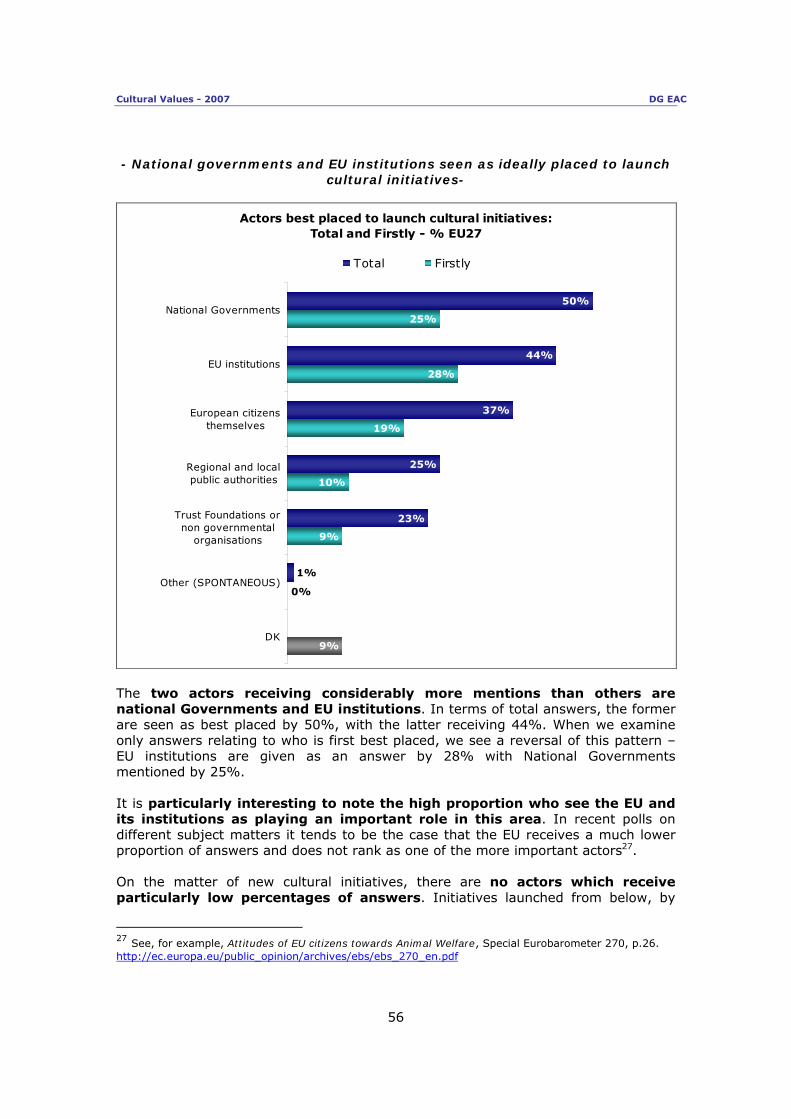
Cultural Values - 2007 DG EAC
56
- National governments and EU institutions seen as ideally placed to launch
cultural initiatives-
Actors best placed to launch cultural initiatives: Total and Firstly - % EU27
50%
44%
37%
25%
23%
25%
28%
19%
10%
9%
1%
9%
0%
National Governments
EU institutions
European citizensthemselves
Regional and localpublic authorities
Trust Foundations ornon governmental
organisations
Other (SPONTANEOUS)
DK
Total Firstly
The two actors receiving considerably more mentions than others are national Governments and EU institutions. In terms of total answers, the former are seen as best placed by 50%, with the latter receiving 44%. When we examine only answers relating to who is first best placed, we see a reversal of this pattern – EU institutions are given as an answer by 28% with National Governments mentioned by 25%. It is particularly interesting to note the high proportion who see the EU and its institutions as playing an important role in this area. In recent polls on different subject matters it tends to be the case that the EU receives a much lower proportion of answers and does not rank as one of the more important actors27. On the matter of new cultural initiatives, there are no actors which receive particularly low percentages of answers. Initiatives launched from below, by
27 See, for example, Attitudes of EU citizens towards Animal Welfare, Special Eurobarometer 270, p.26. http://ec.europa.eu/public_opinion/archives/ebs/ebs_270_en.pdf

Cultural Values - 2007 DG EAC
57
European citizens themselves are mentioned by 37% of the poll. Local and regional public authorities receive exactly a quarter (25%) of total mentions, although it should be noted that this figure is only half the size of that for national Governments – it is clear therefore that national rather than local level is the point at which many citizens feel the state should become involved in cultural affairs. Finally, non-governmental organisations and trust foundations comes at the bottom of the list, although at 23% these are still mentioned as being well-placed by almost a quarter. In terms of results by country, we see that national governments are seen as well-placed to launch initiatives by citizens in Greece and Cyprus (both 65%). The same is true of the Portuguese (62%), who also envision an important role for EU institutions (64%). Initiatives launched ‘from below’ (i.e. by European citizens themselves) are viewed particularly well in Sweden (52%). Meanwhile, civil society, in the form of trust foundations or NGOs are seen as being well-placed to launch cultural initiatives by respondents from the neighbouring states of the Czech Republic (43%) and Slovakia (37%).
Actors best-placed to launch cultural initiatives: Highest Rates by Country
National Governments
EU figures
EU27, 50%
Greece (65%)
Cyprus (65%) Highest figures by
country
Portugal (62%)
EU Institutions
EU figures
EU27, 44%
Portugal (64%)
Romania (57%) Highest figures by
country
Cyprus, Bulgaria (54%)
Socio-demographic
factor EDUCATION: Favoured more by those educated to 20+ (48%)
European citizens themselves
EU figures
EU27, 37%
Sweden (52%)
Luxembourg (49%) Highest figures by country
Finland, Denmark, France (48%)
Socio-demographic factor
AGE: favoured more by those aged 15-24 (42%)
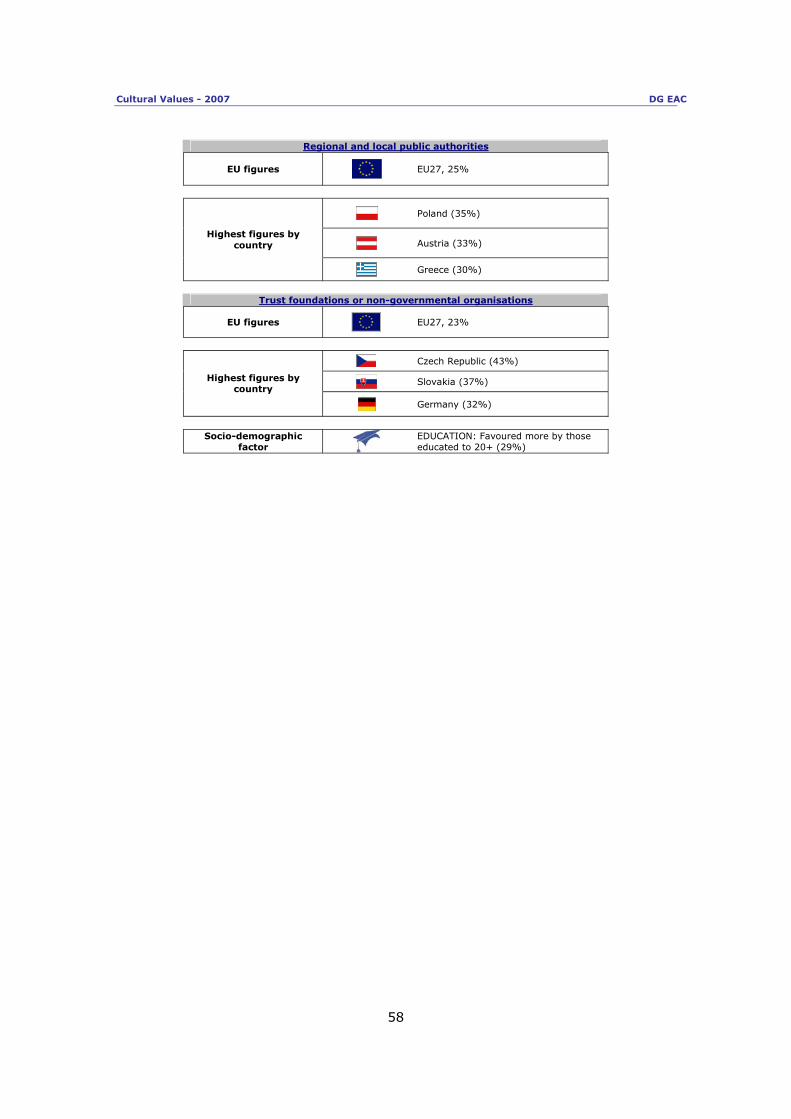
Cultural Values - 2007 DG EAC
58
Regional and local public authorities
EU figures
EU27, 25%
Poland (35%)
Austria (33%) Highest figures by
country
Greece (30%)
Trust foundations or non-governmental organisations
EU figures
EU27, 23%
Czech Republic (43%)
Slovakia (37%) Highest figures by country
Germany (32%)
Socio-demographic
factor EDUCATION: Favoured more by those educated to 20+ (29%)
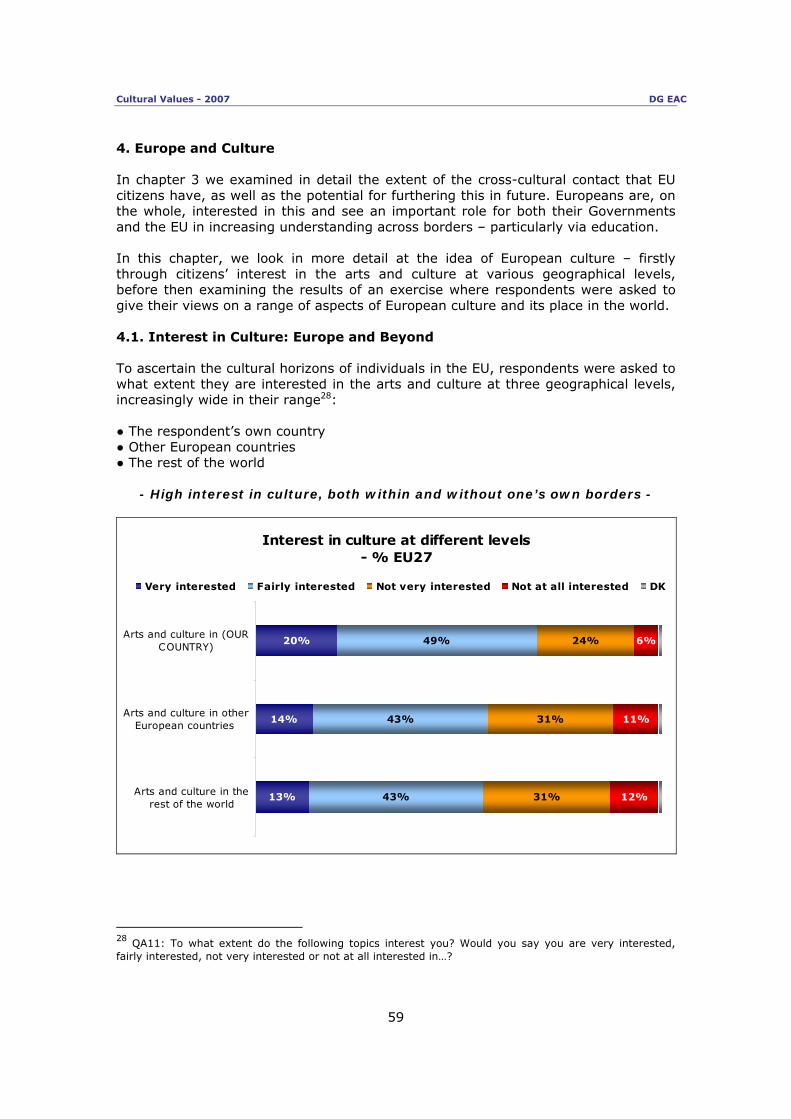
Cultural Values - 2007 DG EAC
59
4. Europe and Culture In chapter 3 we examined in detail the extent of the cross-cultural contact that EU citizens have, as well as the potential for furthering this in future. Europeans are, on the whole, interested in this and see an important role for both their Governments and the EU in increasing understanding across borders – particularly via education. In this chapter, we look in more detail at the idea of European culture – firstly through citizens’ interest in the arts and culture at various geographical levels, before then examining the results of an exercise where respondents were asked to give their views on a range of aspects of European culture and its place in the world. 4.1. Interest in Culture: Europe and Beyond To ascertain the cultural horizons of individuals in the EU, respondents were asked to what extent they are interested in the arts and culture at three geographical levels, increasingly wide in their range28: ● The respondent’s own country ● Other European countries ● The rest of the world
- High interest in culture, both within and without one’s own borders -
Interest in culture at different levels- % EU27
20%
14%
13%
49%
43%
43%
24%
31%
31%
6%
11%
12%
Arts and culture in (OURCOUNTRY)
Arts and culture in otherEuropean countries
Arts and culture in therest of the world
Very interested Fairly interested Not very interested Not at all interested DK
28 QA11: To what extent do the following topics interest you? Would you say you are very interested, fairly interested, not very interested or not at all interested in…?

Cultural Values - 2007 DG EAC
60
There are several points that can be made regarding results here. Firstly, regardless of geographical level, we see that a majority of people say they are interested in arts and culture. This reflects the results we have seen earlier regarding the personal importance of culture. However, we should also note that this interest is somewhat lukewarm in nature, with considerably more saying they are ‘fairly interested’ rather than ‘very interested’. This gap is 30 percentage points for arts and culture at a global level and 29 percentage points for that at national and European level. Secondly, it can be seen that slightly more respondents are interested in arts and culture in their own country rather than outside it. Almost 7 in 10 (69%) indicate an interest related to their own country, with this figure dropping to 57% (a gap of -12 percentage points) for other European countries and 56% (-13 points) for the rest of the world. However, we should stress that despite this gap, the majority remain interested in culture outside of their national borders. Thirdly, we can see that regardless of whether Europe or the rest of the world is under consideration, there is little differentiation in interest in culture outside one’s own country – only one percentage point more say they are interested in the former (57%) than the latter (56%), with this gap exactly the same when we consider only those who say they are ‘very interested’ (14% other European countries vs. 13% rest of the world).
- Countries where citizens are most interested in national culture and the arts are also those where this interest is most likely to extend beyond
national borders - It is interesting to analyse results divided according to country. What these show is that, with some exceptions, if citizens in one country are relatively interested in culture and the arts, they tend to be so at all geographical levels. Thus, for example, a high proportion of Latvians say they are interested in the arts and culture in their own country (78%; +9 points vs. 69% EU average). They are even more likely - relative to the EU average - to say the same of culture and the arts in other European countries (70%; +13 points vs. 57% EU average) and the rest of the world (71%; +15 points vs. 56% EU average). The same observation also seems to hold true at the opposite end of the scale, for example with 17 percentage points fewer of Bulgarians (52% vs. EU average 69%) interested in culture in their own country, 18 points fewer interested with regards to other European countries (39% vs. EU average 57%) and 21 points fewer for arts and culture in the rest of the world (35% vs. EU average 56%).

Cultural Values - 2007 DG EAC
61
4.2. Aspects of European Culture To obtain a clearer view of how Europeans view culture in their continent, respondents were asked to what extent their own views correspond to a series of statements relating to culture’s place in Europe, the existence of a ‘European culture’, factors underlying such a culture and the place of European culture in an increasingly globalised world29. We examine each of these themes in turn. (i) The place of culture in Europe
- A majority of Europeans see their continent as being ‘the continent of culture’ -
There is evidence of some feeling that the place of culture defines the European continent. When presented with the statement ‘Europe is clearly the continent of culture’, over two-thirds (67%) say that this sums up their opinion well, with less than a quarter (24%) saying that this corresponds badly to their own views. However, this feeling is not an especially strong one, with 44% saying that this approximates to their own views ‘fairly well’ compared to the 23% who say this reflects their own ideas ‘very well’.
Europe is clearly the continent of culture- % EU27
Very well23%
Fairly badly18%
Fairly well44%
Very badly6%
DK9%
29 QA13 : I will now read out several statements or opinions that are sometimes heard. For each one, please tell me if it corresponds very well, fairly well, fairly badly or very badly to what you think personally.

Cultural Values - 2007 DG EAC
62
There is a wide range in results by country, with 92% of Slovaks and 89% of Czechs expressing that their views converge with the statement, with these proportions over twice as high as the 39% of Dutch respondents expressing the same views.
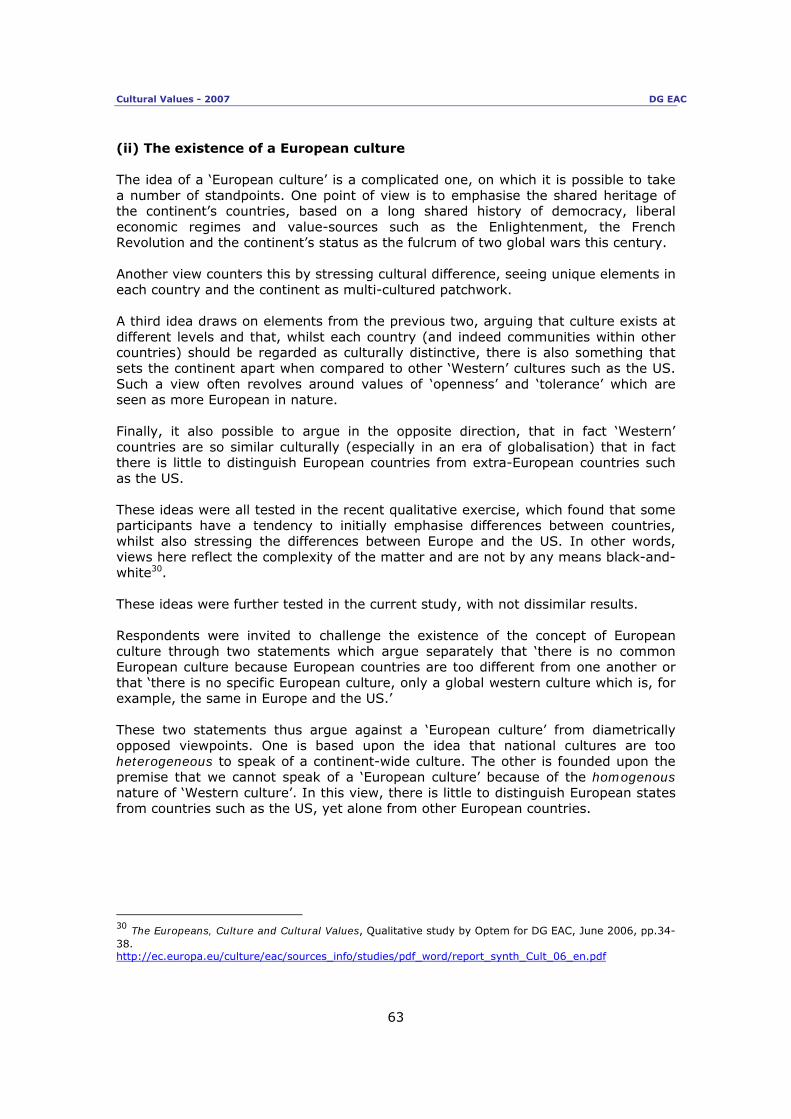
Cultural Values - 2007 DG EAC
63
(ii) The existence of a European culture The idea of a ‘European culture’ is a complicated one, on which it is possible to take a number of standpoints. One point of view is to emphasise the shared heritage of the continent’s countries, based on a long shared history of democracy, liberal economic regimes and value-sources such as the Enlightenment, the French Revolution and the continent’s status as the fulcrum of two global wars this century. Another view counters this by stressing cultural difference, seeing unique elements in each country and the continent as multi-cultured patchwork. A third idea draws on elements from the previous two, arguing that culture exists at different levels and that, whilst each country (and indeed communities within other countries) should be regarded as culturally distinctive, there is also something that sets the continent apart when compared to other ‘Western’ cultures such as the US. Such a view often revolves around values of ‘openness’ and ‘tolerance’ which are seen as more European in nature. Finally, it also possible to argue in the opposite direction, that in fact ‘Western’ countries are so similar culturally (especially in an era of globalisation) that in fact there is little to distinguish European countries from extra-European countries such as the US. These ideas were all tested in the recent qualitative exercise, which found that some participants have a tendency to initially emphasise differences between countries, whilst also stressing the differences between Europe and the US. In other words, views here reflect the complexity of the matter and are not by any means black-and-white30. These ideas were further tested in the current study, with not dissimilar results. Respondents were invited to challenge the existence of the concept of European culture through two statements which argue separately that ‘there is no common European culture because European countries are too different from one another or that ‘there is no specific European culture, only a global western culture which is, for example, the same in Europe and the US.’ These two statements thus argue against a ‘European culture’ from diametrically opposed viewpoints. One is based upon the idea that national cultures are too heterogeneous to speak of a continent-wide culture. The other is founded upon the premise that we cannot speak of a ‘European culture’ because of the homogenous nature of ‘Western culture’. In this view, there is little to distinguish European states from countries such as the US, yet alone from other European countries.
30 The Europeans, Culture and Cultural Values, Qualitative study by Optem for DG EAC, June 2006, pp.34-38. http://ec.europa.eu/culture/eac/sources_info/studies/pdf_word/report_synth_Cult_06_en.pdf

Cultural Values - 2007 DG EAC
64
- The idea of a common European culture is challenged by some on the grounds of cultural difference -
Results show that there is a degree of acceptance of the former idea on lack of shared commonality within Europe, but much less so for the latter argument based on a monolithic global Western culture.
There is no common European culture because European countries are too different from one another
- % EU27
Very well15%
Fairly badly29%
Fairly well38%
Very badly9%
DK9%
As can be seen from the chart above, a slight majority (53%) say that their views correspond well with the statement that European countries are too diverse to speak of a common continental culture. This figure is 15 percentage points higher than the 38% who say this represents their views badly. Amongst those saying this is a good approximation of their views, over twice as many give the more moderate ‘fairly well’ answer (38%) as say that this matches their opinion ‘very well’ (15%). By contrast, the statement related to the categorisation of Europe within the overarching category of ‘Western culture’ received the endorsement of less than a third (32%). Only 7% say that this matches their opinion ‘very well’. Over half (55%) say that their views are not close to this, with 34% giving a ‘fairly badly’ answer and 21% a ‘very badly’ answer.
There is no specific European culture, only a global western culture which is, for example,
the same in Europe and the US - % EU27
Very well7%
Fairly badly34%
Fairly well25%
Very badly21%
DK13%

Cultural Values - 2007 DG EAC
65
Here it may well be the case that, due to the reasonably widespread existence in Europe of negative perceptions of the US, we see a higher level of rejection of the idea of a global Western culture than would otherwise be the case without the introduction of this comparison. In sum, we see that at the level of the EU as a whole the majority of citizens conceive of their continent as being distinct in some way from ‘Western culture’ as a wider category, but that a majority also see a considerably degree of cultural difference within the continent itself.
- Europe is seen as culturally coherent compared to other continents - However, though many call into doubt whether commonality exists to a sufficient extent to speak of an absolute continental cultural identity, it is also the case that when considered relative to other continents, Europe is seen as sharing elements of a collective culture. This can be seen from responses to the statement that ‘when compared to other continents, it is much easier to see what Europeans have in common culturally’.
When compared to other continents, it is much easier to see what Europeans have in common culturally
- % EU27
Very well17%
Fairly badly15%
Fairly well50%
Very badly4%
DK14%
Here, over two-thirds (67%) state that the phrase matches their own views well, a figure comfortably over three times higher than those who say this idea is out of synch with their own opinion (19%). As with the other statements considered up to this point, agreement tends to be slightly cautious in nature, with 50% saying the statement matches their views ‘fairly well’ compared to 17% saying it matches their beliefs ‘very well’. It should also be noted that a high proportion - 14% - experience difficulty evaluating the relative cultural homogeneity of Europe and give a ‘don’t know’ answer.
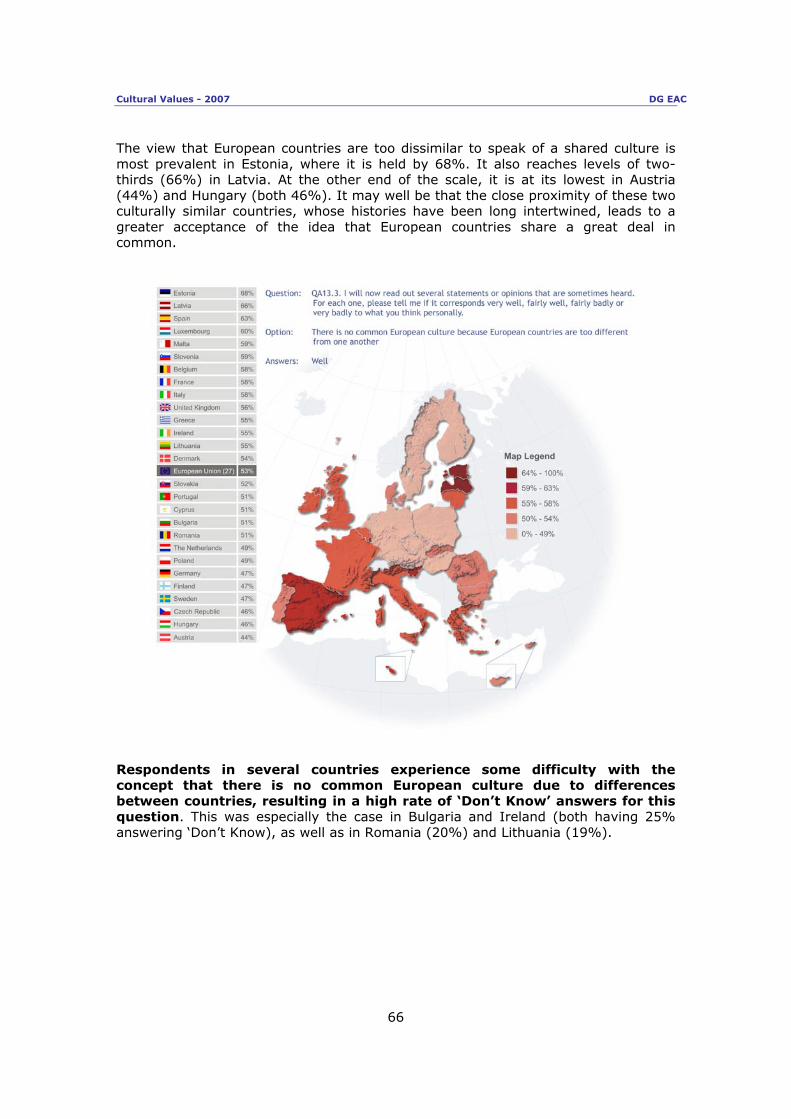
Cultural Values - 2007 DG EAC
66
The view that European countries are too dissimilar to speak of a shared culture is most prevalent in Estonia, where it is held by 68%. It also reaches levels of two-thirds (66%) in Latvia. At the other end of the scale, it is at its lowest in Austria (44%) and Hungary (both 46%). It may well be that the close proximity of these two culturally similar countries, whose histories have been long intertwined, leads to a greater acceptance of the idea that European countries share a great deal in common.
Respondents in several countries experience some difficulty with the concept that there is no common European culture due to differences between countries, resulting in a high rate of ‘Don’t Know’ answers for this question. This was especially the case in Bulgaria and Ireland (both having 25% answering ‘Don’t Know), as well as in Romania (20%) and Lithuania (19%).
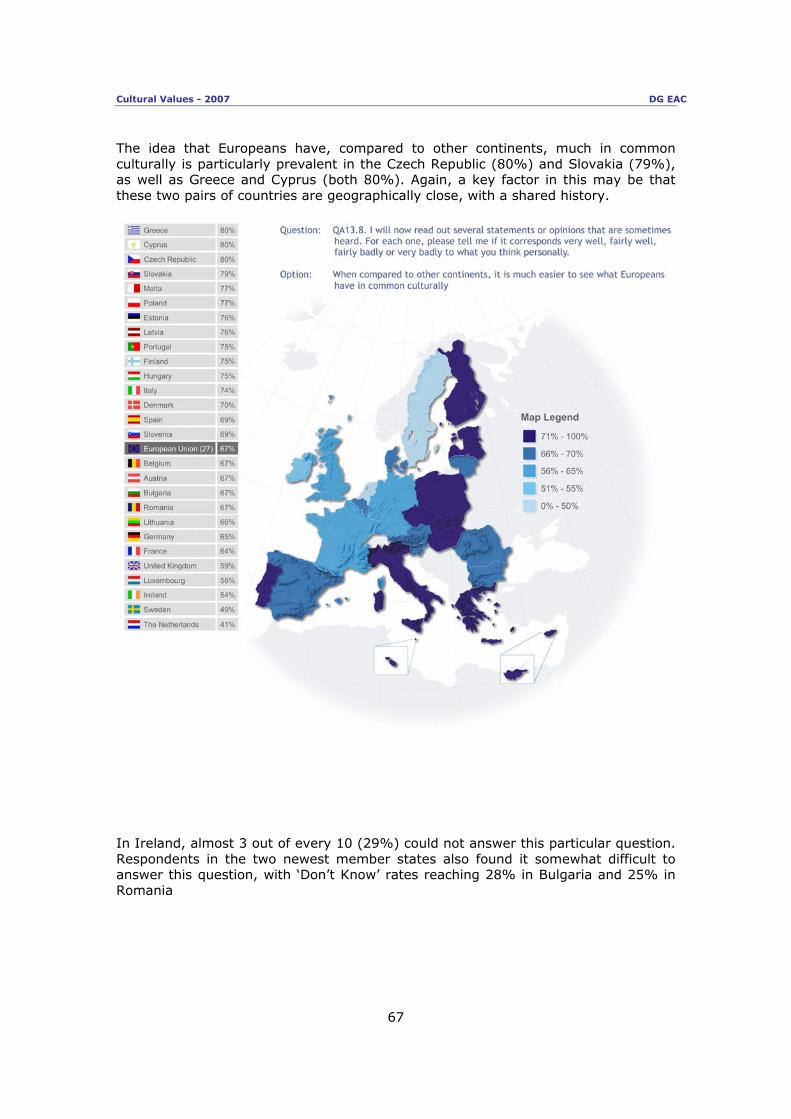
Cultural Values - 2007 DG EAC
67
The idea that Europeans have, compared to other continents, much in common culturally is particularly prevalent in the Czech Republic (80%) and Slovakia (79%), as well as Greece and Cyprus (both 80%). Again, a key factor in this may be that these two pairs of countries are geographically close, with a shared history.
In Ireland, almost 3 out of every 10 (29%) could not answer this particular question. Respondents in the two newest member states also found it somewhat difficult to answer this question, with ‘Don’t Know’ rates reaching 28% in Bulgaria and 25% in Romania
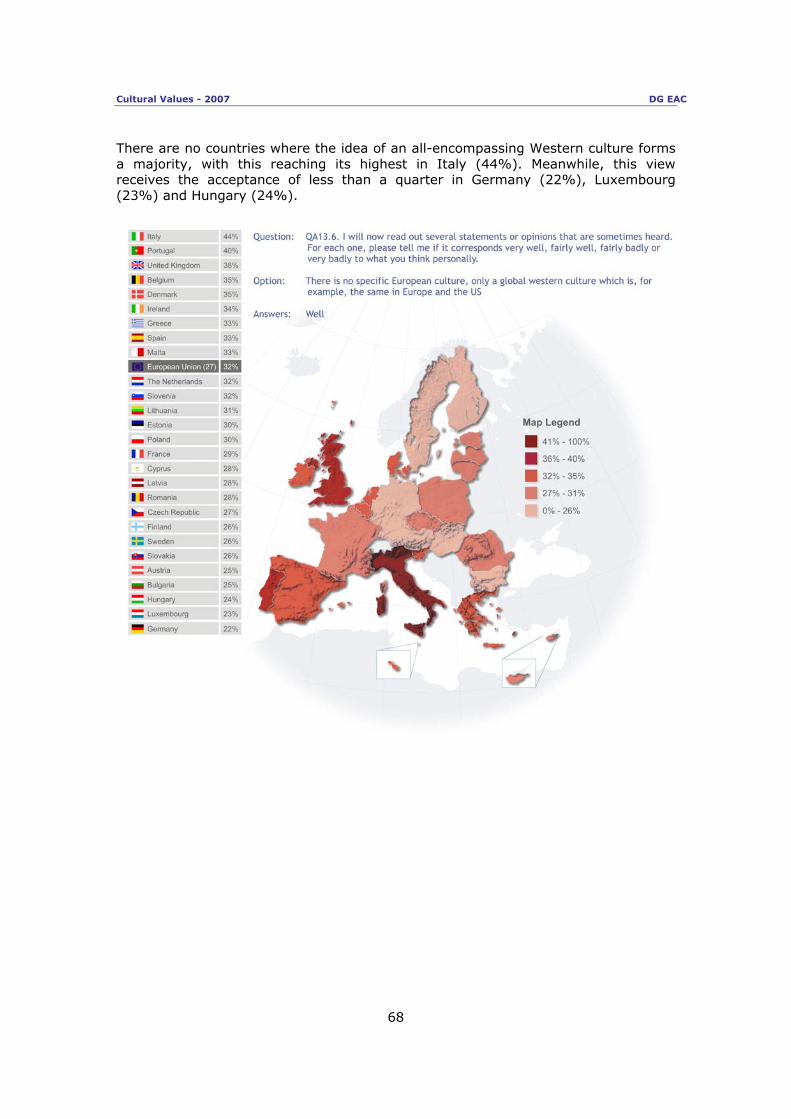
Cultural Values - 2007 DG EAC
68
There are no countries where the idea of an all-encompassing Western culture forms a majority, with this reaching its highest in Italy (44%). Meanwhile, this view receives the acceptance of less than a quarter in Germany (22%), Luxembourg (23%) and Hungary (24%).

Cultural Values - 2007 DG EAC
69
(iii) Sources of European culture Views on the existence of European culture are complex, with the ideas that the continent is cultural distinct from the other parts of ‘the West’ and that there exists a greater degree of shared culture in Europe co-existing alongside the opinion that, internally, national cultures are separate to the extent that their differences make it difficult to talk of a single shared culture. One way of interpreting this is to take the view that in the public mind there are different levels of culture which both overlap and co-exist. National cultures are perceived to be evident, yet at the same time there is something which is seen to give Europe a unique character. Indeed, it could be possible to argue that the very diversity inherent in the collective cultures of European nations is what characterises European culture. This idea is, in fact, one that appears to be particularly prevalent amongst EU citizens. Respondents were given for consideration the statement ‘It’s the diversity of European culture that sets it apart and gives it its particular value’. - Diversity in itself is seen as a particular feature of European culture, along
with an inherited shared history -
It’s the diversity of European culture that sets it apart and gives it its particular value
- % EU27
Very well24%
Fairly badly11%
Fairly well52%
Very badly2%
DK11%
Here over three-quarters (76%) agree with the idea of European culture being unique and valuable in its diversity, with just 13% saying that this viewpoint corresponds badly with their own. Again, however, it should be noted that over twice as many say that the statement corresponds ‘fairly well’ (52%) compared to those saying it corresponds ‘very well’ (24%).
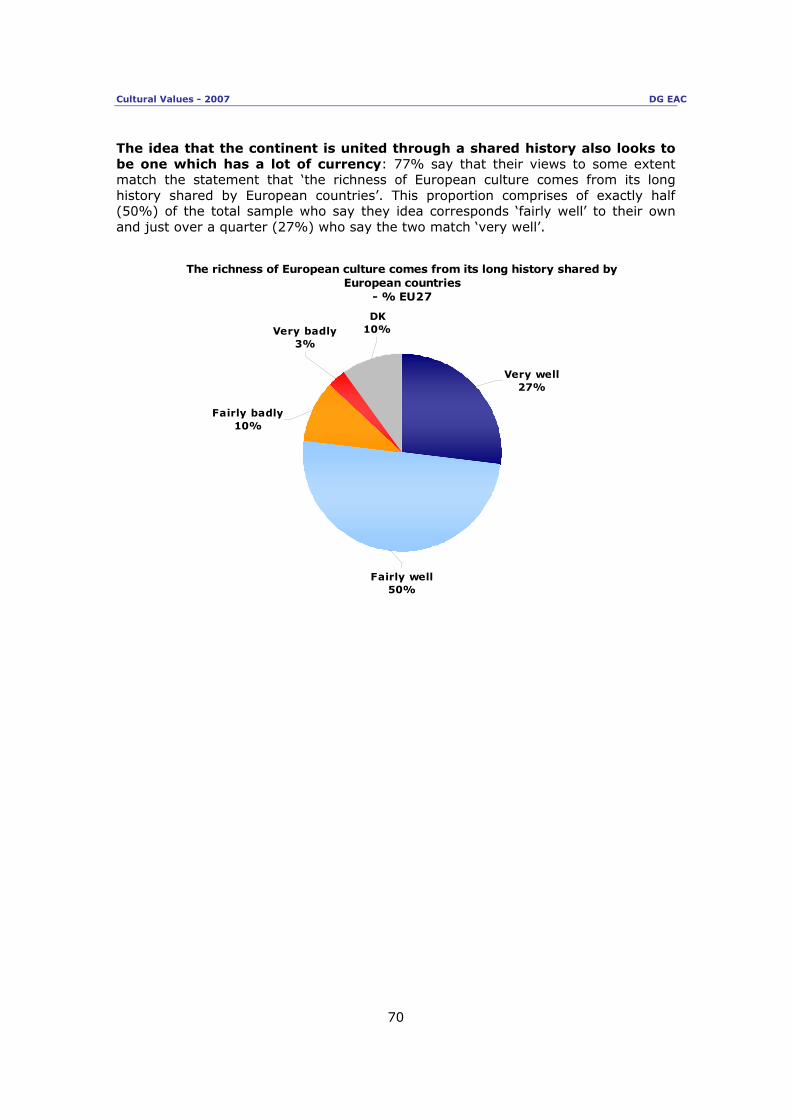
Cultural Values - 2007 DG EAC
70
The idea that the continent is united through a shared history also looks to be one which has a lot of currency: 77% say that their views to some extent match the statement that ‘the richness of European culture comes from its long history shared by European countries’. This proportion comprises of exactly half (50%) of the total sample who say they idea corresponds ‘fairly well’ to their own and just over a quarter (27%) who say the two match ‘very well’.
The richness of European culture comes from its long history shared by European countries
- % EU27
Very well27%
Fairly badly10%
Fairly well50%
Very badly3%
DK10%
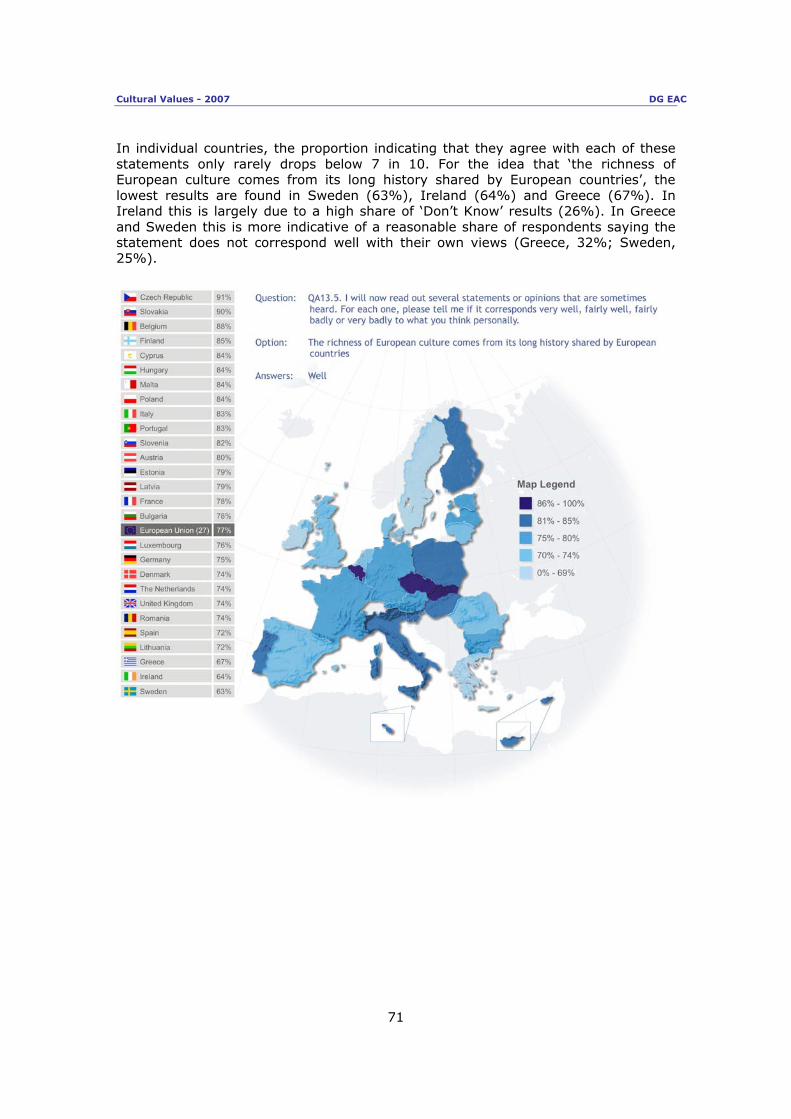
Cultural Values - 2007 DG EAC
71
In individual countries, the proportion indicating that they agree with each of these statements only rarely drops below 7 in 10. For the idea that ‘the richness of European culture comes from its long history shared by European countries’, the lowest results are found in Sweden (63%), Ireland (64%) and Greece (67%). In Ireland this is largely due to a high share of ‘Don’t Know’ results (26%). In Greece and Sweden this is more indicative of a reasonable share of respondents saying the statement does not correspond well with their own views (Greece, 32%; Sweden, 25%).

Cultural Values - 2007 DG EAC
72
For the statement that ‘it’s the diversity of European culture that sets it apart and gives it its particular value’, the Swedes (55%), Danes and Irish are least likely to say that this is their viewpoint (60%). In each of these countries, however, those holding this opinion still form a solid majority – with the low Irish figure again due to a high share of ‘don’t know’ answers (28%) and 31% and 28% respectively of Danes and Swedes saying that the statement matches their opinion badly.
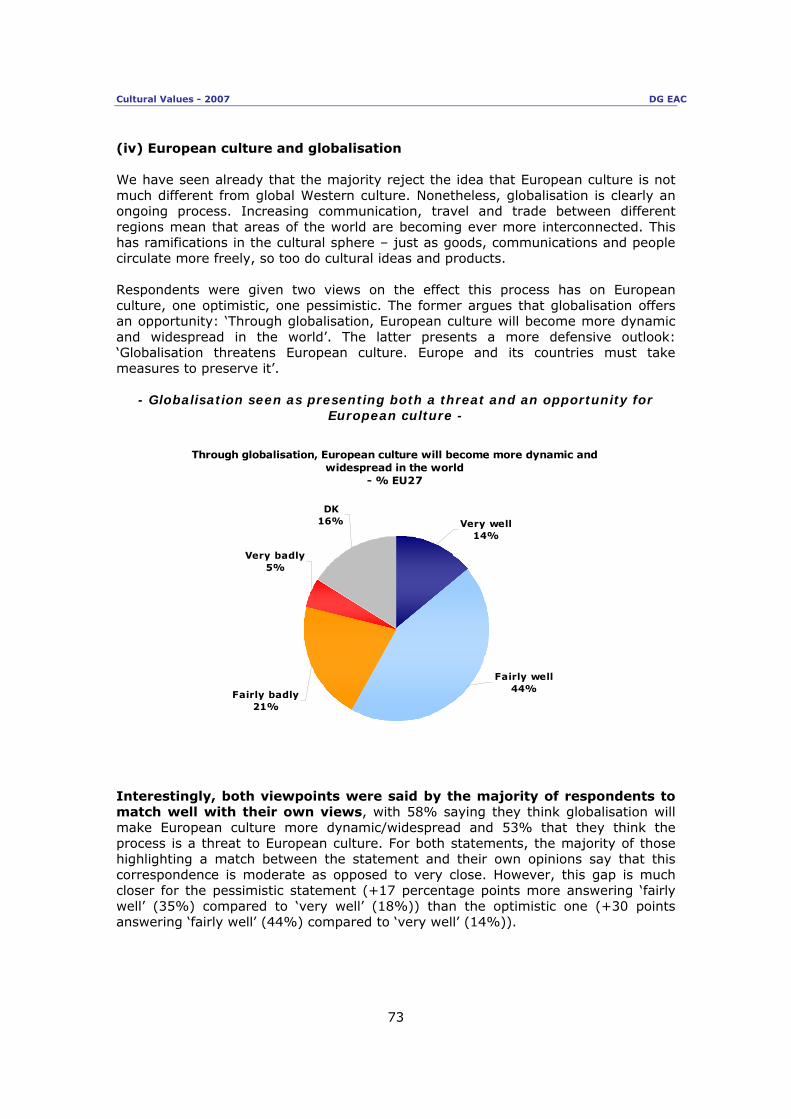
Cultural Values - 2007 DG EAC
73
(iv) European culture and globalisation We have seen already that the majority reject the idea that European culture is not much different from global Western culture. Nonetheless, globalisation is clearly an ongoing process. Increasing communication, travel and trade between different regions mean that areas of the world are becoming ever more interconnected. This has ramifications in the cultural sphere – just as goods, communications and people circulate more freely, so too do cultural ideas and products. Respondents were given two views on the effect this process has on European culture, one optimistic, one pessimistic. The former argues that globalisation offers an opportunity: ‘Through globalisation, European culture will become more dynamic and widespread in the world’. The latter presents a more defensive outlook: ‘Globalisation threatens European culture. Europe and its countries must take measures to preserve it’.
- Globalisation seen as presenting both a threat and an opportunity for European culture -
Through globalisation, European culture will become more dynamic and widespread in the world
- % EU27
Very well14%
Fairly badly21%
Fairly well44%
Very badly5%
DK16%
Interestingly, both viewpoints were said by the majority of respondents to match well with their own views, with 58% saying they think globalisation will make European culture more dynamic/widespread and 53% that they think the process is a threat to European culture. For both statements, the majority of those highlighting a match between the statement and their own opinions say that this correspondence is moderate as opposed to very close. However, this gap is much closer for the pessimistic statement (+17 percentage points more answering ‘fairly well’ (35%) compared to ‘very well’ (18%)) than the optimistic one (+30 points answering ‘fairly well’ (44%) compared to ‘very well’ (14%)).

Cultural Values - 2007 DG EAC
74
Globalisation threatens European culture. Europe and its countries must take measures to preserve it
- % EU27
DK15%
Very badly9%
Fairly well35%
Fairly badly23%
Very well18%
The results we see here are similarly complex to those outlined above for the question of whether culture exists on a national, continental or global plane. What emerges here is a dualistic view that sees globalisation as both a threat and an opportunity, offering the means to exert greater influence in the world yet also placing European culture in danger.
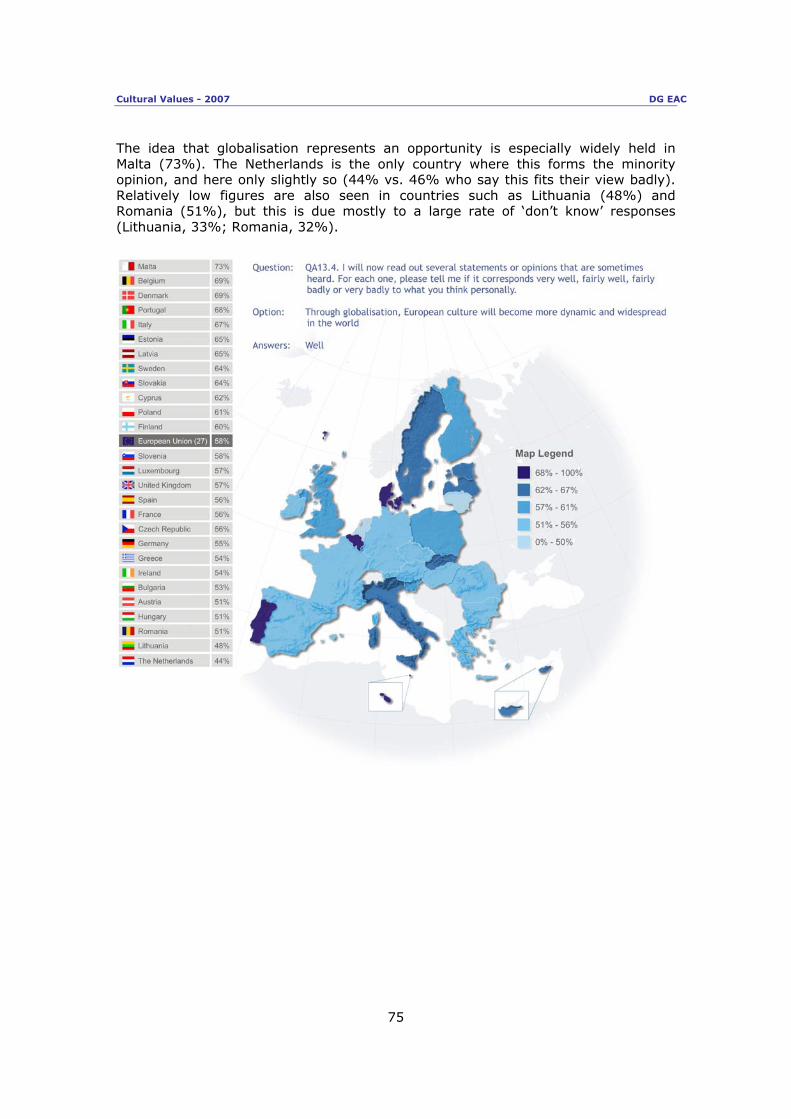
Cultural Values - 2007 DG EAC
75
The idea that globalisation represents an opportunity is especially widely held in Malta (73%). The Netherlands is the only country where this forms the minority opinion, and here only slightly so (44% vs. 46% who say this fits their view badly). Relatively low figures are also seen in countries such as Lithuania (48%) and Romania (51%), but this is due mostly to a large rate of ‘don’t know’ responses (Lithuania, 33%; Romania, 32%).
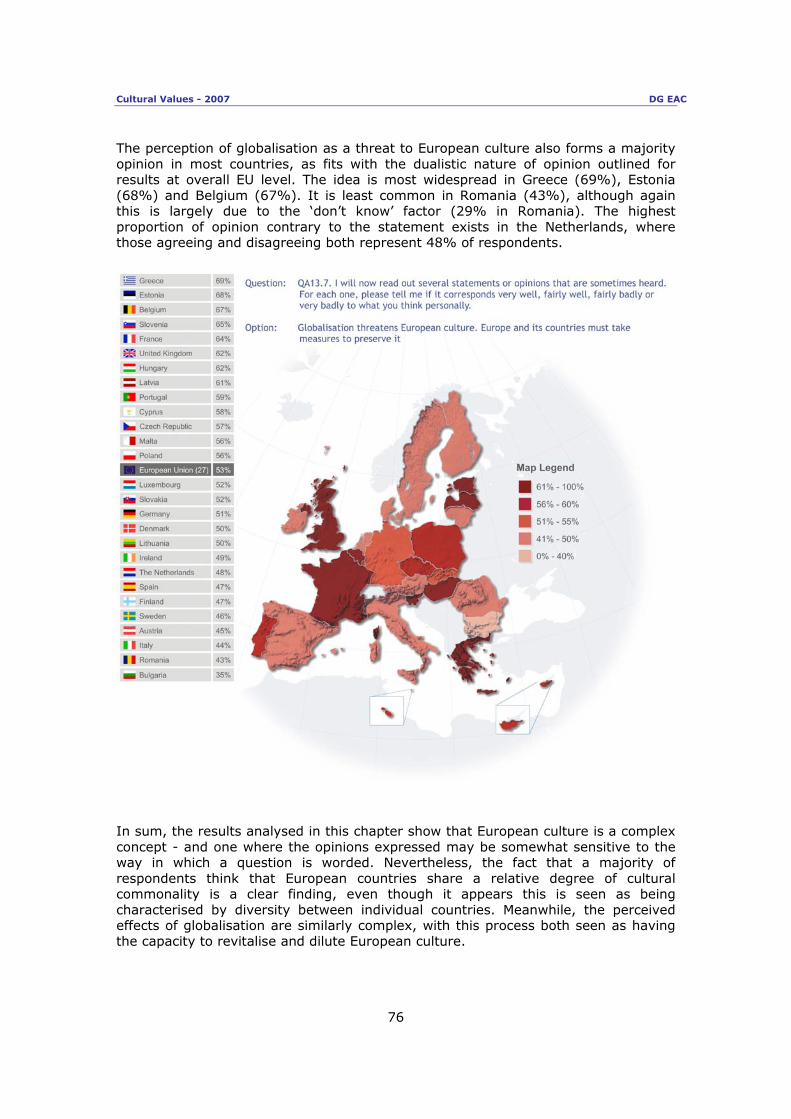
Cultural Values - 2007 DG EAC
76
The perception of globalisation as a threat to European culture also forms a majority opinion in most countries, as fits with the dualistic nature of opinion outlined for results at overall EU level. The idea is most widespread in Greece (69%), Estonia (68%) and Belgium (67%). It is least common in Romania (43%), although again this is largely due to the ‘don’t know’ factor (29% in Romania). The highest proportion of opinion contrary to the statement exists in the Netherlands, where those agreeing and disagreeing both represent 48% of respondents.
In sum, the results analysed in this chapter show that European culture is a complex concept - and one where the opinions expressed may be somewhat sensitive to the way in which a question is worded. Nevertheless, the fact that a majority of respondents think that European countries share a relative degree of cultural commonality is a clear finding, even though it appears this is seen as being characterised by diversity between individual countries. Meanwhile, the perceived effects of globalisation are similarly complex, with this process both seen as having the capacity to revitalise and dilute European culture.
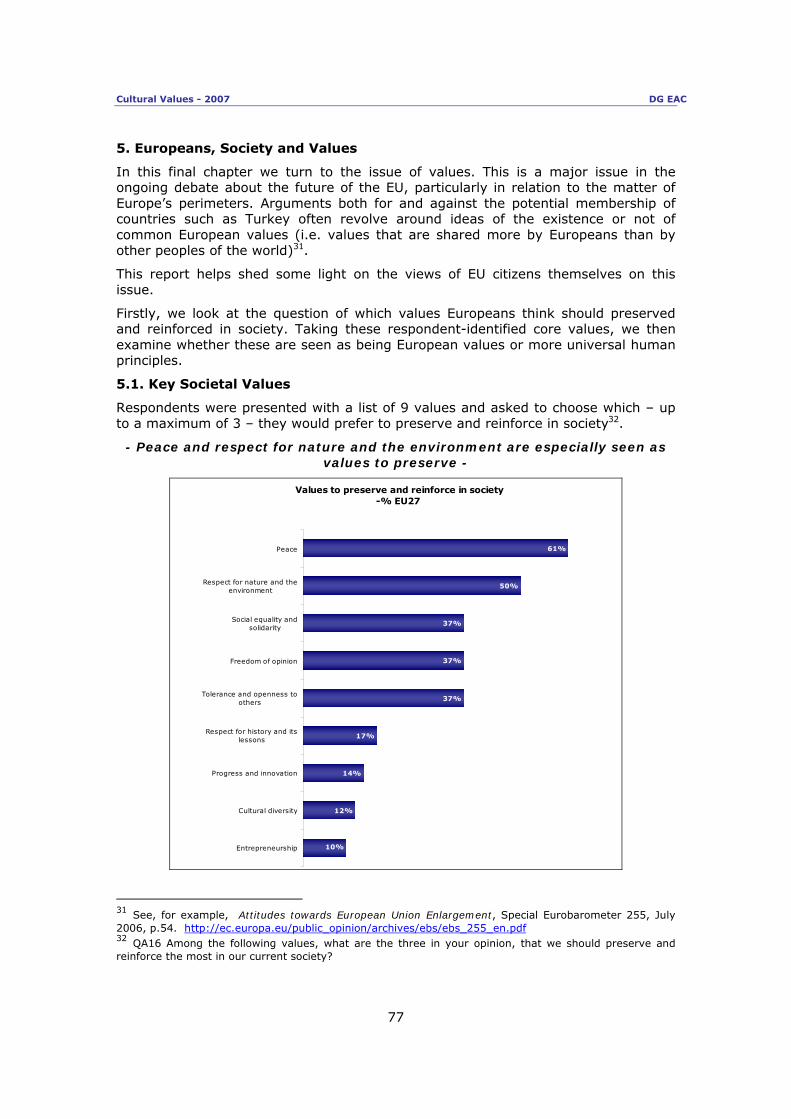
Cultural Values - 2007 DG EAC
77
5. Europeans, Society and Values In this final chapter we turn to the issue of values. This is a major issue in the ongoing debate about the future of the EU, particularly in relation to the matter of Europe’s perimeters. Arguments both for and against the potential membership of countries such as Turkey often revolve around ideas of the existence or not of common European values (i.e. values that are shared more by Europeans than by other peoples of the world)31. This report helps shed some light on the views of EU citizens themselves on this issue. Firstly, we look at the question of which values Europeans think should preserved and reinforced in society. Taking these respondent-identified core values, we then examine whether these are seen as being European values or more universal human principles. 5.1. Key Societal Values Respondents were presented with a list of 9 values and asked to choose which – up to a maximum of 3 – they would prefer to preserve and reinforce in society32.
- Peace and respect for nature and the environment are especially seen as values to preserve -
Values to preserve and reinforce in society
-% EU27
61%
50%
37%
37%
37%
17%
12%
10%
14%
Peace
Respect for nature and theenvironment
Social equality andsolidarity
Freedom of opinion
Tolerance and openness toothers
Respect for history and itslessons
Progress and innovation
Cultural diversity
Entrepreneurship
31 See, for example, Attitudes towards European Union Enlargement, Special Eurobarometer 255, July 2006, p.54. http://ec.europa.eu/public_opinion/archives/ebs/ebs_255_en.pdf 32 QA16 Among the following values, what are the three in your opinion, that we should preserve and reinforce the most in our current society?

Cultural Values - 2007 DG EAC
78
The most selected value is ‘peace’, with this chosen by 61% of all respondents. This is followed by ‘respect for nature and the environment’, chosen by exactly half (50%). After this, three values were chosen by 37% of those polled: ‘Social equality and solidarity’, ‘freedom of opinion’ and ‘tolerance and openness to others’. The high prioritisation of peace as a value is largely universal across countries: Even at its lowest level (45% in both Estonia and Lithuania) it is still selected by a figure approaching half of all respondents. Respect for nature and the environment is mentioned by very high proportions of respondents in certain countries, namely Luxembourg (78%), Sweden (76%) and Finland (74%). In general, there is not a great deal of variation concerning those who mention social equality and solidarity, although it can be mentioned that this is particularly valued by a half of the population or more in Cyprus (54%), Portugal and Austria (both 50%). Freedom of opinion is especially valued in the UK (55%) and the Netherlands (52%). The greatest degree of variation is in results for tolerance and openness to others, which reaches a level as high as 60% (the Netherlands) yet also a figure as low as 11% (Greece).
- Age, gender and most of all political standpoint are important determinants of values -
Analysis of opinion on this question according to social and demographic categories reveals a number of interesting findings. Firstly, with regards to gender there seem to be some values which are favoured by slightly higher proportions of respondents from one sex. Values more ‘female’ in nature are peace and tolerance/openness. Values which tend a little more to the ‘male’ side are progress and innovation, entrepreneurship and freedom of opinion
Values to preserve and reinforce: Analysis according to gender
Note: Figures shown = % of males/females mentioning value
MORE FEMALE THAN MALE MORE MALE THAN FEMALE
Male Female
Difference (female-
male) Male Female
Difference (female-male)
Peace 58% 64% +6 Progress and
innovation 17% 11% -6
Tolerance and
openness to others
34% 40% +6 Entrepreneurship 12% 7% -5
Freedom of opinion
39% 34% -5

Cultural Values - 2007 DG EAC
79
Secondly, we can see that peace - the most prioritised value overall – is especially important to the oldest segment of the population (55+, 69%; 15-24, 56%; 13 points difference). A possible reason for this is that many in the oldest group will have had direct experience of war. Thirdly, political leanings have a very important bearing on respondents’ views of societal priorities. Of all the factors under consideration here, this is perhaps the most important determinant of opinion. As with all Eurobarometer reports, respondents were asked to self-position on a political scale from 1 (left) to 10 (right)33. Those in the range 1-4 are defined as left-leaning, those in the range 7-10 as right-leaning. Those falling between these two categories are considered as being centrists. Taking these categorisations, we can see that respondents towards the political left are considerably more likely to say that society should preserve and reinforce social equality and solidarity (left, 45%; right, 31%; 14 points difference). They are also more likely to say that tolerance and openness to others are important (left, 43%; right, 32%; 11 points difference). Respondents who self-position on the political right are relatively more likely to favour respect for history and its lessons (right, 23%; left, 14%; 9 points difference). The same is also true of entrepreneurship (right, 15%; left, 7%; 8 points difference) and progress/innovation (right 18%; left 11%; 7 points difference). However, it should be stressed here that despite the relative propensity towards these values, they still register low absolute levels amongst respondents who indicate right-wing tendencies. For example, those from this group are still well over twice as likely to mention peace (58% amongst respondents to the right) than they are respect for history and its lessons (23%).
Values to preserve and reinforce: Analysis according to political self-positioning
Note: Figures shown = % of right/left respondents mentioning value
MORE LEFT THAN RIGHT MORE RIGHT THAN LEFT
(1-4) Left
(7-10) Right
Difference (left – right)
(1-4) Left
(7-10) Right
Difference (left – right)
Social equality and solidarity
45% 31% +14 Respect for
history and its lessons
14% 23% -9
Tolerance and openness to
others 43% 32% +11 Entrepreneurship 7% 15% -8
Progress and innovation
11% 18% -7
33 In political matters people talk of "the left" and "the right". How would you place your views on this scale?

Cultural Values - 2007 DG EAC
80
5.2. Europe, the World and the Embodiment of Values After the exercise on societal values, respondents were then presented - one by one - with the same values and asked whether they thought the value in question is best represented by Europe, other countries in the world or both34. Results to this subsequent exercise are therefore extremely useful in ascertaining what values are seen as being particularly European. - The values citizens would like to reinforce are also those which are seen as
most European - In general, societal values are characterised as being either European or universal (both embodied by Europe and by other countries of the world) but not as being extra-European (other countries of the world only). Indeed, the highest result for ‘other countries of the world’ is just 18%, recorded for entrepreneurship. Values seen as being more European than universal are: ● Peace (Europe, 57%; Both Europe and other countries, 30%; 17 points difference) ● Respect for nature and the environment (Europe, 49%; Both, 33%; 16 points difference) ● Social equality and solidarity (Europe, 53%; Both, 29%; 14 points difference) ● Tolerance and openness to others (Europe, 47%; Both, 33%; 14 points difference) ● Freedom of opinion (Europe, 54%; Both, 31%; 13 points difference) The characterisation of these values as being distinctly European is backed up by findings from the recent qualitative study, which found that many make reference to a long history of conflict (and especially the two World Wars) leading to a collective wish for peace. Here also, it was found that most respondents consider that, thinking globally, Europe is relatively advanced in its Environmental sensitivity35. Values seen as being more universal than European are: ● Entrepreneurship (Both, 43%; Europe, 28%; 15 points difference) ● Progress and innovation (Both, 45%; Europe, 30%; 15 points difference) ● Cultural diversity (Both, 46%; Europe, 32%; 14 points difference) A key distinction between European and universal values, according to EU citizens, is that values which are seen to be more European are those which figure prominently in the previous question as being values which should be preserved and reinforced in society. Thus, for example, peace, the value prioritised by the highest proportion (61%), is also the value seen as being the most European (57%). This pattern holds true with remarkable consistency for all values. The 5 values seen as being more European are
34 QA17 For each of these values, please tell me if they are best embodied by Europe, by other countries (or groups of countries) in the world or by both 35 The Europeans, Culture and Cultural Values, Qualitative study by Optem for DG EAC, June 2006, p35, 54. http://ec.europa.eu/culture/eac/sources_info/studies/pdf_word/report_synth_Cult_06_en.pdf
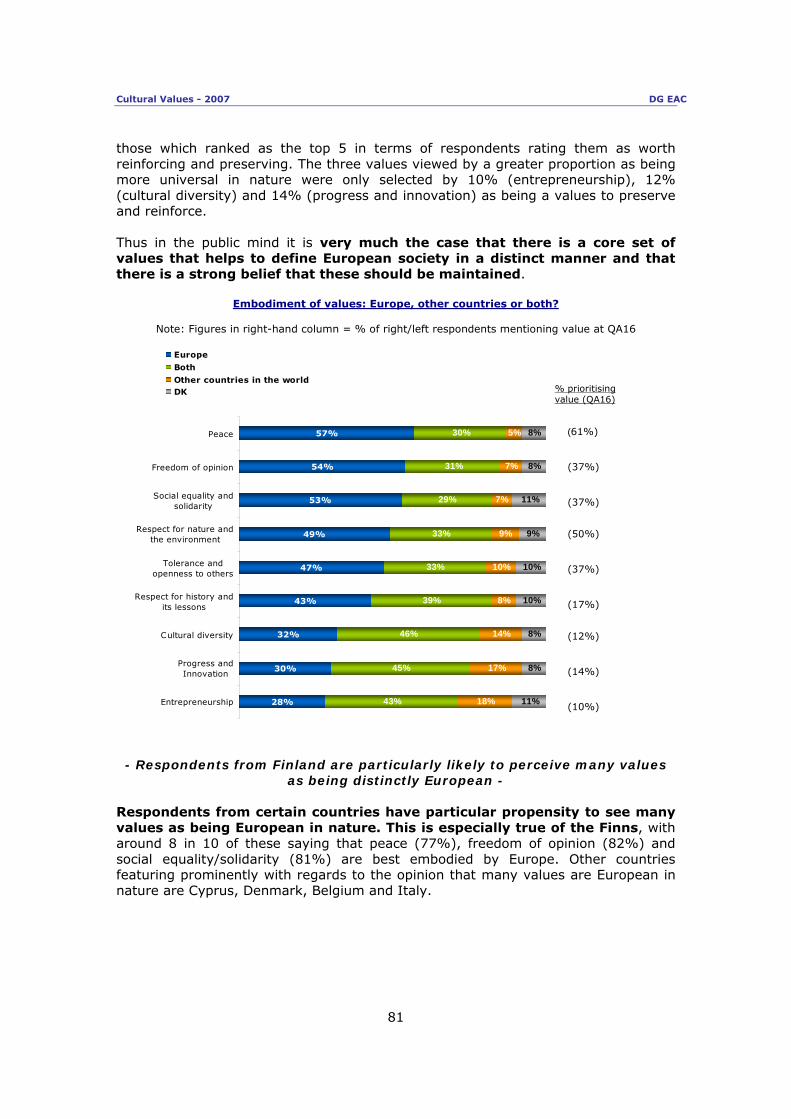
Cultural Values - 2007 DG EAC
81
those which ranked as the top 5 in terms of respondents rating them as worth reinforcing and preserving. The three values viewed by a greater proportion as being more universal in nature were only selected by 10% (entrepreneurship), 12% (cultural diversity) and 14% (progress and innovation) as being a values to preserve and reinforce. Thus in the public mind it is very much the case that there is a core set of values that helps to define European society in a distinct manner and that there is a strong belief that these should be maintained.
Embodiment of values: Europe, other countries or both?
Note: Figures in right-hand column = % of right/left respondents mentioning value at QA16
(61%)
(37%)
(37%)
(50%)
(37%)
(17%)
(12%)
(14%)
(10%)
% prioritising value (QA16)
57%
54%
53%
49%
47%
43%
32%
30%
28%
30%
31%
29%
33%
33%
39%
46%
45%
43%
5%
7%
7%
9%
10%
8%
14%
17%
18%
8%
8%
11%
9%
10%
10%
8%
8%
11%
Peace
Freedom of opinion
Social equality andsolidarity
Respect for nature andthe environment
Tolerance andopenness to others
Respect for history andits lessons
Cultural diversity
Progress andInnovation
Entrepreneurship
Europe
Both
Other countries in the worldDK
- Respondents from Finland are particularly likely to perceive many values
as being distinctly European - Respondents from certain countries have particular propensity to see many values as being European in nature. This is especially true of the Finns, with around 8 in 10 of these saying that peace (77%), freedom of opinion (82%) and social equality/solidarity (81%) are best embodied by Europe. Other countries featuring prominently with regards to the opinion that many values are European in nature are Cyprus, Denmark, Belgium and Italy.

Cultural Values - 2007 DG EAC
82
Extent to which values are seen as European: Highest results according to country
Note: Figures shown= % saying particular value is best embodied by Europe
EU
1st
2nd 3rd
Peace 57%
FI (77%)
CY
(74%)
DE
(73%)
Freedom of opinion 54%
FI (82%)
DK
(79%)
DE
(72%)
Social equality and solidarity
53%
FI (81%)
DK
(75%)
BE
(68%)
Respect for nature and the environment
49%
CY (68%)
DK, FI (67%)
Tolerance and openness to others
47%
FI (63%)
BE, CY (58%)
Respect for history and its lessons
43%
CY (58%)
IT
(56%)
EL
(55%)
Cultural diversity 32%
EL (45%)
AT
(44%)
BE
(42%)
Progress and innovation 30%
FI (51%)
EL
(41%)
IT
(39%)
Entrepreneurship 28%
FI (40%)
BE, IT (38%)
For the question on values to be preserved and reinforced, we saw that opinion differs considerably amongst different social groupings and in particular along the lines of right and left wing political tendencies. However, this is not the case in views on whether these same values are best embodied by Europe or not: Variation amongst socio-demographic groupings is rare, and furthermore is of a low magnitude. The following represent the main differences, such as they are: ● Cultural diversity is seen as a mainly European value by a greater proportion of the 55+ age group than the 15-24 age group (55+, 34%; 15-24, 27%; 7 points difference). Respect for history and its lessons is also perceived as a European value by a higher share of the oldest age bracket (55+, 44%; 15-24, 38%; 6 points difference). ●Social equality and solidarity is viewed as being a mainly European value by a higher proportion of the most educated respondents (20+; 58%; 15, 50%; 8 points difference). ● Respondents living in rural areas are more likely to perceive three values to be mostly European, as shown below.
Embodiment of values: Selected values analysed by urbanisation
Subjective urbanisation
Respect for nature and the environment
Freedom of opinion
Tolerance and openness to
others Rural village 51% 58% 49%
Small/ mid size town
49% 55% 48%
Large town 45% 50% 44%

Cultural Values - 2007 DG EAC
83
CONCLUSION The results of this survey show important insights into the relationship European citizens have with culture, both in terms of their behaviour and their opinions. Firstly we have seen how Europeans conceive of the very idea of culture itself. Here the most common concept is one that particularly involves arts, both performance and visual (with this mentioned spontaneously by 39%). Other ideas that figure prominently are literature and traditions/languages/customs, with both of these mentioned by just under a quarter (24%). Whatever associations respondents may have with culture, it is clear that most see it as playing an important role. Over three-quarters (77%) say that culture is important to them. Furthermore, the majority are interest in arts and culture, whether that be in one’s own country (69%), other European countries (57%) or the rest of the world (56%). The survey has also gathered detailed figures on the types and extent of Europeans’ cultural behaviour. Here the overall picture is a variable one. Cultural and artistic engagement varies across the continent according to both national and socio-demographic variables. In brief, those who are show the greatest cultural participation tend to be young, urbanised and highly educated. No doubt a whole range of factors are at work here, from issues of access to expense and the commitment required. Nonetheless, that most frequently cited is a lack of time (mentioned by 42% as a barrier to cultural activities). This disparity in cultural participation between groups could well be narrowed by access to the Internet, which is transforming the cultural sphere in different ways. For some, it allows for cultural activities to be researched and planned. For others, the Internet forms a direct channel through which culture can be accessed. Results for cultural and artistic participation show that behaviour in this area is diverse in nature. This reflects the complex cultural mix within Europe itself, which is something that seems to be recognised by many respondents as existing alongside a degree of cultural commonality. In this regard, one of the key findings is that a majority of just over two-thirds (67%) those surveyed agree with the idea that, compared to other continents, European countries share a great deal in common culturally. Further evidence of the fact that Europe is seen as a distinct cultural unit comes from the fact that only just under a third (32%) agree with the idea that there is no such thing as European culture, only a common Western culture shared with countries such as the US. Alongside this perception of cultural commonality exists a recognition of the diversity that characterises the many national cultures that co-exist under the European umbrella. Indeed, over three-quarters (76%) agree with the sentiment that it is the existence of this diversity that gives European culture its unique flavour and enhances its value. At the same time, in a separate question, this cultural pluralism also leads around a half (53%) of the poll to question the existence of a shared European culture.
Cultural Values - 2007 DG EAC
84
Respondents also show similarly complex views on the place of European culture in a globalising world: Around 6 in 10 (58%) say that globalisation will infuse the continent’s culture with a new dynamism as well as helping expanding its influence in the world. Yet, at the same time, only a marginally lower figure (53%) believe globalisation to be a threat to European culture and that measures should be taken to counter this. In other words, the most common view seems to be that globalisation places Europe at a cultural cross-roads, one where if it can maintain its unique identity this will help to greatly enhance its place in the world. As part of this, there is a clear belief that European society(ies) should preserve certain key values, especially peace and respect for nature and the environment. These are seen as important in their own right by 61% and 50% of all Europeans respectively. At the same time, these values are given even greater salience by the fact that they are also seen more as being distinctly European (by 57% and 49% respectively) than universal (by 30% and 33% respectively) in nature. We also see that the bulk of Europeans are convinced in the value of culture and cultural exchange: 89% say these should have in important part in the EU in order to help citizens from different Member states to understand each other and 88% that these can develop global understanding and tolerance. In essence, this forms a resounding endorsement of the recent European Commission Communication which calls for greater intercultural dialogue. To this end, many people see an important role for education, with 56% saying that developing foreign language teaching in schools could help Europeans know each other better and a further 41% that increasing exchange programmes for students and teachers could have the same effect. With regards to linguistic ability, it is encouraging that exactly 6 in 10 (60%) saying they would like to learn a new language, or improve the standard of one which they already speak. Finally, there is clear evidence that the EU and its institutions are seen as important in promoting cultural exchange: 44% say that these are one of the two types of actors best-placed in this regard – second only to the 50% who mention national Governments.

ANNEXES

TECHNICAL SPECIFICATIONS
SPECIAL EUROBAROMETER N°278 “European Cultural Values”
TECHNICAL SPECIFICATIONS
Between the 14th of February and the 18th of March 2007, TNS Opinion & Social, a consortium created between Taylor Nelson Sofres and EOS Gallup Europe, carried out wave 67.1 of the EUROBAROMETER, on request of the EUROPEAN COMMISSION, Directorate General Communication, “Public Opinion and Media Monitoring”. The SPECIAL EUROBAROMETER N°278 is part of wave 67.1 and covers the population of the respective nationalities of the European Union Member States, resident in each of the Member States and aged 15 years and over. The basic sample design applied in all states is a multi-stage, random (probability) one. In each country, a number of sampling points was drawn with probability proportional to population size (for a total coverage of the country) and to population density. In order to do so, the sampling points were drawn systematically from each of the "administrative regional units", after stratification by individual unit and type of area. They thus represent the whole territory of the countries surveyed according to the EUROSTAT NUTS II (or equivalent) and according to the distribution of the resident population of the respective nationalities in terms of metropolitan, urban and rural areas. In each of the selected sampling points, a starting address was drawn, at random. Further addresses (every nth address) were selected by standard "random route" procedures, from the initial address. In each household, the respondent was drawn, at random (following the "closest birthday rule"). All interviews were conducted face-to-face in people's homes and in the appropriate national language. As far as the data capture is concerned, CAPI (Computer Assisted Personal Interview) was used in those countries where this technique was available.

ABBREVIATIONS COUNTRIES INSTITUTES N°
INTERVIEWS FIELDWORK
DATES POPULATION
15+ BE Belgium TNS Dimarso 1.040 16/02/2007 15/03/2007 8.650.994BG Bulgaria TNS BBSS 1.009 16/02/2007 1/03/2007 6.671.699CZ Czech Rep. TNS Aisa 1.060 17/02/2007 11/03/2007 8.571.710DK Denmark TNS Gallup DK 1.008 14/02/2007 18/03/2007 4.411.580DE Germany TNS Infratest 1.534 14/02/2007 8/03/2007 64.361.608EE Estonia Emor 1.001 14/02/2007 12/03/2007 887.094EL Greece TNS ICAP 1.000 14/02/2007 10/03/2007 8.693.566ES Spain TNS Demoscopia 1.006 14/02/2007 15/03/2007 37.024.972FR France TNS Sofres 1.031 14/02/2007 13/03/2007 44.010.619IE Ireland TNS MRBI 1.000 16/02/2007 17/03/2007 3.089.775IT Italy TNS Abacus 1.000 14/02/2007 13/03/2007 48.892.559CY Rep. of Cyprus Synovate 500 15/02/2007 12/03/2007 596.752LV Latvia TNS Latvia 1.006 16/02/2007 11/03/2007 1.418.596LT Lithuania TNS Gallup Lithuania 1.029 15/02/2007 12/03/2007 2.803.661LU Luxembourg TNS ILReS 500 14/02/2007 12/03/2007 374.097HU Hungary TNS Hungary 1.000 19/02/2007 14/03/2007 8.503.379MT Malta MISCO 500 14/02/2007 13/03/2007 321.114NL Netherlands TNS NIPO 1.000 21/02/2007 15/03/2007 13.030.000AT Austria Österreichisches Gallup-Institut 1.011 14/02/2007 11/03/2007 6.848.736PL Poland TNS OBOP 1.000 17/02/2007 12/03/2007 31.967.880PT Portugal TNS EUROTESTE 1.013 14/02/2007 15/03/2007 8.080.915RO Romania TNS CSOP 1.028 19/02/2007 11/03/2007 18.173.179SI Slovenia RM PLUS 1.015 15/02/2007 13/03/2007 1.720.137SK Slovakia TNS AISA SK 1.094 18/02/2007 7/03/2007 4.316.438FI Finland TNS Gallup Oy 1.040 14/02/2007 13/03/2007 4.348.676SE Sweden TNS GALLUP 1.011 16/02/2007 15/03/2007 7.486.976UK United Kingdom TNS UK 1.030 14/02/2007 11/03/2007 47.685.578
TOTAL 26.466 14/02/2007 18/03/2007 392.942.290
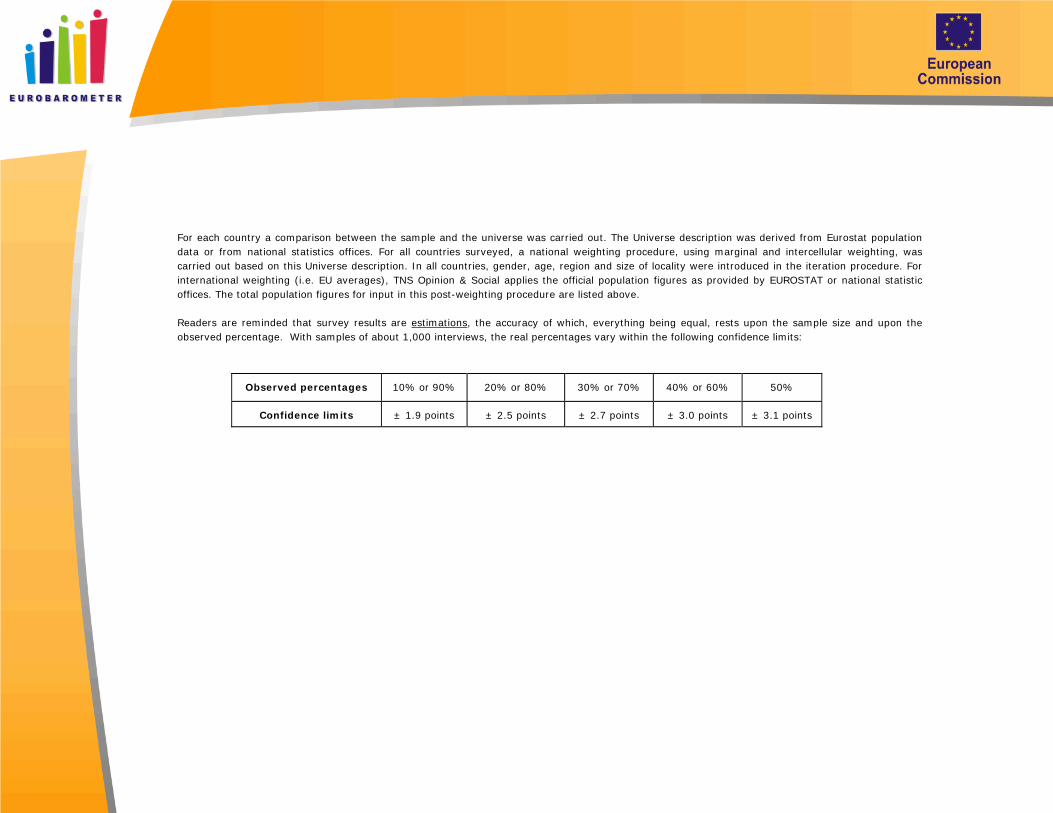
For each country a comparison between the sample and the universe was carried out. The Universe description was derived from Eurostat population data or from national statistics offices. For all countries surveyed, a national weighting procedure, using marginal and intercellular weighting, was carried out based on this Universe description. In all countries, gender, age, region and size of locality were introduced in the iteration procedure. For international weighting (i.e. EU averages), TNS Opinion & Social applies the official population figures as provided by EUROSTAT or national statistic offices. The total population figures for input in this post-weighting procedure are listed above. Readers are reminded that survey results are estimations, the accuracy of which, everything being equal, rests upon the sample size and upon the observed percentage. With samples of about 1,000 interviews, the real percentages vary within the following confidence limits:
Observed percentages 10% or 90% 20% or 80% 30% or 70% 40% or 60% 50%
Confidence limits ± 1.9 points ± 2.5 points ± 2.7 points ± 3.0 points ± 3.1 points

QUESTIONNAIRE

QA1 QA1
Totally
fulfilled
Fairly
fulfilled
Not very fulfilled
Not at all fulfilled
Not aplicable (SPONTANEOUS
)
DK Tout à fait épanoui(e
)
Assez
épanoui(e
)
Pas très
épanoui(e
)
Pas du tout
épanoui(e
)
Pas applicabl
e (SPONTANE
)
NSP
(187) 1 1 2 3 4 5 6 (187) 1 1 2 3 4 5 6(188) 2 1 2 3 4 5 6 (188) 2 1 2 3 4 5 6
Votre vie privéeVotre vie professionnelle
NEW
Dans quelle mesure diriez-vous que la vie que vous vivez vous permet de vous sentir épanoui(e) dans … ?
(MONTRER CARTE AVEC ECHELLE – UNE REPONSE PAR LIGNE)
(LIRE)
POSER LES QA EN UE27
Your private lifeYour professional life
NEW
To what extent would you say that the life you live allows you to feel fulfilled in…?
(SHOW CARD WITH SCALE – ONE ANSWER PER LINE)
(READ OUT)
ASK QA IN EU27
BilinqualQuestionnaireEB671 3/57 06/02/2007
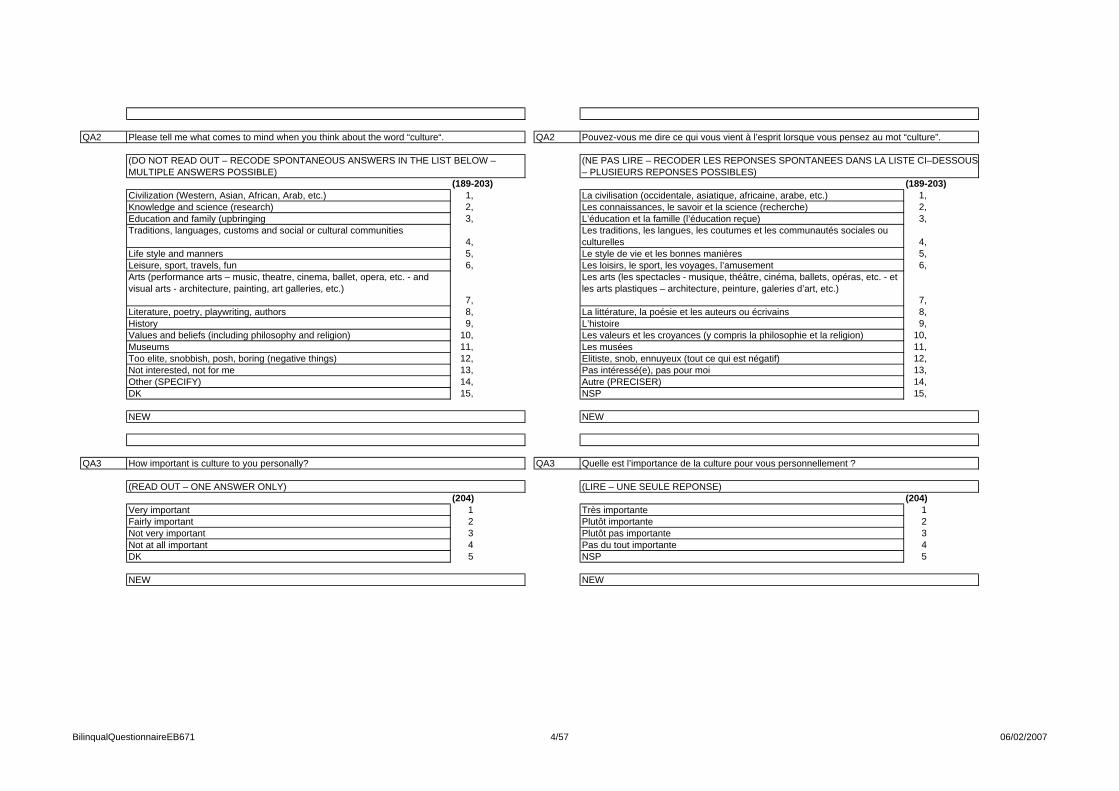
QA2 QA2
(189-203) (189-203)1, 1,2, 2,3, 3,
4, 4,5, 5,6, 6,
7, 7,8, 8,9, 9,
10, 10,11, 11,12, 12,13, 13,14, 14,15, 15,
QA3 QA3
(204) (204)1 12 23 34 45 5
Pas du tout importante NSP
NEW
(LIRE – UNE SEULE REPONSE)
Très importantePlutôt importantePlutôt pas importante
NSP
NEW
Quelle est l’importance de la culture pour vous personnellement ?
Les muséesElitiste, snob, ennuyeux (tout ce qui est négatif)Pas intéressé(e), pas pour moiAutre (PRECISER)
Les arts (les spectacles - musique, théâtre, cinéma, ballets, opéras, etc. - et les arts plastiques – architecture, peinture, galeries d’art, etc.)
La littérature, la poésie et les auteurs ou écrivainsL’histoireLes valeurs et les croyances (y compris la philosophie et la religion)
L’éducation et la famille (l’éducation reçue)Les traditions, les langues, les coutumes et les communautés sociales ou culturellesLe style de vie et les bonnes manièresLes loisirs, le sport, les voyages, l’amusement
Pouvez-vous me dire ce qui vous vient à l’esprit lorsque vous pensez au mot “culture”.
(NE PAS LIRE – RECODER LES REPONSES SPONTANEES DANS LA LISTE CI–DESSOUS – PLUSIEURS REPONSES POSSIBLES)
La civilisation (occidentale, asiatique, africaine, arabe, etc.)Les connaissances, le savoir et la science (recherche)
Not at all importantDK
NEW
(READ OUT – ONE ANSWER ONLY)
Very importantFairly importantNot very important
DK
NEW
How important is culture to you personally?
MuseumsToo elite, snobbish, posh, boring (negative things)Not interested, not for meOther (SPECIFY)
Arts (performance arts – music, theatre, cinema, ballet, opera, etc. - and visual arts - architecture, painting, art galleries, etc.)
Literature, poetry, playwriting, authorsHistory Values and beliefs (including philosophy and religion)
Education and family (upbringingTraditions, languages, customs and social or cultural communities
Life style and manners Leisure, sport, travels, fun
Please tell me what comes to mind when you think about the word “culture“.
(DO NOT READ OUT – RECODE SPONTANEOUS ANSWERS IN THE LIST BELOW – MULTIPLE ANSWERS POSSIBLE)
Civilization (Western, Asian, African, Arab, etc.)Knowledge and science (research)
BilinqualQuestionnaireEB671 4/57 06/02/2007
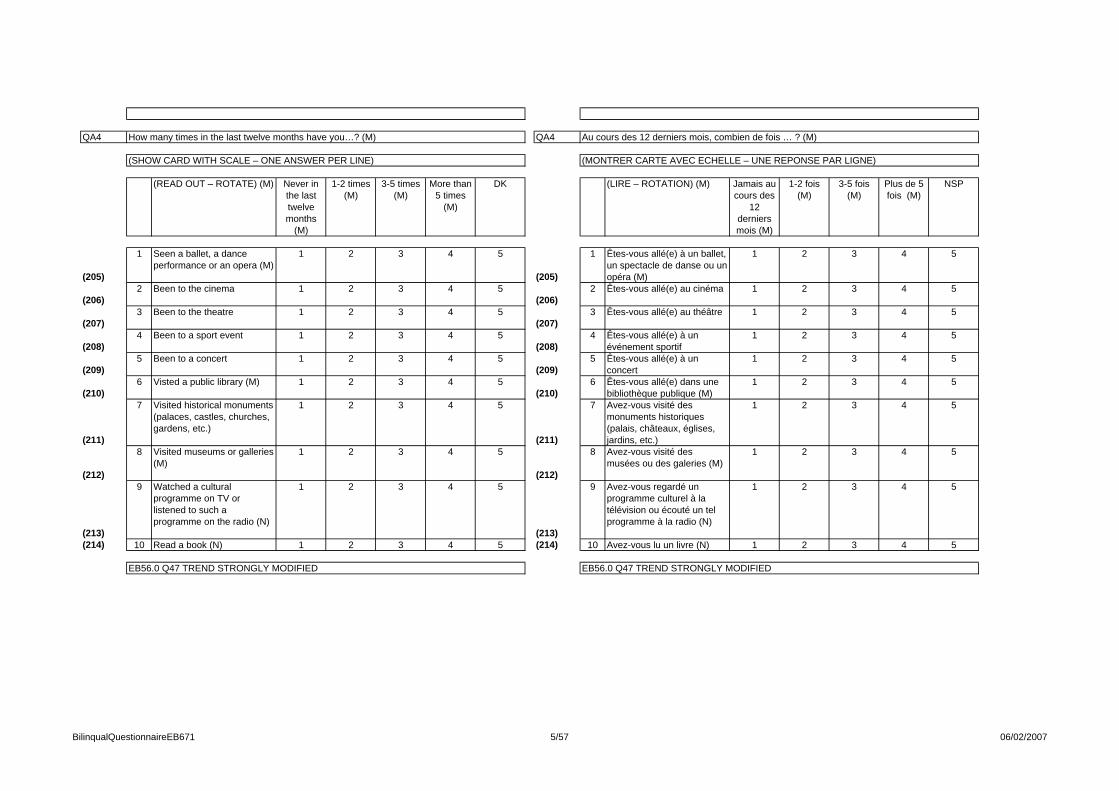
QA4 QA4
(205)
1
(205)
1
(206)2
(206)2
(207)3
(207)3
(208)4
(208)4
(209)5
(209)5
(210)6
(210)6
(211)
7
(211)
7
(212)
8
(212)
8
(213)
9
(213)
9
(214) 10 (214) 10
EB56.0 Q47 TREND STRONGLY MODIFIED
4 5
Avez-vous lu un livre (N) 1 2 3 4 5
Avez-vous regardé un programme culturel à la télévision ou écouté un tel programme à la radio (N)
1 2 3
4 5
Avez-vous visité des musées ou des galeries (M)
1 2 3 4 5
Avez-vous visité des monuments historiques (palais, châteaux, églises, jardins, etc.)
1 2 3
4 5
Êtes-vous allé(e) dans une bibliothèque publique (M)
1 2 3 4 5
Êtes-vous allé(e) à un concert
1 2 3
4 5
Êtes-vous allé(e) à un événement sportif
1 2 3 4 5
Êtes-vous allé(e) au théâtre 1 2 3
4 5
Êtes-vous allé(e) au cinéma 1 2 3 4 5
Êtes-vous allé(e) à un ballet, un spectacle de danse ou un opéra (M)
1 2 3
Au cours des 12 derniers mois, combien de fois … ? (M)
(MONTRER CARTE AVEC ECHELLE – UNE REPONSE PAR LIGNE)
(LIRE – ROTATION) (M) Jamais au cours des
12 derniers mois (M)
1-2 fois (M)
3-5 fois (M)
Plus de 5 fois (M)
NSP
EB56.0 Q47 TREND STRONGLY MODIFIED
4 5
Read a book (N) 1 2 3 4 5
Watched a cultural programme on TV or listened to such a programme on the radio (N)
1 2 3
4 5
Visited museums or galleries (M)
1 2 3 4 5
Visited historical monuments (palaces, castles, churches, gardens, etc.)
1 2 3
4 5
Visted a public library (M) 1 2 3 4 5
Been to a concert 1 2 3
4 5
Been to a sport event 1 2 3 4 5
Been to the theatre 1 2 3
4 5
Been to the cinema 1 2 3 4 5
Seen a ballet, a dance performance or an opera (M)
1 2 3
How many times in the last twelve months have you…? (M)
(SHOW CARD WITH SCALE – ONE ANSWER PER LINE)
(READ OUT – ROTATE) (M) Never in the last twelve months
(M)
1-2 times (M)
3-5 times (M)
More than 5 times
(M)
DK
BilinqualQuestionnaireEB671 5/57 06/02/2007

QA5 QA5
(215-225) (215-225)1, 1,2, 2,3, 3,4, 4,5, 5,6, 6,7, 7,
8, 8,9, 9,
10, 10,11, 11,
QA6 QA6
(226) (226)1 12 23 34 45 56 67 7
JamaisNSP
EB56.0 Q41a TREND STRONGLY MODIFIED
Plusieurs fois par semaineUne fois par semaine1 à 3 fois par moisMoins souvent
A quelle fréquence utilisez-vous Internet en dehors de votre activité professionnelle ? (M)
(LIRE – UNE SEULE REPONSE)
Tous les jours
Aucune (SPONTANE)Autre (SPONTANE)NSP
EB56.0 Q49 TREND STRONGLY MODIFIED
Ecrit (un texte, un poème, etc.) (M)Fait des travaux manuels, de la décoration, ou du jardinage (N)Fait de la photo, réalisé un filmPratiqué d’autres activités artistiques telles que la sculpture, la peinture, le dessin, la création par ordinateur comme la création de sites web, etc.
Joué d’un instrument de musiqueChantéJoué dans une pièce de théâtreDansé
Je vais vous citer une série d’activités artistiques. Pouvez-vous me dire, si au cours des 12 derniers mois, vous avez, de façon individuelle ou au sein d’un groupe ou d’un cours (pas de façon professionnelle mais en tant qu’amateur) … ?
(MONTRER CARTE – LIRE – ROTATION – PLUSIEURS REPONSES POSSIBLES)
NeverDK
EB56.0 Q41a TREND STRONGLY MODIFIED
Several times a weekOnce a week1 to 3 times a monthLess often
How often do you use the Internet apart from your professional activity? (M)
(READ OUT – ONE ANSWER ONLY)
Every day
None (SPONTANEOUS)Other (SPONTANEOUS)DK
EB56.0 Q49 TREND STRONGLY MODIFIED
Written something (a text, a poem, etc.) (M)Done any decorating, handicrafts or gardening (N)Done some photography, made a filmDone any other artistic activities like sculpture, painting, drawing, creative computing such as designing a website, etc.
Played a musical instrumentSungActedDanced
I am going to read out a list of artistic activities. Please tell me if, in the last twelve months, you have either on your own or as a part of an organised group or classes…? (not in a professional way – amateur activities) (M)
(SHOW CARD – READ OUT – ROTATE – MULTIPLE ANSWERS POSSIBLE)
BilinqualQuestionnaireEB671 6/57 06/02/2007
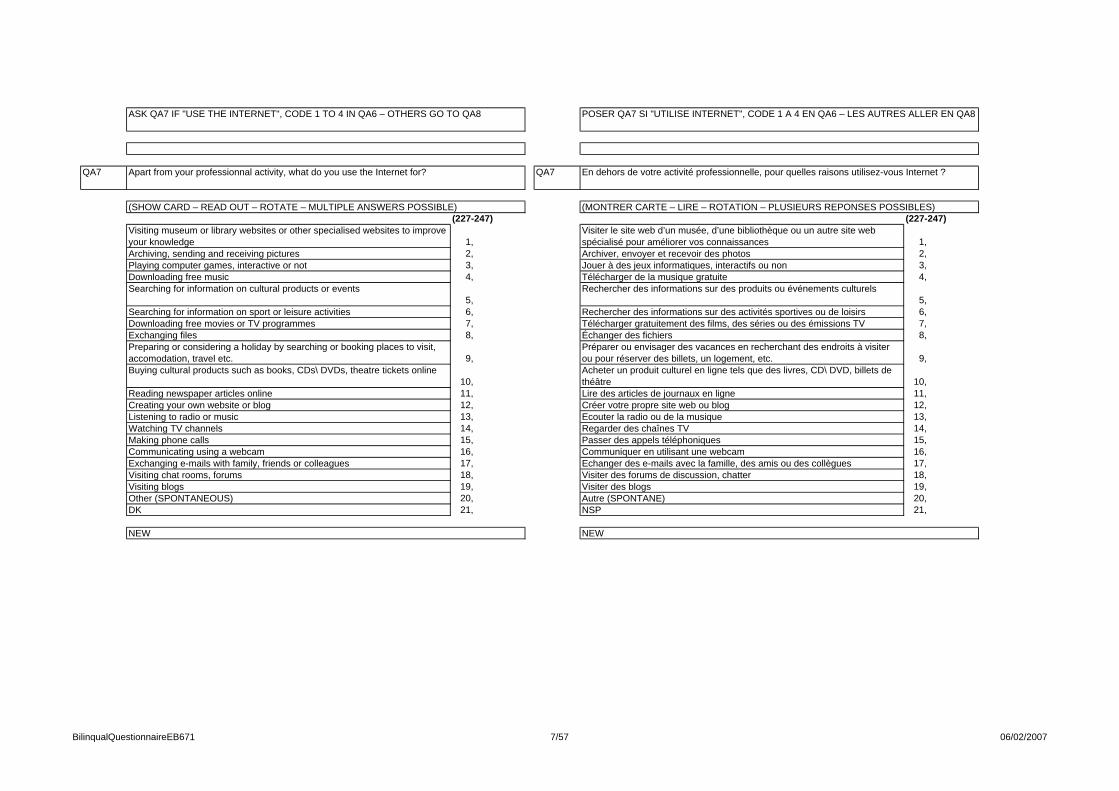
QA7 QA7
(227-247) (227-247)
1, 1,2, 2,3, 3,4, 4,
5, 5,6, 6,7, 7,8, 8,
9, 9,
10, 10,11, 11,12, 12,13, 13,14, 14,15, 15,16, 16,17, 17,18, 18,19, 19,20, 20,21, 21,
NEW
Visiter des forums de discussion, chatterVisiter des blogs Autre (SPONTANE)NSP
Regarder des chaînes TVPasser des appels téléphoniques Communiquer en utilisant une webcam Echanger des e-mails avec la famille, des amis ou des collègues
Acheter un produit culturel en ligne tels que des livres, CD\ DVD, billets de théâtreLire des articles de journaux en ligne Créer votre propre site web ou blogEcouter la radio ou de la musique
Rechercher des informations sur des activités sportives ou de loisirs Télécharger gratuitement des films, des séries ou des émissions TVÉchanger des fichiersPréparer ou envisager des vacances en recherchant des endroits à visiter ou pour réserver des billets, un logement, etc.
Archiver, envoyer et recevoir des photosJouer à des jeux informatiques, interactifs ou nonTélécharger de la musique gratuiteRechercher des informations sur des produits ou événements culturels
En dehors de votre activité professionnelle, pour quelles raisons utilisez-vous Internet ?
(MONTRER CARTE – LIRE – ROTATION – PLUSIEURS REPONSES POSSIBLES)
Visiter le site web d’un musée, d’une bibliothèque ou un autre site web spécialisé pour améliorer vos connaissances
POSER QA7 SI "UTILISE INTERNET", CODE 1 A 4 EN QA6 – LES AUTRES ALLER EN QA8
NEW
Visiting chat rooms, forumsVisiting blogs Other (SPONTANEOUS)DK
Watching TV channelsMaking phone calls Communicating using a webcam Exchanging e-mails with family, friends or colleagues
Buying cultural products such as books, CDs\ DVDs, theatre tickets online
Reading newspaper articles onlineCreating your own website or blogListening to radio or music
Searching for information on sport or leisure activitiesDownloading free movies or TV programmesExchanging filesPreparing or considering a holiday by searching or booking places to visit, accomodation, travel etc.
Archiving, sending and receiving picturesPlaying computer games, interactive or notDownloading free musicSearching for information on cultural products or events
Apart from your professionnal activity, what do you use the Internet for?
(SHOW CARD – READ OUT – ROTATE – MULTIPLE ANSWERS POSSIBLE)
Visiting museum or library websites or other specialised websites to improve your knowledge
ASK QA7 IF "USE THE INTERNET", CODE 1 TO 4 IN QA6 – OTHERS GO TO QA8
BilinqualQuestionnaireEB671 7/57 06/02/2007

QA8 QA8
(248-256) (248-256)1, 1,2, 2,3, 3,4, 4,
5, 5,6, 6,7, 7,8, 8,9, 9,
QA9 QA9
(257) (257)
1 1
2 23 34 4
Aucune de celle-ci (SPONTANE)NSP
NEW
Aujourd’hui, un nombre croissant d’activités culturelles sont gratuites. Vous pouvez trouver des journaux gratuits, aller sur Internet gratuitement, visiter des expositions publiques gratuites, assister à des concerts gratuits, etc. Parmi les affirmations suivantes, laquelle correspond le mieux à votre opinion ?
(LIRE – UNE SEULE REPONSE)
C’est une bonne chose parce que ça donne la possibilité à davantage de personnes d’accéder à la culture Ce n’est pas vraiment une bonne chose parce que la plupart des offres disponibles gratuitement sont de faible qualité culturelle
Autre (SPONTANE)NSP
NEW
Le manque d’informationUne offre d’activités culturelles trop limitée ou de mauvaise qualité dans votre région Le manque de connaissance ou de bagage culturelAucun (SPONTANE)
(MONTRER CARTE – LIRE – ROTATION – PLUSIEURS REPONSES POSSIBLES)
Le manque d’intérêtLe manque de tempsTrop cher
A TOUS
Certaines personnes ont des difficultés pour accéder à la culture ou pour participer à des activités culturelles. Parmi les raisons suivantes, lesquelles seraient les principales barrières pour vous ?
None of these (SPONTANEOUS)DK
NEW
Today, an increasing number of cultural activities are free of charge. You may find free newspapers, go on the Internet for free, visit free public exhibitions, attend free concerts, etc. Which of the following statements corresponds best to your view?
(READ OUT – ONE ANSWER ONLY)
This is a good thing because it gives more people the opportunity to access cultureThis is not really a good thing because most of the offers available for free are of low cultural quality
Other (SPONTANEOUS)DK
NEW
Lack of informationLimited choice or poor quality of cultural activities in your area
Lack of knowledge or cultural backgroundNone (SPONTANEOUS)
(SHOW CARD – READ OUT – ROTATE – MULTIPLE ANSWERS POSSIBLE)
Lack of interestLack of timeToo expensive
ASK ALL
Sometimes people find it difficult to access culture or take part in cultural activities. Which of the following, if any, are the main barriers for you?
BilinqualQuestionnaireEB671 8/57 06/02/2007
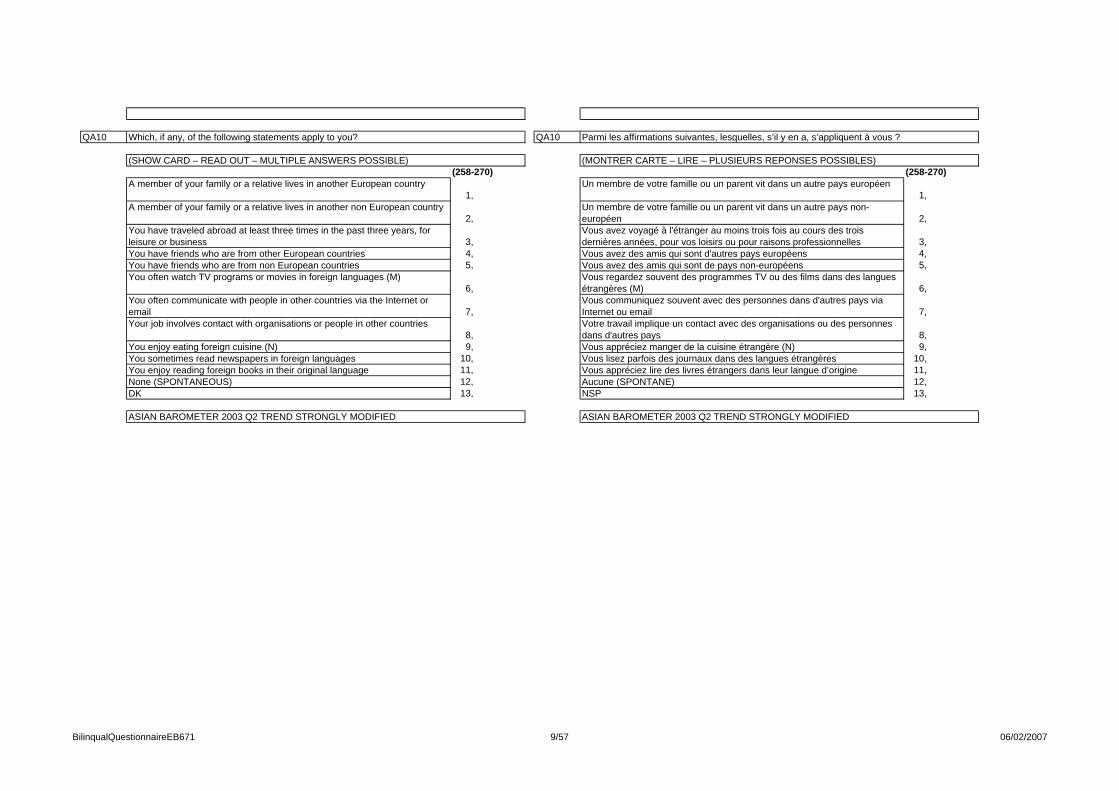
QA10 QA10
(258-270) (258-270)
1, 1,
2, 2,
3, 3,4, 4,5, 5,
6, 6,
7, 7,
8, 8,9, 9,
10, 10,11, 11,12, 12,13, 13,
Vous appréciez lire des livres étrangers dans leur langue d’origineAucune (SPONTANE)NSP
ASIAN BAROMETER 2003 Q2 TREND STRONGLY MODIFIED
Vous communiquez souvent avec des personnes dans d'autres pays via Internet ou email Votre travail implique un contact avec des organisations ou des personnes dans d'autres pays Vous appréciez manger de la cuisine étrangère (N)Vous lisez parfois des journaux dans des langues étrangères
Vous avez voyagé à l'étranger au moins trois fois au cours des trois dernières années, pour vos loisirs ou pour raisons professionnelles Vous avez des amis qui sont d'autres pays européens Vous avez des amis qui sont de pays non-européens Vous regardez souvent des programmes TV ou des films dans des langues étrangères (M)
Parmi les affirmations suivantes, lesquelles, s’il y en a, s’appliquent à vous ?
(MONTRER CARTE – LIRE – PLUSIEURS REPONSES POSSIBLES)
Un membre de votre famille ou un parent vit dans un autre pays européen
Un membre de votre famille ou un parent vit dans un autre pays non-européen
You enjoy reading foreign books in their original languageNone (SPONTANEOUS)DK
ASIAN BAROMETER 2003 Q2 TREND STRONGLY MODIFIED
You often communicate with people in other countries via the Internet or emailYour job involves contact with organisations or people in other countries
You enjoy eating foreign cuisine (N)You sometimes read newspapers in foreign languages
You have traveled abroad at least three times in the past three years, for leisure or businessYou have friends who are from other European countriesYou have friends who are from non European countriesYou often watch TV programs or movies in foreign languages (M)
Which, if any, of the following statements apply to you?
(SHOW CARD – READ OUT – MULTIPLE ANSWERS POSSIBLE)
A member of your family or a relative lives in another European country
A member of your family or a relative lives in another non European country
BilinqualQuestionnaireEB671 9/57 06/02/2007

QA11 QA11
(271)1
(271)1
(272)
2
(272)
2
(273)3
(273)3
QA12 QA12
(274) (274)1 12 23 34 45 5
Plutôt pas intéressé(e)Pas du tout intéressé(e)NSP
NEW
Dans quelle mesure diriez-vous que vous êtes intéressé(e) par le fait de rencontrer, en personne, des gens d’autres pays européens ?
(LIRE – UNE SEULE REPONSE)
Très intéressé(e)Plutôt intéressé(e)
4 5
EB60.1 Q41 TREND MODIFIED
L'art et la culture dans le reste du monde
1 2 3
4 5
L’art et la culture dans d'autres pays européens (M)
1 2 3 4 5
L’art et la culture en (NOTRE PAYS)
1 2 3
Dans quelle mesure les sujets suivants vous intéressent-ils ? Diriez-vous que vous êtes très intéressé(e), plutôt intéressé(e), plutôt pas intéressé(e) ou pas du tout intéressé(e) par … ?
(MONTRER CARTE AVEC ECHELLE – UNE REPONSE PAR LIGNE)
(LIRE) Très intéressé(
e)
Plutôt intéressé(
e) (M)
Plutôt pas intéressé(
e) (M)
Pas du tout
intéressé(e)
NSP
Not very interestedNot at all interestedDK
NEW
How interested would you say you are in meeting in person people from other European countries?
(READ OUT – ONE ANSWER ONLY)
Very interestedFairly interested
4 5
EB60.1 Q41 TREND MODIFIED
Arts and culture in the rest of the world
1 2 3
4 5
Arts and culture in other European countries (M)
1 2 3 4 5
Arts and culture in (OUR COUNTRY)
1 2 3
To what extent do the following topics interest you? Would you say you are very interested, fairly interested, not very interested or not at all interested in…?
(SHOW CARD WITH SCALE – ONE ANSWER PER LINE)
(READ OUT) Very interested
Fairly interested
Not very interested
Not at all interested
DK
BilinqualQuestionnaireEB671 10/57 06/02/2007

QA13 QA13
(275)
1
(275)
1
(276)
2
(276)
2
(277)
3
(277)
3
(278)
4
(278)
4
(279)
5
(279)
5
(280)
6
(280)
6
4 5
Il n'y a pas de culture européenne spécifique, mais seulement une culture occidentale globale qui est, par exemple, la même en Europe et aux Etats-Unis
1 2 3 4 5
La richesse de la culture européenne trouve sa source dans sa longue histoire partagée par les pays européens
1 2 3
4 5
Grâce à la mondialisation, la culture européenne renforcera son dynamisme et son rayonnement dans le monde
1 2 3 4 5
Il n'y a pas de culture européenne commune parce que les pays européens sont trop différents les uns des autres
1 2 3
4 5
C'est la diversité de la culture européenne qui fait son originalité et lui donne sa valeur particulière
1 2 3 4 5
L'Europe est par excellence le continent de la culture
1 2 3
Je vais à présent vous lire plusieurs affirmations ou opinions que l’on entend parfois. Pour chaque affirmation, pouvez-vous me dire si elle correspond très bien, plutôt bien, plutôt mal ou très mal à ce que vous pensez personnellement.
(MONTRER CARTE AVEC ECHELLE – UNE REPONSE PAR LIGNE)
(LIRE – ROTATION) Très bien Plutôt bien Plutôt mal Très mal NSP
4 5
There is no specific European culture, only a global western culture which is, for example, the same in Europe and the US
1 2 3 4 5
The richness of European culture comes from its long history shared by European countries
1 2 3
4 5
Through globalisation, European culture will become more dynamic and widespread in the world
1 2 3 4 5
There is no common European culture because European countries are too different from one another
1 2 3
4 5
It’s the diversity of European culture that sets it apart and gives it its particular value
1 2 3 4 5
Europe is clearly the continent of culture
1 2 3
I will now read out several statements or opinions that are sometimes heard. For each one, please tell me if it corresponds very well, fairly well, fairly badly or very badly to what you think personally.
(SHOW CARD WITH SCALE – ONE ANSWER PER LINE)
(READ OUT – ROTATE) Very well Fairly well Fairly badly
Very badly DK
BilinqualQuestionnaireEB671 11/57 06/02/2007

(281)
7
(281)
7
(282)
8
(282)
8
QA14 QA14
(283) 1 (283) 1(284) 2 (284) 2(285) 3 (285) 3(286) 4 (286) 4(287) 5 (287) 5
QA15 QA15
(288) (288)1 12 23 34 45 5
Européen(ne) uniquementNSP
EB64.2 QA40
(NATIONALITE COMME MENTIONNE EN Q1) (MONTRER CARTE – LIRE – UNE SEULE REPONSE)
*?Q1FIRST uniquement*?Q1FIRST et Européen(ne)Européen(ne) et *?Q1FIRST
4 5
EB65.2 QA35 TREND MODIFIED (ITEMS 1–3+4) – EB63.4 QA35 TREND MODIFIED (ITEM 4)
Dans un avenir proche, vous voyez-vous … ?
Le monde (N) 1 2 3
4 5L'Europe (M) 1 2 3 4 5(NOTRE PAYS) 1 2 3
4 5Votre région 1 2 3 4 5Votre ville\ village 1 2 3
NEW
Les gens peuvent se sentir attachés à des degrés divers à leur ville ou village, à leur région, à leur pays, à l'Europe ou au monde. Veuillez me dire dans quelle mesure vous vous sentez attaché(e) à … (M)
(MONTRER CARTE AVEC ECHELLE – UNE REPONSE PAR LIGNE)
(LIRE) Très attaché(e)
Assez attaché(e)
Pas très attaché(e)
Pas du tout
attaché(e)
NSP
4 5
En comparaison avec d'autres continents, il est nettement plus facile de voir ce que les Européens ont en commun culturellement
1 2 3 4 5
La mondialisation menace la culture européenne. L'Europe et ses pays doivent prendre des mesures pour la préserver
1 2 3
European onlyDK
EB64.2 QA40
(NATIONALITY AS MENTIONNED IN Q1) (SHOW CARD – READ OUT – ONE ANSWER ONLY)
*?Q1FIRST only*?Q1FIRST and EuropeanEuropean and *?Q1FIRST
4 5
EB65.2 QA35 TREND MODIFIED (ITEMS 1–3+4) – EB63.4 QA35 TREND MODIFIED (ITEM 4)
In the near future, do you see yourself as...?
The world (N) 1 2 3
4 5Europe (M) 1 2 3 4 5(OUR COUNTRY) 1 2 3
4 5Your region 1 2 3 4 5Your city\ town\ village 1 2 3
NEW
People may feel different levels of attachment to their village, town or city, to their region, to their country, to Europe or to the world. Please tell me how attached you feel to… (M)
(SHOW CARD WITH SCALE – ONE ANSWER PER LINE)
(READ OUT) Very attached
Fairly attached
Not very attached
Not at all attached
DK
4 5
When compared to other continents, it is much easier to see what Europeans have in common culturally
1 2 3 4 5
Globalisation threatens European culture. Europe and its countries must take measures to preserve it
1 2 3
BilinqualQuestionnaireEB671 12/57 06/02/2007
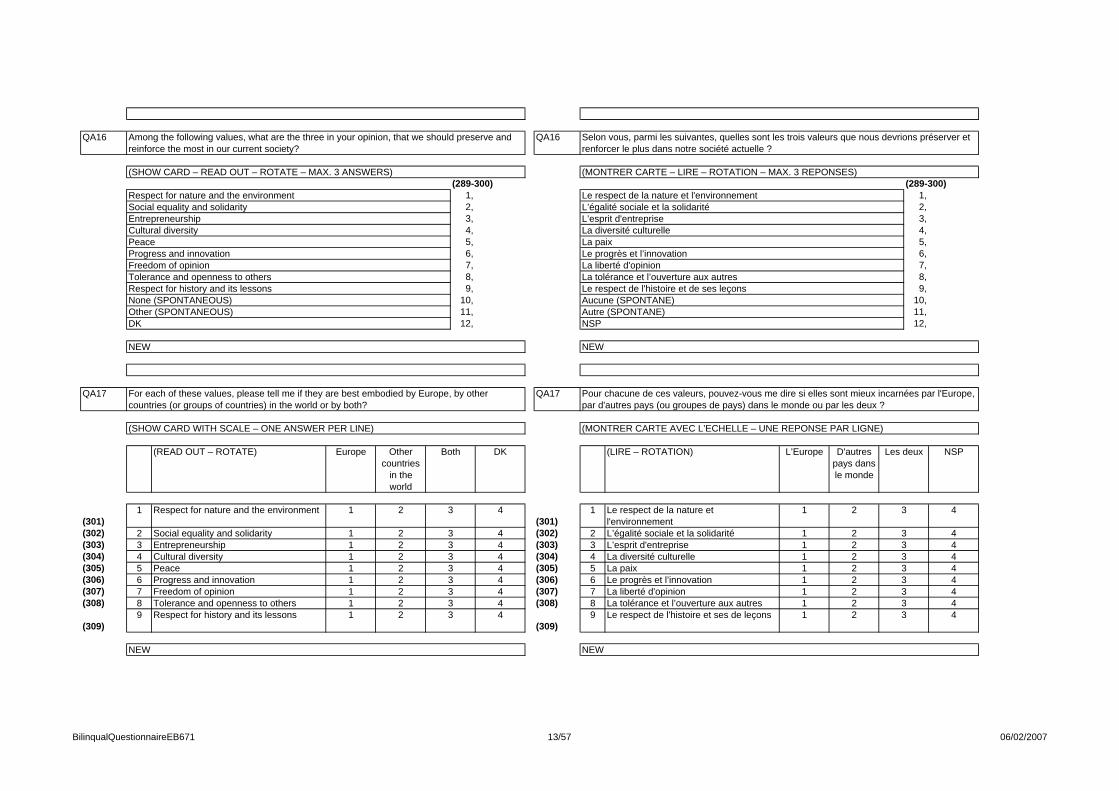
QA16 QA16
(289-300) (289-300)1, 1,2, 2,3, 3,4, 4,5, 5,6, 6,7, 7,8, 8,9, 9,
10, 10,11, 11,12, 12,
QA17 QA17
(301)1
(301)1
(302) 2 (302) 2(303) 3 (303) 3(304) 4 (304) 4(305) 5 (305) 5(306) 6 (306) 6(307) 7 (307) 7(308) 8 (308) 8
(309)9
(309)9 4
NEW
Le respect de l'histoire et ses de leçons 1 2 3
4La tolérance et l’ouverture aux autres 1 2 3 4La liberté d'opinion 1 2 3
4Le progrès et l’innovation 1 2 3 4La paix 1 2 3
4La diversité culturelle 1 2 3 4L’esprit d'entreprise 1 2 3
4
L’égalité sociale et la solidarité 1 2 3 4
Le respect de la nature et l'environnement
1 2 3
Pour chacune de ces valeurs, pouvez-vous me dire si elles sont mieux incarnées par l'Europe, par d'autres pays (ou groupes de pays) dans le monde ou par les deux ?
(MONTRER CARTE AVEC L’ECHELLE – UNE REPONSE PAR LIGNE)
(LIRE – ROTATION) L’Europe D'autres pays dans le monde
Les deux NSP
Autre (SPONTANE)NSP
NEW
La liberté d'opinionLa tolérance et l’ouverture aux autresLe respect de l'histoire et de ses leçonsAucune (SPONTANE)
L’esprit d'entrepriseLa diversité culturelleLa paixLe progrès et l’innovation
Selon vous, parmi les suivantes, quelles sont les trois valeurs que nous devrions préserver et renforcer le plus dans notre société actuelle ?
(MONTRER CARTE – LIRE – ROTATION – MAX. 3 REPONSES)
Le respect de la nature et l'environnementL’égalité sociale et la solidarité
4
NEW
Respect for history and its lessons 1 2 3
4Tolerance and openness to others 1 2 3 4Freedom of opinion 1 2 3
4Progress and innovation 1 2 3 4Peace 1 2 3
4Cultural diversity 1 2 3 4Entrepreneurship 1 2 3
4
Social equality and solidarity 1 2 3 4
Respect for nature and the environment 1 2 3
For each of these values, please tell me if they are best embodied by Europe, by other countries (or groups of countries) in the world or by both?
(SHOW CARD WITH SCALE – ONE ANSWER PER LINE)
(READ OUT – ROTATE) Europe Other countries
in the world
Both DK
Other (SPONTANEOUS)DK
NEW
Freedom of opinionTolerance and openness to othersRespect for history and its lessonsNone (SPONTANEOUS)
EntrepreneurshipCultural diversityPeaceProgress and innovation
Among the following values, what are the three in your opinion, that we should preserve and reinforce the most in our current society?
(SHOW CARD – READ OUT – ROTATE – MAX. 3 ANSWERS)
Respect for nature and the environmentSocial equality and solidarity
BilinqualQuestionnaireEB671 13/57 06/02/2007

QA18 QA18
(310)
1
(310)
1
(311)
2
(311)
2
(312)
3
(312)
3 4 5
NEW
L'Europe, avec son héritage culturel et ses valeurs, est particulièrement bien placée pour contribuer à plus de tolérance dans le monde
1 2 3
4 5
La culture et les échanges culturels peuvent jouer un grand rôle pour développer une meilleure compréhension et plus de tolérance dans le monde, y compris là où il y a des conflits ou des tensions
1 2 3 4 5
La culture et les échanges culturels devraient avoir une place très importante dans l’UE pour que les citoyens des différents Etats membres se connaissent mieux et se sentent davantage européens
1 2 3
(MONTRER CARTE AVEC ECHELLE – UNE REPONSE PAR LIGNE)
(LIRE – ROTATION) Tout à fait d’accord
Plutôt d’accord
Plutôt pas d’accord
Pas du tout
d’accord
NSP
Pour chacune des opinions et affirmations suivantes, pouvez-vous me dire si vous êtes tout à fait d’accord, plutôt d’accord, plutôt pas d’accord ou pas du tout d’accord.
4 5
NEW
Europe, with its long standing culture and values, is particularly well placed to contribute to greater tolerance in the world
1 2 3
4 5
Culture and cultural exchanges can play an important role in developing greater understanding and tolerance in the world, even where there are conflicts or tensions
1 2 3 4 5
Culture and cultural exchanges should have a very important place in the EU so that citizens from different Member States can learn more from each other and feel more European
1 2 3
(SHOW CARD WITH SCALE – ONE ANSWER PER LINE)
(READ OUT – ROTATE) Totally agree
Tend to agree
Tend to disagree
Totally disagree
DK
For each of the following opinions and statements, please tell me whether you totally agree, tend to agree, tend to disagree or totally disagree.
BilinqualQuestionnaireEB671 14/57 06/02/2007
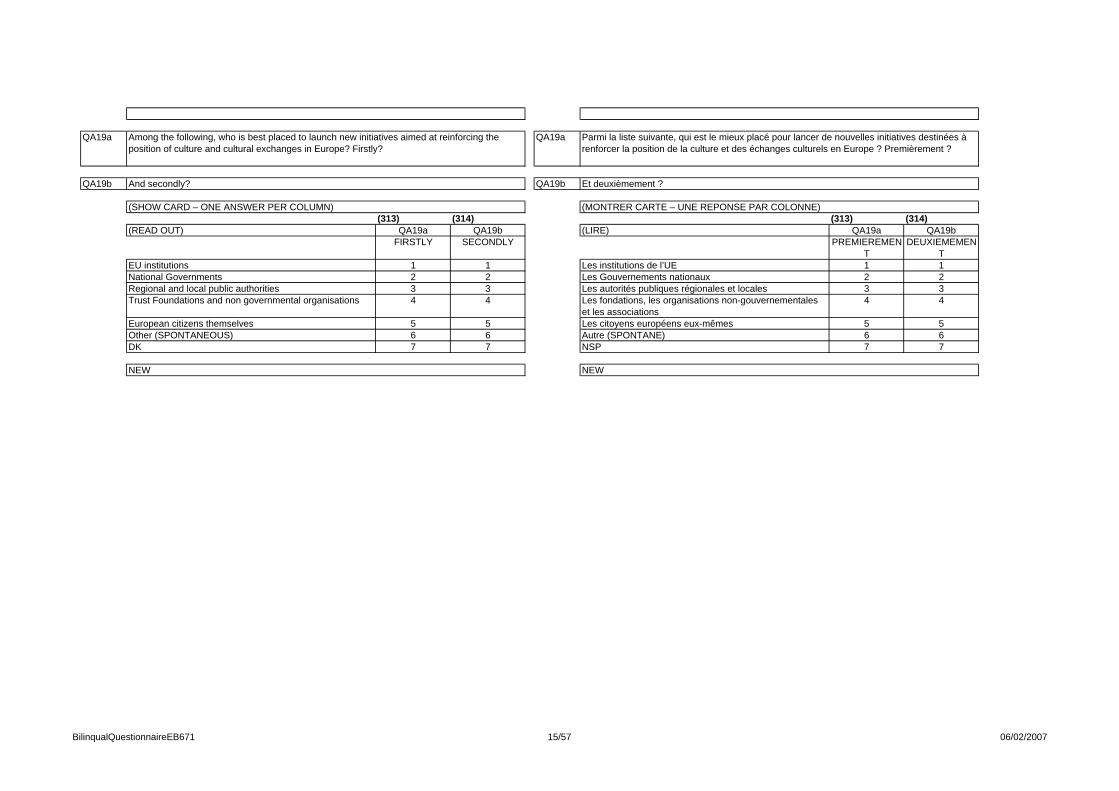
QA19a QA19a
QA19b QA19b
(313) (314) (313) (314)
NEW
Autre (SPONTANE) 6 6NSP 7 7
Les fondations, les organisations non-gouvernementales et les associations
4 4
Les citoyens européens eux-mêmes 5 5
Les Gouvernements nationaux 2 2Les autorités publiques régionales et locales 3 3
PREMIEREMENT
DEUXIEMEMENT
Les institutions de l’UE 1 1
Parmi la liste suivante, qui est le mieux placé pour lancer de nouvelles initiatives destinées à renforcer la position de la culture et des échanges culturels en Europe ? Premièrement ?
Et deuxièmement ?
(MONTRER CARTE – UNE REPONSE PAR COLONNE)
(LIRE) QA19a QA19b
NEW
Other (SPONTANEOUS) 6 6DK 7 7
Trust Foundations and non governmental organisations 4 4
European citizens themselves 5 5
National Governments 2 2Regional and local public authorities 3 3
FIRSTLY SECONDLY
EU institutions 1 1
Among the following, who is best placed to launch new initiatives aimed at reinforcing the position of culture and cultural exchanges in Europe? Firstly?
And secondly?
(SHOW CARD – ONE ANSWER PER COLUMN)
(READ OUT) QA19a QA19b
BilinqualQuestionnaireEB671 15/57 06/02/2007

QA20 QA20
(315-325) (315-325)1, 1,
2, 2,
3, 3,4, 4,
5, 5,
6, 6,
7, 7,
8, 8,
9, 9,10, 10,11, 11,
QA21 QA21
(326) (326)
1 1
2 2
3 34 4
Non, vous pensez que vous connaissez ou maîtrisez suffisamment de langue(s) étrangère(s)Non, vous ne souhaiteriez pas apprendre ou améliorer votre maîtrise d’autres languesNSP
NEW
Seriez-vous désireux(e) d’apprendre une nouvelle langue ou d’améliorer la maîtrise d’une ou plusieurs langues étrangères ?
(MONTRER CARTE – LIRE – UNE SEULE REPONSE)
Oui, vous souhaiteriez apprendre une nouvelle langue ou améliorer votre maîtrise d’une ou plusieurs langues étrangères
Soutenir la distribution de films provenant d'autres Etats membres de l'UE
Autre (SPONTANE) NSP
NEW
Nommer chaque année une Capitale Européenne de la Culture, dans laquelle de nombreux événements sont organisés Soutenir la circulation d‘expositions ou de spectacles (tels que des pièces de théâtre ou des concerts) au delà des frontières nationales Mettre en oeuvre des programmes permettant aux personnes qui ne voyagent pas en général de se rencontrer Soutenir la production de documentaires TV à propos des autres Etats membres de l'UE
Développer l'enseignement des langues étrangères à l'écoleAider à financer la conservation de l'héritage historique, architectural et artistique en Europe Augmenter les programmes d'échange pour les étudiants et professeurs, tels qu'Erasmus ou Leonardo Soutenir le jumelage des villes à travers l’Europe
Parmi la liste suivante, pouvez-vous choisir trois actions qui aideraient le plus les Européens à mieux se connaître entre eux.
(MONTRER CARTE – LIRE – ROTATION – MAX. 3 REPONSES)
No, you believe you already know or have sufficient command of the language(s) you needNo, you would not be willing to learn or improve your command of any other languageDK
NEW
Would you be willing to learn a new language or improve your command of another language(s)...?
(SHOW CARD – READ OUT – ONE ANSWER ONLY)
Yes, you would like to either learn a new language or improve your command of a foreign language
Support the distribution of movies originating from other EU member states
Other (SPONTANEOUS) DK
NEW
Nominate an annual European Capital of Culture, in which many events are organizedSupport exhibitions and live performances (such as plays and concerts) to tour beyond national bordersImplement programmes enabling people who do not usually travel to meet one anotherSupport the production of TV documentaries about other EU member states
Develop the teaching of foreign languages at schoolHelp finance the preservation of historical, architectural and artistic heritage in EuropeIncrease exchange programmes for students and teachers, such as Erasmus or LeonardoSupport town twinning across Europe
From the following list, please choose three actions that would best help Europeans get to know each other better.
(SHOW CARD – READ OUT – ROTATE – MAX. 3 ANSWERS)
BilinqualQuestionnaireEB671 16/57 06/02/2007

QA22 QA22
(327-339) (327-339)1, 1,
2, 2,3, 3,4, 4,5, 5,6, 6,7, 7,8, 8,9, 9,
10, 10,11, 11,12, 12,13, 13,NSP
EB64.3 QA5 TREND MODIFIED
Pour pouvoir comprendre les personnes d’autres culturesPour pouvoir lire des livres et des journaux ou regarder des films et des émissions de télévision dans une autre langue (N)Pour me sentir plus européen(ne)Autre (SPONTANE)
Pour obtenir un meilleur travail en (NOTRE PAYS)Pour votre satisfaction personnellePour garder la connaissance d’une langue parlée par ma famille (M)Pour rencontrer des personnes d’autres pays
Pour avoir quelques notions de base lors de vacances à l'étranger (M)Pour l’utiliser au travail (y compris lors de voyages d’affaires à l’étranger)
Pour pouvoir étudier dans un autre paysPour pouvoir travailler dans un autre pays
POSER QA22 SI "DESIREUX D'APPRENDRE UNE AUTRE LANGUE", CODE 1 EN QA21 – LES AUTRES ALLER EN QB
Quelles seraient vos principales motivations pour apprendre ou améliorer votre maîtrise d’autres langues ? (M)
(MONTRER CARTE – LIRE – PLUSIEURS REPONSES POSSIBLES)
DK
EB64.3 QA5 TREND MODIFIED
To be able to understand people from other cultures To be able to read books and newspapers, or watch movies and TV programmes in another language (N)To feel more EuropeanOther (SPONTANEOUS)
To get a better job in (OUR COUNTRY) For personal satisfactionTo keep up knowledge of a language spoken by my familyTo meet people from other countries
To be able to get along with basic needs when on holiday abroad (M)To use at work (including travelling abroad on business)
To be able to study in another countryTo be able to work in another country
ASK QA22 IF "WILLING TO LEARN A NEW LANGUAGE", CODE 1 IN QA21 – OTHERS GO TO QB
What would be your main reasons for learning or improving another language? (M)
(SHOW CARD – READ OUT – MULTIPLE ANSWERS POSSIBLE)
BilinqualQuestionnaireEB671 17/57 06/02/2007
QB1a QB1a
(360-361) (360-361)1 12 23 34 45 56 67 78 8
9 910 1011 1112 1213 1314 14NSP
NEW BASED ON EB56.1 Q2
Etre utile aux autres (M)Etre accepté ou respecté par la société (M)Participer à des associations, syndicats ou partis politiques (M)Autres (SPONTANE)
Partir au moins une fois par an en vacancesAvoir des relations amicales avec ses voisins (M)Sortir entre amis ou en famille (M)Avoir un logement suffisamment grand pour que chacun ait son espace (M)
Avoir une bonne formation (M)Avoir une bonne relation avec un partenaire (M)Avoir des enfants Avoir suffisamment de loisirs et les moyens d’en profiter
Parmi les aspects suivants, quel est le plus important pour se sentir bien dans sa vie de nos jours ? (M)
(MONTRER CARTE – LIRE – UNE SEULE REPONSE)
Avoir un bon emploi
Passons à un autre sujet.
POSER LES QB EN UE27 et HR
DK
NEW BASED ON EB56.1 Q2
Being useful to others (M)Being accepted or respected by society (M)Participating in associations, trade unions or political parties (M)Other (SPONTANEOUS)
Going on holiday at least once a year (M)Being on friendly terms with the neighboursGoing out with friends or family (M)Having sufficient accommodation for everyone to have their own space
Having a good educationHaving a good relationship with a partner (M)Having children Having sufficient leisure time and being able to enjoy it (M)
Among the following aspects, please tell me what is the most important to have a good life nowadays? (M)
(SHOW CARD – READ OUT – ONE ANSWER ONLY)
Having a good job
Let's move on to another topic.
ASK QB IN EU27 and HR
BilinqualQuestionnaireEB671 18/57 06/02/2007

TABLES

TOTAL Totally fulfilled Fairly fulfilled Not very fulfilled Not at all fulfilledNot aplicable
(SPONTANEOUS)DK Fulfilled Not fulfilled
UE27 EU27 26755 29% 55% 12% 3% - 1% 84% 15%BE 1040 37% 51% 9% 3% - - 88% 12%BG 1009 9% 29% 43% 17% - 2% 38% 60%CZ 1060 30% 54% 13% 2% - 1% 84% 15%DK 1008 53% 44% 3% - - - 97% 3%D-W 1006 35% 56% 7% 2% - - 91% 9%DE 1534 33% 56% 9% 2% - - 89% 11%D-E 528 27% 55% 15% 3% - - 82% 18%EE 1001 29% 51% 16% 2% 1% 1% 80% 18%EL 1000 24% 53% 20% 3% - - 77% 23%ES 1006 21% 68% 9% 2% - - 89% 11%FR 1031 40% 48% 9% 3% - - 88% 12%IE 1000 28% 59% 9% 2% - 2% 87% 11%IT 1000 15% 67% 13% 4% - 1% 82% 17%CY 500 18% 60% 18% 4% - - 78% 22%LV 1006 19% 46% 30% 4% - 1% 65% 34%LT 1029 17% 50% 28% 5% - - 67% 33%LU 500 36% 51% 11% - 1% 1% 87% 11%HU 1000 30% 42% 20% 8% - - 72% 28%MT 500 21% 69% 9% 1% - - 90% 10%NL 1000 51% 43% 5% 1% - - 94% 6%AT 1011 32% 53% 13% 1% - 1% 85% 14%PL 1000 25% 58% 14% 2% - 1% 83% 16%PT 1013 13% 50% 27% 9% - 1% 63% 36%RO 1037 9% 50% 29% 11% - 1% 59% 40%SI 1015 22% 63% 13% 2% - - 85% 15%SK 1094 25% 56% 16% 3% - - 81% 19%FI 1041 50% 45% 4% 1% - - 95% 5%SE 1011 58% 39% 3% - - - 97% 3%UK 1310 31% 56% 9% 2% 1% 1% 87% 11%
Your private life
QA1.1 To what extent would you say that the life you live allows you to feel fulfilled in…?

TOTAL Totally fulfilled Fairly fulfilled Not very fulfilled Not at all fulfilledNot aplicable
(SPONTANEOUS)DK Fulfilled Not fulfilled
UE27 EU27 26755 17% 39% 15% 6% 22% 1% 56% 21%BE 1040 19% 33% 8% 4% 35% 1% 52% 12%BG 1009 6% 21% 31% 20% 15% 7% 27% 51%CZ 1060 19% 47% 16% 5% 12% 1% 66% 21%DK 1008 30% 42% 6% 1% 20% 1% 72% 7%D-W 1006 21% 34% 12% 4% 28% 1% 55% 16%DE 1534 21% 33% 13% 5% 28% - 54% 18%D-E 528 20% 30% 15% 6% 29% - 50% 21%EE 1001 22% 35% 15% 3% 20% 5% 57% 18%EL 1000 13% 34% 27% 8% 18% - 47% 35%ES 1006 15% 53% 16% 5% 9% 2% 68% 21%FR 1031 17% 32% 12% 6% 32% 1% 49% 18%IE 1000 17% 36% 13% 5% 24% 5% 53% 18%IT 1000 11% 49% 17% 6% 16% 1% 60% 23%CY 500 9% 31% 12% 6% 41% 1% 40% 18%LV 1006 13% 37% 25% 8% 15% 2% 50% 33%LT 1029 12% 35% 22% 9% 17% 5% 47% 31%LU 500 16% 35% 9% 2% 37% 1% 51% 11%HU 1000 15% 33% 18% 10% 24% - 48% 28%MT 500 8% 42% 6% 1% 42% 1% 50% 7%NL 1000 30% 34% 8% 2% 26% - 64% 10%AT 1011 20% 37% 13% 4% 25% 1% 57% 17%PL 1000 16% 38% 21% 7% 16% 2% 54% 28%PT 1013 9% 33% 28% 10% 18% 2% 42% 38%RO 1037 6% 39% 28% 14% 9% 4% 45% 42%SI 1015 16% 45% 17% 5% 16% 1% 61% 22%SK 1094 13% 42% 24% 7% 12% 2% 55% 31%FI 1041 24% 39% 11% 2% 23% 1% 63% 13%SE 1011 33% 38% 7% 3% 19% - 71% 10%UK 1310 17% 39% 10% 4% 29% 1% 56% 14%
Your professional life
QA1.2 To what extent would you say that the life you live allows you to feel fulfilled in…?

TOTAL
Civilization (Western,
Asian, African,
Arab, etc.)
Knowledge and science (research)
Education and family
(upbringing
Traditions, languages,
customs and social or cultural
communities
Life style and manners
Leisure, sport,
travels, fun
Arts (performance arts – music,
theatre, cinema,
ballet, opera, etc. - and
visual arts - architecture, painting, art
galleries, etc.)
Literature, poetry,
playwriting, authors
History
Values and beliefs
(including philosophy
and religion)
Museums
Too elite, snobbish,
posh, boring (negative things)
Not interested, not for me
Other DK
UE27 EU27 26755 13% 18% 20% 24% 18% 9% 39% 24% 13% 9% 11% 1% 2% 7% 5%BE 1040 18% 21% 14% 21% 10% 19% 52% 22% 15% 8% 18% 1% 3% 3% 1%BG 1009 10% 22% 28% 36% 25% 4% 40% 27% 13% 11% 13% 0% 4% 0% 3%CZ 1060 8% 8% 12% 29% 18% 17% 72% 32% 19% 6% 16% 0% 1% 3% 0%DK 1008 13% 3% 8% 21% 23% 20% 74% 24% 13% 10% 20% 2% 2% 9% 1%D-W 1006 12% 10% 19% 28% 16% 13% 58% 35% 14% 11% 18% 1% 2% 5% 3%DE 1534 12% 9% 18% 27% 16% 15% 60% 37% 14% 10% 18% 1% 2% 6% 3%D-E 528 9% 4% 15% 24% 16% 23% 67% 41% 12% 7% 19% 0% 2% 9% 1%EE 1001 5% 9% 22% 28% 21% 21% 55% 38% 8% 6% 11% 0% 1% 4% 6%EL 1000 38% 11% 13% 23% 22% 4% 25% 14% 12% 8% 5% 4% 5% 2% 4%ES 1006 7% 35% 36% 19% 13% 6% 25% 19% 14% 7% 8% 0% 2% 3% 7%FR 1031 7% 29% 13% 10% 4% 13% 38% 32% 11% 4% 8% 0% 3% 17% 6%IE 1000 11% 6% 12% 33% 18% 9% 30% 12% 19% 11% 9% 1% 1% 9% 7%IT 1000 16% 35% 39% 22% 15% 6% 18% 20% 15% 10% 6% 1% 2% 5% 2%CY 500 7% 17% 22% 41% 43% 5% 37% 9% 17% 8% 5% - 2% 13% 2%LV 1006 5% 6% 21% 26% 22% 11% 50% 21% 6% 6% 9% 1% 3% 4% 3%LT 1029 3% 18% 21% 18% 31% 11% 36% 20% 8% 4% 10% 1% 7% 3% 4%LU 500 17% 12% 12% 25% 13% 16% 67% 21% 16% 11% 23% 2% 2% 11% 2%HU 1000 7% 24% 19% 27% 16% 12% 62% 43% 18% 8% 21% 1% 2% 6% 1%MT 500 2% 1% 8% 35% 20% 2% 29% 4% 21% 8% 13% 0% 1% 10% 8%NL 1000 27% 5% 7% 33% 23% 7% 51% 13% 11% 18% 21% 1% 1% 14% 2%AT 1011 17% 14% 20% 48% 21% 10% 61% 28% 24% 20% 26% 2% 6% 1% 1%PL 1000 4% 11% 18% 12% 44% 6% 35% 18% 5% 4% 5% 0% 1% 4% 6%PT 1013 10% 25% 26% 18% 12% 7% 26% 20% 21% 8% 11% 1% 4% 4% 9%RO 1037 25% 26% 31% 32% 22% 8% 37% 35% 25% 19% 17% 1% 5% 1% 5%SI 1015 8% 8% 16% 18% 36% 8% 55% 38% 9% 4% 16% 1% 3% 5% 1%SK 1094 10% 13% 20% 45% 23% 20% 67% 33% 22% 14% 26% 1% 1% 2% 0%FI 1041 6% 4% 3% 12% 8% 10% 74% 21% 8% 3% 8% 2% 2% 9% 2%SE 1011 11% 4% 3% 22% 6% 9% 75% 29% 10% 6% 14% 1% 1% 11% 2%UK 1310 15% 2% 7% 33% 19% 2% 20% 9% 9% 13% 4% 2% 2% 8% 12%
QA2 Please tell me what comes to mind when you think about the word “culture“. (DO NOT READ OUT - MULTIPLE ANSWERS POSSIBLE)

TOTAL Very important Fairly important Not very important Not at all important DK Important Not important
UE27 EU27 26755 31% 46% 17% 5% 1% 77% 22%BE 1040 29% 47% 18% 6% - 76% 24%BG 1009 31% 35% 20% 7% 7% 66% 27%CZ 1060 24% 49% 24% 2% 1% 73% 26%DK 1008 35% 42% 19% 4% - 77% 23%D-W 1006 21% 44% 28% 7% - 65% 35%DE 1534 21% 44% 28% 7% - 65% 35%D-E 528 22% 44% 30% 4% - 66% 34%EE 1001 30% 53% 16% 1% - 83% 17%EL 1000 30% 38% 16% 15% 1% 68% 31%ES 1006 36% 49% 10% 3% 2% 85% 13%FR 1031 37% 51% 8% 3% 1% 88% 11%IE 1000 28% 38% 20% 11% 3% 66% 31%IT 1000 36% 52% 9% 2% 1% 88% 11%CY 500 59% 32% 6% 1% 2% 91% 7%LV 1006 25% 52% 21% 2% - 77% 23%LT 1029 30% 48% 17% 4% 1% 78% 21%LU 500 31% 46% 17% 5% 1% 77% 22%HU 1000 28% 49% 19% 4% - 77% 23%MT 500 43% 36% 14% 4% 3% 79% 18%NL 1000 26% 52% 19% 3% - 78% 22%AT 1011 12% 41% 35% 12% - 53% 47%PL 1000 49% 43% 6% 1% 1% 92% 7%PT 1013 24% 50% 17% 7% 2% 74% 24%RO 1037 30% 37% 19% 9% 5% 67% 28%SI 1015 30% 46% 20% 3% 1% 76% 23%SK 1094 19% 51% 26% 3% 1% 70% 29%FI 1041 19% 46% 28% 7% - 65% 35%SE 1011 31% 45% 20% 3% 1% 76% 23%UK 1310 28% 39% 24% 7% 2% 67% 31%
QA3 How important is culture to you personally?
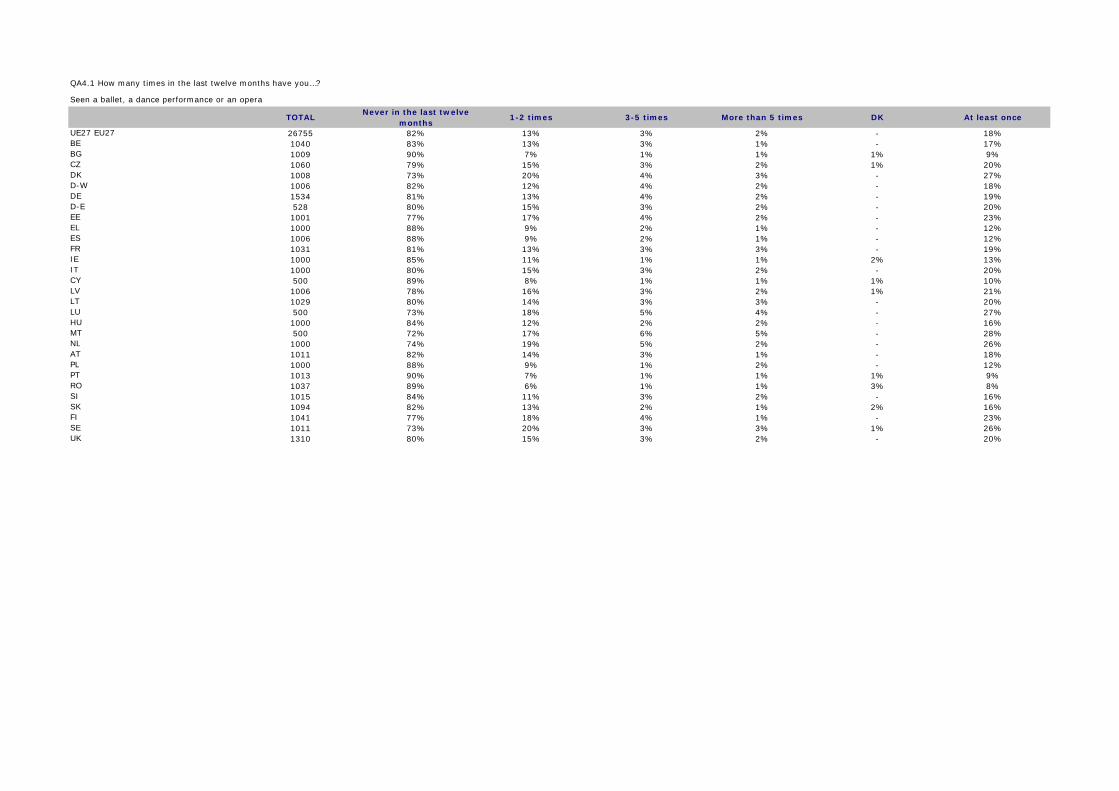
TOTALNever in the last twelve
months 1-2 times 3-5 times More than 5 times DK At least once
UE27 EU27 26755 82% 13% 3% 2% - 18%BE 1040 83% 13% 3% 1% - 17%BG 1009 90% 7% 1% 1% 1% 9%CZ 1060 79% 15% 3% 2% 1% 20%DK 1008 73% 20% 4% 3% - 27%D-W 1006 82% 12% 4% 2% - 18%DE 1534 81% 13% 4% 2% - 19%D-E 528 80% 15% 3% 2% - 20%EE 1001 77% 17% 4% 2% - 23%EL 1000 88% 9% 2% 1% - 12%ES 1006 88% 9% 2% 1% - 12%FR 1031 81% 13% 3% 3% - 19%IE 1000 85% 11% 1% 1% 2% 13%IT 1000 80% 15% 3% 2% - 20%CY 500 89% 8% 1% 1% 1% 10%LV 1006 78% 16% 3% 2% 1% 21%LT 1029 80% 14% 3% 3% - 20%LU 500 73% 18% 5% 4% - 27%HU 1000 84% 12% 2% 2% - 16%MT 500 72% 17% 6% 5% - 28%NL 1000 74% 19% 5% 2% - 26%AT 1011 82% 14% 3% 1% - 18%PL 1000 88% 9% 1% 2% - 12%PT 1013 90% 7% 1% 1% 1% 9%RO 1037 89% 6% 1% 1% 3% 8%SI 1015 84% 11% 3% 2% - 16%SK 1094 82% 13% 2% 1% 2% 16%FI 1041 77% 18% 4% 1% - 23%SE 1011 73% 20% 3% 3% 1% 26%UK 1310 80% 15% 3% 2% - 20%
Seen a ballet, a dance performance or an opera
QA4.1 How many times in the last twelve months have you…?

TOTALNever in the last twelve
months 1-2 times 3-5 times More than 5 times DK At least once
UE27 EU27 26755 48% 20% 14% 17% 1% 51%BE 1040 45% 20% 15% 19% 1% 54%BG 1009 77% 12% 5% 5% 1% 22%CZ 1060 47% 26% 15% 12% - 53%DK 1008 31% 25% 21% 23% - 69%D-W 1006 47% 25% 15% 13% - 53%DE 1534 47% 25% 15% 13% - 53%D-E 528 47% 24% 15% 14% - 53%EE 1001 66% 17% 7% 10% - 34%EL 1000 54% 16% 14% 16% - 46%ES 1006 44% 13% 16% 27% - 56%FR 1031 37% 19% 17% 27% - 63%IE 1000 33% 22% 18% 26% 1% 66%IT 1000 45% 23% 12% 19% 1% 54%CY 500 62% 16% 10% 12% - 38%LV 1006 63% 18% 9% 9% 1% 36%LT 1029 67% 16% 6% 11% - 33%LU 500 37% 20% 20% 22% 1% 62%HU 1000 64% 16% 9% 11% - 36%MT 500 51% 17% 15% 17% - 49%NL 1000 38% 25% 18% 19% - 62%AT 1011 44% 26% 16% 14% - 56%PL 1000 59% 18% 12% 11% - 41%PT 1013 61% 15% 11% 13% - 39%RO 1037 75% 13% 6% 3% 3% 22%SI 1015 53% 17% 14% 16% - 47%SK 1094 49% 29% 12% 9% 1% 50%FI 1041 48% 29% 20% 3% - 52%SE 1011 28% 35% 22% 14% 1% 71%UK 1310 47% 20% 14% 19% - 53%
Been to the cinema
QA4.2 How many times in the last twelve months have you…?

TOTALNever in the last twelve
months 1-2 times 3-5 times More than 5 times DK At least once
UE27 EU27 26755 68% 21% 7% 4% - 32%BE 1040 67% 19% 8% 6% - 33%BG 1009 78% 14% 4% 3% 1% 21%CZ 1060 55% 31% 8% 5% 1% 44%DK 1008 60% 28% 7% 5% - 40%D-W 1006 63% 25% 7% 5% - 37%DE 1534 63% 24% 8% 5% - 37%D-E 528 65% 22% 9% 4% - 35%EE 1001 51% 29% 12% 8% - 49%EL 1000 70% 18% 8% 4% - 30%ES 1006 75% 17% 6% 2% - 25%FR 1031 76% 15% 4% 4% 1% 23%IE 1000 65% 22% 7% 4% 2% 33%IT 1000 74% 20% 3% 3% - 26%CY 500 75% 18% 4% 3% - 25%LV 1006 59% 27% 10% 4% - 41%LT 1029 73% 19% 5% 3% - 27%LU 500 59% 26% 8% 6% 1% 40%HU 1000 69% 21% 6% 4% - 31%MT 500 74% 15% 6% 4% 1% 25%NL 1000 42% 31% 15% 12% - 58%AT 1011 58% 31% 7% 4% - 42%PL 1000 82% 13% 3% 2% - 18%PT 1013 81% 14% 3% 2% - 19%RO 1037 78% 13% 5% 2% 2% 20%SI 1015 64% 24% 6% 6% - 36%SK 1094 62% 30% 5% 2% 1% 37%FI 1041 52% 34% 13% 1% - 48%SE 1011 52% 35% 8% 4% 1% 47%UK 1310 59% 26% 10% 5% - 41%
Been to the theatre
QA4.3 How many times in the last twelve months have you…?

TOTALNever in the last twelve
months 1-2 times 3-5 times More than 5 times DK At least once
UE27 EU27 26755 58% 17% 9% 15% 1% 41%BE 1040 56% 13% 8% 22% 1% 43%BG 1009 75% 12% 7% 4% 2% 23%CZ 1060 50% 18% 12% 20% - 50%DK 1008 51% 19% 9% 21% - 49%D-W 1006 53% 18% 9% 19% 1% 46%DE 1534 53% 19% 9% 18% 1% 46%D-E 528 52% 20% 10% 17% 1% 47%EE 1001 58% 20% 10% 11% 1% 41%EL 1000 68% 15% 7% 10% - 32%ES 1006 62% 13% 11% 14% - 38%FR 1031 64% 15% 8% 13% - 36%IE 1000 35% 18% 15% 29% 3% 62%IT 1000 58% 20% 8% 13% 1% 41%CY 500 65% 13% 5% 16% 1% 34%LV 1006 52% 25% 11% 12% - 48%LT 1029 70% 16% 6% 7% 1% 29%LU 500 53% 15% 10% 21% 1% 46%HU 1000 58% 20% 8% 13% 1% 41%MT 500 60% 16% 9% 14% 1% 39%NL 1000 50% 16% 9% 24% 1% 49%AT 1011 42% 23% 14% 20% 1% 57%PL 1000 66% 17% 8% 8% 1% 33%PT 1013 61% 17% 9% 12% 1% 38%RO 1037 67% 15% 8% 7% 3% 30%SI 1015 50% 22% 14% 14% - 50%SK 1094 38% 24% 14% 23% 1% 61%FI 1041 50% 22% 16% 12% - 50%SE 1011 44% 22% 11% 21% 2% 54%UK 1310 60% 16% 7% 17% - 40%
Been to a sport event
QA4.4 How many times in the last twelve months have you…?
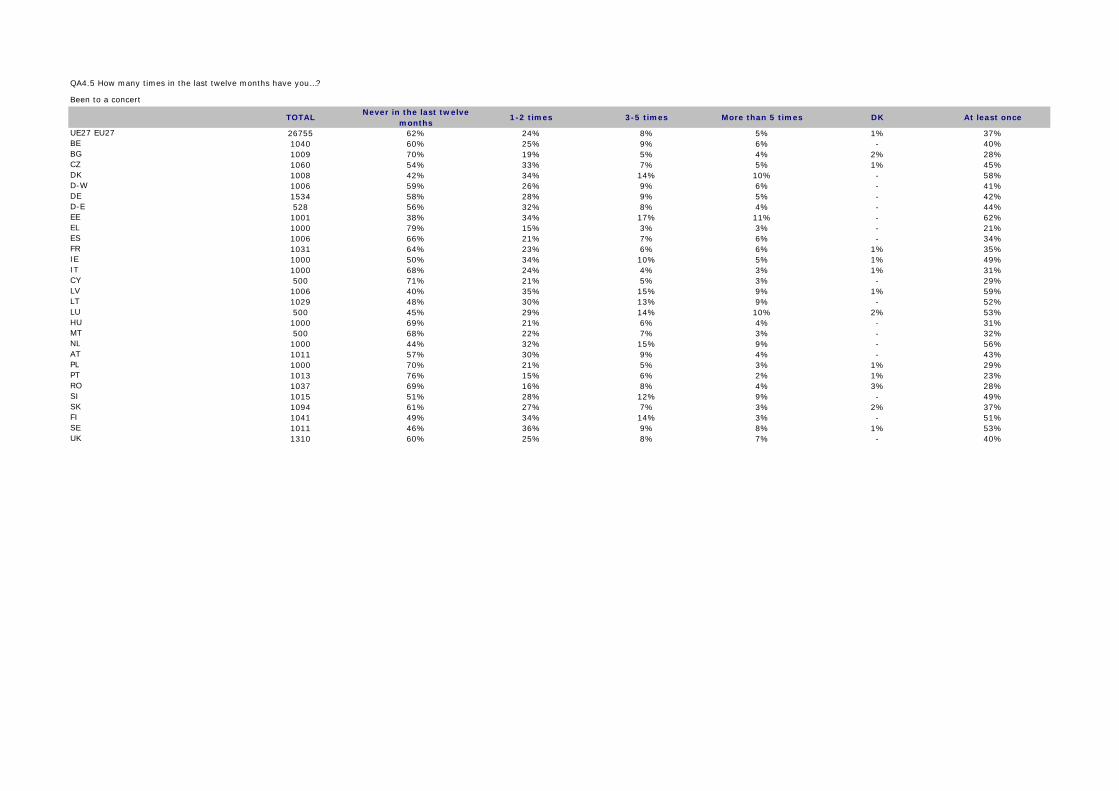
TOTALNever in the last twelve
months 1-2 times 3-5 times More than 5 times DK At least once
UE27 EU27 26755 62% 24% 8% 5% 1% 37%BE 1040 60% 25% 9% 6% - 40%BG 1009 70% 19% 5% 4% 2% 28%CZ 1060 54% 33% 7% 5% 1% 45%DK 1008 42% 34% 14% 10% - 58%D-W 1006 59% 26% 9% 6% - 41%DE 1534 58% 28% 9% 5% - 42%D-E 528 56% 32% 8% 4% - 44%EE 1001 38% 34% 17% 11% - 62%EL 1000 79% 15% 3% 3% - 21%ES 1006 66% 21% 7% 6% - 34%FR 1031 64% 23% 6% 6% 1% 35%IE 1000 50% 34% 10% 5% 1% 49%IT 1000 68% 24% 4% 3% 1% 31%CY 500 71% 21% 5% 3% - 29%LV 1006 40% 35% 15% 9% 1% 59%LT 1029 48% 30% 13% 9% - 52%LU 500 45% 29% 14% 10% 2% 53%HU 1000 69% 21% 6% 4% - 31%MT 500 68% 22% 7% 3% - 32%NL 1000 44% 32% 15% 9% - 56%AT 1011 57% 30% 9% 4% - 43%PL 1000 70% 21% 5% 3% 1% 29%PT 1013 76% 15% 6% 2% 1% 23%RO 1037 69% 16% 8% 4% 3% 28%SI 1015 51% 28% 12% 9% - 49%SK 1094 61% 27% 7% 3% 2% 37%FI 1041 49% 34% 14% 3% - 51%SE 1011 46% 36% 9% 8% 1% 53%UK 1310 60% 25% 8% 7% - 40%
Been to a concert
QA4.5 How many times in the last twelve months have you…?

TOTALNever in the last twelve
months 1-2 times 3-5 times More than 5 times DK At least once
UE27 EU27 26755 64% 13% 6% 16% 1% 35%BE 1040 63% 10% 7% 20% - 37%BG 1009 80% 8% 4% 7% 1% 19%CZ 1060 68% 10% 7% 15% - 32%DK 1008 32% 17% 12% 39% - 68%D-W 1006 71% 12% 5% 11% 1% 28%DE 1534 72% 12% 5% 11% - 28%D-E 528 73% 9% 6% 11% 1% 26%EE 1001 49% 14% 8% 29% - 51%EL 1000 85% 8% 4% 3% - 15%ES 1006 71% 10% 5% 14% - 29%FR 1031 66% 10% 6% 17% 1% 33%IE 1000 51% 16% 13% 18% 2% 47%IT 1000 70% 18% 5% 6% 1% 29%CY 500 87% 8% 3% 2% - 13%LV 1006 61% 8% 8% 23% - 39%LT 1029 67% 9% 6% 17% 1% 32%LU 500 77% 8% 4% 9% 2% 21%HU 1000 67% 14% 6% 13% - 33%MT 500 75% 11% 4% 9% 1% 24%NL 1000 49% 11% 10% 30% - 51%AT 1011 75% 12% 5% 7% 1% 24%PL 1000 62% 11% 6% 20% 1% 37%PT 1013 75% 11% 5% 8% 1% 24%RO 1037 74% 10% 6% 6% 4% 22%SI 1015 47% 12% 11% 30% - 53%SK 1094 56% 17% 8% 17% 2% 42%FI 1041 28% 17% 20% 35% - 72%SE 1011 29% 20% 14% 36% 1% 70%UK 1310 47% 17% 9% 27% - 53%
Visted a public library
QA4.6 How many times in the last twelve months have you…?

TOTALNever in the last twelve
months 1-2 times 3-5 times More than 5 times DK At least once
UE27 EU27 26755 45% 29% 13% 12% 1% 54%BE 1040 46% 27% 12% 15% - 54%BG 1009 69% 17% 6% 7% 1% 30%CZ 1060 32% 44% 13% 11% - 68%DK 1008 24% 31% 21% 24% - 76%D-W 1006 36% 32% 16% 15% 1% 63%DE 1534 35% 33% 17% 15% - 65%D-E 528 29% 37% 19% 15% - 71%EE 1001 37% 33% 15% 15% - 63%EL 1000 67% 22% 7% 4% - 33%ES 1006 50% 24% 16% 10% - 50%FR 1031 46% 25% 14% 15% - 54%IE 1000 48% 34% 9% 8% 1% 51%IT 1000 50% 33% 10% 6% 1% 49%CY 500 65% 23% 8% 4% - 35%LV 1006 37% 32% 15% 15% 1% 62%LT 1029 48% 27% 11% 13% 1% 51%LU 500 35% 32% 18% 14% 1% 64%HU 1000 55% 30% 8% 7% - 45%MT 500 53% 22% 12% 13% - 47%NL 1000 28% 30% 21% 20% 1% 71%AT 1011 50% 35% 10% 5% - 50%PL 1000 51% 28% 11% 9% 1% 48%PT 1013 65% 20% 8% 7% - 35%RO 1037 58% 22% 10% 8% 2% 40%SI 1015 40% 35% 12% 13% - 60%SK 1094 35% 39% 14% 11% 1% 64%FI 1041 37% 41% 17% 5% - 63%SE 1011 25% 32% 20% 23% - 75%UK 1310 39% 25% 15% 21% - 61%
Visited historical monuments (palaces, castles, churches, gardens, etc.)
QA4.7 How many times in the last twelve months have you…?
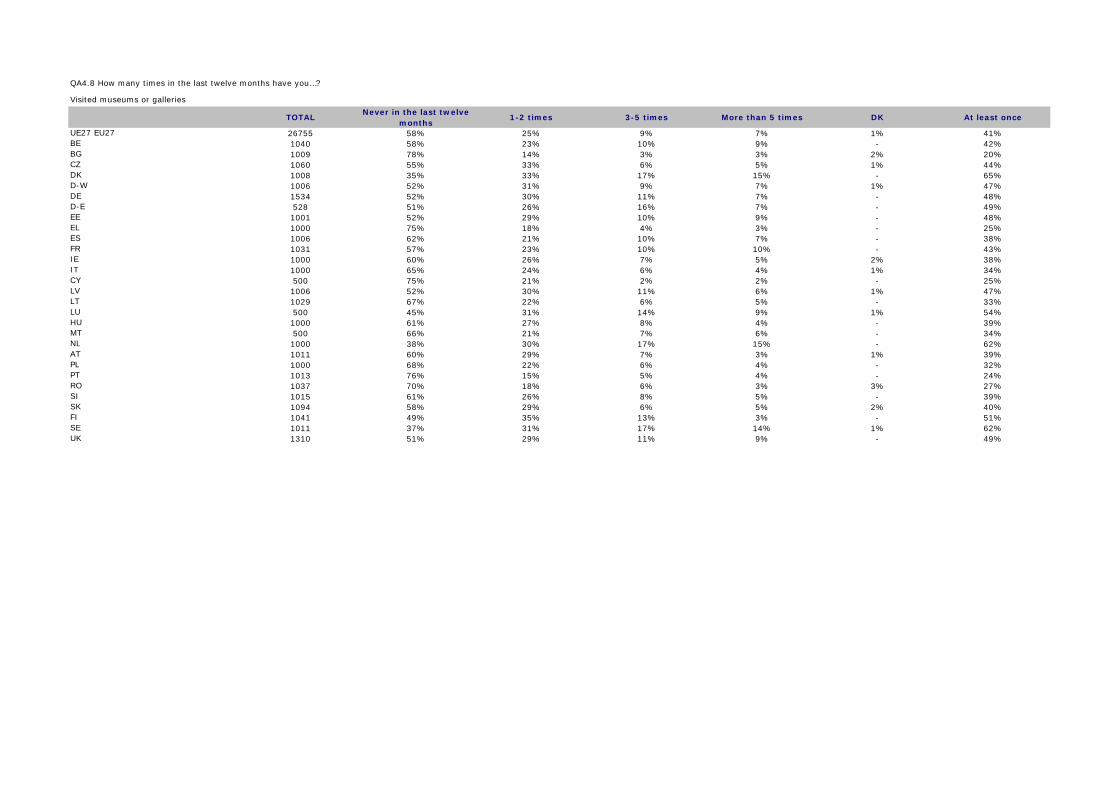
TOTALNever in the last twelve
months 1-2 times 3-5 times More than 5 times DK At least once
UE27 EU27 26755 58% 25% 9% 7% 1% 41%BE 1040 58% 23% 10% 9% - 42%BG 1009 78% 14% 3% 3% 2% 20%CZ 1060 55% 33% 6% 5% 1% 44%DK 1008 35% 33% 17% 15% - 65%D-W 1006 52% 31% 9% 7% 1% 47%DE 1534 52% 30% 11% 7% - 48%D-E 528 51% 26% 16% 7% - 49%EE 1001 52% 29% 10% 9% - 48%EL 1000 75% 18% 4% 3% - 25%ES 1006 62% 21% 10% 7% - 38%FR 1031 57% 23% 10% 10% - 43%IE 1000 60% 26% 7% 5% 2% 38%IT 1000 65% 24% 6% 4% 1% 34%CY 500 75% 21% 2% 2% - 25%LV 1006 52% 30% 11% 6% 1% 47%LT 1029 67% 22% 6% 5% - 33%LU 500 45% 31% 14% 9% 1% 54%HU 1000 61% 27% 8% 4% - 39%MT 500 66% 21% 7% 6% - 34%NL 1000 38% 30% 17% 15% - 62%AT 1011 60% 29% 7% 3% 1% 39%PL 1000 68% 22% 6% 4% - 32%PT 1013 76% 15% 5% 4% - 24%RO 1037 70% 18% 6% 3% 3% 27%SI 1015 61% 26% 8% 5% - 39%SK 1094 58% 29% 6% 5% 2% 40%FI 1041 49% 35% 13% 3% - 51%SE 1011 37% 31% 17% 14% 1% 62%UK 1310 51% 29% 11% 9% - 49%
Visited museums or galleries
QA4.8 How many times in the last twelve months have you…?
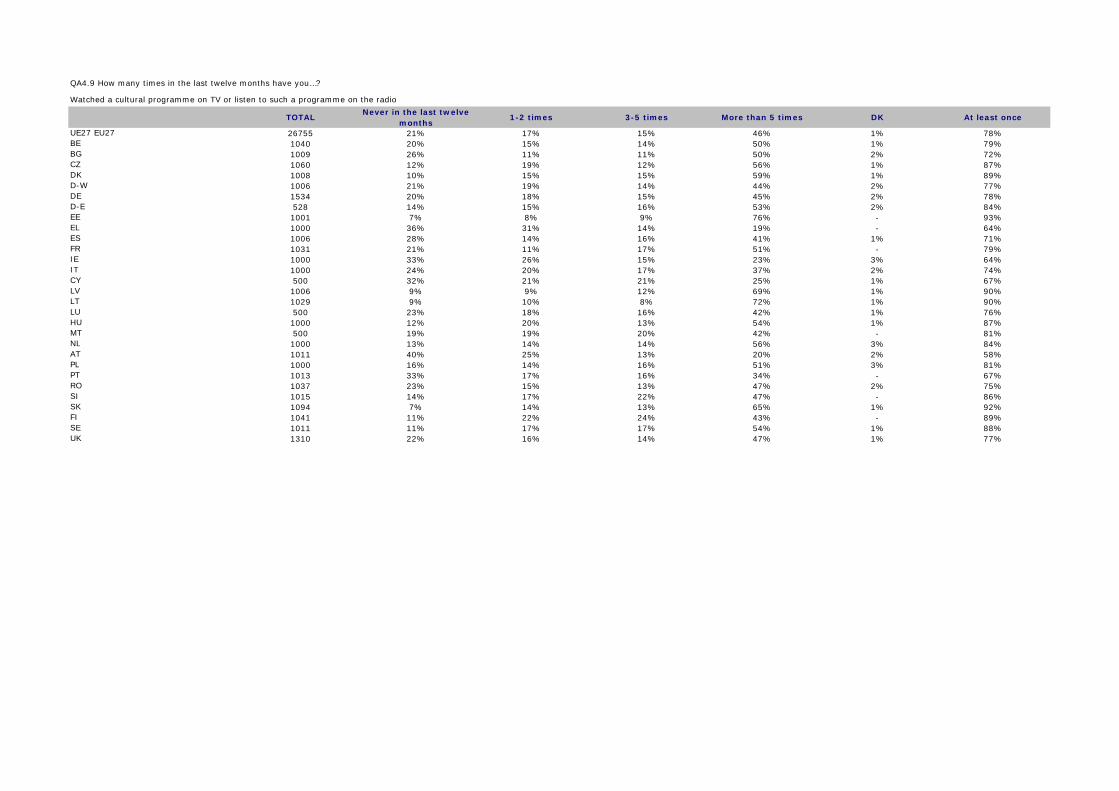
TOTALNever in the last twelve
months 1-2 times 3-5 times More than 5 times DK At least once
UE27 EU27 26755 21% 17% 15% 46% 1% 78%BE 1040 20% 15% 14% 50% 1% 79%BG 1009 26% 11% 11% 50% 2% 72%CZ 1060 12% 19% 12% 56% 1% 87%DK 1008 10% 15% 15% 59% 1% 89%D-W 1006 21% 19% 14% 44% 2% 77%DE 1534 20% 18% 15% 45% 2% 78%D-E 528 14% 15% 16% 53% 2% 84%EE 1001 7% 8% 9% 76% - 93%EL 1000 36% 31% 14% 19% - 64%ES 1006 28% 14% 16% 41% 1% 71%FR 1031 21% 11% 17% 51% - 79%IE 1000 33% 26% 15% 23% 3% 64%IT 1000 24% 20% 17% 37% 2% 74%CY 500 32% 21% 21% 25% 1% 67%LV 1006 9% 9% 12% 69% 1% 90%LT 1029 9% 10% 8% 72% 1% 90%LU 500 23% 18% 16% 42% 1% 76%HU 1000 12% 20% 13% 54% 1% 87%MT 500 19% 19% 20% 42% - 81%NL 1000 13% 14% 14% 56% 3% 84%AT 1011 40% 25% 13% 20% 2% 58%PL 1000 16% 14% 16% 51% 3% 81%PT 1013 33% 17% 16% 34% - 67%RO 1037 23% 15% 13% 47% 2% 75%SI 1015 14% 17% 22% 47% - 86%SK 1094 7% 14% 13% 65% 1% 92%FI 1041 11% 22% 24% 43% - 89%SE 1011 11% 17% 17% 54% 1% 88%UK 1310 22% 16% 14% 47% 1% 77%
Watched a cultural programme on TV or listen to such a programme on the radio
QA4.9 How many times in the last twelve months have you…?

TOTALNever in the last twelve
months 1-2 times 3-5 times More than 5 times DK At least once
UE27 EU27 26755 28% 20% 14% 37% 1% 71%BE 1040 34% 16% 16% 33% 1% 65%BG 1009 41% 17% 11% 30% 1% 58%CZ 1060 18% 24% 17% 41% - 82%DK 1008 17% 15% 12% 56% - 83%D-W 1006 18% 21% 14% 46% 1% 81%DE 1534 18% 22% 14% 45% 1% 81%D-E 528 18% 27% 16% 39% - 82%EE 1001 21% 15% 14% 50% - 79%EL 1000 41% 24% 13% 22% - 59%ES 1006 41% 19% 17% 23% - 59%FR 1031 29% 17% 12% 42% - 71%IE 1000 23% 18% 18% 39% 2% 75%IT 1000 36% 30% 13% 20% 1% 63%CY 500 43% 25% 11% 20% 1% 56%LV 1006 25% 16% 9% 50% - 75%LT 1029 35% 16% 11% 37% 1% 64%LU 500 28% 17% 16% 39% - 72%HU 1000 22% 25% 14% 39% - 78%MT 500 54% 16% 10% 19% 1% 45%NL 1000 15% 15% 14% 55% 1% 84%AT 1011 21% 25% 19% 35% - 79%PL 1000 35% 17% 14% 33% 1% 64%PT 1013 49% 20% 13% 17% 1% 50%RO 1037 39% 22% 13% 23% 3% 58%SI 1015 28% 21% 14% 37% - 72%SK 1094 19% 21% 16% 43% 1% 80%FI 1041 21% 18% 29% 32% - 79%SE 1011 13% 15% 12% 60% - 87%UK 1310 18% 15% 12% 55% - 82%
Read a book
QA4.10 How many times in the last twelve months have you…?

TOTALPlayed a musical
instrumentSung Acted Danced
Written something (a text, a poem,
etc.)
Done any decorating,
handicrafts or gardening
Done some photography, made a film
Done any other artistic activities like
sculpture, painting, drawing, creative
computing such as
designing a website, etc.
None (SPONTANEOU
S)
Other (SPONTANEOU
S)DK
UE27 EU27 26755 10% 15% 3% 19% 12% 36% 27% 16% 38% 1% 1%BE 1040 11% 15% 3% 20% 19% 52% 32% 21% 22% 1% 0%BG 1009 3% 7% 1% 8% 2% 5% 2% 2% 79% 0% 1%CZ 1060 11% 19% 6% 25% 8% 41% 33% 14% 27% 0% 1%DK 1008 16% 27% 6% 26% 23% 52% 51% 29% 21% 1% 0%D-W 1006 13% 21% 2% 26% 15% 53% 39% 20% 24% 0% 0%DE 1534 13% 21% 2% 26% 15% 54% 40% 21% 23% 0% 0%D-E 528 11% 21% 1% 25% 14% 60% 43% 22% 20% 0% - EE 1001 10% 26% 6% 33% 18% 62% 43% 17% 13% 1% 7%EL 1000 7% 11% 1% 18% 4% 11% 16% 7% 61% 1% - ES 1006 6% 8% 4% 18% 7% 12% 18% 11% 54% 2% 1%FR 1031 14% 17% 2% 23% 18% 63% 33% 24% 20% 1% 1%IE 1000 14% 16% 5% 16% 12% 31% 12% 10% 41% 1% 1%IT 1000 7% 9% 2% 5% 7% 13% 26% 9% 49% 2% 2%CY 500 6% 10% 3% 18% 8% 38% 6% 5% 47% 1% - LV 1006 8% 14% 4% 11% 8% 26% 27% 11% 43% 2% 3%LT 1029 5% 10% 5% 10% 7% 19% 9% 8% 56% 1% 4%LU 500 14% 21% 4% 22% 12% 62% 53% 27% 16% 1% - HU 1000 5% 9% 3% 11% 5% 24% 22% 10% 52% 1% 0%MT 500 10% 4% 5% 7% 9% 35% 13% 17% 49% 2% - NL 1000 19% 21% 7% 22% 25% 43% 36% 31% 22% 1% 0%AT 1011 13% 17% 2% 24% 9% 27% 28% 14% 34% 1% 0%PL 1000 6% 8% 2% 13% 5% 13% 15% 8% 62% 1% 1%PT 1013 4% 4% 2% 5% 5% 8% 6% 5% 73% 1% 3%RO 1037 4% 9% 2% 20% 6% 14% 17% 8% 58% - 5%SI 1015 9% 22% 3% 29% 9% 38% 32% 11% 32% 1% 0%SK 1094 13% 34% 2% 36% 10% 54% 32% 17% 17% 1% 1%FI 1041 17% 27% 5% 25% 24% 57% 37% 24% 18% 1% 0%SE 1011 26% 40% 8% 36% 35% 77% 65% 34% 7% 0% - UK 1310 15% 15% 5% 19% 16% 54% 25% 23% 26% 1% 0%
QA5 I am going to read out a list of artistic activities. Please tell me if, in the last twelve months, you have either on your own or as a part of an organised group or classes…? (not in a professional way – amateur activities) (ROTATE – MULTIPLE ANSWERS POSSIBLE)

TOTAL Every day Several times a week Once a week 1 to 3 times a month Less often Never DK
UE27 EU27 26755 26% 15% 5% 3% 5% 46% - BE 1040 34% 16% 6% 3% 4% 37% - BG 1009 11% 8% 3% 1% 6% 70% 1%CZ 1060 19% 20% 7% 4% 5% 45% - DK 1008 53% 20% 5% 2% 2% 18% - D-W 1006 25% 22% 7% 3% 5% 38% - DE 1534 25% 21% 7% 2% 6% 39% - D-E 528 22% 18% 7% 2% 10% 41% - EE 1001 40% 11% 5% 4% 3% 36% 1%EL 1000 9% 9% 3% 3% 5% 71% - ES 1006 22% 11% 5% 3% 4% 55% - FR 1031 34% 10% 5% 4% 2% 45% - IE 1000 20% 19% 9% 5% 7% 40% - IT 1000 13% 17% 6% 5% 5% 53% 1%CY 500 14% 11% 4% 3% 4% 64% - LV 1006 30% 15% 4% 3% 4% 43% 1%LT 1029 26% 10% 4% 2% 5% 53% - LU 500 35% 20% 4% 4% 3% 34% - HU 1000 16% 12% 5% 3% 5% 59% - MT 500 27% 13% 7% 2% 3% 48% - NL 1000 56% 20% 5% 3% 2% 14% - AT 1011 12% 28% 8% 4% 6% 42% - PL 1000 22% 10% 4% 4% 4% 54% 2%PT 1013 17% 10% 4% 2% 2% 65% - RO 1037 16% 10% 3% 1% 7% 61% 2%SI 1015 25% 16% 6% 2% 4% 47% - SK 1094 14% 15% 7% 4% 10% 49% 1%FI 1041 44% 17% 8% 2% 4% 25% - SE 1011 52% 19% 6% 3% 2% 18% - UK 1310 36% 17% 6% 3% 3% 35% -
QA6 How often do you use the Internet apart from your professional activity?
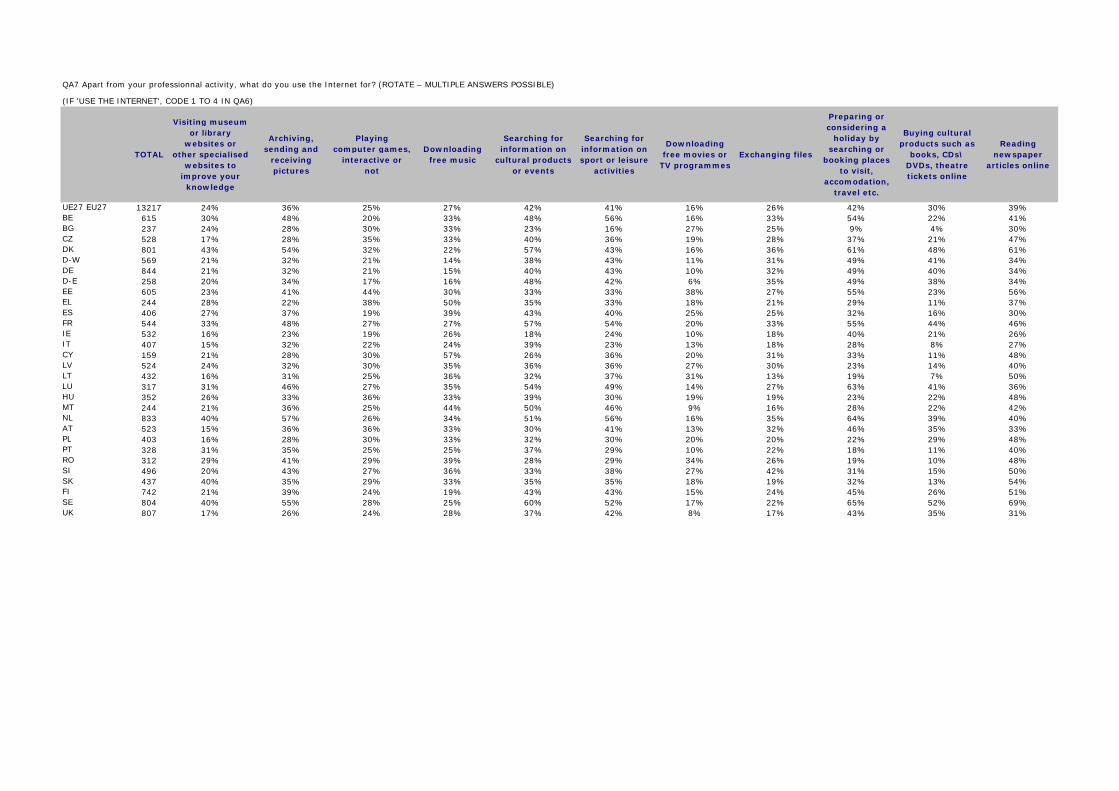
TOTAL
Visiting museum or library
websites or other specialised
websites to improve your
knowledge
Archiving, sending and
receiving pictures
Playing computer games,
interactive or not
Downloading free music
Searching for information on
cultural products or events
Searching for information on sport or leisure
activities
Downloading free movies or
TV programmesExchanging files
Preparing or considering a
holiday by searching or
booking places to visit,
accomodation, travel etc.
Buying cultural products such as
books, CDs\ DVDs, theatre tickets online
Reading newspaper
articles online
UE27 EU27 13217 24% 36% 25% 27% 42% 41% 16% 26% 42% 30% 39%BE 615 30% 48% 20% 33% 48% 56% 16% 33% 54% 22% 41%BG 237 24% 28% 30% 33% 23% 16% 27% 25% 9% 4% 30%CZ 528 17% 28% 35% 33% 40% 36% 19% 28% 37% 21% 47%DK 801 43% 54% 32% 22% 57% 43% 16% 36% 61% 48% 61%D-W 569 21% 32% 21% 14% 38% 43% 11% 31% 49% 41% 34%DE 844 21% 32% 21% 15% 40% 43% 10% 32% 49% 40% 34%D-E 258 20% 34% 17% 16% 48% 42% 6% 35% 49% 38% 34%EE 605 23% 41% 44% 30% 33% 33% 38% 27% 55% 23% 56%EL 244 28% 22% 38% 50% 35% 33% 18% 21% 29% 11% 37%ES 406 27% 37% 19% 39% 43% 40% 25% 25% 32% 16% 30%FR 544 33% 48% 27% 27% 57% 54% 20% 33% 55% 44% 46%IE 532 16% 23% 19% 26% 18% 24% 10% 18% 40% 21% 26%IT 407 15% 32% 22% 24% 39% 23% 13% 18% 28% 8% 27%CY 159 21% 28% 30% 57% 26% 36% 20% 31% 33% 11% 48%LV 524 24% 32% 30% 35% 36% 36% 27% 30% 23% 14% 40%LT 432 16% 31% 25% 36% 32% 37% 31% 13% 19% 7% 50%LU 317 31% 46% 27% 35% 54% 49% 14% 27% 63% 41% 36%HU 352 26% 33% 36% 33% 39% 30% 19% 19% 23% 22% 48%MT 244 21% 36% 25% 44% 50% 46% 9% 16% 28% 22% 42%NL 833 40% 57% 26% 34% 51% 56% 16% 35% 64% 39% 40%AT 523 15% 36% 36% 33% 30% 41% 13% 32% 46% 35% 33%PL 403 16% 28% 30% 33% 32% 30% 20% 20% 22% 29% 48%PT 328 31% 35% 25% 25% 37% 29% 10% 22% 18% 11% 40%RO 312 29% 41% 29% 39% 28% 29% 34% 26% 19% 10% 48%SI 496 20% 43% 27% 36% 33% 38% 27% 42% 31% 15% 50%SK 437 40% 35% 29% 33% 35% 35% 18% 19% 32% 13% 54%FI 742 21% 39% 24% 19% 43% 43% 15% 24% 45% 26% 51%SE 804 40% 55% 28% 25% 60% 52% 17% 22% 65% 52% 69%UK 807 17% 26% 24% 28% 37% 42% 8% 17% 43% 35% 31%
QA7 Apart from your professionnal activity, what do you use the Internet for? (ROTATE – MULTIPLE ANSWERS POSSIBLE)
(IF 'USE THE INTERNET', CODE 1 TO 4 IN QA6)

Creating your own website or
blog
Listening to radio or music
Watching TV channels
Making phone calls
Communicating using a webcam
Exchanging e-mails with
family, friends or colleagues
Visiting chat rooms, forums
Visiting blogs Other
(SPONTANEOUS)DK
9% 28% 9% 13% 14% 68% 22% 13% 6% 1%11% 36% 10% 13% 14% 78% 27% 18% 6% 0%6% 34% 14% 36% 17% 61% 34% 3% 4% 1%7% 28% 15% 24% 6% 80% 26% 12% 2% 0%11% 36% 21% 17% 12% 83% 19% 15% 5% 1%8% 19% 6% 14% 9% 72% 20% 5% 4% - 7% 18% 6% 14% 9% 74% 20% 4% 4% - 5% 13% 4% 11% 9% 81% 18% 4% 2% - 28% 41% 35% 31% 30% 46% 50% 26% 2% 2%14% 37% 8% 9% 10% 47% 19% 12% 4% 1%10% 25% 7% 10% 23% 59% 30% 12% 7% - 13% 37% 10% 22% 28% 72% 30% 25% 5% 1%9% 22% 9% 11% 7% 56% 9% 8% 10% 1%6% 15% 3% 5% 7% 42% 13% 11% 7% 1%16% 42% 16% 16% 23% 67% 27% 14% 7% 1%5% 44% 16% 23% 13% 66% 35% 22% 15% 1%7% 32% 11% 22% 14% 53% 33% 27% 5% - 8% 29% 13% 14% 15% 80% 25% 15% 5% - 10% 26% 17% 16% 13% 72% 27% 19% 3% - 11% 36% 11% 14% 17% 75% 29% 7% 5% - 10% 33% 15% 11% 13% 86% 17% 17% 7% - 8% 28% 3% 10% 10% 83% 32% 11% 5% 0%7% 36% 11% 20% 11% 65% 25% 20% 7% 3%9% 27% 6% 9% 20% 61% 32% 19% 2% 1%9% 42% 15% 15% 29% 64% 39% 8% - 2%10% 31% 11% 9% 9% 71% 37% 19% 9% - 12% 30% 14% 26% 9% 68% 28% 8% 1% - 7% 21% 9% 13% 11% 72% 22% 9% 7% 0%14% 44% 18% 12% 13% 85% 30% 24% 5% - 8% 29% 8% 7% 13% 70% 12% 9% 9% 1%
QA7 Apart from your professionnal activity, what do you use the Internet for? (ROTATE – MULTIPLE ANSWERS POSSIBLE)
(IF 'USE THE INTERNET', CODE 1 TO 4 IN QA6)


TOTAL Lack of interest Lack of time Too expensiveLack of
information
Limited choice or poor quality of
cultural activities in your area
Lack of knowledge or
cultural background
None (SPONTANEOUS)
Other (SPONTANEOUS)
DK
UE27 EU27 26755 27% 42% 29% 17% 16% 13% 8% 3% 1%BE 1040 47% 43% 31% 24% 14% 25% 3% 5% 0%BG 1009 13% 32% 45% 9% 29% 11% 5% 2% 5%CZ 1060 18% 48% 36% 10% 26% 6% 7% 4% 1%DK 1008 30% 40% 25% 13% 12% 12% 15% 5% 1%D-W 1006 29% 38% 26% 11% 11% 11% 16% 1% 0%DE 1534 28% 38% 30% 10% 12% 10% 15% 2% 0%D-E 528 21% 38% 43% 8% 16% 6% 14% 3% 0%EE 1001 16% 45% 37% 12% 14% 6% 7% 9% 4%EL 1000 36% 43% 33% 29% 21% 15% 4% 1% - ES 1006 31% 49% 21% 21% 19% 13% 3% 3% 3%FR 1031 25% 40% 40% 24% 13% 21% 7% 5% 1%IE 1000 30% 33% 11% 12% 14% 9% 12% 2% 6%IT 1000 32% 41% 22% 22% 15% 20% 4% 2% 2%CY 500 41% 52% 10% 22% 13% 11% 3% 1% 2%LV 1006 18% 45% 35% 15% 22% 4% 5% 4% 1%LT 1029 24% 47% 27% 10% 17% 7% 7% 4% 1%LU 500 40% 46% 19% 18% 12% 23% 4% 5% 2%HU 1000 22% 47% 49% 15% 23% 8% 5% 5% 0%MT 500 33% 48% 14% 14% 5% 9% 4% 3% 3%NL 1000 27% 47% 26% 13% 11% 12% 12% 6% 1%AT 1011 48% 38% 26% 20% 10% 17% 11% 2% 1%PL 1000 19% 44% 37% 12% 24% 7% 4% 2% 2%PT 1013 34% 37% 35% 20% 15% 16% 4% 1% 1%RO 1037 16% 51% 28% 17% 24% 20% 6% 1% 4%SI 1015 47% 52% 33% 23% 17% 21% 2% 4% 1%SK 1094 18% 51% 45% 15% 34% 9% 3% 3% 1%FI 1041 32% 41% 30% 8% 13% 8% 8% 5% 0%SE 1011 23% 52% 21% 11% 19% 5% 9% 6% 1%UK 1310 22% 38% 17% 15% 14% 8% 12% 5% 1%
QA8 Sometimes people find it difficult to access culture or take part in cultural activities. Which of the following, if any, are the main barriers for you? (ROTATE – MULTIPLE ANSWERS POSSIBLE)
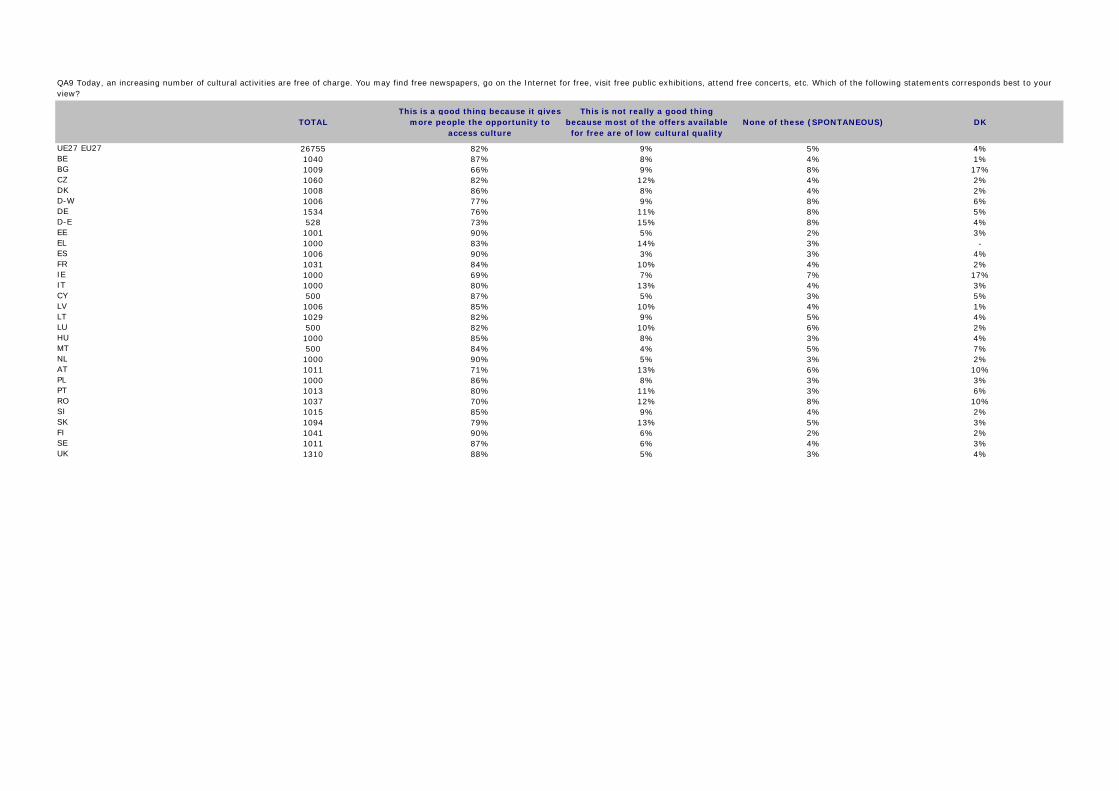
TOTALThis is a good thing because it gives
more people the opportunity to access culture
This is not really a good thing because most of the offers available for free are of low cultural quality
None of these (SPONTANEOUS) DK
UE27 EU27 26755 82% 9% 5% 4%BE 1040 87% 8% 4% 1%BG 1009 66% 9% 8% 17%CZ 1060 82% 12% 4% 2%DK 1008 86% 8% 4% 2%D-W 1006 77% 9% 8% 6%DE 1534 76% 11% 8% 5%D-E 528 73% 15% 8% 4%EE 1001 90% 5% 2% 3%EL 1000 83% 14% 3% - ES 1006 90% 3% 3% 4%FR 1031 84% 10% 4% 2%IE 1000 69% 7% 7% 17%IT 1000 80% 13% 4% 3%CY 500 87% 5% 3% 5%LV 1006 85% 10% 4% 1%LT 1029 82% 9% 5% 4%LU 500 82% 10% 6% 2%HU 1000 85% 8% 3% 4%MT 500 84% 4% 5% 7%NL 1000 90% 5% 3% 2%AT 1011 71% 13% 6% 10%PL 1000 86% 8% 3% 3%PT 1013 80% 11% 3% 6%RO 1037 70% 12% 8% 10%SI 1015 85% 9% 4% 2%SK 1094 79% 13% 5% 3%FI 1041 90% 6% 2% 2%SE 1011 87% 6% 4% 3%UK 1310 88% 5% 3% 4%
QA9 Today, an increasing number of cultural activities are free of charge. You may find free newspapers, go on the Internet for free, visit free public exhibitions, attend free concerts, etc. Which of the following statements corresponds best to your view?

TOTAL
A member of your
family or a relative lives in another
European country
A member of your
family or a relative lives in another
non European country
You have traveled
abroad at least three times in the past three years, for leisure or business
You have friends who
are from other
European countries
You have friends who
are from non
European countries
You often watch TV programs or movies in foreign languages
You often communica
te with people in
other countries
via the Internet or
Your job involves contact
with organisatio
ns or people in
other countries
You enjoy eating foreign cuisine
You sometimes
read newspapers in foreign languages
You enjoy reading foreign
books in their
original language
None (SPONTANE
OUS)DK
UE27 EU27 26755 22% 15% 27% 27% 17% 19% 14% 9% 45% 9% 7% 27% 1%BE 1040 30% 19% 44% 37% 24% 38% 21% 13% 65% 16% 11% 12% 0%BG 1009 18% 7% 5% 15% 9% 15% 6% 2% 14% 3% 1% 47% 2%CZ 1060 21% 6% 29% 23% 8% 14% 9% 5% 41% 5% 3% 31% 0%DK 1008 31% 22% 56% 43% 30% 74% 37% 22% 75% 21% 29% 5% 0%D-W 1006 24% 14% 35% 29% 17% 15% 13% 11% 61% 16% 10% 21% 1%DE 1534 22% 12% 34% 27% 15% 14% 12% 11% 61% 14% 9% 21% 0%D-E 528 14% 7% 28% 18% 10% 9% 8% 11% 62% 5% 5% 22% 0%EE 1001 31% 20% 38% 35% 18% 55% 20% 16% 37% 20% 12% - 13%EL 1000 22% 17% 12% 22% 12% 11% 9% 5% 21% 7% 5% 40% - ES 1006 18% 14% 12% 23% 18% 9% 9% 6% 32% 5% 3% 38% 0%FR 1031 19% 15% 32% 29% 22% 20% 18% 8% 63% 13% 7% 18% 0%IE 1000 41% 23% 26% 31% 20% 8% 14% 9% 27% 3% 2% 23% 1%IT 1000 12% 11% 12% 16% 7% 3% 4% 4% 13% 3% 2% 51% 1%CY 500 59% 33% 42% 42% 18% 59% 17% 16% 46% 12% 7% 7% - LV 1006 32% 17% 18% 24% 13% 34% 18% 9% 27% 16% 15% 19% 2%LT 1029 36% 14% 15% 22% 11% 28% 14% 8% 18% 13% 11% 30% 1%LU 500 57% 20% 63% 69% 32% 80% 35% 25% 84% 71% 49% 2% 0%HU 1000 17% 10% 22% 20% 5% 12% 7% 4% 24% 8% 3% 43% 0%MT 500 37% 50% 24% 38% 21% 72% 26% 12% 61% 56% 32% 5% 0%NL 1000 22% 22% 65% 37% 28% 65% 25% 23% 76% 18% 22% 5% 1%AT 1011 25% 13% 34% 34% 16% 6% 13% 8% 50% 6% 7% 20% 1%PL 1000 31% 9% 16% 23% 8% 14% 9% 5% 26% 6% 2% 33% 1%PT 1013 35% 13% 8% 18% 12% 24% 8% 4% 21% 5% 5% 36% 1%RO 1037 32% 7% 8% 25% 7% 19% 10% 5% 14% 5% 5% 40% 2%SI 1015 28% 19% 44% 29% 21% 48% 14% 9% 46% 23% 10% 14% 0%SK 1094 29% 9% 25% 25% 7% 20% 10% 6% 38% 11% 6% 26% 1%FI 1041 28% 14% 41% 31% 21% 59% 23% 12% 58% 21% 17% 9% - SE 1011 29% 19% 51% 59% 43% 73% 31% 22% 83% 22% 26% 3% - UK 1310 23% 29% 39% 33% 31% 18% 27% 15% 69% 6% 4% 12% 0%
QA10 Which, if any, of the following statements apply to you? (MULTIPLE ANSWERS POSSIBLE)

TOTAL Very interested Fairly interested Not very interested Not at all interested DK Yes Not interested
UE27 EU27 26755 20% 49% 24% 6% 1% 69% 30%BE 1040 17% 49% 23% 11% - 66% 34%BG 1009 17% 35% 35% 11% 2% 52% 46%CZ 1060 14% 50% 30% 6% - 64% 36%DK 1008 22% 49% 25% 4% - 71% 29%D-W 1006 18% 46% 29% 7% - 64% 36%DE 1534 19% 46% 28% 7% - 65% 35%D-E 528 22% 48% 26% 4% - 70% 30%EE 1001 21% 53% 25% 1% - 74% 26%EL 1000 45% 38% 13% 4% - 83% 17%ES 1006 21% 56% 20% 3% - 77% 23%FR 1031 20% 52% 19% 9% - 72% 28%IE 1000 20% 46% 22% 10% 2% 66% 32%IT 1000 23% 53% 20% 4% - 76% 24%CY 500 24% 42% 25% 9% - 66% 34%LV 1006 27% 51% 19% 3% - 78% 22%LT 1029 8% 41% 41% 10% - 49% 51%LU 500 23% 47% 24% 6% - 70% 30%HU 1000 31% 47% 19% 3% - 78% 22%MT 500 26% 45% 23% 6% - 71% 29%NL 1000 18% 51% 26% 5% - 69% 31%AT 1011 16% 35% 39% 9% 1% 51% 48%PL 1000 14% 55% 24% 6% 1% 69% 30%PT 1013 16% 48% 28% 8% - 64% 36%RO 1037 16% 46% 29% 8% 1% 62% 37%SI 1015 15% 54% 27% 3% 1% 69% 30%SK 1094 14% 55% 28% 3% - 69% 31%FI 1041 18% 43% 33% 6% - 61% 39%SE 1011 21% 48% 27% 4% - 69% 31%UK 1310 19% 48% 24% 9% - 67% 33%
Arts and culture in (OUR COUNTRY)
QA11.1 To what extent do the following topics interest you? Would you say you are very interested, fairly interested, not very interested or not at all interested in…?
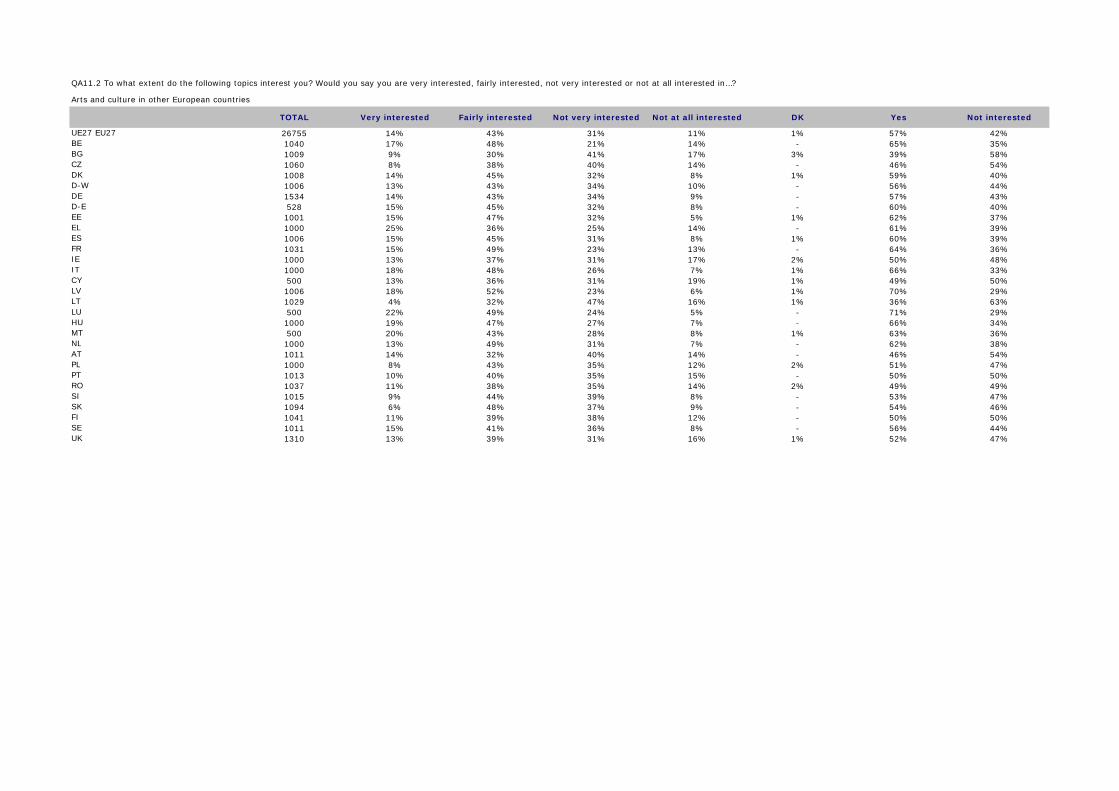
TOTAL Very interested Fairly interested Not very interested Not at all interested DK Yes Not interested
UE27 EU27 26755 14% 43% 31% 11% 1% 57% 42%BE 1040 17% 48% 21% 14% - 65% 35%BG 1009 9% 30% 41% 17% 3% 39% 58%CZ 1060 8% 38% 40% 14% - 46% 54%DK 1008 14% 45% 32% 8% 1% 59% 40%D-W 1006 13% 43% 34% 10% - 56% 44%DE 1534 14% 43% 34% 9% - 57% 43%D-E 528 15% 45% 32% 8% - 60% 40%EE 1001 15% 47% 32% 5% 1% 62% 37%EL 1000 25% 36% 25% 14% - 61% 39%ES 1006 15% 45% 31% 8% 1% 60% 39%FR 1031 15% 49% 23% 13% - 64% 36%IE 1000 13% 37% 31% 17% 2% 50% 48%IT 1000 18% 48% 26% 7% 1% 66% 33%CY 500 13% 36% 31% 19% 1% 49% 50%LV 1006 18% 52% 23% 6% 1% 70% 29%LT 1029 4% 32% 47% 16% 1% 36% 63%LU 500 22% 49% 24% 5% - 71% 29%HU 1000 19% 47% 27% 7% - 66% 34%MT 500 20% 43% 28% 8% 1% 63% 36%NL 1000 13% 49% 31% 7% - 62% 38%AT 1011 14% 32% 40% 14% - 46% 54%PL 1000 8% 43% 35% 12% 2% 51% 47%PT 1013 10% 40% 35% 15% - 50% 50%RO 1037 11% 38% 35% 14% 2% 49% 49%SI 1015 9% 44% 39% 8% - 53% 47%SK 1094 6% 48% 37% 9% - 54% 46%FI 1041 11% 39% 38% 12% - 50% 50%SE 1011 15% 41% 36% 8% - 56% 44%UK 1310 13% 39% 31% 16% 1% 52% 47%
Arts and culture in other European countries
QA11.2 To what extent do the following topics interest you? Would you say you are very interested, fairly interested, not very interested or not at all interested in…?

TOTAL Very interested Fairly interested Not very interested Not at all interested DK Yes Not interested
UE27 EU27 26755 13% 43% 31% 12% 1% 56% 43%BE 1040 17% 45% 23% 15% - 62% 38%BG 1009 9% 26% 43% 19% 3% 35% 62%CZ 1060 5% 33% 44% 18% - 38% 62%DK 1008 13% 42% 35% 9% 1% 55% 44%D-W 1006 12% 40% 36% 12% - 52% 48%DE 1534 12% 41% 35% 12% - 53% 47%D-E 528 12% 44% 33% 11% - 56% 44%EE 1001 15% 47% 32% 5% 1% 62% 37%EL 1000 20% 32% 31% 17% - 52% 48%ES 1006 15% 45% 30% 9% 1% 60% 39%FR 1031 17% 50% 20% 12% 1% 67% 32%IE 1000 11% 34% 33% 19% 3% 45% 52%IT 1000 17% 47% 27% 8% 1% 64% 35%CY 500 10% 35% 31% 23% 1% 45% 54%LV 1006 17% 54% 22% 6% 1% 71% 28%LT 1029 4% 31% 48% 17% - 35% 65%LU 500 21% 48% 24% 6% 1% 69% 30%HU 1000 17% 43% 32% 8% - 60% 40%MT 500 18% 42% 29% 10% 1% 60% 39%NL 1000 14% 49% 30% 6% 1% 63% 36%AT 1011 12% 30% 38% 19% 1% 42% 57%PL 1000 7% 41% 37% 13% 2% 48% 50%PT 1013 9% 39% 35% 16% 1% 48% 51%RO 1037 11% 36% 36% 15% 2% 47% 51%SI 1015 9% 40% 42% 9% - 49% 51%SK 1094 5% 41% 40% 13% 1% 46% 53%FI 1041 10% 36% 40% 14% - 46% 54%SE 1011 12% 41% 37% 9% 1% 53% 46%UK 1310 15% 42% 28% 14% 1% 57% 42%
Arts and culture in the rest of the world
QA11.3 To what extent do the following topics interest you? Would you say you are very interested, fairly interested, not very interested or not at all interested in…?

TOTAL Very interested Fairly interested Not very interested Not at all interested DK Interested Not interested
UE27 EU27 26755 19% 44% 25% 10% 2% 63% 35%BE 1040 22% 47% 20% 10% 1% 69% 30%BG 1009 9% 26% 34% 21% 10% 35% 55%CZ 1060 9% 33% 41% 16% 1% 42% 57%DK 1008 36% 42% 18% 3% 1% 78% 21%D-W 1006 20% 41% 28% 9% 2% 61% 37%DE 1534 19% 41% 29% 9% 2% 60% 38%D-E 528 16% 38% 33% 11% 2% 54% 44%EE 1001 18% 37% 35% 8% 2% 55% 43%EL 1000 21% 34% 28% 17% - 55% 45%ES 1006 14% 39% 30% 14% 3% 53% 44%FR 1031 23% 52% 15% 9% 1% 75% 24%IE 1000 20% 42% 20% 14% 4% 62% 34%IT 1000 16% 47% 25% 10% 2% 63% 35%CY 500 26% 44% 18% 12% - 70% 30%LV 1006 14% 46% 30% 8% 2% 60% 38%LT 1029 27% 45% 19% 7% 2% 72% 26%LU 500 37% 44% 13% 5% 1% 81% 18%HU 1000 21% 36% 32% 11% - 57% 43%MT 500 27% 43% 21% 8% 1% 70% 29%NL 1000 19% 48% 26% 6% 1% 67% 32%AT 1011 14% 41% 35% 8% 2% 55% 43%PL 1000 14% 47% 27% 8% 4% 61% 35%PT 1013 12% 45% 29% 14% - 57% 43%RO 1037 15% 39% 24% 17% 5% 54% 41%SI 1015 18% 42% 34% 6% - 60% 40%SK 1094 8% 35% 39% 17% 1% 43% 56%FI 1041 22% 45% 26% 7% - 67% 33%SE 1011 39% 44% 14% 2% 1% 83% 16%UK 1310 24% 51% 18% 6% 1% 75% 24%
QA12 How interested would you say you are in meeting in person people from other European countries?

TOTAL Very well Fairly well Fairly badly Very badly DK Well BadlyUE27 EU27 26755 23% 44% 18% 6% 9% 67% 24%BE 1040 21% 47% 23% 6% 3% 68% 29%BG 1009 46% 36% 3% 1% 14% 82% 4%CZ 1060 41% 48% 8% - 3% 89% 8%DK 1008 13% 28% 33% 19% 7% 41% 52%D-W 1006 20% 33% 31% 11% 5% 53% 42%DE 1534 19% 33% 32% 12% 4% 52% 44%D-E 528 15% 29% 37% 16% 3% 44% 53%EE 1001 42% 43% 6% 1% 8% 85% 7%EL 1000 36% 45% 16% 3% - 81% 19%ES 1006 16% 54% 12% 2% 16% 70% 14%FR 1031 16% 47% 23% 5% 9% 63% 28%IE 1000 19% 47% 8% 2% 24% 66% 10%IT 1000 31% 51% 10% 2% 6% 82% 12%CY 500 37% 47% 5% 3% 8% 84% 8%LV 1006 42% 45% 6% 2% 5% 87% 8%LT 1029 31% 49% 5% 1% 14% 80% 6%LU 500 24% 46% 16% 6% 8% 70% 22%HU 1000 41% 42% 11% 2% 4% 83% 13%MT 500 38% 47% 5% 2% 8% 85% 7%NL 1000 13% 26% 32% 24% 5% 39% 56%AT 1011 25% 48% 13% 4% 10% 73% 17%PL 1000 35% 53% 5% - 7% 88% 5%PT 1013 16% 66% 7% 1% 10% 82% 8%RO 1037 27% 47% 7% 1% 18% 74% 8%SI 1015 41% 47% 5% 2% 5% 88% 7%SK 1094 36% 56% 5% - 3% 92% 5%FI 1041 33% 51% 11% 2% 3% 84% 13%SE 1011 10% 36% 31% 12% 11% 46% 43%UK 1310 18% 36% 22% 11% 13% 54% 33%
Europe is clearly the continent of culture
QA13.1 I will now read out several statements or opinions that are sometimes heard. For each one, please tell me if it corresponds very well, fairly well, fairly badly or very badly to what you think personally.
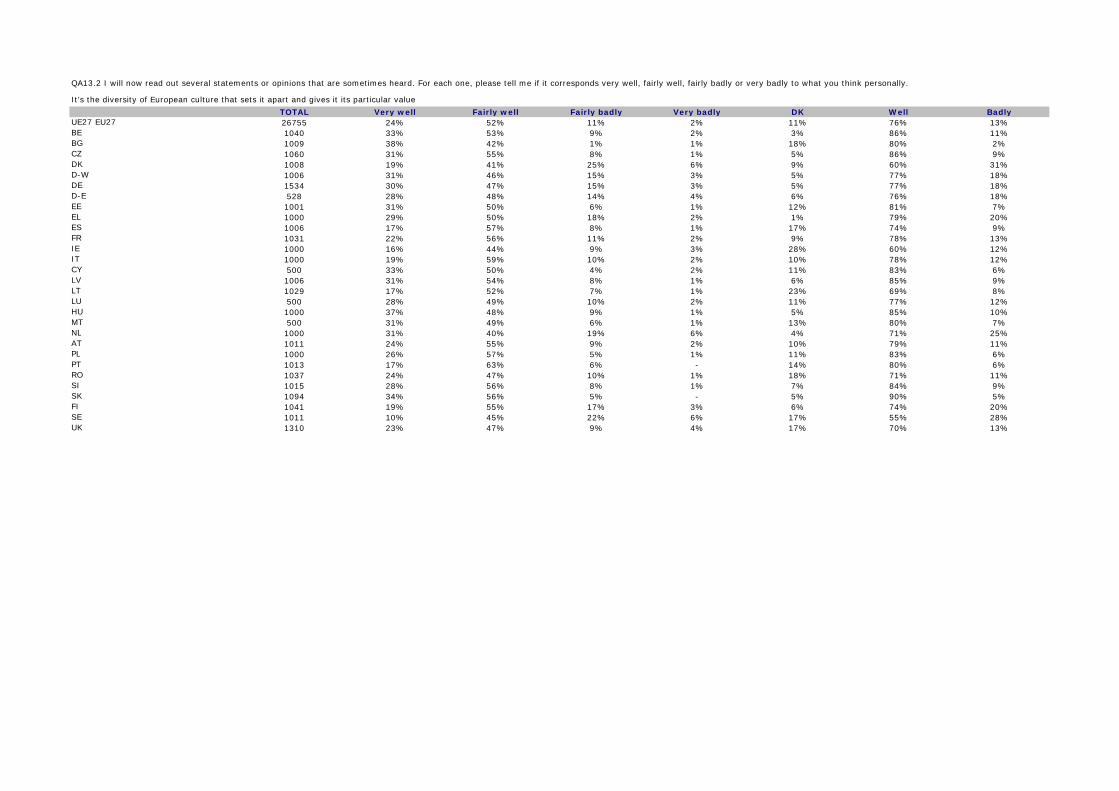
TOTAL Very well Fairly well Fairly badly Very badly DK Well BadlyUE27 EU27 26755 24% 52% 11% 2% 11% 76% 13%BE 1040 33% 53% 9% 2% 3% 86% 11%BG 1009 38% 42% 1% 1% 18% 80% 2%CZ 1060 31% 55% 8% 1% 5% 86% 9%DK 1008 19% 41% 25% 6% 9% 60% 31%D-W 1006 31% 46% 15% 3% 5% 77% 18%DE 1534 30% 47% 15% 3% 5% 77% 18%D-E 528 28% 48% 14% 4% 6% 76% 18%EE 1001 31% 50% 6% 1% 12% 81% 7%EL 1000 29% 50% 18% 2% 1% 79% 20%ES 1006 17% 57% 8% 1% 17% 74% 9%FR 1031 22% 56% 11% 2% 9% 78% 13%IE 1000 16% 44% 9% 3% 28% 60% 12%IT 1000 19% 59% 10% 2% 10% 78% 12%CY 500 33% 50% 4% 2% 11% 83% 6%LV 1006 31% 54% 8% 1% 6% 85% 9%LT 1029 17% 52% 7% 1% 23% 69% 8%LU 500 28% 49% 10% 2% 11% 77% 12%HU 1000 37% 48% 9% 1% 5% 85% 10%MT 500 31% 49% 6% 1% 13% 80% 7%NL 1000 31% 40% 19% 6% 4% 71% 25%AT 1011 24% 55% 9% 2% 10% 79% 11%PL 1000 26% 57% 5% 1% 11% 83% 6%PT 1013 17% 63% 6% - 14% 80% 6%RO 1037 24% 47% 10% 1% 18% 71% 11%SI 1015 28% 56% 8% 1% 7% 84% 9%SK 1094 34% 56% 5% - 5% 90% 5%FI 1041 19% 55% 17% 3% 6% 74% 20%SE 1011 10% 45% 22% 6% 17% 55% 28%UK 1310 23% 47% 9% 4% 17% 70% 13%
It’s the diversity of European culture that sets it apart and gives it its particular value
QA13.2 I will now read out several statements or opinions that are sometimes heard. For each one, please tell me if it corresponds very well, fairly well, fairly badly or very badly to what you think personally.

TOTAL Very well Fairly well Fairly badly Very badly DK Well BadlyUE27 EU27 26755 15% 38% 29% 9% 9% 53% 38%BE 1040 16% 42% 32% 6% 4% 58% 38%BG 1009 17% 34% 18% 6% 25% 51% 24%CZ 1060 11% 35% 39% 9% 6% 46% 48%DK 1008 18% 36% 32% 8% 6% 54% 40%D-W 1006 15% 31% 37% 12% 5% 46% 49%DE 1534 16% 31% 36% 12% 5% 47% 48%D-E 528 17% 32% 36% 12% 3% 49% 48%EE 1001 25% 43% 21% 2% 9% 68% 23%EL 1000 23% 32% 33% 11% 1% 55% 44%ES 1006 16% 47% 18% 6% 13% 63% 24%FR 1031 16% 42% 28% 7% 7% 58% 35%IE 1000 19% 36% 15% 5% 25% 55% 20%IT 1000 13% 45% 25% 9% 8% 58% 34%CY 500 21% 30% 26% 12% 11% 51% 38%LV 1006 22% 44% 23% 5% 6% 66% 28%LT 1029 14% 41% 22% 4% 19% 55% 26%LU 500 26% 34% 24% 11% 5% 60% 35%HU 1000 14% 32% 38% 12% 4% 46% 50%MT 500 23% 36% 23% 5% 13% 59% 28%NL 1000 17% 32% 30% 18% 3% 49% 48%AT 1011 13% 31% 33% 12% 11% 44% 45%PL 1000 10% 39% 34% 5% 12% 49% 39%PT 1013 11% 40% 31% 3% 15% 51% 34%RO 1037 20% 31% 24% 5% 20% 51% 29%SI 1015 16% 43% 27% 7% 7% 59% 34%SK 1094 15% 37% 34% 7% 7% 52% 41%FI 1041 9% 38% 40% 8% 5% 47% 48%SE 1011 11% 36% 33% 10% 10% 47% 43%UK 1310 17% 39% 25% 7% 12% 56% 32%
There is no common European culture because European countries are too different from one another
QA13.3 I will now read out several statements or opinions that are sometimes heard. For each one, please tell me if it corresponds very well, fairly well, fairly badly or very badly to what you think personally.

TOTAL Very well Fairly well Fairly badly Very badly DK Well BadlyUE27 EU27 26755 14% 44% 21% 5% 16% 58% 26%BE 1040 19% 50% 21% 5% 5% 69% 26%BG 1009 19% 34% 8% 2% 37% 53% 10%CZ 1060 10% 46% 27% 5% 12% 56% 32%DK 1008 23% 46% 18% 3% 10% 69% 21%D-W 1006 15% 41% 32% 5% 7% 56% 37%DE 1534 14% 41% 32% 6% 7% 55% 38%D-E 528 13% 45% 29% 7% 6% 58% 36%EE 1001 15% 50% 16% 3% 16% 65% 19%EL 1000 17% 37% 31% 12% 3% 54% 43%ES 1006 12% 44% 11% 6% 27% 56% 17%FR 1031 10% 46% 27% 5% 12% 56% 32%IE 1000 14% 40% 11% 3% 32% 54% 14%IT 1000 14% 53% 14% 4% 15% 67% 18%CY 500 28% 34% 13% 5% 20% 62% 18%LV 1006 14% 51% 17% 3% 15% 65% 20%LT 1029 9% 39% 16% 3% 33% 48% 19%LU 500 16% 41% 21% 8% 14% 57% 29%HU 1000 13% 38% 25% 9% 15% 51% 34%MT 500 26% 47% 6% 2% 19% 73% 8%NL 1000 12% 32% 32% 14% 10% 44% 46%AT 1011 13% 38% 22% 8% 19% 51% 30%PL 1000 11% 50% 16% 2% 21% 61% 18%PT 1013 15% 53% 11% 1% 20% 68% 12%RO 1037 15% 36% 14% 3% 32% 51% 17%SI 1015 17% 41% 22% 7% 13% 58% 29%SK 1094 13% 51% 20% 4% 12% 64% 24%FI 1041 11% 49% 23% 5% 12% 60% 28%SE 1011 18% 46% 19% 3% 14% 64% 22%UK 1310 14% 43% 17% 7% 19% 57% 24%
Through globalisation, European culture will become more dynamic and widespread in the world
QA13.4 I will now read out several statements or opinions that are sometimes heard. For each one, please tell me if it corresponds very well, fairly well, fairly badly or very badly to what you think personally.

TOTAL Very well Fairly well Fairly badly Very badly DK Well BadlyUE27 EU27 26755 27% 50% 10% 3% 10% 77% 13%BE 1040 37% 51% 7% 2% 3% 88% 9%BG 1009 47% 31% 3% 1% 18% 78% 4%CZ 1060 41% 50% 5% 1% 3% 91% 6%DK 1008 26% 48% 14% 3% 9% 74% 17%D-W 1006 30% 46% 14% 4% 6% 76% 18%DE 1534 29% 46% 15% 4% 6% 75% 19%D-E 528 26% 48% 17% 4% 5% 74% 21%EE 1001 32% 47% 9% 1% 11% 79% 10%EL 1000 24% 43% 25% 7% 1% 67% 32%ES 1006 19% 53% 9% 2% 17% 72% 11%FR 1031 23% 55% 11% 2% 9% 78% 13%IE 1000 22% 42% 7% 3% 26% 64% 10%IT 1000 26% 57% 8% 2% 7% 83% 10%CY 500 44% 40% 4% 1% 11% 84% 5%LV 1006 27% 52% 9% 3% 9% 79% 12%LT 1029 23% 49% 6% 1% 21% 72% 7%LU 500 27% 49% 9% 4% 11% 76% 13%HU 1000 36% 48% 10% 2% 4% 84% 12%MT 500 41% 43% 4% 1% 11% 84% 5%NL 1000 32% 42% 16% 6% 4% 74% 22%AT 1011 27% 53% 10% 1% 9% 80% 11%PL 1000 29% 55% 5% 1% 10% 84% 6%PT 1013 24% 59% 6% - 11% 83% 6%RO 1037 32% 42% 4% 1% 21% 74% 5%SI 1015 31% 51% 9% 2% 7% 82% 11%SK 1094 36% 54% 6% - 4% 90% 6%FI 1041 31% 54% 9% 1% 5% 85% 10%SE 1011 16% 47% 20% 5% 12% 63% 25%UK 1310 27% 47% 9% 4% 13% 74% 13%
The richness of European culture comes from its long history shared by European countries
QA13.5 I will now read out several statements or opinions that are sometimes heard. For each one, please tell me if it corresponds very well, fairly well, fairly badly or very badly to what you think personally.

TOTAL Very well Fairly well Fairly badly Very badly DK Well BadlyUE27 EU27 26755 7% 25% 34% 21% 13% 32% 55%BE 1040 5% 30% 38% 22% 5% 35% 60%BG 1009 7% 18% 22% 16% 37% 25% 38%CZ 1060 4% 23% 44% 23% 6% 27% 67%DK 1008 8% 27% 37% 19% 9% 35% 56%D-W 1006 5% 18% 44% 27% 6% 23% 71%DE 1534 5% 17% 44% 28% 6% 22% 72%D-E 528 4% 17% 44% 32% 3% 21% 76%EE 1001 6% 24% 32% 22% 16% 30% 54%EL 1000 10% 23% 37% 28% 2% 33% 65%ES 1006 8% 25% 24% 24% 19% 33% 48%FR 1031 4% 25% 41% 19% 11% 29% 60%IE 1000 8% 26% 20% 14% 32% 34% 34%IT 1000 9% 35% 27% 18% 11% 44% 45%CY 500 11% 17% 27% 29% 16% 28% 56%LV 1006 3% 25% 36% 20% 16% 28% 56%LT 1029 5% 26% 32% 10% 27% 31% 42%LU 500 5% 18% 32% 31% 14% 23% 63%HU 1000 5% 19% 41% 25% 10% 24% 66%MT 500 11% 22% 25% 18% 24% 33% 43%NL 1000 8% 24% 25% 39% 4% 32% 64%AT 1011 4% 21% 36% 23% 16% 25% 59%PL 1000 5% 25% 38% 15% 17% 30% 53%PT 1013 8% 32% 31% 8% 21% 40% 39%RO 1037 7% 21% 28% 17% 27% 28% 45%SI 1015 5% 27% 36% 20% 12% 32% 56%SK 1094 4% 22% 42% 20% 12% 26% 62%FI 1041 4% 22% 43% 25% 6% 26% 68%SE 1011 4% 22% 39% 23% 12% 26% 62%UK 1310 8% 30% 28% 18% 16% 38% 46%
There is no specific European culture, only a global western culture which is, for example, the same in Europe and the US
QA13.6 I will now read out several statements or opinions that are sometimes heard. For each one, please tell me if it corresponds very well, fairly well, fairly badly or very badly to what you think personally.
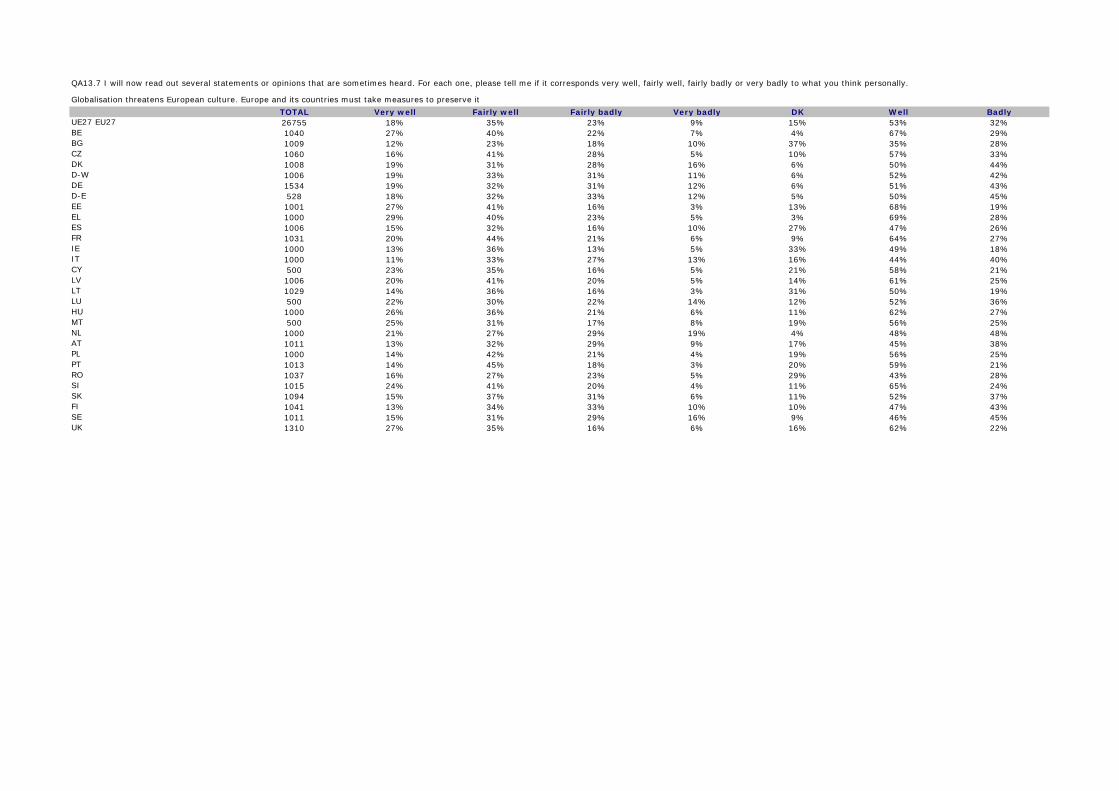
TOTAL Very well Fairly well Fairly badly Very badly DK Well BadlyUE27 EU27 26755 18% 35% 23% 9% 15% 53% 32%BE 1040 27% 40% 22% 7% 4% 67% 29%BG 1009 12% 23% 18% 10% 37% 35% 28%CZ 1060 16% 41% 28% 5% 10% 57% 33%DK 1008 19% 31% 28% 16% 6% 50% 44%D-W 1006 19% 33% 31% 11% 6% 52% 42%DE 1534 19% 32% 31% 12% 6% 51% 43%D-E 528 18% 32% 33% 12% 5% 50% 45%EE 1001 27% 41% 16% 3% 13% 68% 19%EL 1000 29% 40% 23% 5% 3% 69% 28%ES 1006 15% 32% 16% 10% 27% 47% 26%FR 1031 20% 44% 21% 6% 9% 64% 27%IE 1000 13% 36% 13% 5% 33% 49% 18%IT 1000 11% 33% 27% 13% 16% 44% 40%CY 500 23% 35% 16% 5% 21% 58% 21%LV 1006 20% 41% 20% 5% 14% 61% 25%LT 1029 14% 36% 16% 3% 31% 50% 19%LU 500 22% 30% 22% 14% 12% 52% 36%HU 1000 26% 36% 21% 6% 11% 62% 27%MT 500 25% 31% 17% 8% 19% 56% 25%NL 1000 21% 27% 29% 19% 4% 48% 48%AT 1011 13% 32% 29% 9% 17% 45% 38%PL 1000 14% 42% 21% 4% 19% 56% 25%PT 1013 14% 45% 18% 3% 20% 59% 21%RO 1037 16% 27% 23% 5% 29% 43% 28%SI 1015 24% 41% 20% 4% 11% 65% 24%SK 1094 15% 37% 31% 6% 11% 52% 37%FI 1041 13% 34% 33% 10% 10% 47% 43%SE 1011 15% 31% 29% 16% 9% 46% 45%UK 1310 27% 35% 16% 6% 16% 62% 22%
Globalisation threatens European culture. Europe and its countries must take measures to preserve it
QA13.7 I will now read out several statements or opinions that are sometimes heard. For each one, please tell me if it corresponds very well, fairly well, fairly badly or very badly to what you think personally.

TOTAL Very well Fairly well Fairly badly Very badly DK Well BadlyUE27 EU27 26755 17% 50% 15% 4% 14% 67% 19%BE 1040 13% 54% 23% 5% 5% 67% 28%BG 1009 27% 40% 4% 1% 28% 67% 5%CZ 1060 20% 60% 12% 1% 7% 80% 13%DK 1008 27% 43% 19% 4% 7% 70% 23%D-W 1006 20% 45% 24% 3% 8% 65% 27%DE 1534 20% 45% 24% 4% 7% 65% 28%D-E 528 17% 48% 24% 6% 5% 65% 30%EE 1001 26% 50% 7% - 17% 76% 7%EL 1000 23% 57% 16% 2% 2% 80% 18%ES 1006 16% 53% 9% 2% 20% 69% 11%FR 1031 11% 53% 18% 4% 14% 64% 22%IE 1000 13% 41% 12% 5% 29% 54% 17%IT 1000 14% 60% 11% 2% 13% 74% 13%CY 500 38% 42% 4% - 16% 80% 4%LV 1006 19% 57% 11% 1% 12% 76% 12%LT 1029 16% 50% 9% 1% 24% 66% 10%LU 500 18% 38% 18% 6% 20% 56% 24%HU 1000 24% 51% 12% 2% 11% 75% 14%MT 500 29% 48% 7% 1% 15% 77% 8%NL 1000 11% 30% 26% 20% 13% 41% 46%AT 1011 16% 51% 16% 2% 15% 67% 18%PL 1000 20% 57% 8% 1% 14% 77% 9%PT 1013 16% 59% 8% - 17% 75% 8%RO 1037 24% 43% 7% 1% 25% 67% 8%SI 1015 17% 52% 16% 4% 11% 69% 20%SK 1094 19% 60% 10% 1% 10% 79% 11%FI 1041 18% 57% 16% 2% 7% 75% 18%SE 1011 12% 37% 25% 9% 17% 49% 34%UK 1310 14% 45% 18% 6% 17% 59% 24%
When compared to other continents, it is much easier to see what Europeans have in common culturally
QA13.8 I will now read out several statements or opinions that are sometimes heard. For each one, please tell me if it corresponds very well, fairly well, fairly badly or very badly to what you think personally.
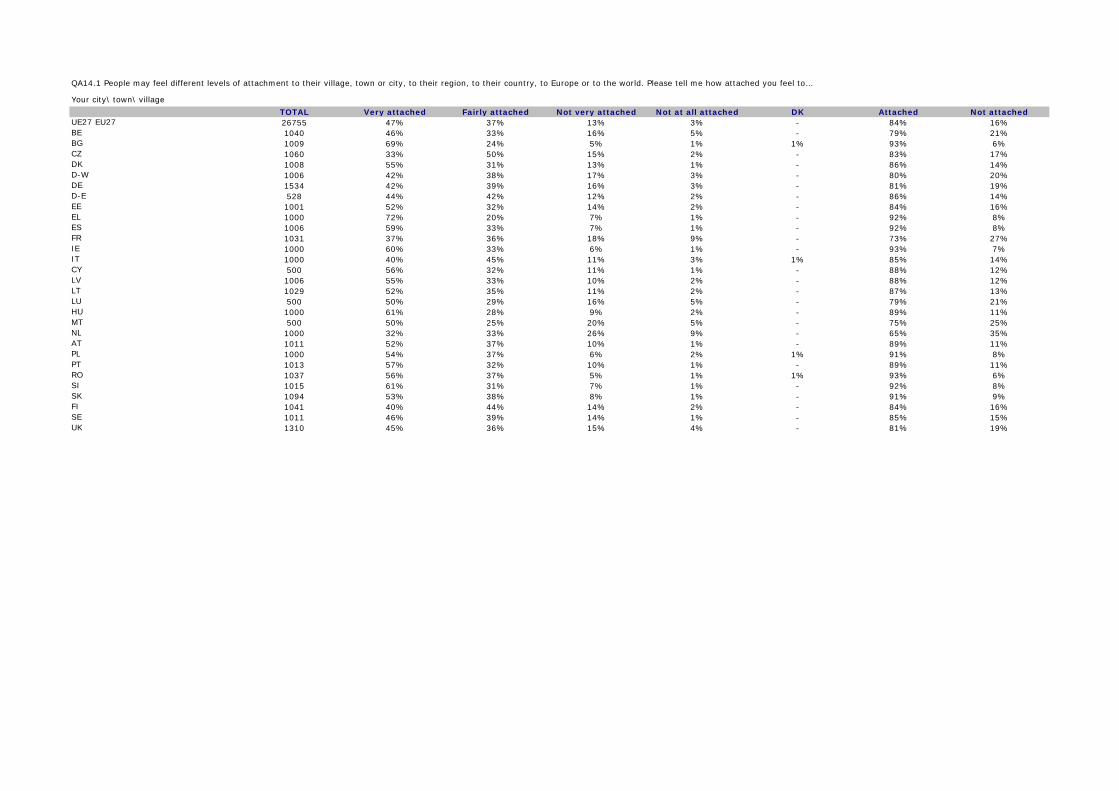
TOTAL Very attached Fairly attached Not very attached Not at all attached DK Attached Not attachedUE27 EU27 26755 47% 37% 13% 3% - 84% 16%BE 1040 46% 33% 16% 5% - 79% 21%BG 1009 69% 24% 5% 1% 1% 93% 6%CZ 1060 33% 50% 15% 2% - 83% 17%DK 1008 55% 31% 13% 1% - 86% 14%D-W 1006 42% 38% 17% 3% - 80% 20%DE 1534 42% 39% 16% 3% - 81% 19%D-E 528 44% 42% 12% 2% - 86% 14%EE 1001 52% 32% 14% 2% - 84% 16%EL 1000 72% 20% 7% 1% - 92% 8%ES 1006 59% 33% 7% 1% - 92% 8%FR 1031 37% 36% 18% 9% - 73% 27%IE 1000 60% 33% 6% 1% - 93% 7%IT 1000 40% 45% 11% 3% 1% 85% 14%CY 500 56% 32% 11% 1% - 88% 12%LV 1006 55% 33% 10% 2% - 88% 12%LT 1029 52% 35% 11% 2% - 87% 13%LU 500 50% 29% 16% 5% - 79% 21%HU 1000 61% 28% 9% 2% - 89% 11%MT 500 50% 25% 20% 5% - 75% 25%NL 1000 32% 33% 26% 9% - 65% 35%AT 1011 52% 37% 10% 1% - 89% 11%PL 1000 54% 37% 6% 2% 1% 91% 8%PT 1013 57% 32% 10% 1% - 89% 11%RO 1037 56% 37% 5% 1% 1% 93% 6%SI 1015 61% 31% 7% 1% - 92% 8%SK 1094 53% 38% 8% 1% - 91% 9%FI 1041 40% 44% 14% 2% - 84% 16%SE 1011 46% 39% 14% 1% - 85% 15%UK 1310 45% 36% 15% 4% - 81% 19%
Your city\ town\ village
QA14.1 People may feel different levels of attachment to their village, town or city, to their region, to their country, to Europe or to the world. Please tell me how attached you feel to…
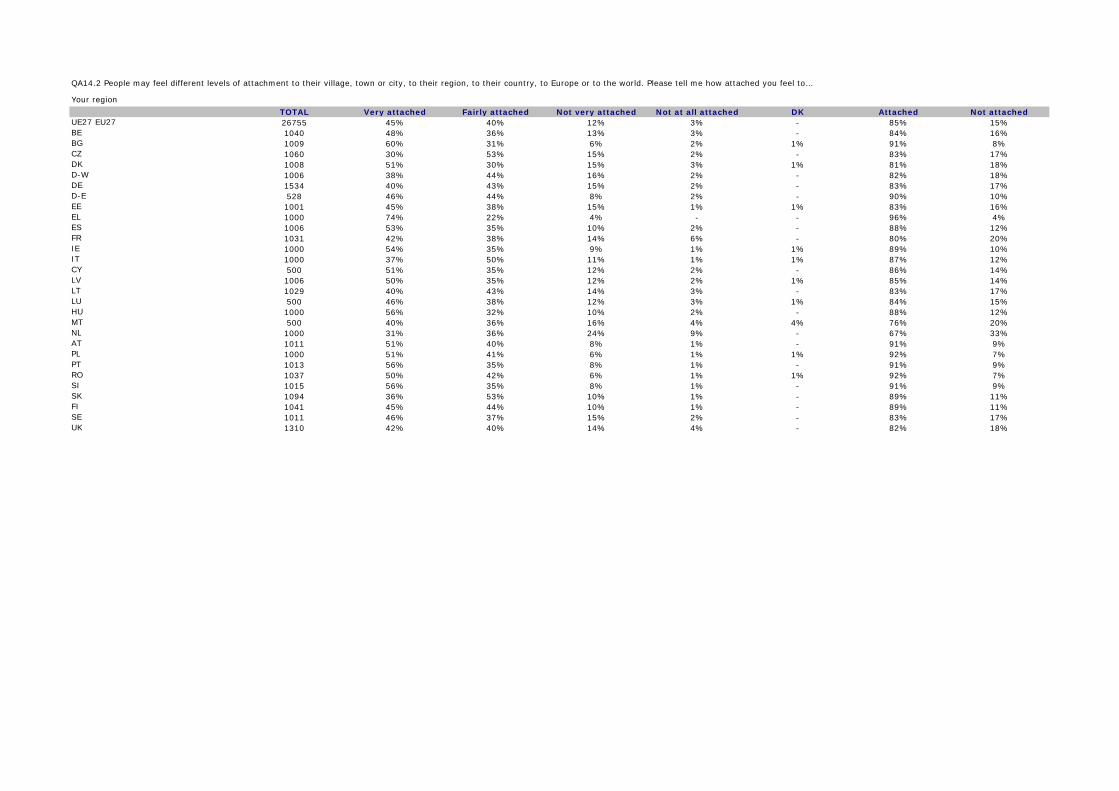
TOTAL Very attached Fairly attached Not very attached Not at all attached DK Attached Not attachedUE27 EU27 26755 45% 40% 12% 3% - 85% 15%BE 1040 48% 36% 13% 3% - 84% 16%BG 1009 60% 31% 6% 2% 1% 91% 8%CZ 1060 30% 53% 15% 2% - 83% 17%DK 1008 51% 30% 15% 3% 1% 81% 18%D-W 1006 38% 44% 16% 2% - 82% 18%DE 1534 40% 43% 15% 2% - 83% 17%D-E 528 46% 44% 8% 2% - 90% 10%EE 1001 45% 38% 15% 1% 1% 83% 16%EL 1000 74% 22% 4% - - 96% 4%ES 1006 53% 35% 10% 2% - 88% 12%FR 1031 42% 38% 14% 6% - 80% 20%IE 1000 54% 35% 9% 1% 1% 89% 10%IT 1000 37% 50% 11% 1% 1% 87% 12%CY 500 51% 35% 12% 2% - 86% 14%LV 1006 50% 35% 12% 2% 1% 85% 14%LT 1029 40% 43% 14% 3% - 83% 17%LU 500 46% 38% 12% 3% 1% 84% 15%HU 1000 56% 32% 10% 2% - 88% 12%MT 500 40% 36% 16% 4% 4% 76% 20%NL 1000 31% 36% 24% 9% - 67% 33%AT 1011 51% 40% 8% 1% - 91% 9%PL 1000 51% 41% 6% 1% 1% 92% 7%PT 1013 56% 35% 8% 1% - 91% 9%RO 1037 50% 42% 6% 1% 1% 92% 7%SI 1015 56% 35% 8% 1% - 91% 9%SK 1094 36% 53% 10% 1% - 89% 11%FI 1041 45% 44% 10% 1% - 89% 11%SE 1011 46% 37% 15% 2% - 83% 17%UK 1310 42% 40% 14% 4% - 82% 18%
Your region
QA14.2 People may feel different levels of attachment to their village, town or city, to their region, to their country, to Europe or to the world. Please tell me how attached you feel to…
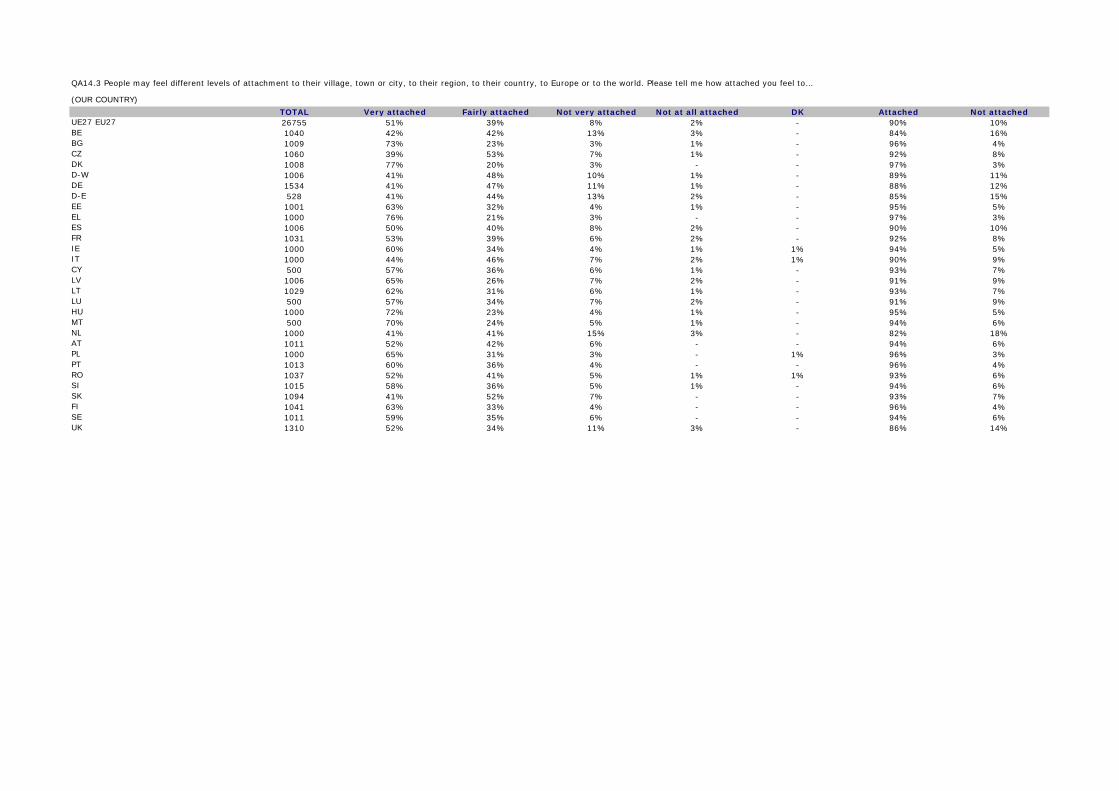
TOTAL Very attached Fairly attached Not very attached Not at all attached DK Attached Not attachedUE27 EU27 26755 51% 39% 8% 2% - 90% 10%BE 1040 42% 42% 13% 3% - 84% 16%BG 1009 73% 23% 3% 1% - 96% 4%CZ 1060 39% 53% 7% 1% - 92% 8%DK 1008 77% 20% 3% - - 97% 3%D-W 1006 41% 48% 10% 1% - 89% 11%DE 1534 41% 47% 11% 1% - 88% 12%D-E 528 41% 44% 13% 2% - 85% 15%EE 1001 63% 32% 4% 1% - 95% 5%EL 1000 76% 21% 3% - - 97% 3%ES 1006 50% 40% 8% 2% - 90% 10%FR 1031 53% 39% 6% 2% - 92% 8%IE 1000 60% 34% 4% 1% 1% 94% 5%IT 1000 44% 46% 7% 2% 1% 90% 9%CY 500 57% 36% 6% 1% - 93% 7%LV 1006 65% 26% 7% 2% - 91% 9%LT 1029 62% 31% 6% 1% - 93% 7%LU 500 57% 34% 7% 2% - 91% 9%HU 1000 72% 23% 4% 1% - 95% 5%MT 500 70% 24% 5% 1% - 94% 6%NL 1000 41% 41% 15% 3% - 82% 18%AT 1011 52% 42% 6% - - 94% 6%PL 1000 65% 31% 3% - 1% 96% 3%PT 1013 60% 36% 4% - - 96% 4%RO 1037 52% 41% 5% 1% 1% 93% 6%SI 1015 58% 36% 5% 1% - 94% 6%SK 1094 41% 52% 7% - - 93% 7%FI 1041 63% 33% 4% - - 96% 4%SE 1011 59% 35% 6% - - 94% 6%UK 1310 52% 34% 11% 3% - 86% 14%
(OUR COUNTRY)
QA14.3 People may feel different levels of attachment to their village, town or city, to their region, to their country, to Europe or to the world. Please tell me how attached you feel to…
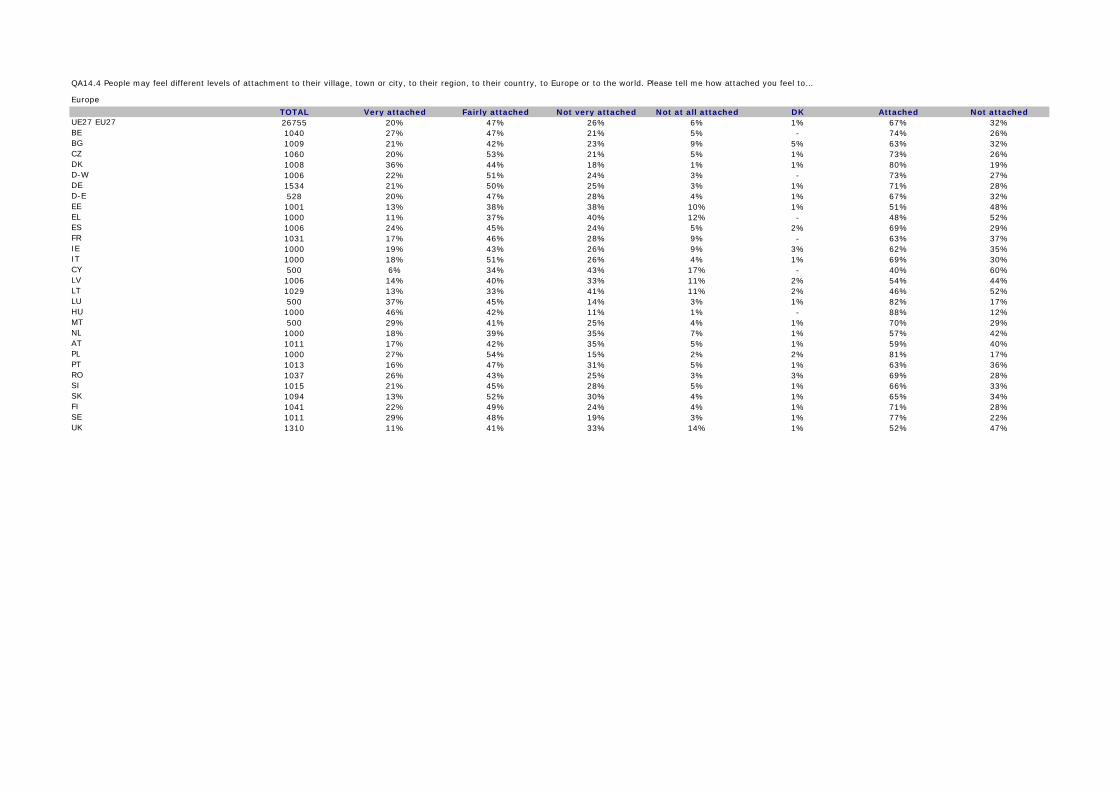
TOTAL Very attached Fairly attached Not very attached Not at all attached DK Attached Not attachedUE27 EU27 26755 20% 47% 26% 6% 1% 67% 32%BE 1040 27% 47% 21% 5% - 74% 26%BG 1009 21% 42% 23% 9% 5% 63% 32%CZ 1060 20% 53% 21% 5% 1% 73% 26%DK 1008 36% 44% 18% 1% 1% 80% 19%D-W 1006 22% 51% 24% 3% - 73% 27%DE 1534 21% 50% 25% 3% 1% 71% 28%D-E 528 20% 47% 28% 4% 1% 67% 32%EE 1001 13% 38% 38% 10% 1% 51% 48%EL 1000 11% 37% 40% 12% - 48% 52%ES 1006 24% 45% 24% 5% 2% 69% 29%FR 1031 17% 46% 28% 9% - 63% 37%IE 1000 19% 43% 26% 9% 3% 62% 35%IT 1000 18% 51% 26% 4% 1% 69% 30%CY 500 6% 34% 43% 17% - 40% 60%LV 1006 14% 40% 33% 11% 2% 54% 44%LT 1029 13% 33% 41% 11% 2% 46% 52%LU 500 37% 45% 14% 3% 1% 82% 17%HU 1000 46% 42% 11% 1% - 88% 12%MT 500 29% 41% 25% 4% 1% 70% 29%NL 1000 18% 39% 35% 7% 1% 57% 42%AT 1011 17% 42% 35% 5% 1% 59% 40%PL 1000 27% 54% 15% 2% 2% 81% 17%PT 1013 16% 47% 31% 5% 1% 63% 36%RO 1037 26% 43% 25% 3% 3% 69% 28%SI 1015 21% 45% 28% 5% 1% 66% 33%SK 1094 13% 52% 30% 4% 1% 65% 34%FI 1041 22% 49% 24% 4% 1% 71% 28%SE 1011 29% 48% 19% 3% 1% 77% 22%UK 1310 11% 41% 33% 14% 1% 52% 47%
Europe
QA14.4 People may feel different levels of attachment to their village, town or city, to their region, to their country, to Europe or to the world. Please tell me how attached you feel to…
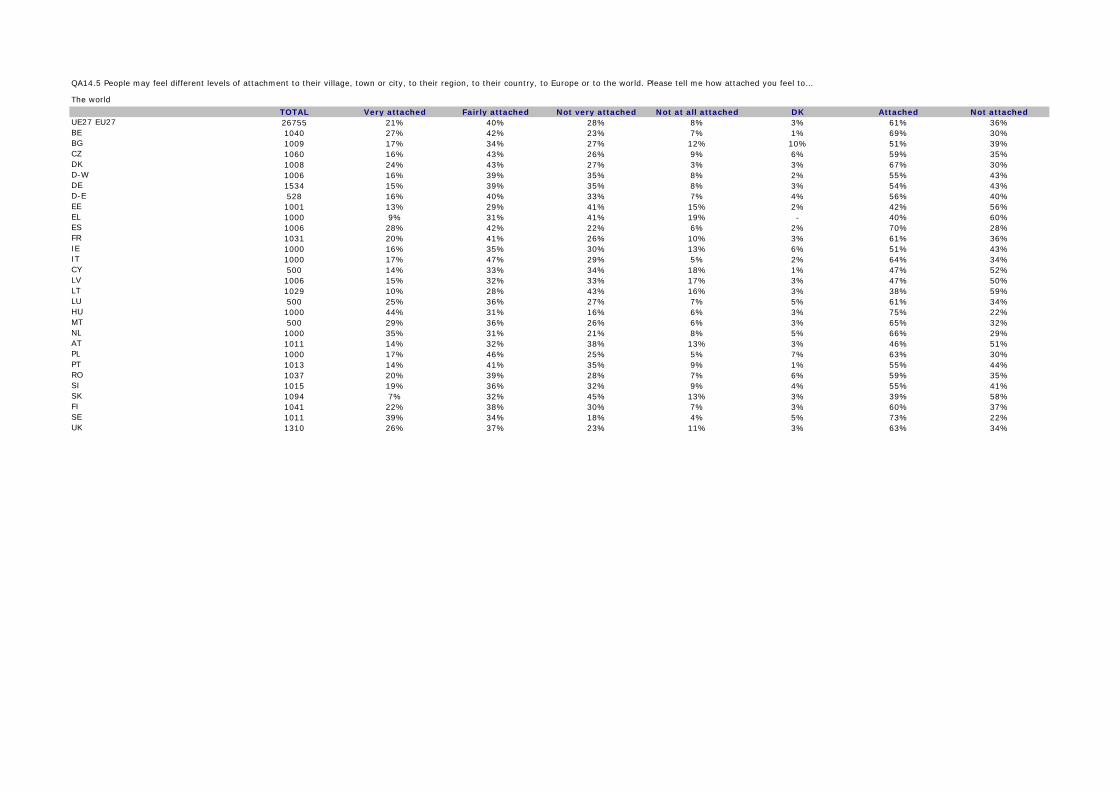
TOTAL Very attached Fairly attached Not very attached Not at all attached DK Attached Not attachedUE27 EU27 26755 21% 40% 28% 8% 3% 61% 36%BE 1040 27% 42% 23% 7% 1% 69% 30%BG 1009 17% 34% 27% 12% 10% 51% 39%CZ 1060 16% 43% 26% 9% 6% 59% 35%DK 1008 24% 43% 27% 3% 3% 67% 30%D-W 1006 16% 39% 35% 8% 2% 55% 43%DE 1534 15% 39% 35% 8% 3% 54% 43%D-E 528 16% 40% 33% 7% 4% 56% 40%EE 1001 13% 29% 41% 15% 2% 42% 56%EL 1000 9% 31% 41% 19% - 40% 60%ES 1006 28% 42% 22% 6% 2% 70% 28%FR 1031 20% 41% 26% 10% 3% 61% 36%IE 1000 16% 35% 30% 13% 6% 51% 43%IT 1000 17% 47% 29% 5% 2% 64% 34%CY 500 14% 33% 34% 18% 1% 47% 52%LV 1006 15% 32% 33% 17% 3% 47% 50%LT 1029 10% 28% 43% 16% 3% 38% 59%LU 500 25% 36% 27% 7% 5% 61% 34%HU 1000 44% 31% 16% 6% 3% 75% 22%MT 500 29% 36% 26% 6% 3% 65% 32%NL 1000 35% 31% 21% 8% 5% 66% 29%AT 1011 14% 32% 38% 13% 3% 46% 51%PL 1000 17% 46% 25% 5% 7% 63% 30%PT 1013 14% 41% 35% 9% 1% 55% 44%RO 1037 20% 39% 28% 7% 6% 59% 35%SI 1015 19% 36% 32% 9% 4% 55% 41%SK 1094 7% 32% 45% 13% 3% 39% 58%FI 1041 22% 38% 30% 7% 3% 60% 37%SE 1011 39% 34% 18% 4% 5% 73% 22%UK 1310 26% 37% 23% 11% 3% 63% 34%
The world
QA14.5 People may feel different levels of attachment to their village, town or city, to their region, to their country, to Europe or to the world. Please tell me how attached you feel to…

TOTAL (NATIONALITY) only(NATIONALITY) and
EuropeanEuropean and
(NATIONALITY)European only DK
UE27 EU27 26755 42% 44% 8% 4% 2%BE 1040 30% 50% 13% 6% 1%BG 1009 43% 37% 9% 4% 7%CZ 1060 49% 43% 5% 2% 1%DK 1008 36% 52% 9% 2% 1%D-W 1006 29% 52% 11% 7% 1%DE 1534 31% 51% 11% 6% 1%D-E 528 40% 45% 10% 3% 2%EE 1001 49% 46% 4% 1% - EL 1000 48% 46% 4% 1% 1%ES 1006 34% 50% 6% 6% 4%FR 1031 32% 51% 10% 6% 1%IE 1000 59% 34% 3% 3% 1%IT 1000 52% 35% 7% 2% 4%CY 500 38% 45% 10% 6% 1%LV 1006 55% 37% 4% 3% 1%LT 1029 56% 37% 4% 1% 2%LU 500 22% 44% 19% 13% 2%HU 1000 46% 47% 5% 2% - MT 500 34% 63% 3% - - NL 1000 29% 55% 12% 3% 1%AT 1011 44% 46% 7% 1% 2%PL 1000 45% 48% 5% 1% 1%PT 1013 49% 41% 4% 3% 3%RO 1037 52% 30% 10% 2% 6%SI 1015 36% 55% 6% 2% 1%SK 1094 43% 43% 8% 4% 2%FI 1041 49% 46% 4% 1% - SE 1011 45% 48% 4% 2% 1%UK 1310 60% 31% 5% 2% 2%
QA15 In the near future, do you see yourself as...? (NATIONALITY AS MENTIONED IN Q1)

TOTAL
Respect for nature and
the environment
Social equality and
solidarity
Entrepreneurship
Cultural diversity
PeaceProgress and
innovationFreedom of
opinion
Tolerance and
openness to others
Respect for history and its lessons
None (SPONTANEO
US)
Other (SPONTANEO
US)DK
UE27 EU27 26755 50% 37% 10% 12% 61% 14% 37% 37% 17% 0% 0% 1%BE 1040 51% 41% 10% 10% 60% 12% 39% 51% 12% - 1% - BG 1009 45% 39% 15% 16% 56% 15% 22% 28% 15% - 0% 5%CZ 1060 61% 27% 12% 11% 59% 12% 35% 34% 27% - - - DK 1008 70% 41% 7% 11% 56% 13% 34% 50% 12% 0% - 0%D-W 1006 48% 36% 6% 10% 67% 13% 45% 45% 14% 0% 0% 0%DE 1534 48% 38% 7% 10% 68% 13% 42% 44% 14% 0% 0% 0%D-E 528 48% 49% 8% 8% 74% 14% 30% 41% 16% - - - EE 1001 59% 30% 14% 17% 45% 8% 30% 41% 29% - 1% 1%EL 1000 58% 44% 10% 7% 72% 19% 36% 11% 23% 0% 0% - ES 1006 42% 43% 8% 14% 69% 12% 28% 37% 9% 0% 1% 1%FR 1031 61% 43% 11% 10% 63% 9% 38% 43% 14% 0% 0% - IE 1000 56% 32% 8% 14% 65% 13% 37% 34% 13% 0% 0% 2%IT 1000 38% 38% 15% 12% 52% 21% 33% 23% 16% 1% 0% 1%CY 500 68% 54% 5% 7% 70% 12% 42% 16% 16% - 0% - LV 1006 58% 33% 14% 24% 56% 13% 24% 20% 26% 0% - 1%LT 1029 45% 39% 9% 19% 45% 9% 30% 31% 25% 1% 0% 2%LU 500 78% 42% 5% 5% 62% 7% 33% 39% 14% - 1% 0%HU 1000 54% 34% 12% 18% 66% 26% 16% 32% 23% 0% 0% 0%MT 500 60% 32% 3% 10% 71% 14% 37% 26% 22% - 0% 0%NL 1000 46% 34% 9% 10% 50% 16% 52% 60% 14% 0% 1% 0%AT 1011 60% 50% 6% 12% 68% 13% 36% 34% 10% - 0% 0%PL 1000 45% 32% 12% 9% 59% 11% 29% 38% 27% 1% 0% 2%PT 1013 53% 50% 8% 15% 68% 20% 26% 21% 12% 0% 0% 0%RO 1037 60% 28% 13% 16% 64% 17% 28% 23% 16% - 0% 3%SI 1015 53% 35% 10% 8% 64% 15% 29% 50% 16% - 0% 0%SK 1094 62% 43% 12% 10% 68% 15% 25% 30% 15% - 0% 1%FI 1041 74% 48% 12% 8% 63% 9% 27% 43% 7% - 1% 0%SE 1011 76% 43% 5% 9% 65% 9% 34% 39% 12% - 0% 0%UK 1310 46% 23% 4% 13% 54% 13% 55% 44% 26% 1% 0% 1%
QA16 Among the following values, what are the three in your opinion, that we should preserve and reinforce the most in our current society? (ROTATE – MAX. 3 ANSWERS)

TOTAL Europe Other countries in the world Both DKUE27 EU27 26755 49% 9% 33% 9%BE 1040 55% 11% 30% 4%BG 1009 27% 7% 43% 23%CZ 1060 44% 9% 42% 5%DK 1008 67% 5% 23% 5%D-W 1006 67% 6% 24% 3%DE 1534 65% 5% 26% 4%D-E 528 58% 5% 32% 5%EE 1001 45% 3% 41% 11%EL 1000 57% 5% 32% 6%ES 1006 40% 9% 35% 16%FR 1031 55% 11% 22% 12%IE 1000 38% 8% 37% 17%IT 1000 46% 16% 28% 10%CY 500 68% 2% 22% 8%LV 1006 44% 6% 40% 10%LT 1029 30% 6% 52% 12%LU 500 58% 9% 26% 7%HU 1000 40% 11% 41% 8%MT 500 32% 3% 58% 7%NL 1000 50% 7% 36% 7%AT 1011 63% 5% 28% 4%PL 1000 48% 10% 35% 7%PT 1013 49% 8% 29% 14%RO 1037 37% 7% 43% 13%SI 1015 56% 5% 33% 6%SK 1094 43% 10% 42% 5%FI 1041 67% 6% 21% 6%SE 1011 56% 7% 31% 6%UK 1310 31% 11% 48% 10%
Respect for nature and the environment
QA17.1 For each of these values, please tell me if they are best embodied by Europe, by other countries (or groups of countries) in the world or by both?

TOTAL Europe Other countries in the world Both DKUE27 EU27 26755 53% 7% 29% 11%BE 1040 68% 7% 22% 3%BG 1009 25% 10% 35% 30%CZ 1060 51% 6% 33% 10%DK 1008 75% 3% 17% 5%D-W 1006 70% 4% 19% 7%DE 1534 68% 4% 21% 7%D-E 528 59% 7% 26% 8%EE 1001 49% 5% 31% 15%EL 1000 61% 6% 28% 5%ES 1006 47% 6% 34% 13%FR 1031 60% 8% 20% 12%IE 1000 39% 8% 33% 20%IT 1000 56% 12% 23% 9%CY 500 59% 3% 24% 14%LV 1006 41% 11% 31% 17%LT 1029 33% 7% 43% 17%LU 500 62% 9% 22% 7%HU 1000 44% 10% 32% 14%MT 500 32% 5% 53% 10%NL 1000 59% 4% 29% 8%AT 1011 62% 6% 26% 6%PL 1000 47% 9% 33% 11%PT 1013 53% 6% 26% 15%RO 1037 30% 9% 40% 21%SI 1015 55% 5% 31% 9%SK 1094 46% 13% 32% 9%FI 1041 81% 2% 13% 4%SE 1011 67% 4% 22% 7%UK 1310 32% 7% 44% 17%
Social equality and solidarity
QA17.2 For each of these values, please tell me if they are best embodied by Europe, by other countries (or groups of countries) in the world or by both?

TOTAL Europe Other countries in the world Both DKUE27 EU27 26755 28% 18% 43% 11%BE 1040 38% 17% 42% 3%BG 1009 17% 11% 50% 22%CZ 1060 26% 15% 55% 4%DK 1008 36% 17% 37% 10%D-W 1006 33% 15% 47% 5%DE 1534 31% 15% 49% 5%D-E 528 25% 15% 57% 3%EE 1001 28% 8% 52% 12%EL 1000 28% 21% 49% 2%ES 1006 31% 14% 40% 15%FR 1031 27% 28% 34% 11%IE 1000 24% 14% 39% 23%IT 1000 38% 25% 29% 8%CY 500 21% 8% 54% 17%LV 1006 26% 15% 47% 12%LT 1029 20% 10% 54% 16%LU 500 22% 29% 34% 15%HU 1000 21% 15% 55% 9%MT 500 13% 9% 46% 32%NL 1000 23% 17% 50% 10%AT 1011 27% 14% 52% 7%PL 1000 31% 22% 38% 9%PT 1013 33% 11% 34% 22%RO 1037 21% 13% 47% 19%SI 1015 24% 14% 57% 5%SK 1094 19% 21% 54% 6%FI 1041 40% 12% 42% 6%SE 1011 24% 20% 39% 17%UK 1310 19% 13% 51% 17%
Entrepreneurship
QA17.3 For each of these values, please tell me if they are best embodied by Europe, by other countries (or groups of countries) in the world or by both?

TOTAL Europe Other countries in the world Both DKUE27 EU27 26755 32% 14% 46% 8%BE 1040 42% 12% 44% 2%BG 1009 26% 7% 48% 19%CZ 1060 30% 10% 59% 1%DK 1008 22% 16% 55% 7%D-W 1006 38% 9% 51% 2%DE 1534 34% 9% 55% 2%D-E 528 21% 9% 69% 1%EE 1001 30% 7% 54% 9%EL 1000 45% 11% 42% 2%ES 1006 36% 9% 41% 14%FR 1031 37% 11% 44% 8%IE 1000 31% 11% 36% 22%IT 1000 33% 29% 29% 9%CY 500 37% 4% 48% 11%LV 1006 28% 9% 55% 8%LT 1029 23% 5% 61% 11%LU 500 38% 15% 38% 9%HU 1000 29% 9% 60% 2%MT 500 21% 7% 61% 11%NL 1000 29% 11% 54% 6%AT 1011 44% 8% 43% 5%PL 1000 29% 26% 37% 8%PT 1013 40% 8% 37% 15%RO 1037 27% 9% 49% 15%SI 1015 29% 11% 56% 4%SK 1094 22% 19% 53% 6%FI 1041 32% 14% 49% 5%SE 1011 22% 15% 52% 11%UK 1310 22% 12% 51% 15%
Cultural diversity
QA17.4 For each of these values, please tell me if they are best embodied by Europe, by other countries (or groups of countries) in the world or by both?
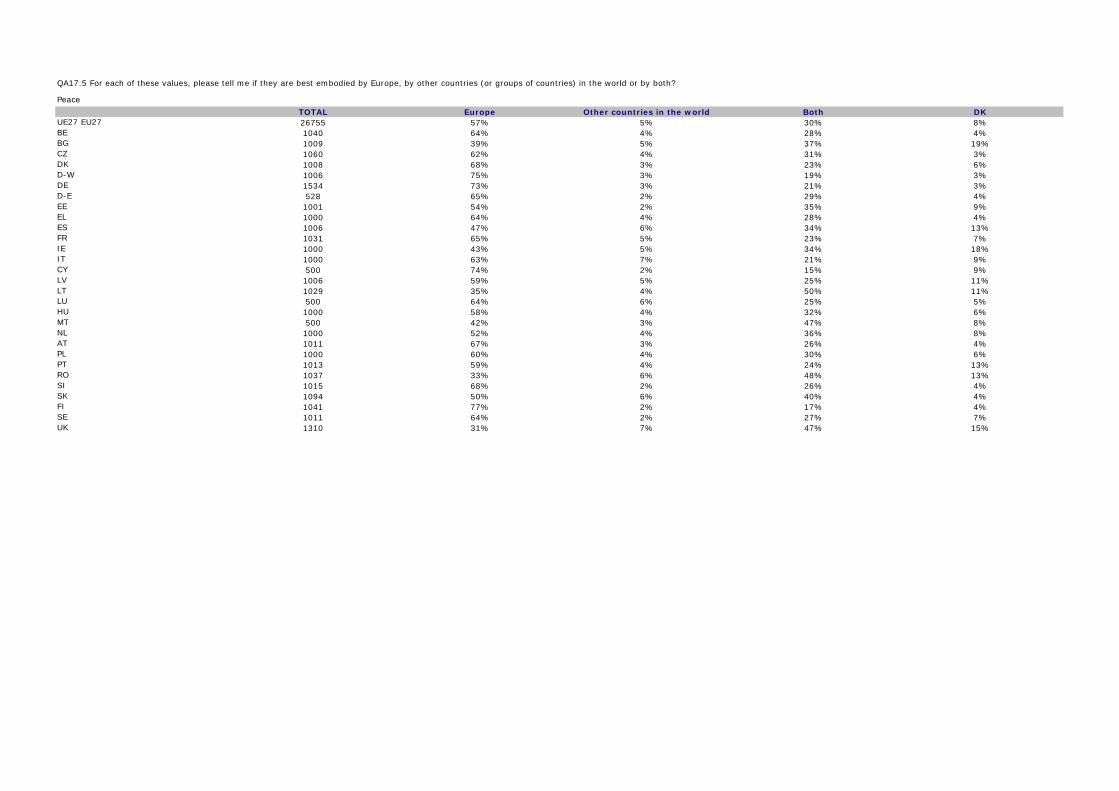
TOTAL Europe Other countries in the world Both DKUE27 EU27 26755 57% 5% 30% 8%BE 1040 64% 4% 28% 4%BG 1009 39% 5% 37% 19%CZ 1060 62% 4% 31% 3%DK 1008 68% 3% 23% 6%D-W 1006 75% 3% 19% 3%DE 1534 73% 3% 21% 3%D-E 528 65% 2% 29% 4%EE 1001 54% 2% 35% 9%EL 1000 64% 4% 28% 4%ES 1006 47% 6% 34% 13%FR 1031 65% 5% 23% 7%IE 1000 43% 5% 34% 18%IT 1000 63% 7% 21% 9%CY 500 74% 2% 15% 9%LV 1006 59% 5% 25% 11%LT 1029 35% 4% 50% 11%LU 500 64% 6% 25% 5%HU 1000 58% 4% 32% 6%MT 500 42% 3% 47% 8%NL 1000 52% 4% 36% 8%AT 1011 67% 3% 26% 4%PL 1000 60% 4% 30% 6%PT 1013 59% 4% 24% 13%RO 1037 33% 6% 48% 13%SI 1015 68% 2% 26% 4%SK 1094 50% 6% 40% 4%FI 1041 77% 2% 17% 4%SE 1011 64% 2% 27% 7%UK 1310 31% 7% 47% 15%
Peace
QA17.5 For each of these values, please tell me if they are best embodied by Europe, by other countries (or groups of countries) in the world or by both?
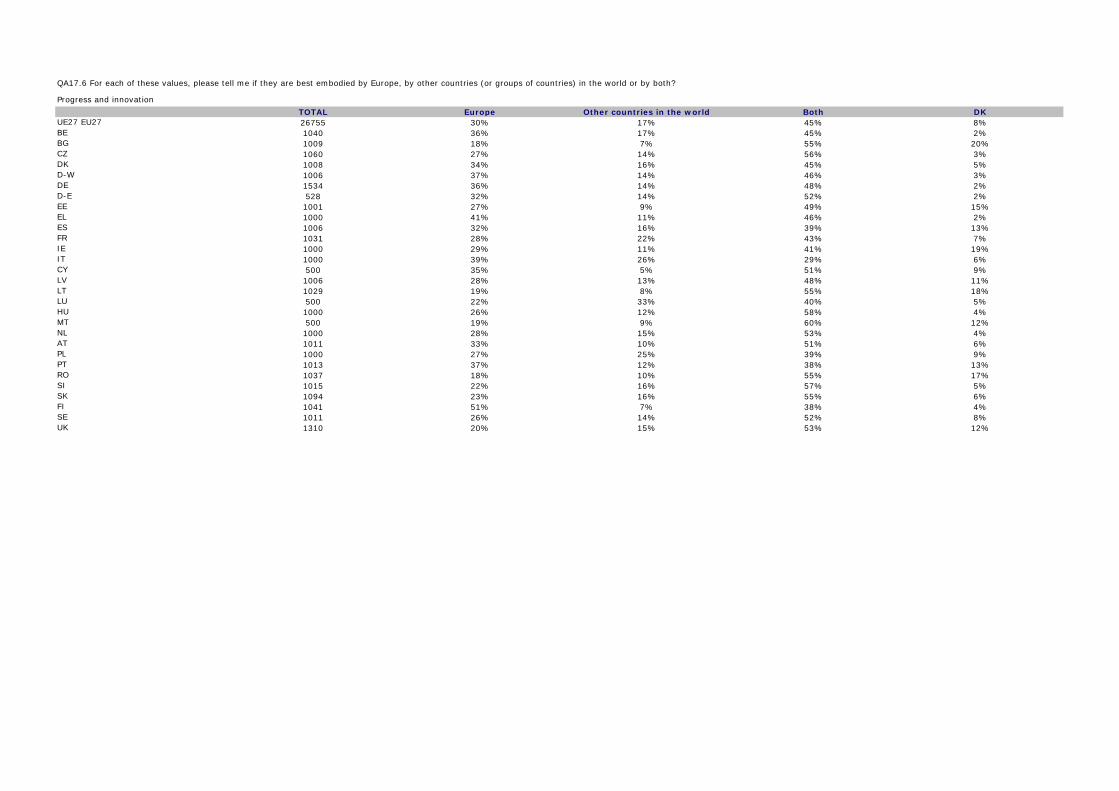
TOTAL Europe Other countries in the world Both DKUE27 EU27 26755 30% 17% 45% 8%BE 1040 36% 17% 45% 2%BG 1009 18% 7% 55% 20%CZ 1060 27% 14% 56% 3%DK 1008 34% 16% 45% 5%D-W 1006 37% 14% 46% 3%DE 1534 36% 14% 48% 2%D-E 528 32% 14% 52% 2%EE 1001 27% 9% 49% 15%EL 1000 41% 11% 46% 2%ES 1006 32% 16% 39% 13%FR 1031 28% 22% 43% 7%IE 1000 29% 11% 41% 19%IT 1000 39% 26% 29% 6%CY 500 35% 5% 51% 9%LV 1006 28% 13% 48% 11%LT 1029 19% 8% 55% 18%LU 500 22% 33% 40% 5%HU 1000 26% 12% 58% 4%MT 500 19% 9% 60% 12%NL 1000 28% 15% 53% 4%AT 1011 33% 10% 51% 6%PL 1000 27% 25% 39% 9%PT 1013 37% 12% 38% 13%RO 1037 18% 10% 55% 17%SI 1015 22% 16% 57% 5%SK 1094 23% 16% 55% 6%FI 1041 51% 7% 38% 4%SE 1011 26% 14% 52% 8%UK 1310 20% 15% 53% 12%
Progress and innovation
QA17.6 For each of these values, please tell me if they are best embodied by Europe, by other countries (or groups of countries) in the world or by both?

TOTAL Europe Other countries in the world Both DKUE27 EU27 26755 54% 7% 31% 8%BE 1040 70% 4% 23% 3%BG 1009 24% 8% 48% 20%CZ 1060 40% 11% 46% 3%DK 1008 79% 2% 15% 4%D-W 1006 75% 2% 20% 3%DE 1534 72% 2% 23% 3%D-E 528 61% 4% 31% 4%EE 1001 46% 3% 41% 10%EL 1000 61% 5% 32% 2%ES 1006 52% 5% 31% 12%FR 1031 65% 6% 22% 7%IE 1000 43% 7% 33% 17%IT 1000 57% 13% 23% 7%CY 500 66% 1% 25% 8%LV 1006 39% 9% 39% 13%LT 1029 31% 5% 51% 13%LU 500 64% 6% 25% 5%HU 1000 35% 10% 46% 9%MT 500 38% 3% 52% 7%NL 1000 65% 2% 28% 5%AT 1011 65% 4% 27% 4%PL 1000 41% 14% 37% 8%PT 1013 56% 4% 29% 11%RO 1037 24% 7% 53% 16%SI 1015 49% 6% 39% 6%SK 1094 34% 15% 44% 7%FI 1041 82% 2% 13% 3%SE 1011 69% 2% 23% 6%UK 1310 40% 6% 44% 10%
Freedom of opinion
QA17.7 For each of these values, please tell me if they are best embodied by Europe, by other countries (or groups of countries) in the world or by both?

TOTAL Europe Other countries in the world Both DKUE27 EU27 26755 47% 10% 33% 10%BE 1040 58% 9% 29% 4%BG 1009 25% 6% 43% 26%CZ 1060 42% 11% 39% 8%DK 1008 49% 14% 31% 6%D-W 1006 60% 9% 27% 4%DE 1534 56% 10% 30% 4%D-E 528 42% 14% 40% 4%EE 1001 42% 7% 38% 13%EL 1000 55% 7% 34% 4%ES 1006 49% 6% 31% 14%FR 1031 56% 9% 27% 8%IE 1000 39% 8% 33% 20%IT 1000 54% 13% 24% 9%CY 500 58% 3% 27% 12%LV 1006 36% 12% 36% 16%LT 1029 29% 7% 48% 16%LU 500 55% 9% 29% 7%HU 1000 40% 10% 38% 12%MT 500 34% 4% 49% 13%NL 1000 48% 8% 36% 8%AT 1011 54% 7% 32% 7%PL 1000 45% 13% 34% 8%PT 1013 54% 4% 27% 15%RO 1037 24% 9% 48% 19%SI 1015 53% 7% 31% 9%SK 1094 37% 14% 40% 9%FI 1041 63% 7% 24% 6%SE 1011 43% 9% 39% 9%UK 1310 32% 9% 46% 13%
Tolerance and openness to others
QA17.8 For each of these values, please tell me if they are best embodied by Europe, by other countries (or groups of countries) in the world or by both?
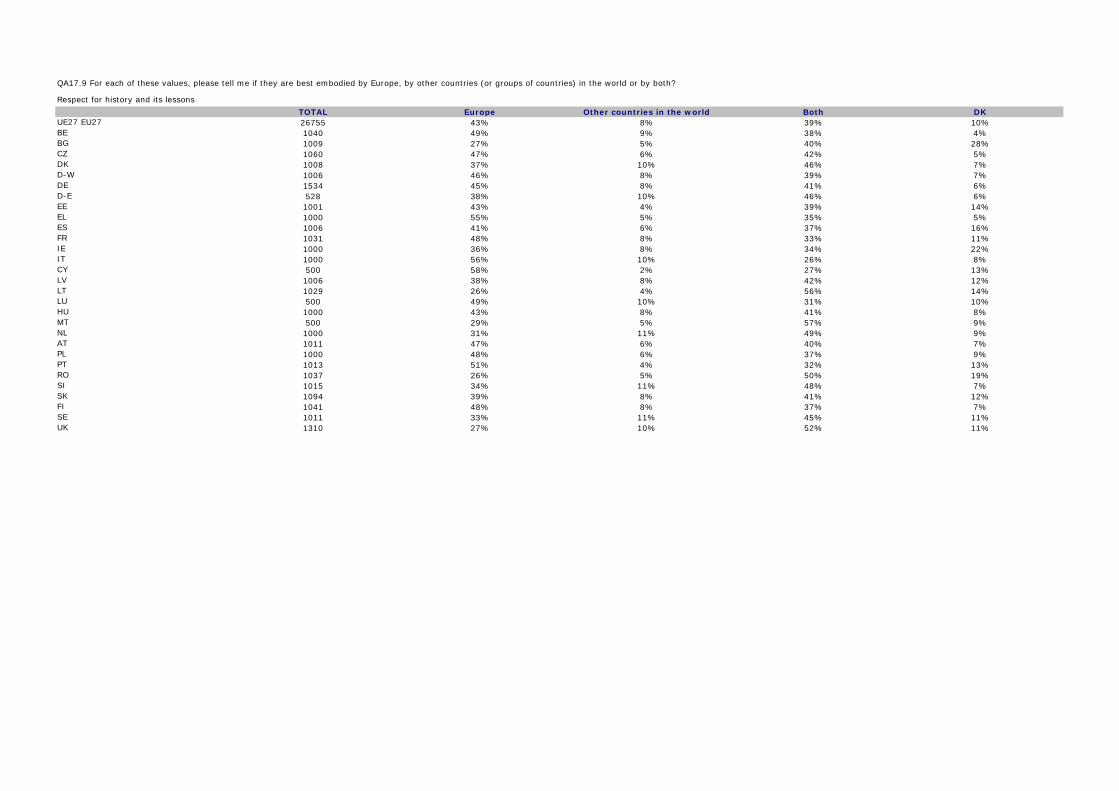
TOTAL Europe Other countries in the world Both DKUE27 EU27 26755 43% 8% 39% 10%BE 1040 49% 9% 38% 4%BG 1009 27% 5% 40% 28%CZ 1060 47% 6% 42% 5%DK 1008 37% 10% 46% 7%D-W 1006 46% 8% 39% 7%DE 1534 45% 8% 41% 6%D-E 528 38% 10% 46% 6%EE 1001 43% 4% 39% 14%EL 1000 55% 5% 35% 5%ES 1006 41% 6% 37% 16%FR 1031 48% 8% 33% 11%IE 1000 36% 8% 34% 22%IT 1000 56% 10% 26% 8%CY 500 58% 2% 27% 13%LV 1006 38% 8% 42% 12%LT 1029 26% 4% 56% 14%LU 500 49% 10% 31% 10%HU 1000 43% 8% 41% 8%MT 500 29% 5% 57% 9%NL 1000 31% 11% 49% 9%AT 1011 47% 6% 40% 7%PL 1000 48% 6% 37% 9%PT 1013 51% 4% 32% 13%RO 1037 26% 5% 50% 19%SI 1015 34% 11% 48% 7%SK 1094 39% 8% 41% 12%FI 1041 48% 8% 37% 7%SE 1011 33% 11% 45% 11%UK 1310 27% 10% 52% 11%
Respect for history and its lessons
QA17.9 For each of these values, please tell me if they are best embodied by Europe, by other countries (or groups of countries) in the world or by both?
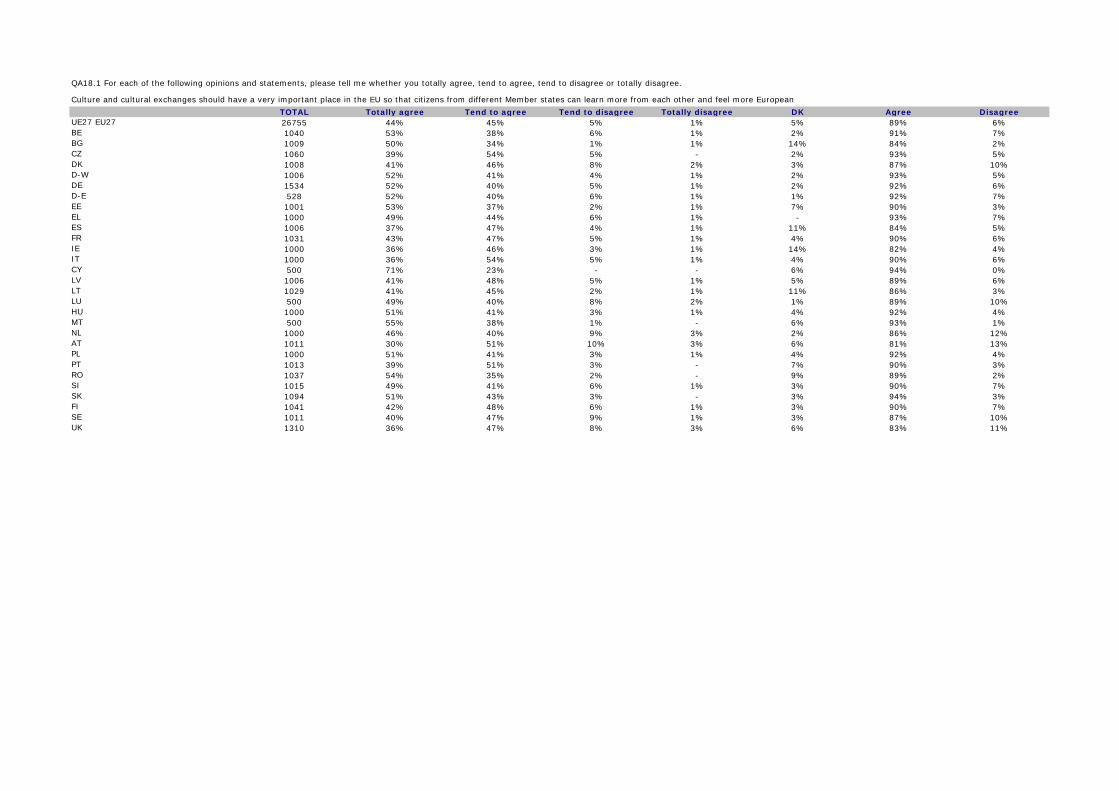
TOTAL Totally agree Tend to agree Tend to disagree Totally disagree DK Agree DisagreeUE27 EU27 26755 44% 45% 5% 1% 5% 89% 6%BE 1040 53% 38% 6% 1% 2% 91% 7%BG 1009 50% 34% 1% 1% 14% 84% 2%CZ 1060 39% 54% 5% - 2% 93% 5%DK 1008 41% 46% 8% 2% 3% 87% 10%D-W 1006 52% 41% 4% 1% 2% 93% 5%DE 1534 52% 40% 5% 1% 2% 92% 6%D-E 528 52% 40% 6% 1% 1% 92% 7%EE 1001 53% 37% 2% 1% 7% 90% 3%EL 1000 49% 44% 6% 1% - 93% 7%ES 1006 37% 47% 4% 1% 11% 84% 5%FR 1031 43% 47% 5% 1% 4% 90% 6%IE 1000 36% 46% 3% 1% 14% 82% 4%IT 1000 36% 54% 5% 1% 4% 90% 6%CY 500 71% 23% - - 6% 94% 0%LV 1006 41% 48% 5% 1% 5% 89% 6%LT 1029 41% 45% 2% 1% 11% 86% 3%LU 500 49% 40% 8% 2% 1% 89% 10%HU 1000 51% 41% 3% 1% 4% 92% 4%MT 500 55% 38% 1% - 6% 93% 1%NL 1000 46% 40% 9% 3% 2% 86% 12%AT 1011 30% 51% 10% 3% 6% 81% 13%PL 1000 51% 41% 3% 1% 4% 92% 4%PT 1013 39% 51% 3% - 7% 90% 3%RO 1037 54% 35% 2% - 9% 89% 2%SI 1015 49% 41% 6% 1% 3% 90% 7%SK 1094 51% 43% 3% - 3% 94% 3%FI 1041 42% 48% 6% 1% 3% 90% 7%SE 1011 40% 47% 9% 1% 3% 87% 10%UK 1310 36% 47% 8% 3% 6% 83% 11%
Culture and cultural exchanges should have a very important place in the EU so that citizens from different Member states can learn more from each other and feel more European
QA18.1 For each of the following opinions and statements, please tell me whether you totally agree, tend to agree, tend to disagree or totally disagree.
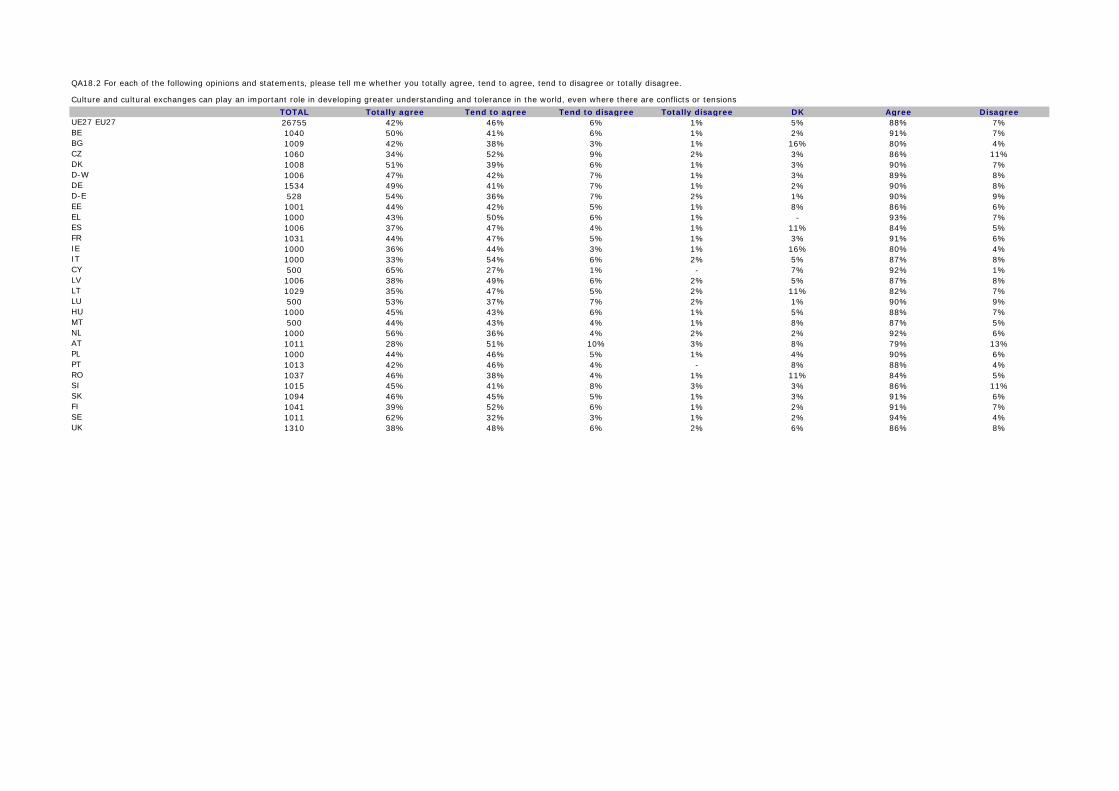
TOTAL Totally agree Tend to agree Tend to disagree Totally disagree DK Agree DisagreeUE27 EU27 26755 42% 46% 6% 1% 5% 88% 7%BE 1040 50% 41% 6% 1% 2% 91% 7%BG 1009 42% 38% 3% 1% 16% 80% 4%CZ 1060 34% 52% 9% 2% 3% 86% 11%DK 1008 51% 39% 6% 1% 3% 90% 7%D-W 1006 47% 42% 7% 1% 3% 89% 8%DE 1534 49% 41% 7% 1% 2% 90% 8%D-E 528 54% 36% 7% 2% 1% 90% 9%EE 1001 44% 42% 5% 1% 8% 86% 6%EL 1000 43% 50% 6% 1% - 93% 7%ES 1006 37% 47% 4% 1% 11% 84% 5%FR 1031 44% 47% 5% 1% 3% 91% 6%IE 1000 36% 44% 3% 1% 16% 80% 4%IT 1000 33% 54% 6% 2% 5% 87% 8%CY 500 65% 27% 1% - 7% 92% 1%LV 1006 38% 49% 6% 2% 5% 87% 8%LT 1029 35% 47% 5% 2% 11% 82% 7%LU 500 53% 37% 7% 2% 1% 90% 9%HU 1000 45% 43% 6% 1% 5% 88% 7%MT 500 44% 43% 4% 1% 8% 87% 5%NL 1000 56% 36% 4% 2% 2% 92% 6%AT 1011 28% 51% 10% 3% 8% 79% 13%PL 1000 44% 46% 5% 1% 4% 90% 6%PT 1013 42% 46% 4% - 8% 88% 4%RO 1037 46% 38% 4% 1% 11% 84% 5%SI 1015 45% 41% 8% 3% 3% 86% 11%SK 1094 46% 45% 5% 1% 3% 91% 6%FI 1041 39% 52% 6% 1% 2% 91% 7%SE 1011 62% 32% 3% 1% 2% 94% 4%UK 1310 38% 48% 6% 2% 6% 86% 8%
Culture and cultural exchanges can play an important role in developing greater understanding and tolerance in the world, even where there are conflicts or tensions
QA18.2 For each of the following opinions and statements, please tell me whether you totally agree, tend to agree, tend to disagree or totally disagree.
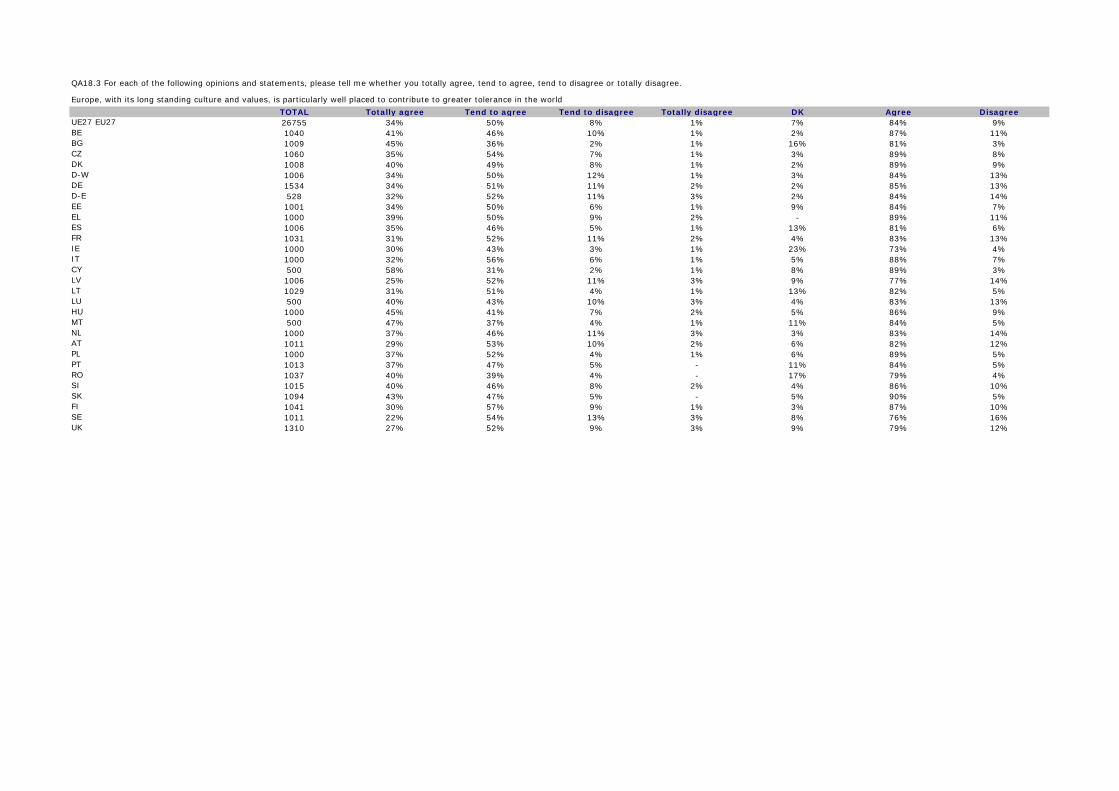
TOTAL Totally agree Tend to agree Tend to disagree Totally disagree DK Agree DisagreeUE27 EU27 26755 34% 50% 8% 1% 7% 84% 9%BE 1040 41% 46% 10% 1% 2% 87% 11%BG 1009 45% 36% 2% 1% 16% 81% 3%CZ 1060 35% 54% 7% 1% 3% 89% 8%DK 1008 40% 49% 8% 1% 2% 89% 9%D-W 1006 34% 50% 12% 1% 3% 84% 13%DE 1534 34% 51% 11% 2% 2% 85% 13%D-E 528 32% 52% 11% 3% 2% 84% 14%EE 1001 34% 50% 6% 1% 9% 84% 7%EL 1000 39% 50% 9% 2% - 89% 11%ES 1006 35% 46% 5% 1% 13% 81% 6%FR 1031 31% 52% 11% 2% 4% 83% 13%IE 1000 30% 43% 3% 1% 23% 73% 4%IT 1000 32% 56% 6% 1% 5% 88% 7%CY 500 58% 31% 2% 1% 8% 89% 3%LV 1006 25% 52% 11% 3% 9% 77% 14%LT 1029 31% 51% 4% 1% 13% 82% 5%LU 500 40% 43% 10% 3% 4% 83% 13%HU 1000 45% 41% 7% 2% 5% 86% 9%MT 500 47% 37% 4% 1% 11% 84% 5%NL 1000 37% 46% 11% 3% 3% 83% 14%AT 1011 29% 53% 10% 2% 6% 82% 12%PL 1000 37% 52% 4% 1% 6% 89% 5%PT 1013 37% 47% 5% - 11% 84% 5%RO 1037 40% 39% 4% - 17% 79% 4%SI 1015 40% 46% 8% 2% 4% 86% 10%SK 1094 43% 47% 5% - 5% 90% 5%FI 1041 30% 57% 9% 1% 3% 87% 10%SE 1011 22% 54% 13% 3% 8% 76% 16%UK 1310 27% 52% 9% 3% 9% 79% 12%
Europe, with its long standing culture and values, is particularly well placed to contribute to greater tolerance in the world
QA18.3 For each of the following opinions and statements, please tell me whether you totally agree, tend to agree, tend to disagree or totally disagree.
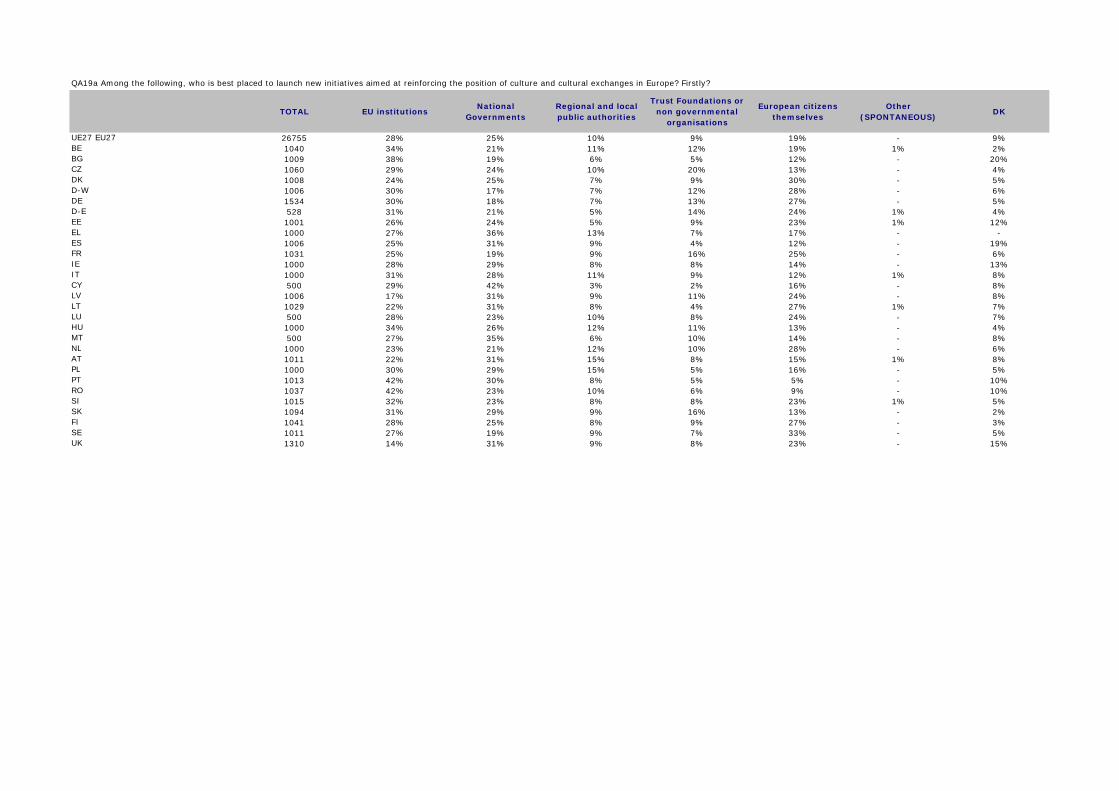
TOTAL EU institutionsNational
GovernmentsRegional and local public authorities
Trust Foundations or non governmental
organisations
European citizens themselves
Other (SPONTANEOUS)
DK
UE27 EU27 26755 28% 25% 10% 9% 19% - 9%BE 1040 34% 21% 11% 12% 19% 1% 2%BG 1009 38% 19% 6% 5% 12% - 20%CZ 1060 29% 24% 10% 20% 13% - 4%DK 1008 24% 25% 7% 9% 30% - 5%D-W 1006 30% 17% 7% 12% 28% - 6%DE 1534 30% 18% 7% 13% 27% - 5%D-E 528 31% 21% 5% 14% 24% 1% 4%EE 1001 26% 24% 5% 9% 23% 1% 12%EL 1000 27% 36% 13% 7% 17% - - ES 1006 25% 31% 9% 4% 12% - 19%FR 1031 25% 19% 9% 16% 25% - 6%IE 1000 28% 29% 8% 8% 14% - 13%IT 1000 31% 28% 11% 9% 12% 1% 8%CY 500 29% 42% 3% 2% 16% - 8%LV 1006 17% 31% 9% 11% 24% - 8%LT 1029 22% 31% 8% 4% 27% 1% 7%LU 500 28% 23% 10% 8% 24% - 7%HU 1000 34% 26% 12% 11% 13% - 4%MT 500 27% 35% 6% 10% 14% - 8%NL 1000 23% 21% 12% 10% 28% - 6%AT 1011 22% 31% 15% 8% 15% 1% 8%PL 1000 30% 29% 15% 5% 16% - 5%PT 1013 42% 30% 8% 5% 5% - 10%RO 1037 42% 23% 10% 6% 9% - 10%SI 1015 32% 23% 8% 8% 23% 1% 5%SK 1094 31% 29% 9% 16% 13% - 2%FI 1041 28% 25% 8% 9% 27% - 3%SE 1011 27% 19% 9% 7% 33% - 5%UK 1310 14% 31% 9% 8% 23% - 15%
QA19a Among the following, who is best placed to launch new initiatives aimed at reinforcing the position of culture and cultural exchanges in Europe? Firstly?

TOTAL EU institutionsNational
GovernmentsRegional and local public authorities
Trust Foundations or non governmental
organisations
European citizens themselves
Other (SPONTANEOUS)
DK
UE27 EU27 24428 18% 27% 17% 15% 19% - 4%BE 1017 18% 27% 18% 16% 19% 1% 1%BG 805 20% 33% 12% 10% 22% - 3%CZ 1022 19% 19% 16% 24% 19% - 3%DK 960 18% 25% 17% 18% 19% - 3%D-W 947 18% 26% 15% 20% 19% 1% 1%DE 1449 17% 27% 15% 20% 19% 1% 1%D-E 505 16% 27% 13% 22% 19% 1% 2%EE 882 17% 33% 13% 12% 19% - 6%EL 998 17% 29% 18% 13% 23% - - ES 817 20% 31% 12% 11% 17% 2% 7%FR 968 18% 19% 16% 16% 25% - 6%IE 873 19% 32% 15% 11% 18% 1% 4%IT 915 20% 30% 17% 16% 13% 1% 3%CY 462 28% 25% 18% 4% 24% - 1%LV 922 17% 25% 14% 16% 24% - 4%LT 952 22% 32% 16% 7% 19% - 4%LU 466 15% 22% 16% 14% 27% 1% 5%HU 958 19% 30% 16% 17% 15% - 3%MT 458 19% 27% 11% 12% 28% - 3%NL 942 16% 26% 21% 17% 16% 1% 3%AT 931 18% 30% 19% 12% 18% 1% 2%PL 949 17% 27% 21% 12% 20% - 3%PT 915 24% 35% 14% 16% 9% - 2%RO 932 16% 32% 20% 11% 17% 1% 3%SI 966 22% 24% 14% 13% 22% 1% 4%SK 1072 16% 24% 14% 21% 23% - 2%FI 1005 17% 23% 17% 17% 22% 1% 3%SE 961 18% 25% 16% 18% 20% - 3%UK 1111 16% 24% 20% 13% 21% - 6%
QA19b And secondly?

TOTAL EU institutionsNational
GovernmentsRegional and local public authorities
Trust Foundations or non governmental
organisations
European citizens themselves
Other (SPONTANEOUS)
DK
UE27 EU27 26755 44% 50% 25% 23% 37% 1% 9%BE 1040 51% 48% 28% 28% 38% 1% 2%BG 1009 54% 46% 15% 13% 29% 0% 20%CZ 1060 47% 43% 25% 43% 31% - 4%DK 1008 41% 48% 24% 26% 48% 1% 5%D-W 1006 46% 42% 21% 31% 46% 1% 6%DE 1534 46% 43% 21% 32% 45% 1% 6%D-E 528 46% 47% 18% 35% 42% 1% 4%EE 1001 41% 53% 17% 20% 40% 1% 12%EL 1000 44% 65% 30% 20% 40% 0% 0%ES 1006 41% 55% 19% 13% 26% 2% 19%FR 1031 41% 38% 24% 30% 48% 1% 6%IE 1000 44% 56% 22% 18% 29% 1% 13%IT 1000 50% 55% 26% 24% 24% 1% 8%CY 500 54% 65% 20% 6% 38% 0% 8%LV 1006 33% 54% 22% 25% 46% - 8%LT 1029 42% 60% 23% 11% 44% 1% 7%LU 500 42% 43% 25% 21% 49% 1% 7%HU 1000 52% 55% 28% 26% 28% 0% 4%MT 500 45% 59% 16% 21% 40% 0% 8%NL 1000 38% 45% 31% 27% 43% 1% 6%AT 1011 39% 58% 33% 19% 32% 2% 8%PL 1000 46% 55% 35% 15% 36% 0% 5%PT 1013 64% 62% 20% 19% 13% - 10%RO 1037 57% 52% 28% 16% 24% 1% 10%SI 1015 53% 45% 21% 20% 45% 3% 5%SK 1094 46% 52% 22% 37% 35% - 2%FI 1041 44% 48% 24% 25% 48% 1% 3%SE 1011 44% 44% 24% 24% 52% 1% 5%UK 1310 26% 51% 26% 19% 41% 0% 15%
QA19 - Best placed to launch new initiatives - TOTAL
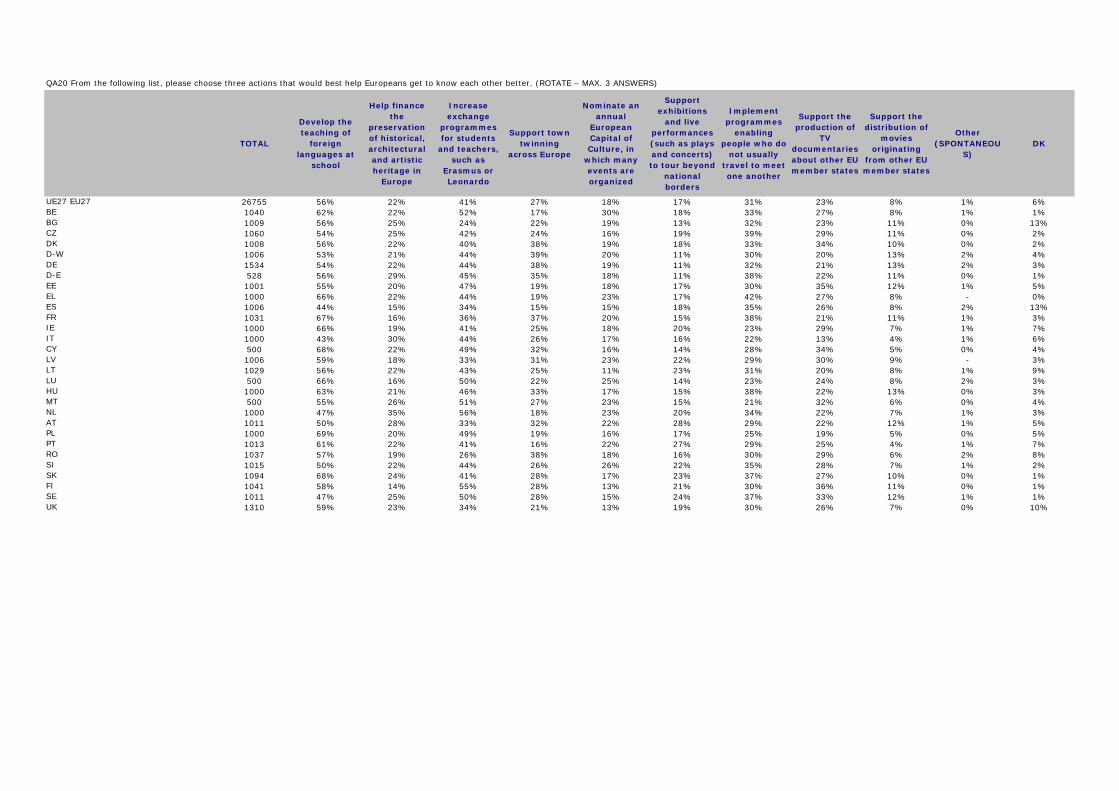
TOTAL
Develop the teaching of
foreign languages at
school
Help finance the
preservation of historical, architectural and artistic heritage in
Europe
Increase exchange
programmes for students
and teachers, such as
Erasmus or Leonardo
Support town twinning
across Europe
Nominate an annual
European Capital of Culture, in
which many events are organized
Support exhibitions
and live performances (such as plays and concerts) to tour beyond
national borders
Implement programmes
enabling people who do
not usually travel to meet one another
Support the production of
TV documentaries about other EU member states
Support the distribution of
movies originating
from other EU member states
Other (SPONTANEOU
S) DK
UE27 EU27 26755 56% 22% 41% 27% 18% 17% 31% 23% 8% 1% 6%BE 1040 62% 22% 52% 17% 30% 18% 33% 27% 8% 1% 1%BG 1009 56% 25% 24% 22% 19% 13% 32% 23% 11% 0% 13%CZ 1060 54% 25% 42% 24% 16% 19% 39% 29% 11% 0% 2%DK 1008 56% 22% 40% 38% 19% 18% 33% 34% 10% 0% 2%D-W 1006 53% 21% 44% 39% 20% 11% 30% 20% 13% 2% 4%DE 1534 54% 22% 44% 38% 19% 11% 32% 21% 13% 2% 3%D-E 528 56% 29% 45% 35% 18% 11% 38% 22% 11% 0% 1%EE 1001 55% 20% 47% 19% 18% 17% 30% 35% 12% 1% 5%EL 1000 66% 22% 44% 19% 23% 17% 42% 27% 8% - 0%ES 1006 44% 15% 34% 15% 15% 18% 35% 26% 8% 2% 13%FR 1031 67% 16% 36% 37% 20% 15% 38% 21% 11% 1% 3%IE 1000 66% 19% 41% 25% 18% 20% 23% 29% 7% 1% 7%IT 1000 43% 30% 44% 26% 17% 16% 22% 13% 4% 1% 6%CY 500 68% 22% 49% 32% 16% 14% 28% 34% 5% 0% 4%LV 1006 59% 18% 33% 31% 23% 22% 29% 30% 9% - 3%LT 1029 56% 22% 43% 25% 11% 23% 31% 20% 8% 1% 9%LU 500 66% 16% 50% 22% 25% 14% 23% 24% 8% 2% 3%HU 1000 63% 21% 46% 33% 17% 15% 38% 22% 13% 0% 3%MT 500 55% 26% 51% 27% 23% 15% 21% 32% 6% 0% 4%NL 1000 47% 35% 56% 18% 23% 20% 34% 22% 7% 1% 3%AT 1011 50% 28% 33% 32% 22% 28% 29% 22% 12% 1% 5%PL 1000 69% 20% 49% 19% 16% 17% 25% 19% 5% 0% 5%PT 1013 61% 22% 41% 16% 22% 27% 29% 25% 4% 1% 7%RO 1037 57% 19% 26% 38% 18% 16% 30% 29% 6% 2% 8%SI 1015 50% 22% 44% 26% 26% 22% 35% 28% 7% 1% 2%SK 1094 68% 24% 41% 28% 17% 23% 37% 27% 10% 0% 1%FI 1041 58% 14% 55% 28% 13% 21% 30% 36% 11% 0% 1%SE 1011 47% 25% 50% 28% 15% 24% 37% 33% 12% 1% 1%UK 1310 59% 23% 34% 21% 13% 19% 30% 26% 7% 0% 10%
QA20 From the following list, please choose three actions that would best help Europeans get to know each other better. (ROTATE – MAX. 3 ANSWERS)
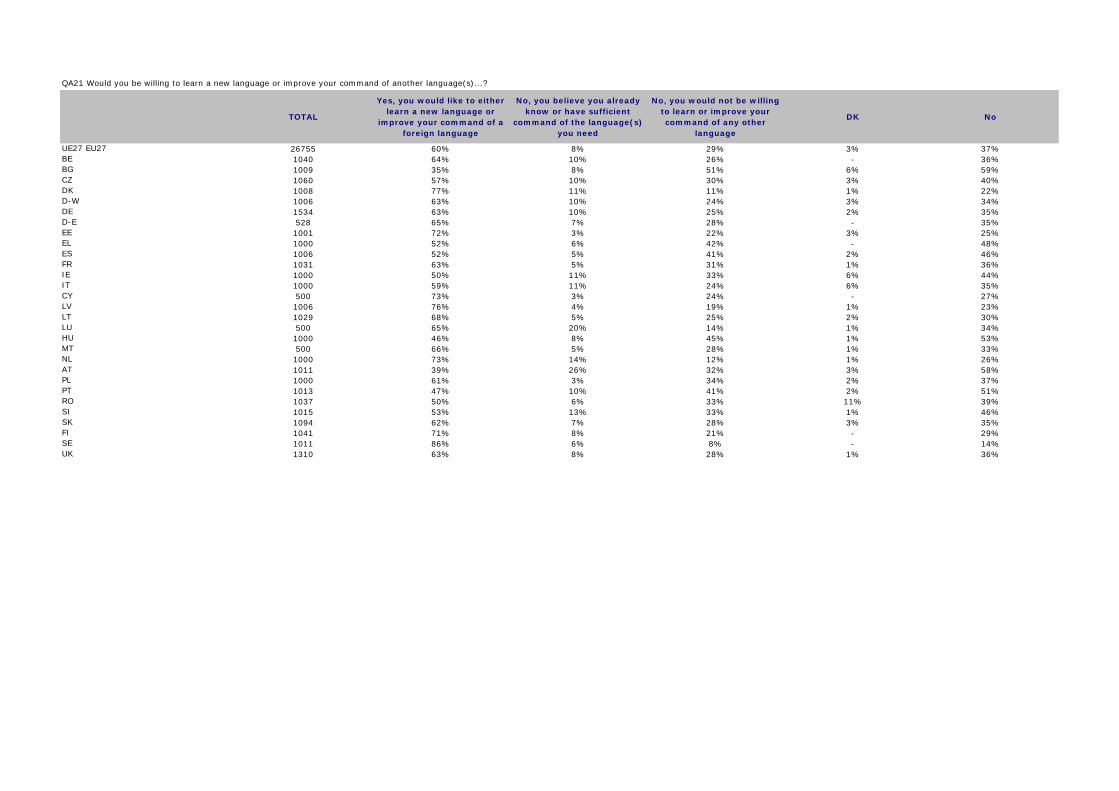
TOTAL
Yes, you would like to either learn a new language or
improve your command of a foreign language
No, you believe you already know or have sufficient
command of the language(s) you need
No, you would not be willing to learn or improve your command of any other
language
DK No
UE27 EU27 26755 60% 8% 29% 3% 37%BE 1040 64% 10% 26% - 36%BG 1009 35% 8% 51% 6% 59%CZ 1060 57% 10% 30% 3% 40%DK 1008 77% 11% 11% 1% 22%D-W 1006 63% 10% 24% 3% 34%DE 1534 63% 10% 25% 2% 35%D-E 528 65% 7% 28% - 35%EE 1001 72% 3% 22% 3% 25%EL 1000 52% 6% 42% - 48%ES 1006 52% 5% 41% 2% 46%FR 1031 63% 5% 31% 1% 36%IE 1000 50% 11% 33% 6% 44%IT 1000 59% 11% 24% 6% 35%CY 500 73% 3% 24% - 27%LV 1006 76% 4% 19% 1% 23%LT 1029 68% 5% 25% 2% 30%LU 500 65% 20% 14% 1% 34%HU 1000 46% 8% 45% 1% 53%MT 500 66% 5% 28% 1% 33%NL 1000 73% 14% 12% 1% 26%AT 1011 39% 26% 32% 3% 58%PL 1000 61% 3% 34% 2% 37%PT 1013 47% 10% 41% 2% 51%RO 1037 50% 6% 33% 11% 39%SI 1015 53% 13% 33% 1% 46%SK 1094 62% 7% 28% 3% 35%FI 1041 71% 8% 21% - 29%SE 1011 86% 6% 8% - 14%UK 1310 63% 8% 28% 1% 36%
QA21 Would you be willing to learn a new language or improve your command of another language(s)...?

TOTAL
To be able to get
along with basic needs
when on holiday abroad
To use at work
(including travelling abroad on business)
To be able to study in
another country
To be able to work in another country
To get a better job in (OUR
COUNTRY)
For personal
satisfaction
To keep up knowledge
of a language spoken by my family
To meet people
from other countries
To be able to
understand people
from other cultures
To be able to read
books and newspapers, or watch movies and
TV programme
s in another
language
To feel more
European
Other (SPONTANE
OUS)DK
UE27 EU27 16026 52% 28% 9% 25% 19% 51% 6% 31% 37% 17% 9% 1% 1%BE 663 62% 31% 7% 17% 18% 63% 10% 39% 44% 23% 9% 1% - BG 353 19% 33% 15% 46% 25% 37% 2% 27% 27% 14% 16% 0% 1%CZ 604 44% 36% 12% 36% 19% 43% 3% 28% 42% 11% 7% 0% - DK 778 48% 35% 13% 28% 21% 66% 10% 48% 52% 26% 9% 0% 0%D-W 633 66% 31% 7% 24% 16% 42% 10% 40% 41% 23% 14% 1% 1%DE 970 66% 33% 7% 25% 17% 40% 9% 39% 40% 22% 12% 1% 1%D-E 341 66% 40% 6% 29% 22% 33% 2% 39% 39% 16% 6% 1% 0%EE 719 55% 46% 21% 39% 34% 46% 4% 40% 47% 34% 16% 0% 1%EL 515 36% 19% 10% 13% 24% 61% 1% 32% 34% 19% 5% - - ES 521 41% 23% 8% 15% 17% 63% 3% 19% 25% 12% 4% 1% 2%FR 651 51% 28% 7% 27% 15% 59% 8% 40% 42% 15% 10% 1% - IE 500 60% 19% 10% 23% 13% 50% 5% 25% 30% 12% 9% 1% 1%IT 595 42% 24% 9% 16% 19% 54% 3% 17% 32% 7% 5% 1% 1%CY 366 59% 38% 15% 20% 17% 68% 5% 24% 45% 22% 8% 0% 0%LV 764 29% 36% 14% 26% 29% 37% 4% 29% 22% 21% 7% 1% 0%LT 703 34% 29% 14% 36% 30% 40% 3% 37% 35% 27% 14% - 0%LU 325 51% 27% 9% 14% 15% 68% 11% 40% 42% 25% 15% 1% - HU 456 40% 42% 15% 37% 42% 38% 3% 24% 31% 26% 13% 2% - MT 330 52% 21% 10% 15% 9% 71% 3% 22% 32% 26% 5% 0% - NL 731 67% 29% 9% 18% 11% 50% 8% 36% 42% 23% 5% 2% 0%AT 395 54% 30% 17% 25% 29% 56% 5% 34% 57% 22% 6% 1% 0%PL 615 60% 27% 12% 42% 34% 48% 5% 30% 25% 16% 14% 1% 0%PT 480 45% 23% 12% 20% 22% 52% 6% 18% 31% 20% 8% 1% 1%RO 522 35% 39% 18% 47% 40% 45% 6% 26% 24% 22% 13% 0% 0%SI 538 49% 30% 14% 22% 29% 64% 6% 24% 30% 28% 8% 2% - SK 677 47% 42% 16% 44% 35% 38% 4% 31% 40% 29% 16% 1% 0%FI 741 55% 34% 8% 18% 13% 53% 6% 39% 40% 30% 6% 1% - SE 868 62% 36% 8% 28% 15% 61% 6% 49% 47% 32% 5% 0% 0%UK 829 52% 19% 8% 21% 11% 49% 7% 31% 45% 11% 8% 1% 0%
(IF 'WILLING TO LEARN A NEW LANGUAGE', CODE 1 IN QA21)
QA22 What would be your main reasons for learning or improving another language? (MULTIPLE ANSWERS POSSIBLE)