european commission competing in global value chains
TRANSCRIPT
Enterpriseand Industry
Competing inGlobal Value Chains
EU Industrial Structure Report 2013
ISSN 1831-3043

EU Industrial Structure Report 2013
Competing in Global Value Chains
Cover picture: Fotolia_3011203_L© yang yu This publication was prepared in the Directorate-General for Enterprise and Industry, Unit A5 "Economic Analysis and Impact Assessment" by Konstantin Pashev, Mats Marcusson, Neil Kay, Paolo Casini and Johannes Schneider under the overall supervision of Didier Herbert, Acting Director of the Directorate for Industrial Policy and Economic Analysis and Daniel Calleja Crespo, Director-General for Enterprise and Industry. Statistical support was provided by Luigi Cipriani; technical and administrative support was provided by Elizabeth Catzel, Marietta Todorova and Patricia Carbajosa. Editing by Mark Osborne of the Commission’s Directorate-General for Translation is greatly appreciated. The final report has benefitted from many comments and suggestions from colleagues in DG Enterprise and Industry, whose contributions are gratefully acknowledged. The report and related materials can be downloaded at: http://ec.europa.eu/enterprise/policies/industrial-competitiveness/competitiveness-analysis/eu-industrial-structure/index_en.htm Comments would be gratefully received: By e-mail to: [email protected] Or by mail to: Directorate-General for Enterprise and Industry
Unit A5 - Economic Analysis and Impact Assessment Unit BREY 06/181 European Commission B - 1049 Brussels (Belgium)
This publication is financed under the Competitiveness and Innovation Framework Programme (CIP) which aims to encourage the competitiveness of European enterprises. More information on the European Union is available on the Internet (http://europa.eu). Cataloguing data can be found at the end of this publication. Luxembourg: Publications Office of the European Union, 2013 ISBN 978-92-79-33972-1 ISSN 1831-3043 doi 10.2769/88487 Catalogue Number NB-BL-13-001-EN-C © European Union, 2013 Reproduction is authorised, provided the source is acknowledged, save where otherwise stated. For use/reproduction of third-party copyright material specified as such permission must be obtained from the copyright holder(s). Legal notice: Neither the European Commission nor any person acting on its behalf may be held responsible for the use to which information contained in this publication may be put, nor for any errors which may appear despite careful preparation and checking. The publication does not necessarily reflect the view or the position of the European Union. Luxembourg, Office for Official Publications of the European Union, 2013.
Printed in Luxembourg

3
Table of Contents
OVERVIEW........................................................................................................................................5
EXECUTIVE SUMMARY......................................................................................................................7
Chapter 1. EU INDUSTRY – A FRAGILE RECOVERY......................................................................11
1.1. Manufacturing recovery remains fragile.........................................................................11
1.2. The recovery of EU services...........................................................................................14
Chapter 2. CHANGES IN THE EU'S INDUSTRIAL STRUCTURE.......................................................17
2.1. Changes in manufacturing output and employment .......................................................17
2.2. Sector specialisation in the EU .......................................................................................22
2.3. Size distribution of enterprises........................................................................................27
2.4. Inter-linkages between manufacturing and services .......................................................27
2.5. Focus on the tourism sector ............................................................................................31
Chapter 3. EU INDUSTRIAL PRODUCTIVITY.................................................................................35
3.1. Output and employment growth in the EU .....................................................................35
3.1.1. Output ......................................................................................................................35
3.1.2. Employment.............................................................................................................37
3.2. Labour costs and productivity.........................................................................................42
3.2.1. Labour productivity .................................................................................................42
3.2.2. Unit labour costs ......................................................................................................45
3.2.3. Relative prices .........................................................................................................47
3.3. Energy and material intensity of EU industrial sectors...................................................47
3.3.1. Energy......................................................................................................................47
3.3.2. Raw materials ..........................................................................................................48
3.4. Skills and technology......................................................................................................51
3.4.1. Human capital..........................................................................................................51
3.4.2. Technology ..............................................................................................................52
3.5. Investment.......................................................................................................................61
3.5.1. Private consumption ................................................................................................62

4
3.5.2. Physical capital ........................................................................................................63
Chapter 4. INTERNATIONAL COMPETITIVENESS OF THE EU INDUSTRY......................................67
4.1. The EU in global trade....................................................................................................67
4.1.1. Manufactured goods ................................................................................................67
4.1.2. Services....................................................................................................................69
4.2. The EU industries' market shares and comparative advantages .....................................69
4.2.1. Manufacturing .........................................................................................................69
4.2.2. Services....................................................................................................................74
4.3. Sophistication and exclusivity of EU exports .................................................................77
4.4. EU industries in global value chains...............................................................................83
4.5. Foreign direct investment (FDI) .....................................................................................91
References .................................................................................................................................95
Annexes .....................................................................................................................................98
A.1 Statistical nomenclature......................................................................................................98
A.2 List of abbreviations .........................................................................................................110
5
OVERVIEW
TThhee EEUU IInndduussttrriiaall SSttrruuccttuurree RReeppoorrtt aaiimmss ttoo ssaattiissffyy tthhee iinnccrreeaassiinngg nneeeedd ffoorr aannaallyyssiiss ooff EEUU ccoommppeettiittiivveenneessss aatt sseeccttoorraall lleevveell.. IItt aannaallyysseess tthhee ppeerrffoorrmmaannccee ooff EEUU iinndduussttrriiaall aanndd sseerrvviiccee sseeccttoorrss iinn tteerrmmss ooff pprroodduuccttiivviittyy aanndd iittss uunnddeerrllyyiinngg ddrriivveerrss,, tthhee rreessuullttaanntt cchhaannggeess ttoo iinndduussttrriiaall aanndd eexxppoorrtt ssppeecciiaalliizzaattiioonn,, ccoommppaarraattiivvee aaddvvaannttaaggeess aatt EEUU aanndd nnaattiioonnaall lleevveell,, aanndd tthhee ppoossiittiioonn ooff tthhee EEUU iinn iinnccrreeaassiinnggllyy gglloobbaall vvaalluuee cchhaaiinnss.. TThhiiss eeddiittiioonn aallssoo llooookkss aatt tthhee iimmppaacctt ooff tthhee ccrriissiiss aanndd tthhee ddiiffffiiccuulltt rreeccoovveerryy oonn lloonngg--tteerrmm ssttrruuccttuurraall ttrreennddss..
TThhee ppuubblliiccaattiioonn iiss iinntteennddeedd ttoo bbee uusseedd bbyy eeccoonnoommiissttss aanndd ppoolliiccyy mmaakkeerrss iinn tthhee EEUU aanndd MMeemmbbeerr SSttaatteess oorr aannyyoonnee oouuttssiiddee tthhee EEUU iinntteerreesstteedd iinn tthhee ssttrruuccttuurree aanndd ppeerrffoorrmmaannccee ooff EEUU iinndduussttrriieess..11 IItt mmaayy aallssoo bbee uusseeffuull ttoo aaccaaddeemmiiccss,, jjoouurrnnaalliissttss,, oorrggaanniissaattiioonnss aanndd cciittiizzeennss iinntteerreesstteedd iinn ddiiffffeerreenntt aassppeeccttss ooff tthhee EEUU eeccoonnoommyy ffrroomm aa sseeccttoorraall ppeerrssppeeccttiivvee..
This year’s report contains for the third time a chapter dedicated to the impact of the crisis and the state of industrial recovery. The conclusions in Chapter 1 are based on short-term indicators and may be taken as preliminary. The previous (2011) edition of this report expressed some optimism that most industries had passed their troughs and were starting to recover. This optimism turned out to be premature as the EU industries slid into a second dip in 2012-2013. More recently there have been tentative signs of a pick-up in demand but industrial recovery still remains uncertain.
Chapter 2 analyses developments in the industrial structure of the EU. The chapter begins with an examination of changes in manufacturing output and employment. This includes an analysis of sector changes at member state, EU and international level, taking into account the long-term shift from manufacturing to services and the degree of specialisation in member state economies. The second section of the chapter goes deeper into sector specialisation at member state and EU level, including medium-term developments, while the third section provides a breakdown at sector level of the distribution of enterprises in terms of size and value added. The fourth section describes the interlinkages between manufacturing and
_____________ 1. Throughout this analysis, the term ‘industries’ is used
interchangeably with ‘sectors’ unless otherwise specified.
services, drawing upon statistics from the World Input Output Database (WIOD). This includes a description of the increasing interdependence between manufacturing and services and the relative dependence of manufacturing production on domestic and foreign services inputs. The final section of the chapter focuses specifically on the tourism industry. The section describes the growing importance of tourism as a sector including its indirect benefits for many related sectors. The section also includes an analysis of how the tourism sector was affected by the crisis, which, in particular, indicates that there was a degree of substitution between foreign and domestic tourism.
Chapter 3 studies industrial productivity. It starts by analysing patterns of output and employment growth in the EU, indicating that high-tech and services industries outperformed the rest of the economy. The subsequent sections assess EU industrial competitiveness via the main factors of production: labour, materials, energy, human capital and technology. The main insight from this analysis is that high-tech and knowledge intensive industries have provided the strongest impulse to economic recovery: they are more productive, less energy intensive and more innovative. The final section focuses on investments, taking into account both the demand and supply side. The analysis of consumption patterns shows a clear decline in the demand for manufactured

6
products in favour of services. Similarly, the highest investment growth is observable in intangible assets.
Chapter 4 assesses the external side of EU industry including trade links and competitiveness. The chapter starts with an analysis of the global trade nexus, looking at the structure of exports to the world for both goods and services and medium-term developments. The following section goes into a deeper sector level analysis, analysing the importance of various trade factors per sector. The section concludes with a sector level analysis of competitiveness across manufacturing and services industries based on measures of revealed comparative advantage (RCA). The following section broadens the analysis of competitiveness to technological competitiveness presenting figures of revealed comparative advantage for increasing levels of technological intensity. The third section analyses the complexity of exports across sectors, and relates complexity scores to industry performance and the productive structures and capabilities of countries. This analysis covers EU exports and those of its international competitors. The fourth section examines the position of EU industries in global value chains. The section draws upon data from the World Input Output Database (WIOD) to analysis the degree of interconnectedness at sector and Member State level in the international supply chains. The section employs trade in value added as a more precise metrics of industrial competitiveness in the global value chain.
The analyses in this publication cover where relevant all sectors: from mining to market and non-market services, as well as the EU Member States and their major established and emerging global competitors. The use of indicators and the level of aggregation in the analyses vary between sectors and countries depending data availability. This does not allow us to compare sectors on the basis of the same set of indicators at the same level of aggregation. It is a consequence of differing statistical definitions, or degrees of detail between sectors such as manufacturing and services and also between different topics such as trade and R&D. Annex A1 presents the statistical nomenclatures used in the report.
Statistics for Croatia, - which joined the EU on July 1, 2013 – are still being incorporated in Eurostat’s databases.2 This process is far from completed at the time of drafting the report. Some indicators used here (including those relating to trade data) are still for the EU-27, while others are for EU-28.
2
http://epp.eurostat.ec.europa.eu/portal/page/portal/croatia_accession/implementation .
7
EXECUTIVE SUMMARY
Industrial outlook has improved but recovery is still weak and fragile
It is not yet possible to assess the full impact of the latest crisis on EU industries – they are still recovering and have, with a few exceptions, still not regained their pre-crisis production levels. Industrial recovery is analysed in Chapter 1 of this report.
The fragile recovery hinted at by positive growth in 2010-2011 was interrupted by a downturn in the business cycle and EU industries experienced a double dip.3 The aggregate of EU manufacturing masks significant differences between Member States. Strong recoveries can be seen in the Baltic States, Poland, Romania and Slovakia, for example, which all have regained and exceeded their pre-recession peaks.
There are also significant differences between sectors. Industries producing consumer staples such as food and beverages, and pharmaceuticals, have fared relatively better than others since the outbreak of the crisis. High-technology manufacturing industries have in general not been impacted to the same extent as other industries. Overall, services have been hit less badly than the construction, manufacturing and mining industries. There are also differences across service industries, however: EU-27 market service industries, information & communication, and real estate activities have not suffered from the financial crisis to the same extent as other service sectors.
3 At the time of the 2011 edition of this report, it was considered
that the first signs of recovery had emerged. Uncertainty and caution has dominated short-term industrial forecasts since then (see DG Enterprise and Industry’s Short-Term Industrial Outlook series for more details) (http://ec.europa.eu/enterprise/policies/industrial-competitiveness/competitiveness-analysis/index_en.htm)
The importance of services in manufacturing is growing
Changes in EU industrial structure are studied in Chapter 2. EU manufacturing declined further to around 15% of overall gross value added in 2012. On average, market services have grown by 1.7 percentage points in the EU overall from between 2000 and 2012 and now make up half of EU GDP. The share of non-market services4 has also increased, reaching 23% in 2012. Pharmaceuticals are the only manufacturing sector which has increased its share of output since 2000.
The growing share of services in GDP is explained by higher income elasticities of demand for services, which tend to shift final demand towards services, as incomes grow over time. Falling relative prices of manufacturing compared to services due to higher productivity growth in manufacturing also tend to reduce the relative share of manufacturing in nominal terms. With respect to employment, the sectoral shift is even more pronounced due to the fact that services are more labour intensive and typically have lower productivity growth.
The shift away from agriculture and manufacturing towards services is a worldwide trend, which has accelerated in the last decade in emerging markets as well. Services was the largest growing sector in the world, between 2000 and 2009, whilst manufacturing declined globally, on average, by around 2.5% over the same period of time. The largest decline occurred in the EU.
Chapter 2 looks as well at the sectors in terms of enterprise size and the share of SME’s. They are socially and economically important as they represent 99% of all enterprises in the EU, have strong growth potential, and are
4 Non-market services comprises branches covering general
public services, non-market services of education and research provided by general government and private non-profit institutions, non-market services of health provided by general government and private non-profit institutions, domestic services and other non-market services.

8
also a major source of new jobs. Nearly two million new SMEs are created annually in the EU. SME’s tend to predominate in sectors which are less capital-intensive, and where economies of scale are not crucial. They are also strongly represented in service industries, for example retail trades, hotels and restaurants as well as business services. In general, SME’s are under-represented in manufacturing, whereas they represent just below 90% of value added in local services such as real estate and environmental remediation. Large enterprises represent more than 80% of value added in industries producing tobacco, oil refining, logistics, motor vehicle, air transport and other transport equipment.
The inter-linkages between manufacturing and services are growing. Manufacturing firms are increasingly using services as part of their business processes. Firms use services in the development of products, in the sale of products, and for horizontal business activities such as accounting and logistics. On the production side, the motivation for using services is often to increase productivity and reduce costs. Manufacturing firms also use services to upgrade the quality of their products for which they charge a premium to customers.
The service content of manufacturing output embodied in domestic final consumption increased on average by more than two per cent between 2000 and 2009 in EU member states. Manufacturing firms’ use of intermediate services has, with one exception, increased across all industries since 1995. Manufacturing is changing from being dominated by machine operators and assembly line workers to a sector which relies more and more on service occupations and service inputs. This shows up in the increased share of employees with services-related occupations, including activities such as R&D, engineering design, software design, market research, marketing, organizational design and after-sales training, maintenance and support services. As manufacturing firms are using more services, they are also
increasingly trying to innovate in the use of services to improve their business.
Tourism has become a key sector of the EU economy. The EU is the number one tourism destination in the world and tourism services create demand for a wide variety of products and services produced by other industries, in both public and private sectors. In 2012, the tourism sector is estimated to have contributed 3% to EU GDP and 3.6% of EU employment. Despite the cyclicality of the tourism sector, the EU tourism industry has shown resilience during the recent crisis and recovered better than many other industries. There is evidence that this has been supported by a degree of switching from extra- to intra-EU tourism.
Productivity gains have been concentrated in high-tech industries Firms try to increase their competitiveness by lowering costs, increasing productivity and innovating products and processes. These efforts spur growth and create employment. However, an analysis of EU economic sectors, over the period 2001-2010 in Chapter 3, shows that industries were not equally successful in making gains. Employment also varied significantly across sectors, with a general decline in manufacturing, in particular in low-tech industries, and an increase in employment in services.
In the aftermath of the latest crisis, EU manufacturing has managed to reduce labour costs and increase productivity. In particular, high-tech industries have been the main engine of growth. They have been more resilient to the negative effect of the financial crisis thanks to higher productivity and limited dependence on energy. Due to the high cost of energy within the EU, the specialization into high-tech and low energy intensive industries is crucial for the strategic positioning of the industries in the global value chain.
9
Manufacturing accounts for a major share of the innovation effort in the EU This translates into above-average contributions to overall productivity growth and thus to real income growth. However, data on patent applications show that many high- and medium-tech industries still perform relatively poorly compared to the world aggregate and, in particular, the US.
The increased interdependence between manufacturing and services implies a ‘carrier function’ of manufacturing for services that might otherwise have limited tradability. This ‘carrier function’ has, furthermore, a stimulus effect on innovation and qualitative upgrading for service activities. Higher productivity growth in manufacturing can spill over to other sectors through the linkages between them. This is particularly important in view of the fact that, in the period 2001-2010, employment grew only in the service industries.
Of course, part of the employment shift from manufacturing to services may be due to the increasing use of outsourced services by manufacturing firms. Tasks that used to be performed in house (like cleaning, marketing etc.) are now frequently outsourced to specialized companies. Yet, the analysis of consumption patterns shows a clear decline of demand for manufactured products in favour of services. Thus, European industries need to adapt to this structural change and make adequate investment choices. Reassuringly, the data suggest that this transformation has started: the largest investment growth in the period 1997-2012 is observable in intangible assets.
The EU remains a leader in global trade
Chapter 4 discusses the external competitiveness of the EU industries using trade and FDI data. The EU, Asia and North America account for 78 % of total world goods exports in 2012. Trade among EU countries (i.e. single-market trade) represented a quarter of world manufactured trade in 2011. By comparison, intra-regional
trade in Asia reached 17 % of world trade and in North America 4 %.
World trade flows mostly involve developed countries. Most high-income countries’ trade takes place with other high-income countries. In all manufacturing sectors except textiles, paper, machinery, electrical equipment and basic metals, half or more of EU-27 exports are to high-income countries.
The highest market shares for EU manufacturing industries are in printing and reproduction of recorded media, tobacco, beverages, pharmaceuticals, paper and paper products and motor vehicles. These are the sectors where the EU has highest revealed comparative advantage and export specialization.China accounts for large portion of EU imports in furniture (58%), leather and footwear (52%), computer, electronic and optical equipment (47%) electrical equipment (45%), clothing (44%), non-metallic mineral products (43%), metal products (42%), other manufacturing (37%), and textiles (36%). China has comparative advantages in both high-tech and low-tech manufactures.
From studying the sectors that dominate Chinese trade and their technological intensity, it may seem that China has become one of the most important trade partners in high-technology goods. However, while it has exported proportionally more technology-intensive goods in recent years, much of the content was imported from developed countries. As confirmed by data on trade in value added, the share of imported high-tech inputs is still higher in China than in the EU especially for high-tech products. Trade in value added is a measurement that takes account of the fact that intermediate goods may cross many borders before the final good is assembled and exported for final consumption. Traditional trade statistics include these flows of intermediate goods in the export value of the final product, which stem from the increased international fragmentation of production. Globalisation
10
has fragmented firms’ ‘value chains’5 and led an increasing number to establish cross-border networks. As a result, world trade, investment and production are increasingly organised in global value chains (GVCs).
This is also confirmed by the analyses of manufacturing industries’ ability to produce complex or sophisticated goods. Although industries in the BRIC countries managed to upgrade their production considerably between 1995 and 2010, the output of the majority is still less complex than that of EU industries. This is corroborated by the fact that 67 % of the EU’s export products in 2010, had RCAs. By comparison, this was the case for only 43 % of the USA’s exports, 54 % of China’s and 24 % of Japan’s.
The analysis of trade in services indicates that the EU has a comparative advantage in almost all sectors except construction and travel. By comparison, the US economy has a comparative advantage in relatively few sectors (financial and insurance services and travel). Russia and China specialise in construction services, as does Japan. India is highly specialised in computer and information services. Brazil exhibits high RCA values in other business services.
5 A ‘value chain’ is made up of all activities that firms engage in,
at home or abroad, to bring a product to the market, from conception to final use.
Export strength in service industries differs markedly between Member States. The UK and Luxembourg have very strong RCAs in financial services and also, along with Ireland, in insurance services. Ireland also has a high RCA in computer and information services, together with Finland.
Increased internationalisation of EU industries
Increasing global trade flows have been accompanied by even stronger growth in global capital flows, including foreign direct investment (FDI). EU Member States together account for a significant proportion of global FDI flows (around 22 % of inflows and 30 % of outflows), but both inflows and outflows have been badly hit by the crisis. In 2010, EU FDI inflows were approximately a third of their 2007 level and outflows had fallen even further.
Stocks of inward and outward EU FDI are concentrated in the financial and real estate sectors. Financial intermediation, real estate and business activities represent about three-quarters of overall outward stock and about two thirds of inward stock.

11
Chapter 1. EU INDUSTRY – A FRAGILE RECOVERY
This is the third edition of this report to include a chapter on short-term developments. The interest in describing and analysing such developments for sectors and countries arose in response to the financial crisis which broke out in early 2008. When the EU Industrial Structure Report 2011 was published, the latest available data (from June 2011) indicated a fragile recovery. This first recovery was short-lived, however, and followed by another economic downturn. The most recent data indicate that a tentative recovery appears to be broadening across Member States and gaining some momentum, but it still remains weak and fragile.
This chapter focuses on the most recent developments in manufacturing and services. These are analysed with the aid of monthly and quarterly production and turnover indicators, complemented by information from business surveys. Some forward-looking indicators will also be presented to provide information on future developments. It should be borne in mind that such forward-looking indicators and forecasts are subject to a great deal of uncertainty.
The first part of the chapter analyses developments in EU manufacturing industries since 2008, the beginning of the crisis. The impacts of the crisis and the extent of the recovery are compared across both industries and countries. The different impacts across industries are mostly explained in terms of differing demand elasticities with respect to income and prices. This analysis includes recent developments, i.e. in the last months for which data are available. Thereafter, the chapter briefly compares the EU manufacturing sector as a whole with those of Japan, South Korea and the USA. The last section of the chapter highlights the development of the services sector in the EU.
1.1. MANUFACTURING RECOVERY REMAINS
FRAGILE
Following the financial crisis, EU-27 manufacturing seemed to be recovering from the beginning of 2009. The recovery came to a halt in the third quarter of 2011 (as indicated by the vertical black line in Figure 1.1), since when manufacturing growth rates have once again declined. The downturn which followed is comparable to the millennium recession in terms both of duration and impact (see Figure 1.1.)
The data for the first and second quarter of 2013 indicate a slow recovery of industrial production in the EU. However, the most recent data demonstrate the fragility of this recovery, as production declined again slightly in the third quarter of 2013.
The strength of the recovery differs substantially across EU countries. Strong recoveries can be seen in Romania, Poland, Slovakia, and the Baltic states, which have all regained and surpassed their pre-recession peaks. Although the recovery process began simultaneously in many other Member States,
Figure 1.1. EU-27 manufacturing during previous recessions
75
80
85
90
95
100
105
110
115
120
Inde
x, 2
010=
100
EU Manufacturing
Source: Own calculations using Eurostat data. Note: Shaded areas represent the three recessions since 1990. The vertical black line indicates when EU-27 manufacturing growth rates mostly turned negative again after the recovery following the financial crisis.

12
these are still trailing well behind pre-recession production levels. Several manufacturing industries in the south of the EU are still at an early stage of recovery or still waiting for it to begin (see Figure 1.2).
European industries producing non-durable goods such as food, beverages, other transport equipment and pharmaceuticals have fared relatively better than other industries since the outbreak of the financial crisis. Also, high-technology manufacturing industries were in general not affected to the same extent as other sectors. As explained in the previous edition of this Report (EU Industrial Structure
2011), capital goods and intermediate goods industries are more sensitive to business-cycle fluctuations than those producing non-durable consumer goods, where demand is less sensitive to variations in income. This explains the relatively large production losses for some medium-/high-technology industries. Mining industries and construction were harder hit by the financial crisis than manufacturing as a whole, though there is considerable variation within the mining and quarrying sector. Metal ores and mining support services have developed positively
since 2008, partly due to strong global demand. Other mining industries have been on the decline over a longer period of time. This also applies to manufacturing sectors such as furniture, clothing and textiles (see Figure 1.3).
Looking at the most recent data, the strongest growth rates in manufacturing are in industries with the largest production losses from pre-recession peaks: motor vehicles, machinery n.e.c.6 and basic metals.
Consumer goods were not hit as hard by the crisis as capital and intermediate goods. In this category, consumer staples, such as food
6 Not elsewhere classified
Figure 1.2. EU manufacturing recovery by Member State
-35
-30
-25
-20
-15
-10
-5
0
5
10
15
Perc
enta
ge c
hang
e si
nce
Janu
ary
2008
Source: Own calculations using Eurostat manufacturing data. Developments are shown since January 2008 until March 2013.
Figure 1.3. Better recovery for high-tech manufacturing and industries producing necessity goods while capital and intermediate goods industries trail behind
-35
-30
-25
-20
-15
-10
-5
0
5
10
15
Perc
enta
ge c
hang
e si
nce
2008
Source: Own calculations using Eurostat data. Note: January 2008 was the peak date for total EU manufacturing. Data as of March 2013.

13
and pharmaceuticals, have also fared better since the end of 2012. The development for pharmaceuticals also partly explains the still-positive growth rates for high-tech manufacturing industries. Besides pharmaceuticals and metal ores, other transport equipment and other manufacturing industries have also displayed positive growth rates since the end of 2012.
On the basis of information from EU business surveys, the recent positive developments in manufacturing output are expected to continue. After recovering from very low levels in 2009, EU manufacturing order books and production expectations declined again in 2011. Developments as regards inventories mirrored these trends. Production expectations lead the other variables by some months. The latest surveys showing growing, though still fragile, expectations may indicate a future rise in demand. Expectations in manufacturing have become more optimistic since the beginning of 2013 (see Figure 1.4).
International comparison of EU manufacturing recovery
EU manufacturing hit a trough and began a rebound earlier than US manufacturing, but US developments have been stronger over the past two years. US manufacturing already recovered more quickly than EU manufacturing in the two previous recessions since 1990. After the most recent recession, growth in the EU and the USA initially
followed a similar course until the third quarter of 2011. However, since then, EU manufacturing growth has declined, while US growth rates remain positive (see Figure 1.5.)
Average annual EU manufacturing growth rates in the period 2001-12 were less than half those in the USA. Growth rates in South Korean manufacturing were considerably higher, while, on average, Japanese manufacturing did not grow in this period (see Figure 1.5).
The significantly greater degree of volatility in the most recent Japanese growth rates is partly attributable to the impact of the earthquake in 2011, after which Japanese production declined sharply before staging an impressive recovery (see Table 1.1).
In addition, the financial crisis had a greater impact on Japan’s manufacturing industries than on other countries’ and, until recently, developments have been more negative for Japan (see Figure 1.5).
Figure 1.4. Optimistic expectations of demand for manufacturing and services in 2013
-40
-30
-20
-10
0
10
20
30
2008 2009 2010 2011 2012 2013
Bal
ance
of r
espo
nses
toqu
estio
nnai
res
Services Manufacturing
Source: Directorate-General for Economic and Financial Affairs. Note: The business survey indicators are calculated as the differences between the percentages of all respondents who think demand for services, or for manufacturing, will increase in the next month and those who think it will decrease.
Figure 1.5. EU recovery in comparative perspective
50
60
70
80
90
100
110
120
Inde
x 20
10 =
100
EU Japan S. Korea USA
Source: Own calculations using Eurostat and OECD data.
Table 1.1. Lower growth and higher volatility in Japanese manufacturing
Mean Standard deviation Max Min
EU growth 0.4 6.0 9.9 -20.4Japanese growth -0.2 10.0 29.1 -34.7S. Korean growth 5.9 7.8 36.7 -21.9USA growth 0.5 5.6 9.2 -17.8Source: Own calculations using Eurostat data. Note: 12-month percentage growth rates 2001:1-2012:11.

14
1.2. THE RECOVERY OF EU SERVICES
Services have in general not been as badly hit by the recession as the construction, manufacturing, and mining industries. There are however differences between service industries. While aggregate EU GDP is still below its pre-recession level, market services, information & communication, and real estate activities have continued to grow during the crisis (see Figure 1.6).
Professional services and trade and transportation now seem to be on a rebound, while financial and insurance activities have been in decline since 2008 (see Figure 1.7).
A more detailed breakdown reveals that the impact of the crisis has varied considerably. While information services, as shown above on a more aggregate level, have been in
constant growth since the last quarter of 2010,
transportation and services related to tourism, which are more sensitive to changes in income, are in decline (see Figure 1.8. and Box 1.1).
While demand for information and computer services seems to be growing, other services still trail behind. Telecommunications services output has declined slightly since 2012, which is surprising, as demand in this area has been strong during the crisis (see Table 1.2).
Figure 1.6. Growth rates in services and the EU economy as a whole
-8
-6
-4
-2
0
2
4
6
8
10
12
2008 2009 2010 2011 2012 2013
Perc
enta
ge c
hang
es si
nce
1st q
uart
er o
f 200
8
TOTAL Information & communication Real estate activities
Source: Own calculations using Eurostat data.
Figure 1.8. Strong recovery for information services while trade, tourism and transportation services face a second trough at the beginning of 2013
-20
-15
-10
-5
0
5
10
2008 2009 2010 2011 2012 2013
Perc
enta
ge c
hang
es si
nce
1st q
uart
er o
f 200
8
WHOLESALE Transportation services Hotels & accommodationInformation services Professional services
Source: Own calculations using Eurostat data. Figure 1.7. Services developments since 2008
-12
-10
-8
-6
-4
-2
0
2
4
6
8
10
12
2008 2009 2010 2011 2012 2013
Perc
enta
ge c
hang
es s
ince
1st
qua
rter
of 2
008
Trade, transportation, hotels & restaurants Information & communicationFinancial & insurance activities Real estate activitiesProfessional & administrative services Non-market services
Source: Own calculations using Eurostat data.
Box 1.1. Measuring services activities in real terms The closest item in the consumer and producer price indices has been used to deflate nominal turnover for each service industry. When such an item is unavailable, the index for all services has been used to deflate the turnover series, as follows: - Retail trade is presented in constant prices in
the original series; - The corresponding consumer price indices are
used to deflate accommodation and food services;
- Producer price indices are used to deflate transport services, postal activities, telecommunications and computer programming services;
- Information and communication services are deflated by the price index for communications;
- All other services industries are deflated by the consumer price index for all services.

15
As illustrated above, the expectation of demand for services closely follows that of manufactured goods. The indicator for services has been positive since early 2013 showing that the majority of service industries that participate in the survey believe that demand will increase in the coming months. The most recent business surveys indicate that expectations of demand in services have been even more optimistic since summer 2013 (see Figure 1.4).
This chapter has shown developments for different industries and services since the outbreak of the financial crisis according to the information available at the time of writing. We have compared the rebound in EU manufacturing with the recovery in other major economies. Signs for industrial recovery, though mixed, are encouraging. However, it may be still difficult to foresee the likely path and speed of this recovery for most manufacturing sectors.
Table 1.2. Falling prices in all service sectors except for computer and information services
NACE Rev.2Codes
Development since 2008Q1 2012Q3 2012Q4 2013Q1 2013Q2
G45 Motor vehicle trade -24.5 -5.5 -7.6 -6.2 -1.5
G46 Wholesale trade -8.9 -1.9 -1.9 -1.7 -0.1
G47 Retail trade -4.5 -0.8 -2.0 -1.2 -0.2
H49 Land transport -17.2 -2.5 -2.7 -1.0 -0.9
H50 Water transport -25.5 2.3 -6.9 -6.9 -5.3
H51 Air transport -19.3 -2.2 -5.4 -6.1 -3.1
H52 Warehousing -11.0 -0.3 -1.8 -1.5 -0.9
H53 Postal services -19.0 -8.1 -8.4 -2.5 -3.7
I Accommodation & Food -15.2 -2.8 -3.3 -4.3 -2.1
J61 Telecommunications 1.1 -1.9 -2.1 -1.0 1.2
J62 Computer programming & consultancy 22.9 6.3 5.3 5.1 6.4
J63 Information service activities 9.0 7.0 7.9 5.4 6.4
M Professional, scientific & technical activities -7.4 -1.6 -1.7 -2.1 0.7
N Administrative & support services -2.5 2.9 0.6 -0.8 0.0
Total services -9.1 -1.4 -2.2 -1.9 -0.3
Manufacturing -12.6 -2.5 -3.7 -3.3 -1.3
Source: Own calculations using Eurostat data. Note: Percentage change in constant prices (year-on-year) and percentage change since the first quarter of 2008.

16

17
Chapter 2. CHANGES IN THE EU'S INDUSTRIAL STRUCTURE
The industrial structure of an economy is the result of long-term trends. Each sector's share of employment and value added is determined by factors such as growth in productivity, the structure of demand and international trade. This chapter attempts to capture the dynamics of the main sectors of the EU economy. Section 2.1 describes sector developments, primarily in terms of changing shares of output and employment. Section 2.2 describes the degree of sector specialisation in the EU. Section 2.3 studies the distribution of enterprises by size classes across sectors. Section 2.4 analyses the inter-linkages between manufacturing and services sectors.7 Finally, section 2.5 focuses on the tourism sector.
2.1. CHANGES IN MANUFACTURING
OUTPUT AND EMPLOYMENT
The long-term shift from manufacturing to services is continuing. Market services have grown to a point where they account for nearly half of EU gross value added. The share of non-market services8 has also increased, to 23 % in 2012. Conversely, manufacturing activities declined to around 15 % of overall gross value added in 2012. Construction, and mining and quarrying, have remained roughly stable at 6 % and 1 % respectively. The contribution of agriculture has declined marginally (see Figure 2.1).
7 It is important to note that the analysis is partly restrained by
the availability of data and statistical nomenclatures. Therefore, some sectors may be only partially visible because the classification scheme doesn't reach to a sufficient level of disaggregation. For example, there is no separate data on optical products and computers within the category 'manufacture of computers, electronics and optical products'. Although NACE Rev 2 provides a greater level of disaggregation compared to NACE Rev 1, many economic activities cannot be separated into specific sectors.
8 Non-market services comprise branches covering general public services, non-market education, research and health services provided by general government and private non-profit institutions, domestic services and other non-market services.
Figure 2.1. Share in EU-27 GVA (%) in 2000 and 2012
Source: own calculations based on Eurostat data
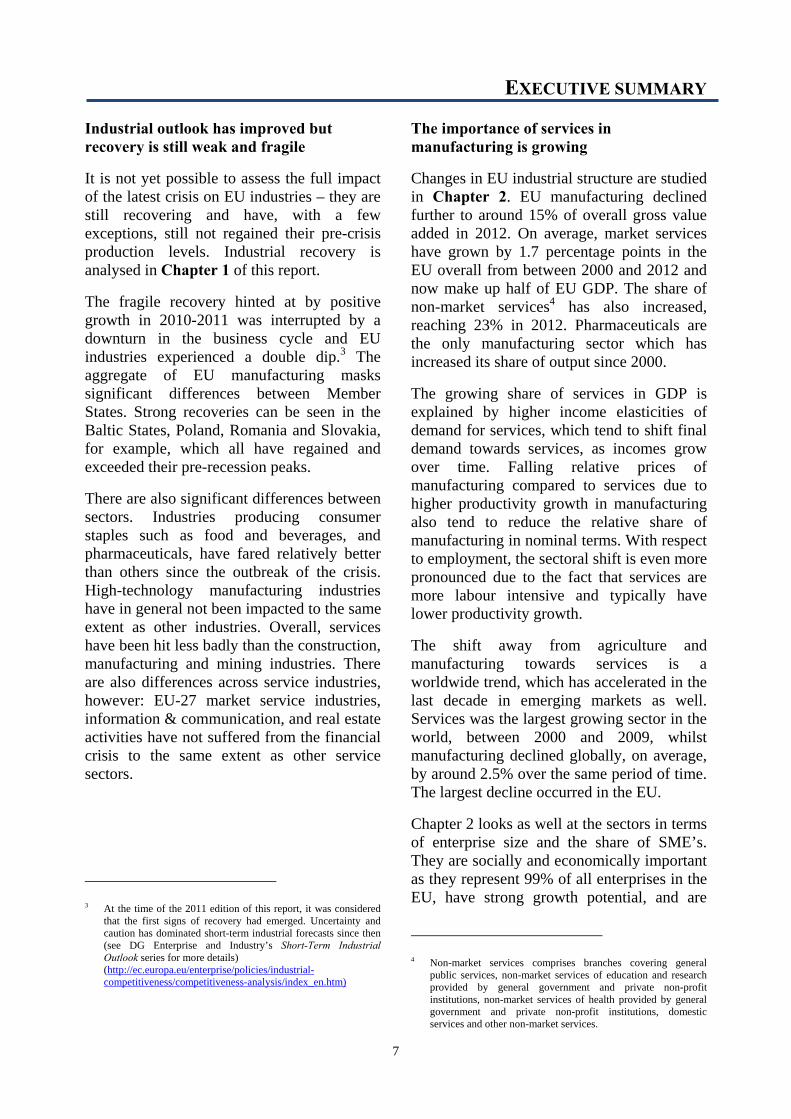
Figure 2.2 shows the large variations in the percentages of Member States’ output accounted for by manufacturing and market services. Luxembourg stands out as having a very large market services sector and a very small manufacturing sector. Greece, Cyprus and the UK also have large shares of market services. Conversely, Romania, the Czech Republic, Hungary and Ireland have small market services sectors but relatively large manufacturing sectors. In general, many central and eastern European economies have kept relatively large manufacturing sectors as compared with the EU average.
Manufacturing industries in some of these countries have received relatively large inflows of foreign direct investment (FDI), which are channelled towards exports. In the short term, this may counteract the long-term trend of growing services and shrinking manufacturing sectors. In the long run, however, the share of services in these economies looks set to increase due to long-term drivers such as a higher income elasticity of demand for services and lower
18
relative productivity growth in service sectors as compared with manufacturing.
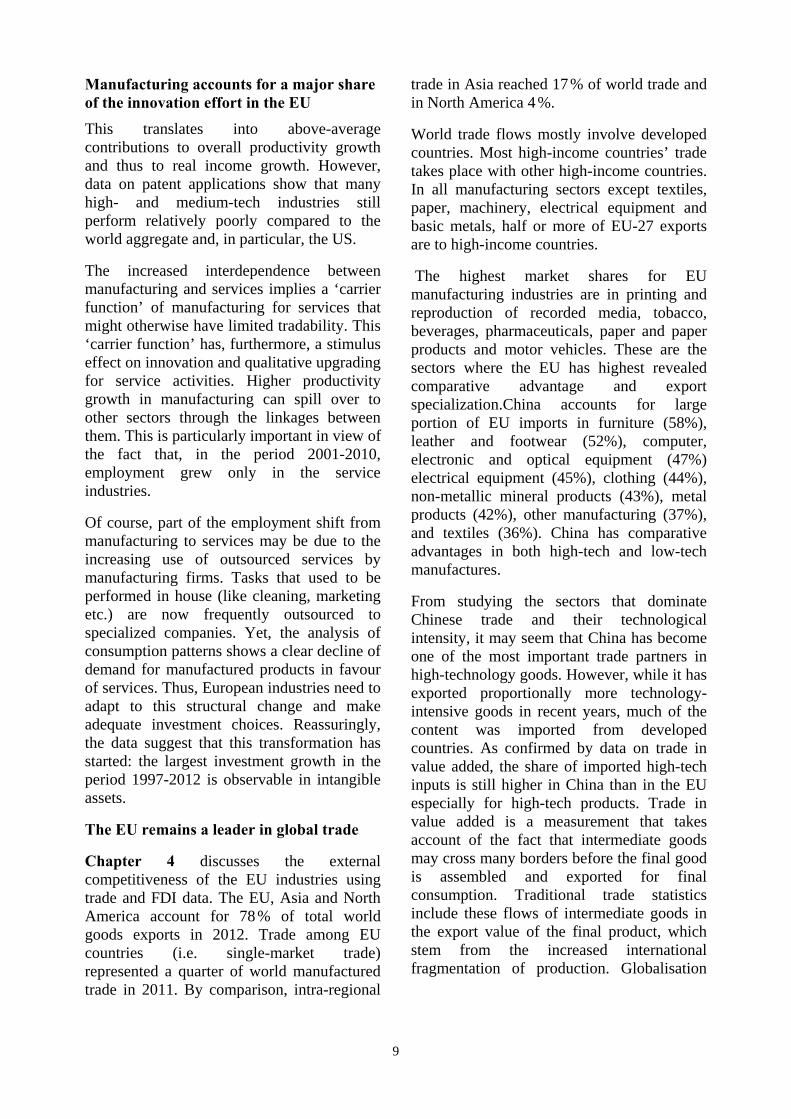
Figure 2.3 shows the distribution of manufacturing production across the European Union. Around a quarter is located in Germany, whose share of manufacturing has been much greater than its share of overall economic activity for a long time and has largely been maintained during the crisis period.
Although manufacturing shares have been quite stable, enlargement has caused a partial shift away from the EU-15 to the ‘new’ Member States, which inherited larger manufacturing sectors from the pre-transition period; the proportion of EU-12 in EU manufacturing has increased since 2005. Poland experienced the strongest
increase and now accounts for 3.5 % of the total. Notably, the share of manufacturing in the UK fell from over 14 % in 2005 to just over 11 % in 2009 - a sizeable decline from a relatively high base (in 2005, the UK had the second largest share after Germany and now ranks only fourth).
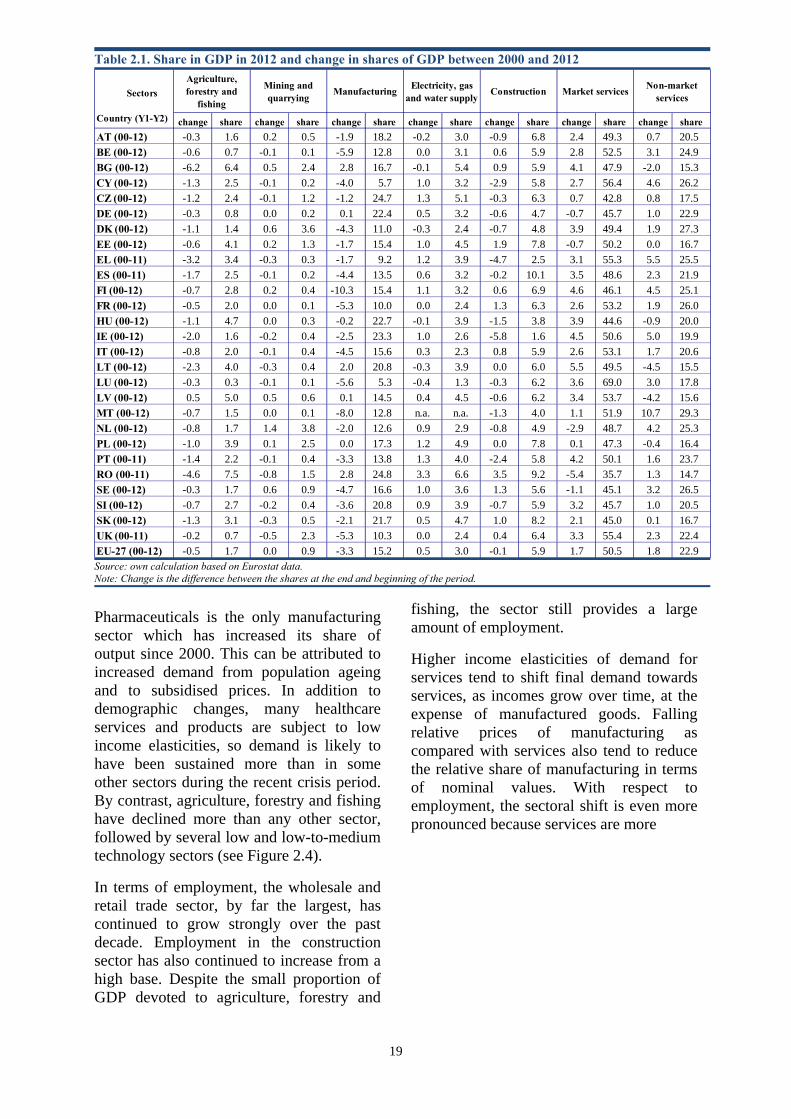
On average, market services have grown by 1.7 percentage points in the EU overall between 2000 and 2012 and now make up half of EU GDP. The share of manufacturing has fallen by 3.3 percentage points. The proportion of market services has increased in most Member States, with the exception of Germany, Estonia, Malta, the Netherlands, Poland and Romania. As implied above, the share of manufacturing has declined in most Member States, but it has increased in Germany, Estonia, Lithuania, Poland and Romania. Lithuania stands out as the only country which has seen a positive shift in both manufacturing and market services, mainly at the expense of non-market services and agriculture. The relative importance of agricultural activities has diminished in all Member States except Latvia. The share of non-market services has increased by 1.8 percentage points on average and there has been an increase in most Member States, with the exception of Bulgaria, Hungary, Lithuania, Latvia, Poland and Romania. The construction sector’s share of output has marginally declined since 2000. A few countries stand out as having particularly large construction sectors; in Spain, Romania and Slovakia, for example, construction has a share markedly higher than the EU average of 5.9 % (see Table 2.1).
Wholesale and retail trade is the largest EU market service sector, followed by real estate activities. Within EU manufacturing, ‘basic metals and metal products’ is the largest sector. Healthcare activities increased more than any other sector between 2000 and 2011 (due to the effect of demographic changes on demand), followed by financial and insurance activities, and real estate.
Figure 2.2. Proportion of Member States’ output accounted for by manufacturing and market services in 2011 (%)
EU27
BE
CZ
DK
DE
EEIE
EL
ES
FRIT
CYLV
LT
LU
HU
MTNL AT
PL
PT
RO
SI
SKFI
SE
UK
30
35
40
45
50
55
60
65
70
75
5 10 15 20 25 30
Shar
e of
mar
ket s
ervi
ces
Share of manufacturing
Source: own calculations based on Eurostat data. Data for Bulgaria not available.
Figure 2.3. Share in EU manufacturing by Member State (% of total)
0%
5%
10%
15%
20%
25%
30%2005 2009
Source: Own calculations based on Eurostat data. Note: Data taken from 2009 as the most complete recent data set.
19
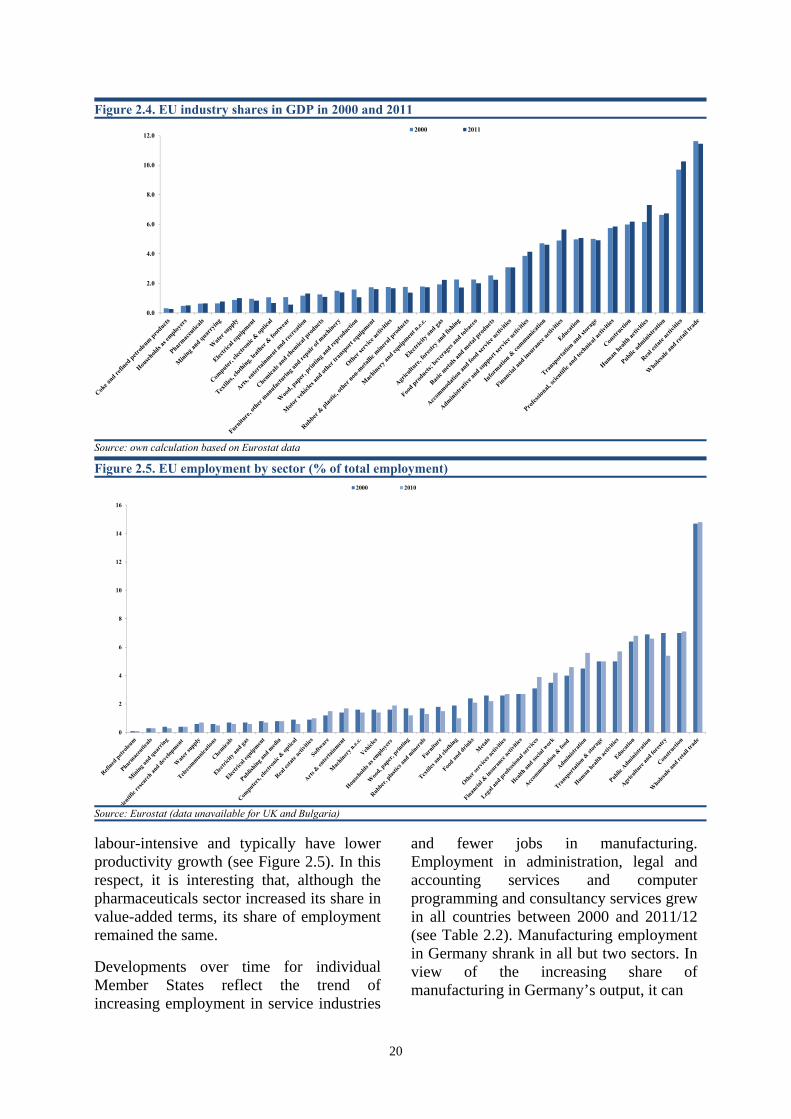
Pharmaceuticals is the only manufacturing sector which has increased its share of output since 2000. This can be attributed to increased demand from population ageing and to subsidised prices. In addition to demographic changes, many healthcare services and products are subject to low income elasticities, so demand is likely to have been sustained more than in some other sectors during the recent crisis period. By contrast, agriculture, forestry and fishing have declined more than any other sector, followed by several low and low-to-medium technology sectors (see Figure 2.4).
In terms of employment, the wholesale and retail trade sector, by far the largest, has continued to grow strongly over the past decade. Employment in the construction sector has also continued to increase from a high base. Despite the small proportion of GDP devoted to agriculture, forestry and
fishing, the sector still provides a large amount of employment.
Higher income elasticities of demand for services tend to shift final demand towards services, as incomes grow over time, at the expense of manufactured goods. Falling relative prices of manufacturing as compared with services also tend to reduce the relative share of manufacturing in terms of nominal values. With respect to employment, the sectoral shift is even more pronounced because services are more
Table 2.1. Share in GDP in 2012 and change in shares of GDP between 2000 and 2012
change share change share change share change share change share change share change shareAT (00-12) -0.3 1.6 0.2 0.5 -1.9 18.2 -0.2 3.0 -0.9 6.8 2.4 49.3 0.7 20.5BE (00-12) -0.6 0.7 -0.1 0.1 -5.9 12.8 0.0 3.1 0.6 5.9 2.8 52.5 3.1 24.9BG (00-12) -6.2 6.4 0.5 2.4 2.8 16.7 -0.1 5.4 0.9 5.9 4.1 47.9 -2.0 15.3CY (00-12) -1.3 2.5 -0.1 0.2 -4.0 5.7 1.0 3.2 -2.9 5.8 2.7 56.4 4.6 26.2CZ (00-12) -1.2 2.4 -0.1 1.2 -1.2 24.7 1.3 5.1 -0.3 6.3 0.7 42.8 0.8 17.5DE (00-12) -0.3 0.8 0.0 0.2 0.1 22.4 0.5 3.2 -0.6 4.7 -0.7 45.7 1.0 22.9DK (00-12) -1.1 1.4 0.6 3.6 -4.3 11.0 -0.3 2.4 -0.7 4.8 3.9 49.4 1.9 27.3EE (00-12) -0.6 4.1 0.2 1.3 -1.7 15.4 1.0 4.5 1.9 7.8 -0.7 50.2 0.0 16.7EL (00-11) -3.2 3.4 -0.3 0.3 -1.7 9.2 1.2 3.9 -4.7 2.5 3.1 55.3 5.5 25.5ES (00-11) -1.7 2.5 -0.1 0.2 -4.4 13.5 0.6 3.2 -0.2 10.1 3.5 48.6 2.3 21.9FI (00-12) -0.7 2.8 0.2 0.4 -10.3 15.4 1.1 3.2 0.6 6.9 4.6 46.1 4.5 25.1FR (00-12) -0.5 2.0 0.0 0.1 -5.3 10.0 0.0 2.4 1.3 6.3 2.6 53.2 1.9 26.0HU (00-12) -1.1 4.7 0.0 0.3 -0.2 22.7 -0.1 3.9 -1.5 3.8 3.9 44.6 -0.9 20.0IE (00-12) -2.0 1.6 -0.2 0.4 -2.5 23.3 1.0 2.6 -5.8 1.6 4.5 50.6 5.0 19.9IT (00-12) -0.8 2.0 -0.1 0.4 -4.5 15.6 0.3 2.3 0.8 5.9 2.6 53.1 1.7 20.6LT (00-12) -2.3 4.0 -0.3 0.4 2.0 20.8 -0.3 3.9 0.0 6.0 5.5 49.5 -4.5 15.5LU (00-12) -0.3 0.3 -0.1 0.1 -5.6 5.3 -0.4 1.3 -0.3 6.2 3.6 69.0 3.0 17.8LV (00-12) 0.5 5.0 0.5 0.6 0.1 14.5 0.4 4.5 -0.6 6.2 3.4 53.7 -4.2 15.6MT (00-12) -0.7 1.5 0.0 0.1 -8.0 12.8 n.a. n.a. -1.3 4.0 1.1 51.9 10.7 29.3NL (00-12) -0.8 1.7 1.4 3.8 -2.0 12.6 0.9 2.9 -0.8 4.9 -2.9 48.7 4.2 25.3PL (00-12) -1.0 3.9 0.1 2.5 0.0 17.3 1.2 4.9 0.0 7.8 0.1 47.3 -0.4 16.4PT (00-11) -1.4 2.2 -0.1 0.4 -3.3 13.8 1.3 4.0 -2.4 5.8 4.2 50.1 1.6 23.7RO (00-11) -4.6 7.5 -0.8 1.5 2.8 24.8 3.3 6.6 3.5 9.2 -5.4 35.7 1.3 14.7SE (00-12) -0.3 1.7 0.6 0.9 -4.7 16.6 1.0 3.6 1.3 5.6 -1.1 45.1 3.2 26.5SI (00-12) -0.7 2.7 -0.2 0.4 -3.6 20.8 0.9 3.9 -0.7 5.9 3.2 45.7 1.0 20.5SK (00-12) -1.3 3.1 -0.3 0.5 -2.1 21.7 0.5 4.7 1.0 8.2 2.1 45.0 0.1 16.7UK (00-11) -0.2 0.7 -0.5 2.3 -5.3 10.3 0.0 2.4 0.4 6.4 3.3 55.4 2.3 22.4EU-27 (00-12) -0.5 1.7 0.0 0.9 -3.3 15.2 0.5 3.0 -0.1 5.9 1.7 50.5 1.8 22.9
Market services Non-market services
Sectors
Country (Y1-Y2)
Agriculture, forestry and
fishing
Mining and quarrying
Manufacturing Electricity, gas and water supply
Construction
Source: own calculation based on Eurostat data. Note: Change is the difference between the shares at the end and beginning of the period.
20
labour-intensive and typically have lower productivity growth (see Figure 2.5). In this respect, it is interesting that, although the pharmaceuticals sector increased its share in value-added terms, its share of employment remained the same.
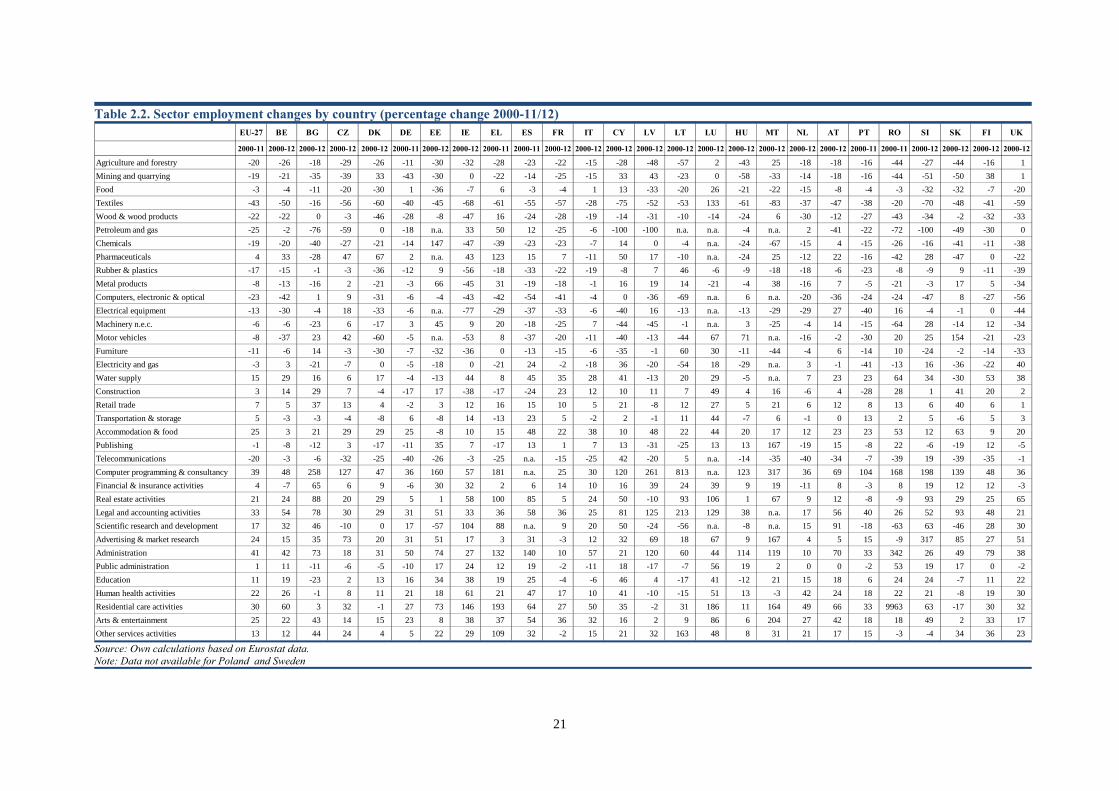
Developments over time for individual Member States reflect the trend of increasing employment in service industries
and fewer jobs in manufacturing. Employment in administration, legal and accounting services and computer programming and consultancy services grew in all countries between 2000 and 2011/12 (see Table 2.2). Manufacturing employment in Germany shrank in all but two sectors. In view of the increasing share of manufacturing in Germany’s output, it can
Figure 2.4. EU industry shares in GDP in 2000 and 2011
0.0
2.0
4.0
6.0
8.0
10.0
12.02000 2011
Source: own calculation based on Eurostat data
Figure 2.5. EU employment by sector (% of total employment)
0
2
4
6
8
10
12
14
16
2000 2010
Source: Eurostat (data unavailable for UK and Bulgaria)
21
Table 2.2. Sector employment changes by country (percentage change 2000-11/12) EU-27 BE BG CZ DK DE EE IE EL ES FR IT CY LV LT LU HU MT NL AT PT RO SI SK FI UK
2000-11 2000-12 2000-12 2000-12 2000-12 2000-11 2000-12 2000-12 2000-11 2000-11 2000-12 2000-12 2000-12 2000-12 2000-12 2000-12 2000-12 2000-12 2000-12 2000-12 2000-11 2000-11 2000-12 2000-12 2000-12 2000-12
Agriculture and forestry -20 -26 -18 -29 -26 -11 -30 -32 -28 -23 -22 -15 -28 -48 -57 2 -43 25 -18 -18 -16 -44 -27 -44 -16 1Mining and quarrying -19 -21 -35 -39 33 -43 -30 0 -22 -14 -25 -15 33 43 -23 0 -58 -33 -14 -18 -16 -44 -51 -50 38 1Food -3 -4 -11 -20 -30 1 -36 -7 6 -3 -4 1 13 -33 -20 26 -21 -22 -15 -8 -4 -3 -32 -32 -7 -20Textiles -43 -50 -16 -56 -60 -40 -45 -68 -61 -55 -57 -28 -75 -52 -53 133 -61 -83 -37 -47 -38 -20 -70 -48 -41 -59Wood & wood products -22 -22 0 -3 -46 -28 -8 -47 16 -24 -28 -19 -14 -31 -10 -14 -24 6 -30 -12 -27 -43 -34 -2 -32 -33Petroleum and gas -25 -2 -76 -59 0 -18 n.a. 33 50 12 -25 -6 -100 -100 n.a. n.a. -4 n.a. 2 -41 -22 -72 -100 -49 -30 0Chemicals -19 -20 -40 -27 -21 -14 147 -47 -39 -23 -23 -7 14 0 -4 n.a. -24 -67 -15 4 -15 -26 -16 -41 -11 -38Pharmaceuticals 4 33 -28 47 67 2 n.a. 43 123 15 7 -11 50 17 -10 n.a. -24 25 -12 22 -16 -42 28 -47 0 -22Rubber & plastics -17 -15 -1 -3 -36 -12 9 -56 -18 -33 -22 -19 -8 7 46 -6 -9 -18 -18 -6 -23 -8 -9 9 -11 -39Metal products -8 -13 -16 2 -21 -3 66 -45 31 -19 -18 -1 16 19 14 -21 -4 38 -16 7 -5 -21 -3 17 5 -34Computers, electronic & optical -23 -42 1 9 -31 -6 -4 -43 -42 -54 -41 -4 0 -36 -69 n.a. 6 n.a. -20 -36 -24 -24 -47 8 -27 -56Electrical equipment -13 -30 -4 18 -33 -6 n.a. -77 -29 -37 -33 -6 -40 16 -13 n.a. -13 -29 -29 27 -40 16 -4 -1 0 -44Machinery n.e.c. -6 -6 -23 6 -17 3 45 9 20 -18 -25 7 -44 -45 -1 n.a. 3 -25 -4 14 -15 -64 28 -14 12 -34Motor vehicles -8 -37 23 42 -60 -5 n.a. -53 8 -37 -20 -11 -40 -13 -44 67 71 n.a. -16 -2 -30 20 25 154 -21 -23Furniture -11 -6 14 -3 -30 -7 -32 -36 0 -13 -15 -6 -35 -1 60 30 -11 -44 -4 6 -14 10 -24 -2 -14 -33Electricity and gas -3 3 -21 -7 0 -5 -18 0 -21 24 -2 -18 36 -20 -54 18 -29 n.a. 3 -1 -41 -13 16 -36 -22 40Water supply 15 29 16 6 17 -4 -13 44 8 45 35 28 41 -13 20 29 -5 n.a. 7 23 23 64 34 -30 53 38Construction 3 14 29 7 -4 -17 17 -38 -17 -24 23 12 10 11 7 49 4 16 -6 4 -28 28 1 41 20 2Retail trade 7 5 37 13 4 -2 3 12 16 15 10 5 21 -8 12 27 5 21 6 12 8 13 6 40 6 1Transportation & storage 5 -3 -3 -4 -8 6 -8 14 -13 23 5 -2 2 -1 11 44 -7 6 -1 0 13 2 5 -6 5 3Accommodation & food 25 3 21 29 29 25 -8 10 15 48 22 38 10 48 22 44 20 17 12 23 23 53 12 63 9 20Publishing -1 -8 -12 3 -17 -11 35 7 -17 13 1 7 13 -31 -25 13 13 167 -19 15 -8 22 -6 -19 12 -5Telecommunications -20 -3 -6 -32 -25 -40 -26 -3 -25 n.a. -15 -25 42 -20 5 n.a. -14 -35 -40 -34 -7 -39 19 -39 -35 -1Computer programming & consultancy 39 48 258 127 47 36 160 57 181 n.a. 25 30 120 261 813 n.a. 123 317 36 69 104 168 198 139 48 36Financial & insurance activities 4 -7 65 6 9 -6 30 32 2 6 14 10 16 39 24 39 9 19 -11 8 -3 8 19 12 12 -3Real estate activities 21 24 88 20 29 5 1 58 100 85 5 24 50 -10 93 106 1 67 9 12 -8 -9 93 29 25 65Legal and accounting activities 33 54 78 30 29 31 51 33 36 58 36 25 81 125 213 129 38 n.a. 17 56 40 26 52 93 48 21Scientific research and development 17 32 46 -10 0 17 -57 104 88 n.a. 9 20 50 -24 -56 n.a. -8 n.a. 15 91 -18 -63 63 -46 28 30Advertising & market research 24 15 35 73 20 31 51 17 3 31 -3 12 32 69 18 67 9 167 4 5 15 -9 317 85 27 51Administration 41 42 73 18 31 50 74 27 132 140 10 57 21 120 60 44 114 119 10 70 33 342 26 49 79 38Public administration 1 11 -11 -6 -5 -10 17 24 12 19 -2 -11 18 -17 -7 56 19 2 0 0 -2 53 19 17 0 -2Education 11 19 -23 2 13 16 34 38 19 25 -4 -6 46 4 -17 41 -12 21 15 18 6 24 24 -7 11 22Human health activities 22 26 -1 8 11 21 18 61 21 47 17 10 41 -10 -15 51 13 -3 42 24 18 22 21 -8 19 30Residential care activities 30 60 3 32 -1 27 73 146 193 64 27 50 35 -2 31 186 11 164 49 66 33 9963 63 -17 30 32Arts & entertainment 25 22 43 14 15 23 8 38 37 54 36 32 16 2 9 86 6 204 27 42 18 18 49 2 33 17Other services activities 13 12 44 24 4 5 22 29 109 32 -2 15 21 32 163 48 8 31 21 17 15 -3 -4 34 36 23
Source: Own calculations based on Eurostat data. Note: Data not available for Poland and Sweden
22
be reasonably assumed that improved productivity growth has made its manufacturing more competitive on world markets. Austerity measures in some Member States have led to lower employment in public administration.
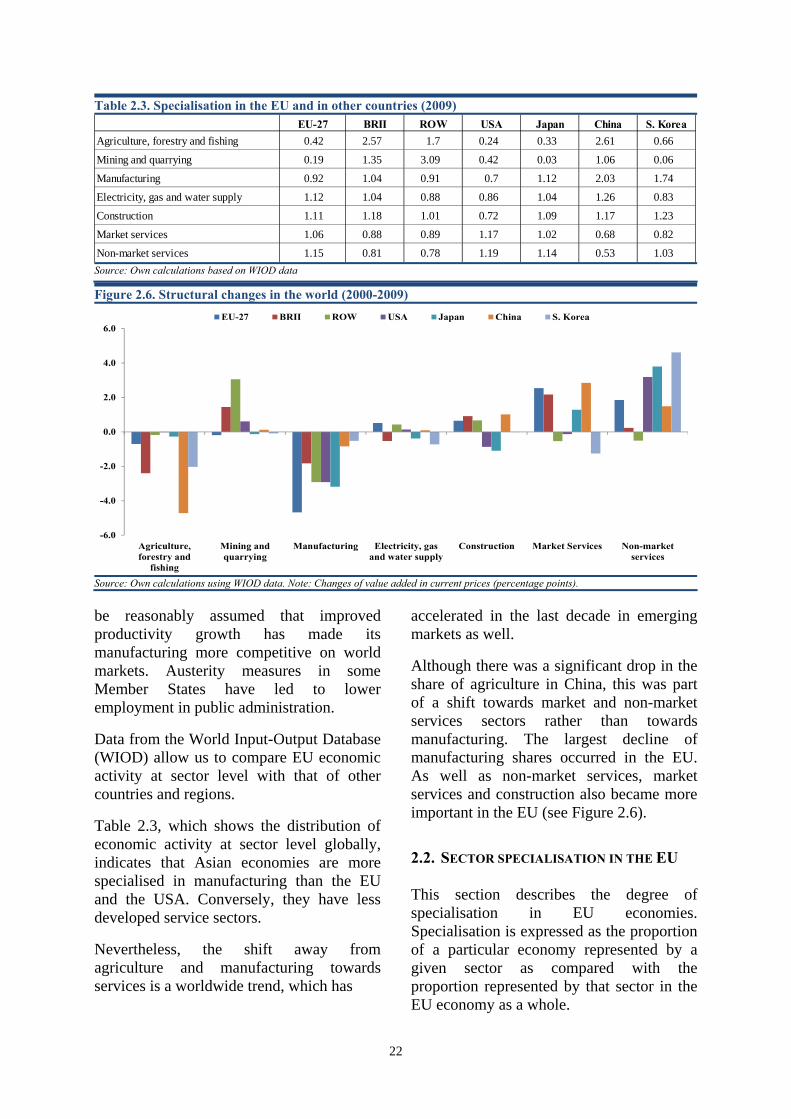
Data from the World Input-Output Database (WIOD) allow us to compare EU economic activity at sector level with that of other countries and regions.
Table 2.3, which shows the distribution of economic activity at sector level globally, indicates that Asian economies are more specialised in manufacturing than the EU and the USA. Conversely, they have less developed service sectors.
Nevertheless, the shift away from agriculture and manufacturing towards services is a worldwide trend, which has
accelerated in the last decade in emerging markets as well.
Although there was a significant drop in the share of agriculture in China, this was part of a shift towards market and non-market services sectors rather than towards manufacturing. The largest decline of manufacturing shares occurred in the EU. As well as non-market services, market services and construction also became more important in the EU (see Figure 2.6).
2.2. SECTOR SPECIALISATION IN THE EU
This section describes the degree of specialisation in EU economies. Specialisation is expressed as the proportion of a particular economy represented by a given sector as compared with the proportion represented by that sector in the EU economy as a whole.
Table 2.3. Specialisation in the EU and in other countries (2009) EU-27 BRII ROW USA Japan China S. Korea
Agriculture, forestry and fishing 0.42 2.57 1.7 0.24 0.33 2.61 0.66
Mining and quarrying 0.19 1.35 3.09 0.42 0.03 1.06 0.06
Manufacturing 0.92 1.04 0.91 0.7 1.12 2.03 1.74
Electricity, gas and water supply 1.12 1.04 0.88 0.86 1.04 1.26 0.83
Construction 1.11 1.18 1.01 0.72 1.09 1.17 1.23
Market services 1.06 0.88 0.89 1.17 1.02 0.68 0.82
Non-market services 1.15 0.81 0.78 1.19 1.14 0.53 1.03Source: Own calculations based on WIOD data
Figure 2.6. Structural changes in the world (2000-2009)
-6.0
-4.0
-2.0
0.0
2.0
4.0
6.0
Agriculture,forestry and
fishing
Mining andquarrying
Manufacturing Electricity, gasand water supply
Construction Market Services Non-marketservices
EU-27 BRII ROW USA Japan China S. Korea
Source: Own calculations using WIOD data. Note: Changes of value added in current prices (percentage points).

23
In overall terms, the four Member States with the most specialised industrial structures are Ireland, Sweden, Romania and Malta, in that order (see Figure 2.7). In general (although the index is based on relative sector distributions), the larger the economy, the greater the potential for diversification – large countries can harbour more activities than small countries. Hence larger economies (France, Spain, Italy and Germany) make up the majority of the most diversified economies in the EU.
It should also be noted that specialisation indices tend to be higher for tradable (generally goods rather than service) sectors, because there is more potential to specialise via external demand.
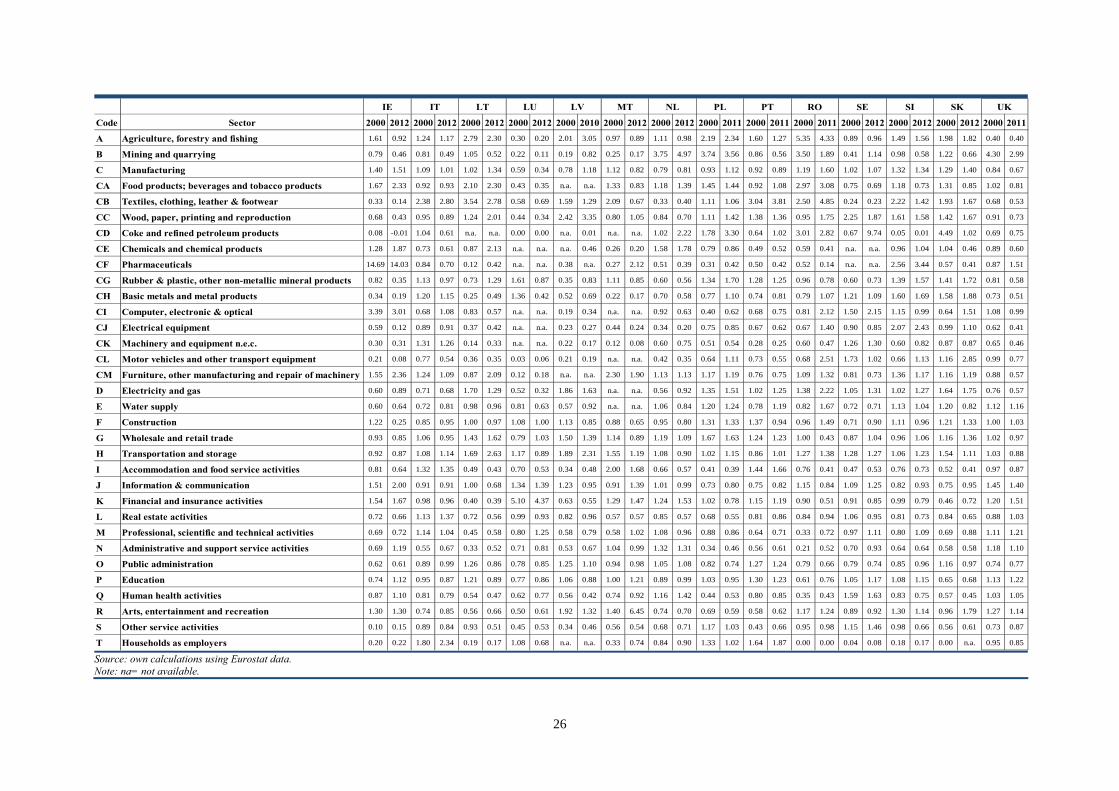
As explained in Box 2.1 below, a high degree of ‘specialisation’ in a sector does not necessarily denote that the sector represents a large proportion of the economy; rather, it means that it is relatively more important to the national economy than to the reference economy, here the EU. In some countries, the specialisation indices are very high.9 The highest (14.03) is to be found in Ireland, for the pharmaceuticals sector, followed by Sweden (9.74), for refined petroleum (see Table 2.4).
Some shifts in the degree of specialisation, e.g. the decline in the importance of the construction sector in Ireland and Greece, clearly reflect the impact of the crisis. Other shifts, e.g. the strong increase in specialisation in computer, electronic and optical equipment in Estonia, indicate rapid economic development.
Economies with a lower per capita income, such as Romania, Poland, Latvia and Lithuania, tend to be more specialised in agriculture, whereas higher income economies tend to specialise in medium-to-high technology industries and knowledge-intensive services.10 This is in line with the long-term structural shift from agriculture to industry and subsequently services, as income levels rise. Nevertheless, higher income economies sometimes show specialisation in low-to-medium technology manufacturing industries, often reflecting the availability of natural resources. For example, the paper and printing industry in the Nordic countries is supported by the domestic forestry sector.
9 The indices should be interpreted with caution, as data
availability varies substantially between countries. 10 France is an exception in that it specialises almost entirely in
agriculture and services.
Figure 2.7. Ranking of countries by degree of specialisation in 2012
0 2 4 6 8 10 12 14 16
ATFRBEESFIIT
UKDESKPTCZSI
CYLVEEPLLTLUDKELNLBGHUMTROSEIE
Source: own calculations using Eurostat data. Note: 2011 for RO, EL, PL, PT, DE, UK, ES; 2010 for LV
24
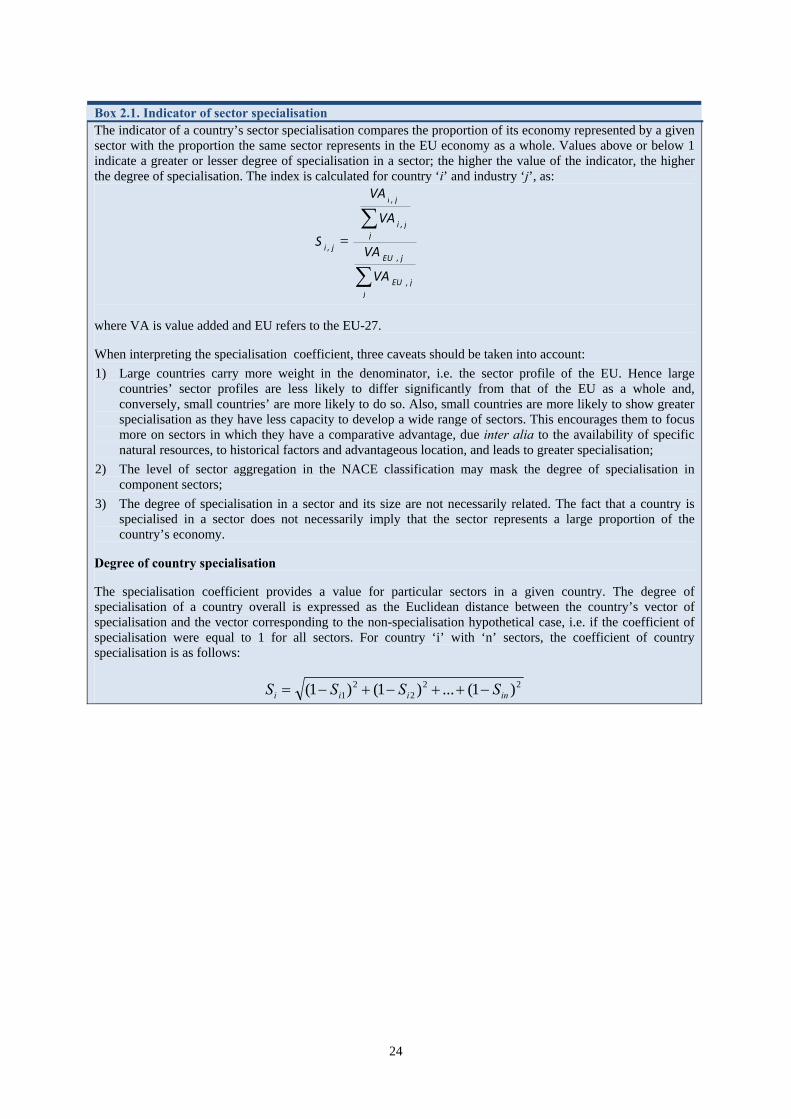
Box 2.1. Indicator of sector specialisation The indicator of a country’s sector specialisation compares the proportion of its economy represented by a given sector with the proportion the same sector represents in the EU economy as a whole. Values above or below 1 indicate a greater or lesser degree of specialisation in a sector; the higher the value of the indicator, the higher the degree of specialisation. The index is calculated for country ‘i’ and industry ‘j’, as:
∑
∑=
jjEU
jEU
jji
ji
ji
VA
VA
VA
VA
S
,
,
,
,
,
where VA is value added and EU refers to the EU-27.
When interpreting the specialisation coefficient, three caveats should be taken into account: 1) Large countries carry more weight in the denominator, i.e. the sector profile of the EU. Hence large
countries’ sector profiles are less likely to differ significantly from that of the EU as a whole and, conversely, small countries’ are more likely to do so. Also, small countries are more likely to show greater specialisation as they have less capacity to develop a wide range of sectors. This encourages them to focus more on sectors in which they have a comparative advantage, due inter alia to the availability of specific natural resources, to historical factors and advantageous location, and leads to greater specialisation;
2) The level of sector aggregation in the NACE classification may mask the degree of specialisation in component sectors;
3) The degree of specialisation in a sector and its size are not necessarily related. The fact that a country is specialised in a sector does not necessarily imply that the sector represents a large proportion of the country’s economy.
Degree of country specialisation
The specialisation coefficient provides a value for particular sectors in a given country. The degree of specialisation of a country overall is expressed as the Euclidean distance between the country’s vector of specialisation and the vector corresponding to the non-specialisation hypothetical case, i.e. if the coefficient of specialisation were equal to 1 for all sectors. For country ‘i’ with ‘n’ sectors, the coefficient of country specialisation is as follows:
222
21 )1(...)1()1( iniii SSSS −++−+−=

25
Table 2.4. Sector specialisation indices (2000–12)
Code Sector 2000 2012 2000 2012 2000 2012 2000 2012 2000 2012 2000 2011 2000 2012 2000 2012 2000 2011 2000 2011 2000 2012 2000 2012 2000 2012A Agriculture, forestry and fishing 0.85 0.93 0.58 0.43 5.60 3.72 1.68 1.47 1.60 1.37 0.49 0.46 1.11 0.84 2.12 2.40 2.93 1.96 1.87 1.45 1.55 1.64 1.09 1.14 2.60 2.75
B Mining and quarrying 0.59 0.71 0.24 0.12 2.85 3.06 0.47 0.23 1.95 1.52 0.43 0.31 4.65 4.65 1.81 1.74 0.88 0.39 0.48 0.25 0.35 0.56 0.23 0.19 0.40 0.33
C Manufacturing 1.09 1.17 1.01 0.82 0.76 1.08 0.52 0.37 1.40 1.59 1.20 1.46 0.83 0.71 0.92 0.99 0.59 0.59 0.97 0.87 1.39 0.99 0.82 0.64 1.24 1.46
CA Food products; beverages and tobacco products 0.93 0.96 1.06 1.01 1.29 1.91 1.62 1.01 1.63 1.22 0.87 0.84 1.13 0.72 1.38 0.99 1.30 1.60 1.10 1.32 0.70 0.79 1.05 0.94 1.46 1.10
CB Textiles, clothing, leather & footwear 0.79 0.62 0.96 0.81 1.93 4.03 0.68 0.21 1.37 1.12 0.46 0.58 0.42 0.29 2.33 1.71 1.44 0.82 1.21 0.98 0.45 0.42 0.63 0.52 1.53 0.94
CC Wood, paper, printing and reproduction 1.63 1.56 0.91 0.83 0.34 0.87 0.75 0.66 1.15 1.35 0.99 1.01 0.91 0.56 1.98 2.88 0.44 0.64 0.97 0.99 4.23 2.54 0.69 0.58 0.85 0.89
CD Coke and refined petroleum products 2.00 0.37 1.44 0.93 6.34 1.62 0.42 0.01 1.36 0.33 0.89 0.55 0.11 0.65 0.35 3.55 2.47 4.28 1.44 0.58 1.08 1.55 0.55 0.39 4.23 5.37
CE Chemicals and chemical products 0.61 0.94 2.16 1.83 0.79 0.68 0.25 0.14 1.09 0.84 1.36 1.55 0.50 0.64 0.56 0.69 0.44 0.26 0.91 0.99 0.88 0.91 0.83 0.77 0.83 0.69
CF Pharmaceuticals 0.86 1.56 1.50 1.21 0.72 0.62 0.49 0.51 0.65 0.61 0.77 1.17 1.90 2.50 0.11 0.12 0.32 0.54 0.88 0.72 0.38 0.96 0.99 0.53 1.73 2.49
CG Rubber & plastic, other non-metallic mineral products 1.17 1.20 0.96 0.85 0.53 1.17 0.76 0.69 2.00 2.32 1.12 1.27 0.90 0.70 0.84 0.96 0.74 0.48 1.26 1.07 0.93 0.91 0.83 0.60 1.16 1.56
CH Basic metals and metal products 1.20 1.32 1.12 0.80 0.67 1.05 0.32 0.33 1.50 1.68 1.19 1.37 0.65 0.48 0.54 0.68 0.38 0.55 1.11 0.95 1.08 0.93 0.83 0.63 0.90 0.91
CI Computer, electronic & optical 1.32 1.19 0.74 0.55 0.25 0.59 0.02 0.01 0.76 1.04 1.29 1.73 0.99 1.09 0.61 1.33 0.29 0.09 0.49 0.34 5.28 0.71 0.85 0.43 1.74 2.74
CJ Electrical equipment 1.14 1.41 0.76 0.52 0.32 0.74 0.11 0.12 1.46 2.19 1.91 2.12 0.56 0.47 0.51 1.10 0.27 0.35 0.70 0.61 0.82 0.98 0.71 0.47 1.83 1.13
CK Machinery and equipment n.e.c. 1.12 1.47 0.64 0.61 0.45 0.74 0.10 0.08 1.13 1.38 1.78 2.09 1.31 1.15 0.23 0.34 0.13 0.12 0.53 0.47 1.23 1.46 0.52 0.40 0.59 1.95
CL Motor vehicles and other transport equipment 0.78 0.84 1.02 0.57 0.16 0.36 0.05 0.02 1.77 3.07 1.68 2.51 0.26 0.11 0.25 0.45 0.18 0.13 1.16 0.84 0.39 0.29 0.85 0.54 1.81 2.22
CM Furniture, other manufacturing and repair of machinery 1.06 1.17 0.47 0.46 0.45 0.93 0.53 0.27 1.37 1.43 0.96 1.14 0.96 0.72 1.69 1.15 0.50 0.28 0.81 0.75 1.01 0.85 1.10 1.01 0.64 0.88
D Electricity and gas 1.12 0.86 1.20 1.01 2.36 1.81 0.81 0.96 1.43 1.74 0.85 0.88 1.03 0.75 1.34 1.58 1.01 1.17 0.88 0.97 0.77 1.05 0.96 0.71 1.55 1.20
E Water supply 1.24 1.10 0.85 0.82 0.98 1.30 0.74 1.05 1.14 1.22 1.18 1.14 0.81 0.76 0.95 0.92 0.74 1.23 0.95 1.01 0.74 0.89 0.69 0.83 1.14 1.19
F Construction 1.29 1.10 0.88 0.95 0.84 0.96 1.46 0.95 1.10 1.02 0.88 0.76 0.92 0.77 0.99 1.26 1.20 0.40 1.72 1.63 1.06 1.12 0.84 1.01 0.89 0.62
G Wholesale and retail trade 1.14 1.10 0.99 1.08 0.89 1.01 1.04 1.04 1.05 0.99 0.88 0.79 1.04 1.01 1.07 1.08 1.27 1.04 0.96 1.05 0.81 0.90 0.95 0.98 0.77 0.87
H Transportation and storage 1.11 0.96 1.22 1.16 1.68 1.38 1.03 0.95 1.47 1.28 0.83 0.78 1.31 1.30 2.07 1.67 1.01 1.25 0.97 1.03 1.27 1.10 0.92 0.94 1.17 1.26
I Accommodation and food service activities 1.33 1.62 0.54 0.56 0.71 0.58 3.13 2.25 1.01 0.59 0.55 0.54 0.47 0.46 0.51 0.55 2.39 2.24 2.46 2.48 0.43 0.55 0.80 0.79 0.62 0.46
J Information & communication 0.70 0.70 0.82 0.90 0.66 1.16 0.97 0.93 0.92 1.09 0.89 0.88 0.89 0.92 1.05 1.02 0.80 1.05 0.95 0.94 1.01 1.09 1.05 0.98 1.02 1.13
K Financial and insurance activities 1.14 0.86 1.26 1.15 0.50 1.45 1.51 1.70 0.57 0.77 0.89 0.77 0.97 1.21 0.82 0.56 1.13 0.87 0.94 0.74 0.91 0.50 0.91 0.85 0.75 0.77
L Real estate activities 0.85 0.96 0.98 0.87 1.37 0.90 0.98 1.12 0.68 0.69 1.13 1.18 1.02 1.05 1.32 1.16 1.17 1.54 0.64 0.76 1.01 1.21 1.21 1.28 0.91 0.87
M Professional, scientific and technical activities 0.67 0.82 1.25 1.48 0.26 0.61 0.67 1.06 0.72 0.86 1.16 1.01 0.79 0.92 0.55 0.75 0.56 0.50 0.56 0.73 0.61 0.82 0.95 1.13 0.71 0.88
N Administrative and support service activities 0.78 1.03 0.99 1.07 0.68 0.37 0.36 0.30 0.42 0.44 1.11 1.20 0.52 0.68 0.42 0.94 0.28 0.46 0.75 0.79 0.48 0.86 1.53 1.41 0.68 0.80
O Public administration 0.94 0.86 1.05 1.16 1.06 0.79 1.38 1.59 1.02 0.97 0.98 0.91 0.95 0.97 0.93 0.97 1.25 1.47 0.90 1.00 0.87 0.92 1.20 1.16 1.31 1.24
P Education 1.08 1.08 1.28 1.41 1.14 0.77 1.07 1.35 0.76 0.84 0.91 0.90 1.11 1.17 1.03 0.87 1.08 1.13 0.99 1.02 0.93 1.04 1.14 1.12 0.96 0.90
Q Human health activities 0.88 0.88 1.04 1.08 0.51 0.50 0.57 0.58 0.57 0.61 1.04 1.02 1.66 1.56 0.48 0.47 0.46 0.66 0.83 0.87 1.24 1.41 1.19 1.25 0.70 0.59
R Arts, entertainment and recreation 0.91 0.96 0.54 0.51 0.69 1.03 1.14 1.31 1.02 0.77 1.20 1.09 1.28 1.11 1.25 1.06 0.84 1.44 1.45 1.35 0.93 1.04 1.00 1.12 1.13 0.82
S Other service activities 0.92 0.92 0.67 0.75 0.36 0.61 1.01 0.87 0.82 0.75 1.55 1.66 1.00 1.12 0.55 0.53 1.06 1.44 0.54 0.62 0.81 1.04 0.94 0.92 1.04 1.02
T Households as employers 0.08 0.07 0.47 0.24 n.a. n.a. 1.09 2.35 0.03 0.02 0.67 0.61 0.23 0.28 n.a. n.a. 1.30 1.41 2.13 1.67 0.10 0.26 0.74 0.78 0.04 0.03
HUES FI FRAT BE BG CY CZ DK EE ELDE
26
Code Sector 2000 2012 2000 2012 2000 2012 2000 2012 2000 2010 2000 2012 2000 2012 2000 2011 2000 2011 2000 2011 2000 2012 2000 2012 2000 2012 2000 2011
A Agriculture, forestry and fishing 1.61 0.92 1.24 1.17 2.79 2.30 0.30 0.20 2.01 3.05 0.97 0.89 1.11 0.98 2.19 2.34 1.60 1.27 5.35 4.33 0.89 0.96 1.49 1.56 1.98 1.82 0.40 0.40
B Mining and quarrying 0.79 0.46 0.81 0.49 1.05 0.52 0.22 0.11 0.19 0.82 0.25 0.17 3.75 4.97 3.74 3.56 0.86 0.56 3.50 1.89 0.41 1.14 0.98 0.58 1.22 0.66 4.30 2.99
C Manufacturing 1.40 1.51 1.09 1.01 1.02 1.34 0.59 0.34 0.78 1.18 1.12 0.82 0.79 0.81 0.93 1.12 0.92 0.89 1.19 1.60 1.02 1.07 1.32 1.34 1.29 1.40 0.84 0.67
CA Food products; beverages and tobacco products 1.67 2.33 0.92 0.93 2.10 2.30 0.43 0.35 n.a. n.a. 1.33 0.83 1.18 1.39 1.45 1.44 0.92 1.08 2.97 3.08 0.75 0.69 1.18 0.73 1.31 0.85 1.02 0.81
CB Textiles, clothing, leather & footwear 0.33 0.14 2.38 2.80 3.54 2.78 0.58 0.69 1.59 1.29 2.09 0.67 0.33 0.40 1.11 1.06 3.04 3.81 2.50 4.85 0.24 0.23 2.22 1.42 1.93 1.67 0.68 0.53
CC Wood, paper, printing and reproduction 0.68 0.43 0.95 0.89 1.24 2.01 0.44 0.34 2.42 3.35 0.80 1.05 0.84 0.70 1.11 1.42 1.38 1.36 0.95 1.75 2.25 1.87 1.61 1.58 1.42 1.67 0.91 0.73
CD Coke and refined petroleum products 0.08 -0.01 1.04 0.61 n.a. n.a. 0.00 0.00 n.a. 0.01 n.a. n.a. 1.02 2.22 1.78 3.30 0.64 1.02 3.01 2.82 0.67 9.74 0.05 0.01 4.49 1.02 0.69 0.75
CE Chemicals and chemical products 1.28 1.87 0.73 0.61 0.87 2.13 n.a. n.a. n.a. 0.46 0.26 0.20 1.58 1.78 0.79 0.86 0.49 0.52 0.59 0.41 n.a. n.a. 0.96 1.04 1.04 0.46 0.89 0.60
CF Pharmaceuticals 14.69 14.03 0.84 0.70 0.12 0.42 n.a. n.a. 0.38 n.a. 0.27 2.12 0.51 0.39 0.31 0.42 0.50 0.42 0.52 0.14 n.a. n.a. 2.56 3.44 0.57 0.41 0.87 1.51
CG Rubber & plastic, other non-metallic mineral products 0.82 0.35 1.13 0.97 0.73 1.29 1.61 0.87 0.35 0.83 1.11 0.85 0.60 0.56 1.34 1.70 1.28 1.25 0.96 0.78 0.60 0.73 1.39 1.57 1.41 1.72 0.81 0.58
CH Basic metals and metal products 0.34 0.19 1.20 1.15 0.25 0.49 1.36 0.42 0.52 0.69 0.22 0.17 0.70 0.58 0.77 1.10 0.74 0.81 0.79 1.07 1.21 1.09 1.60 1.69 1.58 1.88 0.73 0.51
CI Computer, electronic & optical 3.39 3.01 0.68 1.08 0.83 0.57 n.a. n.a. 0.19 0.34 n.a. n.a. 0.92 0.63 0.40 0.62 0.68 0.75 0.81 2.12 1.50 2.15 1.15 0.99 0.64 1.51 1.08 0.99
CJ Electrical equipment 0.59 0.12 0.89 0.91 0.37 0.42 n.a. n.a. 0.23 0.27 0.44 0.24 0.34 0.20 0.75 0.85 0.67 0.62 0.67 1.40 0.90 0.85 2.07 2.43 0.99 1.10 0.62 0.41
CK Machinery and equipment n.e.c. 0.30 0.31 1.31 1.26 0.14 0.33 n.a. n.a. 0.22 0.17 0.12 0.08 0.60 0.75 0.51 0.54 0.28 0.25 0.60 0.47 1.26 1.30 0.60 0.82 0.87 0.87 0.65 0.46
CL Motor vehicles and other transport equipment 0.21 0.08 0.77 0.54 0.36 0.35 0.03 0.06 0.21 0.19 n.a. n.a. 0.42 0.35 0.64 1.11 0.73 0.55 0.68 2.51 1.73 1.02 0.66 1.13 1.16 2.85 0.99 0.77
CM Furniture, other manufacturing and repair of machinery 1.55 2.36 1.24 1.09 0.87 2.09 0.12 0.18 n.a. n.a. 2.30 1.90 1.13 1.13 1.17 1.19 0.76 0.75 1.09 1.32 0.81 0.73 1.36 1.17 1.16 1.19 0.88 0.57
D Electricity and gas 0.60 0.89 0.71 0.68 1.70 1.29 0.52 0.32 1.86 1.63 n.a. n.a. 0.56 0.92 1.35 1.51 1.02 1.25 1.38 2.22 1.05 1.31 1.02 1.27 1.64 1.75 0.76 0.57
E Water supply 0.60 0.64 0.72 0.81 0.98 0.96 0.81 0.63 0.57 0.92 n.a. n.a. 1.06 0.84 1.20 1.24 0.78 1.19 0.82 1.67 0.72 0.71 1.13 1.04 1.20 0.82 1.12 1.16
F Construction 1.22 0.25 0.85 0.95 1.00 0.97 1.08 1.00 1.13 0.85 0.88 0.65 0.95 0.80 1.31 1.33 1.37 0.94 0.96 1.49 0.71 0.90 1.11 0.96 1.21 1.33 1.00 1.03
G Wholesale and retail trade 0.93 0.85 1.06 0.95 1.43 1.62 0.79 1.03 1.50 1.39 1.14 0.89 1.19 1.09 1.67 1.63 1.24 1.23 1.00 0.43 0.87 1.04 0.96 1.06 1.16 1.36 1.02 0.97
H Transportation and storage 0.92 0.87 1.08 1.14 1.69 2.63 1.17 0.89 1.89 2.31 1.55 1.19 1.08 0.90 1.02 1.15 0.86 1.01 1.27 1.38 1.28 1.27 1.06 1.23 1.54 1.11 1.03 0.88
I Accommodation and food service activities 0.81 0.64 1.32 1.35 0.49 0.43 0.70 0.53 0.34 0.48 2.00 1.68 0.66 0.57 0.41 0.39 1.44 1.66 0.76 0.41 0.47 0.53 0.76 0.73 0.52 0.41 0.97 0.87
J Information & communication 1.51 2.00 0.91 0.91 1.00 0.68 1.34 1.39 1.23 0.95 0.91 1.39 1.01 0.99 0.73 0.80 0.75 0.82 1.15 0.84 1.09 1.25 0.82 0.93 0.75 0.95 1.45 1.40
K Financial and insurance activities 1.54 1.67 0.98 0.96 0.40 0.39 5.10 4.37 0.63 0.55 1.29 1.47 1.24 1.53 1.02 0.78 1.15 1.19 0.90 0.51 0.91 0.85 0.99 0.79 0.46 0.72 1.20 1.51
L Real estate activities 0.72 0.66 1.13 1.37 0.72 0.56 0.99 0.93 0.82 0.96 0.57 0.57 0.85 0.57 0.68 0.55 0.81 0.86 0.84 0.94 1.06 0.95 0.81 0.73 0.84 0.65 0.88 1.03
M Professional, scientific and technical activities 0.69 0.72 1.14 1.04 0.45 0.58 0.80 1.25 0.58 0.79 0.58 1.02 1.08 0.96 0.88 0.86 0.64 0.71 0.33 0.72 0.97 1.11 0.80 1.09 0.69 0.88 1.11 1.21
N Administrative and support service activities 0.69 1.19 0.55 0.67 0.33 0.52 0.71 0.81 0.53 0.67 1.04 0.99 1.32 1.31 0.34 0.46 0.56 0.61 0.21 0.52 0.70 0.93 0.64 0.64 0.58 0.58 1.18 1.10
O Public administration 0.62 0.61 0.89 0.99 1.26 0.86 0.78 0.85 1.25 1.10 0.94 0.98 1.05 1.08 0.82 0.74 1.27 1.24 0.79 0.66 0.79 0.74 0.85 0.96 1.16 0.97 0.74 0.77
P Education 0.74 1.12 0.95 0.87 1.21 0.89 0.77 0.86 1.06 0.88 1.00 1.21 0.89 0.99 1.03 0.95 1.30 1.23 0.61 0.76 1.05 1.17 1.08 1.15 0.65 0.68 1.13 1.22
Q Human health activities 0.87 1.10 0.81 0.79 0.54 0.47 0.62 0.77 0.56 0.42 0.74 0.92 1.16 1.42 0.44 0.53 0.80 0.85 0.35 0.43 1.59 1.63 0.83 0.75 0.57 0.45 1.03 1.05
R Arts, entertainment and recreation 1.30 1.30 0.74 0.85 0.56 0.66 0.50 0.61 1.92 1.32 1.40 6.45 0.74 0.70 0.69 0.59 0.58 0.62 1.17 1.24 0.89 0.92 1.30 1.14 0.96 1.79 1.27 1.14
S Other service activities 0.10 0.15 0.89 0.84 0.93 0.51 0.45 0.53 0.34 0.46 0.56 0.54 0.68 0.71 1.17 1.03 0.43 0.66 0.95 0.98 1.15 1.46 0.98 0.66 0.56 0.61 0.73 0.87
T Households as employers 0.20 0.22 1.80 2.34 0.19 0.17 1.08 0.68 n.a. n.a. 0.33 0.74 0.84 0.90 1.33 1.02 1.64 1.87 0.00 0.00 0.04 0.08 0.18 0.17 0.00 n.a. 0.95 0.85
UKRO SE SI SKIE IT LT LU LV PTMT NL PL
Source: own calculations using Eurostat data. Note: na= not available.
27
2.3. SIZE DISTRIBUTION OF ENTERPRISES
The distribution of economic activity according to the size of enterprises provides a measure of the degree of concentration, and of the proportion of an economy represented by large or small firms. This information is useful as part of an overall appreciation of sectoral performance and competitiveness.
The proportion of small and medium-sized enterprises (SMEs)11 varies significantly between sectors. Figure 2.8 below presents, in decreasing order, the sectors dominated by large enterprises (i.e. with 250 or more employees). SMEs are socially and economically important as they represent 99 % of all firms in the EU and provide around 65 million jobs. They are also a major source of new jobs and have strong growth potential. Nearly two million new SMEs are created annually in the EU. SMEs tend to predominate in sectors which are less capital-intensive, and where economies of scale are not crucial. They are also strongly represented in service industries, e.g. retail trades, hotels and restaurants, and business services.
Large enterprises represent more than 80 % of value added in the industries producing tobacco, oil refining, logistics, and motor vehicle, air transport and other transport equipment. In general, SMEs are under-represented in manufacturing, whereas they represent just below 90 % of value added in local services such as real estate.
2.4. INTER-LINKAGES BETWEEN
MANUFACTURING AND SERVICES
Manufacturing firms are increasingly using services as part of their business processes – in the development and sale of products, and
11 Enterprises qualify as SMEs if they meet thresholds as regards:
i) number of employees (10, 50 and 250); and ii) turnover or balance sheet. Eurostat currently collects data as regards the three employee thresholds but not the financial thresholds.
for horizontal business activities such as accounting and logistics.
On the production side, services are often used to increase productivity and reduce costs. Manufacturing firms also use services to upgrade the quality of their products, for which they charge a premium to customers (Nordås and Kim, 2013). They can use complementary or embedded services to differentiate their products from those of their competitors and to reduce the price elasticity of demand. Producing better quality products can also help firms build up long-term relationships with customers.12 The increased use and offering of services by manufacturing firms is analysed in this section via a range of indicators which show how and where services are being used in manufacturing and how their use is changing over time.
Domestic service content of manufacturing production
Manufacturing and services are becoming increasingly interdependent. Between 2000 and 2009, the service content of manufacturing output embodied in domestic final consumption increased (on average by over 2 %) in every Member State for which data were available, except Ireland, the UK and the Netherlands. Therefore, the financial crisis does not appear to have had a significant negative impact on the service content of manufactured goods (see Figure 2.9).
12 DG Enterprise and Industry (2011), EU Industrial Structure
2011: Trends and Performance.

28
Figure 2.8. Distribution of value added by sector and employee numbers (2010)
0 10 20 30 40 50 60 70 80 90 100
TOTAL (**)
CONSTRUCTION
MARKET SERVICES (*)
WATER SUPPLY
MANUFACTURING
ELECTRICITY AND GAS
Remediation activities
Real estate activities
Printing
Construction
Wholesale and retail trade
Wood & wood products
Accommodation & food
Professional, scientific and technical activities
Metal products
Textiles
Wholesale trade
Clothing
Furniture
Leather & footwear
Repair of machinery
Waste collection
Inland transport
Other manufacturing
Administration
Rubber & plastics
Sewerage
Retail trade
Water transport
Non-metallic mineral products
Food products
Machinery n.e.c.
Warehousing & support activities for transportation
Paper
Information & communication
Computers, electronic & optical
Chemicals
Water collection
Beverages
Electrical equipment
Basic metals
Electricity and gas
Air transport
Other transport equipment
Pharmaceuticals
Motor vehicles
Postal & courier
Refined petroleum
Tobacco
0-9 10-19 20-49 50-249 250 or more
Source: own calculations using Eurostat data.
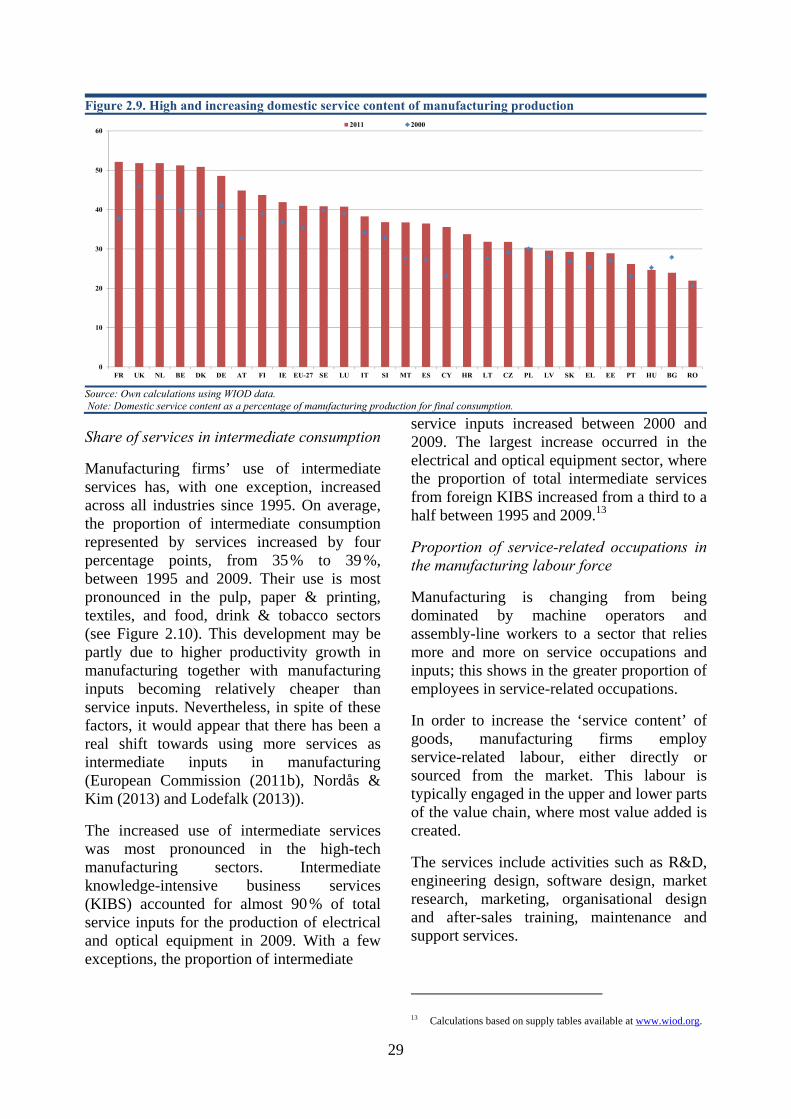
29
Share of services in intermediate consumption
Manufacturing firms’ use of intermediate services has, with one exception, increased across all industries since 1995. On average, the proportion of intermediate consumption represented by services increased by four percentage points, from 35 % to 39 %, between 1995 and 2009. Their use is most pronounced in the pulp, paper & printing, textiles, and food, drink & tobacco sectors (see Figure 2.10). This development may be partly due to higher productivity growth in manufacturing together with manufacturing inputs becoming relatively cheaper than service inputs. Nevertheless, in spite of these factors, it would appear that there has been a real shift towards using more services as intermediate inputs in manufacturing (European Commission (2011b), Nordås & Kim (2013) and Lodefalk (2013)).
The increased use of intermediate services was most pronounced in the high-tech manufacturing sectors. Intermediate knowledge-intensive business services (KIBS) accounted for almost 90 % of total service inputs for the production of electrical and optical equipment in 2009. With a few exceptions, the proportion of intermediate
service inputs increased between 2000 and 2009. The largest increase occurred in the electrical and optical equipment sector, where the proportion of total intermediate services from foreign KIBS increased from a third to a half between 1995 and 2009.13
Proportion of service-related occupations in the manufacturing labour force
Manufacturing is changing from being dominated by machine operators and assembly-line workers to a sector that relies more and more on service occupations and inputs; this shows in the greater proportion of employees in service-related occupations.
In order to increase the ‘service content’ of goods, manufacturing firms employ service-related labour, either directly or sourced from the market. This labour is typically engaged in the upper and lower parts of the value chain, where most value added is created.
The services include activities such as R&D, engineering design, software design, market research, marketing, organisational design and after-sales training, maintenance and support services.
13 Calculations based on supply tables available at www.wiod.org.
Figure 2.9. High and increasing domestic service content of manufacturing production
0
10
20
30
40
50
60
FR UK NL BE DK DE AT FI IE EU-27 SE LU IT SI MT ES CY HR LT CZ PL LV SK EL EE PT HU BG RO
2011 2000
Source: Own calculations using WIOD data. Note: Domestic service content as a percentage of manufacturing production for final consumption.
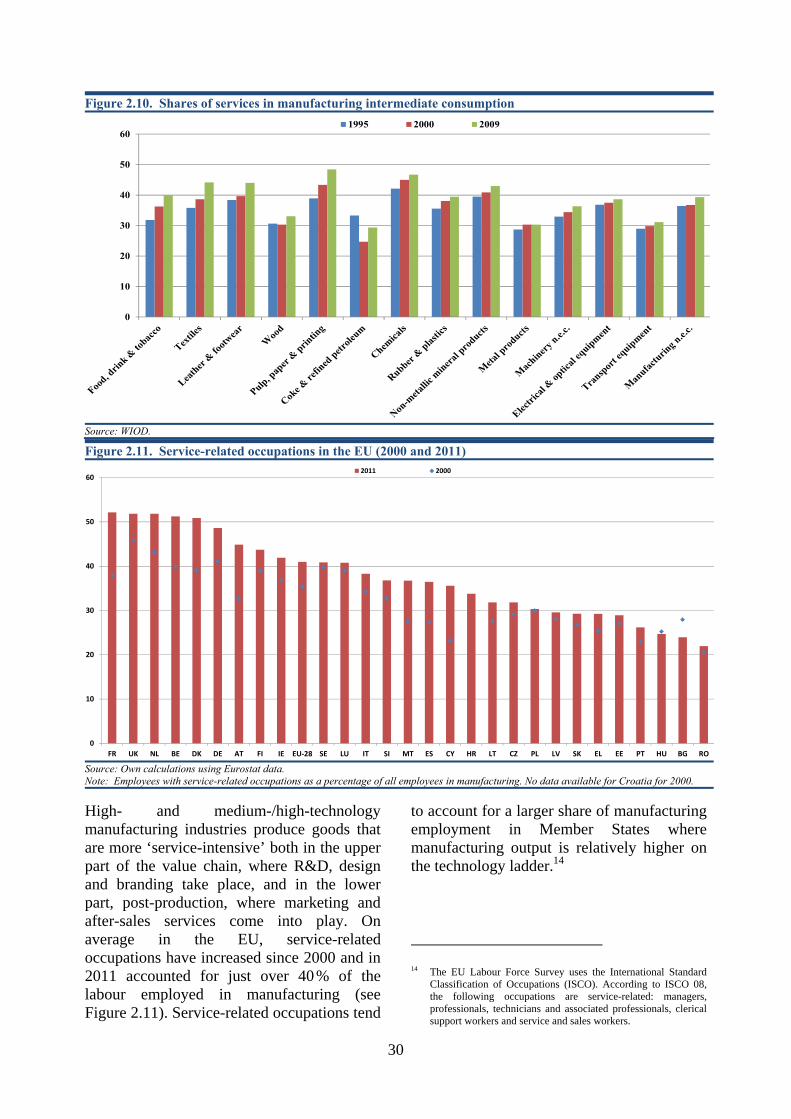
30
High- and medium-/high-technology manufacturing industries produce goods that are more ‘service-intensive’ both in the upper part of the value chain, where R&D, design and branding take place, and in the lower part, post-production, where marketing and after-sales services come into play. On average in the EU, service-related occupations have increased since 2000 and in 2011 accounted for just over 40 % of the labour employed in manufacturing (see Figure 2.11). Service-related occupations tend
to account for a larger share of manufacturing employment in Member States where manufacturing output is relatively higher on the technology ladder.14
14 The EU Labour Force Survey uses the International Standard
Classification of Occupations (ISCO). According to ISCO 08, the following occupations are service-related: managers, professionals, technicians and associated professionals, clerical support workers and service and sales workers.
Figure 2.10. Shares of services in manufacturing intermediate consumption
0
10
20
30
40
50
601995 2000 2009
Source: WIOD.
Figure 2.11. Service-related occupations in the EU (2000 and 2011)
0
10
20
30
40
50
60
FR UK NL BE DK DE AT FI IE EU-28 SE LU IT SI MT ES CY HR LT CZ PL LV SK EL EE PT HU BG RO
2011 2000
Source: Own calculations using Eurostat data. Note: Employees with service-related occupations as a percentage of all employees in manufacturing. No data available for Croatia for 2000.
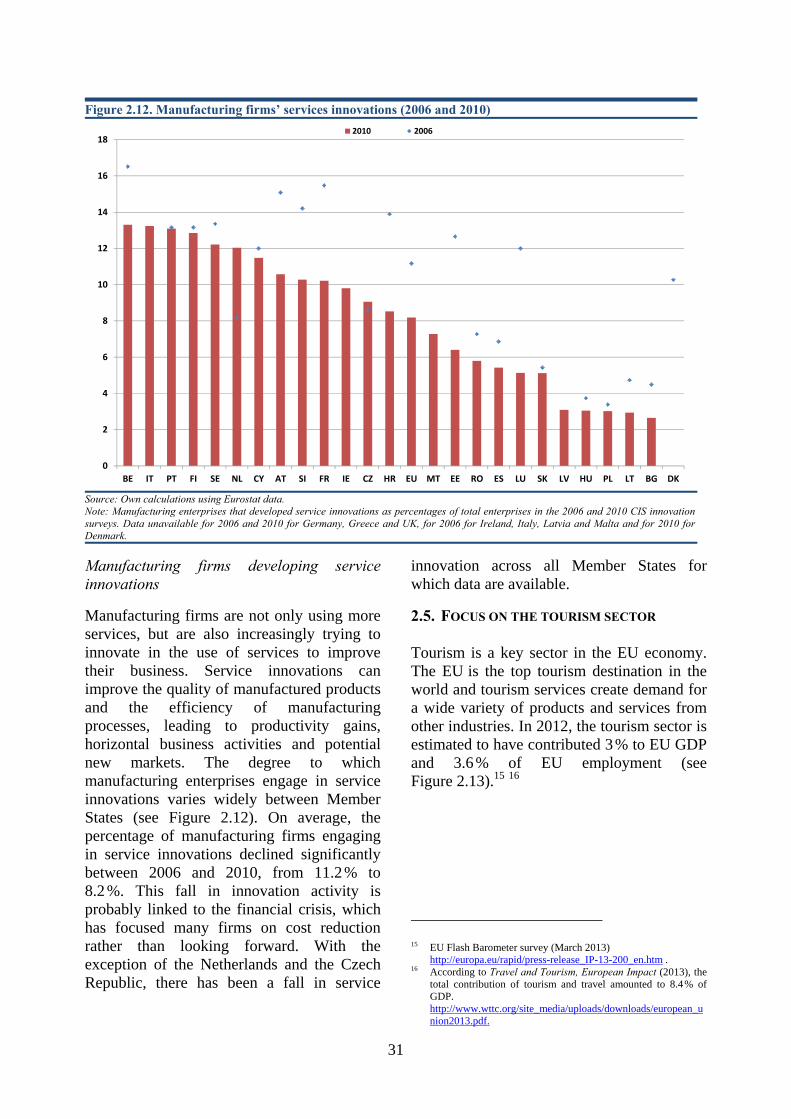
31
Manufacturing firms developing service innovations
Manufacturing firms are not only using more services, but are also increasingly trying to innovate in the use of services to improve their business. Service innovations can improve the quality of manufactured products and the efficiency of manufacturing processes, leading to productivity gains, horizontal business activities and potential new markets. The degree to which manufacturing enterprises engage in service innovations varies widely between Member States (see Figure 2.12). On average, the percentage of manufacturing firms engaging in service innovations declined significantly between 2006 and 2010, from 11.2 % to 8.2 %. This fall in innovation activity is probably linked to the financial crisis, which has focused many firms on cost reduction rather than looking forward. With the exception of the Netherlands and the Czech Republic, there has been a fall in service
innovation across all Member States for which data are available.
2.5. FOCUS ON THE TOURISM SECTOR
Tourism is a key sector in the EU economy. The EU is the top tourism destination in the world and tourism services create demand for a wide variety of products and services from other industries. In 2012, the tourism sector is estimated to have contributed 3 % to EU GDP and 3.6 % of EU employment (see Figure 2.13).15 16
15 EU Flash Barometer survey (March 2013)
http://europa.eu/rapid/press-release_IP-13-200_en.htm . 16 According to Travel and Tourism, European Impact (2013), the
total contribution of tourism and travel amounted to 8.4 % of GDP. http://www.wttc.org/site_media/uploads/downloads/european_union2013.pdf.
Figure 2.12. Manufacturing firms’ services innovations (2006 and 2010)
0
2
4
6
8
10
12
14
16
18
BE IT PT FI SE NL CY AT SI FR IE CZ HR EU MT EE RO ES LU SK LV HU PL LT BG DK
2010 2006
Source: Own calculations using Eurostat data. Note: Manufacturing enterprises that developed service innovations as percentages of total enterprises in the 2006 and 2010 CIS innovation surveys. Data unavailable for 2006 and 2010 for Germany, Greece and UK, for 2006 for Ireland, Italy, Latvia and Malta and for 2010 for Denmark.

32
Spain (12 %), Italy (8 %) and France (7 %) are the most popular destinations in the EU. Croatia (3 %) was also among the preferred destinations in 2012.17 EU tourism is mainly driven by the attraction of sunshine and beaches (40 %) and the desire to visit friends and relatives (36 %). A large proportion of EU respondents (58 %) spent their holidays in their own country. This was most common in Greece (87 %), Italy (80 %), Bulgaria (79 %), Spain (73 %) and Croatia (74 %).
17 Ibid.
Demand for tourism services is sensitive to fluctuations in the business cycle. Also, political events and natural disasters have an impact on the demand for certain destinations. Despite its cyclical nature, the EU tourism industry has shown resilience during the recent crisis. In terms of the number of nights spent in tourism accommodation (a narrow but representative indicator of tourism activity), there was a decline in 2008 and 2009 in the total number of tourists, resident and non-resident, in the destination country. This was steeper than the decline in private consumption as a whole, reflecting higher income elasticities for tourism services.
The fall in the number of nights spent by non-residents in tourist accommodation was more pronounced than that for residents, indicating greater income elasticity for the former. Euro-area tourism may also have been partly supported by a weaker euro.18 Political events, such as the turbulence in North Africa, towards the end of 2010 and in 2011, may have reduced non-residents’ demand for tourism (see Figure 2.14).
Seven out of ten Europeans are estimated to have travelled in 2012 (roughly the same proportion as in 2011). Around 88 % of EU tourists spent their holiday in the EU, either in their own country or another Member State.
18 A depreciating euro leads to relatively higher prices for
destinations outside the euro area. Both the income and substitution effect of higher prices would dampen demand for those destinations. This also applies for non-euro Member States whose currencies depreciate.
Figure 2.13. Contribution of tourism to selected economies
0 2 4 6 8 10 12
CanadaDenmark
LuxembourgFinland
IsraelSlovak Republic
S. KoreaAustralia
JapanCzech Republic
TurkeyUnited States
NetherlandsSweden
SwitzerlandChile
NorwayIreland
ItalyUnited Kingdom
GermanyEstoniaPoland
SloveniaAustria
HungaryIcelandFrance
MexicoNew Zealand
PortugalSpain
Greece
Tourism as % of total employment Tourism as % of GDP
Source: OECD. Note: data reported for latest available year (2008-10).
Figure 2.14. Nights spent in tourism accommodation (% annual change)
-8%
-6%
-4%
-2%
0%
2%
4%
6%
8%
2005 2006 2007 2008 2009 2010 2011
Residents Non-residents Tourism combined Private consumption
Source: Own calculations based on Eurostat data
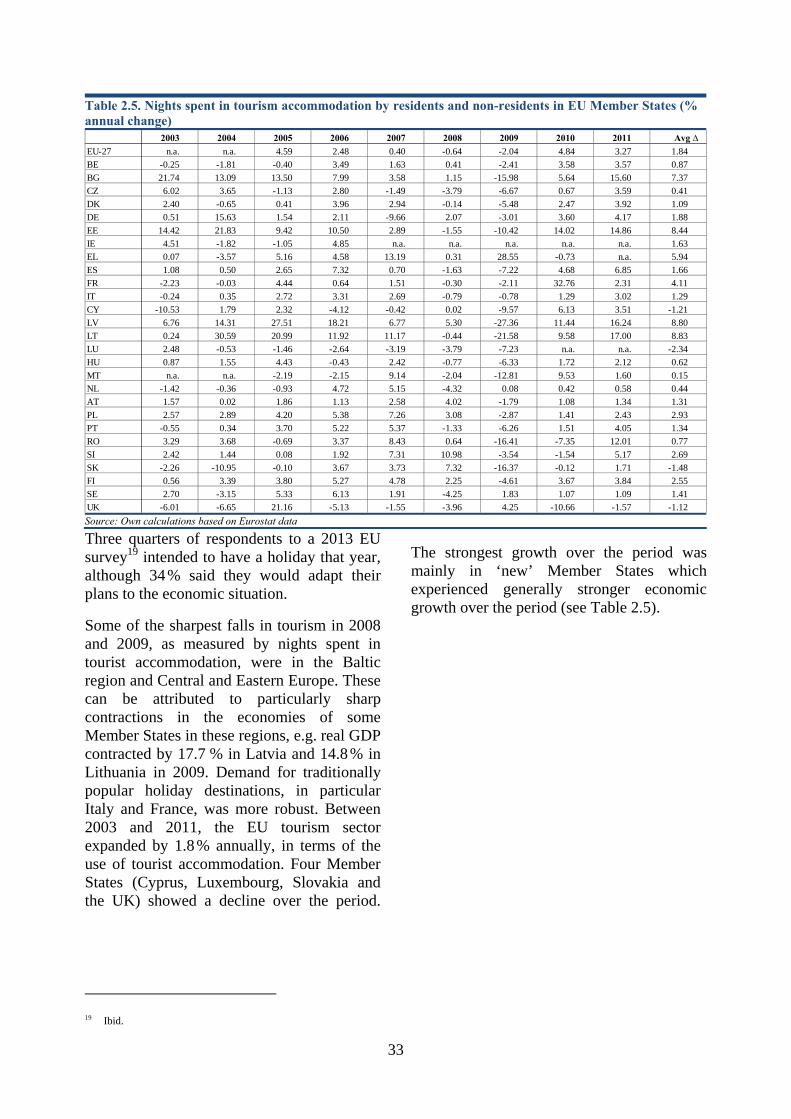
33
Three quarters of respondents to a 2013 EU survey19 intended to have a holiday that year, although 34 % said they would adapt their plans to the economic situation.
Some of the sharpest falls in tourism in 2008 and 2009, as measured by nights spent in tourist accommodation, were in the Baltic region and Central and Eastern Europe. These can be attributed to particularly sharp contractions in the economies of some Member States in these regions, e.g. real GDP contracted by 17.7 % in Latvia and 14.8 % in Lithuania in 2009. Demand for traditionally popular holiday destinations, in particular Italy and France, was more robust. Between 2003 and 2011, the EU tourism sector expanded by 1.8 % annually, in terms of the use of tourist accommodation. Four Member States (Cyprus, Luxembourg, Slovakia and the UK) showed a decline over the period.
19 Ibid.
The strongest growth over the period was mainly in ‘new’ Member States which experienced generally stronger economic growth over the period (see Table 2.5).
Table 2.5. Nights spent in tourism accommodation by residents and non-residents in EU Member States (% annual change)
2003 2004 2005 2006 2007 2008 2009 2010 2011 Avg ∆EU-27 n.a. n.a. 4.59 2.48 0.40 -0.64 -2.04 4.84 3.27 1.84BE -0.25 -1.81 -0.40 3.49 1.63 0.41 -2.41 3.58 3.57 0.87BG 21.74 13.09 13.50 7.99 3.58 1.15 -15.98 5.64 15.60 7.37CZ 6.02 3.65 -1.13 2.80 -1.49 -3.79 -6.67 0.67 3.59 0.41DK 2.40 -0.65 0.41 3.96 2.94 -0.14 -5.48 2.47 3.92 1.09DE 0.51 15.63 1.54 2.11 -9.66 2.07 -3.01 3.60 4.17 1.88EE 14.42 21.83 9.42 10.50 2.89 -1.55 -10.42 14.02 14.86 8.44IE 4.51 -1.82 -1.05 4.85 n.a. n.a. n.a. n.a. n.a. 1.63EL 0.07 -3.57 5.16 4.58 13.19 0.31 28.55 -0.73 n.a. 5.94ES 1.08 0.50 2.65 7.32 0.70 -1.63 -7.22 4.68 6.85 1.66FR -2.23 -0.03 4.44 0.64 1.51 -0.30 -2.11 32.76 2.31 4.11IT -0.24 0.35 2.72 3.31 2.69 -0.79 -0.78 1.29 3.02 1.29CY -10.53 1.79 2.32 -4.12 -0.42 0.02 -9.57 6.13 3.51 -1.21LV 6.76 14.31 27.51 18.21 6.77 5.30 -27.36 11.44 16.24 8.80LT 0.24 30.59 20.99 11.92 11.17 -0.44 -21.58 9.58 17.00 8.83LU 2.48 -0.53 -1.46 -2.64 -3.19 -3.79 -7.23 n.a. n.a. -2.34HU 0.87 1.55 4.43 -0.43 2.42 -0.77 -6.33 1.72 2.12 0.62MT n.a. n.a. -2.19 -2.15 9.14 -2.04 -12.81 9.53 1.60 0.15NL -1.42 -0.36 -0.93 4.72 5.15 -4.32 0.08 0.42 0.58 0.44AT 1.57 0.02 1.86 1.13 2.58 4.02 -1.79 1.08 1.34 1.31PL 2.57 2.89 4.20 5.38 7.26 3.08 -2.87 1.41 2.43 2.93PT -0.55 0.34 3.70 5.22 5.37 -1.33 -6.26 1.51 4.05 1.34RO 3.29 3.68 -0.69 3.37 8.43 0.64 -16.41 -7.35 12.01 0.77SI 2.42 1.44 0.08 1.92 7.31 10.98 -3.54 -1.54 5.17 2.69SK -2.26 -10.95 -0.10 3.67 3.73 7.32 -16.37 -0.12 1.71 -1.48FI 0.56 3.39 3.80 5.27 4.78 2.25 -4.61 3.67 3.84 2.55SE 2.70 -3.15 5.33 6.13 1.91 -4.25 1.83 1.07 1.09 1.41UK -6.01 -6.65 21.16 -5.13 -1.55 -3.96 4.25 -10.66 -1.57 -1.12Source: Own calculations based on Eurostat data

34
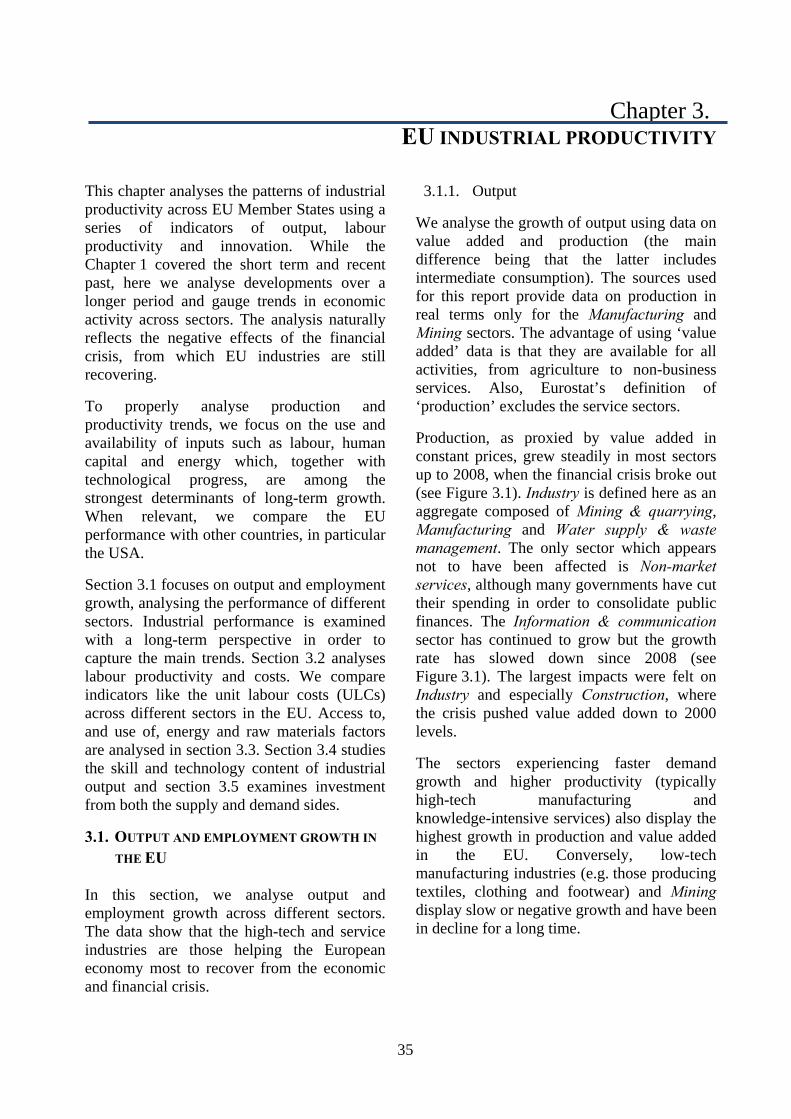
35
Chapter 3. EU INDUSTRIAL PRODUCTIVITY
This chapter analyses the patterns of industrial productivity across EU Member States using a series of indicators of output, labour productivity and innovation. While the Chapter 1 covered the short term and recent past, here we analyse developments over a longer period and gauge trends in economic activity across sectors. The analysis naturally reflects the negative effects of the financial crisis, from which EU industries are still recovering.
To properly analyse production and productivity trends, we focus on the use and availability of inputs such as labour, human capital and energy which, together with technological progress, are among the strongest determinants of long-term growth. When relevant, we compare the EU performance with other countries, in particular the USA.
Section 3.1 focuses on output and employment growth, analysing the performance of different sectors. Industrial performance is examined with a long-term perspective in order to capture the main trends. Section 3.2 analyses labour productivity and costs. We compare indicators like the unit labour costs (ULCs) across different sectors in the EU. Access to, and use of, energy and raw materials factors are analysed in section 3.3. Section 3.4 studies the skill and technology content of industrial output and section 3.5 examines investment from both the supply and demand sides.
3.1. OUTPUT AND EMPLOYMENT GROWTH IN
THE EU
In this section, we analyse output and employment growth across different sectors. The data show that the high-tech and service industries are those helping the European economy most to recover from the economic and financial crisis.
3.1.1. Output
We analyse the growth of output using data on value added and production (the main difference being that the latter includes intermediate consumption). The sources used for this report provide data on production in real terms only for the Manufacturing and Mining sectors. The advantage of using ‘value added’ data is that they are available for all activities, from agriculture to non-business services. Also, Eurostat’s definition of ‘production’ excludes the service sectors.
Production, as proxied by value added in constant prices, grew steadily in most sectors up to 2008, when the financial crisis broke out (see Figure 3.1). Industry is defined here as an aggregate composed of Mining & quarrying, Manufacturing and Water supply & waste management. The only sector which appears not to have been affected is Non-market services, although many governments have cut their spending in order to consolidate public finances. The Information & communication sector has continued to grow but the growth rate has slowed down since 2008 (see Figure 3.1). The largest impacts were felt on Industry and especially Construction, where the crisis pushed value added down to 2000 levels.
The sectors experiencing faster demand growth and higher productivity (typically high-tech manufacturing and knowledge-intensive services) also display the highest growth in production and value added in the EU. Conversely, low-tech manufacturing industries (e.g. those producing textiles, clothing and footwear) and Mining display slow or negative growth and have been in decline for a long time.
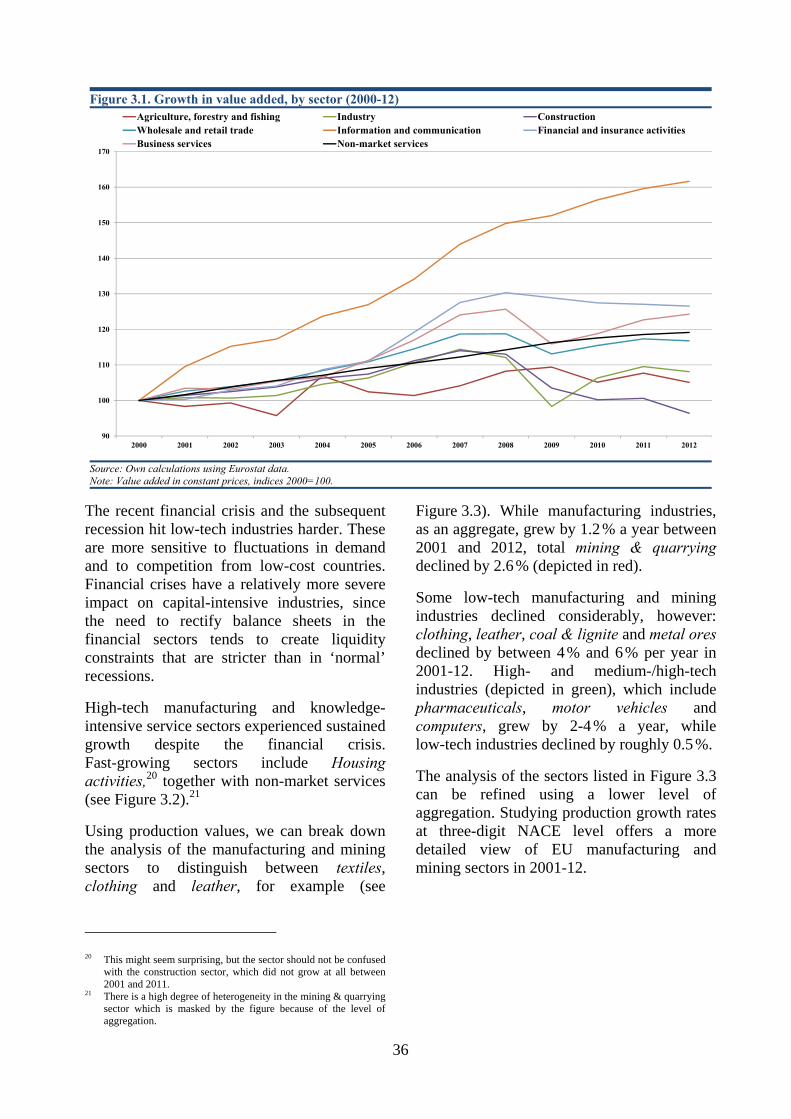
36
The recent financial crisis and the subsequent recession hit low-tech industries harder. These are more sensitive to fluctuations in demand and to competition from low-cost countries. Financial crises have a relatively more severe impact on capital-intensive industries, since the need to rectify balance sheets in the financial sectors tends to create liquidity constraints that are stricter than in ‘normal’ recessions.
High-tech manufacturing and knowledge-intensive service sectors experienced sustained growth despite the financial crisis. Fast-growing sectors include Housing activities,20 together with non-market services (see Figure 3.2).21
Using production values, we can break down the analysis of the manufacturing and mining sectors to distinguish between textiles, clothing and leather, for example (see
20 This might seem surprising, but the sector should not be confused
with the construction sector, which did not grow at all between 2001 and 2011.
21 There is a high degree of heterogeneity in the mining & quarrying sector which is masked by the figure because of the level of aggregation.
Figure 3.3). While manufacturing industries, as an aggregate, grew by 1.2 % a year between 2001 and 2012, total mining & quarrying declined by 2.6 % (depicted in red).
Some low-tech manufacturing and mining industries declined considerably, however: clothing, leather, coal & lignite and metal ores declined by between 4 % and 6 % per year in 2001-12. High- and medium-/high-tech industries (depicted in green), which include pharmaceuticals, motor vehicles and computers, grew by 2-4 % a year, while low-tech industries declined by roughly 0.5 %.
The analysis of the sectors listed in Figure 3.3 can be refined using a lower level of aggregation. Studying production growth rates at three-digit NACE level offers a more detailed view of EU manufacturing and mining sectors in 2001-12.
Figure 3.1. Growth in value added, by sector (2000-12)
90
100
110
120
130
140
150
160
170
2000 2001 2002 2003 2004 2005 2006 2007 2008 2009 2010 2011 2012
Agriculture, forestry and fishing Industry ConstructionWholesale and retail trade Information and communication Financial and insurance activitiesBusiness services Non-market services
Source: Own calculations using Eurostat data. Note: Value added in constant prices, indices 2000=100.
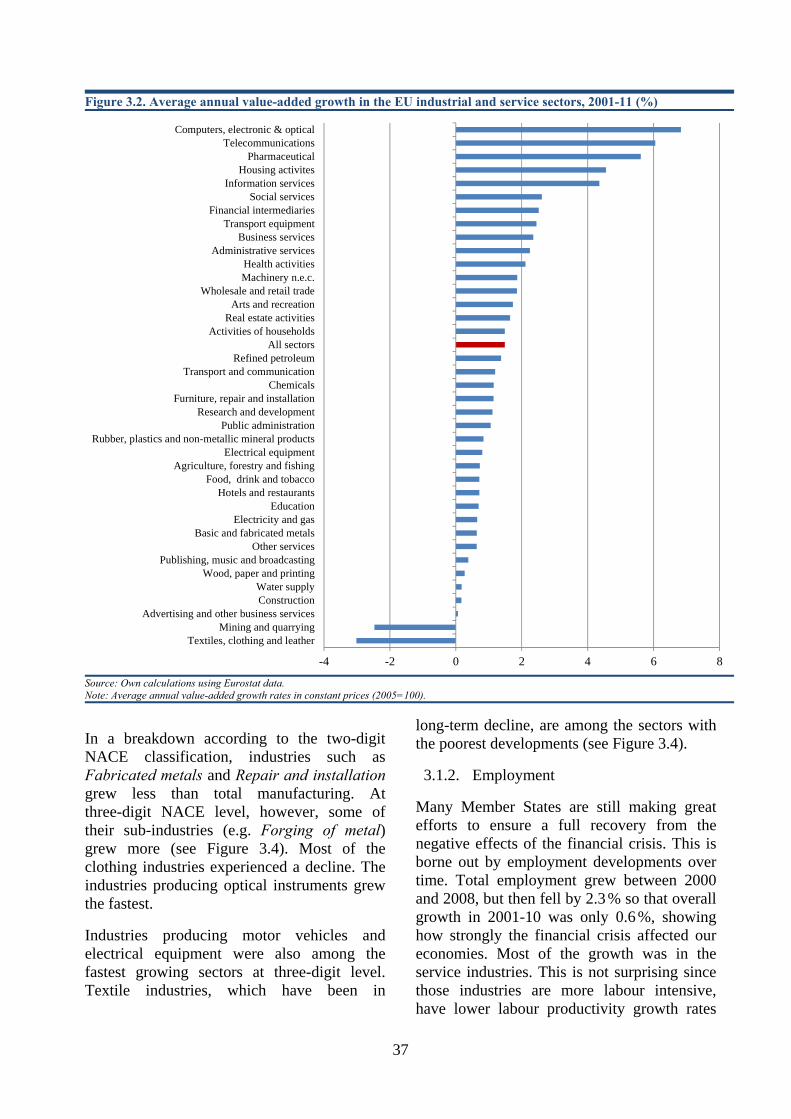
37
In a breakdown according to the two-digit NACE classification, industries such as Fabricated metals and Repair and installation grew less than total manufacturing. At three-digit NACE level, however, some of their sub-industries (e.g. Forging of metal) grew more (see Figure 3.4). Most of the clothing industries experienced a decline. The industries producing optical instruments grew the fastest.
Industries producing motor vehicles and electrical equipment were also among the fastest growing sectors at three-digit level. Textile industries, which have been in
long-term decline, are among the sectors with the poorest developments (see Figure 3.4).
3.1.2. Employment
Many Member States are still making great efforts to ensure a full recovery from the negative effects of the financial crisis. This is borne out by employment developments over time. Total employment grew between 2000 and 2008, but then fell by 2.3 % so that overall growth in 2001-10 was only 0.6 %, showing how strongly the financial crisis affected our economies. Most of the growth was in the service industries. This is not surprising since those industries are more labour intensive, have lower labour productivity growth rates
Figure 3.2. Average annual value-added growth in the EU industrial and service sectors, 2001-11 (%)
-4 -2 0 2 4 6 8
Textiles, clothing and leather Mining and quarrying
Advertising and other business servicesConstructionWater supply
Wood, paper and printingPublishing, music and broadcasting
Other servicesBasic and fabricated metals
Electricity and gasEducation
Hotels and restaurantsFood, drink and tobacco
Agriculture, forestry and fishingElectrical equipment
Rubber, plastics and non-metallic mineral productsPublic administration
Research and developmentFurniture, repair and installation
ChemicalsTransport and communication
Refined petroleumAll sectors
Activities of householdsReal estate activities
Arts and recreationWholesale and retail trade
Machinery n.e.c.Health activities
Administrative servicesBusiness services
Transport equipmentFinancial intermediaries
Social servicesInformation services
Housing activitesPharmaceutical
TelecommunicationsComputers, electronic & optical
Source: Own calculations using Eurostat data. Note: Average annual value-added growth rates in constant prices (2005=100).
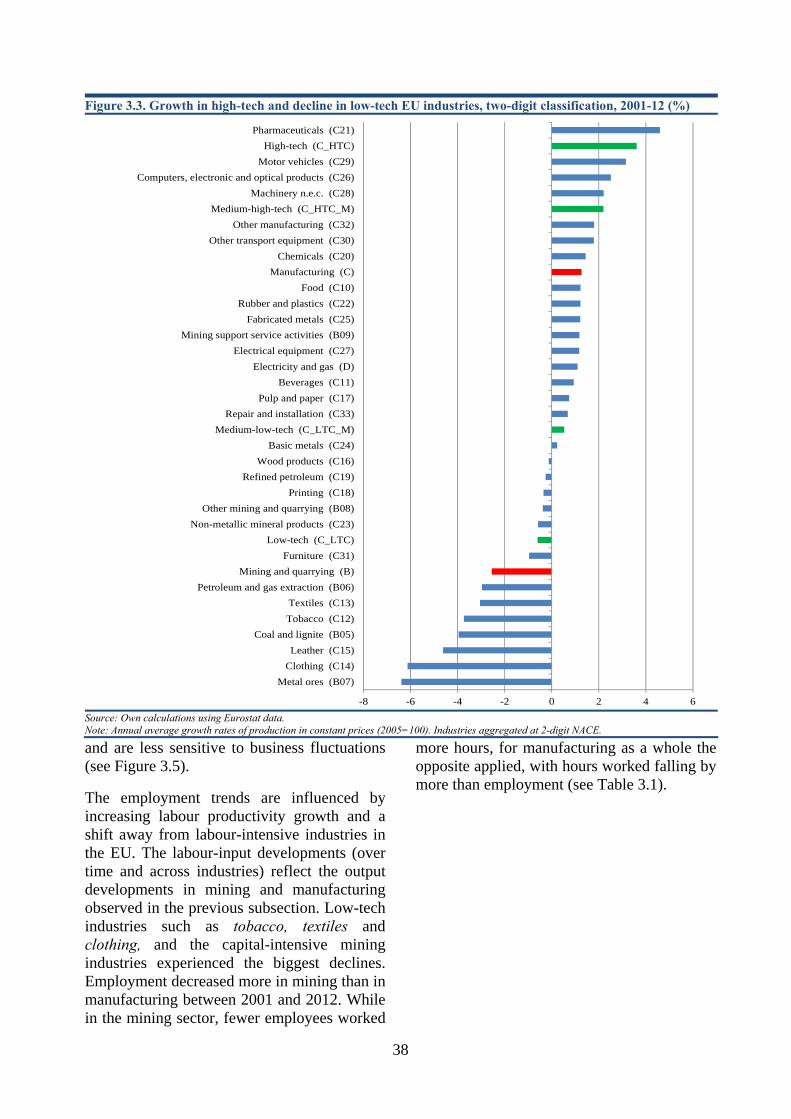
38
and are less sensitive to business fluctuations (see Figure 3.5).
The employment trends are influenced by increasing labour productivity growth and a shift away from labour-intensive industries in the EU. The labour-input developments (over time and across industries) reflect the output developments in mining and manufacturing observed in the previous subsection. Low-tech industries such as tobacco, textiles and clothing, and the capital-intensive mining industries experienced the biggest declines. Employment decreased more in mining than in manufacturing between 2001 and 2012. While in the mining sector, fewer employees worked
more hours, for manufacturing as a whole the opposite applied, with hours worked falling by more than employment (see Table 3.1).
Figure 3.3. Growth in high-tech and decline in low-tech EU industries, two-digit classification, 2001-12 (%)
-8 -6 -4 -2 0 2 4 6
Metal ores (B07)Clothing (C14)Leather (C15)
Coal and lignite (B05)Tobacco (C12)Textiles (C13)
Petroleum and gas extraction (B06)Mining and quarrying (B)
Furniture (C31)Low-tech (C_LTC)
Non-metallic mineral products (C23)Other mining and quarrying (B08)
Printing (C18)Refined petroleum (C19)
Wood products (C16)Basic metals (C24)
Medium-low-tech (C_LTC_M)Repair and installation (C33)
Pulp and paper (C17)Beverages (C11)
Electricity and gas (D)Electrical equipment (C27)
Mining support service activities (B09)Fabricated metals (C25)
Rubber and plastics (C22)Food (C10)
Manufacturing (C)Chemicals (C20)
Other transport equipment (C30)Other manufacturing (C32)
Medium-high-tech (C_HTC_M)Machinery n.e.c. (C28)
Computers, electronic and optical products (C26)Motor vehicles (C29)
High-tech (C_HTC)Pharmaceuticals (C21)
Source: Own calculations using Eurostat data. Note: Annual average growth rates of production in constant prices (2005=100). Industries aggregated at 2-digit NACE.
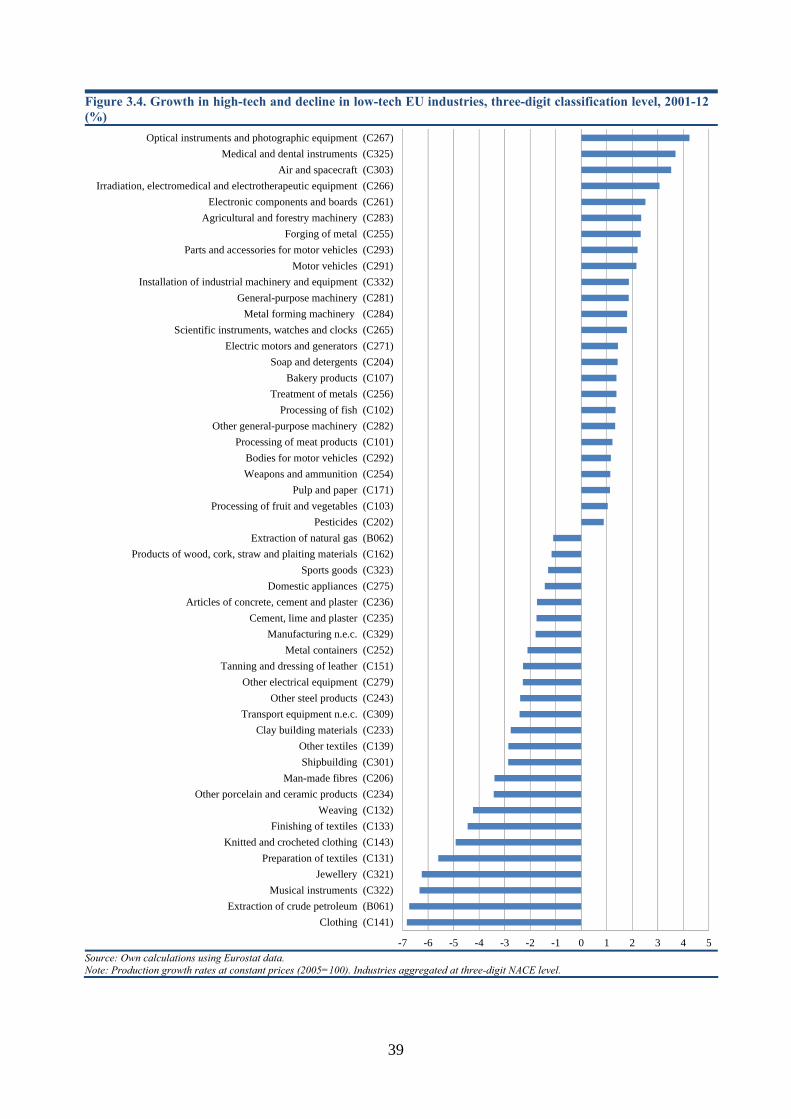
39
Figure 3.4. Growth in high-tech and decline in low-tech EU industries, three-digit classification level, 2001-12 (%)
-7 -6 -5 -4 -3 -2 -1 0 1 2 3 4 5
Clothing (C141)Extraction of crude petroleum (B061)
Musical instruments (C322)Jewellery (C321)
Preparation of textiles (C131)Knitted and crocheted clothing (C143)
Finishing of textiles (C133)Weaving (C132)
Other porcelain and ceramic products (C234)Man-made fibres (C206)
Shipbuilding (C301)Other textiles (C139)
Clay building materials (C233)Transport equipment n.e.c. (C309)
Other steel products (C243)Other electrical equipment (C279)
Tanning and dressing of leather (C151)Metal containers (C252)
Manufacturing n.e.c. (C329)Cement, lime and plaster (C235)
Articles of concrete, cement and plaster (C236)Domestic appliances (C275)
Sports goods (C323)Products of wood, cork, straw and plaiting materials (C162)
Extraction of natural gas (B062)Pesticides (C202)
Processing of fruit and vegetables (C103)Pulp and paper (C171)
Weapons and ammunition (C254)Bodies for motor vehicles (C292)
Processing of meat products (C101)Other general-purpose machinery (C282)
Processing of fish (C102)Treatment of metals (C256)
Bakery products (C107)Soap and detergents (C204)
Electric motors and generators (C271)Scientific instruments, watches and clocks (C265)
Metal forming machinery (C284)General-purpose machinery (C281)
Installation of industrial machinery and equipment (C332)Motor vehicles (C291)
Parts and accessories for motor vehicles (C293)Forging of metal (C255)
Agricultural and forestry machinery (C283)Electronic components and boards (C261)
Irradiation, electromedical and electrotherapeutic equipment (C266)Air and spacecraft (C303)
Medical and dental instruments (C325)Optical instruments and photographic equipment (C267)
Source: Own calculations using Eurostat data. Note: Production growth rates at constant prices (2005=100). Industries aggregated at three-digit NACE level.

40
Figure 3.5. Between 2001 and 2010 employment only grew in service industries
-6 -5 -4 -3 -2 -1 0 1 2 3
Textiles, clothing and leather
Computers, electronic & optical
Wood, paper and printing
Mining and quarrying
Telecommunications
Agriculture, forestry and fishing
Chemicals
Rubber, plastics and non-metallic mineral products
Electrical equipment
Transport equipment
Basic and fabricated metals
Furniture, repair and installation
Electricity and gas
Food, drink and tobacco
Machinery n.e.c.
Pharmaceutical
Publishing, music and broadcasting
Administrative services
Financial intermediates
Transport and communication
Refined petroleum
All sectors
Wholesale and retail trade
Water supply
Construction
Arts and recreation
Public administration
Education
Business services
Real estate activities
Hotels and restaurants
Other services
Research and development
Social services
Health activities
Information services
Advertising and other business services
Housing activites
Source: Own calculations using Eurostat data. Note: Average annual growth rates (%).

41
Table 3.1. Employment and hours worked decline more in low-tech industries NACE SECTOR EMPLOYMENT HOURS WORKEDB Mining and quarrying -3.40 -3.3B05 Coal -4.8 -4.5B06 Petroleum and gas -3.2 -4.3B07 Metal ores -3.9 -3.5B08 Other mining and quarrying -1.7 -2.1B09 Mining support services 0.9 1.6C Manufacturing -1.5 -1.6C10 Food -0.4 -0.8C11 Beverages -1.8 -2C12 Tobacco -4.8 -4.2C13 Textiles -5.7 -5.2C14 Clothing -5.8 -4.9C15 Leather & footwear -3.5 -2.7C16 Wood & wood products -2.5 -2.4C17 Paper -2.2 -2.1C18 Printing -2.9 -2.8C19 Refined petroleum -2.1 -1.8C20 Chemicals -1.8 -1.9C21 Pharmaceuticals -0.2 0C22 Rubber & plastics -0.5 -0.7C23 Non-metallic mineral products -2.7 -2.7C24 Basic metals -2.4 -2.2C25 Metal products -0.4 -0.7C26 Computers, electronic & optical -2.3 -2.6C27 Electrical equipment -0.9 -1.2C28 Machinery n.e.c. -0.5 -0.7C29 Motor vehicles -0.7 -0.8C30 Other transport equipment -0.4 -0.7C31 Furniture -2.7 -2.8C32 Other manufacturing -0.6 -0.8C33 Repair of machinery -0.5 -0.9D35 Electricity and gas -1.9 -1.6E36 Water collection 0 -0.3F Construction -0.6 -1.1
2001-2012
Source: Own calculations using Eurostat data. Note: Average annual growth rates (%)
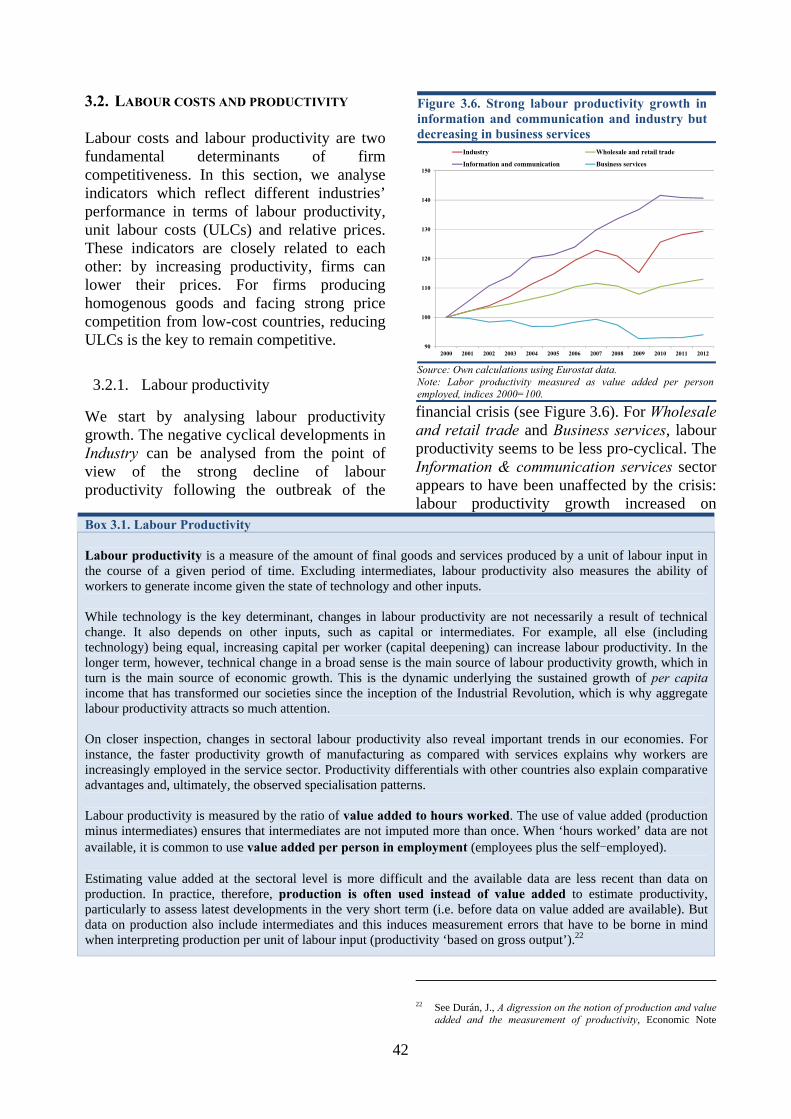
42
3.2. LABOUR COSTS AND PRODUCTIVITY
Labour costs and labour productivity are two fundamental determinants of firm competitiveness. In this section, we analyse indicators which reflect different industries’ performance in terms of labour productivity, unit labour costs (ULCs) and relative prices. These indicators are closely related to each other: by increasing productivity, firms can lower their prices. For firms producing homogenous goods and facing strong price competition from low-cost countries, reducing ULCs is the key to remain competitive.
3.2.1. Labour productivity
We start by analysing labour productivity growth. The negative cyclical developments in Industry can be analysed from the point of view of the strong decline of labour productivity following the outbreak of the
financial crisis (see Figure 3.6). For Wholesale and retail trade and Business services, labour productivity seems to be less pro-cyclical. The Information & communication services sector appears to have been unaffected by the crisis: labour productivity growth increased on
22 See Durán, J., A digression on the notion of production and value
added and the measurement of productivity, Economic Note
Figure 3.6. Strong labour productivity growth in information and communication and industry but decreasing in business services
90
100
110
120
130
140
150
2000 2001 2002 2003 2004 2005 2006 2007 2008 2009 2010 2011 2012
Industry Wholesale and retail trade
Information and communication Business services
Source: Own calculations using Eurostat data. Note: Labor productivity measured as value added per person employed, indices 2000=100.
Box 3.1. Labour Productivity Labour productivity is a measure of the amount of final goods and services produced by a unit of labour input in the course of a given period of time. Excluding intermediates, labour productivity also measures the ability of workers to generate income given the state of technology and other inputs. While technology is the key determinant, changes in labour productivity are not necessarily a result of technical change. It also depends on other inputs, such as capital or intermediates. For example, all else (including technology) being equal, increasing capital per worker (capital deepening) can increase labour productivity. In the longer term, however, technical change in a broad sense is the main source of labour productivity growth, which in turn is the main source of economic growth. This is the dynamic underlying the sustained growth of per capita income that has transformed our societies since the inception of the Industrial Revolution, which is why aggregate labour productivity attracts so much attention. On closer inspection, changes in sectoral labour productivity also reveal important trends in our economies. For instance, the faster productivity growth of manufacturing as compared with services explains why workers are increasingly employed in the service sector. Productivity differentials with other countries also explain comparative advantages and, ultimately, the observed specialisation patterns. Labour productivity is measured by the ratio of value added to hours worked. The use of value added (production minus intermediates) ensures that intermediates are not imputed more than once. When ‘hours worked’ data are not available, it is common to use value added per person in employment (employees plus the self-employed). Estimating value added at the sectoral level is more difficult and the available data are less recent than data on production. In practice, therefore, production is often used instead of value added to estimate productivity, particularly to assess latest developments in the very short term (i.e. before data on value added are available). But data on production also include intermediates and this induces measurement errors that have to be borne in mind when interpreting production per unit of labour input (productivity ‘based on gross output’).22
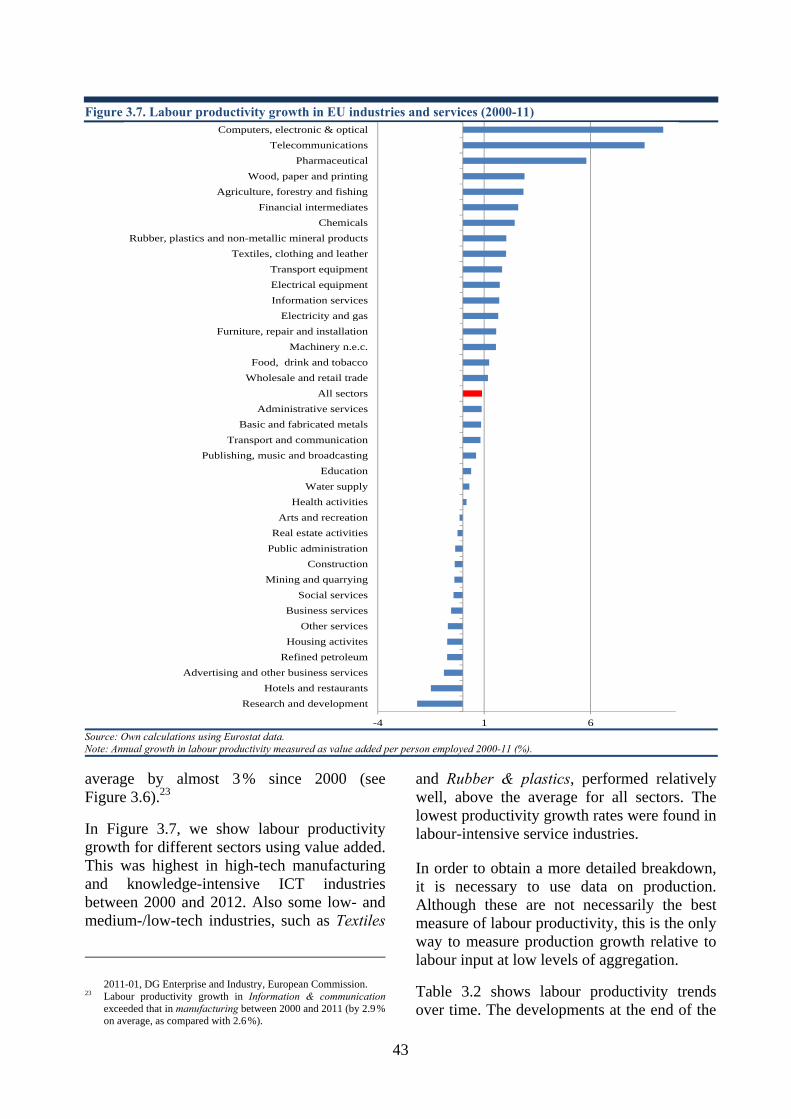
43
average by almost 3 % since 2000 (see Figure 3.6).23
In Figure 3.7, we show labour productivity growth for different sectors using value added. This was highest in high-tech manufacturing and knowledge-intensive ICT industries between 2000 and 2012. Also some low- and medium-/low-tech industries, such as Textiles
2011-01, DG Enterprise and Industry, European Commission. 23 Labour productivity growth in Information & communication
exceeded that in manufacturing between 2000 and 2011 (by 2.9 % on average, as compared with 2.6 %).
and Rubber & plastics, performed relatively well, above the average for all sectors. The lowest productivity growth rates were found in labour-intensive service industries.
In order to obtain a more detailed breakdown, it is necessary to use data on production. Although these are not necessarily the best measure of labour productivity, this is the only way to measure production growth relative to labour input at low levels of aggregation.
Table 3.2 shows labour productivity trends over time. The developments at the end of the
Figure 3.7. Labour productivity growth in EU industries and services (2000-11)
-4 1 6
Research and developmentHotels and restaurants
Advertising and other business servicesRefined petroleumHousing activites
Other servicesBusiness services
Social servicesMining and quarrying
ConstructionPublic administrationReal estate activities
Arts and recreationHealth activities
Water supplyEducation
Publishing, music and broadcastingTransport and communication
Basic and fabricated metalsAdministrative services
All sectorsWholesale and retail tradeFood, drink and tobacco
Machinery n.e.c.Furniture, repair and installation
Electricity and gasInformation servicesElectrical equipmentTransport equipment
Textiles, clothing and leatherRubber, plastics and non-metallic mineral products
ChemicalsFinancial intermediates
Agriculture, forestry and fishingWood, paper and printing
PharmaceuticalTelecommunications
Computers, electronic & optical
Source: Own calculations using Eurostat data. Note: Annual growth in labour productivity measured as value added per person employed 2000-11 (%).
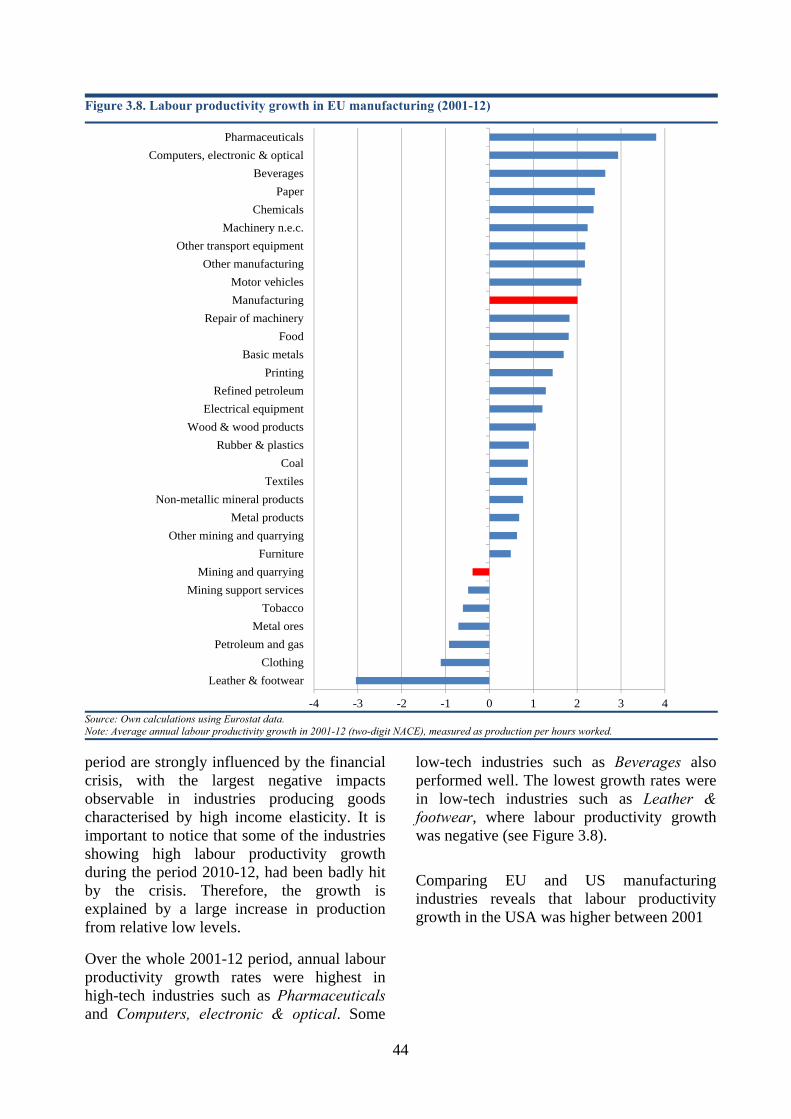
44
period are strongly influenced by the financial crisis, with the largest negative impacts observable in industries producing goods characterised by high income elasticity. It is important to notice that some of the industries showing high labour productivity growth during the period 2010-12, had been badly hit by the crisis. Therefore, the growth is explained by a large increase in production from relative low levels.
Over the whole 2001-12 period, annual labour productivity growth rates were highest in high-tech industries such as Pharmaceuticals and Computers, electronic & optical. Some
low-tech industries such as Beverages also performed well. The lowest growth rates were in low-tech industries such as Leather & footwear, where labour productivity growth was negative (see Figure 3.8).
Comparing EU and US manufacturing industries reveals that labour productivity growth in the USA was higher between 2001
Figure 3.8. Labour productivity growth in EU manufacturing (2001-12)
-4 -3 -2 -1 0 1 2 3 4
Leather & footwearClothing
Petroleum and gasMetal ores
TobaccoMining support services
Mining and quarryingFurniture
Other mining and quarryingMetal products
Non-metallic mineral productsTextiles
CoalRubber & plastics
Wood & wood productsElectrical equipment
Refined petroleumPrinting
Basic metalsFood
Repair of machineryManufacturingMotor vehicles
Other manufacturingOther transport equipment
Machinery n.e.c.Chemicals
PaperBeverages
Computers, electronic & opticalPharmaceuticals
Source: Own calculations using Eurostat data. Note: Average annual labour productivity growth in 2001-12 (two-digit NACE), measured as production per hours worked.
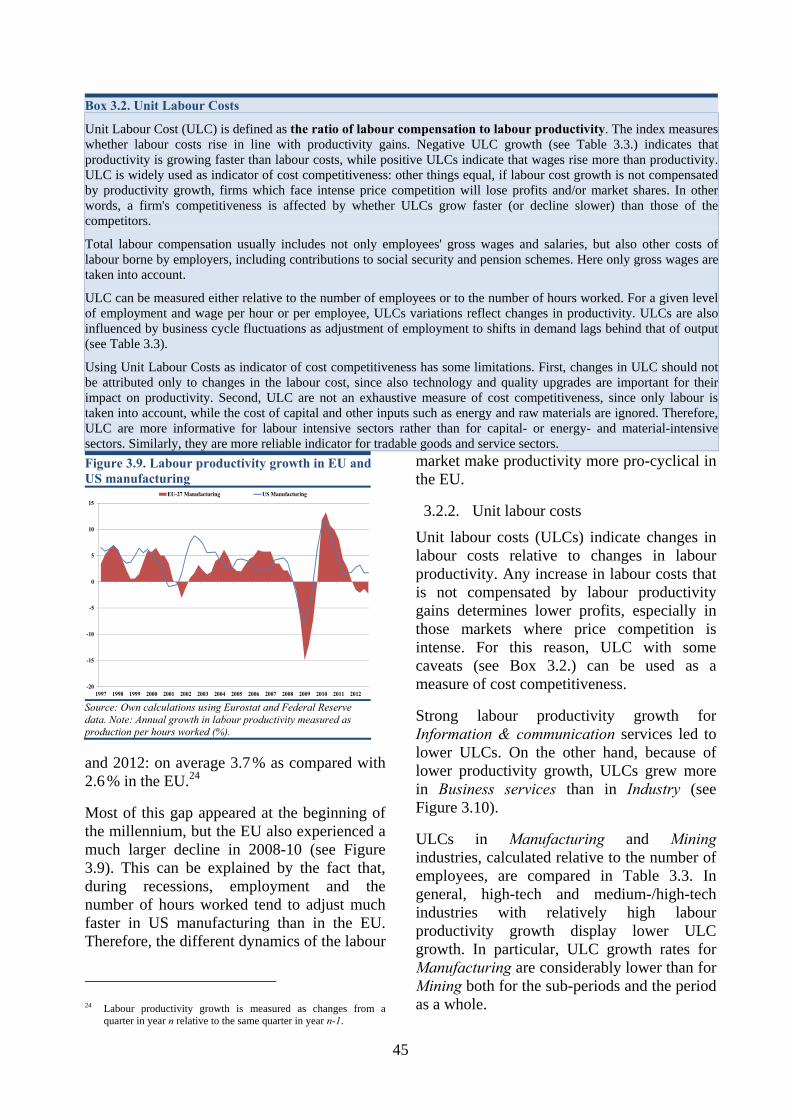
45
and 2012: on average 3.7 % as compared with 2.6 % in the EU.24
Most of this gap appeared at the beginning of the millennium, but the EU also experienced a much larger decline in 2008-10 (see Figure 3.9). This can be explained by the fact that, during recessions, employment and the number of hours worked tend to adjust much faster in US manufacturing than in the EU. Therefore, the different dynamics of the labour
24 Labour productivity growth is measured as changes from a
quarter in year n relative to the same quarter in year n-1.
market make productivity more pro-cyclical in the EU.
3.2.2. Unit labour costs
Unit labour costs (ULCs) indicate changes in labour costs relative to changes in labour productivity. Any increase in labour costs that is not compensated by labour productivity gains determines lower profits, especially in those markets where price competition is intense. For this reason, ULC with some caveats (see Box 3.2.) can be used as a measure of cost competitiveness.
Strong labour productivity growth for Information & communication services led to lower ULCs. On the other hand, because of lower productivity growth, ULCs grew more in Business services than in Industry (see Figure 3.10).
ULCs in Manufacturing and Mining industries, calculated relative to the number of employees, are compared in Table 3.3. In general, high-tech and medium-/high-tech industries with relatively high labour productivity growth display lower ULC growth. In particular, ULC growth rates for Manufacturing are considerably lower than for Mining both for the sub-periods and the period as a whole.
Box 3.2. Unit Labour Costs
Unit Labour Cost (ULC) is defined as the ratio of labour compensation to labour productivity. The index measures whether labour costs rise in line with productivity gains. Negative ULC growth (see Table 3.3.) indicates that productivity is growing faster than labour costs, while positive ULCs indicate that wages rise more than productivity.ULC is widely used as indicator of cost competitiveness: other things equal, if labour cost growth is not compensated by productivity growth, firms which face intense price competition will lose profits and/or market shares. In otherwords, a firm's competitiveness is affected by whether ULCs grow faster (or decline slower) than those of the competitors.
Total labour compensation usually includes not only employees' gross wages and salaries, but also other costs oflabour borne by employers, including contributions to social security and pension schemes. Here only gross wages aretaken into account.
ULC can be measured either relative to the number of employees or to the number of hours worked. For a given levelof employment and wage per hour or per employee, ULCs variations reflect changes in productivity. ULCs are alsoinfluenced by business cycle fluctuations as adjustment of employment to shifts in demand lags behind that of output(see Table 3.3).
Using Unit Labour Costs as indicator of cost competitiveness has some limitations. First, changes in ULC should notbe attributed only to changes in the labour cost, since also technology and quality upgrades are important for theirimpact on productivity. Second, ULC are not an exhaustive measure of cost competitiveness, since only labour istaken into account, while the cost of capital and other inputs such as energy and raw materials are ignored. Therefore,ULC are more informative for labour intensive sectors rather than for capital- or energy- and material-intensive sectors. Similarly, they are more reliable indicator for tradable goods and service sectors. Figure 3.9. Labour productivity growth in EU andUS manufacturing
-20
-15
-10
-5
0
5
10
15
1997 1998 1999 2000 2001 2002 2003 2004 2005 2006 2007 2008 2009 2010 2011 2012
EU-27 Manufacturing US Manufacturing
Source: Own calculations using Eurostat and Federal Reserve data. Note: Annual growth in labour productivity measured as production per hours worked (%).
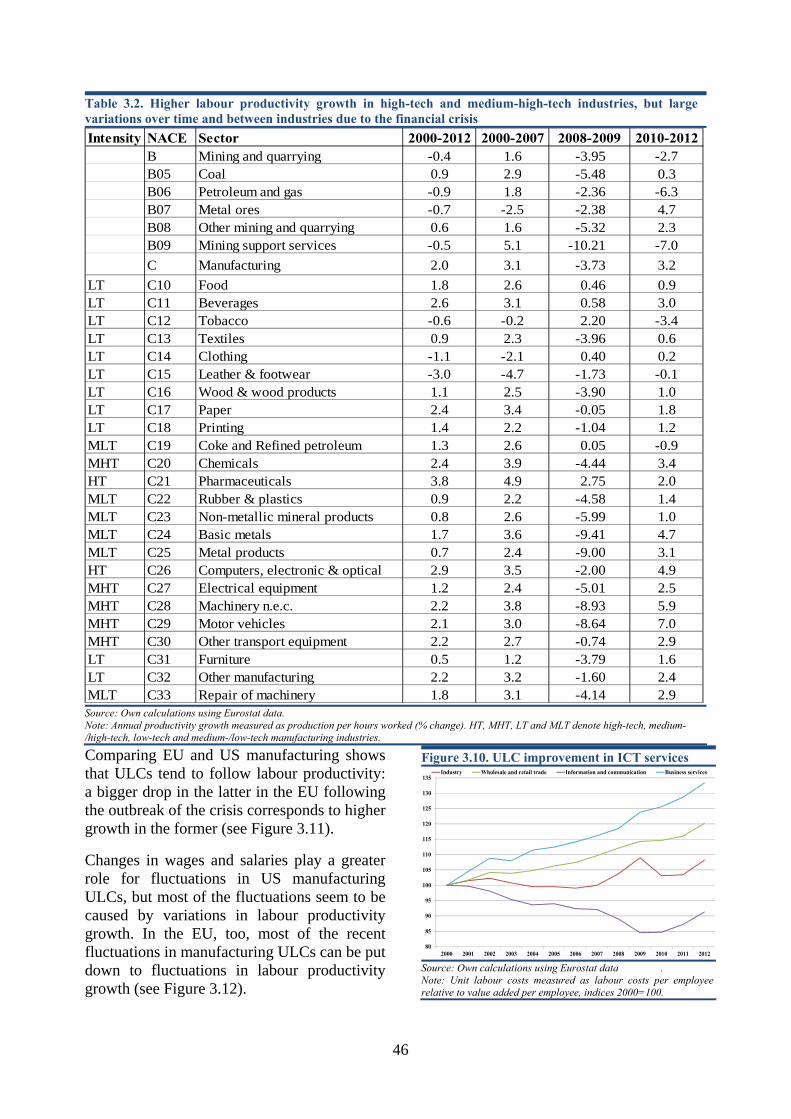
46
Comparing EU and US manufacturing shows that ULCs tend to follow labour productivity: a bigger drop in the latter in the EU following the outbreak of the crisis corresponds to higher growth in the former (see Figure 3.11).
Changes in wages and salaries play a greater role for fluctuations in US manufacturing ULCs, but most of the fluctuations seem to be caused by variations in labour productivity growth. In the EU, too, most of the recent fluctuations in manufacturing ULCs can be put down to fluctuations in labour productivity growth (see Figure 3.12).
Table 3.2. Higher labour productivity growth in high-tech and medium-high-tech industries, but large variations over time and between industries due to the financial crisis Intensity NACE Sector 2000-2012 2000-2007 2008-2009 2010-2012
B Mining and quarrying -0.4 1.6 -3.95 -2.7B05 Coal 0.9 2.9 -5.48 0.3B06 Petroleum and gas -0.9 1.8 -2.36 -6.3B07 Metal ores -0.7 -2.5 -2.38 4.7B08 Other mining and quarrying 0.6 1.6 -5.32 2.3B09 Mining support services -0.5 5.1 -10.21 -7.0C Manufacturing 2.0 3.1 -3.73 3.2
LT C10 Food 1.8 2.6 0.46 0.9LT C11 Beverages 2.6 3.1 0.58 3.0LT C12 Tobacco -0.6 -0.2 2.20 -3.4LT C13 Textiles 0.9 2.3 -3.96 0.6LT C14 Clothing -1.1 -2.1 0.40 0.2LT C15 Leather & footwear -3.0 -4.7 -1.73 -0.1LT C16 Wood & wood products 1.1 2.5 -3.90 1.0LT C17 Paper 2.4 3.4 -0.05 1.8LT C18 Printing 1.4 2.2 -1.04 1.2MLT C19 Coke and Refined petroleum 1.3 2.6 0.05 -0.9MHT C20 Chemicals 2.4 3.9 -4.44 3.4HT C21 Pharmaceuticals 3.8 4.9 2.75 2.0MLT C22 Rubber & plastics 0.9 2.2 -4.58 1.4MLT C23 Non-metallic mineral products 0.8 2.6 -5.99 1.0MLT C24 Basic metals 1.7 3.6 -9.41 4.7MLT C25 Metal products 0.7 2.4 -9.00 3.1HT C26 Computers, electronic & optical 2.9 3.5 -2.00 4.9MHT C27 Electrical equipment 1.2 2.4 -5.01 2.5MHT C28 Machinery n.e.c. 2.2 3.8 -8.93 5.9MHT C29 Motor vehicles 2.1 3.0 -8.64 7.0MHT C30 Other transport equipment 2.2 2.7 -0.74 2.9LT C31 Furniture 0.5 1.2 -3.79 1.6LT C32 Other manufacturing 2.2 3.2 -1.60 2.4MLT C33 Repair of machinery 1.8 3.1 -4.14 2.9
Source: Own calculations using Eurostat data. Note: Annual productivity growth measured as production per hours worked (% change). HT, MHT, LT and MLT denote high-tech, medium-/high-tech, low-tech and medium-/low-tech manufacturing industries.
Figure 3.10. ULC improvement in ICT services
80
85
90
95
100
105
110
115
120
125
130
135
2000 2001 2002 2003 2004 2005 2006 2007 2008 2009 2010 2011 2012
Industry Wholesale and retail trade Information and communication Business services
Source: Own calculations using Eurostat data . Note: Unit labour costs measured as labour costs per employee relative to value added per employee, indices 2000=100.
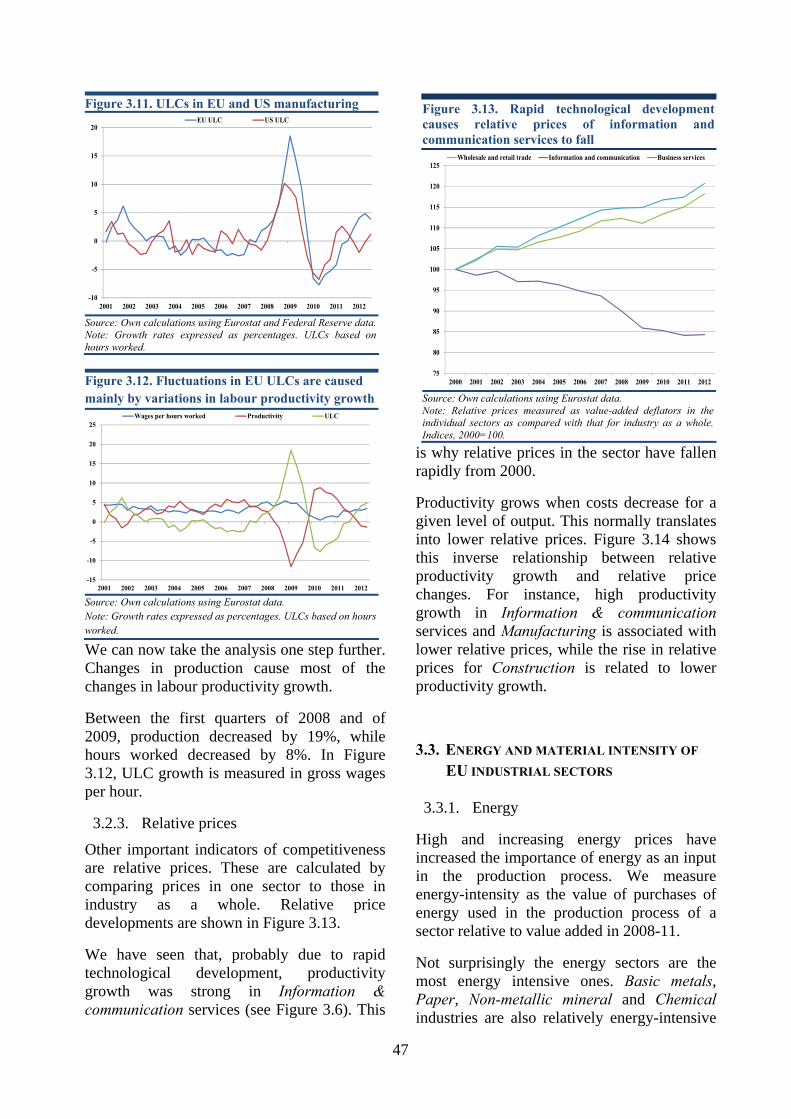
47
We can now take the analysis one step further. Changes in production cause most of the changes in labour productivity growth.
Between the first quarters of 2008 and of 2009, production decreased by 19%, while hours worked decreased by 8%. In Figure 3.12, ULC growth is measured in gross wages per hour.
3.2.3. Relative prices
Other important indicators of competitiveness are relative prices. These are calculated by comparing prices in one sector to those in industry as a whole. Relative price developments are shown in Figure 3.13.
We have seen that, probably due to rapid technological development, productivity growth was strong in Information & communication services (see Figure 3.6). This
is why relative prices in the sector have fallen rapidly from 2000.
Productivity grows when costs decrease for a given level of output. This normally translates into lower relative prices. Figure 3.14 shows this inverse relationship between relative productivity growth and relative price changes. For instance, high productivity growth in Information & communication services and Manufacturing is associated with lower relative prices, while the rise in relative prices for Construction is related to lower productivity growth.
3.3. ENERGY AND MATERIAL INTENSITY OF
EU INDUSTRIAL SECTORS
3.3.1. Energy
High and increasing energy prices have increased the importance of energy as an input in the production process. We measure energy-intensity as the value of purchases of energy used in the production process of a sector relative to value added in 2008-11.
Not surprisingly the energy sectors are the most energy intensive ones. Basic metals, Paper, Non-metallic mineral and Chemical industries are also relatively energy-intensive
Figure 3.11. ULCs in EU and US manufacturing
-10
-5
0
5
10
15
20
2001 2002 2003 2004 2005 2006 2007 2008 2009 2010 2011 2012
EU ULC US ULC
Source: Own calculations using Eurostat and Federal Reserve data.Note: Growth rates expressed as percentages. ULCs based on hours worked.
Figure 3.12. Fluctuations in EU ULCs are caused mainly by variations in labour productivity growth
-15
-10
-5
0
5
10
15
20
25
2001 2002 2003 2004 2005 2006 2007 2008 2009 2010 2011 2012
Wages per hours worked Productivity ULC
Source: Own calculations using Eurostat data. Note: Growth rates expressed as percentages. ULCs based on hours worked.
Figure 3.13. Rapid technological development causes relative prices of information and communication services to fall
75
80
85
90
95
100
105
110
115
120
125
2000 2001 2002 2003 2004 2005 2006 2007 2008 2009 2010 2011 2012
Wholesale and retail trade Information and communication Business services
Source: Own calculations using Eurostat data. Note: Relative prices measured as value-added deflators in the individual sectors as compared with that for industry as a whole. Indices, 2000=100.

48
(see Figure 3.15).25 These industries are, of course, vulnerable to changes in energy supply and prices.26
3.3.2. Raw materials
EU manufacturing industries use different kinds of raw materials in their production processes. Price rises due to increasing demand from emerging economies, together with the unequal distribution of raw materials across countries, make some economies more dependent on imports.
25 As data coverage varies considerably across sectors and
countries, the calculations of energy intensities are subject to errors.
26 For a more detailed analysis, see the European Competitiveness Report 2012 (European Commission 2012).
27 For more detailed information about the concepts used, see
http://ec.europa.eu/environment/enveco/resource_efficiency/pdf/report_Resource_Sectoral_Maps.pdf and http://www.wiod.org/publications/source_docs/Environmental_Sources.pdf.
Table 3.3. Slow annual ULC growth in high- and medium/high-tech industries (%) NACE Sector 2001-12 2001-07 2008-09 2010-12
B Mining and quarrying 6.0 4.1 11.2 7.0 B05 Coal 3.0 -0.2 13.9 3.0 B06 Petroleum and gas 12.3 11.5 13.9 13.2 B07 Metal ores 13.4 19.8 9.5 1.2 B08 Other mining and quarrying 2.8 2.3 10.1 -0.7 B09 Mining support services 9.0 7.1 17.7 7.5 C Manufacturing 1.3 0.2 8.3 -0.9 C10 Food 1.2 0.8 3.0 0.9 C11 Beverages 0.6 0.3 3.3 -0.5 C12 Tobacco 4.4 5.7 3.1 2.1 C13 Textiles 1.8 1.0 8.0 -0.4 C14 Clothing 3.6 3.6 6.5 1.7 C15 Leather & footwear 6.4 7.3 8.2 3.0 C16 Wood & wood products 1.8 1.0 8.7 -0.9 C17 Paper 0.1 -0.7 3.7 -0.4 C18 Printing 0.2 -0.1 3.3 -1.3 C19 Coke and refined petroleum 2.7 1.4 5.8 3.6 C20 Chemicals 1.0 -0.5 8.3 -0.3 C21 Pharmaceuticals -0.7 -1.0 -1.3 0.3 C22 Rubber & plastics 1.7 0.3 8.0 0.6 C23 Non-metallic mineral products 2.5 0.8 11.1 0.6 C24 Basic metals 1.7 -0.6 15.4 -2.0 C25 Metal products 2.4 0.8 13.3 -1.1 C26 Computers, electronic & optical 0.2 -0.7 6.5 -2.1 C27 Electrical equipment 1.6 0.3 9.2 -0.5 C28 Machinery n.e.c. 1.8 -0.3 16.1 -2.9 C29 Motor vehicles 1.0 -0.5 13.4 -3.9 C30 Other transport equipment 2.0 1.2 5.3 1.5 C31 Furniture 2.0 1.1 8.9 -0.6 C32 Other manufacturing 0.9 0.6 4.0 -0.7 C33 Repair of machinery 1.5 0.9 8.9 -1.8 Source: Own calculations using Eurostat data. Note: Annual growth in ULC based on hours worked (%).

49
Between 1995 and 2008, materials embedded in EU exports increased by more than 80 % (see Figure 3.16). Most Member States’ industries increased the quantity of materials
embedded in exports, with the largest increases in Germany, Poland and Spain.28
28 European Commission, JRC (2012).
Figure 3.14. Labour productivity growth vs. relative price changes, 2000-11
All industries
Agriculture, forestry and fishing
Industry
Manufacturing
Construction
Wholesale and retail trade
Information and communication
Financial and insurance activities Real estate activities
Business services
Non-market services
-1.5
-1
-0.5
0
0.5
1
1.5
2
2.5
3
-0.4 -0.2 0 0.2 0.4 0.6 0.8 1 1.2 1.4 1.6
Pric
e ch
ange
vs
Indu
stry
Productivity growth vs Industry
Source: Own calculations using Eurostat data. Note: Relative prices measured as value-added deflators in the individual sectors as compared with that for industry as a whole. Indices, 2000=100.
Figure 3.15. High-tech industries are less energy-intensive
0
10
20
30
40
50
60
70Energy/VA (%)
Source: Own calculations using Eurostat data. Note: Data for Greece, Malta, Poland, and Slovenia are not included. The tobacco industries are excluded due to gaps in data.
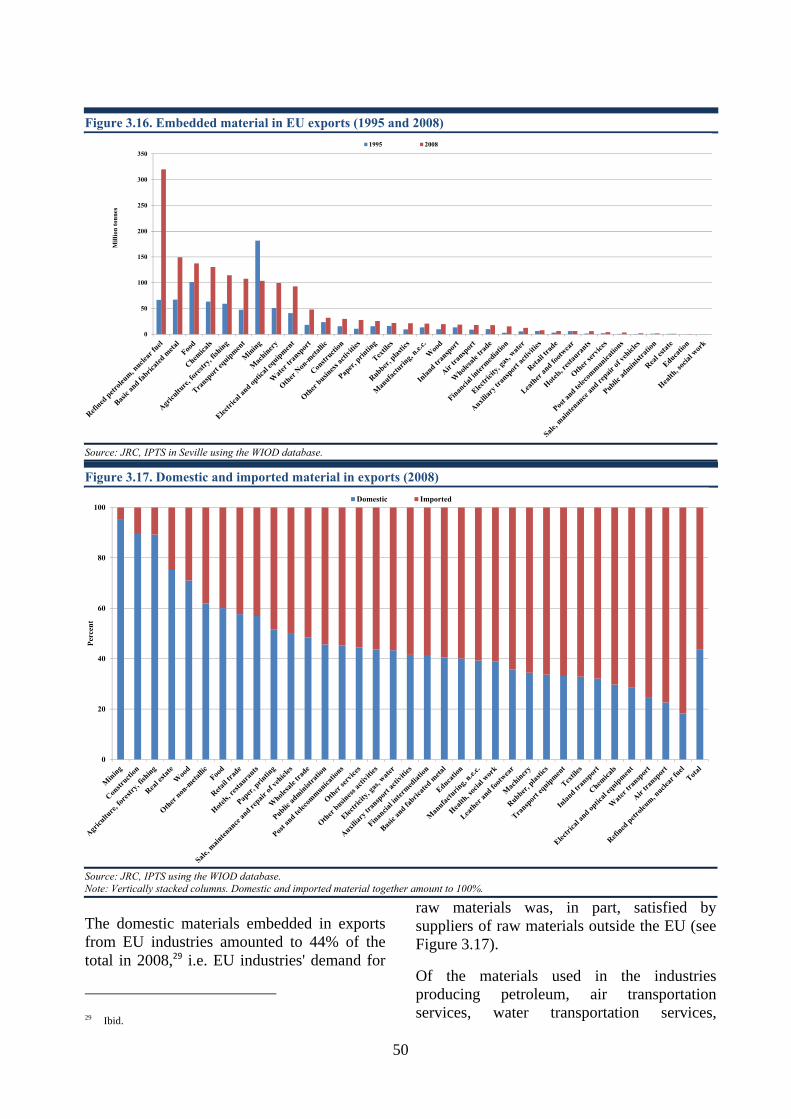
50
The domestic materials embedded in exports from EU industries amounted to 44% of the total in 2008,29 i.e. EU industries' demand for
29 Ibid.
raw materials was, in part, satisfied by suppliers of raw materials outside the EU (see Figure 3.17).
Of the materials used in the industries producing petroleum, air transportation services, water transportation services,
Figure 3.16. Embedded material in EU exports (1995 and 2008)
0
50
100
150
200
250
300
350
Mill
ion
tonn
es
1995 2008
Source: JRC, IPTS in Seville using the WIOD database.
Figure 3.17. Domestic and imported material in exports (2008)
0
20
40
60
80
100
Perc
ent
Domestic Imported
Source: JRC, IPTS using the WIOD database. Note: Vertically stacked columns. Domestic and imported material together amount to 100%.
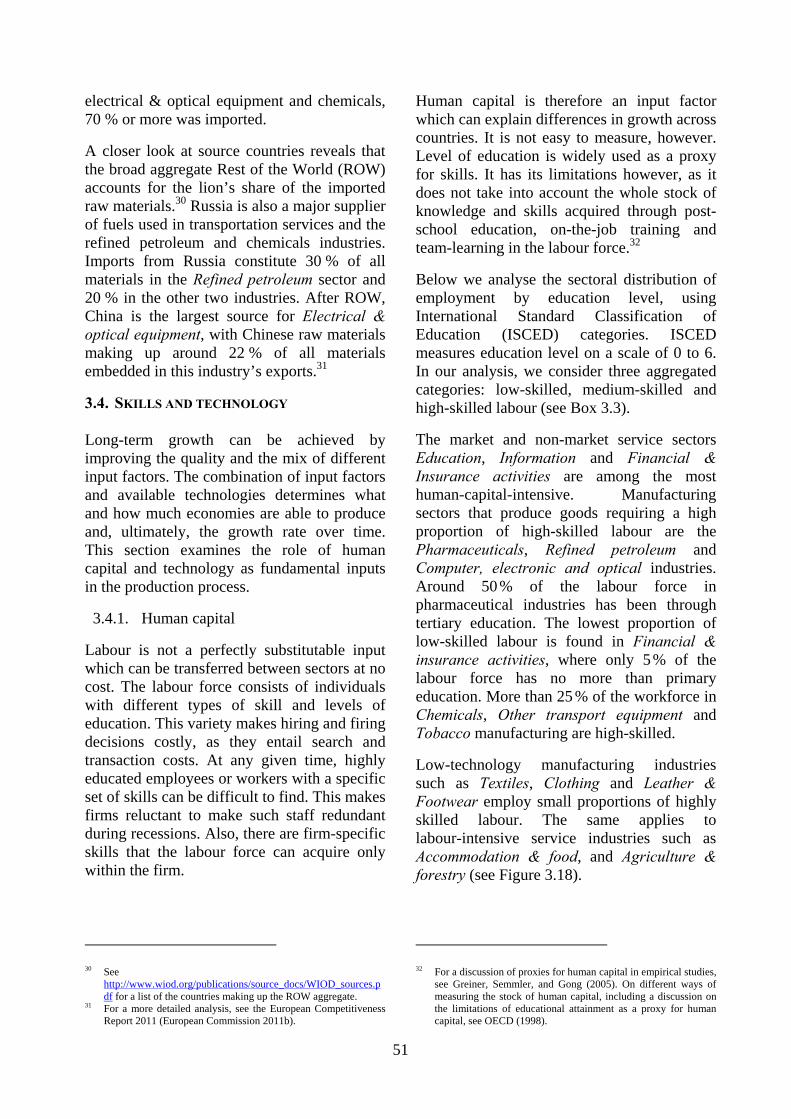
51
electrical & optical equipment and chemicals, 70 % or more was imported.
A closer look at source countries reveals that the broad aggregate Rest of the World (ROW) accounts for the lion’s share of the imported raw materials.30 Russia is also a major supplier of fuels used in transportation services and the refined petroleum and chemicals industries. Imports from Russia constitute 30 % of all materials in the Refined petroleum sector and 20 % in the other two industries. After ROW, China is the largest source for Electrical & optical equipment, with Chinese raw materials making up around 22 % of all materials embedded in this industry’s exports.31
3.4. SKILLS AND TECHNOLOGY
Long-term growth can be achieved by improving the quality and the mix of different input factors. The combination of input factors and available technologies determines what and how much economies are able to produce and, ultimately, the growth rate over time. This section examines the role of human capital and technology as fundamental inputs in the production process.
3.4.1. Human capital
Labour is not a perfectly substitutable input which can be transferred between sectors at no cost. The labour force consists of individuals with different types of skill and levels of education. This variety makes hiring and firing decisions costly, as they entail search and transaction costs. At any given time, highly educated employees or workers with a specific set of skills can be difficult to find. This makes firms reluctant to make such staff redundant during recessions. Also, there are firm-specific skills that the labour force can acquire only within the firm.
30 See
http://www.wiod.org/publications/source_docs/WIOD_sources.pdf for a list of the countries making up the ROW aggregate.
31 For a more detailed analysis, see the European Competitiveness Report 2011 (European Commission 2011b).
Human capital is therefore an input factor which can explain differences in growth across countries. It is not easy to measure, however. Level of education is widely used as a proxy for skills. It has its limitations however, as it does not take into account the whole stock of knowledge and skills acquired through post-school education, on-the-job training and team-learning in the labour force.32
Below we analyse the sectoral distribution of employment by education level, using International Standard Classification of Education (ISCED) categories. ISCED measures education level on a scale of 0 to 6. In our analysis, we consider three aggregated categories: low-skilled, medium-skilled and high-skilled labour (see Box 3.3).
The market and non-market service sectors Education, Information and Financial & Insurance activities are among the most human-capital-intensive. Manufacturing sectors that produce goods requiring a high proportion of high-skilled labour are the Pharmaceuticals, Refined petroleum and Computer, electronic and optical industries. Around 50 % of the labour force in pharmaceutical industries has been through tertiary education. The lowest proportion of low-skilled labour is found in Financial & insurance activities, where only 5 % of the labour force has no more than primary education. More than 25 % of the workforce in Chemicals, Other transport equipment and Tobacco manufacturing are high-skilled.
Low-technology manufacturing industries such as Textiles, Clothing and Leather & Footwear employ small proportions of highly skilled labour. The same applies to labour-intensive service industries such as Accommodation & food, and Agriculture & forestry (see Figure 3.18).
32 For a discussion of proxies for human capital in empirical studies,
see Greiner, Semmler, and Gong (2005). On different ways of measuring the stock of human capital, including a discussion on the limitations of educational attainment as a proxy for human capital, see OECD (1998).

52
Human capital is necessary not only for economies to achieve growth in the long run, but also in a shorter term perspective. Firms need to develop new or improved products in order to stay competitive on world markets. By employing highly skilled labour capable of adopting and developing new technologies and ideas, firms can supply innovative products which are less sensitive to price competition. Labour-intensive firms with lower proportions of highly skilled labour, on the other hand, are more sensitive to price competition from low-cost countries. Unless their productivity grows in line with increasing labour costs, these firms lose market share to competitors. Also, EU firms in labour-intensive industries (such as Textiles) have been able to face the increasing competition from firms in emerging markets by upgrading quality and differentiating their products.
3.4.2. Technology
The adoption of a particular technology determines how efficiently input factors are combined. The long-term growth of a sector depends significantly on the availability of the best technologies. This section presents indicators describing the technologies of EU industries from different angles. The indicators measure the different stages of the R&D&I process: R&D expenditures can be regarded as
input indicators, while patents and the introduction of new and/or improved products measure output (see Box 3.4. for details). However, these indicators are not perfect. Patent statistics can underestimate or overestimate the importance of innovation. Being granted a patent does not necessarily mean that a firm will be able to market a new product. In practice, more than one patent is often granted for the same product, as firms try to protect their innovations by strategically applying for a series of ‘surrounding’ patents.33
R&D
In 2012, R&D expenditures represented 2.06 % of GDP in the EU-28, which marked a minor improvement from 2011 (2.04 %). In the USA, R&D expenditures amounted to 2.67 % of GDP in 2011.34
Due to the insufficient coverage of R&D statistics across sectors and countries, we are unable to analyse developments after 2007. In that year, R&D expenditures represented 1.85 % of GDP in the EU and 2.62 % in the USA (most of the difference is accounted for by private R&D in the business enterprise sector).
We formed an EU aggregate to analyse R&D expenditures relative to value added) in each manufacturing sector. Manufacturing represents more than 80 % of total R&D expenditures in the EU. The analysis focuses on business enterprise R&D expenditures (BERD) by economic activity. Government expenditures in sectoral R&D are not reflected in the data.
At this level of aggregation (ISIC Rev. 3.1), the EU rarely shows a higher intensity, the most notable exception being the chemical industry (see Figure 3.19).
This conclusion is confirmed by analysing the relatively similar distributions of total
33 OECD (2007) contains a detailed discussion of R&D&I
indicators. 34 More recent USA data unavailable.
Box 3.3. Using ISCED to define skill categories The International Standard Classification of Education (ISCED) distinguishes seven levels of education: - Level 0: pre-primary - Level 1: primary - Level 2: lower secondary - Level 3: upper secondary - Level 4: post-secondary (non-tertiary) - Level 5: first stage of tertiary - Level 6: second stage of tertiary. In this publication, we aggregate the levels in three categories, breaking down total employment in each sector into three skill categories: - Low skilled: Levels 0, 1 and 2 - Medium skilled: Levels 3 and 4 - High-skilled: Levels 5 and 6

53
expenditures across manufacturing industries (see Figure 3.20). Thus, it seems that the aggregate differences observed are due not to
the sectoral structure, but rather to overall lower R&D investment across all sectors.
Figure 3.18. Highly educated workforce in knowledge-intensive sectors
0 20 40 60 80
EducationProfessional, scientific and technical activities
InformationPharmaceuticals
Financial and insurance activitiesHuman health and social work
AdministrationArts and entertainment
Coke and refined petroleumComputer, electronic and optical
Electricity and gasReal estate activities
Other transport equipmentChemicals
TobaccoMachinery and equipment n.e.c.
Other servicesBeverages
Motor vehiclesElectrical equipmentOther manufacturingRepair of machinery
Administrative and support servicesPrinting
Mining and quarryingWater
Wholesale and retail tradePaper
Basic metalsRubber and plastics
Non-metallic mineral productsTransportation and storage
ConstructionFabricated metal products
FoodAccommodation and food services
FurnitureTextiles
Wood and wood productsClothing
Agriculture and forestryLeather and footwear
MEDIUM SKILL LOW SKILL HIGH SKILL
Source: Own calculations using Eurostat's labour force survey data. Note: Percentages of total employment in the sectors.

54
Figure 3.19. Higher R&D intensity in US manufacturing industries (% value added)
0 5 10 15 20 25 30 35 40 45 50
Radio, TV and communication equipment
Pharmaceuticals
Other transport equipment
Motor Vehicles
Instruments, watches and clocks
Office, accounting and computing machinery
Chemicals excluding pharmaceuticals
Machinery and equipment n.e.c.
Electrical machinery and apparatus n.e.c.
Rubber and plastics products
Coke, refined petrolroleum products and nuclearfuel
Basic metals
Other non-metallic mineral products
Food products, beverages and tobacco
Textiles, textile products, leather and footwear
Manufacturing n.e.c.; recycling
Fabricated metal products (excl. machinery andequipment)
Wood, paper, printing, publishing
US EU
Source: own calculations using OECD data. Note: The EU is represented by 17 countries: Austrai, Belgium, the Czech Republic, Denmark, Finland, France, Germany, Greece, Hungary, Ireland, Italy, the Netherlands, Poland, Portugal, Spain, Sweden and the UK. The industries are classified according to ISIC Rev. 3.1.
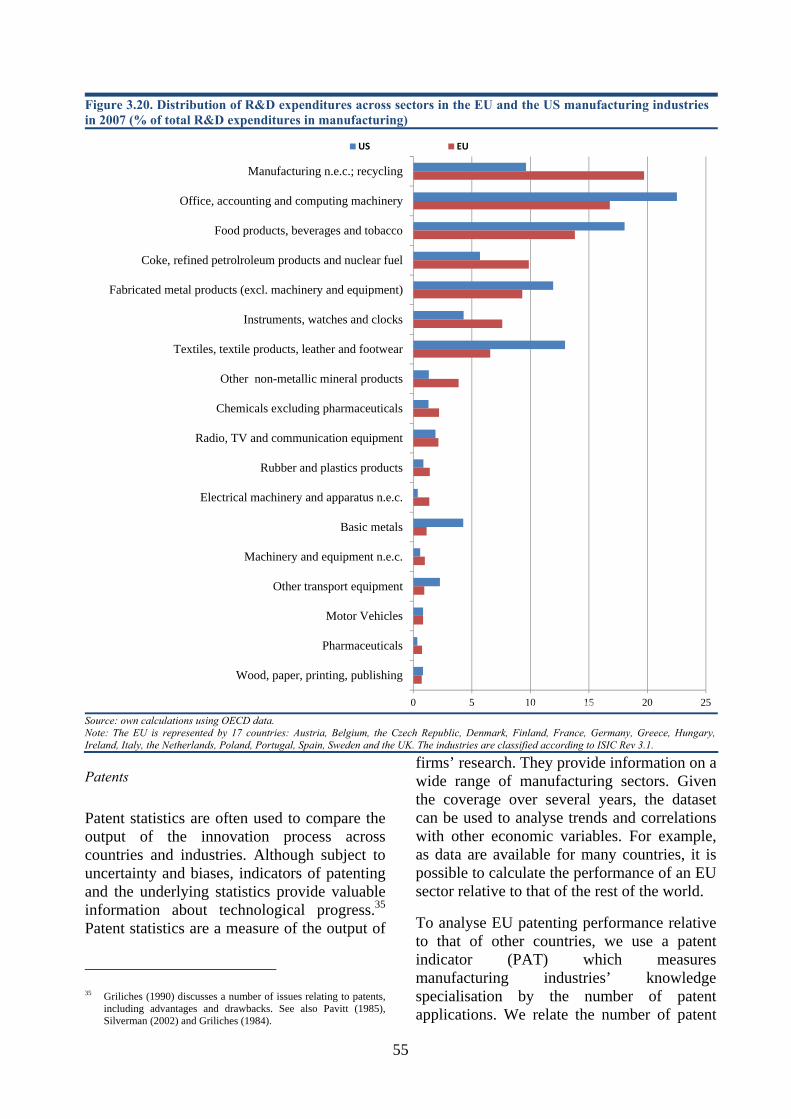
55
Patents
Patent statistics are often used to compare the output of the innovation process across countries and industries. Although subject to uncertainty and biases, indicators of patenting and the underlying statistics provide valuable information about technological progress.35 Patent statistics are a measure of the output of
35 Griliches (1990) discusses a number of issues relating to patents,
including advantages and drawbacks. See also Pavitt (1985), Silverman (2002) and Griliches (1984).
firms’ research. They provide information on a wide range of manufacturing sectors. Given the coverage over several years, the dataset can be used to analyse trends and correlations with other economic variables. For example, as data are available for many countries, it is possible to calculate the performance of an EU sector relative to that of the rest of the world.
To analyse EU patenting performance relative to that of other countries, we use a patent indicator (PAT) which measures manufacturing industries’ knowledge specialisation by the number of patent applications. We relate the number of patent
Figure 3.20. Distribution of R&D expenditures across sectors in the EU and the US manufacturing industries in 2007 (% of total R&D expenditures in manufacturing)
0 5 10 15 20 25
Manufacturing n.e.c.; recycling
Office, accounting and computing machinery
Food products, beverages and tobacco
Coke, refined petrolroleum products and nuclear fuel
Fabricated metal products (excl. machinery and equipment)
Instruments, watches and clocks
Textiles, textile products, leather and footwear
Other non-metallic mineral products
Chemicals excluding pharmaceuticals
Radio, TV and communication equipment
Rubber and plastics products
Electrical machinery and apparatus n.e.c.
Basic metals
Machinery and equipment n.e.c.
Other transport equipment
Motor Vehicles
Pharmaceuticals
Wood, paper, printing, publishing
% Expenditures in manufacturing
US EU
Source: own calculations using OECD data. Note: The EU is represented by 17 countries: Austria, Belgium, the Czech Republic, Denmark, Finland, France, Germany, Greece, Hungary, Ireland, Italy, the Netherlands, Poland, Portugal, Spain, Sweden and the UK. The industries are classified according to ISIC Rev 3.1.

56
applications of a given EU manufacturing sector to total EU manufacturing patent applications. This is then related to the number of patent applications from the same sector at world level relative to the number of total patent applications in manufacturing in the world:
36 A different set of output indicators is used for the Innovation
Union Scoreboard: • Proportion of SMEs introducing product or process
innovations, or marketing or organisational innovations; • Proportion of high-growth firms; • Proportion of employment in knowledge-intensive
activities (manufacturing and services); • Contribution of medium and high-tech product exports to
the trade balance; • Proportion of knowledge-intensive services exports; • Sales of new-to-market and new-to-firm innovations as a
proportion of turnover; • Licence and patent revenues from abroad as a proportion
of GDP. 37 For more information on innovation in services see Miles (2007).
For an alternative source of sectoral company-based survey see
where:
PATiEU: number of patents filed by EU industry ‘i’
Σi PATiEU: number of patents filed by all EU
manufacturing industries
PATiWorld: number of patents filed by world industry ‘i’
Σi PATiWorld: number of patents filed by all
manufacturing industries in the world.
the ‘2008 EU industrial R&D investment scoreboard’ European Commission (2008).
Box 3.4. Using indicators to reflect innovation effort in different sectors Different types of indicator can be used to measure innovation. Some quantify inputs, while others measure results.The approach of this publication is specifically sectoral and therefore we use only indicators, linked to EU policies,which provide a cross-sectoral view of innovation inputs and outputs.
Different indicators are better suited to measuring different types of innovation (product innovation, processinnovation, market innovation and organisational innovation).
The indicators we selected are R&D expenditures and the number of patents. These are the most commonly used indicators, but they have some limitations, generally providing a better estimate of research activities in manufacturingthan in services.36
Inputs innovation indicators
Research and development (R&D) is one of the many activities carried out in an innovation process. R&D comprises basic research, applied research and experimental development. The indicators used to measure it are usually eitherR&D expenditures or R&D personnel.
In a knowledge-driven economy, R&D expenditure is not the only sign of innovation. Other indicators can be used tomeasure inputs that are intrinsically conducive to progress. Expenditures on software, training, organisation, forinstance, also quantify the innovation effort.
Innovations in service activities are not well captured by the R&D indicator. They often involve software applicationsand research in social sciences that are not properly accounted for in R&D expenditure surveys, which focus more ontechnological R&D than on social science.37 This publication focuses on R&D expenditure and the analysis ofinnovation is therefore more accurate as regards manufacturing than services.
In their national surveys, different countries allocate large, multi-sector enterprises’ R&D expenditures to different economic sectors. Similar R&D expenditure can be categorised in different industries across countries.
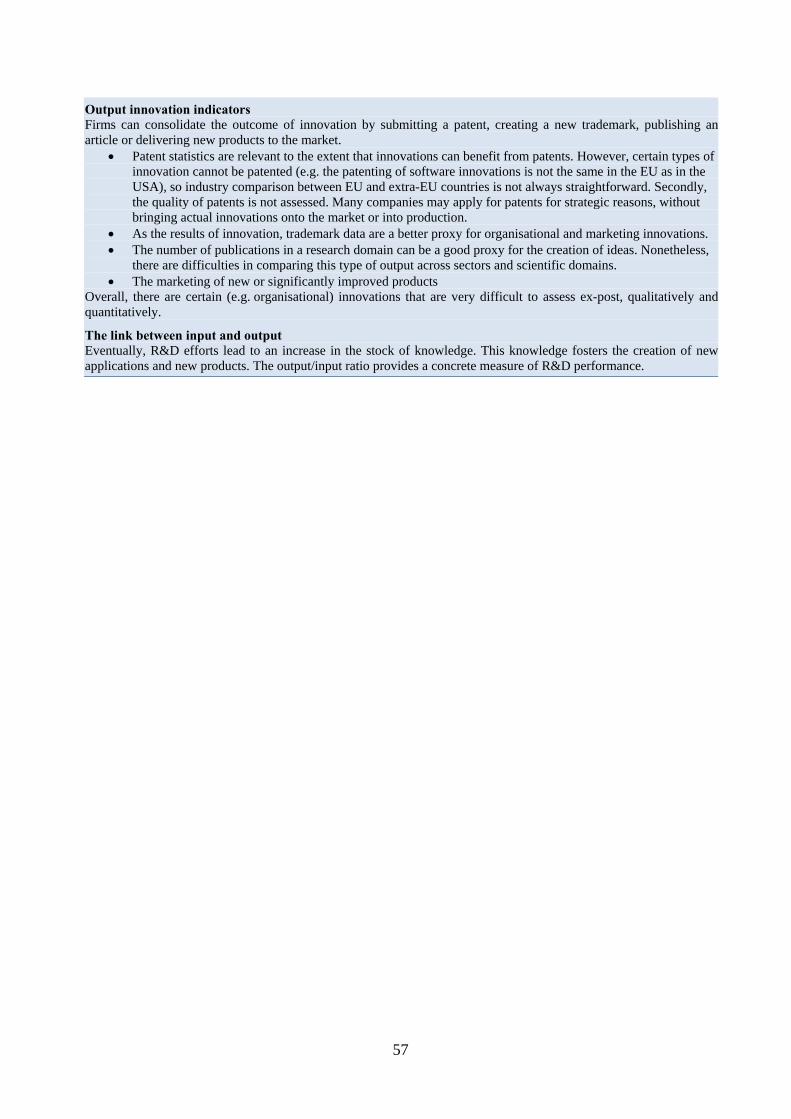
57
Output innovation indicators Firms can consolidate the outcome of innovation by submitting a patent, creating a new trademark, publishing anarticle or delivering new products to the market.
• Patent statistics are relevant to the extent that innovations can benefit from patents. However, certain types of innovation cannot be patented (e.g. the patenting of software innovations is not the same in the EU as in the USA), so industry comparison between EU and extra-EU countries is not always straightforward. Secondly, the quality of patents is not assessed. Many companies may apply for patents for strategic reasons, without bringing actual innovations onto the market or into production.
• As the results of innovation, trademark data are a better proxy for organisational and marketing innovations. • The number of publications in a research domain can be a good proxy for the creation of ideas. Nonetheless,
there are difficulties in comparing this type of output across sectors and scientific domains. • The marketing of new or significantly improved products
Overall, there are certain (e.g. organisational) innovations that are very difficult to assess ex-post, qualitatively and quantitatively.
The link between input and output Eventually, R&D efforts lead to an increase in the stock of knowledge. This knowledge fosters the creation of new applications and new products. The output/input ratio provides a concrete measure of R&D performance.
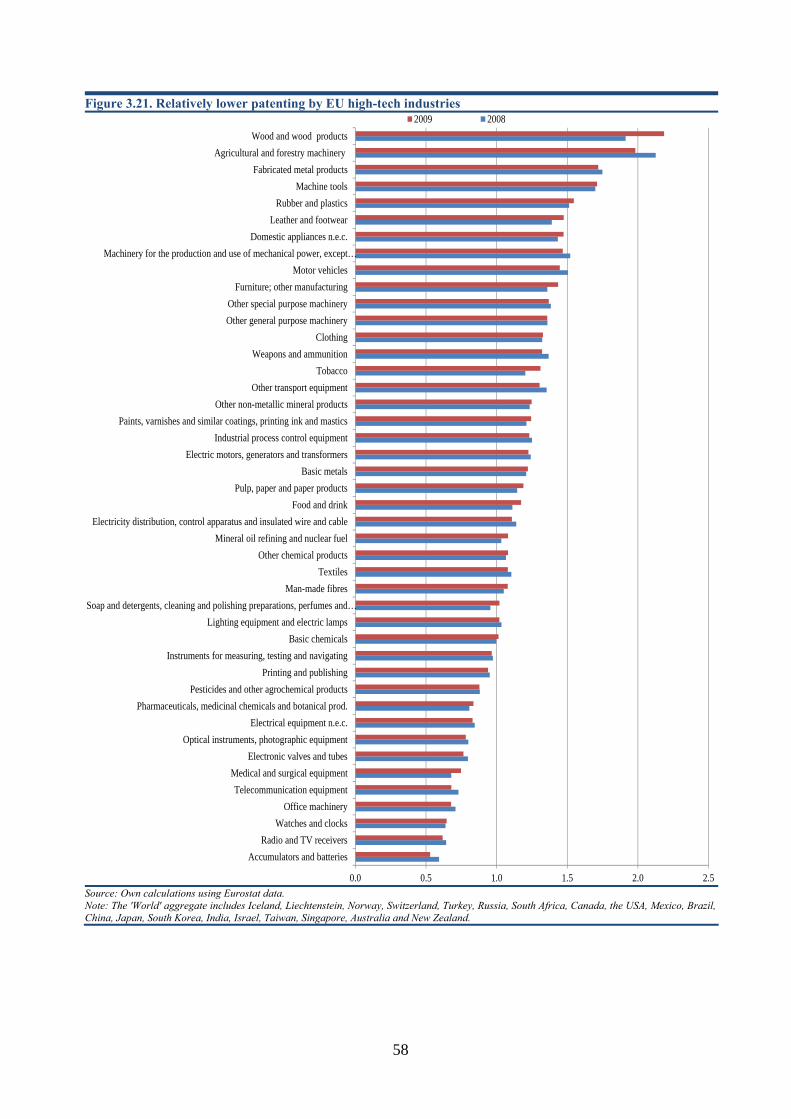
58
Figure 3.21. Relatively lower patenting by EU high-tech industries
0.0 0.5 1.0 1.5 2.0 2.5
Accumulators and batteriesRadio and TV receivers
Watches and clocksOffice machinery
Telecommunication equipmentMedical and surgical equipment
Electronic valves and tubesOptical instruments, photographic equipment
Electrical equipment n.e.c.Pharmaceuticals, medicinal chemicals and botanical prod.
Pesticides and other agrochemical productsPrinting and publishing
Instruments for measuring, testing and navigatingBasic chemicals
Lighting equipment and electric lampsSoap and detergents, cleaning and polishing preparations, perfumes and…
Man-made fibresTextiles
Other chemical productsMineral oil refining and nuclear fuel
Electricity distribution, control apparatus and insulated wire and cableFood and drink
Pulp, paper and paper productsBasic metals
Electric motors, generators and transformersIndustrial process control equipment
Paints, varnishes and similar coatings, printing ink and masticsOther non-metallic mineral products
Other transport equipmentTobacco
Weapons and ammunitionClothing
Other general purpose machineryOther special purpose machinery
Furniture; other manufacturingMotor vehicles
Machinery for the production and use of mechanical power, except…Domestic appliances n.e.c.
Leather and footwearRubber and plastics
Machine toolsFabricated metal products
Agricultural and forestry machineryWood and wood products
2009 2008
Source: Own calculations using Eurostat data. Note: The 'World' aggregate includes Iceland, Liechtenstein, Norway, Switzerland, Turkey, Russia, South Africa, Canada, the USA, Mexico, Brazil, China, Japan, South Korea, India, Israel, Taiwan, Singapore, Australia and New Zealand.
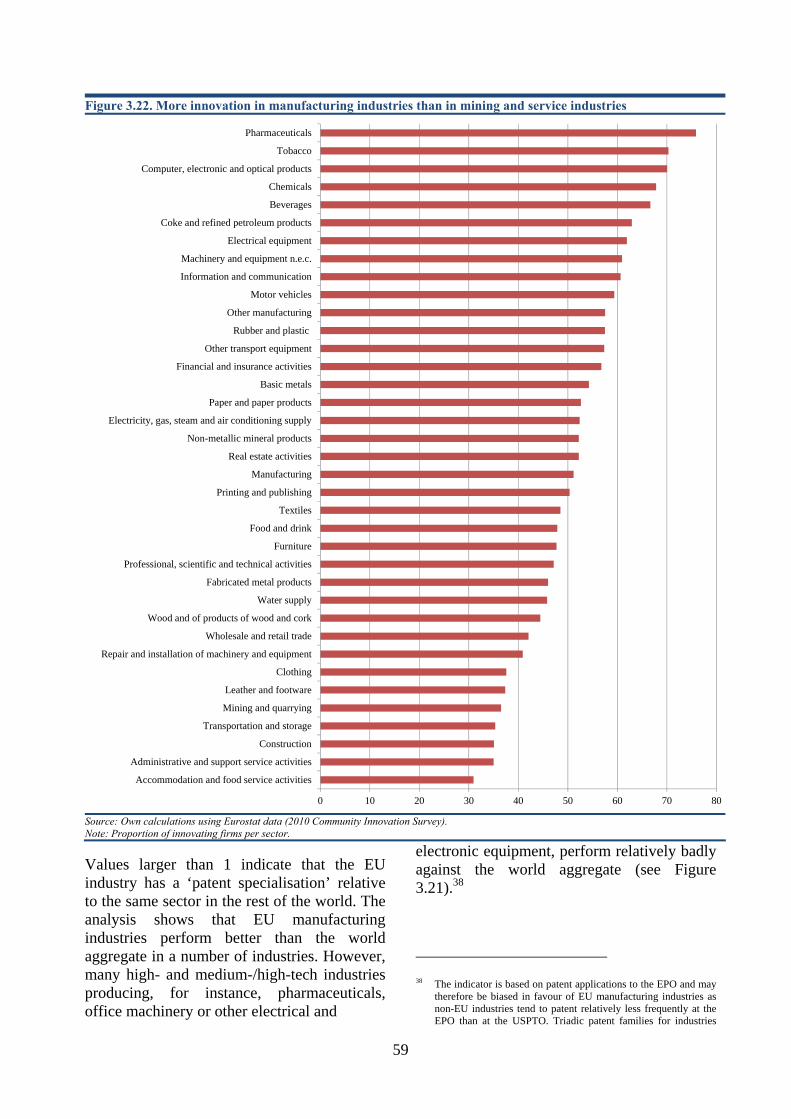
59
Values larger than 1 indicate that the EU industry has a ‘patent specialisation’ relative to the same sector in the rest of the world. The analysis shows that EU manufacturing industries perform better than the world aggregate in a number of industries. However, many high- and medium-/high-tech industries producing, for instance, pharmaceuticals, office machinery or other electrical and
electronic equipment, perform relatively badly against the world aggregate (see Figure 3.21).38
38 The indicator is based on patent applications to the EPO and may
therefore be biased in favour of EU manufacturing industries as non-EU industries tend to patent relatively less frequently at the EPO than at the USPTO. Triadic patent families for industries
Figure 3.22. More innovation in manufacturing industries than in mining and service industries
0 10 20 30 40 50 60 70 80
Accommodation and food service activities
Administrative and support service activities
Construction
Transportation and storage
Mining and quarrying
Leather and footware
Clothing
Repair and installation of machinery and equipment
Wholesale and retail trade
Wood and of products of wood and cork
Water supply
Fabricated metal products
Professional, scientific and technical activities
Furniture
Food and drink
Textiles
Printing and publishing
Manufacturing
Real estate activities
Non-metallic mineral products
Electricity, gas, steam and air conditioning supply
Paper and paper products
Basic metals
Financial and insurance activities
Other transport equipment
Rubber and plastic
Other manufacturing
Motor vehicles
Information and communication
Machinery and equipment n.e.c.
Electrical equipment
Coke and refined petroleum products
Beverages
Chemicals
Computer, electronic and optical products
Tobacco
Pharmaceuticals
Source: Own calculations using Eurostat data (2010 Community Innovation Survey). Note: Proportion of innovating firms per sector.

60
Innovation
Firms engage in R&D&I activities in order to develop new products or improve the existing ones. They can do this by engaging in:
- product innovation, thus differentiating their products and making demand less sensitive to price changes;
- process innovation, thus increasing productivity or lowering production costs.
- marketing innovation, thus implementation of a new marketing concept or strategy.
- organizational innovation, thus improving the enterprise’s business practices, workplace organisation or external relations.
We use here three indicators from the 2010 Community Innovation Survey (CIS): the proportion of innovative firms per sector (any type of innovation, Figure 3.22), the percentage of enterprises which introduced
that could take this bias into account were not available at the time of writing.
products that were new to the market and the share of firms that introduced process innovation (Figure 3.23).
Figure 3.22 shows the proportion of innovative enterprises by sector.
Manufacturing industries tend more than service industries to engage in innovation activities.39 The sectors producing pharmaceuticals, tobacco, computers, chemicals and beverages have a relatively higher proportion of innovative enterprises.
Few firms in low-tech manufacturing industries (such as clothing, wood and leather), or in industries like construction and services (administrative support, hotels and restaurants) engage in innovative activities.
According to the CIS dataset, pharmaceutical, ICT and chemical firms were the most successful in bringing new or improved
39 The figures are calculated as averages for different sectors across
the EU countries. They should be interpreted with caution as there are quite a few gaps in the dataset. The averages for tobacco, administration, accommodation & food and real estate activities are based on 10 or fewer observations.
Figure 3.23. Pharmaceuticals and ICT firms are the most successful in innovation
0.0
5.0
10.0
15.0
20.0
25.0
30.0
35.0
40.0Product innovation Process innovation
Source: Own calculations using Eurostat data. Data (2010 Community Innovation Survey). Note: Proportion of enterprises which introduced new or improved products (new to the market) and which introduced process innovation (new to the market, not new to the market and not knowing whether new to the market) as percentages of all enterprises in the CIS 2010 population. EU averages include Croatia.
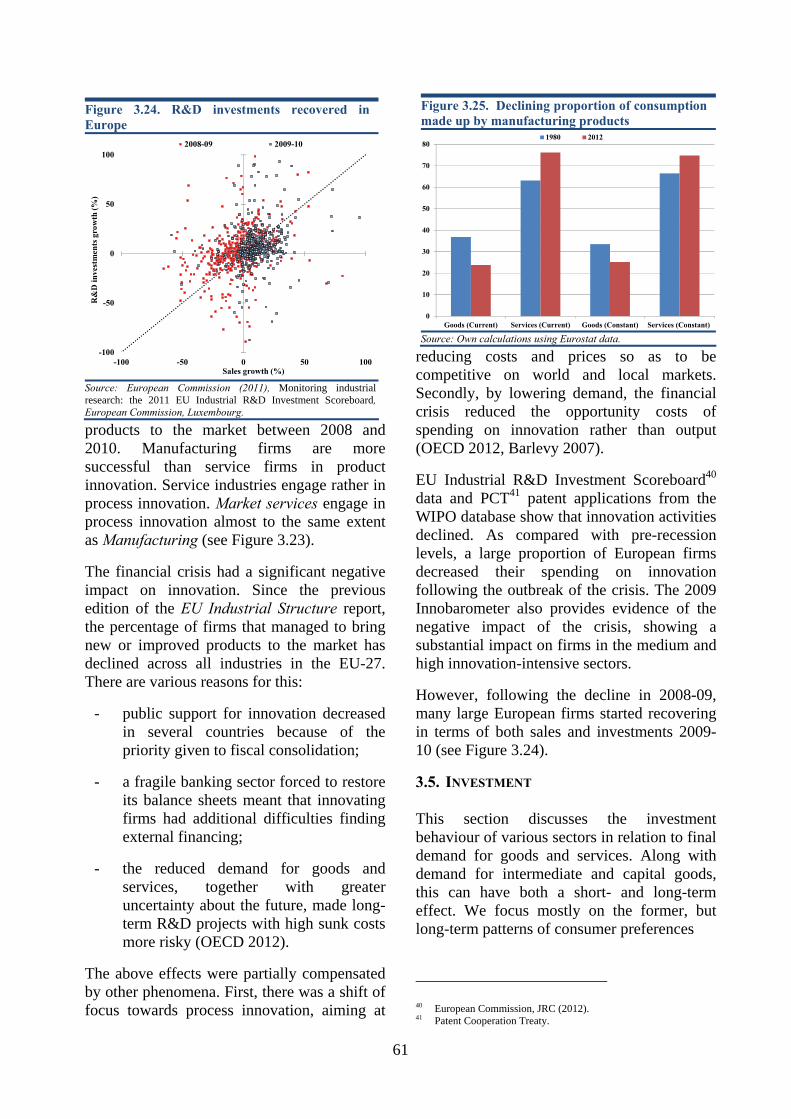
61
products to the market between 2008 and 2010. Manufacturing firms are more successful than service firms in product innovation. Service industries engage rather in process innovation. Market services engage in process innovation almost to the same extent as Manufacturing (see Figure 3.23).
The financial crisis had a significant negative impact on innovation. Since the previous edition of the EU Industrial Structure report, the percentage of firms that managed to bring new or improved products to the market has declined across all industries in the EU-27. There are various reasons for this:
- public support for innovation decreased in several countries because of the priority given to fiscal consolidation;
- a fragile banking sector forced to restore its balance sheets meant that innovating firms had additional difficulties finding external financing;
- the reduced demand for goods and services, together with greater uncertainty about the future, made long-term R&D projects with high sunk costs more risky (OECD 2012).
The above effects were partially compensated by other phenomena. First, there was a shift of focus towards process innovation, aiming at
reducing costs and prices so as to be competitive on world and local markets. Secondly, by lowering demand, the financial crisis reduced the opportunity costs of spending on innovation rather than output (OECD 2012, Barlevy 2007).
EU Industrial R&D Investment Scoreboard40 data and PCT41 patent applications from the WIPO database show that innovation activities declined. As compared with pre-recession levels, a large proportion of European firms decreased their spending on innovation following the outbreak of the crisis. The 2009 Innobarometer also provides evidence of the negative impact of the crisis, showing a substantial impact on firms in the medium and high innovation-intensive sectors.
However, following the decline in 2008-09, many large European firms started recovering in terms of both sales and investments 2009-10 (see Figure 3.24).
3.5. INVESTMENT
This section discusses the investment behaviour of various sectors in relation to final demand for goods and services. Along with demand for intermediate and capital goods, this can have both a short- and long-term effect. We focus mostly on the former, but long-term patterns of consumer preferences
40 European Commission, JRC (2012). 41 Patent Cooperation Treaty.
Figure 3.24. R&D investments recovered in Europe
-100
-50
0
50
100
-100 -50 0 50 100
R&
D in
vest
men
ts g
row
th (%
)
Sales growth (%)
2008-09 2009-10
Source: European Commission (2011), Monitoring industrial research: the 2011 EU Industrial R&D Investment Scoreboard, European Commission, Luxembourg.
Figure 3.25. Declining proportion of consumption made up by manufacturing products
0
10
20
30
40
50
60
70
80
Goods (Current) Services (Current) Goods (Constant) Services (Constant)
1980 2012
Source: Own calculations using Eurostat data.
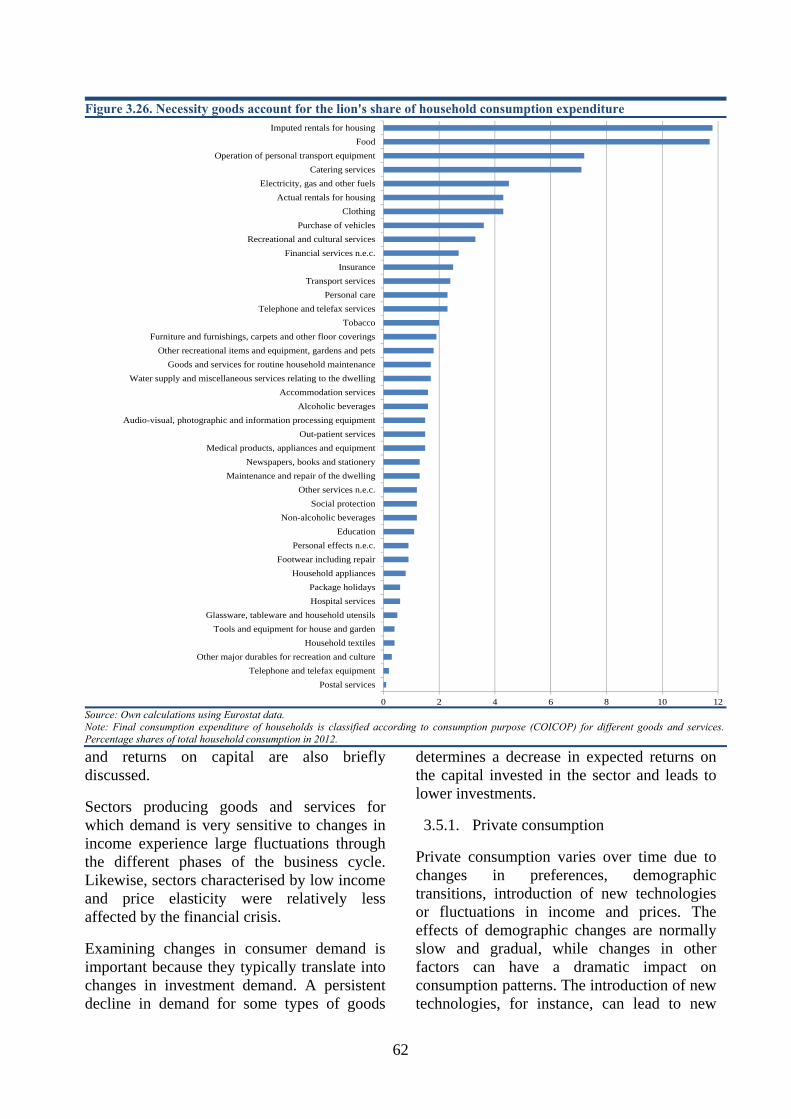
62
and returns on capital are also briefly discussed.
Sectors producing goods and services for which demand is very sensitive to changes in income experience large fluctuations through the different phases of the business cycle. Likewise, sectors characterised by low income and price elasticity were relatively less affected by the financial crisis.
Examining changes in consumer demand is important because they typically translate into changes in investment demand. A persistent decline in demand for some types of goods
determines a decrease in expected returns on the capital invested in the sector and leads to lower investments.
3.5.1. Private consumption
Private consumption varies over time due to changes in preferences, demographic transitions, introduction of new technologies or fluctuations in income and prices. The effects of demographic changes are normally slow and gradual, while changes in other factors can have a dramatic impact on consumption patterns. The introduction of new technologies, for instance, can lead to new
Figure 3.26. Necessity goods account for the lion's share of household consumption expenditure
0 2 4 6 8 10 12
Postal servicesTelephone and telefax equipment
Other major durables for recreation and cultureHousehold textiles
Tools and equipment for house and gardenGlassware, tableware and household utensils
Hospital servicesPackage holidays
Household appliancesFootwear including repair
Personal effects n.e.c.Education
Non-alcoholic beveragesSocial protection
Other services n.e.c.Maintenance and repair of the dwelling
Newspapers, books and stationeryMedical products, appliances and equipment
Out-patient servicesAudio-visual, photographic and information processing equipment
Alcoholic beveragesAccommodation services
Water supply and miscellaneous services relating to the dwellingGoods and services for routine household maintenance
Other recreational items and equipment, gardens and petsFurniture and furnishings, carpets and other floor coverings
TobaccoTelephone and telefax services
Personal careTransport services
InsuranceFinancial services n.e.c.
Recreational and cultural servicesPurchase of vehicles
ClothingActual rentals for housing
Electricity, gas and other fuelsCatering services
Operation of personal transport equipmentFood
Imputed rentals for housing
Source: Own calculations using Eurostat data. Note: Final consumption expenditure of households is classified according to consumption purpose (COICOP) for different goods and services. Percentage shares of total household consumption in 2012.
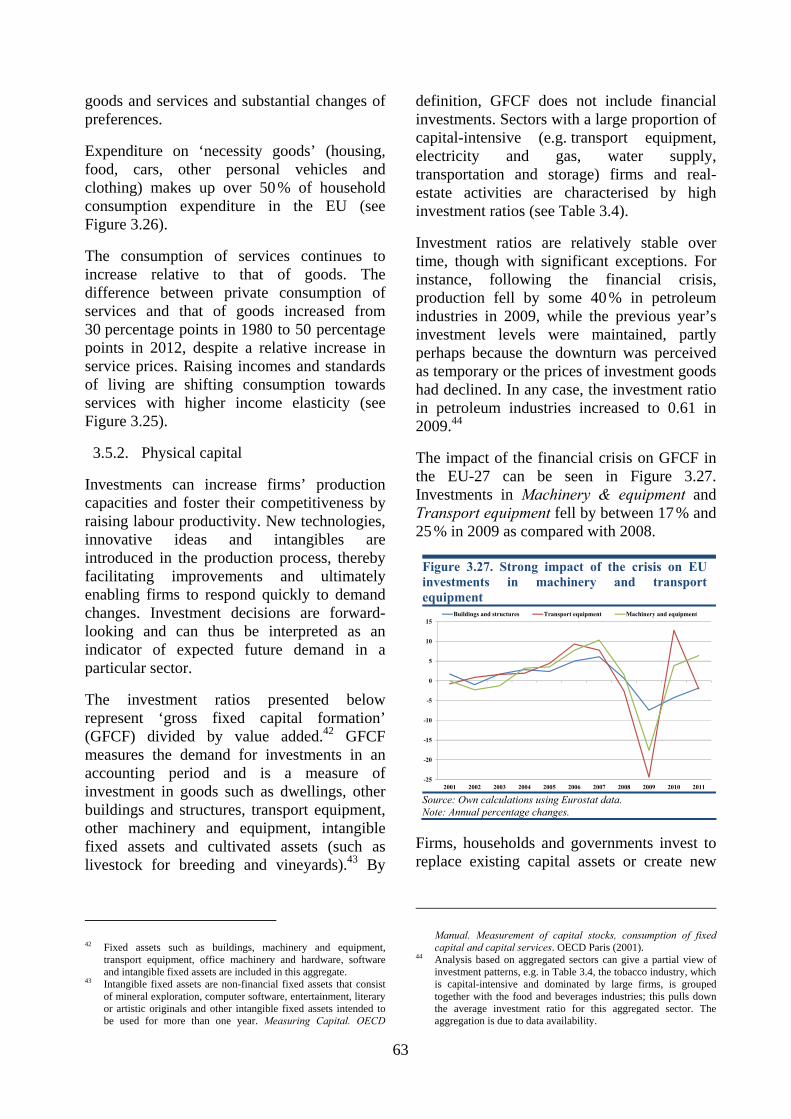
63
goods and services and substantial changes of preferences.
Expenditure on ‘necessity goods’ (housing, food, cars, other personal vehicles and clothing) makes up over 50 % of household consumption expenditure in the EU (see Figure 3.26).
The consumption of services continues to increase relative to that of goods. The difference between private consumption of services and that of goods increased from 30 percentage points in 1980 to 50 percentage points in 2012, despite a relative increase in service prices. Raising incomes and standards of living are shifting consumption towards services with higher income elasticity (see Figure 3.25).
3.5.2. Physical capital
Investments can increase firms’ production capacities and foster their competitiveness by raising labour productivity. New technologies, innovative ideas and intangibles are introduced in the production process, thereby facilitating improvements and ultimately enabling firms to respond quickly to demand changes. Investment decisions are forward-looking and can thus be interpreted as an indicator of expected future demand in a particular sector.
The investment ratios presented below represent ‘gross fixed capital formation’ (GFCF) divided by value added.42 GFCF measures the demand for investments in an accounting period and is a measure of investment in goods such as dwellings, other buildings and structures, transport equipment, other machinery and equipment, intangible fixed assets and cultivated assets (such as livestock for breeding and vineyards).43 By
42 Fixed assets such as buildings, machinery and equipment,
transport equipment, office machinery and hardware, software and intangible fixed assets are included in this aggregate.
43 Intangible fixed assets are non-financial fixed assets that consist of mineral exploration, computer software, entertainment, literary or artistic originals and other intangible fixed assets intended to be used for more than one year. Measuring Capital. OECD
definition, GFCF does not include financial investments. Sectors with a large proportion of capital-intensive (e.g. transport equipment, electricity and gas, water supply, transportation and storage) firms and real-estate activities are characterised by high investment ratios (see Table 3.4).
Investment ratios are relatively stable over time, though with significant exceptions. For instance, following the financial crisis, production fell by some 40 % in petroleum industries in 2009, while the previous year’s investment levels were maintained, partly perhaps because the downturn was perceived as temporary or the prices of investment goods had declined. In any case, the investment ratio in petroleum industries increased to 0.61 in 2009.44
The impact of the financial crisis on GFCF in the EU-27 can be seen in Figure 3.27. Investments in Machinery & equipment and Transport equipment fell by between 17 % and 25 % in 2009 as compared with 2008.
Firms, households and governments invest to replace existing capital assets or create new
Manual. Measurement of capital stocks, consumption of fixed capital and capital services. OECD Paris (2001).
44 Analysis based on aggregated sectors can give a partial view of investment patterns, e.g. in Table 3.4, the tobacco industry, which is capital-intensive and dominated by large firms, is grouped together with the food and beverages industries; this pulls down the average investment ratio for this aggregated sector. The aggregation is due to data availability.
Figure 3.27. Strong impact of the crisis on EU investments in machinery and transport equipment
-25
-20
-15
-10
-5
0
5
10
15
2001 2002 2003 2004 2005 2006 2007 2008 2009 2010 2011
Buildings and structures Transport equipment Machinery and equipment
Source: Own calculations using Eurostat data. Note: Annual percentage changes.
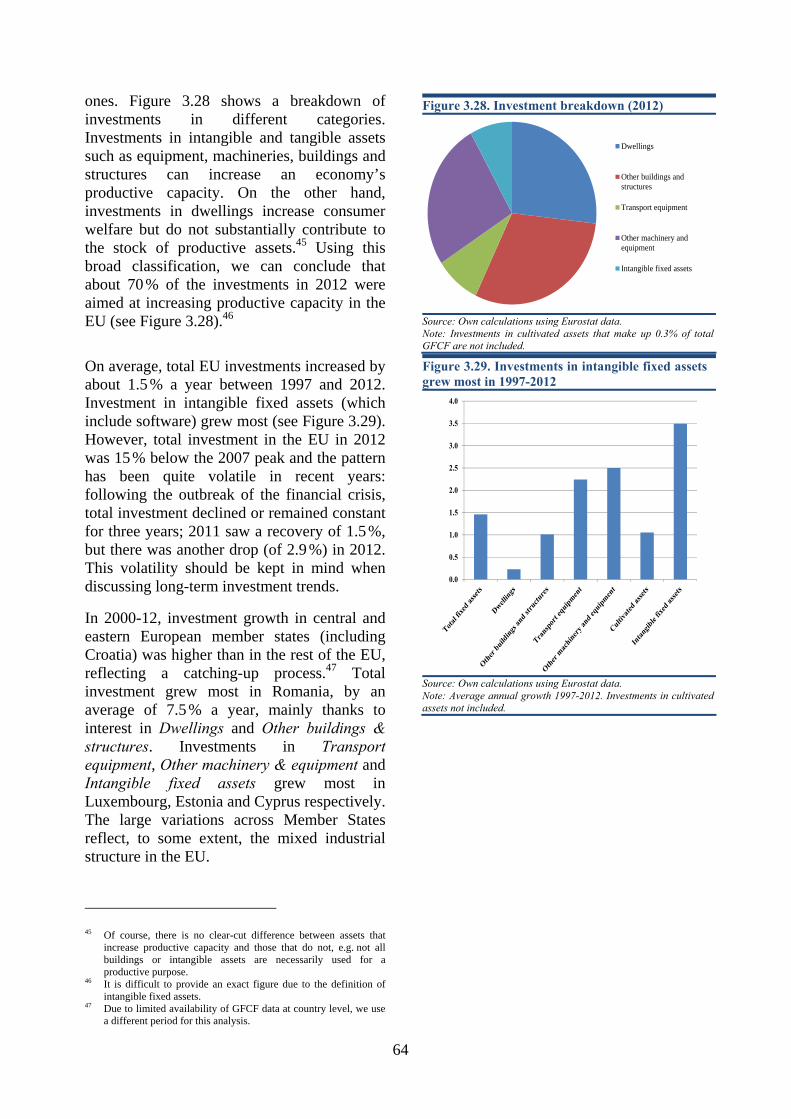
64
ones. Figure 3.28 shows a breakdown of investments in different categories. Investments in intangible and tangible assets such as equipment, machineries, buildings and structures can increase an economy’s productive capacity. On the other hand, investments in dwellings increase consumer welfare but do not substantially contribute to the stock of productive assets.45 Using this broad classification, we can conclude that about 70 % of the investments in 2012 were aimed at increasing productive capacity in the EU (see Figure 3.28).46
On average, total EU investments increased by about 1.5 % a year between 1997 and 2012. Investment in intangible fixed assets (which include software) grew most (see Figure 3.29). However, total investment in the EU in 2012 was 15 % below the 2007 peak and the pattern has been quite volatile in recent years: following the outbreak of the financial crisis, total investment declined or remained constant for three years; 2011 saw a recovery of 1.5 %, but there was another drop (of 2.9 %) in 2012. This volatility should be kept in mind when discussing long-term investment trends.
In 2000-12, investment growth in central and eastern European member states (including Croatia) was higher than in the rest of the EU, reflecting a catching-up process.47 Total investment grew most in Romania, by an average of 7.5 % a year, mainly thanks to interest in Dwellings and Other buildings & structures. Investments in Transport equipment, Other machinery & equipment and Intangible fixed assets grew most in Luxembourg, Estonia and Cyprus respectively. The large variations across Member States reflect, to some extent, the mixed industrial structure in the EU.
45 Of course, there is no clear-cut difference between assets that
increase productive capacity and those that do not, e.g. not all buildings or intangible assets are necessarily used for a productive purpose.
46 It is difficult to provide an exact figure due to the definition of intangible fixed assets.
47 Due to limited availability of GFCF data at country level, we use a different period for this analysis.
Figure 3.28. Investment breakdown (2012)
Dwellings
Other buildings andstructures
Transport equipment
Other machinery andequipment
Intangible fixed assets
Source: Own calculations using Eurostat data. Note: Investments in cultivated assets that make up 0.3% of total GFCF are not included.
Figure 3.29. Investments in intangible fixed assets grew most in 1997-2012
0.0
0.5
1.0
1.5
2.0
2.5
3.0
3.5
4.0
Source: Own calculations using Eurostat data. Note: Average annual growth 1997-2012. Investments in cultivated assets not included.
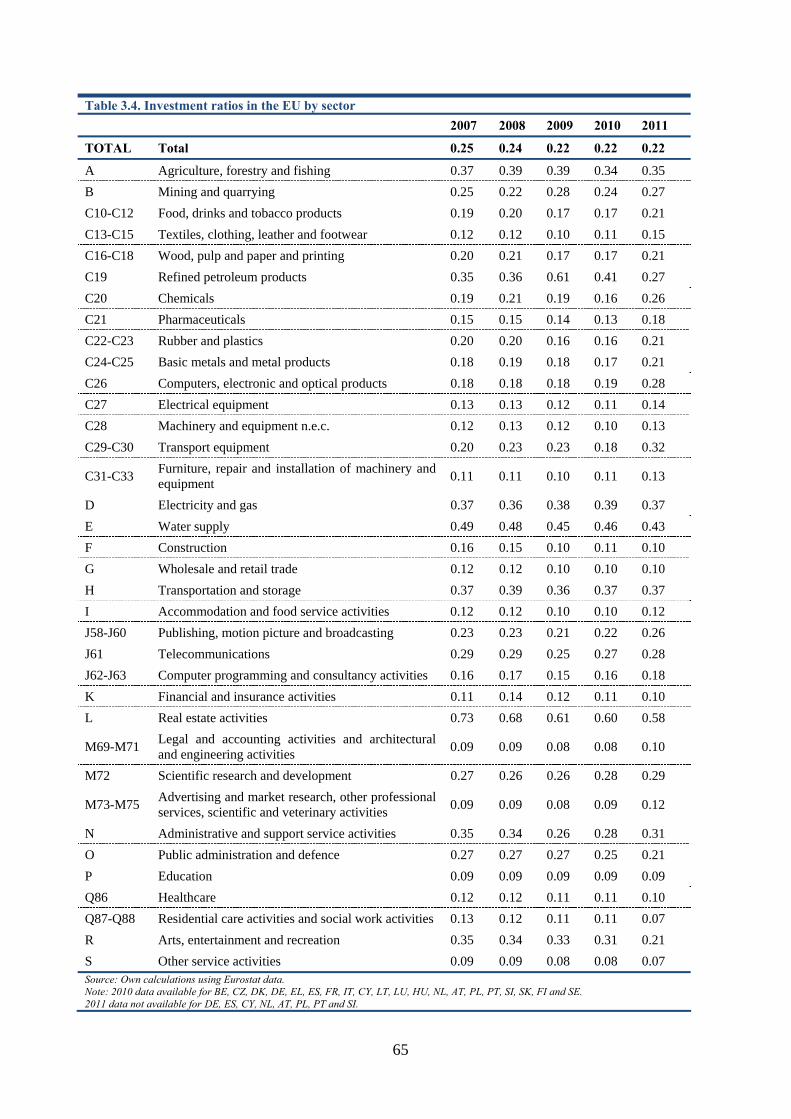
65
Table 3.4. Investment ratios in the EU by sector 2007 2008 2009 2010 2011
TOTAL Total 0.25 0.24 0.22 0.22 0.22
A Agriculture, forestry and fishing 0.37 0.39 0.39 0.34 0.35 B Mining and quarrying 0.25 0.22 0.28 0.24 0.27 C10-C12 Food, drinks and tobacco products 0.19 0.20 0.17 0.17 0.21 C13-C15 Textiles, clothing, leather and footwear 0.12 0.12 0.10 0.11 0.15 C16-C18 Wood, pulp and paper and printing 0.20 0.21 0.17 0.17 0.21 C19 Refined petroleum products 0.35 0.36 0.61 0.41 0.27 C20 Chemicals 0.19 0.21 0.19 0.16 0.26 C21 Pharmaceuticals 0.15 0.15 0.14 0.13 0.18 C22-C23 Rubber and plastics 0.20 0.20 0.16 0.16 0.21 C24-C25 Basic metals and metal products 0.18 0.19 0.18 0.17 0.21 C26 Computers, electronic and optical products 0.18 0.18 0.18 0.19 0.28 C27 Electrical equipment 0.13 0.13 0.12 0.11 0.14 C28 Machinery and equipment n.e.c. 0.12 0.13 0.12 0.10 0.13 C29-C30 Transport equipment 0.20 0.23 0.23 0.18 0.32
C31-C33 Furniture, repair and installation of machinery and equipment 0.11 0.11 0.10 0.11 0.13
D Electricity and gas 0.37 0.36 0.38 0.39 0.37 E Water supply 0.49 0.48 0.45 0.46 0.43 F Construction 0.16 0.15 0.10 0.11 0.10 G Wholesale and retail trade 0.12 0.12 0.10 0.10 0.10 H Transportation and storage 0.37 0.39 0.36 0.37 0.37 I Accommodation and food service activities 0.12 0.12 0.10 0.10 0.12 J58-J60 Publishing, motion picture and broadcasting 0.23 0.23 0.21 0.22 0.26 J61 Telecommunications 0.29 0.29 0.25 0.27 0.28 J62-J63 Computer programming and consultancy activities 0.16 0.17 0.15 0.16 0.18 K Financial and insurance activities 0.11 0.14 0.12 0.11 0.10 L Real estate activities 0.73 0.68 0.61 0.60 0.58
M69-M71 Legal and accounting activities and architectural and engineering activities 0.09 0.09 0.08 0.08 0.10
M72 Scientific research and development 0.27 0.26 0.26 0.28 0.29
M73-M75 Advertising and market research, other professional services, scientific and veterinary activities 0.09 0.09 0.08 0.09 0.12
N Administrative and support service activities 0.35 0.34 0.26 0.28 0.31 O Public administration and defence 0.27 0.27 0.27 0.25 0.21 P Education 0.09 0.09 0.09 0.09 0.09 Q86 Healthcare 0.12 0.12 0.11 0.11 0.10 Q87-Q88 Residential care activities and social work activities 0.13 0.12 0.11 0.11 0.07 R Arts, entertainment and recreation 0.35 0.34 0.33 0.31 0.21 S Other service activities 0.09 0.09 0.08 0.08 0.07 Source: Own calculations using Eurostat data. Note: 2010 data available for BE, CZ, DK, DE, EL, ES, FR, IT, CY, LT, LU, HU, NL, AT, PL, PT, SI, SK, FI and SE. 2011 data not available for DE, ES, CY, NL, AT, PL, PT and SI.

66
Table 3.5. Annual investment growth rates (2000-12)
Total Dwellings Other
buildings & structures
Transport equipment
Other machinery
& equipment
Intangible fixed assets
EU-27 0.3 -0.5 0.2 -0.1 0.8 2.7 EU-15 0.1 -0.6 -0.1 -0.5 0.5 2.7 BE 1.2 n.a n.a n.a n.a n.a BG 6.5 6.3 6.8 1.4 7.8 2.4 CZ 2.2 -0.8 1.3 4.8 3.1 2.9 DK 0.2 -0.5 -2.6 0.8 1.1 4.8 DE 0.0 -1.0 -1.0 1.3 1.2 4.0 EE 6.1 10.3 3.3 5.5 8.1 15.6 IE -3.4 -7.3 -3.2 0.7 -2.2 5.5 EL -3.0 -6.7 -3.4 0.1 0.4 4.0 ES -0.7 -1.3 0.7 -1.4 1.0 5.0 FR 1.2 0.9 1.0 1.5 1.3 3.8 IT -1.1 0.0 -1.6 -2.3 -1.2 -0.3 CY 0.1 -1.4 2.9 -11.4 0.0 23.9 LV 4.6 n.a n.a n.a n.a n.a LT 5.0 4.4 4.1 6.3 5.5 6.8 LU 4.6 9.1 1.4 7.7 4.9 4.6 HU -0.3 -4.4 -0.1 1.5 1.5 5.6 MT -2.5 -0.5 0.5 -11.2 -8.5 11.4 NL -0.5 -1.8 -1.1 -0.6 1.3 0.7 AT 0.5 -0.5 -0.4 1.5 1.2 3.8 PL 3.4 3.0 4.2 4.1 3.6 1.2 PT -4.0 -10.3 -2.4 -9.4 0.2 1.5 RO 7.5 23.1 7.3 3.7 7.0 0.6 SI -1.1 -2.0 -4.7 0.6 2.2 3.9 SK 3.6 -1.3 3.3 1.5 7.1 3.7 FI 1.1 1.6 -0.1 0.6 1.2 4.4 SE 2.7 4.3 2.0 0.4 3.6 2.3 UK 0.9 1.8 2.0 -5.3 0.1 1.3 HR 2.9 n.a n.a n.a n.a n.a Source: Own calculations using Eurostat data. Note: Investments in cultivated assets not included. Average annual growth 2000-12. Calculated from data expressed in volumes. Growth rates for Bulgaria, Spain, France, Luxembourg, Hungary and Poland refer to 2000-11. Growth rates for German investments in Transport equipment and Other Machinery refer to 2000-2011. Growth rates for Romania refer to 2000-10.
67
Chapter 4. INTERNATIONAL COMPETITIVENESS OF THE EU INDUSTRY
This chapter analyses the external competitiveness of the EU industries using trade and FDI data. It covers trade in both goods and services and also contains a section on foreign direct investment (FDI), which is important for understanding the effect of internationalisation on European industries. The chapter is organised as follows. Section 4.1 presents the position of the EU in the multilateral network of international supply chains. Section 4.2 analyses the competitiveness of EU industries via indicators of world market shares and revealed comparative advantage. EU trade is compared to that of its major trade partners. Section 4.3 complements the results from section 4.2 by looking at sophistication and exclusivity of EU exports and by analysing domestic and foreign content of exports and final consumption. Section 4.4 analyses foreign direct investment by sector.
4.1. THE EU IN GLOBAL TRADE
EU is the world’s largest trade bloc. Extra-EU (EU exports to countries outside the European Union) trade accounted for 16% of world trade in 2010.48 Exports of manufactured goods account for more than 80% of EU exports of goods. Machinery and vehicles make up for some 42%, while other manufactured goods and chemical products accounted for 23% and 16% respectively.49
The share of services in extra-EU trade of goods and services increased over time until 2009 to 30% from which it declined to some 27% in 2011.50
The importance of trade varies substantially between different Member States. Exports and imports are very large relative to GDP in
48 Eurostat (2013) 49 Ibid. 50 Ibid.
Ireland and Luxembourg while the external sector is much smaller in countries such as Greece and Spain. On average, exports and imports amounted to 45% and 43% respectively of GDP in the EU in 2012.
4.1.1. Manufactured goods
The EU-27 has a large share of world trade in manufactured goods: exports originating in EU-27 countries (including intra-EU trade) accounted for 37 % of total world exports in 2011. The importance of the single market is illustrated by the fact that a quarter of total world exports took place within the EU-27. Asia, North America and the EU accounted for about 80 % of total world export flows (see Table 4.1).51
51 The regions are as follows. Other Western Europe: Iceland,
Norway, Switzerland. Central and Eastern Europe: Albania, Armenia, Azerbaijan, Belarus, Bosnia Herzegovina, Croatia, Georgia, Kazakhstan, Montenegro, Rep. of Moldova, Russian Federation, Serbia, TFYR of Macedonia, Turkey, Ukraine. North America: Canada, US. Latin America: Argentina, Bahamas, Belize, Bolivia, Brazil, Chile, Colombia, Costa Rica, Cuba, Dominican Rep., Ecuador, El Salvador, Guatemala, Haiti, Honduras, Jamaica, Mexico, Dutch Antilles, Nicaragua, Panama, Paraguay, Peru, Suriname, Trinidad and Tobago, Uruguay, Venezuela. Middle East: Bahrain, Iran, Iraq, Israel, Jordan, Kuwait, Lebanon, Occ. Palestinian Terr., Oman, Qatar, Saudi Arabia, Syria, United Arab Emirates, Yemen. Asia: Afghanistan, Bangladesh, Bhutan, Brunei Darussalam, Cambodia, China, China, Hong Kong SAR, China, Macao SAR, Dem. People's Rep. of Korea, India, Indonesia, Japan, Kyrgyzstan, Lao People's Dem. Rep., Malaysia, Maldives, Mongolia, Myanmar, Nepal, Pakistan, Philippines, Rep. of Korea, Singapore, Sri Lanka, Tajikistan, Thailand, Timor-Leste, Uzbekistan, Viet Nam. Oceania: Australia, New Zealand. Africa: Algeria, Angola, Benin, Botswana, Burkina Faso, Burundi, Cameroon, Cape Verde, Central African Rep., Chad, Comoros, Congo, Côte d'Ivoire, Dem. Rep. of the Congo, Djibouti, Egypt, Equatorial Guinea, Eritrea, Ethiopia, Gabon, Gambia, Ghana, Guinea, Guinea-Bissau, Kenya, Lesotho, Liberia Libya, Madagascar, Malawi, Mali, Mauritania, Mauritius, Morocco, Mozambique, Namibia, Niger, Nigeria, Rwanda, Senegal, Sierra Leone, Somalia, South Africa, Sudan, Swaziland, Togo, Tunisia, Uganda, United Rep. of Tanzania, Zambia, Zimbabwe.
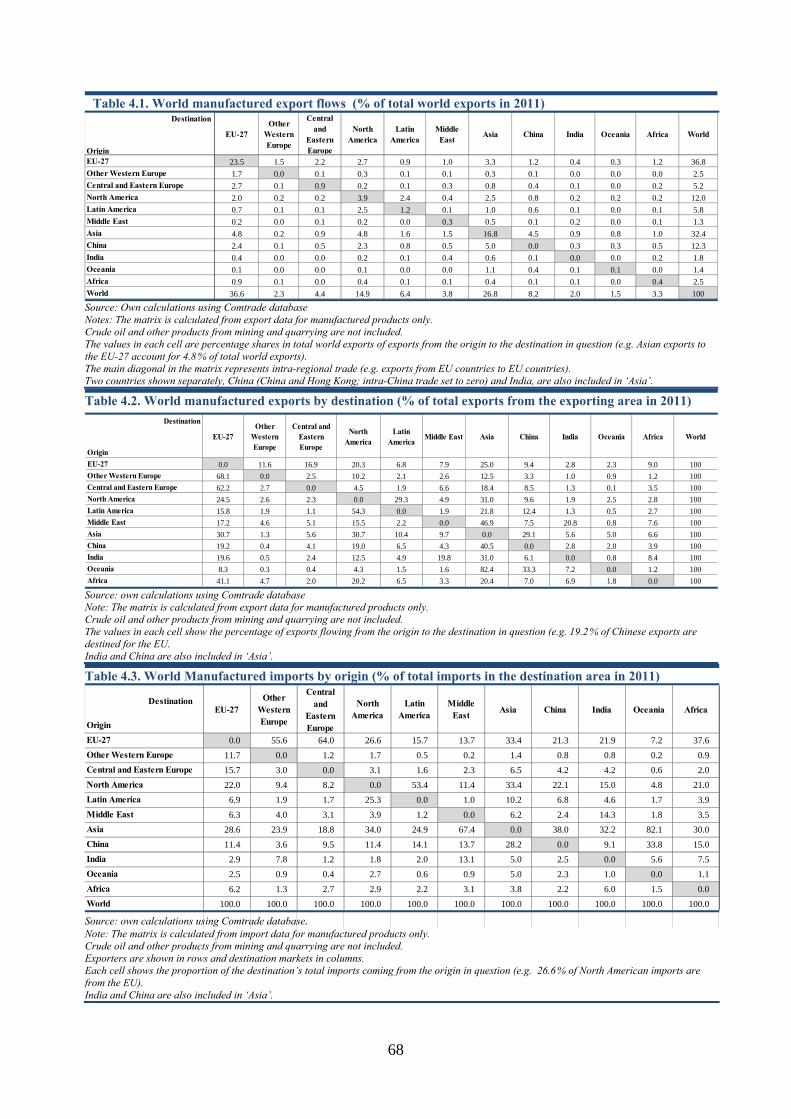
68
Table 4.1. World manufactured export flows (% of total world exports in 2011) Destination
Origin
EU-27Other
Western Europe
Central and
Eastern Europe
North America
Latin America
Middle East
Asia China India Oceania Africa World
EU-27 23.5 1.5 2.2 2.7 0.9 1.0 3.3 1.2 0.4 0.3 1.2 36.8Other Western Europe 1.7 0.0 0.1 0.3 0.1 0.1 0.3 0.1 0.0 0.0 0.0 2.5Central and Eastern Europe 2.7 0.1 0.9 0.2 0.1 0.3 0.8 0.4 0.1 0.0 0.2 5.2North America 2.0 0.2 0.2 3.9 2.4 0.4 2.5 0.8 0.2 0.2 0.2 12.0Latin America 0.7 0.1 0.1 2.5 1.2 0.1 1.0 0.6 0.1 0.0 0.1 5.8Middle East 0.2 0.0 0.1 0.2 0.0 0.3 0.5 0.1 0.2 0.0 0.1 1.3Asia 4.8 0.2 0.9 4.8 1.6 1.5 16.8 4.5 0.9 0.8 1.0 32.4China 2.4 0.1 0.5 2.3 0.8 0.5 5.0 0.0 0.3 0.3 0.5 12.3India 0.4 0.0 0.0 0.2 0.1 0.4 0.6 0.1 0.0 0.0 0.2 1.8Oceania 0.1 0.0 0.0 0.1 0.0 0.0 1.1 0.4 0.1 0.1 0.0 1.4Africa 0.9 0.1 0.0 0.4 0.1 0.1 0.4 0.1 0.1 0.0 0.4 2.5World 36.6 2.3 4.4 14.9 6.4 3.8 26.8 8.2 2.0 1.5 3.3 100
Source: Own calculations using Comtrade database Notes: The matrix is calculated from export data for manufactured products only. Crude oil and other products from mining and quarrying are not included. The values in each cell are percentage shares in total world exports of exports from the origin to the destination in question (e.g. Asian exports to the EU-27 account for 4.8 % of total world exports). The main diagonal in the matrix represents intra-regional trade (e.g. exports from EU countries to EU countries). Two countries shown separately, China (China and Hong Kong; intra-China trade set to zero) and India, are also included in ‘Asia’.
Table 4.2. World manufactured exports by destination (% of total exports from the exporting area in 2011) Destination
Origin
EU-27Other
Western Europe
Central and Eastern Europe
North America
Latin America Middle East Asia China India Oceania Africa World
EU-27 0.0 11.6 16.9 20.3 6.8 7.9 25.0 9.4 2.8 2.3 9.0 100Other Western Europe 68.1 0.0 2.5 10.2 2.1 2.6 12.5 3.3 1.0 0.9 1.2 100Central and Eastern Europe 62.2 2.7 0.0 4.5 1.9 6.6 18.4 8.5 1.3 0.1 3.5 100North America 24.5 2.6 2.3 0.0 29.3 4.9 31.0 9.6 1.9 2.5 2.8 100Latin America 15.8 1.9 1.1 54.3 0.0 1.9 21.8 12.4 1.3 0.5 2.7 100Middle East 17.2 4.6 5.1 15.5 2.2 0.0 46.9 7.5 20.8 0.8 7.6 100Asia 30.7 1.3 5.6 30.7 10.4 9.7 0.0 29.1 5.6 5.0 6.6 100China 19.2 0.4 4.1 19.0 6.5 4.3 40.5 0.0 2.8 2.0 3.9 100India 19.6 0.5 2.4 12.5 4.9 19.8 31.0 6.1 0.0 0.8 8.4 100Oceania 8.3 0.3 0.4 4.3 1.5 1.6 82.4 33.3 7.2 0.0 1.2 100Africa 41.1 4.7 2.0 20.2 6.5 3.3 20.4 7.0 6.9 1.8 0.0 100
Source: own calculations using Comtrade database Note: The matrix is calculated from export data for manufactured products only. Crude oil and other products from mining and quarrying are not included. The values in each cell show the percentage of exports flowing from the origin to the destination in question (e.g. 19.2 % of Chinese exports are destined for the EU. India and China are also included in ‘Asia’.
Table 4.3. World Manufactured imports by origin (% of total imports in the destination area in 2011)
Destination
Origin
EU-27Other
Western Europe
Central and
Eastern Europe
North America
Latin America
Middle East Asia China India Oceania Africa
EU-27 0.0 55.6 64.0 26.6 15.7 13.7 33.4 21.3 21.9 7.2 37.6Other Western Europe 11.7 0.0 1.2 1.7 0.5 0.2 1.4 0.8 0.8 0.2 0.9Central and Eastern Europe 15.7 3.0 0.0 3.1 1.6 2.3 6.5 4.2 4.2 0.6 2.0North America 22.0 9.4 8.2 0.0 53.4 11.4 33.4 22.1 15.0 4.8 21.0Latin America 6.9 1.9 1.7 25.3 0.0 1.0 10.2 6.8 4.6 1.7 3.9Middle East 6.3 4.0 3.1 3.9 1.2 0.0 6.2 2.4 14.3 1.8 3.5Asia 28.6 23.9 18.8 34.0 24.9 67.4 0.0 38.0 32.2 82.1 30.0China 11.4 3.6 9.5 11.4 14.1 13.7 28.2 0.0 9.1 33.8 15.0India 2.9 7.8 1.2 1.8 2.0 13.1 5.0 2.5 0.0 5.6 7.5Oceania 2.5 0.9 0.4 2.7 0.6 0.9 5.0 2.3 1.0 0.0 1.1Africa 6.2 1.3 2.7 2.9 2.2 3.1 3.8 2.2 6.0 1.5 0.0World 100.0 100.0 100.0 100.0 100.0 100.0 100.0 100.0 100.0 100.0 100.0
Source: own calculations using Comtrade database. Note: The matrix is calculated from import data for manufactured products only. Crude oil and other products from mining and quarrying are not included. Exporters are shown in rows and destination markets in columns. Each cell shows the proportion of the destination’s total imports coming from the origin in question (e.g. 26.6 % of North American imports are from the EU). India and China are also included in ‘Asia’.
69
In 2011, the main destinations for extra-EU-27 exports to non-EU countries were Asia, North America and Central and Eastern Europe which together amounted to more than 60% of total EU-27 exports. While China was a large destination for Asian, exports, the Chinese market only accounted for 9.4% of the EU’s exports (see Table 4.2).
When intra-regional trade is not taken into account, EU-27 imports came mainly from Asia (28.6%) and North America (22%). Asia, including India, and the EU receive more than a half of North American exports (see Table 4.2).
4.1.2. Services
No data are available on multilateral trade flows in services and the information in this section is limited to exports and imports by region.
If trade between Member States is included, the EU accounts for around 42 % of world exports in services, followed by North America (see Figure 4.1). Its share has declined in recent years (by around 6 %), along with (albeit less than) the USA’s. Conversely, developing regions, particularly Asia, have increased their share.
The EU also accounts for the largest share of imported services followed by North America. Similar to the pattern above for exported services, there is a shift in the proportion of shares of imported services toward faster growing regions, particularly China.
At sector level, the share of world services exports has declined across all sectors. The steepest declines have been in construction, computer and information services and travel (see Figure 4.2).
The smallest declines have been in communication services (which include telecommunications) and insurance services.
4.2. THE EU INDUSTRIES' MARKET SHARES
AND COMPARATIVE ADVANTAGES
This section studies EU patterns of export specialization and comparative advantages on the world markets. It presents first EU exports and imports by income groups of countries and major trade partners (US, Japan and the BRIC countries); then it looks at EU market shares and export specialization for manufacturing goods and services.
4.2.1. Manufacturing
The EU trades mainly with partners at a similar level of development, but there are noticeable variations across sectors. The analyses below refer only to manufactured goods, so agriculture and mining (including energy) products are not included. This has a significant impact on the shares of some trading partners, e.g. Russia and the oil-producing countries. In 2011, Russia was responsible for over a third of EU refined petroleum imports. The EU trades in manufacturing goods mainly with high- and upper-medium-income partners.52
52 We used the World Bank’s classification by income level; the
country groups are as follows: High non-EU: Australia, Bahamas, Bahrain, Brunei Darussalam, Canada, Croatia, Hong Kong SAR, Iceland, Israel, Japan, Rep. of Korea, Kuwait, China, Macao SAR, Oman, Dutch Antilles, New Zealand, Norway, Qatar, Saudi Arabia, Singapore, Switzerland, United Arab Emirates, USA; Upper-medium: Algeria, Argentina, Bosnia Herzegovina, Botswana, Brazil, Belarus, Chile, Colombia, Costa Rica, Cuba, Dominican Rep., Equatorial Guinea, Gabon, Jamaica, Kazakhstan, Lebanon, Libya, Malaysia, Mauritius, Mexico, Montenegro, Namibia, Panama, Russian Federation, Serbia, South Africa, Suriname, Trinidad and Tobago, Turkey, TFYR of Macedonia, Uruguay, Venezuela; Low-medium: Albania, Angola, Azerbaijan, Armenia, Bolivia, Belize, Cameroon, Cape Verde, Sri Lanka, China, Ecuador, El Salvador, Djibouti, Georgia, Guatemala, Honduras, Indonesia, Iran, Iraq, Côte d’Ivoire, Jordan, Lesotho, Maldives, Mongolia, Rep. of Moldova, Morocco, Nicaragua, Nigeria, Paraguay, Peru, Philippines, Timor-Leste, India, Swaziland, Syria, Thailand, Tunisia, Ukraine, Egypt; Low: Afghanistan, Bangladesh, Bhutan, Myanmar, Burundi, Cambodia, Central African Rep., Chad, Comoros, Congo, Dem. Rep. of the Congo, Benin, Ethiopia, Eritrea, Gambia, Ghana, Guinea, Haiti, Kenya, Dem. People’s Rep. of Korea, Kyrgyzstan, Lao People’s Dem. Rep., Liberia, Madagascar, Malawi, Mali, Mauritania, Mozambique, Nepal, Niger, Pakistan, Guinea-Bissau, Rwanda, Senegal, Sierra Leone, Viet Nam, Somalia, Zimbabwe, Sudan, Tajikistan, Togo, Uganda, United Rep. of Tanzania, Burkina Faso, Uzbekistan, Yemen, Zambia.

70
In all manufacturing sectors except textiles, paper, electrical equipment, machinery and motor vehicles, about half or more of the EU’s exports in 2011 were to high-income countries (see Table 4.4).
More than half of the EU’s imports of textiles, clothing, footwear, non-metallic mineral products, computers, electrical equipment and furniture originate in low-/medium-income countries (table 4.5). It is interesting to compare the EU’s imports of computers, electronic and optical instruments with its exports of similar goods. Over half of these EU exports are destined for high-income countries. While this is a broad category, this indicates that the goods that EU industries export are of a higher quality than those it imports.
The share of EU imports from low income countries is relatively high only in clothing (18.3% of all EU imports), leather and footwear (13.9%) and textiles (12.5%).
The EU imports from the US are significant in other transport equipment (54% of all EU imports in this category), pharmaceuticals (43%), beverages (28%), chemicals (23%) and machinery (23%). Japan is a large source of EU imports for motor vehicles (27%) and machinery (20%).
Figure 4.1. Services exports and imports by region (% of world services exports/ imports)
Exports Imports
0% 10% 20% 30% 40% 50% 60%
New Zealand
Australia
CIS
Middle East
South and CentralAmerica
EFTA
India
China
ASEAN
North America
EU 27 (intra-EU)
EU 27
2012 2004
0% 10% 20% 30% 40% 50%
New Zealand
Australia
India
EFTA
CIS
South and Central America
China
Middle East
ASEAN
North America
EU 27 (intra-EU)
EU 27
2012 2004
Source: WTO trade statistics, own calculations
Figure 4.2. EU service exports by sector (% of world service exports)
0 0.1 0.2 0.3 0.4 0.5 0.6 0.7
Commercial services (Services excl.government services)
Transportation
Travel
Communications services
Construction
Insurance services
Financial services
Computer and information services
Royalties and license fees
Other business services
2012 2004
Source: WTO trade statistics, own calculations
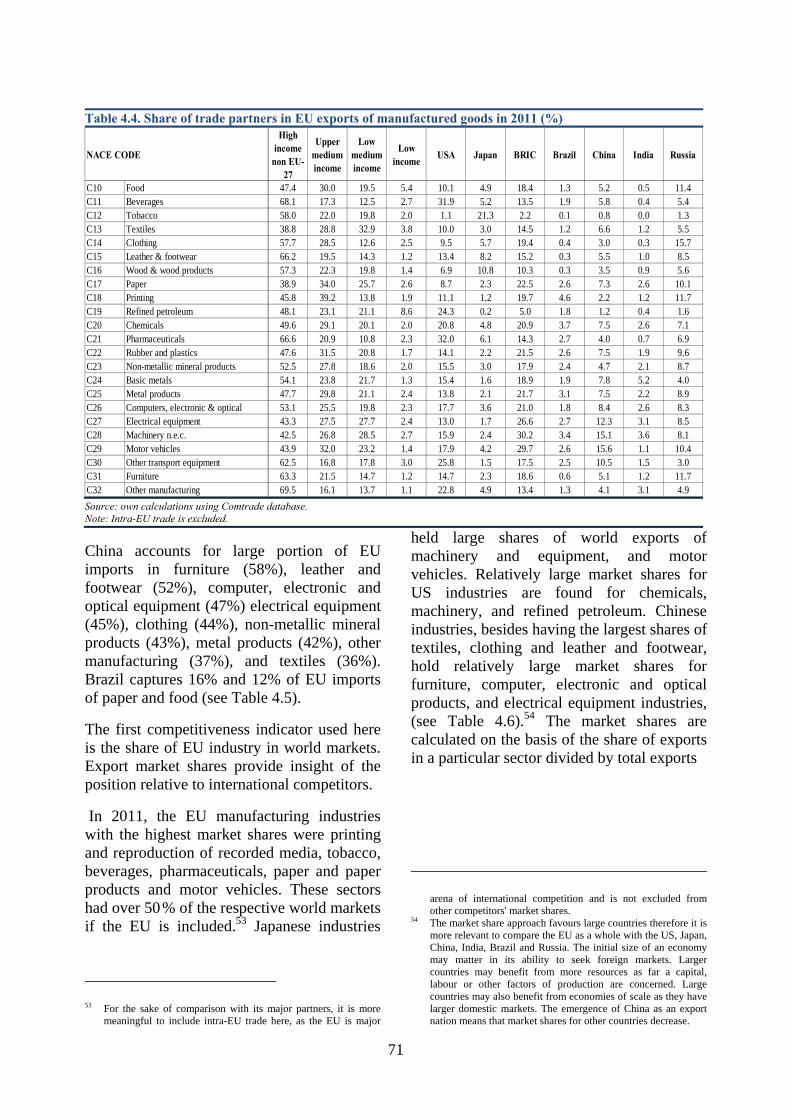
71
China accounts for large portion of EU imports in furniture (58%), leather and footwear (52%), computer, electronic and optical equipment (47%) electrical equipment (45%), clothing (44%), non-metallic mineral products (43%), metal products (42%), other manufacturing (37%), and textiles (36%). Brazil captures 16% and 12% of EU imports of paper and food (see Table 4.5).
The first competitiveness indicator used here is the share of EU industry in world markets. Export market shares provide insight of the position relative to international competitors.
In 2011, the EU manufacturing industries with the highest market shares were printing and reproduction of recorded media, tobacco, beverages, pharmaceuticals, paper and paper products and motor vehicles. These sectors had over 50 % of the respective world markets if the EU is included.53 Japanese industries
53 For the sake of comparison with its major partners, it is more
meaningful to include intra-EU trade here, as the EU is major
held large shares of world exports of machinery and equipment, and motor vehicles. Relatively large market shares for US industries are found for chemicals, machinery, and refined petroleum. Chinese industries, besides having the largest shares of textiles, clothing and leather and footwear, hold relatively large market shares for furniture, computer, electronic and optical products, and electrical equipment industries, (see Table 4.6).54 The market shares are calculated on the basis of the share of exports in a particular sector divided by total exports
arena of international competition and is not excluded from other competitors' market shares.
54 The market share approach favours large countries therefore it is more relevant to compare the EU as a whole with the US, Japan, China, India, Brazil and Russia. The initial size of an economy may matter in its ability to seek foreign markets. Larger countries may benefit from more resources as far a capital, labour or other factors of production are concerned. Large countries may also benefit from economies of scale as they have larger domestic markets. The emergence of China as an export nation means that market shares for other countries decrease.
Table 4.4. Share of trade partners in EU exports of manufactured goods in 2011 (%)
NACE CODE
High income
non EU-27
Upper medium income
Low medium income
Low income USA Japan BRIC Brazil China India Russia
C10 Food 47.4 30.0 19.5 5.4 10.1 4.9 18.4 1.3 5.2 0.5 11.4C11 Beverages 68.1 17.3 12.5 2.7 31.9 5.2 13.5 1.9 5.8 0.4 5.4C12 Tobacco 58.0 22.0 19.8 2.0 1.1 21.3 2.2 0.1 0.8 0.0 1.3C13 Textiles 38.8 28.8 32.9 3.8 10.0 3.0 14.5 1.2 6.6 1.2 5.5C14 Clothing 57.7 28.5 12.6 2.5 9.5 5.7 19.4 0.4 3.0 0.3 15.7C15 Leather & footwear 66.2 19.5 14.3 1.2 13.4 8.2 15.2 0.3 5.5 1.0 8.5C16 Wood & wood products 57.3 22.3 19.8 1.4 6.9 10.8 10.3 0.3 3.5 0.9 5.6C17 Paper 38.9 34.0 25.7 2.6 8.7 2.3 22.5 2.6 7.3 2.6 10.1C18 Printing 45.8 39.2 13.8 1.9 11.1 1.2 19.7 4.6 2.2 1.2 11.7C19 Refined petroleum 48.1 23.1 21.1 8.6 24.3 0.2 5.0 1.8 1.2 0.4 1.6C20 Chemicals 49.6 29.1 20.1 2.0 20.8 4.8 20.9 3.7 7.5 2.6 7.1C21 Pharmaceuticals 66.6 20.9 10.8 2.3 32.0 6.1 14.3 2.7 4.0 0.7 6.9C22 Rubber and plastics 47.6 31.5 20.8 1.7 14.1 2.2 21.5 2.6 7.5 1.9 9.6C23 Non-metallic mineral products 52.5 27.8 18.6 2.0 15.5 3.0 17.9 2.4 4.7 2.1 8.7C24 Basic metals 54.1 23.8 21.7 1.3 15.4 1.6 18.9 1.9 7.8 5.2 4.0C25 Metal products 47.7 29.8 21.1 2.4 13.8 2.1 21.7 3.1 7.5 2.2 8.9C26 Computers, electronic & optical 53.1 25.5 19.8 2.3 17.7 3.6 21.0 1.8 8.4 2.6 8.3C27 Electrical equipment 43.3 27.5 27.7 2.4 13.0 1.7 26.6 2.7 12.3 3.1 8.5C28 Machinery n.e.c. 42.5 26.8 28.5 2.7 15.9 2.4 30.2 3.4 15.1 3.6 8.1C29 Motor vehicles 43.9 32.0 23.2 1.4 17.9 4.2 29.7 2.6 15.6 1.1 10.4C30 Other transport equipment 62.5 16.8 17.8 3.0 25.8 1.5 17.5 2.5 10.5 1.5 3.0C31 Furniture 63.3 21.5 14.7 1.2 14.7 2.3 18.6 0.6 5.1 1.2 11.7C32 Other manufacturing 69.5 16.1 13.7 1.1 22.8 4.9 13.4 1.3 4.1 3.1 4.9Source: own calculations using Comtrade database. Note: Intra-EU trade is excluded.
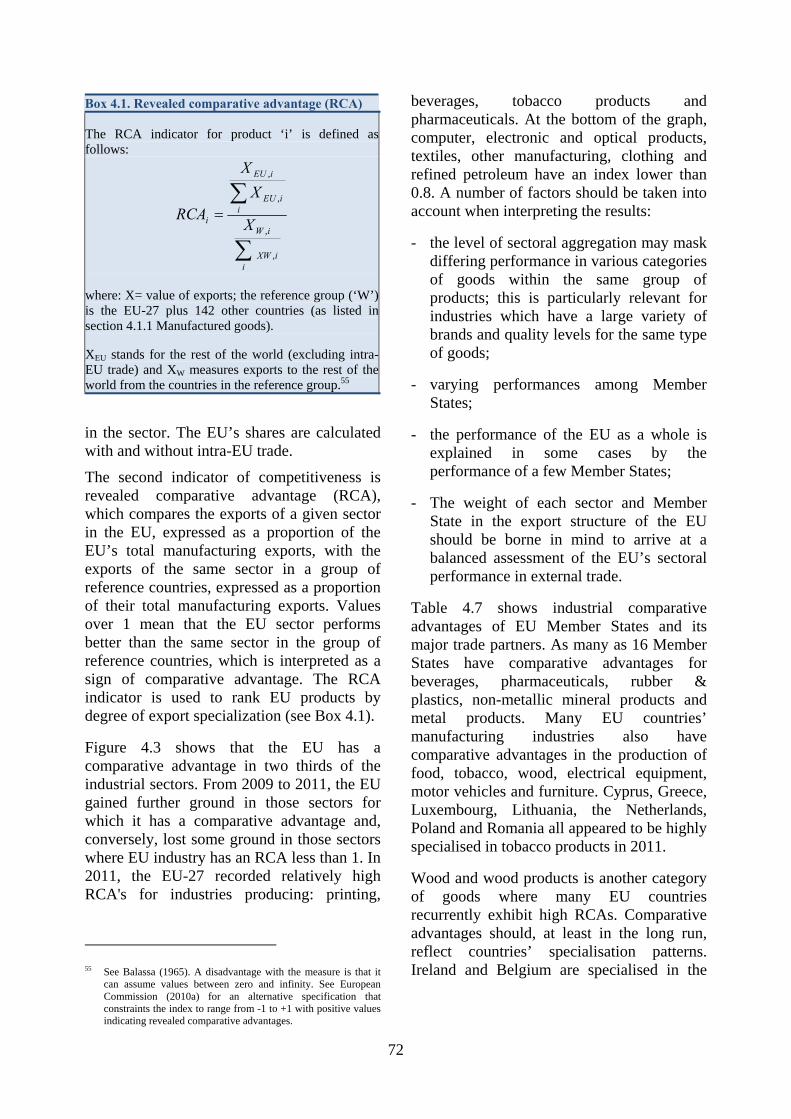
72
in the sector. The EU’s shares are calculated with and without intra-EU trade.
The second indicator of competitiveness is revealed comparative advantage (RCA), which compares the exports of a given sector in the EU, expressed as a proportion of the EU’s total manufacturing exports, with the exports of the same sector in a group of reference countries, expressed as a proportion of their total manufacturing exports. Values over 1 mean that the EU sector performs better than the same sector in the group of reference countries, which is interpreted as a sign of comparative advantage. The RCA indicator is used to rank EU products by degree of export specialization (see Box 4.1).
Figure 4.3 shows that the EU has a comparative advantage in two thirds of the industrial sectors. From 2009 to 2011, the EU gained further ground in those sectors for which it has a comparative advantage and, conversely, lost some ground in those sectors where EU industry has an RCA less than 1. In 2011, the EU-27 recorded relatively high RCA's for industries producing: printing,
55 See Balassa (1965). A disadvantage with the measure is that it
can assume values between zero and infinity. See European Commission (2010a) for an alternative specification that constraints the index to range from -1 to +1 with positive values indicating revealed comparative advantages.
beverages, tobacco products and pharmaceuticals. At the bottom of the graph, computer, electronic and optical products, textiles, other manufacturing, clothing and refined petroleum have an index lower than 0.8. A number of factors should be taken into account when interpreting the results:
- the level of sectoral aggregation may mask differing performance in various categories of goods within the same group of products; this is particularly relevant for industries which have a large variety of brands and quality levels for the same type of goods;
- varying performances among Member States;
- the performance of the EU as a whole is explained in some cases by the performance of a few Member States;
- The weight of each sector and Member State in the export structure of the EU should be borne in mind to arrive at a balanced assessment of the EU’s sectoral performance in external trade.
Table 4.7 shows industrial comparative advantages of EU Member States and its major trade partners. As many as 16 Member States have comparative advantages for beverages, pharmaceuticals, rubber & plastics, non-metallic mineral products and metal products. Many EU countries’ manufacturing industries also have comparative advantages in the production of food, tobacco, wood, electrical equipment, motor vehicles and furniture. Cyprus, Greece, Luxembourg, Lithuania, the Netherlands, Poland and Romania all appeared to be highly specialised in tobacco products in 2011.
Wood and wood products is another category of goods where many EU countries recurrently exhibit high RCAs. Comparative advantages should, at least in the long run, reflect countries’ specialisation patterns. Ireland and Belgium are specialised in the
Box 4.1. Revealed comparative advantage (RCA)
The RCA indicator for product ‘i’ is defined as follows:
∑
∑=
iiXW
iW
iiEU
iEU
i X
XX
RCA
,
,
,
,
where: X= value of exports; the reference group (‘W’) is the EU-27 plus 142 other countries (as listed in section 4.1.1 Manufactured goods).
XEU stands for the rest of the world (excluding intra-EU trade) and XW measures exports to the rest of the world from the countries in the reference group.55
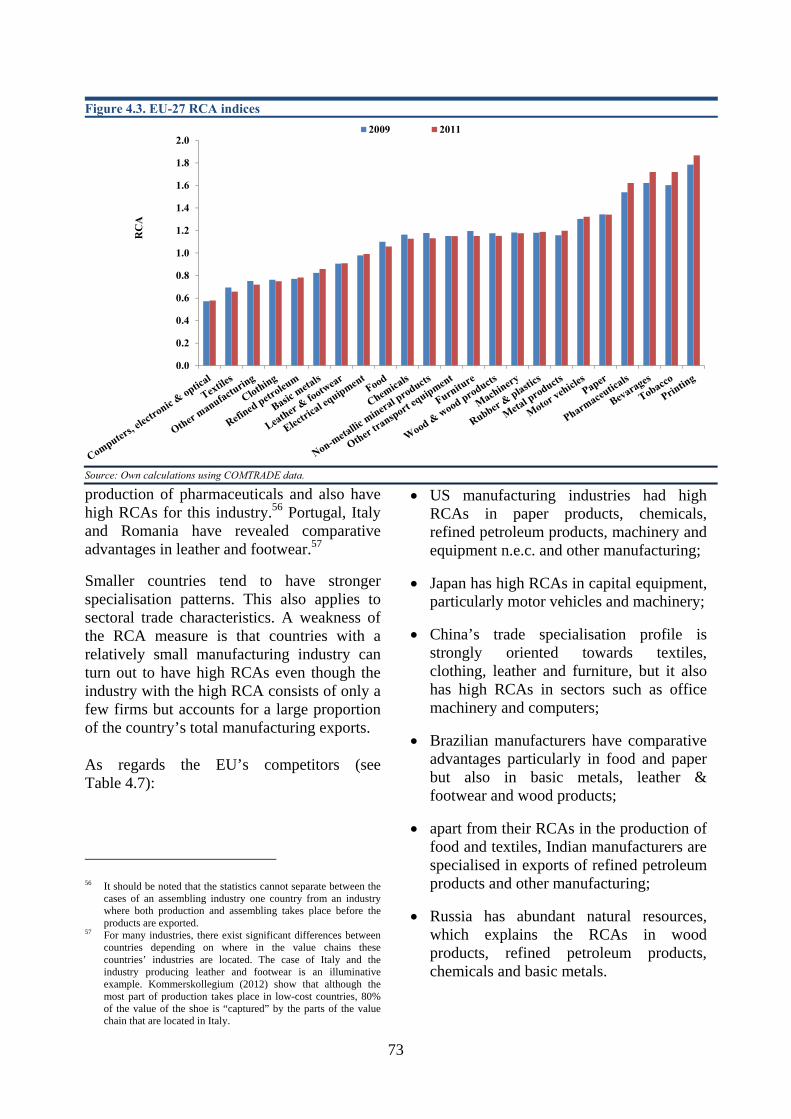
73
production of pharmaceuticals and also have high RCAs for this industry.56 Portugal, Italy and Romania have revealed comparative advantages in leather and footwear.57
Smaller countries tend to have stronger specialisation patterns. This also applies to sectoral trade characteristics. A weakness of the RCA measure is that countries with a relatively small manufacturing industry can turn out to have high RCAs even though the industry with the high RCA consists of only a few firms but accounts for a large proportion of the country’s total manufacturing exports.
As regards the EU’s competitors (see Table 4.7):
56 It should be noted that the statistics cannot separate between the
cases of an assembling industry one country from an industry where both production and assembling takes place before the products are exported.
57 For many industries, there exist significant differences between countries depending on where in the value chains these countries’ industries are located. The case of Italy and the industry producing leather and footwear is an illuminative example. Kommerskollegium (2012) show that although the most part of production takes place in low-cost countries, 80% of the value of the shoe is “captured” by the parts of the value chain that are located in Italy.
• US manufacturing industries had high RCAs in paper products, chemicals, refined petroleum products, machinery and equipment n.e.c. and other manufacturing;
• Japan has high RCAs in capital equipment, particularly motor vehicles and machinery;
• China’s trade specialisation profile is strongly oriented towards textiles, clothing, leather and furniture, but it also has high RCAs in sectors such as office machinery and computers;
• Brazilian manufacturers have comparative advantages particularly in food and paper but also in basic metals, leather & footwear and wood products;
• apart from their RCAs in the production of food and textiles, Indian manufacturers are specialised in exports of refined petroleum products and other manufacturing;
• Russia has abundant natural resources, which explains the RCAs in wood products, refined petroleum products, chemicals and basic metals.
Figure 4.3. EU-27 RCA indices
0.0
0.2
0.4
0.6
0.8
1.0
1.2
1.4
1.6
1.8
2.0R
CA
2009 2011
Source: Own calculations using COMTRADE data.

74
RCA in manufacturing by technology groups
Manufacturing industries are often classified according to technological intensities. The classifications are based on the OECD (1997) classification. According to this, R&D intensity is the main criterion for evaluating the technological content of an industry. Analyses of trade performance in the four technology categories for individual MS show that Cyprus, Hungary, Ireland and Malta have the highest revealed comparative advantages in high technology products. Conversely, Latvia and Portugal exhibit high RCA's in low technology products. As mentioned above, caution is needed when studying RCA's for individual countries. Small countries with small manufacturing industries can have high RCA's due to a few relatively large firms which export large shares of their production.
The EU-27 which has a comparative advantage of 1.14 in medium-high technology products, but it is lagging behind the US (1.22) and Japan (1.59) in this category. China has a dual structure, with a high RCA in both high-tech (1.56) and low-technology products (1.2.9) while Russia has a RCA of 2.74 in trade with medium-low technology products which includes refined petroleum products and basic metals (see Table 4.9).
4.2.2. Services
The share of services in EU-27 exports (extra-EU) of goods and services has fallen back to around 27.4 %,58 after peaking in 2009 at above 30 %. The decline can be mainly attributed to the impact of falling output during the crisis. The EU ran a surplus in service exports in 2011. The main trading partner was the USA, which accounted for over a quarter of all exported services. World service exports represented USD 4.3 billion in 2012. By comparison, world goods exports represented USD 18.3 billion (WTO, 2013).
58 Based on data from Eurostat.
Service and goods exports both increased by around 13 % between 2008 and 2012 in nominal terms.
Although services currently account for over 60 % of global production and employment, they represent only around 20 % of total trade.59 However, this imbalance may narrow as technological developments increase the possibilities for trading services. In particular, developments in communication technologies have enabled and increased the tradability of many services, including business services, finance, education and health services. Services trade has also been boosted by the liberalisation of monopoly services such as voice telephony and postal services and regulatory reforms in areas such as transport. In addition, global trade liberalisation has also promoted trade in services. The most significant act was the completion of the General Agreement on Trade in Services (GATS) in 1995.
Measuring RCA in services is not straightforward. Unlike trade in goods, trade in services does not always imply cross-border flow. There are other modes of supply such as movements of consumers to producers (e.g. tourism), commercial presence abroad, or movements of physical persons. Services supplied via factor movements are traded between residents and non-residents without crossing national borders. (see Box 4.2).60
The EU has a relative comparative advantage in almost all service sectors except construction and travel (Table 4.8). However, there is a lot of diversity amongst EU Member States in all categories. The UK and Luxembourg have very strong revealed comparative advantages in financial services. Ireland, Luxembourg and the UK have high RCAs as well in insurance services. Ireland also has a high RCA in computer and information services together with Finland.
59 World Trade Organisation statistics. 60 See laso Langhammer 2004 (it is in the Ref List but not here)

75
As discussed above, the RCA measure is sensitive to the size of an economy. Smaller
economies are more likely to show greater variation in the indices for comparative advantage due to more limited scope for diversification. For example, this can be seen in the case of Malta with regard to personal, cultural and recreational services or Luxembourg with regard to financial services. Conversely, the indices for Germany show much less variance than those for Luxembourg.
The EU has an RCA in almost all service sectors except construction and travel.
61 For more background, see European Commission, United
Nations, International Monetary Fund, Organisation for Economic Cooperation and Development, United Nations Conference on Trade and Development, WTO (2013).
However, there is a lot of diversity among EU Member States in all categories. As noted above, this is partly due to the differing size of the economies. For example, the indices for Germany show much less variation than those for Luxembourg.
Box 4.2. Trade in services: Definition, sectoral breakdown and modes of supply61 International trade in services involves transactions between residents and non-residents of an economy. Services are less tradable than goods. As they are immediately consumed, they cannot be resold. For many services, the consumer and provider of the service have to be located at the same place.
From a sector perspective, the main components of services activities are generally broken down into three categories grouping together 11 types of services sectors: 1. Transportation 2. Travel. 3. Other services, including: communication services, construction services, insurance services, financial
services, computer and information services, royalties and licence fees, other business services, personal, cultural and recreational services and government services
There are four modes for the supply of services: 1. Cross-border supply, where only the service crosses the border, e.g. the change of country can be via
electronic communication (internet, telephone, facsimile, etc.). Sectors characterised by cross-border supply are most transportation, communication services, financial and insurance services, royalties and licence fees. Parts of certain sectors can involve cross-border supply, e.g. computer and information services, other business services, and personal, cultural and recreational services;
2. Consumption abroad. This is the case principally for tourism or business travel, when individuals go to hotels and restaurants. Part of transportation can also be counted as consumption abroad (support and auxiliary services for carriers in foreign ports);
3. Commercial presence, e.g. a foreign company opening branches or subsidiaries in the destination country. Some construction services involve commercial presence;
4. Presence of natural persons. An individual who is self-employed (e.g. a consultant or health worker) or an employee (e.g. a construction worker) moves temporarily to the country of the consumer to supply services. This form of trade is found in the following sectors: computer and information services, other business services, personal, cultural and recreational services sector, and construction services.
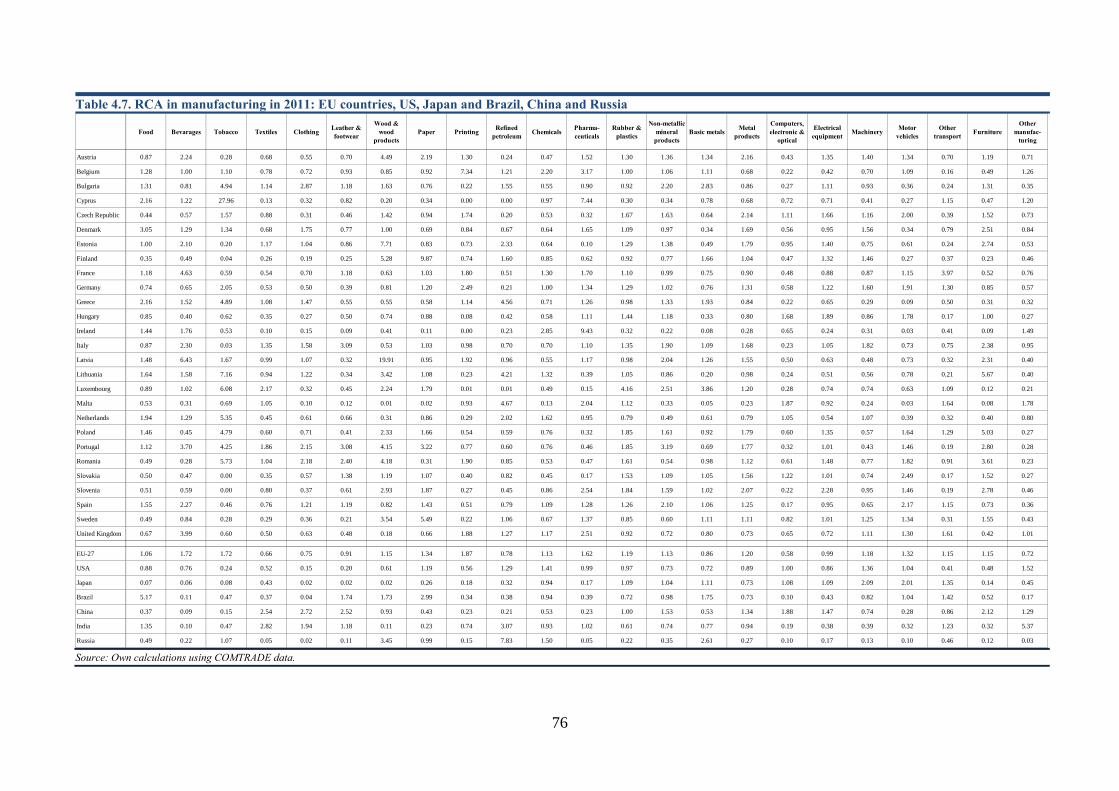
76
Table 4.7. RCA in manufacturing in 2011: EU countries, US, Japan and Brazil, China and Russia
Food Bevarages Tobacco Textiles Clothing Leather & footwear
Wood & wood
productsPaper Printing Refined
petroleum Chemicals Pharma-ceuticals
Rubber & plastics
Non-metallic mineral products
Basic metals Metal products
Computers, electronic &
optical
Electrical equipment Machinery Motor
vehiclesOther
transport FurnitureOther
manufac-turing
Austria 0.87 2.24 0.28 0.68 0.55 0.70 4.49 2.19 1.30 0.24 0.47 1.52 1.30 1.36 1.34 2.16 0.43 1.35 1.40 1.34 0.70 1.19 0.71
Belgium 1.28 1.00 1.10 0.78 0.72 0.93 0.85 0.92 7.34 1.21 2.20 3.17 1.00 1.06 1.11 0.68 0.22 0.42 0.70 1.09 0.16 0.49 1.26
Bulgaria 1.31 0.81 4.94 1.14 2.87 1.18 1.63 0.76 0.22 1.55 0.55 0.90 0.92 2.20 2.83 0.86 0.27 1.11 0.93 0.36 0.24 1.31 0.35
Cyprus 2.16 1.22 27.96 0.13 0.32 0.82 0.20 0.34 0.00 0.00 0.97 7.44 0.30 0.34 0.78 0.68 0.72 0.71 0.41 0.27 1.15 0.47 1.20
Czech Republic 0.44 0.57 1.57 0.88 0.31 0.46 1.42 0.94 1.74 0.20 0.53 0.32 1.67 1.63 0.64 2.14 1.11 1.66 1.16 2.00 0.39 1.52 0.73
Denmark 3.05 1.29 1.34 0.68 1.75 0.77 1.00 0.69 0.84 0.67 0.64 1.65 1.09 0.97 0.34 1.69 0.56 0.95 1.56 0.34 0.79 2.51 0.84
Estonia 1.00 2.10 0.20 1.17 1.04 0.86 7.71 0.83 0.73 2.33 0.64 0.10 1.29 1.38 0.49 1.79 0.95 1.40 0.75 0.61 0.24 2.74 0.53
Finland 0.35 0.49 0.04 0.26 0.19 0.25 5.28 9.87 0.74 1.60 0.85 0.62 0.92 0.77 1.66 1.04 0.47 1.32 1.46 0.27 0.37 0.23 0.46
France 1.18 4.63 0.59 0.54 0.70 1.18 0.63 1.03 1.80 0.51 1.30 1.70 1.10 0.99 0.75 0.90 0.48 0.88 0.87 1.15 3.97 0.52 0.76
Germany 0.74 0.65 2.05 0.53 0.50 0.39 0.81 1.20 2.49 0.21 1.00 1.34 1.29 1.02 0.76 1.31 0.58 1.22 1.60 1.91 1.30 0.85 0.57
Greece 2.16 1.52 4.89 1.08 1.47 0.55 0.55 0.58 1.14 4.56 0.71 1.26 0.98 1.33 1.93 0.84 0.22 0.65 0.29 0.09 0.50 0.31 0.32
Hungary 0.85 0.40 0.62 0.35 0.27 0.50 0.74 0.88 0.08 0.42 0.58 1.11 1.44 1.18 0.33 0.80 1.68 1.89 0.86 1.78 0.17 1.00 0.27
Ireland 1.44 1.76 0.53 0.10 0.15 0.09 0.41 0.11 0.00 0.23 2.85 9.43 0.32 0.22 0.08 0.28 0.65 0.24 0.31 0.03 0.41 0.09 1.49
Italy 0.87 2.30 0.03 1.35 1.58 3.09 0.53 1.03 0.98 0.70 0.70 1.10 1.35 1.90 1.09 1.68 0.23 1.05 1.82 0.73 0.75 2.38 0.95
Latvia 1.48 6.43 1.67 0.99 1.07 0.32 19.91 0.95 1.92 0.96 0.55 1.17 0.98 2.04 1.26 1.55 0.50 0.63 0.48 0.73 0.32 2.31 0.40
Lithuania 1.64 1.58 7.16 0.94 1.22 0.34 3.42 1.08 0.23 4.21 1.32 0.39 1.05 0.86 0.20 0.98 0.24 0.51 0.56 0.78 0.21 5.67 0.40
Luxembourg 0.89 1.02 6.08 2.17 0.32 0.45 2.24 1.79 0.01 0.01 0.49 0.15 4.16 2.51 3.86 1.20 0.28 0.74 0.74 0.63 1.09 0.12 0.21
Malta 0.53 0.31 0.69 1.05 0.10 0.12 0.01 0.02 0.93 4.67 0.13 2.04 1.12 0.33 0.05 0.23 1.87 0.92 0.24 0.03 1.64 0.08 1.78
Netherlands 1.94 1.29 5.35 0.45 0.61 0.66 0.31 0.86 0.29 2.02 1.62 0.95 0.79 0.49 0.61 0.79 1.05 0.54 1.07 0.39 0.32 0.40 0.80
Poland 1.46 0.45 4.79 0.60 0.71 0.41 2.33 1.66 0.54 0.59 0.76 0.32 1.85 1.61 0.92 1.79 0.60 1.35 0.57 1.64 1.29 5.03 0.27
Portugal 1.12 3.70 4.25 1.86 2.15 3.08 4.15 3.22 0.77 0.60 0.76 0.46 1.85 3.19 0.69 1.77 0.32 1.01 0.43 1.46 0.19 2.80 0.28
Romania 0.49 0.28 5.73 1.04 2.18 2.40 4.18 0.31 1.90 0.85 0.53 0.47 1.61 0.54 0.98 1.12 0.61 1.48 0.77 1.82 0.91 3.61 0.23
Slovakia 0.50 0.47 0.00 0.35 0.57 1.38 1.19 1.07 0.40 0.82 0.45 0.17 1.53 1.09 1.05 1.56 1.22 1.01 0.74 2.49 0.17 1.52 0.27
Slovenia 0.51 0.59 0.00 0.80 0.37 0.61 2.93 1.87 0.27 0.45 0.86 2.54 1.84 1.59 1.02 2.07 0.22 2.28 0.95 1.46 0.19 2.78 0.46
Spain 1.55 2.27 0.46 0.76 1.21 1.19 0.82 1.43 0.51 0.79 1.09 1.28 1.26 2.10 1.06 1.25 0.17 0.95 0.65 2.17 1.15 0.73 0.36
Sweden 0.49 0.84 0.28 0.29 0.36 0.21 3.54 5.49 0.22 1.06 0.67 1.37 0.85 0.60 1.11 1.11 0.82 1.01 1.25 1.34 0.31 1.55 0.43
United Kingdom 0.67 3.99 0.60 0.50 0.63 0.48 0.18 0.66 1.88 1.27 1.17 2.51 0.92 0.72 0.80 0.73 0.65 0.72 1.11 1.30 1.61 0.42 1.01
EU-27 1.06 1.72 1.72 0.66 0.75 0.91 1.15 1.34 1.87 0.78 1.13 1.62 1.19 1.13 0.86 1.20 0.58 0.99 1.18 1.32 1.15 1.15 0.72
USA 0.88 0.76 0.24 0.52 0.15 0.20 0.61 1.19 0.56 1.29 1.41 0.99 0.97 0.73 0.72 0.89 1.00 0.86 1.36 1.04 0.41 0.48 1.52
Japan 0.07 0.06 0.08 0.43 0.02 0.02 0.02 0.26 0.18 0.32 0.94 0.17 1.09 1.04 1.11 0.73 1.08 1.09 2.09 2.01 1.35 0.14 0.45
Brazil 5.17 0.11 0.47 0.37 0.04 1.74 1.73 2.99 0.34 0.38 0.94 0.39 0.72 0.98 1.75 0.73 0.10 0.43 0.82 1.04 1.42 0.52 0.17
China 0.37 0.09 0.15 2.54 2.72 2.52 0.93 0.43 0.23 0.21 0.53 0.23 1.00 1.53 0.53 1.34 1.88 1.47 0.74 0.28 0.86 2.12 1.29
India 1.35 0.10 0.47 2.82 1.94 1.18 0.11 0.23 0.74 3.07 0.93 1.02 0.61 0.74 0.77 0.94 0.19 0.38 0.39 0.32 1.23 0.32 5.37
Russia 0.49 0.22 1.07 0.05 0.02 0.11 3.45 0.99 0.15 7.83 1.50 0.05 0.22 0.35 2.61 0.27 0.10 0.17 0.13 0.10 0.46 0.12 0.03
Source: Own calculations using COMTRADE data.

77
As compared with the EU, the US economy displays far less comparative advantage across the range of services, with the exception of financial services. Russia and China display specialisation in construction services, as does Japan. India is highly specialised in computer and information services. Brazil exhibits high RCA values in other business services.
4.3. SOPHISTICATION AND EXCLUSIVITY OF
EU EXPORTS
The RCA indices presented above are calculated from raw trade data. While the industries can be classified according to technology intensities, it is difficult to
measure the real sophistication of a country’s manufacturing with the aid of this kind of data, for at least two reasons:
- it is difficult to gauge the quality or complexity of a country’s or industry’s products; two countries or industries exporting the same kind of commodity may be producing goods that differ considerably in terms of complexity;
- for any given type of commodity, it is difficult to quantify the domestic content of a country’s exports; this makes it hard to tell, for example, if an industry in a specific country is developing high-tech products or merely assembling them.
Table 4.8. RCAs in services (2011): EU Member States, USA, Japan and BRIC countries
Communication Computer and information Construction Financial Insurance Other business
services
Personal, cultural and recreational
services
Transportation Travel
Austria 0.95 0.73 0.51 0.29 0.68 1.14 0.59 1.17 1.31Belgium 1.97 0.89 1.20 0.56 0.57 1.38 0.96 1.37 0.50Bulgaria 1.09 1.15 0.43 0.14 0.83 0.43 0.90 1.02 2.14Cyprus 0.29 0.13 0.25 1.46 0.22 1.19 0.64 1.20 1.21Czech Republic 0.91 1.33 1.48 0.05 0.57 1.00 1.33 1.16 1.33Denmark 0.40 0.49 0.21 0.15 0.18 0.69 1.03 2.99 0.40Estonia 1.77 0.77 2.46 0.20 0.07 0.73 0.44 1.97 0.93Finland 0.50 3.82 2.60 0.31 0.17 1.21 0.31 0.58 0.51France 1.16 0.32 1.70 0.40 1.05 1.22 2.22 0.99 0.98Germany 0.89 1.22 1.88 0.76 1.09 1.30 0.42 1.13 0.60Greece 0.53 0.21 1.29 0.06 0.62 0.20 0.65 2.42 1.48Hungary 0.70 1.03 0.82 0.12 0.07 1.19 7.38 1.02 1.04Ireland 0.23 6.71 NA 1.10 4.43 1.07 0.38 0.25 0.16Italy 2.59 0.39 0.04 0.34 1.08 1.03 0.34 0.71 1.63Latvia 0.93 0.68 0.79 0.96 0.26 0.58 0.59 2.48 0.70Lithuania 0.91 0.19 0.95 0.13 -0.01 0.28 0.49 2.94 1.02Luxembourg 1.48 0.20 0.22 8.01 1.97 0.55 4.76 0.26 0.27Malta 0.45 0.30 NA 0.73 0.30 0.51 51.32 0.41 1.02Netherlands 1.78 0.79 0.80 0.16 0.23 1.19 0.70 1.08 0.42Poland 0.63 0.97 1.72 0.17 0.48 1.01 1.68 1.43 1.13Portugal 1.02 0.34 1.20 0.16 0.25 0.72 1.51 1.34 1.72Romania 2.91 1.77 1.83 0.26 0.59 0.99 1.50 1.51 0.56Slovak Republic 0.69 1.49 1.66 0.07 0.17 0.57 1.54 1.53 1.47Slovenia 2.22 0.39 1.31 0.09 0.72 0.65 1.25 1.32 1.62Spain 0.66 0.81 1.20 0.51 0.43 0.93 1.84 0.83 1.70Sweden 1.19 2.02 0.49 0.28 0.54 1.44 1.00 0.74 0.74United Kingdom 1.46 0.87 0.37 3.04 2.49 1.18 1.91 0.63 0.48EU-27 1.18 1.21 0.97 1.15 1.24 1.10 1.51 1.00 0.81United States 0.89 0.45 0.21 1.71 1.16 0.76 0.18 0.66 1.02Japan 0.22 0.14 3.07 0.39 0.51 1.21 0.13 1.32 0.31Brazil 0.36 0.11 0.02 0.99 0.61 2.05 0.18 0.78 0.72China 0.39 1.14 3.23 0.06 0.73 1.35 0.08 0.96 1.07India 0.50 5.45 0.24 0.62 0.83 1.10 0.30 0.62 0.51Russia 1.13 0.56 2.34 0.28 0.36 1.11 1.11 1.56 0.86
Source: WTO trade statistics, own calculations
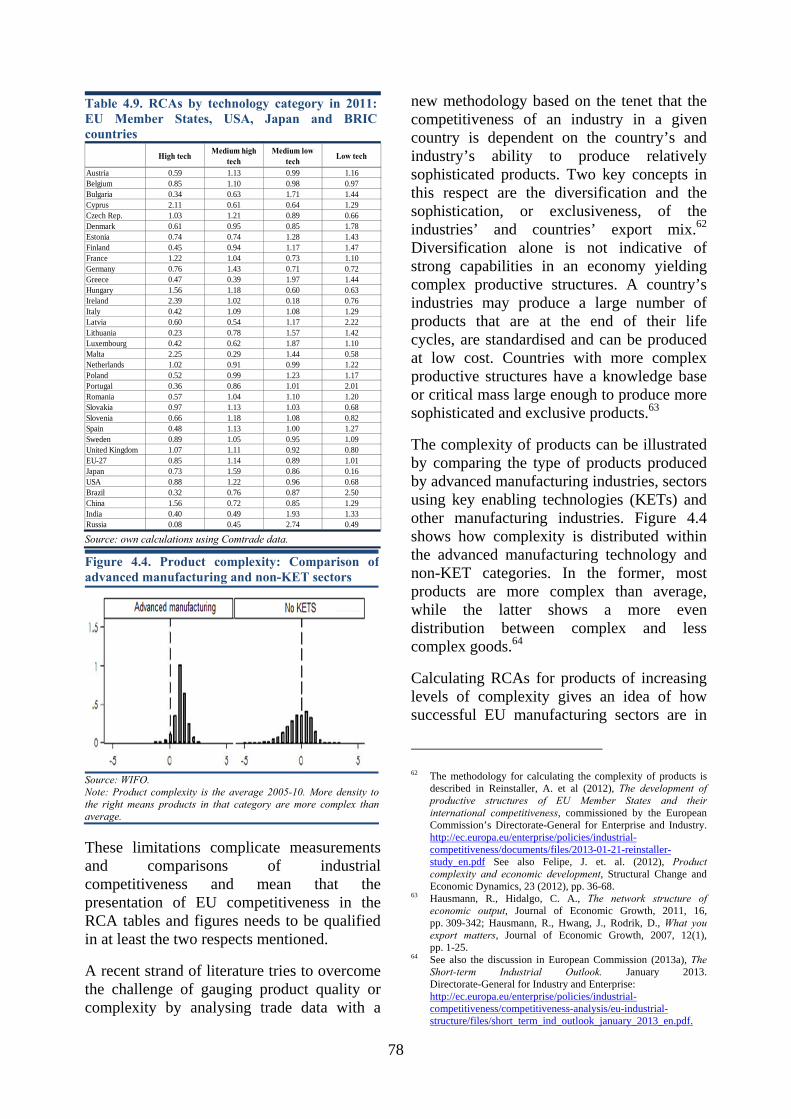
78
These limitations complicate measurements and comparisons of industrial competitiveness and mean that the presentation of EU competitiveness in the RCA tables and figures needs to be qualified in at least the two respects mentioned.
A recent strand of literature tries to overcome the challenge of gauging product quality or complexity by analysing trade data with a
new methodology based on the tenet that the competitiveness of an industry in a given country is dependent on the country’s and industry’s ability to produce relatively sophisticated products. Two key concepts in this respect are the diversification and the sophistication, or exclusiveness, of the industries’ and countries’ export mix.62
Diversification alone is not indicative of strong capabilities in an economy yielding complex productive structures. A country’s industries may produce a large number of products that are at the end of their life cycles, are standardised and can be produced at low cost. Countries with more complex productive structures have a knowledge base or critical mass large enough to produce more sophisticated and exclusive products.63
The complexity of products can be illustrated by comparing the type of products produced by advanced manufacturing industries, sectors using key enabling technologies (KETs) and other manufacturing industries. Figure 4.4 shows how complexity is distributed within the advanced manufacturing technology and non-KET categories. In the former, most products are more complex than average, while the latter shows a more even distribution between complex and less complex goods.64
Calculating RCAs for products of increasing levels of complexity gives an idea of how successful EU manufacturing sectors are in
62 The methodology for calculating the complexity of products is
described in Reinstaller, A. et al (2012), The development of productive structures of EU Member States and their international competitiveness, commissioned by the European Commission’s Directorate-General for Enterprise and Industry. http://ec.europa.eu/enterprise/policies/industrial-competitiveness/documents/files/2013-01-21-reinstaller-study_en.pdf See also Felipe, J. et. al. (2012), Product complexity and economic development, Structural Change and Economic Dynamics, 23 (2012), pp. 36-68.
63 Hausmann, R., Hidalgo, C. A., The network structure of economic output, Journal of Economic Growth, 2011, 16, pp. 309-342; Hausmann, R., Hwang, J., Rodrik, D., What you export matters, Journal of Economic Growth, 2007, 12(1), pp. 1-25.
64 See also the discussion in European Commission (2013a), The Short-term Industrial Outlook. January 2013. Directorate-General for Industry and Enterprise: http://ec.europa.eu/enterprise/policies/industrial-competitiveness/competitiveness-analysis/eu-industrial-structure/files/short_term_ind_outlook_january_2013_en.pdf.
Table 4.9. RCAs by technology category in 2011: EU Member States, USA, Japan and BRIC countries
High tech Medium high tech
Medium low tech Low tech
Austria 0.59 1.13 0.99 1.16Belgium 0.85 1.10 0.98 0.97Bulgaria 0.34 0.63 1.71 1.44Cyprus 2.11 0.61 0.64 1.29Czech Rep. 1.03 1.21 0.89 0.66Denmark 0.61 0.95 0.85 1.78Estonia 0.74 0.74 1.28 1.43Finland 0.45 0.94 1.17 1.47France 1.22 1.04 0.73 1.10Germany 0.76 1.43 0.71 0.72Greece 0.47 0.39 1.97 1.44Hungary 1.56 1.18 0.60 0.63Ireland 2.39 1.02 0.18 0.76Italy 0.42 1.09 1.08 1.29Latvia 0.60 0.54 1.17 2.22Lithuania 0.23 0.78 1.57 1.42Luxembourg 0.42 0.62 1.87 1.10Malta 2.25 0.29 1.44 0.58Netherlands 1.02 0.91 0.99 1.22Poland 0.52 0.99 1.23 1.17Portugal 0.36 0.86 1.01 2.01Romania 0.57 1.04 1.10 1.20Slovakia 0.97 1.13 1.03 0.68Slovenia 0.66 1.18 1.08 0.82Spain 0.48 1.13 1.00 1.27Sweden 0.89 1.05 0.95 1.09United Kingdom 1.07 1.11 0.92 0.80EU-27 0.85 1.14 0.89 1.01Japan 0.73 1.59 0.86 0.16USA 0.88 1.22 0.96 0.68Brazil 0.32 0.76 0.87 2.50China 1.56 0.72 0.85 1.29India 0.40 0.49 1.93 1.33Russia 0.08 0.45 2.74 0.49
Source: own calculations using Comtrade data.
Figure 4.4. Product complexity: Comparison ofadvanced manufacturing and non-KET sectors
Source: WIFO. Note: Product complexity is the average 2005-10. More density tothe right means products in that category are more complex thanaverage.
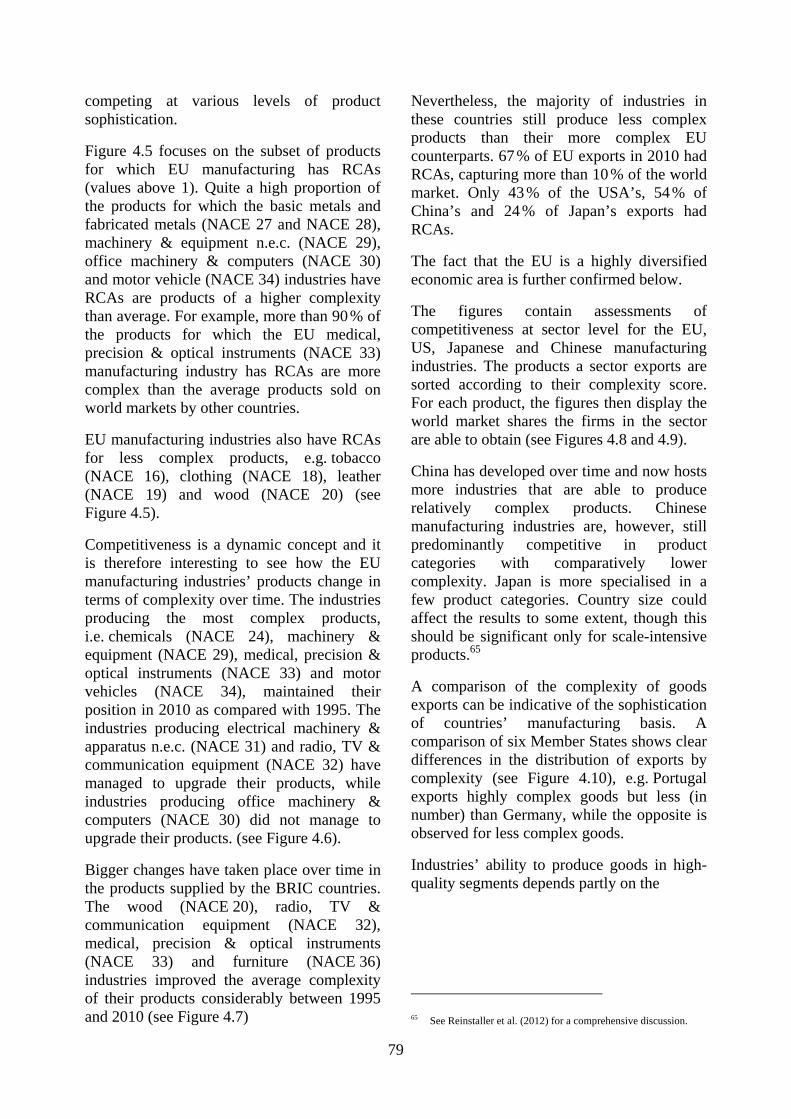
79
competing at various levels of product sophistication.
Figure 4.5 focuses on the subset of products for which EU manufacturing has RCAs (values above 1). Quite a high proportion of the products for which the basic metals and fabricated metals (NACE 27 and NACE 28), machinery & equipment n.e.c. (NACE 29), office machinery & computers (NACE 30) and motor vehicle (NACE 34) industries have RCAs are products of a higher complexity than average. For example, more than 90 % of the products for which the EU medical, precision & optical instruments (NACE 33) manufacturing industry has RCAs are more complex than the average products sold on world markets by other countries.
EU manufacturing industries also have RCAs for less complex products, e.g. tobacco (NACE 16), clothing (NACE 18), leather (NACE 19) and wood (NACE 20) (see Figure 4.5).
Competitiveness is a dynamic concept and it is therefore interesting to see how the EU manufacturing industries’ products change in terms of complexity over time. The industries producing the most complex products, i.e. chemicals (NACE 24), machinery & equipment (NACE 29), medical, precision & optical instruments (NACE 33) and motor vehicles (NACE 34), maintained their position in 2010 as compared with 1995. The industries producing electrical machinery & apparatus n.e.c. (NACE 31) and radio, TV & communication equipment (NACE 32) have managed to upgrade their products, while industries producing office machinery & computers (NACE 30) did not manage to upgrade their products. (see Figure 4.6).
Bigger changes have taken place over time in the products supplied by the BRIC countries. The wood (NACE 20), radio, TV & communication equipment (NACE 32), medical, precision & optical instruments (NACE 33) and furniture (NACE 36) industries improved the average complexity of their products considerably between 1995 and 2010 (see Figure 4.7)
Nevertheless, the majority of industries in these countries still produce less complex products than their more complex EU counterparts. 67 % of EU exports in 2010 had RCAs, capturing more than 10 % of the world market. Only 43 % of the USA’s, 54 % of China’s and 24 % of Japan’s exports had RCAs.
The fact that the EU is a highly diversified economic area is further confirmed below.
The figures contain assessments of competitiveness at sector level for the EU, US, Japanese and Chinese manufacturing industries. The products a sector exports are sorted according to their complexity score. For each product, the figures then display the world market shares the firms in the sector are able to obtain (see Figures 4.8 and 4.9).
China has developed over time and now hosts more industries that are able to produce relatively complex products. Chinese manufacturing industries are, however, still predominantly competitive in product categories with comparatively lower complexity. Japan is more specialised in a few product categories. Country size could affect the results to some extent, though this should be significant only for scale-intensive products.65
A comparison of the complexity of goods exports can be indicative of the sophistication of countries’ manufacturing basis. A comparison of six Member States shows clear differences in the distribution of exports by complexity (see Figure 4.10), e.g. Portugal exports highly complex goods but less (in number) than Germany, while the opposite is observed for less complex goods.
Industries’ ability to produce goods in high-quality segments depends partly on the
65 See Reinstaller et al. (2012) for a comprehensive discussion.
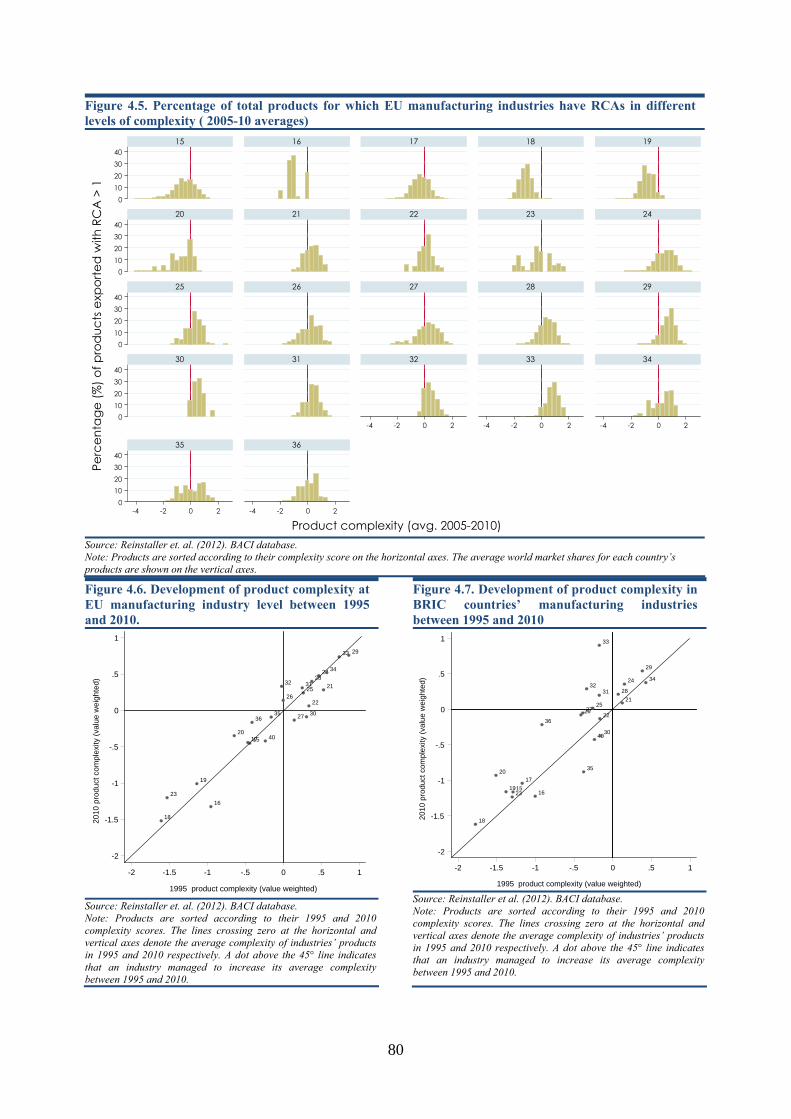
80
Figure 4.5. Percentage of total products for which EU manufacturing industries have RCAs in different levels of complexity ( 2005-10 averages)
010203040
010203040
010203040
010203040
010203040
-4 -2 0 2 -4 -2 0 2 -4 -2 0 2
-4 -2 0 2 -4 -2 0 2
15 16 17 18 19
20 21 22 23 24
25 26 27 28 29
30 31 32 33 34
35 36
Perc
enta
ge (%
) of p
rod
ucts
exp
orte
d w
ith R
CA
> 1
Product complexity (avg. 2005-2010)Source: Reinstaller et. al. (2012). BACI database. Note: Products are sorted according to their complexity score on the horizontal axes. The average world market shares for each country’s products are shown on the vertical axes.
Figure 4.6. Development of product complexity at EU manufacturing industry level between 1995 and 2010.
18
23
19
16
201715
36
40
35
32
26
27
3125
30
22
2824
21
34
33 29
-1.5
-1
-.5
0
.5
1
-2
2010
pro
duct
com
plex
ity (v
alue
wei
ghte
d)
-1.5 -1 -.5 0 .5 1-2
1995 product complexity (value weighted)
Source: Reinstaller et. al. (2012). BACI database. Note: Products are sorted according to their 1995 and 2010 complexity scores. The lines crossing zero at the horizontal and vertical axes denote the average complexity of industries’ products in 1995 and 2010 respectively. A dot above the 45° line indicates that an industry managed to increase its average complexity between 1995 and 2010.
Figure 4.7. Development of product complexity in BRIC countries’ manufacturing industries between 1995 and 2010
18
20
192315
17
16
36
2627
35
32
25
40
31
33
22
30
2821
24
29
34
-1.5
-1
-.5
0
.5
1
-2
2010
pro
duct
com
plex
ity (v
alue
wei
ghte
d)
-2 -1.5 -1 -.5 0 .5 1
1995 product complexity (value weighted) Source: Reinstaller et al. (2012). BACI database. Note: Products are sorted according to their 1995 and 2010 complexity scores. The lines crossing zero at the horizontal and vertical axes denote the average complexity of industries’ products in 1995 and 2010 respectively. A dot above the 45° line indicates that an industry managed to increase its average complexity between 1995 and 2010.

81
capabilities or productive structures in the countries and regions hosting them.
A certain set of skills or capabilities is necessary in order to produce sophisticated products, i.e. there must be a knowledge base which is not only broad enough to supply a range of firms and industries with the necessary skills, but also deep enough to be able to upgrade existing exports.
These capabilities are not evenly distributed across the EU. As shown in Reinstaller et al (2012), some countries face greater challenges than others in upgrading their ‘export baskets’ with more sophisticated products and, as a consequence, are likely to face more competition from low-cost countries, which typically export less sophisticated products.
Figure 4.8. World export shares by product level and product complexity by NACE sector, EU-27 and USA EU
0%
50%
100%
0%
50%
100%
0%
50%
100%
0%
50%
100%
0%
50%
100%
0%
50%
100%
0%
50%
100%
0%
50%
100%
0%
50%
100%
0%
50%
100%
0%
50%
100%
0%
50%
100%
0%
50%
100%
0%
50%
100%
0%
50%
100%
0%
50%
100%
0%
50%
100%
0%
50%
100%
0%
50%
100%
0%
50%
100%
0%
50%
100%
0%
50%
100%
-4 -2 0 2 4 -4 -2 0 2 4 -4 -2 0 2 4 -4 -2 0 2 4 -4 -2 0 2 4
-4 -2 0 2 4 -4 -2 0 2 4 -4 -2 0 2 4 -4 -2 0 2 4 -4 -2 0 2 4
-4 -2 0 2 4 -4 -2 0 2 4 -4 -2 0 2 4 -4 -2 0 2 4 -4 -2 0 2 4
-4 -2 0 2 4 -4 -2 0 2 4 -4 -2 0 2 4 -4 -2 0 2 4 -4 -2 0 2 4
-4 -2 0 2 4 -4 -2 0 2 4
15 16 17 18 19
20 21 22 23 24
25 26 27 28 29
30 31 32 33 34
35 36
Wor
ld e
xpor
t sha
res i
n %
at p
rodu
ct le
vel (
avg
. 200
5-20
10)
Product complexity (avg. 2005-2010, standardised)Graphs by Nace1.1
USA
0%
50%
100%
0%
50%
100%
0%
50%
100%
0%
50%
100%
0%
50%
100%
0%
50%
100%
0%
50%
100%
0%
50%
100%
0%
50%
100%
0%
50%
100%
0%
50%
100%
0%
50%
100%
0%
50%
100%
0%
50%
100%
0%
50%
100%
0%
50%
100%
0%
50%
100%
0%
50%
100%
0%
50%
100%
0%
50%
100%
0%
50%
100%
0%
50%
100%
-4 -2 0 2 4 -4 -2 0 2 4 -4 -2 0 2 4 -4 -2 0 2 4 -4 -2 0 2 4
-4 -2 0 2 4 -4 -2 0 2 4 -4 -2 0 2 4 -4 -2 0 2 4 -4 -2 0 2 4
-4 -2 0 2 4 -4 -2 0 2 4 -4 -2 0 2 4 -4 -2 0 2 4 -4 -2 0 2 4
-4 -2 0 2 4 -4 -2 0 2 4 -4 -2 0 2 4 -4 -2 0 2 4 -4 -2 0 2 4
-4 -2 0 2 4 -4 -2 0 2 4
15 16 17 18 19
20 21 22 23 24
25 26 27 28 29
30 31 32 33 34
35 36
Wor
ld e
xpor
t sha
res i
n %
at p
rod
uct l
evel
(avg
. 200
5-20
10)
Product complexity (avg. 2005-2010, standardised)Graphs by Nace 1.1
Source: Reinstaller et. al. (2012). BACI database
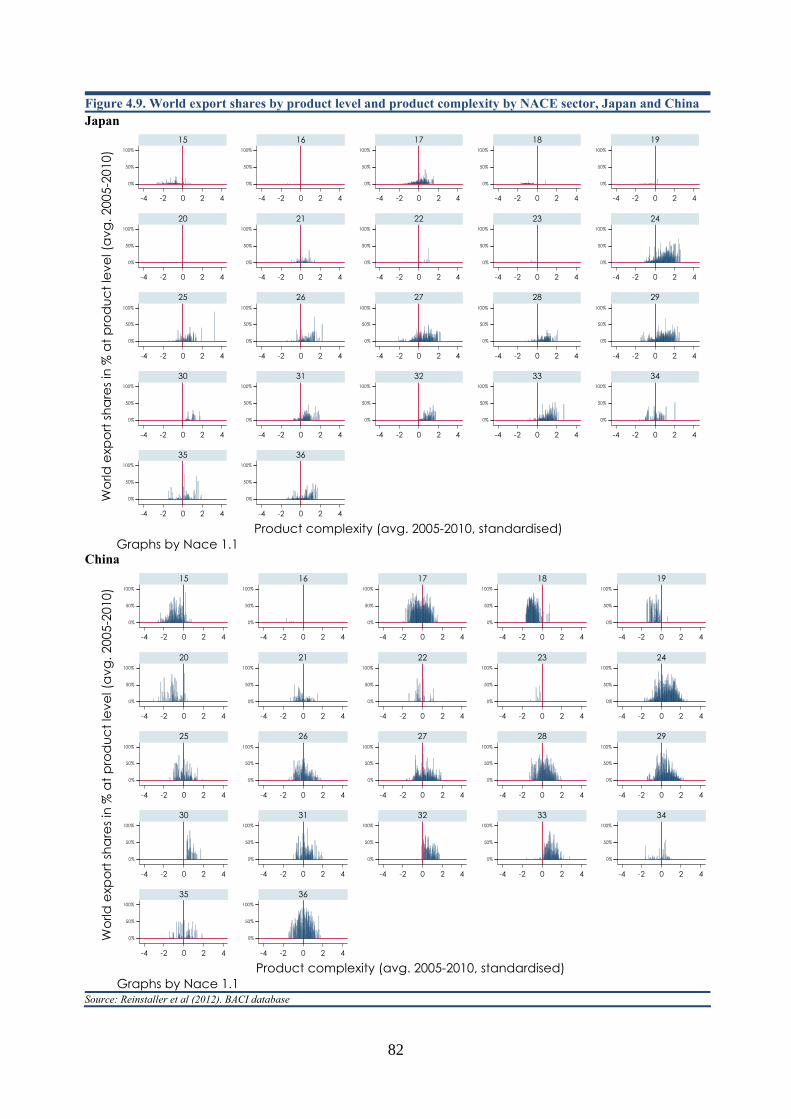
82
Figure 4.9. World export shares by product level and product complexity by NACE sector, Japan and China Japan
0%
50%
100%
0%
50%
100%
0%
50%
100%
0%
50%
100%
0%
50%
100%
0%
50%
100%
0%
50%
100%
0%
50%
100%
0%
50%
100%
0%
50%
100%
0%
50%
100%
0%
50%
100%
0%
50%
100%
0%
50%
100%
0%
50%
100%
0%
50%
100%
0%
50%
100%
0%
50%
100%
0%
50%
100%
0%
50%
100%
0%
50%
100%
0%
50%
100%
-4 -2 0 2 4 -4 -2 0 2 4 -4 -2 0 2 4 -4 -2 0 2 4 -4 -2 0 2 4
-4 -2 0 2 4 -4 -2 0 2 4 -4 -2 0 2 4 -4 -2 0 2 4 -4 -2 0 2 4
-4 -2 0 2 4 -4 -2 0 2 4 -4 -2 0 2 4 -4 -2 0 2 4 -4 -2 0 2 4
-4 -2 0 2 4 -4 -2 0 2 4 -4 -2 0 2 4 -4 -2 0 2 4 -4 -2 0 2 4
-4 -2 0 2 4 -4 -2 0 2 4
15 16 17 18 19
20 21 22 23 24
25 26 27 28 29
30 31 32 33 34
35 36
Wor
ld e
xpor
t sha
res i
n %
at p
rod
uct l
evel
(avg
. 200
5-20
10)
Product complexity (avg. 2005-2010, standardised)Graphs by Nace 1.1
China
0%
50%
100%
0%
50%
100%
0%
50%
100%
0%
50%
100%
0%
50%
100%
0%
50%
100%
0%
50%
100%
0%
50%
100%
0%
50%
100%
0%
50%
100%
0%
50%
100%
0%
50%
100%
0%
50%
100%
0%
50%
100%
0%
50%
100%
0%
50%
100%
0%
50%
100%
0%
50%
100%
0%
50%
100%
0%
50%
100%
0%
50%
100%
0%
50%
100%
-4 -2 0 2 4 -4 -2 0 2 4 -4 -2 0 2 4 -4 -2 0 2 4 -4 -2 0 2 4
-4 -2 0 2 4 -4 -2 0 2 4 -4 -2 0 2 4 -4 -2 0 2 4 -4 -2 0 2 4
-4 -2 0 2 4 -4 -2 0 2 4 -4 -2 0 2 4 -4 -2 0 2 4 -4 -2 0 2 4
-4 -2 0 2 4 -4 -2 0 2 4 -4 -2 0 2 4 -4 -2 0 2 4 -4 -2 0 2 4
-4 -2 0 2 4 -4 -2 0 2 4
15 16 17 18 19
20 21 22 23 24
25 26 27 28 29
30 31 32 33 34
35 36
Wor
ld e
xpor
t sha
res i
n %
at p
rod
uct l
evel
(avg
. 200
5-20
10)
Product complexity (avg. 2005-2010, standardised)Graphs by Nace 1.1
Source: Reinstaller et al (2012). BACI database
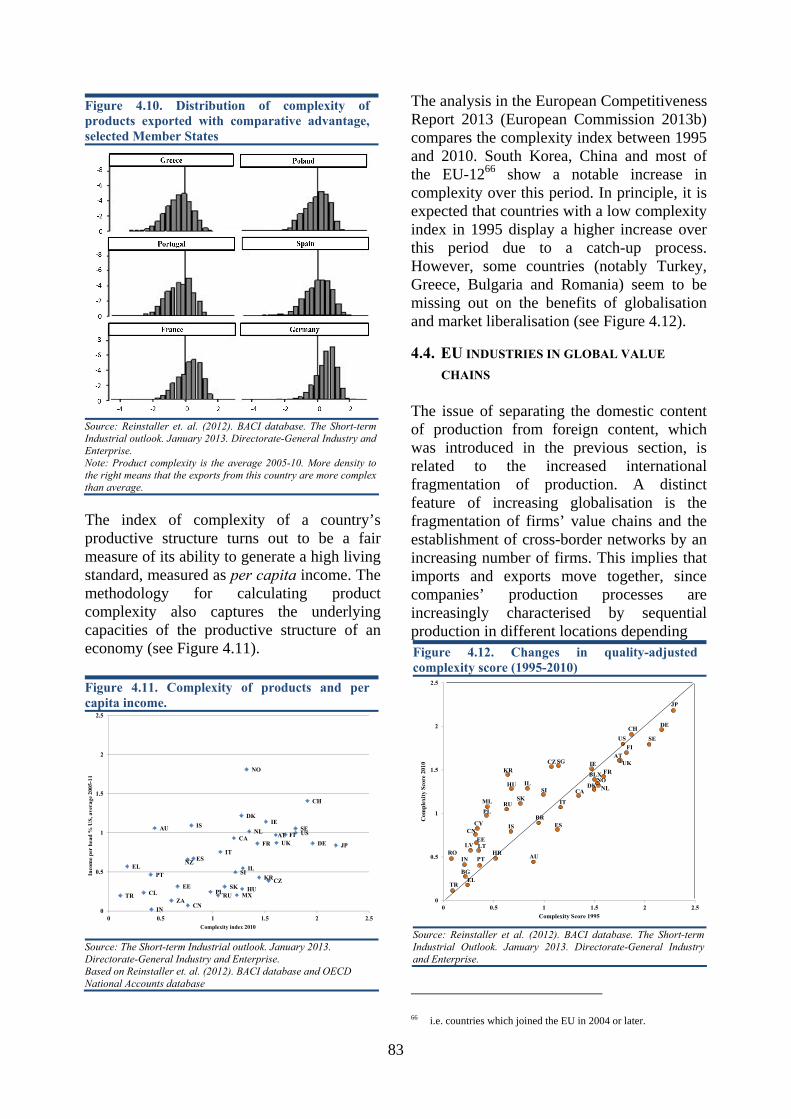
83
The index of complexity of a country’s productive structure turns out to be a fair measure of its ability to generate a high living standard, measured as per capita income. The methodology for calculating product complexity also captures the underlying capacities of the productive structure of an economy (see Figure 4.11).
The analysis in the European Competitiveness Report 2013 (European Commission 2013b) compares the complexity index between 1995 and 2010. South Korea, China and most of the EU-1266 show a notable increase in complexity over this period. In principle, it is expected that countries with a low complexity index in 1995 display a higher increase over this period due to a catch-up process. However, some countries (notably Turkey, Greece, Bulgaria and Romania) seem to be missing out on the benefits of globalisation and market liberalisation (see Figure 4.12).
4.4. EU INDUSTRIES IN GLOBAL VALUE
CHAINS
The issue of separating the domestic content of production from foreign content, which was introduced in the previous section, is related to the increased international fragmentation of production. A distinct feature of increasing globalisation is the fragmentation of firms’ value chains and the establishment of cross-border networks by an increasing number of firms. This implies that imports and exports move together, since companies’ production processes are increasingly characterised by sequential production in different locations depending
66 i.e. countries which joined the EU in 2004 or later.
Figure 4.10. Distribution of complexity of products exported with comparative advantage, selected Member States
Source: Reinstaller et. al. (2012). BACI database. The Short-term Industrial outlook. January 2013. Directorate-General Industry and Enterprise. Note: Product complexity is the average 2005-10. More density to the right means that the exports from this country are more complex than average.
Figure 4.12. Changes in quality-adjusted complexity score (1995-2010)
BR
CN
IN
RU
CH
IS
NO
AT
BG
BLX
CY
CZ
DE
DK
ES
EE
FI
FRUK
EL
HU
IE
IT
LTLV
ML
NL
PL
PTRO
SKSI
SE
HR
TR
AU
CAIL
JP
KRSG
US
0
0.5
1
1.5
2
2.5
0 0.5 1 1.5 2 2.5
Com
plex
ity S
core
201
0
Complexity Score 1995
Source: Reinstaller et al. (2012). BACI database. The Short-term Industrial Outlook. January 2013. Directorate-General Industry and Enterprise.
Figure 4.11. Complexity of products and per capita income.
AUATCA
CL
CZ
DK
EE
FIFR DE
EL
HU
IS IE
IL
ITJP
KR
MX
NL
NZ
NO
PL
PT
SK
SI
ES
SE
CH
TR
UKUS
CNIN
RUZA
0
0.5
1
1.5
2
2.5
0 0.5 1 1.5 2 2.5Complexity index 2010
Inco
me
per
head
% U
S, a
vera
ge 2
005-
11
Source: The Short-term Industrial outlook. January 2013. Directorate-General Industry and Enterprise. Based on Reinstaller et. al. (2012). BACI database and OECD National Accounts database

84
on the locations’ comparative advantages. Imported intermediate goods make up an increasing share of exports. This means that it is no longer valid to label a Swedish export as ‘Made in Sweden’, for example, as the components and services needed to manufacture it come from many locations around the world.
World trade, investment and production are increasingly organised in ‘global value chains’ (GVCs) covering all activities that firms engage in, at home or abroad, from conception to final use, to bring a product to market.67
More and more, this process entails an increased number of cross-border flows of parts and components between different locations before a good is produced, assembled and shipped to the final consumer.
The GVC participation index measures the importance of foreign suppliers in the country’s value chain by examining two sides of a country’s exports. The backward vertical specialisation share, or ‘VS’, examines the value added share of a country’s exports that
67 OECD (2013a), p. 14.
can be attributed to foreign imports of intermediate goods. The forward vertical specialisation share, or ‘VS1’ examines how much of the same country’s exports form part of other countries supply chains, i.e. what share of a country’s exports, measured in value added, are embedded in other countries gross exports (Koopman et al., 2011).68 By combining both indicators, the GVC participation index, measures the degree of integration in global value chains (Figure 4.13).
Small and open countries such as Luxembourg, Taiwan, Slovakia, Hungary, the Czech Republic, Belgium, Ireland and Malta source more intermediate goods from abroad and therefore the VS is typically higher than in larger or more resource-rich countries such as Australia, Brazil and China,
Russia and the USA are less involved in GVCs. In most cases, their participation is predominantly in the forward part of GVCs as intermediate inputs for industries abroad. An obvious example is the energy produced by Russia, which is exported for use by many industries globally (see Figure 4.13).
68 Koopman et al. (2011) refer to the backward and forward
participation shares as VS and VS1 respectively.
Figure 4.13. GVC participation in all industries (2009)
0
10
20
30
40
50
60
70
80
Perc
ent
VS VS1
Source: The World Input-Output Database (WIOD). www.wiod.org Note: foreign inputs and domestically produced inputs used in foreign exports as percent of gross exports.
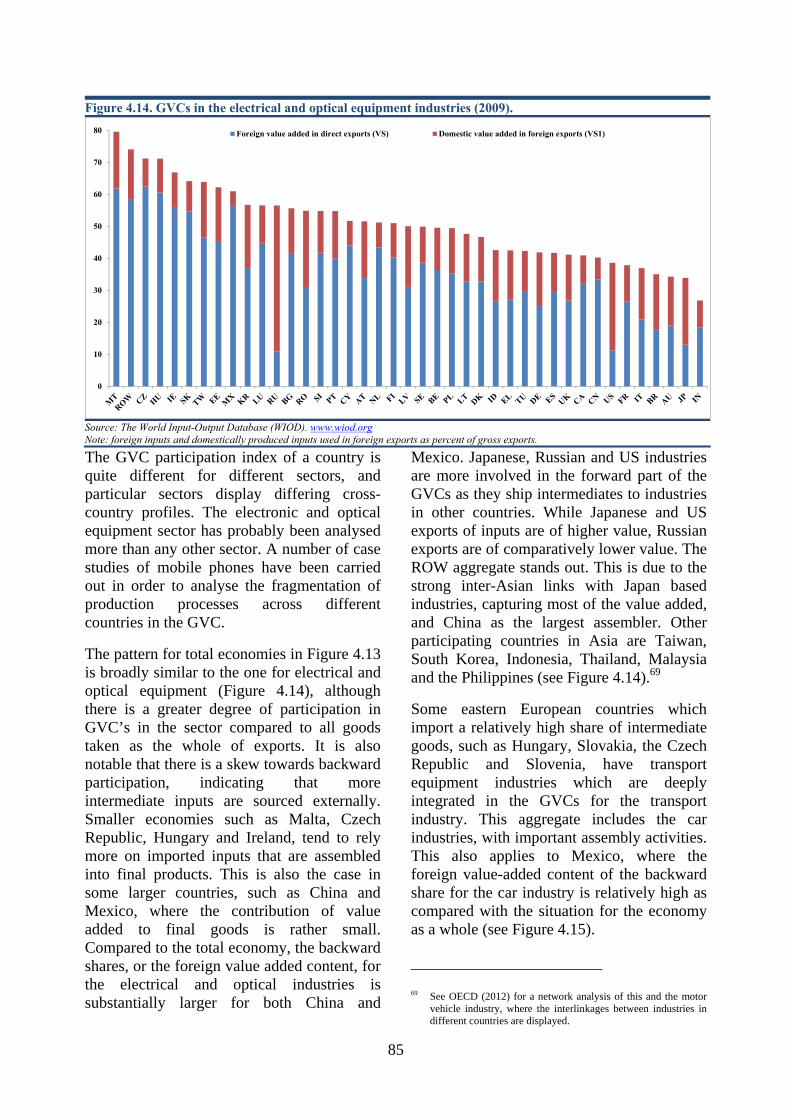
85
The GVC participation index of a country is quite different for different sectors, and particular sectors display differing cross-country profiles. The electronic and optical equipment sector has probably been analysed more than any other sector. A number of case studies of mobile phones have been carried out in order to analyse the fragmentation of production processes across different countries in the GVC.
The pattern for total economies in Figure 4.13 is broadly similar to the one for electrical and optical equipment (Figure 4.14), although there is a greater degree of participation in GVC’s in the sector compared to all goods taken as the whole of exports. It is also notable that there is a skew towards backward participation, indicating that more intermediate inputs are sourced externally. Smaller economies such as Malta, Czech Republic, Hungary and Ireland, tend to rely more on imported inputs that are assembled into final products. This is also the case in some larger countries, such as China and Mexico, where the contribution of value added to final goods is rather small. Compared to the total economy, the backward shares, or the foreign value added content, for the electrical and optical industries is substantially larger for both China and
Mexico. Japanese, Russian and US industries are more involved in the forward part of the GVCs as they ship intermediates to industries in other countries. While Japanese and US exports of inputs are of higher value, Russian exports are of comparatively lower value. The ROW aggregate stands out. This is due to the strong inter-Asian links with Japan based industries, capturing most of the value added, and China as the largest assembler. Other participating countries in Asia are Taiwan, South Korea, Indonesia, Thailand, Malaysia and the Philippines (see Figure 4.14).69
Some eastern European countries which import a relatively high share of intermediate goods, such as Hungary, Slovakia, the Czech Republic and Slovenia, have transport equipment industries which are deeply integrated in the GVCs for the transport industry. This aggregate includes the car industries, with important assembly activities. This also applies to Mexico, where the foreign value-added content of the backward share for the car industry is relatively high as compared with the situation for the economy as a whole (see Figure 4.15).
69 See OECD (2012) for a network analysis of this and the motor
vehicle industry, where the interlinkages between industries in different countries are displayed.
Figure 4.14. GVCs in the electrical and optical equipment industries (2009).
0
10
20
30
40
50
60
70
80 Foreign value added in direct exports (VS) Domestic value added in foreign exports (VS1)
Source: The World Input-Output Database (WIOD). www.wiod.org Note: foreign inputs and domestically produced inputs used in foreign exports as percent of gross exports.
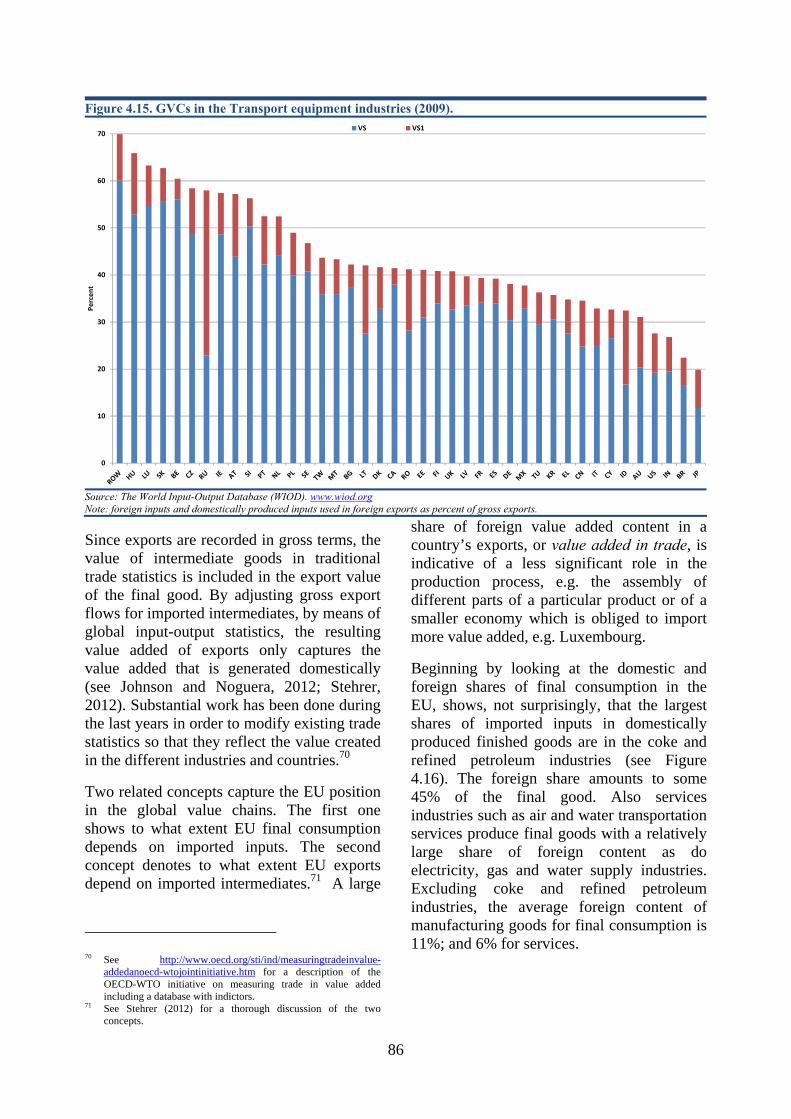
86
Since exports are recorded in gross terms, the value of intermediate goods in traditional trade statistics is included in the export value of the final good. By adjusting gross export flows for imported intermediates, by means of global input-output statistics, the resulting value added of exports only captures the value added that is generated domestically (see Johnson and Noguera, 2012; Stehrer, 2012). Substantial work has been done during the last years in order to modify existing trade statistics so that they reflect the value created in the different industries and countries.70
Two related concepts capture the EU position in the global value chains. The first one shows to what extent EU final consumption depends on imported inputs. The second concept denotes to what extent EU exports depend on imported intermediates.71 A large
70 See http://www.oecd.org/sti/ind/measuringtradeinvalue-
addedanoecd-wtojointinitiative.htm for a description of the OECD-WTO initiative on measuring trade in value added including a database with indictors.
71 See Stehrer (2012) for a thorough discussion of the two concepts.
share of foreign value added content in a country’s exports, or value added in trade, is indicative of a less significant role in the production process, e.g. the assembly of different parts of a particular product or of a smaller economy which is obliged to import more value added, e.g. Luxembourg.
Beginning by looking at the domestic and foreign shares of final consumption in the EU, shows, not surprisingly, that the largest shares of imported inputs in domestically produced finished goods are in the coke and refined petroleum industries (see Figure 4.16). The foreign share amounts to some 45% of the final good. Also services industries such as air and water transportation services produce final goods with a relatively large share of foreign content as do electricity, gas and water supply industries. Excluding coke and refined petroleum industries, the average foreign content of manufacturing goods for final consumption is 11%; and 6% for services.
Figure 4.15. GVCs in the Transport equipment industries (2009).
0
10
20
30
40
50
60
70
Perc
ent
VS VS1
Source: The World Input-Output Database (WIOD). www.wiod.org Note: foreign inputs and domestically produced inputs used in foreign exports as percent of gross exports.
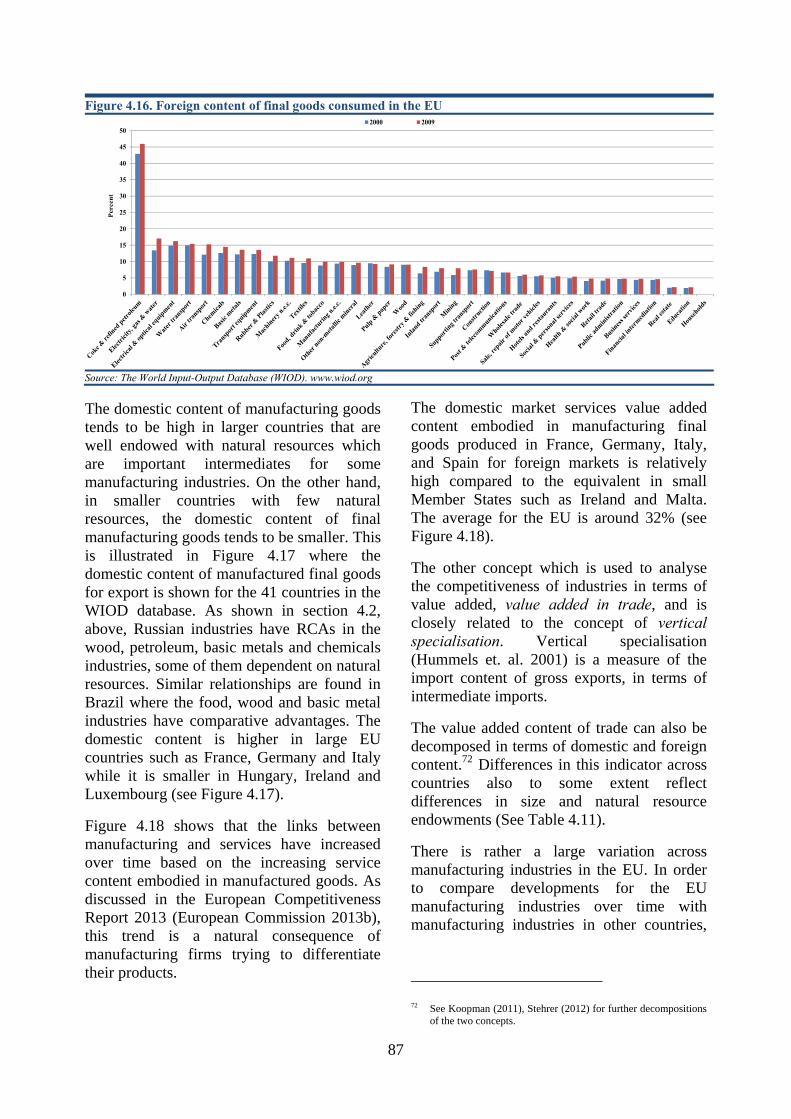
87
The domestic content of manufacturing goods tends to be high in larger countries that are well endowed with natural resources which are important intermediates for some manufacturing industries. On the other hand, in smaller countries with few natural resources, the domestic content of final manufacturing goods tends to be smaller. This is illustrated in Figure 4.17 where the domestic content of manufactured final goods for export is shown for the 41 countries in the WIOD database. As shown in section 4.2, above, Russian industries have RCAs in the wood, petroleum, basic metals and chemicals industries, some of them dependent on natural resources. Similar relationships are found in Brazil where the food, wood and basic metal industries have comparative advantages. The domestic content is higher in large EU countries such as France, Germany and Italy while it is smaller in Hungary, Ireland and Luxembourg (see Figure 4.17).
Figure 4.18 shows that the links between manufacturing and services have increased over time based on the increasing service content embodied in manufactured goods. As discussed in the European Competitiveness Report 2013 (European Commission 2013b), this trend is a natural consequence of manufacturing firms trying to differentiate their products.
The domestic market services value added content embodied in manufacturing final goods produced in France, Germany, Italy, and Spain for foreign markets is relatively high compared to the equivalent in small Member States such as Ireland and Malta. The average for the EU is around 32% (see Figure 4.18).
The other concept which is used to analyse the competitiveness of industries in terms of value added, value added in trade, and is closely related to the concept of vertical specialisation. Vertical specialisation (Hummels et. al. 2001) is a measure of the import content of gross exports, in terms of intermediate imports.
The value added content of trade can also be decomposed in terms of domestic and foreign content.72 Differences in this indicator across countries also to some extent reflect differences in size and natural resource endowments (See Table 4.11).
There is rather a large variation across manufacturing industries in the EU. In order to compare developments for the EU manufacturing industries over time with manufacturing industries in other countries,
72 See Koopman (2011), Stehrer (2012) for further decompositions
of the two concepts.
Figure 4.16. Foreign content of final goods consumed in the EU
0
5
10
15
20
25
30
35
40
45
50
Perc
ent
2000 2009
Source: The World Input-Output Database (WIOD). www.wiod.org
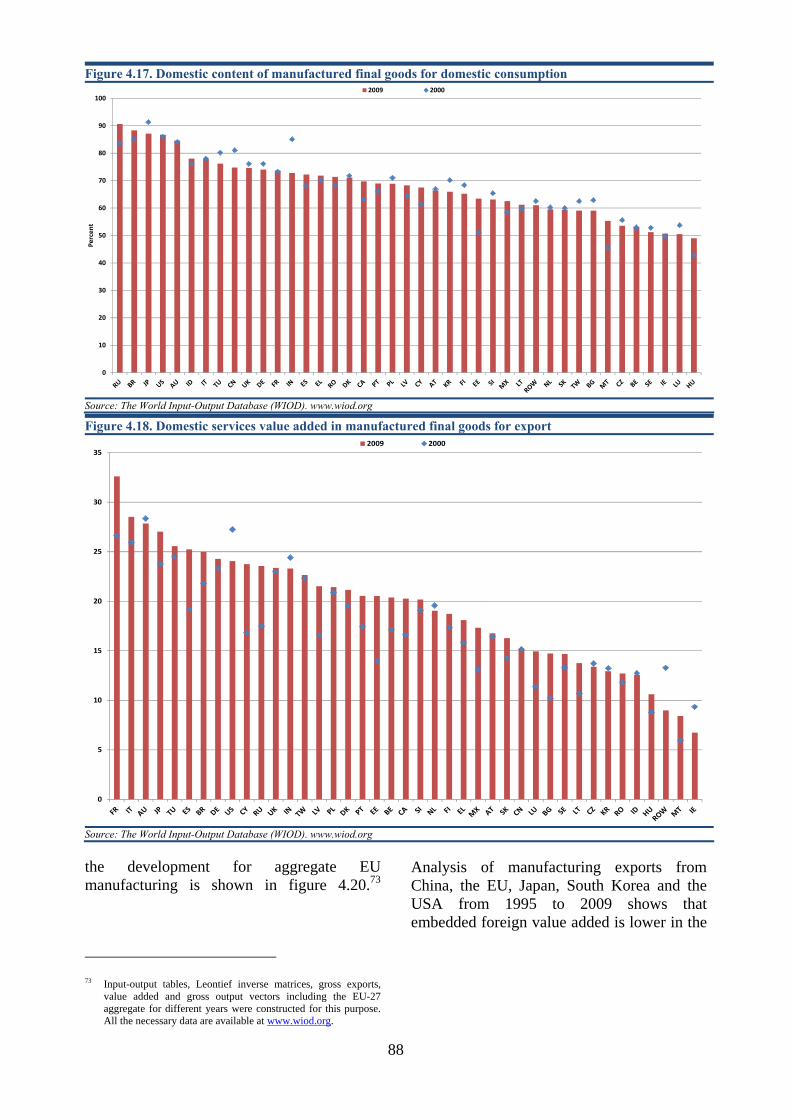
88
the development for aggregate EU manufacturing is shown in figure 4.20.73
73 Input-output tables, Leontief inverse matrices, gross exports,
value added and gross output vectors including the EU-27 aggregate for different years were constructed for this purpose. All the necessary data are available at www.wiod.org.
Analysis of manufacturing exports from China, the EU, Japan, South Korea and the USA from 1995 to 2009 shows that embedded foreign value added is lower in the
Figure 4.17. Domestic content of manufactured final goods for domestic consumption
0
10
20
30
40
50
60
70
80
90
100Pe
rcen
t2009 2000
Source: The World Input-Output Database (WIOD). www.wiod.org
Figure 4.18. Domestic services value added in manufactured final goods for export
0
5
10
15
20
25
30
352009 2000
Source: The World Input-Output Database (WIOD). www.wiod.org
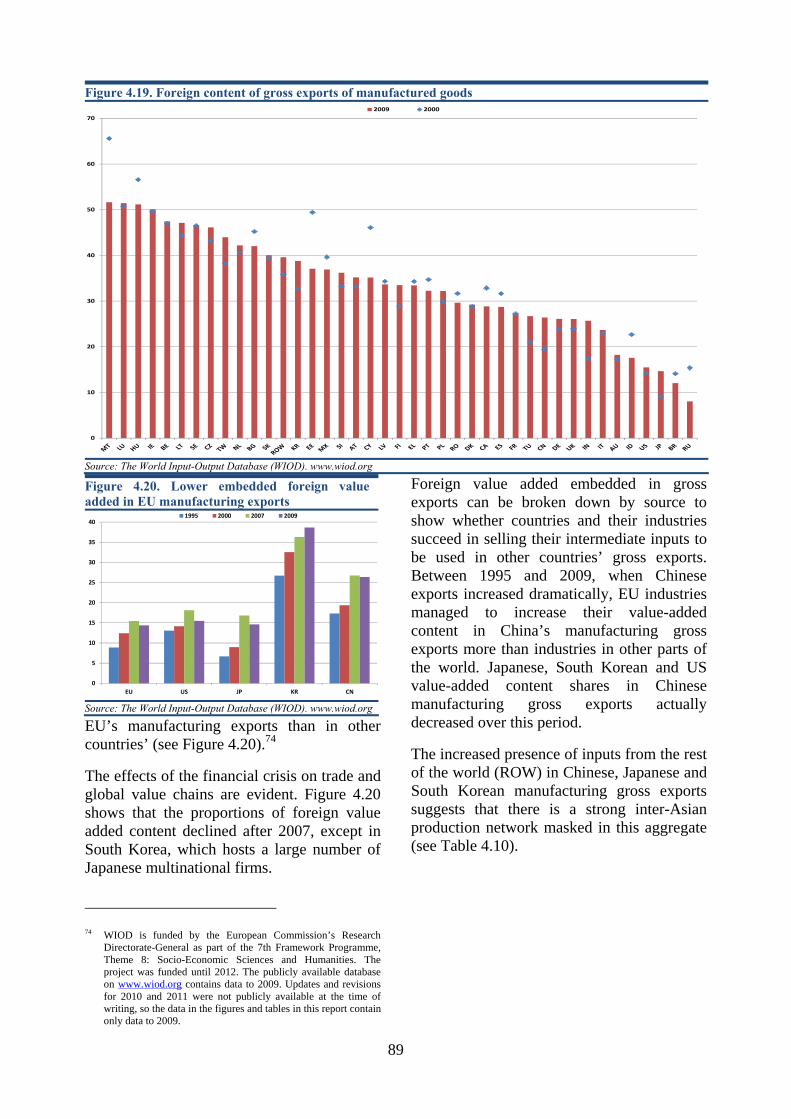
89
EU’s manufacturing exports than in other countries’ (see Figure 4.20).74
The effects of the financial crisis on trade and global value chains are evident. Figure 4.20 shows that the proportions of foreign value added content declined after 2007, except in South Korea, which hosts a large number of Japanese multinational firms.
74 WIOD is funded by the European Commission’s Research
Directorate-General as part of the 7th Framework Programme, Theme 8: Socio-Economic Sciences and Humanities. The project was funded until 2012. The publicly available database on www.wiod.org contains data to 2009. Updates and revisions for 2010 and 2011 were not publicly available at the time of writing, so the data in the figures and tables in this report contain only data to 2009.
Foreign value added embedded in gross exports can be broken down by source to show whether countries and their industries succeed in selling their intermediate inputs to be used in other countries’ gross exports. Between 1995 and 2009, when Chinese exports increased dramatically, EU industries managed to increase their value-added content in China’s manufacturing gross exports more than industries in other parts of the world. Japanese, South Korean and US value-added content shares in Chinese manufacturing gross exports actually decreased over this period.
The increased presence of inputs from the rest of the world (ROW) in Chinese, Japanese and South Korean manufacturing gross exports suggests that there is a strong inter-Asian production network masked in this aggregate (see Table 4.10).
Figure 4.19. Foreign content of gross exports of manufactured goods
0
10
20
30
40
50
60
702009 2000
Source: The World Input-Output Database (WIOD). www.wiod.org
Figure 4.20. Lower embedded foreign value added in EU manufacturing exports
0
5
10
15
20
25
30
35
40
EU US JP KR CN
1995 2000 2007 2009
Source: The World Input-Output Database (WIOD). www.wiod.org
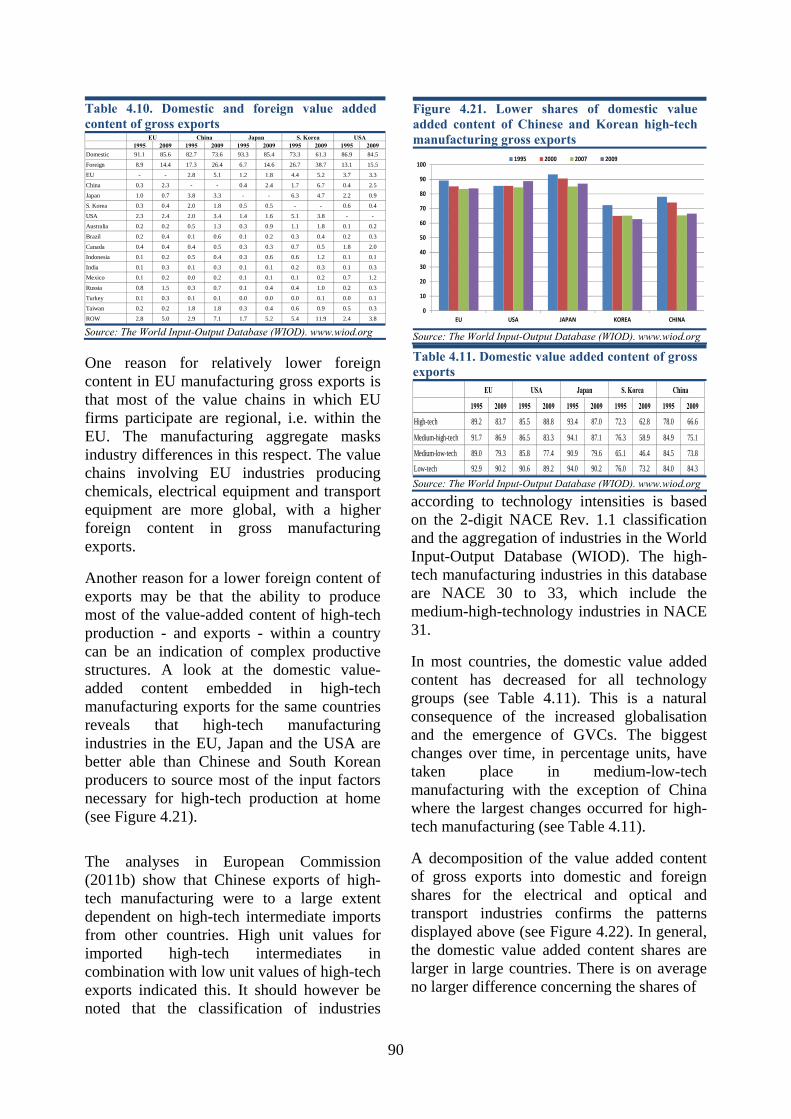
90
One reason for relatively lower foreign content in EU manufacturing gross exports is that most of the value chains in which EU firms participate are regional, i.e. within the EU. The manufacturing aggregate masks industry differences in this respect. The value chains involving EU industries producing chemicals, electrical equipment and transport equipment are more global, with a higher foreign content in gross manufacturing exports.
Another reason for a lower foreign content of exports may be that the ability to produce most of the value-added content of high-tech production - and exports - within a country can be an indication of complex productive structures. A look at the domestic value-added content embedded in high-tech manufacturing exports for the same countries reveals that high-tech manufacturing industries in the EU, Japan and the USA are better able than Chinese and South Korean producers to source most of the input factors necessary for high-tech production at home (see Figure 4.21).
The analyses in European Commission (2011b) show that Chinese exports of high-tech manufacturing were to a large extent dependent on high-tech intermediate imports from other countries. High unit values for imported high-tech intermediates in combination with low unit values of high-tech exports indicated this. It should however be noted that the classification of industries
according to technology intensities is based on the 2-digit NACE Rev. 1.1 classification and the aggregation of industries in the World Input-Output Database (WIOD). The high-tech manufacturing industries in this database are NACE 30 to 33, which include the medium-high-technology industries in NACE 31.
In most countries, the domestic value added content has decreased for all technology groups (see Table 4.11). This is a natural consequence of the increased globalisation and the emergence of GVCs. The biggest changes over time, in percentage units, have taken place in medium-low-tech manufacturing with the exception of China where the largest changes occurred for high-tech manufacturing (see Table 4.11).
A decomposition of the value added content of gross exports into domestic and foreign shares for the electrical and optical and transport industries confirms the patterns displayed above (see Figure 4.22). In general, the domestic value added content shares are larger in large countries. There is on average no larger difference concerning the shares of
Table 4.10. Domestic and foreign value added content of gross exports
1995 2009 1995 2009 1995 2009 1995 2009 1995 2009Domestic 91.1 85.6 82.7 73.6 93.3 85.4 73.3 61.3 86.9 84.5
Foreign 8.9 14.4 17.3 26.4 6.7 14.6 26.7 38.7 13.1 15.5
EU - - 2.8 5.1 1.2 1.8 4.4 5.2 3.7 3.3
China 0.3 2.3 - - 0.4 2.4 1.7 6.7 0.4 2.5
Japan 1.0 0.7 3.8 3.3 - - 6.3 4.7 2.2 0.9
S. Korea 0.3 0.4 2.0 1.8 0.5 0.5 - - 0.6 0.4
USA 2.3 2.4 2.0 3.4 1.4 1.6 5.1 3.8 - -
Australia 0.2 0.2 0.5 1.3 0.3 0.9 1.1 1.8 0.1 0.2
Brazil 0.2 0.4 0.1 0.6 0.1 0.2 0.3 0.4 0.2 0.3
Canada 0.4 0.4 0.4 0.5 0.3 0.3 0.7 0.5 1.8 2.0
Indonesia 0.1 0.2 0.5 0.4 0.3 0.6 0.6 1.2 0.1 0.1
India 0.1 0.3 0.1 0.3 0.1 0.1 0.2 0.3 0.1 0.3
Mexico 0.1 0.2 0.0 0.2 0.1 0.1 0.1 0.2 0.7 1.2
Russia 0.8 1.5 0.3 0.7 0.1 0.4 0.4 1.0 0.2 0.3
Turkey 0.1 0.3 0.1 0.1 0.0 0.0 0.0 0.1 0.0 0.1
Taiwan 0.2 0.2 1.8 1.8 0.3 0.4 0.6 0.9 0.5 0.3
ROW 2.8 5.0 2.9 7.1 1.7 5.2 5.4 11.9 2.4 3.8
S. Korea USAEU China Japan
Source: The World Input-Output Database (WIOD). www.wiod.org
Figure 4.21. Lower shares of domestic value added content of Chinese and Korean high-tech manufacturing gross exports
0
10
20
30
40
50
60
70
80
90
100
EU USA JAPAN KOREA CHINA
1995 2000 2007 2009
Source: The World Input-Output Database (WIOD). www.wiod.org
Table 4.11. Domestic value added content of gross exports
1995 2009 1995 2009 1995 2009 1995 2009 1995 2009
High-tech 89.2 83.7 85.5 88.8 93.4 87.0 72.3 62.8 78.0 66.6
Medium-high-tech 91.7 86.9 86.5 83.3 94.1 87.1 76.3 58.9 84.9 75.1
Medium-low-tech 89.0 79.3 85.8 77.4 90.9 79.6 65.1 46.4 84.5 73.8
Low-tech 92.9 90.2 90.6 89.2 94.0 90.2 76.0 73.2 84.0 84.3
EU USA Japan S. Korea China
Source: The World Input-Output Database (WIOD). www.wiod.org
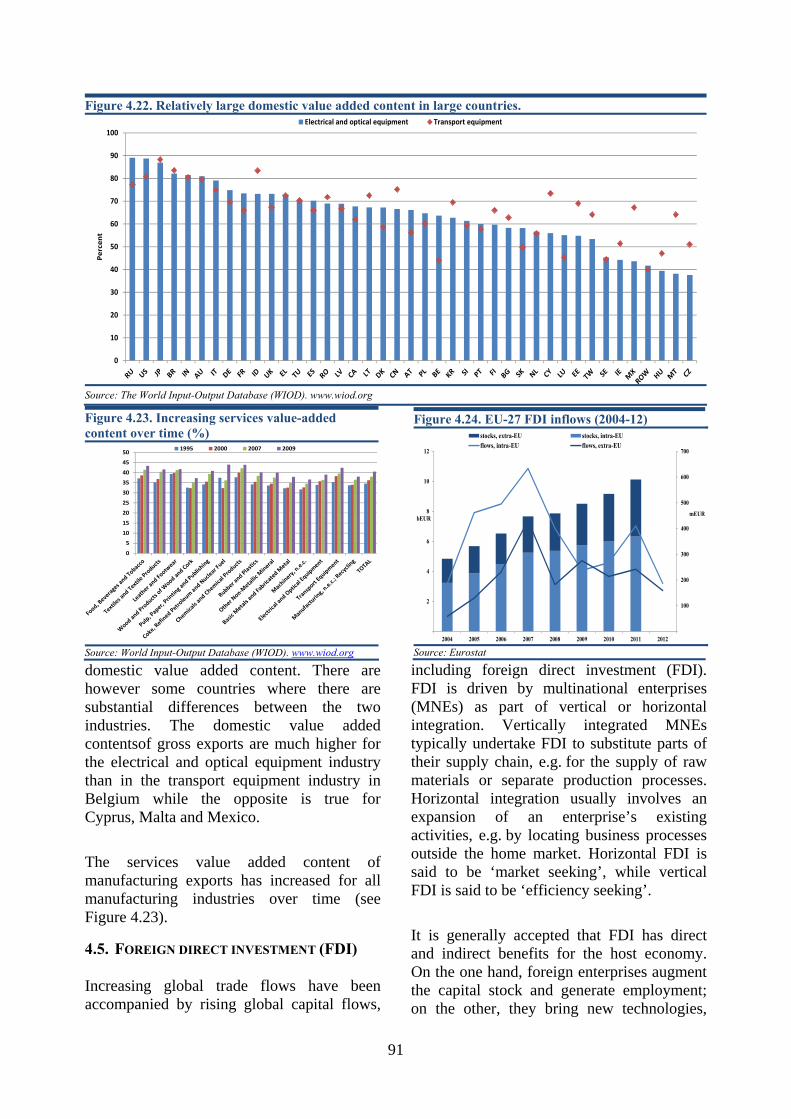
91
domestic value added content. There are however some countries where there are substantial differences between the two industries. The domestic value added contentsof gross exports are much higher for the electrical and optical equipment industry than in the transport equipment industry in Belgium while the opposite is true for Cyprus, Malta and Mexico.
The services value added content of manufacturing exports has increased for all manufacturing industries over time (see Figure 4.23).
4.5. FOREIGN DIRECT INVESTMENT (FDI)
Increasing global trade flows have been accompanied by rising global capital flows,
including foreign direct investment (FDI). FDI is driven by multinational enterprises (MNEs) as part of vertical or horizontal integration. Vertically integrated MNEs typically undertake FDI to substitute parts of their supply chain, e.g. for the supply of raw materials or separate production processes. Horizontal integration usually involves an expansion of an enterprise’s existing activities, e.g. by locating business processes outside the home market. Horizontal FDI is said to be ‘market seeking’, while vertical FDI is said to be ‘efficiency seeking’.
It is generally accepted that FDI has direct and indirect benefits for the host economy. On the one hand, foreign enterprises augment the capital stock and generate employment; on the other, they bring new technologies,
Figure 4.22. Relatively large domestic value added content in large countries.
0
10
20
30
40
50
60
70
80
90
100
Perc
ent
Electrical and optical equipment Transport equipment
Source: The World Input-Output Database (WIOD). www.wiod.org
Figure 4.23. Increasing services value-added content over time (%)
0
5
10
15
20
25
30
35
40
45
50 1995 2000 2007 2009
Source: World Input-Output Database (WIOD). www.wiod.org
Figure 4.24. EU-27 FDI inflows (2004-12)
100
200
300
400
500
600
700
2
4
6
8
10
12
2004 2005 2006 2007 2008 2009 2010 2011 2012
stocks, extra-EU stocks, intra-EUflows, intra-EU flows, extra-EU
bEURmEUR
Source: Eurostat

92
skills and human capital that can spill over to domestic firms and workers. More broadly, the appeal and influence of foreign investment can drive improvements in the business environment as a whole.
The impact of inward FDI on host economies and firms depends on a wide range of factors, including:
- the type of investment;
- the absorption capacity of the host country; and
- the size and other characteristics of firms.
Outward FDI can be an important driver of firm growth. MNEs are typically larger and more productive, pay higher wages and have better knowledge, technologies and managerial skills. They may also gain competitive advantages by expanding into new markets (through the learning effects of internationalisation), reducing production costs or gaining access to natural resources, advanced technologies and know-how.
EU Member States account for a significant proportion of global FDI flows, with around 22 % and 30 % of global inflows and outflows respectively. After the EU, China is the second most attractive destination for global inflows (18 %), while it accounts for a significantly lower proportion of global outflows. Despite the impact of the crisis, inflows to China grew by 44 % in nominal
terms between 2008 and 2012,75 as compared with a decline in inflows to the EU of around 60 %.
Most of the fall in EU FDI inflows was due to a sharp drop in intra-EU flows: since the start of the crisis, European firms have been less able and less willing to invest in the EU market. Consequently, non-EU countries have become a more important source of FDI (see Figure 4.24). Inflows started rising again in 2011, perhaps in response to an improving economic outlook, but again fell below 2008 levels in 2012.
Despite its increasing importance, FDI from outside the EU has also declined in absolute terms since 2007 in line with the broader pro-cyclical trend of declining investment spending in both the private and public sectors.
EU FDI outflows also fell sharply at the start of the crisis (see Figure 4.25). Intra-EU FDI outflows fell more than those to the rest of the world, which indicates that EU enterprises remained more positive about external prospects. The fall in extra-EU outflows has been much smaller in absolute terms than the fall in intra-EU outflows. Stocks in extra-EU outward FDI rose to around 47 % of all outward FDI stocks in 2011. Outbound FDI started rising in 2011 but subsequently fell sharply in 2012.
The USA is the EU’s biggest FDI partner for both outflows and inflows, followed by Switzerland and Japan (see Figure 4.26). Although stocks with FDI partners in emerging economies are still low, there has been marked development in links with Russia, Brazil and China.
The stocks of inward and outward FDI from the EU are concentrated in financial and manufacturing sectors, and professional services. The high level of FDI in services contrasts with the relatively minor importance
75 Based on OECD statistics.
Figure 4.25. EU-27 FDI outflows (rhs) (2004-2012)
100
200
300
400
500
600
700
800
2
4
6
8
10
12
14
2004 2005 2006 2007 2008 2009 2010 2011 2012
stocks, extra-EU stocks, intra-EUflows, intra-EU flows, extra-EU
bEURmEUR
Source: Eurostat, European Competitiveness report 2012

93
of services in trade flows. This correlation is sometimes considered to be partly natural in that the non-tradability of many services encourages investment abroad to open up new markets, while the greater tradability of goods encourages more direct trade flows. As noted earlier, technical and regulatory developments in international trade are likely to encourage greater trade flows in services in future.
In most sectors, outward EU FDI stocks easily outweigh inward EU FDI stocks, which can be accounted for by the size of the EU economy, the comparatively high income levels in EU Member States and the fact that the single market encourages intra-EU investment. The highest ratios are for air transport and courier services, followed by electricity and gas. The high level of FDI is more balanced in the financial and insurance service sectors, where horizontal integration appears to be behind the high FDI ratio for air transport, courier services and the electricity and gas sectors (see Figure 4.27). Vertical integration would appear to be the main driver behind the large ratios for mining and quarrying and for the manufacture of base metals.
Figure 4.26. The EU’s main FDI partners (stocks)
2004 2011 2004 2011United States 15.87% 13.28% 14.18% 11.92%Switzerland 4.63% 4.62% 4.75% 5.17%Japan 1.69% 1.42% 1.47% 0.72%Canada 1.31% 1.36% 1.46% 1.86%Russia 0.11% 0.53% 0.40% 1.40%South Africa 0.09% 0.08% 0.72% 0.67%Brazil 0.07% 0.77% 1.36% 2.00%China (excl. HK) 0.04% 0.15% 0.41% 0.85%Hong Kong 0.27% 0.63% 1.67% 1.04%Singapore 0.35% 0.67% 0.81% 1.03%Australia 0.56% 0.34% 1.00% 1.05%
Inward Outward
Source: Eurostat, own calculations.
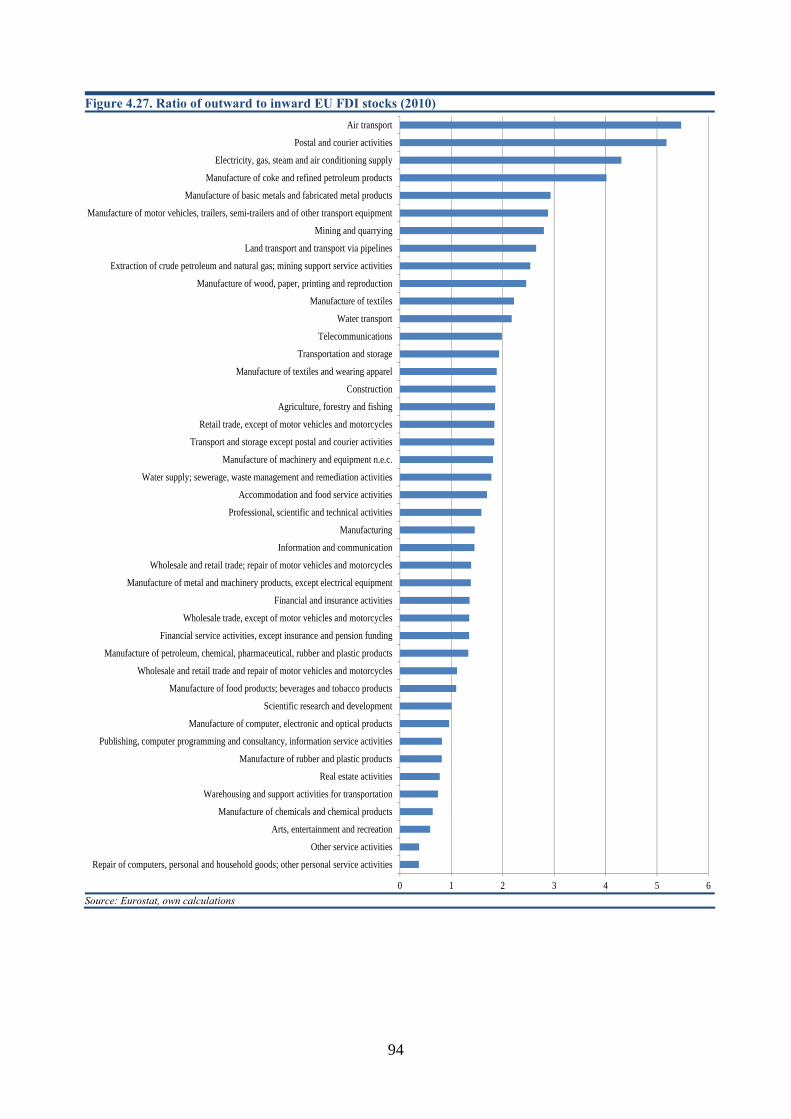
94
Figure 4.27. Ratio of outward to inward EU FDI stocks (2010)
0 1 2 3 4 5 6
Repair of computers, personal and household goods; other personal service activities
Other service activities
Arts, entertainment and recreation
Manufacture of chemicals and chemical products
Warehousing and support activities for transportation
Real estate activities
Manufacture of rubber and plastic products
Publishing, computer programming and consultancy, information service activities
Manufacture of computer, electronic and optical products
Scientific research and development
Manufacture of food products; beverages and tobacco products
Wholesale and retail trade and repair of motor vehicles and motorcycles
Manufacture of petroleum, chemical, pharmaceutical, rubber and plastic products
Financial service activities, except insurance and pension funding
Wholesale trade, except of motor vehicles and motorcycles
Financial and insurance activities
Manufacture of metal and machinery products, except electrical equipment
Wholesale and retail trade; repair of motor vehicles and motorcycles
Information and communication
Manufacturing
Professional, scientific and technical activities
Accommodation and food service activities
Water supply; sewerage, waste management and remediation activities
Manufacture of machinery and equipment n.e.c.
Transport and storage except postal and courier activities
Retail trade, except of motor vehicles and motorcycles
Agriculture, forestry and fishing
Construction
Manufacture of textiles and wearing apparel
Transportation and storage
Telecommunications
Water transport
Manufacture of textiles
Manufacture of wood, paper, printing and reproduction
Extraction of crude petroleum and natural gas; mining support service activities
Land transport and transport via pipelines
Mining and quarrying
Manufacture of motor vehicles, trailers, semi-trailers and of other transport equipment
Manufacture of basic metals and fabricated metal products
Manufacture of coke and refined petroleum products
Electricity, gas, steam and air conditioning supply
Postal and courier activities
Air transport
Source: Eurostat, own calculations
95
REFERENCES
Arto, I., Genty, A., Rueda-Cantuche, J.M., Villanueva, A., Andreoni, V., 2012a. Global Resources Use and Pollution. Vol. I, Production, Consumption and Trade (1995-2008). JRC Scientific and Policy Reports. European Commission. Luxembourg: Publications Office of the European Union.
Arto, I., Genty, A., Rueda-Cantuche, J.M., Villanueva, A., Andreoni, V., 2012b. Global Resources Use and Pollution. Vol. II, Country factsheets. JRC Scientific and Policy Reports. European Commission. Luxembourg: Publications Office of the European Union.
Balassa, B., ‘Trade Liberalisation and ‘Revealed Comparative Advantage’, Manchester School of Economic and Social Studies, 1965, Vol. 33, pp. 99–123.
Barlevy, G. (2007), On the Cyclicality of Research and Development, The American Economic Review, Vol. 97, No. 4, pp. 1131-1164
EU Industrial Structure 2009, European Commission (2009), Performance and Competitiveness, Enterprise and Industry DG, Office for Official Publications of the European Communities, Luxembourg.
EU Industrial Structure 2011, European Commission (2011), Trends and Performance, Enterprise and Industry DG, Office for Official Publications of the European Communities, Luxembourg.
European Central Bank (2007), European Union balance of payments/International investment position statistical methods.
European Commission (2005a), EU sectoral competitiveness indicators, Enterprise and Industry DG, Office for Official Publications of the European Communities, Luxembourg.
European Commission (2007a), EU industrial structure 2007 — Challenges and opportunities, Enterprise and Industry DG, Office for Official Publications of the European Communities, Luxembourg.
European Commission (2008), Monitoring industrial research: the 2011 EU Industrial R&D Investment Scoreboard, European Commission, Luxembourg
European Commission (2009), Product Market Review 2009. Microeconomic consequences of the crisis and implications for the recovery, European Economy 11, Directorate Economic and Financial Affairs.
European Commission (2009), Sectoral Growth drivers and competitiveness in the European Union, Enterprise and Industry DG, Office for Official Publications of the European Communities, Luxembourg.
European Commission (2010a). Product Market Review 2010-2011. European Economy 8. Directorate-General Economic and Financial Affairs, European Commission.
European Commission (2011), Monitoring industrial research: the 2011 EU Industrial R&D Investment Scoreboard, European Commission, Luxembourg
European Commission (2011a), European Competitiveness Report 2010, Enterprise and Industry DG, Office for Official Publications of the European Communities, Luxembourg.
European Commission (2011b), European Competitiveness Report 2011, Enterprise and Industry DG, Office for Official Publications of the European Communities, Luxembourg.
European Commission (2011c), Price and cost competitiveness, quarterly report, Directorate-General for Economic and Financial Affairs.
European Commission (2012), European Competitiveness Report 2012, Enterprise and Industry DG, Office for Official Publications of the European Communities, Luxembourg.
European Commission (2013a). The Short-term Industrial Outlook. January 2013. Directorate-General Industry and Enterprise.
European Commission (2013b), European Competitiveness Report 2013, Enterprise and Industry DG, Office for Official Publications of the European Communities, Luxembourg.
European Commission, United Nations, International Monetary Fund, Organisation for Economic Cooperation and Development, United Nations Conference on Trade and Development, World Trade Organisation (2002), Manual on Statistics of international trade in services, Department of Economic and Social Affairs, Statistics Division, Statistical Papers, Geneva, Luxembourg, New York, Paris, Washington DC.
Eurostat (1996), Statistical Classification of Economic Activities in the European Community, Office for Official Publications of the European Communities, Luxembourg.

96
Eurostat (2008), Eurostat Manual of supply, use tables and input-output tables, Methodologies and Working Papers, Office for Official Publications of the European Communities, Luxembourg.
Eurostat (2013), Eurostat pocketbooks. International trade and foreign direct investment. Office for Official Publications of the European Communities, Luxembourg.
Greiner, A., W. Semmler, and G. Gong (2005). The Forces of Economic Growth - A Time Series Perspective. Princeton University Press.
Griliches, Z. (ed.) (1984), R&D, Patents and Productivity, The University of Chicago Press. Griliches, Z. (1990), ‘Patent statistics as economic indicators: a survey’, Journal of Economic Literature,
Vol. XXVIII, pp. 1661–1707. Hummels, D., Ishii, J. & Yi., K-M. (2001), The nature and growth of vertical specialisation in world
trade. Journal of International Economics, Vol. 54, No 1, pp. 75-96. International Monetary Fund, Balance of Payments and International Investment Position Manual, sixth
edition. Johnson, R.C. and G. Noguera (2012), “Accounting for Intermediates: Production Sharing and Trade in
Value Added”, Journal of International Economics, Vol. 86, No. 2, pp. 224-236. Koopman, R., W. Powers, Z. Wang and S.-J. Wei (2011), “Give Credit Where Credit is Due: Tracing
Value Added in Global Production Chains”, NBER Working Paper Series No. 16426, Cambridge, MA.
Kommerskollegium, National Board of Trade (2010). ”The servicification of Swedish manufacturing”. Stockholm.
Kommerskollegium, National Board of Trade (2012). “Adding value to the European Economy. How anti-dumping can damage the supply chains of globalised European companies. Five case studies from the shoe industry. Stockholm.
Langhammer R. (2004), ‘Revealed Comparative Advantages in Services Trade of the United States, the European Union and Japan — What Do They Tell Us?’, The Journal of World Investment & Trade, Vol. 5, No 6, pp. 887–896.
Leontief, W. (1986), Input-Output economics, 2nd edition, Oxford University Press. Lodefalk, M. (2013), "Servicification of manufacturing – evidence from Sweden", International Journal
of Economics and Business Research, Vol. 6, No. 1. Miles, I. (June 2007), ‘Research and Development (R&D) beyond manufacturing: The Strange Case of
Services R&D’, R&D Management, Vol. 37, No 3, pp. 249–268. Ng, F. and Yeats, A. (1999), Production sharing in East Asia: Who does what for whom and why? World
Bank Policy Research Working Paper, No 2197. Nordås, K. N. & Kim, Y. (2013). “The role of services for competitiveness in Manufacturing.” OECD
Trade Policy Papers No. 148. Paris. OECD (1997), Revision of the High-Technology Sector and Product Classification, Paris. OECD (1998), Human capital Investment - An international comparison, Centre for Educational
Research and Innovation, Paris. OECD (2001), OECD Manual: Measuring Capital. Measurement of capital stocks, consumption of fixed
capital and capital services, Paris OECD (2002), Frascati Manual: Proposed standard practice for surveys on research and experimental
development, Paris. OECD (2004), ‘Promoting Innovation in Services’, OECD Science, Technology and Industry Outlook,
Paris, Chapter IV. OECD (2005), ‘The Service Economy in OECD Countries’, OECD Directorate for Science, Technology
and Industry, working paper 2005/3, Statistical Analysis of Science, Technology and Industry, Paris. OECD (2007), ‘Science, Technology and Innovation Indicators in a Changing World Responding to
policy needs’, Paris. OECD (2010), OECD Economic Globalisation Indicators, Paris, OECD Directorate for Science,
Technology and Industry, Committee on Industry, Innovation and Entrepreneurship. DSTI/IND/WPGI(2011)2, Paris.
OECD (2011), Export Competition: Price or quality?, OECD Directorate Science, Technology and Industry, Committee on Industry, Innovation and Entrepreneurship. DSTI/IND/WPGI(2011)2, Paris.
OECD (2012), Mapping global value chains, Paris, OECD Trade and Agriculture Directorate, Trade Committee, TAD/CP/WP/RD(2012)9, Paris.
97
OECD (2013) Preliminary version, Interconnected economies: benefitting from global value chains. OECD, Paris.
OECD (2013) FDI in figures, OECD, Paris. O’Mahony and van Ark (2003), EU productivity and competitiveness — An industry perspective,
European Commission Pavitt, K. (1985), ‘Patent statistics as indicators of innovative activities: possibilities and problems’,
Scientometrics, Vol. 7, Nos 1–2, pp. 77–99. Reinstaller, A. et al (2012), The development of productive structures of EU Member States and their
international competitiveness, commissioned by the European Commission’s Directorate-General for Enterprise and Industry.
Silverman, B. (2002), Technological resources and the logic of corporate diversification, Routledge, Chapter 4.
Stehrer, R. (2012). “Trade in Value Added and the Value Added in Trade”. WIOD working Paper 8 (2012) 1-19.
Varangis, et.al. (2004), ‘Exogenous shocks in low income countries: economic policy issues and the role of the international community’, Background paper for the report Managing the debt risk of exogenous shocks in low-income countries, World Bank.
World Input-Output Database (2012). Project funded by the European Commission, Research Directorate General as part of the 7th Framework Programme, Theme 8: Socio-Economic Sciences and Humanities. Grant Agreement no: 225 281
WTO, International Trade Statistics (2013).
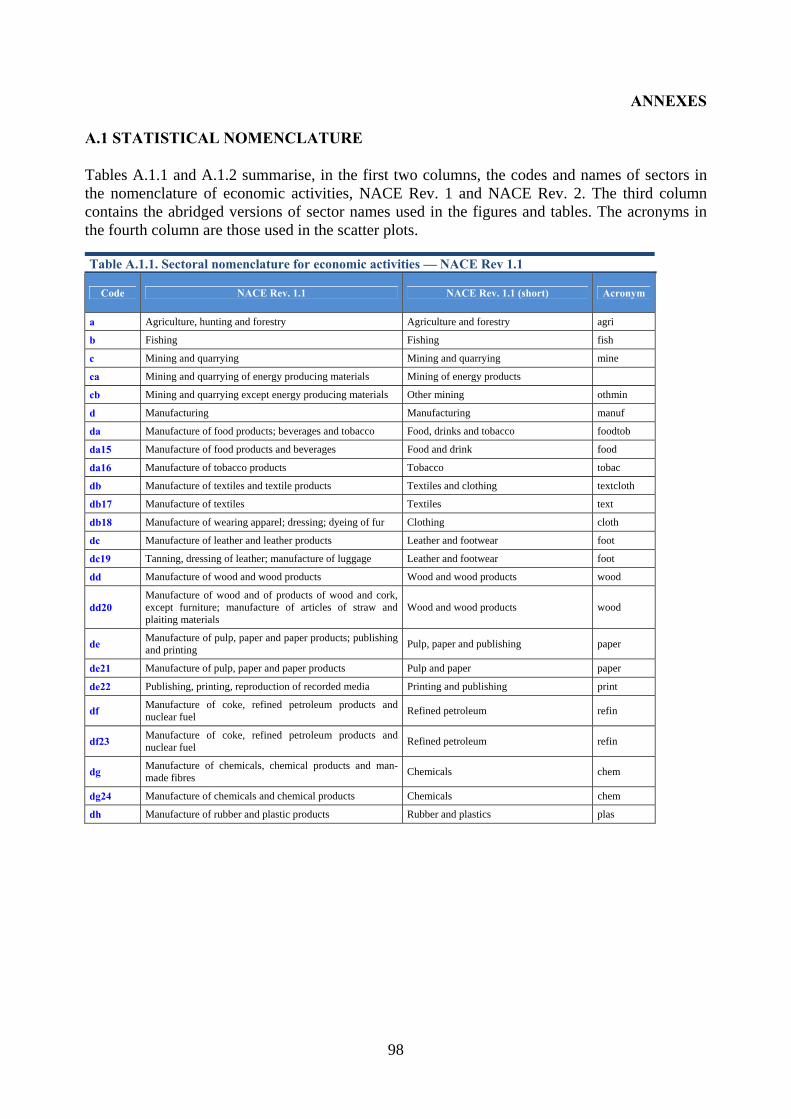
98
ANNEXES
A.1 STATISTICAL NOMENCLATURE
Tables A.1.1 and A.1.2 summarise, in the first two columns, the codes and names of sectors in the nomenclature of economic activities, NACE Rev. 1 and NACE Rev. 2. The third column contains the abridged versions of sector names used in the figures and tables. The acronyms in the fourth column are those used in the scatter plots.
Table A.1.1. Sectoral nomenclature for economic activities — NACE Rev 1.1
Code NACE Rev. 1.1 NACE Rev. 1.1 (short) Acronym
a Agriculture, hunting and forestry Agriculture and forestry agri
b Fishing Fishing fish
c Mining and quarrying Mining and quarrying mine
ca Mining and quarrying of energy producing materials Mining of energy products
cb Mining and quarrying except energy producing materials Other mining othmin
d Manufacturing Manufacturing manuf
da Manufacture of food products; beverages and tobacco Food, drinks and tobacco foodtob
da15 Manufacture of food products and beverages Food and drink food
da16 Manufacture of tobacco products Tobacco tobac
db Manufacture of textiles and textile products Textiles and clothing textcloth
db17 Manufacture of textiles Textiles text
db18 Manufacture of wearing apparel; dressing; dyeing of fur Clothing cloth
dc Manufacture of leather and leather products Leather and footwear foot
dc19 Tanning, dressing of leather; manufacture of luggage Leather and footwear foot
dd Manufacture of wood and wood products Wood and wood products wood
dd20 Manufacture of wood and of products of wood and cork, except furniture; manufacture of articles of straw and plaiting materials
Wood and wood products wood
de Manufacture of pulp, paper and paper products; publishing and printing Pulp, paper and publishing paper
de21 Manufacture of pulp, paper and paper products Pulp and paper paper
de22 Publishing, printing, reproduction of recorded media Printing and publishing print
df Manufacture of coke, refined petroleum products and nuclear fuel Refined petroleum refin
df23 Manufacture of coke, refined petroleum products and nuclear fuel Refined petroleum refin
dg Manufacture of chemicals, chemical products and man-made fibres Chemicals chem
dg24 Manufacture of chemicals and chemical products Chemicals chem
dh Manufacture of rubber and plastic products Rubber and plastics plas
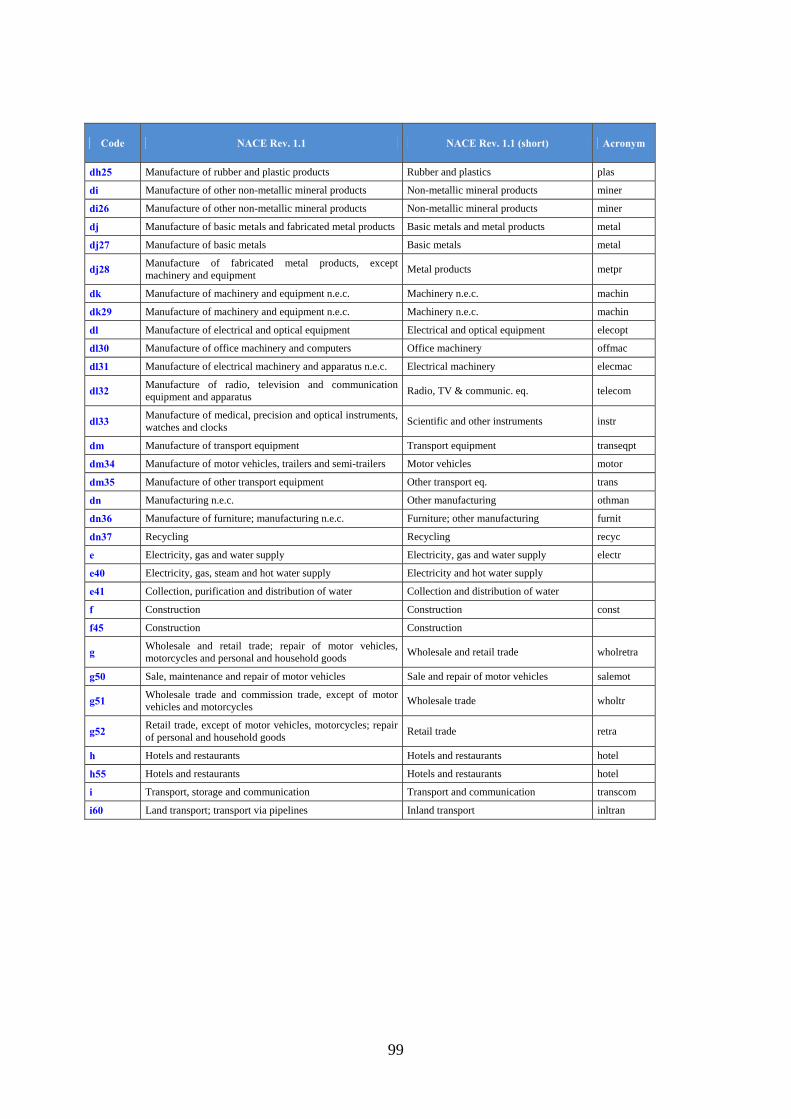
99
Code NACE Rev. 1.1 NACE Rev. 1.1 (short) Acronym
dh25 Manufacture of rubber and plastic products Rubber and plastics plas
di Manufacture of other non-metallic mineral products Non-metallic mineral products miner
di26 Manufacture of other non-metallic mineral products Non-metallic mineral products miner
dj Manufacture of basic metals and fabricated metal products Basic metals and metal products metal
dj27 Manufacture of basic metals Basic metals metal
dj28 Manufacture of fabricated metal products, except machinery and equipment Metal products metpr
dk Manufacture of machinery and equipment n.e.c. Machinery n.e.c. machin
dk29 Manufacture of machinery and equipment n.e.c. Machinery n.e.c. machin
dl Manufacture of electrical and optical equipment Electrical and optical equipment elecopt
dl30 Manufacture of office machinery and computers Office machinery offmac
dl31 Manufacture of electrical machinery and apparatus n.e.c. Electrical machinery elecmac
dl32 Manufacture of radio, television and communication equipment and apparatus Radio, TV & communic. eq. telecom
dl33 Manufacture of medical, precision and optical instruments, watches and clocks Scientific and other instruments instr
dm Manufacture of transport equipment Transport equipment transeqpt
dm34 Manufacture of motor vehicles, trailers and semi-trailers Motor vehicles motor
dm35 Manufacture of other transport equipment Other transport eq. trans
dn Manufacturing n.e.c. Other manufacturing othman
dn36 Manufacture of furniture; manufacturing n.e.c. Furniture; other manufacturing furnit
dn37 Recycling Recycling recyc
e Electricity, gas and water supply Electricity, gas and water supply electr
e40 Electricity, gas, steam and hot water supply Electricity and hot water supply
e41 Collection, purification and distribution of water Collection and distribution of water
f Construction Construction const
f45 Construction Construction
g Wholesale and retail trade; repair of motor vehicles, motorcycles and personal and household goods Wholesale and retail trade wholretra
g50 Sale, maintenance and repair of motor vehicles Sale and repair of motor vehicles salemot
g51 Wholesale trade and commission trade, except of motor vehicles and motorcycles Wholesale trade wholtr
g52 Retail trade, except of motor vehicles, motorcycles; repair of personal and household goods Retail trade retra
h Hotels and restaurants Hotels and restaurants hotel
h55 Hotels and restaurants Hotels and restaurants hotel
i Transport, storage and communication Transport and communication transcom
i60 Land transport; transport via pipelines Inland transport inltran
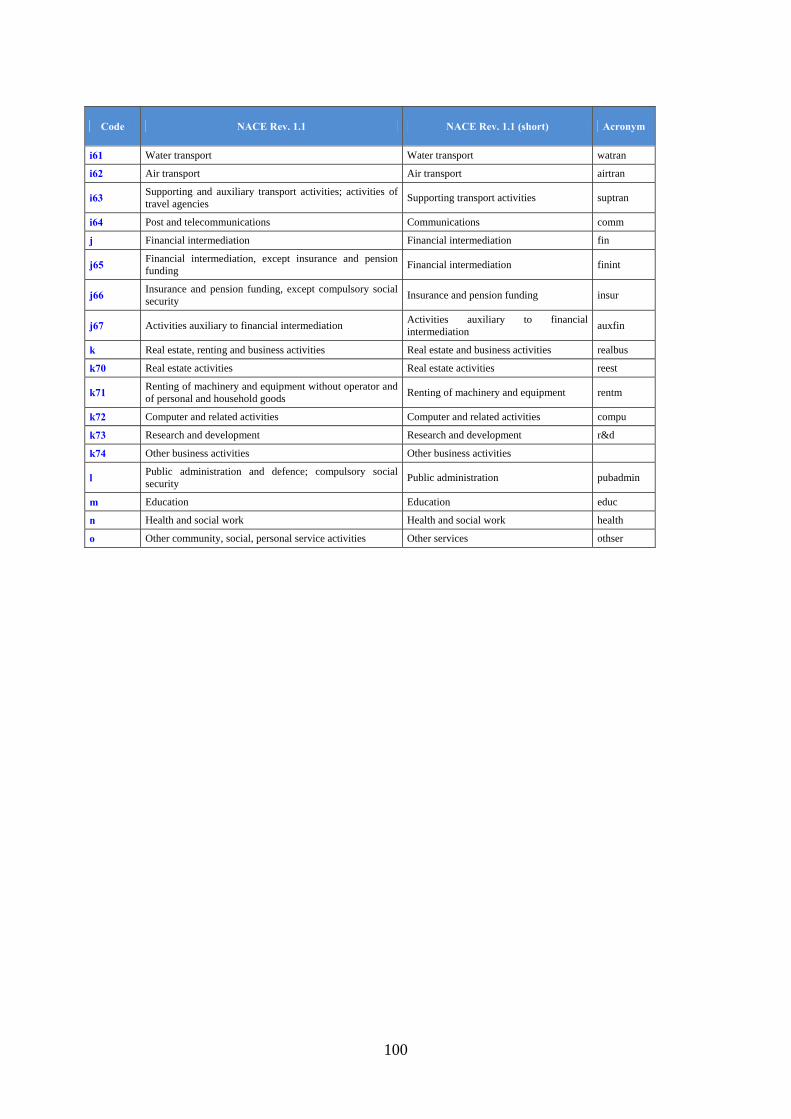
100
Code NACE Rev. 1.1 NACE Rev. 1.1 (short) Acronym
i61 Water transport Water transport watran
i62 Air transport Air transport airtran
i63 Supporting and auxiliary transport activities; activities of travel agencies Supporting transport activities suptran
i64 Post and telecommunications Communications comm
j Financial intermediation Financial intermediation fin
j65 Financial intermediation, except insurance and pension funding Financial intermediation finint
j66 Insurance and pension funding, except compulsory social security Insurance and pension funding insur
j67 Activities auxiliary to financial intermediation Activities auxiliary to financial intermediation auxfin
k Real estate, renting and business activities Real estate and business activities realbus
k70 Real estate activities Real estate activities reest
k71 Renting of machinery and equipment without operator and of personal and household goods Renting of machinery and equipment rentm
k72 Computer and related activities Computer and related activities compu
k73 Research and development Research and development r&d
k74 Other business activities Other business activities
l Public administration and defence; compulsory social security Public administration pubadmin
m Education Education educ
n Health and social work Health and social work health
o Other community, social, personal service activities Other services othser
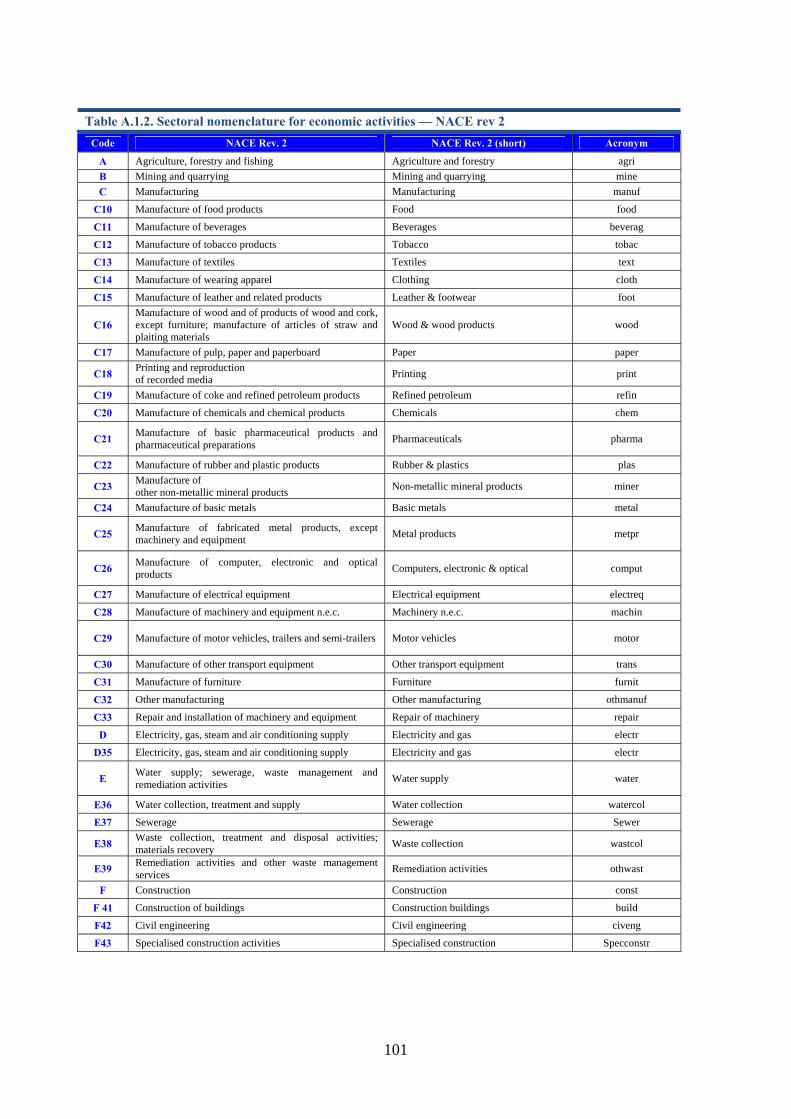
101
Table A.1.2. Sectoral nomenclature for economic activities — NACE rev 2 Code NACE Rev. 2 NACE Rev. 2 (short) Acronym
A Agriculture, forestry and fishing Agriculture and forestry agri B Mining and quarrying Mining and quarrying mine C Manufacturing Manufacturing manuf
C10 Manufacture of food products Food food
C11 Manufacture of beverages Beverages beverag
C12 Manufacture of tobacco products Tobacco tobac
C13 Manufacture of textiles Textiles text
C14 Manufacture of wearing apparel Clothing cloth
C15 Manufacture of leather and related products Leather & footwear foot
C16 Manufacture of wood and of products of wood and cork, except furniture; manufacture of articles of straw and plaiting materials
Wood & wood products wood
C17 Manufacture of pulp, paper and paperboard Paper paper
C18 Printing and reproduction of recorded media Printing print
C19 Manufacture of coke and refined petroleum products Refined petroleum refin
C20 Manufacture of chemicals and chemical products Chemicals chem
C21 Manufacture of basic pharmaceutical products and pharmaceutical preparations Pharmaceuticals pharma
C22 Manufacture of rubber and plastic products Rubber & plastics plas
C23 Manufacture of other non-metallic mineral products Non-metallic mineral products miner
C24 Manufacture of basic metals Basic metals metal
C25 Manufacture of fabricated metal products, except machinery and equipment Metal products metpr
C26 Manufacture of computer, electronic and optical products Computers, electronic & optical comput
C27 Manufacture of electrical equipment Electrical equipment electreq
C28 Manufacture of machinery and equipment n.e.c. Machinery n.e.c. machin
C29 Manufacture of motor vehicles, trailers and semi-trailers Motor vehicles motor
C30 Manufacture of other transport equipment Other transport equipment trans
C31 Manufacture of furniture Furniture furnit
C32 Other manufacturing Other manufacturing othmanuf
C33 Repair and installation of machinery and equipment Repair of machinery repair
D Electricity, gas, steam and air conditioning supply Electricity and gas electr
D35 Electricity, gas, steam and air conditioning supply Electricity and gas electr
E Water supply; sewerage, waste management and remediation activities Water supply water
E36 Water collection, treatment and supply Water collection watercol
E37 Sewerage Sewerage Sewer
E38 Waste collection, treatment and disposal activities; materials recovery Waste collection wastcol
E39 Remediation activities and other waste management services Remediation activities othwast
F Construction Construction const
F 41 Construction of buildings Construction buildings build
F42 Civil engineering Civil engineering civeng
F43 Specialised construction activities Specialised construction Specconstr
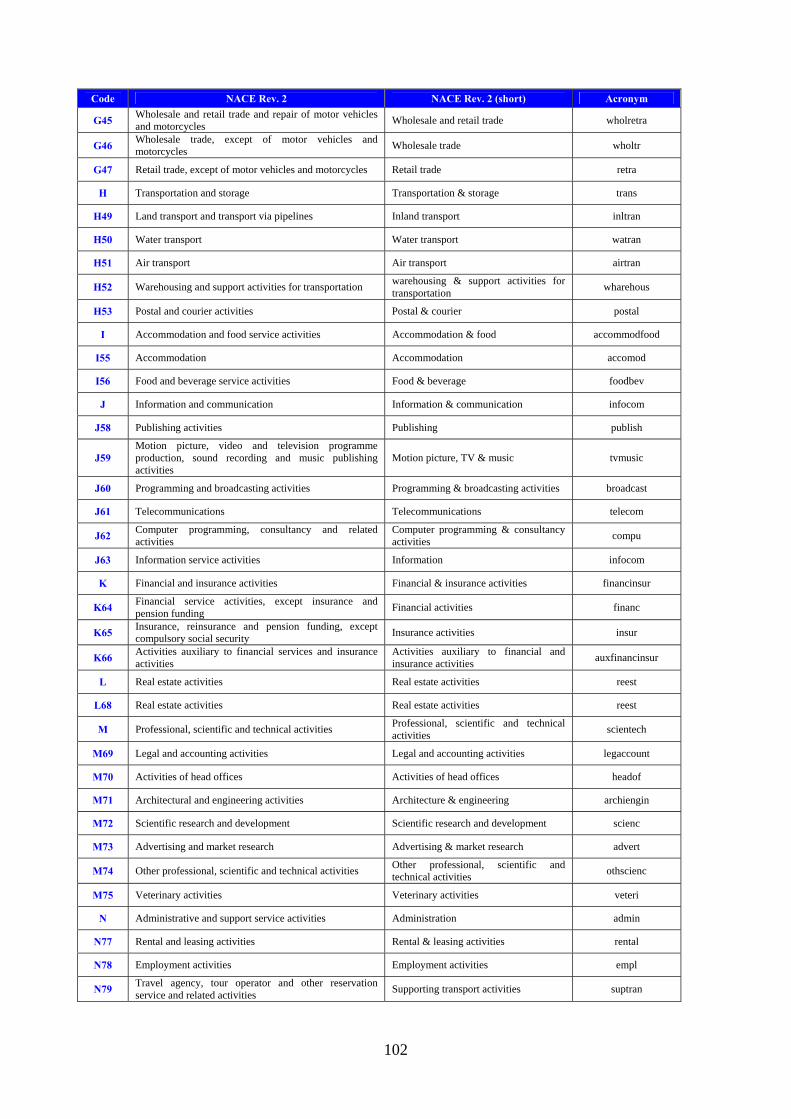
102
Code NACE Rev. 2 NACE Rev. 2 (short) Acronym
G45 Wholesale and retail trade and repair of motor vehicles and motorcycles Wholesale and retail trade wholretra
G46 Wholesale trade, except of motor vehicles and motorcycles Wholesale trade wholtr
G47 Retail trade, except of motor vehicles and motorcycles Retail trade retra
H Transportation and storage Transportation & storage trans
H49 Land transport and transport via pipelines Inland transport inltran
H50 Water transport Water transport watran
H51 Air transport Air transport airtran
H52 Warehousing and support activities for transportation warehousing & support activities for transportation wharehous
H53 Postal and courier activities Postal & courier postal
I Accommodation and food service activities Accommodation & food accommodfood
I55 Accommodation Accommodation accomod
I56 Food and beverage service activities Food & beverage foodbev
J Information and communication Information & communication infocom
J58 Publishing activities Publishing publish
J59 Motion picture, video and television programme production, sound recording and music publishing activities
Motion picture, TV & music tvmusic
J60 Programming and broadcasting activities Programming & broadcasting activities broadcast
J61 Telecommunications Telecommunications telecom
J62 Computer programming, consultancy and related activities
Computer programming & consultancy activities compu
J63 Information service activities Information infocom
K Financial and insurance activities Financial & insurance activities financinsur
K64 Financial service activities, except insurance and pension funding Financial activities financ
K65 Insurance, reinsurance and pension funding, except compulsory social security Insurance activities insur
K66 Activities auxiliary to financial services and insurance activities
Activities auxiliary to financial and insurance activities auxfinancinsur
L Real estate activities Real estate activities reest
L68 Real estate activities Real estate activities reest
M Professional, scientific and technical activities Professional, scientific and technical activities scientech
M69 Legal and accounting activities Legal and accounting activities legaccount
M70 Activities of head offices Activities of head offices headof
M71 Architectural and engineering activities Architecture & engineering archiengin
M72 Scientific research and development Scientific research and development scienc
M73 Advertising and market research Advertising & market research advert
M74 Other professional, scientific and technical activities Other professional, scientific and technical activities othscienc
M75 Veterinary activities Veterinary activities veteri
N Administrative and support service activities Administration admin
N77 Rental and leasing activities Rental & leasing activities rental
N78 Employment activities Employment activities empl
N79 Travel agency, tour operator and other reservation service and related activities Supporting transport activities suptran

103
Code NACE Rev. 2 NACE Rev. 2 (short) Acronym
N80 Security and investigation activities Security & investigation activities secur
N81 Services to buildings and landscape activities Services to buildings servbuild
N82 Office administrative, office support and other business support activities Office support officesup
O Public administration and defence Public administration pubadmin
O84 Public administration and defence Public administration pubadmin
P Education Education educ
Q Human health and social work activities Human health and social work health
Q86 Human health activities Human health activities health
Q87 Residential care activities Residential care activities residcare
Q88 Social work activities without accommodation Social work activities socwork
R Arts, entertainment and recreation Arts & entertainment artentertain
R90 Creative, arts and entertainment activities Creative activities creative
R91 Libraries, archives, museums and other cultural activities Cultural activities cultu
R92 Gambling and betting activities Gambling gambl
R93 Sports activities and amusement and recreation activities Leisure leis
S Other services activities Other services activities othser
S94 Activities of membership organisations Membership organisations memberorg
S95 Repair of computers and personal and household goods Computer and related activities compu
S96 Other personal service activities Other personal service activities othpersser
T Activities of households as employers Households as employers househol
T97 Activities of households as employers of domestic personnel
Households as employers of domestic personnel househol
T98 Undifferentiated goods- and services-producing activities of private households for own use Private households for own use privhousehol
U Activities of extraterritorial organisations and bodies Extraterritorial organisations and bodies extraorg
U99 Activities of extraterritorial organisations and bodies Extraterritorial organisations and bodies extraorg
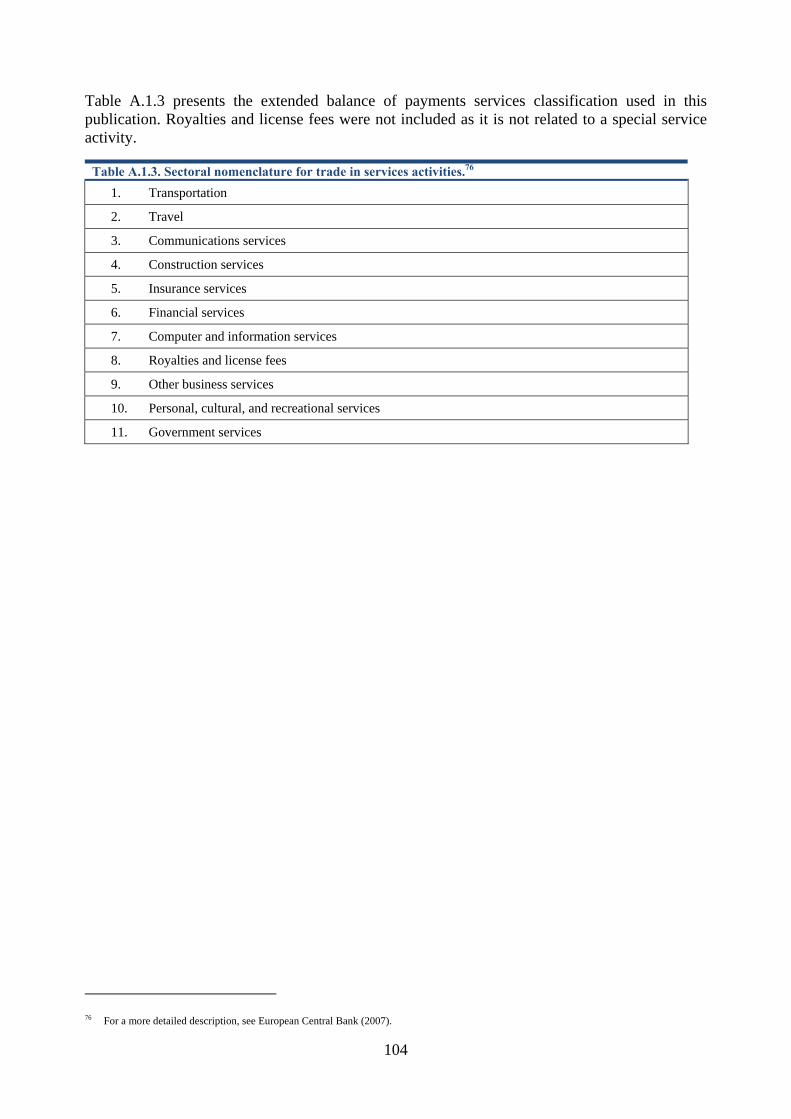
104
Table A.1.3 presents the extended balance of payments services classification used in this publication. Royalties and license fees were not included as it is not related to a special service activity.
Table A.1.3. Sectoral nomenclature for trade in services activities.76 1. Transportation
2. Travel
3. Communications services
4. Construction services
5. Insurance services
6. Financial services
7. Computer and information services
8. Royalties and license fees
9. Other business services
10. Personal, cultural, and recreational services
11. Government services
76 For a more detailed description, see European Central Bank (2007).
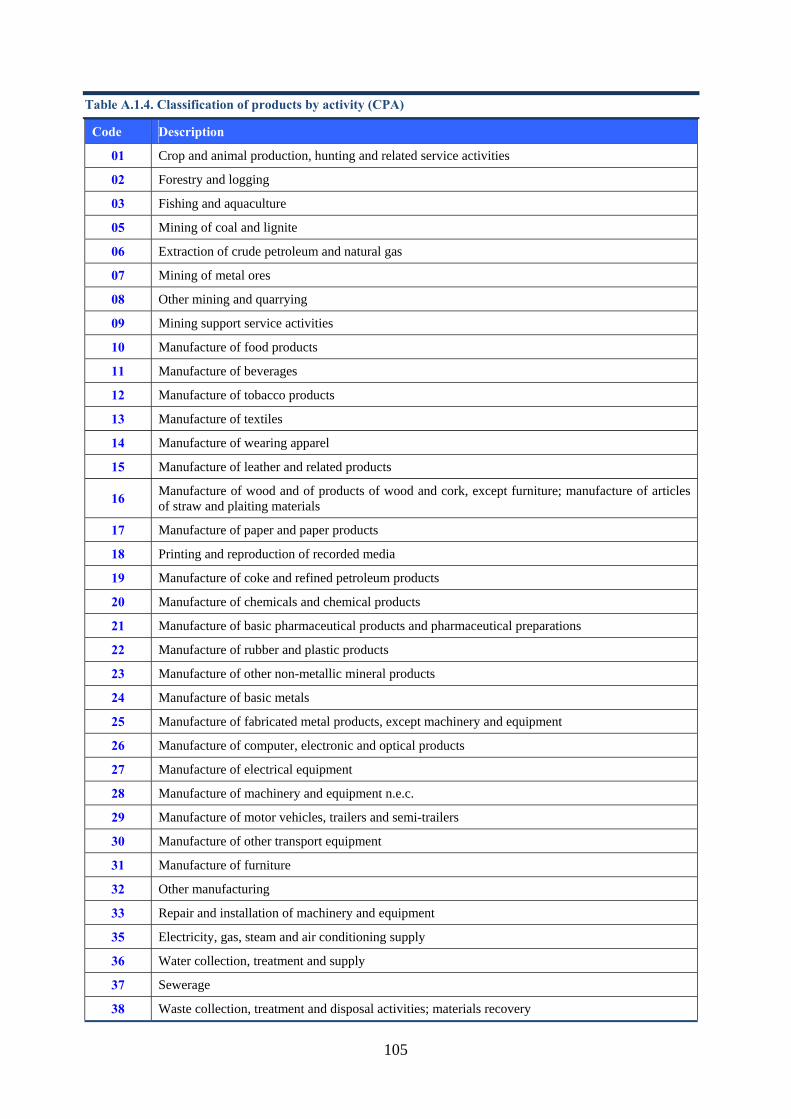
105
Table A.1.4. Classification of products by activity (CPA)
Code Description
01 Crop and animal production, hunting and related service activities
02 Forestry and logging
03 Fishing and aquaculture
05 Mining of coal and lignite
06 Extraction of crude petroleum and natural gas
07 Mining of metal ores
08 Other mining and quarrying
09 Mining support service activities
10 Manufacture of food products
11 Manufacture of beverages
12 Manufacture of tobacco products
13 Manufacture of textiles
14 Manufacture of wearing apparel
15 Manufacture of leather and related products
16 Manufacture of wood and of products of wood and cork, except furniture; manufacture of articles of straw and plaiting materials
17 Manufacture of paper and paper products
18 Printing and reproduction of recorded media
19 Manufacture of coke and refined petroleum products
20 Manufacture of chemicals and chemical products
21 Manufacture of basic pharmaceutical products and pharmaceutical preparations
22 Manufacture of rubber and plastic products
23 Manufacture of other non-metallic mineral products
24 Manufacture of basic metals
25 Manufacture of fabricated metal products, except machinery and equipment
26 Manufacture of computer, electronic and optical products
27 Manufacture of electrical equipment
28 Manufacture of machinery and equipment n.e.c.
29 Manufacture of motor vehicles, trailers and semi-trailers
30 Manufacture of other transport equipment
31 Manufacture of furniture
32 Other manufacturing
33 Repair and installation of machinery and equipment
35 Electricity, gas, steam and air conditioning supply
36 Water collection, treatment and supply
37 Sewerage
38 Waste collection, treatment and disposal activities; materials recovery
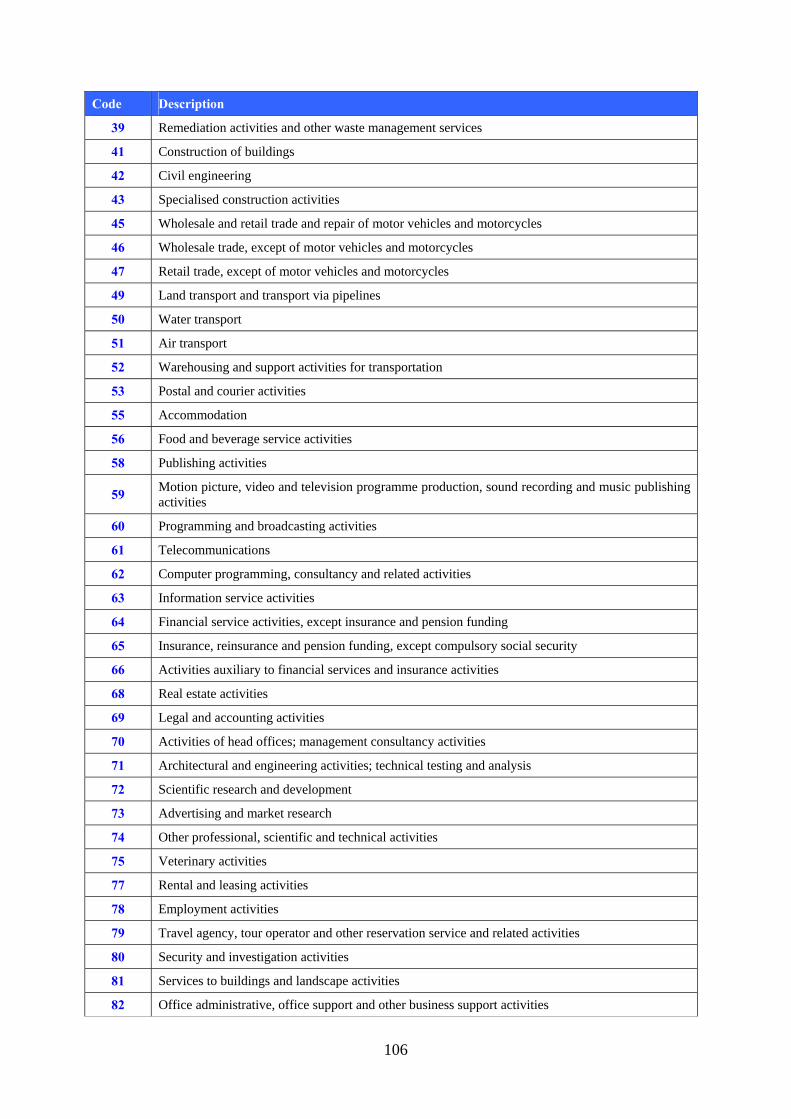
106
Code Description
39 Remediation activities and other waste management services
41 Construction of buildings
42 Civil engineering
43 Specialised construction activities
45 Wholesale and retail trade and repair of motor vehicles and motorcycles
46 Wholesale trade, except of motor vehicles and motorcycles
47 Retail trade, except of motor vehicles and motorcycles
49 Land transport and transport via pipelines
50 Water transport
51 Air transport
52 Warehousing and support activities for transportation
53 Postal and courier activities
55 Accommodation
56 Food and beverage service activities
58 Publishing activities
59 Motion picture, video and television programme production, sound recording and music publishing activities
60 Programming and broadcasting activities
61 Telecommunications
62 Computer programming, consultancy and related activities
63 Information service activities
64 Financial service activities, except insurance and pension funding
65 Insurance, reinsurance and pension funding, except compulsory social security
66 Activities auxiliary to financial services and insurance activities
68 Real estate activities
69 Legal and accounting activities
70 Activities of head offices; management consultancy activities
71 Architectural and engineering activities; technical testing and analysis
72 Scientific research and development
73 Advertising and market research
74 Other professional, scientific and technical activities
75 Veterinary activities
77 Rental and leasing activities
78 Employment activities
79 Travel agency, tour operator and other reservation service and related activities
80 Security and investigation activities
81 Services to buildings and landscape activities
82 Office administrative, office support and other business support activities
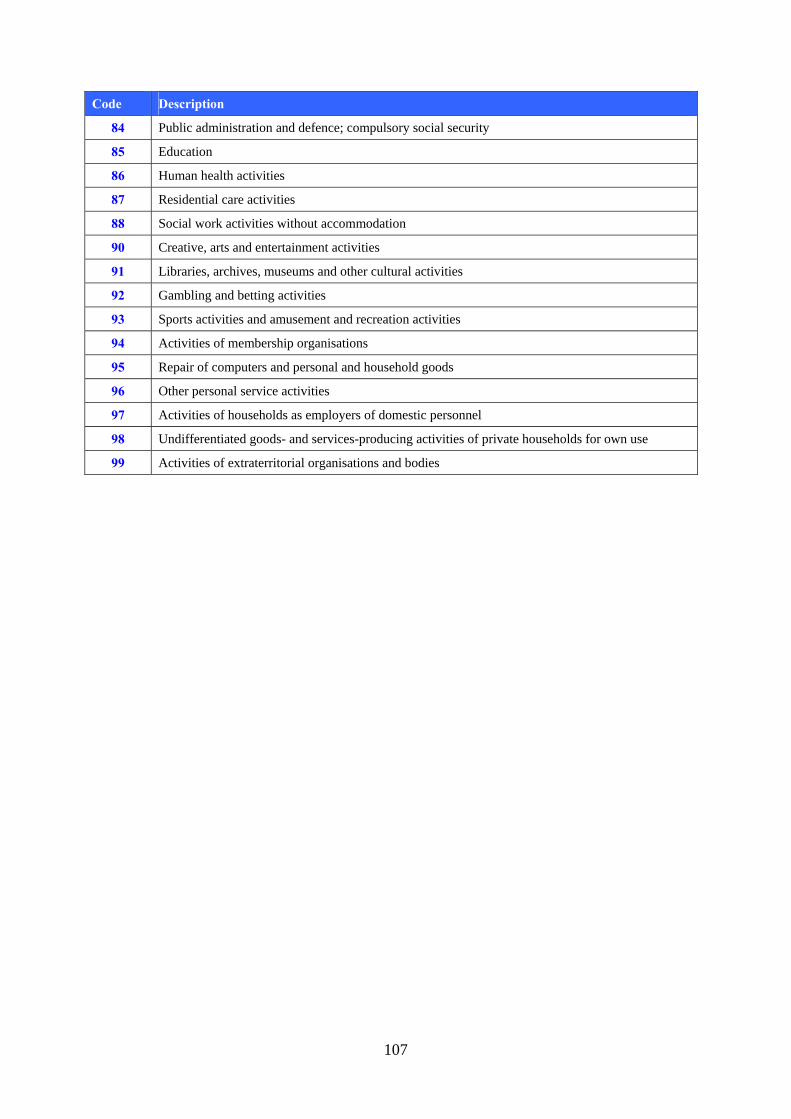
107
Code Description
84 Public administration and defence; compulsory social security
85 Education
86 Human health activities
87 Residential care activities
88 Social work activities without accommodation
90 Creative, arts and entertainment activities
91 Libraries, archives, museums and other cultural activities
92 Gambling and betting activities
93 Sports activities and amusement and recreation activities
94 Activities of membership organisations
95 Repair of computers and personal and household goods
96 Other personal service activities
97 Activities of households as employers of domestic personnel
98 Undifferentiated goods- and services-producing activities of private households for own use
99 Activities of extraterritorial organisations and bodies
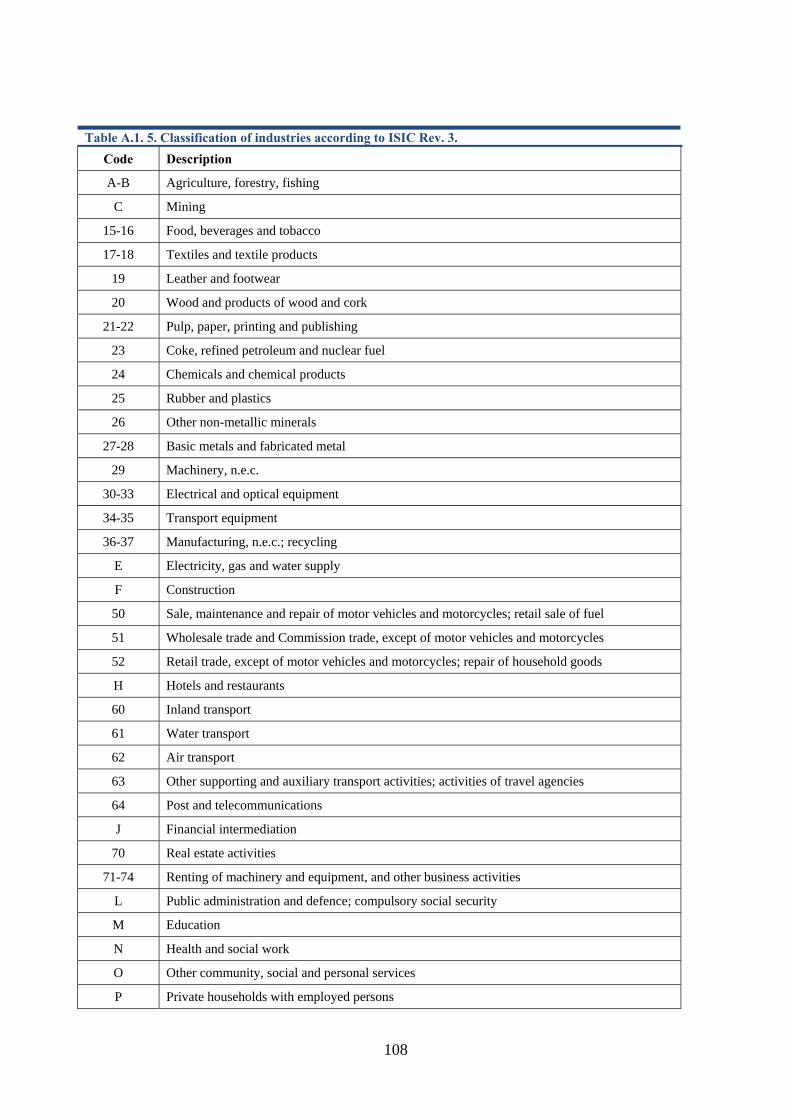
108
Table A.1. 5. Classification of industries according to ISIC Rev. 3. Code Description
A-B Agriculture, forestry, fishing
C Mining
15-16 Food, beverages and tobacco
17-18 Textiles and textile products
19 Leather and footwear
20 Wood and products of wood and cork
21-22 Pulp, paper, printing and publishing
23 Coke, refined petroleum and nuclear fuel
24 Chemicals and chemical products
25 Rubber and plastics
26 Other non-metallic minerals
27-28 Basic metals and fabricated metal
29 Machinery, n.e.c.
30-33 Electrical and optical equipment
34-35 Transport equipment
36-37 Manufacturing, n.e.c.; recycling
E Electricity, gas and water supply
F Construction
50 Sale, maintenance and repair of motor vehicles and motorcycles; retail sale of fuel
51 Wholesale trade and Commission trade, except of motor vehicles and motorcycles
52 Retail trade, except of motor vehicles and motorcycles; repair of household goods
H Hotels and restaurants
60 Inland transport
61 Water transport
62 Air transport
63 Other supporting and auxiliary transport activities; activities of travel agencies
64 Post and telecommunications
J Financial intermediation
70 Real estate activities
71-74 Renting of machinery and equipment, and other business activities
L Public administration and defence; compulsory social security
M Education
N Health and social work
O Other community, social and personal services
P Private households with employed persons
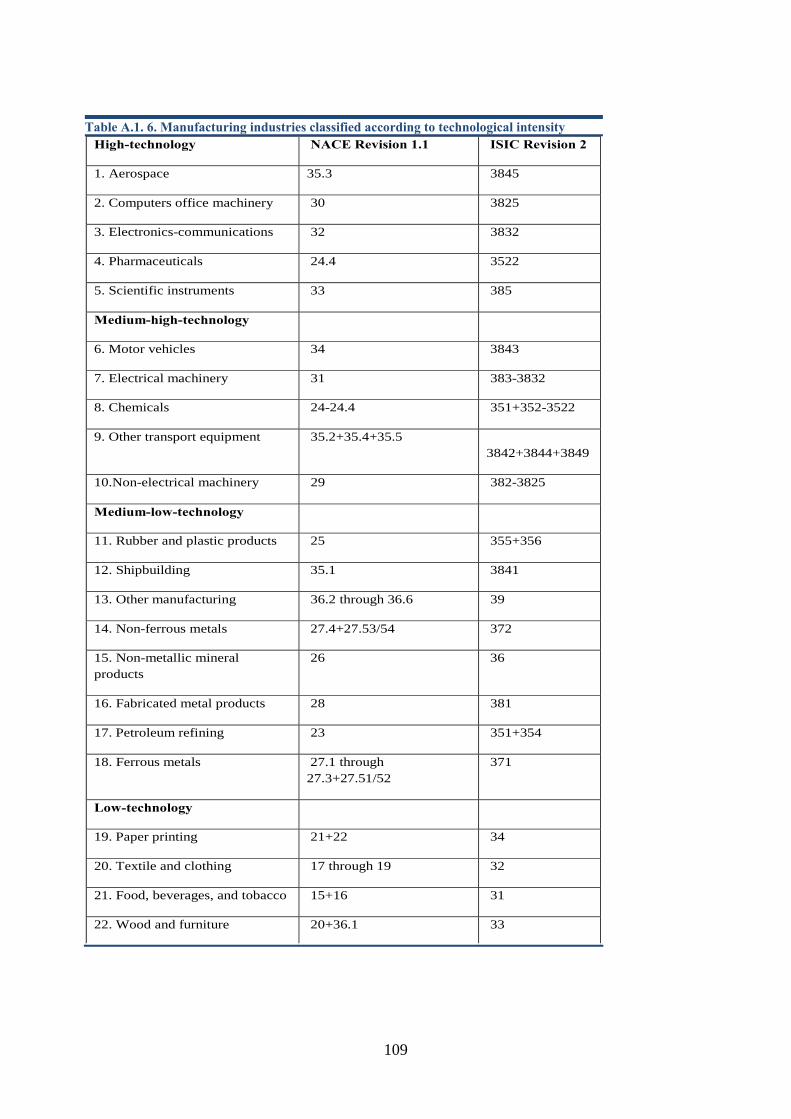
109
Table A.1. 6. Manufacturing industries classified according to technological intensity High-technology NACE Revision 1.1 ISIC Revision 2
1. Aerospace 35.3 3845
2. Computers office machinery 30 3825
3. Electronics-communications 32 3832
4. Pharmaceuticals 24.4 3522
5. Scientific instruments 33 385
Medium-high-technology
6. Motor vehicles 34 3843
7. Electrical machinery 31 383-3832
8. Chemicals 24-24.4 351+352-3522
9. Other transport equipment 35.2+35.4+35.5 3842+3844+3849
10.Non-electrical machinery 29 382-3825
Medium-low-technology
11. Rubber and plastic products 25 355+356
12. Shipbuilding 35.1 3841
13. Other manufacturing 36.2 through 36.6 39
14. Non-ferrous metals 27.4+27.53/54 372
15. Non-metallic mineral products
26 36
16. Fabricated metal products 28 381
17. Petroleum refining 23 351+354
18. Ferrous metals 27.1 through 27.3+27.51/52
371
Low-technology
19. Paper printing 21+22 34
20. Textile and clothing 17 through 19 32
21. Food, beverages, and tobacco 15+16 31
22. Wood and furniture 20+36.1 33
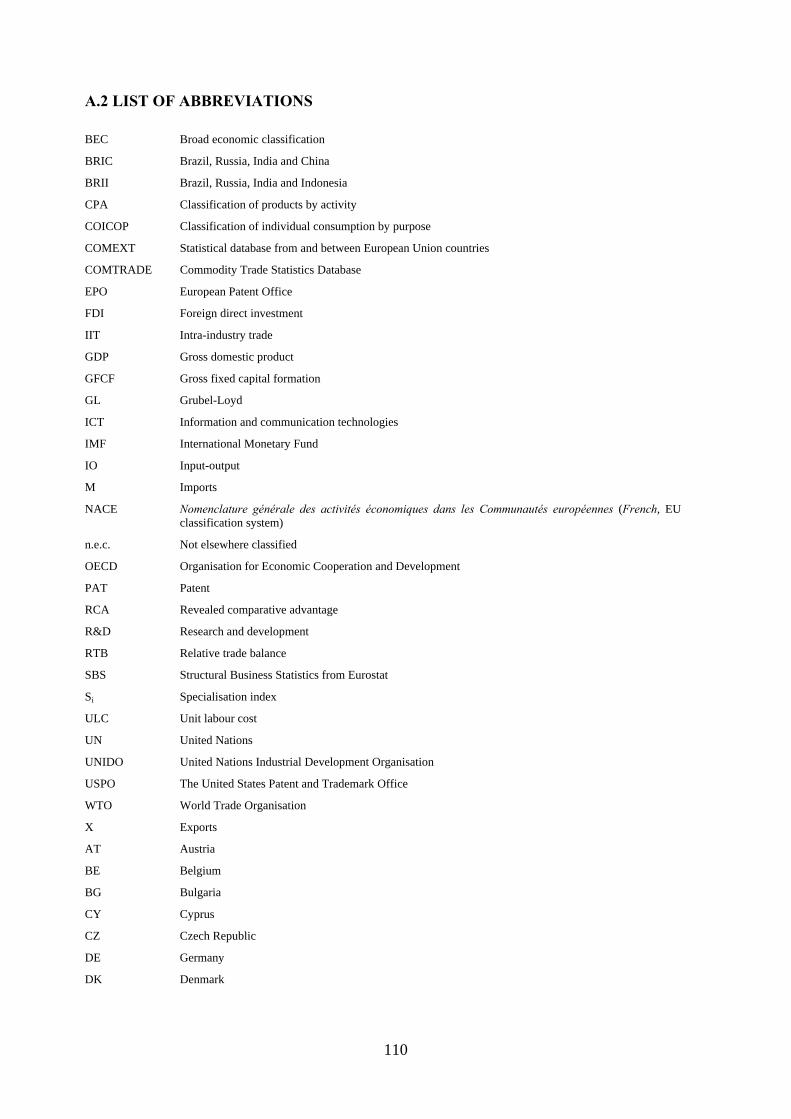
110
A.2 LIST OF ABBREVIATIONS
BEC Broad economic classification
BRIC Brazil, Russia, India and China
BRII Brazil, Russia, India and Indonesia
CPA Classification of products by activity
COICOP Classification of individual consumption by purpose
COMEXT Statistical database from and between European Union countries
COMTRADE Commodity Trade Statistics Database
EPO European Patent Office
FDI Foreign direct investment
IIT Intra-industry trade
GDP Gross domestic product
GFCF Gross fixed capital formation
GL Grubel-Loyd
ICT Information and communication technologies
IMF International Monetary Fund
IO Input-output
M Imports
NACE Nomenclature générale des activités économiques dans les Communautés européennes (French, EU classification system)
n.e.c. Not elsewhere classified
OECD Organisation for Economic Cooperation and Development
PAT Patent
RCA Revealed comparative advantage
R&D Research and development
RTB Relative trade balance
SBS Structural Business Statistics from Eurostat
Si Specialisation index
ULC Unit labour cost
UN United Nations
UNIDO United Nations Industrial Development Organisation
USPO The United States Patent and Trademark Office
WTO World Trade Organisation
X Exports
AT Austria
BE Belgium
BG Bulgaria
CY Cyprus
CZ Czech Republic
DE Germany
DK Denmark
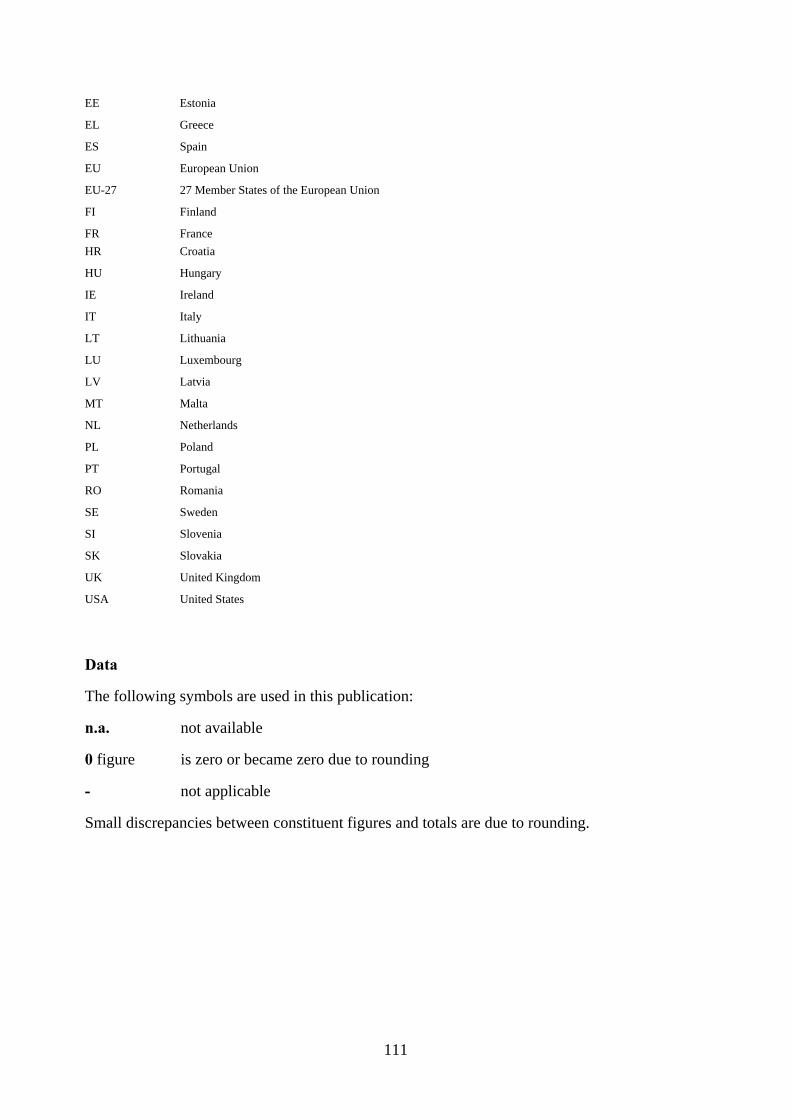
111
Data
The following symbols are used in this publication:
n.a. not available
0 figure is zero or became zero due to rounding
- not applicable
Small discrepancies between constituent figures and totals are due to rounding.
EE Estonia
EL Greece
ES Spain
EU European Union
EU-27 27 Member States of the European Union
FI Finland
FR HR
France Croatia
HU Hungary
IE Ireland
IT Italy
LT Lithuania
LU Luxembourg
LV Latvia
MT Malta
NL Netherlands
PL Poland
PT Portugal
RO Romania
SE Sweden
SI Slovenia
SK Slovakia
UK United Kingdom
USA United States
112
ENTERPRISE & INDUSTRY MAGAZINE The online ENTERPRISE & INDUSTRY MAGAZINE (http://ec.europa.eu/enterprise/magazine/index_en.htm) covers issues related to SMEs, innovation, entrepreneurship, the single market for goods, competitiveness and environment protection, industrial policies across a wide range of sectors, and more. The printed edition of the magazine is published three times a year. You can subscribe online (http://ec.europa.eu/enterprise/magazine/print-edition/subscription/index_en.htm) to receive it in French, German, Spanish or Italian – free of charge by post.
Europe Direct is a service to help you find answers
to your questions about the European Union.
Freephone number (*):
00 800 6 7 8 9 10 11 (*) Certain mobile telephone operators do not allow access to 00 800 numbers or these calls may be billed

EU Industrial Structure Report 2013: Competing in Global Value Chains
The EU Industrial Structure Report 2013 aims to satisfy the increasing need for analysis of EU competitiveness at sectoral level. It analyses the performance of EU industrial and service sectors in terms of productivity and its underlying drivers, the resultant changes to industrial and export specialization, comparative advantages at EU and national level, and the position of the EU in increasingly global value chains. This edition also looks at the impact of the crisis and the difficult recovery on long-term structural trends.
The publication is intended to be used by economists and policy makers in the EU and Member States or anyone outside the EU interested in the structure and performance of EU industries. It may also be useful to academics, journalists, organisations and citizens interested in different aspects of the EU economy from a sectoral perspective.
NB-BL-13-001-EN
-C
ISBN 978-92-79-33972-1
cover image: Fotolia.com
© Yang Yu