european coffee report 2013/14 - stc€¦ · european coffee report 2013/2014 3 introduction this...
TRANSCRIPT

European Coffee Report 2013/14 European chapter and key national data

European Coffee Report 2013/2014 2
CONTENTS
CONTENTS ........................................................................................................................................................ 2
INTRODUCTION ................................................................................................................................................ 3
NOTE ON THE TABLES ...................................................................................................................................... 4
ICO INDICATOR PRICES .................................................................................................................................... 5
GREEN COFFEE STOCKS IN MAJOR EUROPEAN COFFEE PORTS ..................................................................... 6
THE EUROPEAN COFFEE MARKET IN 2013...................................................................................................... 7
KEY NATIONAL DATA ..................................................................................................................................... 15
EU VAT AND EXCISE DUTIES .......................................................................................................................... 23

European Coffee Report 2013/2014 3
INTRODUCTION This is the thirty-fifth issue of the ‘European Coffee Report’. The European Coffee Federation (ECF) continues this series with the report over 2013/14. Since last year we have not been able to present country chapters. It has become increasingly difficult for many national associations to obtain data from their national statistical offices. While we review the situation and reflect on the future format of the European Coffee Report, we hereby present a limited version with the European data and a few key national statistics. The European Coffee Report is available only in electronic format on the ECF website. Disclaimer: this report is for information purposes only. No rights or obligations can be derived from its contents. This report was finalised in July 2014
EUROPEAN COFFEE FEDERATION
EUROPEAN COFFEE FEDERATION (ECF) AVENUE DES NERVIENS 9-31, FIFTH FLOOR 1040 BRUSSELS BELGIUM [E] [email protected] [W] WWW.ECF-COFFEE.ORG

European Coffee Report 2013/2014 4
NOTE ON THE TABLES Bags are bags of 60 kilos Tons are metric tons The recalculation of roasted and soluble coffee uses the conversion factors as approved under the International Coffee Agreement 2007 (ED 2123/11 of 20 October 2011):
from roasted to green: multiply by 1,19
from soluble to green: multiply by 2,6
from green decaffeinated to green: multiply by 1,05 Green coffee equivalent is the sum total of the volume of green, green decaffeinated, roasted and soluble coffee recalculated to green coffee with the above conversion factors. In the notation of figures, the convention of continental Europe is followed:
thousands are separated by a dot (.)
the decimal sign is the comma (,) For large numbers the so-called ‘short scale’ is used: 106 = one million, 109 = one billion, 1012 = one trillion. Abbreviations of currencies are those used for international banking purposes, based on ISO standards. Eurostat import figures may differ from those from national sources Distribution of green coffee imports by types of coffee is based on the following grouping of coffee producing countries applied by the International Coffee Organization:
Arabicas Robustas Colombian Milds Other Milds Brazilian Naturals
Colombia Bolivia Brazil Angola Kenya Burundi Ethiopia Benin Tanzania Costa Rica Paraguay Cameroon Cuba Central African Rep. Dominican Republic Congo Ecuador Congo Democratic Rep. El Salvador Cote d’Ivoire Guatemala Equatorial Guinea Haiti Gabon Honduras Ghana India Guinea Jamaica Indonesia Malawi Liberia Mexico Madagascar Nicaragua Nigeria Panama Philippines Papua New Guinea Sierra Leone Peru Sri Lanka Rwanda Thailand Timor-Leste Togo Venezuela Trinidad and Tobago Zambia Uganda Zimbabwe Vietnam

European Coffee Report 2013/2014 5
ICO INDICATOR PRICES
The calculation of the ICO composite indicator price is weighted as follows (latest: ICO document ICC 105-17 Add 1):
From October 2007 to September 2009: Colombian Milds 14% Other Milds 20% Brazilian Naturals 31% Robustas 35%
From October 2009 to February 2011: Colombian Milds 13% Other Milds 23% Brazilian Naturals 30% Robustas 34%
From March 2011 to September 2013: Colombian Milds 12% Other Milds 23% Brazilian Naturals 31% Robustas 34%
From October 2013: Colombian Milds: 9% Other Milds: 24% Brazilian Naturals: 31% Robustas: 36%
0,00
50,00
100,00
150,00
200,00
250,00
300,00
350,00
ICO Indicator Prices Monthly Averages January 2009 - June 2014 (USD cents/pound)
Composite Inicator Price Colombian Milds Other Milds
Brazilian Naturals Robustas

European Coffee Report 2013/2014 6
GREEN COFFEE STOCKS IN MAJOR EUROPEAN COFFEE PORTS Volumes are in bags of 60 kilos. The ports covered are: Antwerp, Bremen, Hamburg, Genova/Savona Vado, Le Havre and Trieste. Stocks include LIFFE and ICE certified stocks as well as non-exchange stocks. The data are supplied by warehousing and port organisations in the listed port areas and have been compiled by ECF.
0
1.000.000
2.000.000
3.000.000
4.000.000
5.000.000
6.000.000
Total coffee stocks per port (Antwerp, Bremen, Genova, Hamburg, Le Havre and Trieste) May 2013 - May 2014
ANTWERP BREMEN HAMBURG GENOVA/ SAVONA VADO LE HAVRE TRIESTE

European Coffee Report 2013/2014 7
THE EUROPEAN COFFEE MARKET IN 2013
1. IMPORTS AND EXPORTS
The traditional division between ‘Western Europe’ and ‘Central and Eastern Europe’ has changed over time with the increasing EU membership. The terms ‘Western Europe’ and ‘Central and Eastern Europe’ are not strictly defined, and the inclusion of a country in one or the other group has always been somewhat arbitrary. We designate EU plus Norway and Switzerland as ‘Western Europe’. EU data refer to the 28-member European Union. EU membership was changed on 1 July 2013 with the inclusion of Croatia. Eurostat has adapted statistics also for earlier years.
Imports of green coffee into European countries from 2011 to 2013 - in tons and in bags of 60 kilos -
2011 2012 2013
tons bags tons bags tons bags
Austria 34.028 567.138 35.615 593.585 25.261 421.010
Belgium 300.835 5.013.920 285.461 4.757.680 281.592 4.693.195
Bulgaria 20.635 343.915 23.121 385.355 23.373 389.555
Croatia 17.740 295.667 15.983 266.382 16.021 267.010
Cyprus 1.466 24.432 1.442 24.040 1.496 24.937
Czech Republic 17.629 293.813 17.952 299.202 17.299 288.312
Denmark 23.090 384.838 18.152 302.530 15.874 264.570
Estonia 60 1.003 43 712 113 1.875
Finland 63.905 1.065.085 61.328 1.022.135 63.071 1.051.188
France 242.063 4.034.385 242.518 4.041.973 229.767 3.829.450
Germany 1.106.142 18.435.697 1.140.703 19.011.718 1.113.362 18.556.025
Greece 30.099 501.642 33.095 551.585 33.419 556.975
Hungary 6.659 110.980 13.558 225.958 2.799 46.648
Ireland 4.814 80.240 5.167 86.122 4.613 76.890
Italy 465.271 7.754.518 484.499 8.074.988 495.310 8.255.168
Latvia 2.779 46.322 2.620 43.658 2.527 42.123
Lithuania 347 5.787 568 9.458 486 8.103
Luxembourg 889 14.823 844 14.072 664 11.067
Malta 32 537 68 1.125 23 390
Netherlands 77.621 1.293.682 79.667 1.327.787 74.673 1.244.548
Poland 107.020 1.783.670 108.076 1.801.258 86.588 1.443.135
Portugal 47.855 797.585 48.633 810.548 49.865 831.085
Rumania 20.147 335.775 21.223 353.722 21.049 350.822
Slovakia 5.520 91.992 4.871 81.190 5.402 90.035
Slovenia 9.156 152.603 9.214 153.560 11.287 188.118
Spain 240.794 4.013.228 256.036 4.267.262 253.867 4.231.108
Sweden 99.160 1.652.663 102.646 1.710.760 103.743 1.729.055
United Kingdom 141.552 2.359.205 134.482 2.241.367 144.678 2.411.297
EU28 total (incl. intra-EU) 3.087.309 51.455.145 3.147.584 52.459.732 3.078.222 51.303.695
Norway 36.615 610.250 32.889 548.158 34.784 579.739
Switzerland 122.579 2.042.990 120.579 2.009.652 131.020 2.183.658
Western Europe total 3.246.503 54.108.385 3.301.052 55.017.541 3.244.026 54.067.093
Belarus 9.504 158.406 12.039 200.651
Bosnia and Herzegovina 22.396 373.271 23.800 396.671
Georgia 8.826 147.103 9.288 154.795

European Coffee Report 2013/2014 8
Montenegro 8.803 146.714 4.498 74.973
Russian Federation 242.033 4.033.881 246.951 4.115.851
Serbia 35.105 585.079 35.944 599.061
Ukraine 82.304 1.371.741 77.630 1.293.831
Central and Eastern Europe total
408.972 6.816.195 410.150 6.835.832
Europe total 3.655.475 60.924.580 3.711.202 61.853.374 Note: Figures show imports of green coffee, not decaffeinated for the EU, Norway and Switzerland and imports of coffee in all forms for other countries. Sources: Eurostat for EU; Statistics Norway/Statbank for Norway; Swiss Federal Customs Administration/Swiss-Impex for Switzerland; ICO for other countries.
In calendar year 2013 green coffee imports in Western Europe were 54,1 million bags, a drop of 1,7% compared to the 55 million bags in 2012. The Western European market is heavily dominated by the EU. Green coffee imports into the EU28 – including intra-EU trade – decreased by 2,2% from 52,5 million bags in 2012 to 51,3 million bags in 2013. According to ICO data, imports of coffee from selected Central and Eastern European countries in all forms in 2012 (the most recent year available) amounted to 6,8 million bags, virtually unchanged compared to the year before. Please note that the list of countries for Central and Eastern Europe has changed in line with available ICO statistics.
The ‘top 20’ sources of EU28 green coffee imports (excluding intra-EU trade) in 2011, 2012 and 2013 were as follows (listed in the order of 2013 imports):
Imports of green, not decaffeinated coffee into the EU28 (excluding intra-EU trade) by main origins
2011 2012 2013
bags % bags % bags %
Brazil 14.678.162 32,0 12.711.232 27,3 13.395.995 28,6
Vietnam 9.076.962 19,8 11.970.522 25,7 10.974.765 23,5
Honduras 2.515.220 5,5 3.140.923 6,8 2.837.088 6,1
Indonesia 1.992.702 4,3 1.994.040 4,3 2.781.382 5,9
Peru 2.489.995 5,4 2.615.155 5,6 2.478.210 5,3
Colombia 1.788.583 3,9 1.685.947 3,6 2.201.523 4,7
India 2.698.988 5,9 2.351.910 5,1 2.122.855 4,5
Uganda 1.840.773 4,0 1.615.952 3,5 2.116.038 4,5
Ethiopia 1.753.392 3,8 1.605.250 3,5 1.450.562 3,1
China 262.295 0,6 673.545 1,4 723.645 1,5
Guatemala 741.012 1,6 829.125 1,8 631.088 1,3
Tanzania 486.790 1,1 373.255 0,8 583.887 1,2
Mexico 336.063 0,7 467.530 1,0 549.262 1,2
Kenya 461.678 1,0 506.333 1,1 492.303 1,1
El Salvador 762.248 1,7 397.963 0,9 439.675 0,9
Nicaragua 447.790 1,0 405.880 0,9 413.832 0,9
Côte d'Ivoire 345.262 0,8 438.973 0,9 369.317 0,8
Cameroon 480.027 1,0 421.603 0,9 359.180 0,8
Costa Rica 252.667 0,6 293.735 0,6 327.988 0,7
Papua New Guinea 544.548 1,2 523.633 1,1 265.155 0,6
Others 1.952.013 4,3 1.483.657 3,2 1.263.670 2,7
EU28 excl. intra-EU 45.907.170 100,0 46.506.163 100,0 46.777.420 100,0
Source: Eurostat For quite a few years, Brazil and Vietnam have consistently been the top-two suppliers. The third position has changed over time. Traditionally, this fell to Colombia, but changed to Indonesia in 2009 and 2010, to India in 2011, and to Honduras in 2012 and 2013. In 2013 Brazil continued to be the major green coffee supplier to the

European Coffee Report 2013/2014 9
EU with a higher volume of 13,4 million bags (+685.000 bags) and market share (+1,3 percentage points). Vietnam retained its position as second supplier, with a lower volume of close to 12 million bags (-1 million bags) and import share (- 2,3 percentage points). As mentioned, Honduras took third spot again in 2013, albeit with a lower volume: -300.000 bags. The top-five was completed by Peru and Colombia. The last-mentioned country took over the fifth spot from India and seems to be recovering some of the ground lost because of its drop in production. Volume changes that appear small from the EU perspective are significant for the countries concerned. For example, Indonesia experienced a 39% volume increase, Colombia 31%, and Tanzania 56%.
The next two graphs illustrate the changes in the ‘top 5’:
Brazil27%
Vietnam26%Honduras
7%
Peru6%
India5%
Other29%
Top 5 EU28 green coffee suppliers 2012
Brazil29%
Vietnam23%Honduras
6%
Indonesia6%
Peru5%
Other31%
Top 5 EU green coffee suppliers 2013

European Coffee Report 2013/2014 10
Imports by type of coffee for the EU are now included in the European chapter. This is because data for each individual country are becoming less easy to determine. For intra-EU trade, the Eurostat country statistics do not reveal the country of production of green coffee. When arriving from the countries with major coffee ports, the origin may be recorded in the statistics as - say - Germany or Belgium. In many cases the share of the intra-EU trade is so high that no meaningful assessment can be made of the types of coffee imported. In order to have some idea of development in the EU as a whole, the following table has been added to this chapter:
EU28 imports per type of coffee - in % -
2012 2013
Arabicas 62,4 62,8
Brazilian Naturals 30,8 31,8
Colombian Milds 5,5 7,0
Other Milds 26,1 24,0
Robustas 37,4 37,1
Other/Unknown 0,1 0,1
Total 100,0 100,0
Source: Eurostat; due to rounding the total may differ from the sum of the items.
The overall ratio Arabicas/Robustas has shifted fractionally towards Arabicas. Within the Arabica group the increase of Colombian Milds can be attributed mainly to the recovery of production in and exports from Colombia.
The EU is not only an important importer of green coffee, but also a significant exporter of finished products. The EU imports of green decaffeinated coffee and regular roasted coffee are modest compared to the exports of the same products while the imports and the exports of decaffeinated roasted coffee and coffee extracts (soluble coffee) are fairly evenly matched.
EU28 imports and exports of green coffee and (semi)finished products from non-EU origins/to non-EU destinations
- in tons -
2011 2012 2013
Import Export Import Export Import Export
Green coffee (09011100) 2.754.430 19.600 2.790.370 21.717 2.806.565 28.384
Green coffee, decaffeinated (09011200) 3.512 101.370 3.075 97.325 6.210 105.246
Roasted coffee (09012100) 35.488 81.069 38.540 89.022 41.193 98.557
Roasted coffee, decaffeinated (09012200) 3.567 3.485 3.531 2.811 4.019 2.570
Coffee extracts (21011100) 42.002 40.096 51.106 43.664 48.615 45.114 Source: Eurostat Compared to 2012 the re-exports in 2013 of green coffee increased by 30%. The exports of green decaffeinated coffee decreased (8%). Exports of roasted coffee were higher for regular (+11%) but lower for decaffeinated (-9%). Soluble coffee exports increased modestly (+3%). Green decaffeinated imports doubled (+102%) in 2013 compared to 2012. Imports of roasted coffee increased for regular coffee (+7%) as well as for decaffeinated coffee (-14%). Imports of soluble coffee decreased somewhat with 5%.
Looking in some more detail at the EU exports of finished products, in the years 2011-2013 the twenty main destinations of roasted coffee (non-decaffeinated plus decaffeinated), listed according to their ranking in 2013, were:
EU28 exports of roasted coffee (incl. decaf) to non-EU destinations - in tons and % -
2011 2012 2013
tons % tons % tons %
Russian Federation 11.433 13,5 11.463 12,5 14.203 14,0
Ukraine 9.943 11,8 12.107 13,2 13.302 13,2
United States 12.540 14,8 11.040 12,0 10.671 10,6

European Coffee Report 2013/2014 11
Switzerland 8.715 10,3 9.656 10,5 10.566 10,4
Australia 4.290 5,1 6.169 6,7 6.673 6,6
Norway 4.209 5,0 4.924 5,4 5.502 5,4
Canada 3.699 4,4 3.981 4,3 4.009 4,0
Belarus 1.504 1,8 1.917 2,1 2.265 2,2
United Arab Emirates 1.482 1,8 1.825 2,0 2.117 2,1
Turkey 1.805 2,1 1.811 2,0 2.099 2,1
Israel 1.545 1,8 1.677 1,8 1.995 2,0
South Korea 1.536 1,8 1.597 1,7 1.889 1,9
Albania 1.587 1,9 1.672 1,8 1.862 1,8
Japan 1.201 1,4 1.392 1,5 1.803 1,8
Bosnia and Herzegovina 1.556 1,8 1.763 1,9 1.586 1,6
China 1.068 1,3 1.158 1,3 1.383 1,4
South Africa 1.106 1,3 1.226 1,3 1.124 1,1
Iceland 837 1,0 1.124 1,2 1.119 1,1
Ceuta 1.136 1,3 1.336 1,5 1.110 1,1
Serbia 866 1,0 873 1,0 1.024 1,0
Others 12.499 14,8 15.331 16,7 16.960 16,8
Total external trade 84.555 100,0 91.833 100,0 101.127 100,0 Source: Eurostat In 2013 total exports of roasted coffee (including decaffeinated coffee) to non-EU destinations increased by 10,1% in volume compared to the previous year. The Russian Federation overtook Ukraine as the largest non-EU destination. These were followed by two other destinations roughly in the same order of magnitude: the United States and Switzerland.
Regarding the EU exports of soluble coffee (officially: extracts, essences and concentrates of coffee) to non-EU destinations, the total volume increased by 3,3%. In 2013 the three largest clients remained the Russian Federation, Ukraine and Australia. The growing share of the Russian Federation in EU soluble coffee exports (25,6% in 2013) is beginning to approach that of 2010 (33%). South Africa remained the fourth destination in 2013 and Egypt entered the top-5 with an almost tripled volume. Listed according to their 2013 ranking, the ten largest destinations by volume in the three most recent years were:
EU28 exports of soluble coffee to non-EU destinations (HS 21011100) - in tons and % -
2011 2012 2013
tons % tons % tons %
Russian Federation 8.481 21,2 9.897 22,7 11.569 25,6
Ukraine 9.192 22,9 8.970 20,5 8.335 18,5
Australia 3.870 9,7 3.737 8,6 3.923 8,7
South Africa 1.190 3,0 2.709 6,2 2.989 6,6
Egypt 203 0,5 780 1,8 2.131 4,7
United States 2.185 5,4 2.581 5,9 1.772 3,9
Norway 1.301 3,2 1.376 3,2 1.409 3,1
Switzerland 1.735 4,3 1.696 3,9 1.355 3,0
Canada 1.263 3,1 1.019 2,3 1.350 3,0
Israel 1.337 3,3 1.437 3,3 1.251 2,8
Others 9.340 23,3 9.464 21,7 9.029 20,0
Total external trade 40.096 100,0 43.664 100,0 45.114 100,0
Source: Eurostat Several coffee-producing countries have a sizeable production and export of soluble coffee. The following table, giving EU imports of soluble coffee from the five main non-EU origins, illustrates this: all but one of the five largest suppliers are coffee producing countries. Overall volume decreased by almost 5%. In 2013 the top-

European Coffee Report 2013/2014 12
three remained unchanged: Ecuador, Brazil and Switzerland. Colombia and Côte d’Ivoire completed the top 5. India, fourth supplier in 2012, dropped to sixth place in 2013.
EU28 imports of soluble coffee from non-EU origins (HS 21011100) - in tons and % -
2011 2012 2013
tons % tons % tons %
Ecuador 12.705 30,2 17.404 34,1 16.639 34,2
Brazil 9.172 21,8 13.636 26,7 12.010 24,7
Switzerland 5.983 14,2 5.022 9,8 6.223 12,8
Colombia 3.828 9,1 3.291 6,4 3.088 6,4
Côte d’Ivoire 2.131 5,1 3.277 6,4 2.939 6,0
Others 8.183 19,5 8.476 16,6 7.716 15,9
Total external trade 42.002 100,0 51.106 100,0 48.615 100,0 Source: Eurostat
Finally in this section some data on the value of imports and exports of green, roasted and soluble coffee:
Value of EU28 imports and exports of green, roasted and soluble coffee - in mln EUR -
Green Green decaf Roasted Roasted decaf Soluble
Imports 2012 2013 2012 2013 2012 2013 2012 2013 2012 2013
From non-EU origins 7.887 6.032 11 15 1.119 1.225 116 137 422 387
From EU origins 8.925 6.696 174 126 3.989 3.989 237 265 1.877 1.749
Exports 2012 2013 2012 2013 2012 2013 2012 2013 2012 2013
To non-EU destinations 87 94 353 323 682 728 26 23 523 489
To EU destinations 1.363 937 615 532 3.972 4.069 184 202 1.933 1.713 Source: Eurostat These data underline the economic relevance of the coffee sector for the EU food and drinks industry and trade balance. The value of the intra-EU trade of finished coffee products (roasted and soluble coffee) in 2013 was EUR 4,3 billion. In comparison, the value of exports to non-EU destinations of finished coffee products was much smaller, but still represents a relevant contribution to the EU export performance: EUR 1,2 billion. According to ICO data, the share of the EU in the value of imports (C.I.F.)of all forms of coffee by importing countries from all sources in the 12-month period June 2012/July 2013 was close to 66%, making the EU a significant trading partner of the coffee exporting countries.
2. PRODUCTION
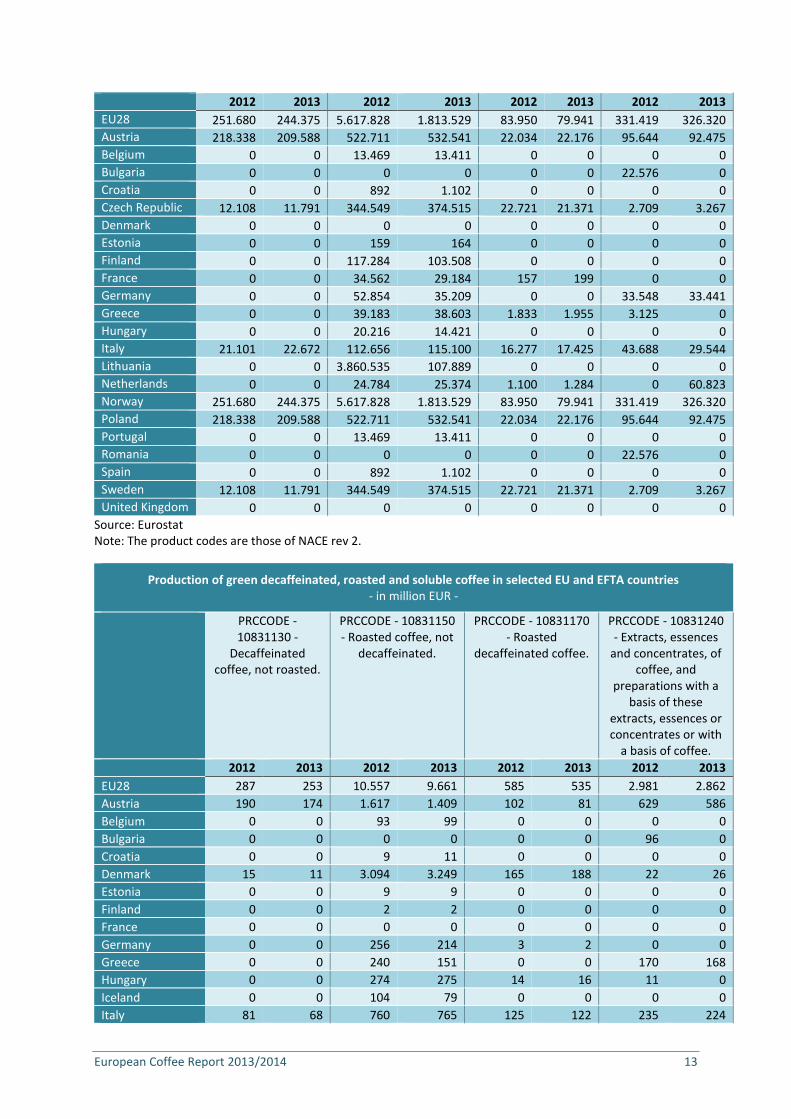
The following table is a summary of the Eurostat Prodcom statistics over calendar years 2012 and 2013, summarising production of decaffeinated green, roasted, roasted decaffeinated and soluble coffee in volume and value.
Production of green decaffeinated, roasted and soluble coffee in selected EU and EFTA countries - in tons -
PRCCODE - 10831130 - Decaffeinated
coffee, not roasted.
PRCCODE - 10831150 - Roasted coffee, not
decaffeinated.
PRCCODE - 10831170 - Roasted
decaffeinated coffee.
PRCCODE - 10831240 - Extracts, essences
and concentrates, of coffee, and
preparations with a basis of these
extracts, essences or concentrates or with
a basis of coffee.
European Coffee Report 2013/2014 13
2012 2013 2012 2013 2012 2013 2012 2013
EU28 251.680 244.375 5.617.828 1.813.529 83.950 79.941 331.419 326.320
Austria 218.338 209.588 522.711 532.541 22.034 22.176 95.644 92.475
Belgium 0 0 13.469 13.411 0 0 0 0
Bulgaria 0 0 0 0 0 0 22.576 0
Croatia 0 0 892 1.102 0 0 0 0
Czech Republic 12.108 11.791 344.549 374.515 22.721 21.371 2.709 3.267
Denmark 0 0 0 0 0 0 0 0
Estonia 0 0 159 164 0 0 0 0
Finland 0 0 117.284 103.508 0 0 0 0
France 0 0 34.562 29.184 157 199 0 0
Germany 0 0 52.854 35.209 0 0 33.548 33.441
Greece 0 0 39.183 38.603 1.833 1.955 3.125 0
Hungary 0 0 20.216 14.421 0 0 0 0
Italy 21.101 22.672 112.656 115.100 16.277 17.425 43.688 29.544
Lithuania 0 0 3.860.535 107.889 0 0 0 0
Netherlands 0 0 24.784 25.374 1.100 1.284 0 60.823
Norway 251.680 244.375 5.617.828 1.813.529 83.950 79.941 331.419 326.320
Poland 218.338 209.588 522.711 532.541 22.034 22.176 95.644 92.475
Portugal 0 0 13.469 13.411 0 0 0 0
Romania 0 0 0 0 0 0 22.576 0
Spain 0 0 892 1.102 0 0 0 0
Sweden 12.108 11.791 344.549 374.515 22.721 21.371 2.709 3.267
United Kingdom 0 0 0 0 0 0 0 0
Source: Eurostat Note: The product codes are those of NACE rev 2.
Production of green decaffeinated, roasted and soluble coffee in selected EU and EFTA countries - in million EUR -
PRCCODE - 10831130 -
Decaffeinated coffee, not roasted.
PRCCODE - 10831150 - Roasted coffee, not
decaffeinated.
PRCCODE - 10831170 - Roasted
decaffeinated coffee.
PRCCODE - 10831240 - Extracts, essences
and concentrates, of coffee, and
preparations with a basis of these
extracts, essences or concentrates or with
a basis of coffee.
2012 2013 2012 2013 2012 2013 2012 2013
EU28 287 253 10.557 9.661 585 535 2.981 2.862
Austria 190 174 1.617 1.409 102 81 629 586
Belgium 0 0 93 99 0 0 0 0
Bulgaria 0 0 0 0 0 0 96 0
Croatia 0 0 9 11 0 0 0 0
Denmark 15 11 3.094 3.249 165 188 22 26
Estonia 0 0 9 9 0 0 0 0
Finland 0 0 2 2 0 0 0 0
France 0 0 0 0 0 0 0 0
Germany 0 0 256 214 3 2 0 0
Greece 0 0 240 151 0 0 170 168
Hungary 0 0 274 275 14 16 11 0
Iceland 0 0 104 79 0 0 0 0
Italy 81 68 760 765 125 122 235 224

European Coffee Report 2013/2014 14
Latvia 0 0 472 439 0 0 0 0
Lithuania 0 0 208 212 11 13 0 854
Netherlands 287 253 10.557 9.661 585 535 2.981 2.862
Norway 190 174 1.617 1.409 102 81 629 586
Poland 0 0 93 99 0 0 0 0
Portugal 0 0 0 0 0 0 96 0
Romania 0 0 9 11 0 0 0 0
Spain 15 11 3.094 3.249 165 188 22 26
Sweden 0 0 9 9 0 0 0 0
United Kingdom 0 0 2 2 0 0 0 0
Source: Eurostat Note: The product codes are those of NACE rev 2. These categories are not the same as those of the Harmonised System used for external trade data. Only those countries for which at least some data are available have been included in the tables. We repeat our caveat: the Prodcom statistics need to be used with care. For a number of countries data are not published for reasons of confidentiality or too high level of estimates. Sometimes only volumes are reported but no values or vice-versa. Absence of a country or ‘zero’ reporting therefore can mean ‘unavailable’ or ‘confidential’ or no production’. Occasionally very different values are reported for similar volumes of production. For all of these reasons we present the data ‘as is’ and refrain from drawing conclusions.

European Coffee Report 2013/2014 15
KEY NATIONAL DATA
1. SUMMARY IMPORT STATISTICS EU MEMBERS 2013 (IN TONS)
Austria
Green Coffee (Incl Decaf)
Roasted Coffee (Incl Decaf)
Extracts, essences
Germany 15.188 Italy 13.689 Brazil 3.781
Vietnam 3.328 Germany 13.349 Germany 341
India 2.881 Greece 11.148 France 312
Brazil 1.678 Romania 2.907 Hungary 209
Indonesia 780 Hungary 679 United Kingdom 199
Others 2.409 Others 1.314 Others 404
Total 26.264 Total 43.086 Total 5.245
Belgium
Green Coffee (Incl Decaf)
Roasted Coffee (Incl Decaf)
Extracts, essences
Brazil 70.258 Germany 10.275 Germany 1.381
Vietnam 49.739 Netherlands 5.611 Brazil 933
Honduras 24.873 France 4.264 Netherlands 816
Peru 19.692 Switzerland 2.004 France 754
Uganda 19.084 Luxembourg 815 Colombia 372
Others 104.393 Others 2.969 Others 541
Total 288.039 Total 25.939 Total 4.797
Bulgaria
Green Coffee (Incl Decaf)
Roasted Coffee (Incl Decaf)
Extracts, essences
Vietnam 5.755 Poland 1.721 Brazil 552
Indonesia 4.716 Italy 1.601 Germany 329
Greece 3.423 Germany 910 Greece 244
Germany 1.884 Romania 499 France 100
Italy 1.666 Slovakia 254 Poland 94
Others 6.032 Others 880 Others 291
Total 23.474 Total 5.865 Total 1.609
Croatia
Green Coffee (Incl Decaf)
Roasted Coffee (Incl Decaf)
Extracts, essences
Brazil 5.640 Italy 1.955 Germany 372
Vietnam 4.393 Slovenia 1.614 Poland 222
India 3.573 Germany 159 Brazil 206
Italy 451 United Kingdom 43 Spain 182
Cameroon 425 Spain 42 Ecuador 116
Others 1.598 Others 74 Others 227
Total 16.079 Total 3.887 Total 1.325

European Coffee Report 2013/2014 16
Cyprus
Green Coffee (Incl Decaf)
Roasted Coffee (Incl Decaf)
Extracts, essences
Brazil 1.462 Greece 171 Greece 911
Greece 20 Germany 158 Germany 83
Ethiopia 18 Italy 63 Austria 71
Mexico 14 United Kingdom 33 Netherlands 60
Netherlands 9 Switzerland 21 Poland 56
Others 3 Others 70 Others 146
Total 1.527 Total 516 Total 1.329
Czech Republic
Green Coffee (Incl Decaf)
Roasted Coffee (Incl Decaf)
Extracts, essences
Brazil 5.010 Germany 5.189 Germany 6.240
Vietnam 2.864 Poland 4.678 United Kingdom 3.277
Honduras 1.680 Austria 1.568 Spain 1.436
Indonesia 1.329 Italy 856 Poland 817
Sierra Leone 886 Slovakia 774 Switzerland 353
Others 5.548 Others 2.360 Others 800
Total 17.316 Total 15.424 Total 12.923
Denmark
Green Coffee (Incl Decaf)
Roasted Coffee (Incl Decaf)
Extracts, essences
Brazil 4.243 Sweden 13.306 Germany 931
Uganda 1.948 Netherlands 7.159 Netherlands 462
Vietnam 1.615 Poland 2.237 France 443
Colombia 1.441 Germany 1.522 United Kingdom 215
Sweden 1.235 Hungary 357 Switzerland 168
Others 6.834 Others 962 Others 654
Total 17.314 Total 25.542 Total 2.872
Estonia
Green Coffee (Incl Decaf)
Roasted Coffee (Incl Decaf)
Extracts, essences
Brazil 40 Finland 3.443 Lithuania 242
Colombia 38 Latvia 640 India 113
Netherlands 21 Lithuania 501 Sweden 40
Lithuania 6 Italy 242 Switzerland 16
Czech Republic 3 Denmark 92 Latvia 15
Others 8 Others 321 Others 24
Total 115 Total 5.238 Total 449
Finland
Green Coffee (Incl Decaf)
Roasted Coffee (Incl Decaf)
Extracts, essences
Brazil 29.928 Netherlands 5.264 Switzerland 840
Colombia 11.754 Sweden 1.439 Germany 237
Honduras 3.720 Germany 1.170 Sweden 217
Kenya 2.413 Italy 193 Hungary 15
Tanzania 2.404 Denmark 186 France 13
Others 12.701 Others 194 Others 22
Total 62.920 Total 8.447 Total 1.345

European Coffee Report 2013/2014 17
France
Green Coffee (Incl Decaf)
Roasted Coffee (Incl Decaf)
Extracts, essences
Brazil 44.665 Switzerland 24.662 Germany 6.389
Vietnam 42.540 Germany 18.457 United Kingdom 2.202
Germany 24.509 Italy 16.035 Belgium 1.744
Belgium 18.906 Belgium 15.378 Spain 1.499
Indonesia 13.918 Czech Republic 5.773 Switzerland 897
Others 93.579 Others 11.986 Others 2.904
Total 238.118 Total 92.291 Total 15.635
Germany
Green Coffee (Incl Decaf)
Roasted Coffee (Incl Decaf)
Extracts, essences
Brazil 321.493 Italy 20.990 Belgium 6.855
Vietnam 221.929 Poland 16.650 Ecuador 5.862
Peru 88.679 Switzerland 7.732 Netherlands 4.087
Honduras 85.005 Netherlands 6.536 United Kingdom 3.920
Indonesia 68.102 United Kingdom 3.843 Poland 2.905
Others 331.167 Others 8.568 Others 8.086
Total 1.116.374 Total 64.319 Total 31.714
Greece
Green Coffee (Incl Decaf)
Roasted Coffee (Incl Decaf)
Extracts, essences
Brazil 19.597 Italy 4.594 Spain 3.519
Vietnam 4.649 Portugal 1.130 Cote d'Ivoire 2.890
India 3.198 Germany 1.103 Germany 2.509
Indonesia 2.042 Belgium 407 Sweden 993
Italy 982 Spain 351 Italy 611
Others 3.165 Others 846 Others 2.052
Total 33.634 Total 8.431 Total 12.573
Hungary
Green Coffee (Incl Decaf)
Roasted Coffee (Incl Decaf)
Extracts, essences
Germany 1.824 Slovakia 8.179 Brazil 1.916
Italy 378 Austria 1.732 Spain 1.695
Netherlands 275 Germany 1.152 Poland 583
India 80 Italy 814 Germany 556
Vietnam 56 Netherlands 274 India 148
Others 186 Others 831 Others 365
Total 2.799 Total 12.981 Total 5.263
Ireland
Green Coffee (Incl Decaf)
Roasted Coffee (Incl Decaf)
Extracts, essences
United Kingdom 1.291 United Kingdom 1.719 United Kingdom 2.157
Brazil 730 Germany 687 Netherlands 81
Nicaragua 511 United States 86 Germany 42
Netherlands 422 Lithuania 69 Poland 9
Colombia 366 Belgium 63 China 0
Others 1.399 Others 132 Others 0
Total 4.718 Total 2.756 Total 2.289

European Coffee Report 2013/2014 18
Italy
Green Coffee (Incl Decaf)
Roasted Coffee (Incl Decaf)
Extracts, essences
Brazil 152.082 France 3.629 Spain 1.213
Vietnam 108.656 Germany 2.603 Germany 671
India 64.229 Switzerland 1.583 France 489
Indonesia 37.785 Spain 1.007 Switzerland 445
Uganda 28.478 Portugal 519 Netherlands 186
Others 114.442 Others 1.589 Others 793
Total 505.672 Total 10.929 Total 3.798
Latvia
Green Coffee (Incl Decaf)
Roasted Coffee (Incl Decaf)
Extracts, essences
Germany 743 Lithuania 1.603 Lithuania 553
Belgium 545 Poland 925 India 267
Poland 478 Estonia 603 Poland 148
Italy 194 Sweden 585 Cyprus 27
Netherlands 172 Italy 286 Spain 17
Others 397 Others 592 Others 48
Total 2.528 Total 4.594 Total 1.060
Lithuania
Green Coffee (Incl Decaf)
Roasted Coffee (Incl Decaf)
Extracts, essences
Germany 288 Germany 4.381 Germany 380
Brazil 78 Latvia 1.787 Brazil 341
Italy 33 Italy 1.606 Poland 188
Poland 28 Estonia 1.606 India 135
Netherlands 23 Finland 1.301 United Kingdom 117
Others 40 Others 3.523 Others 234
Total 489 Total 14.204 Total 1.395
Luxembourg
Green Coffee (Incl Decaf)
Roasted Coffee (Incl Decaf)
Extracts, essences
Belgium 444 Germany 9.241 Belgium 187
Germany 132 Belgium 1.647 Germany 126
France 43 Netherlands 1.136 Austria 5
Italy 36 Italy 1.081 Netherlands 3
Colombia 18 Poland 646 France 2
Others 5 Others 610 Others 0
Total 677 Total 14.362 Total 322
Malta
Green Coffee (Incl Decaf)
Roasted Coffee (Incl Decaf)
Extracts, essences
Switzerland 19 Italy 188 United Kingdom 212
Italy 4 United Kingdom 39 Netherlands 91
Belgium 3 Spain 17 Italy 26
United Kingdom 0 Poland 4 France 8
Andorra 0 Portugal 2 Spain 1
Others 0 Others 4 Others 0
Total 26 Total 253 Total 338

European Coffee Report 2013/2014 19
Netherlands
Green Coffee (Incl Decaf)
Roasted Coffee (Incl Decaf)
Extracts, essences
Vietnam 13.223 Germany 19.289 France 1.088
Belgium 12.210 Luxembourg 2.669 Brazil 749
Germany 7.624 Italy 2.176 Ecuador 606
Honduras 5.571 Poland 1.870 Belgium 436
Others 17.991 Others 3.201 Others 1.342
Total 74.780 Total 48.781 Total 6.222
Vietnam 13.223 Germany 19.289 France 1.088
Poland
Green Coffee (Incl Decaf)
Roasted Coffee (Incl Decaf)
Extracts, essences
Germany 65.661 Germany 29.932 Germany 8.057
Vietnam 8.869 United Kingdom 2.271 Ecuador 7.518
Uganda 3.169 Czech Republic 1.274 United Kingdom 2.359
Brazil 3.062 Denmark 1.181 Spain 2.043
Laos 1.463 Italy 930 Israel 1.051
Others 4.746 Others 3.701 Others 3.188
Total 86.971 Total 39.289 Total 24.215
Portugal
Green Coffee (Incl Decaf)
Roasted Coffee (Incl Decaf)
Extracts, essences
Vietnam 13.214 Spain 2.446 Spain 1.130
Spain 6.699 Italy 2.266 Germany 465
Brazil 6.382 France 1.381 France 149
Uganda 5.564 Germany 809 United Kingdom 88
Cameroon 3.704 Switzerland 87 Italy 15
Others 16.573 Others 111 Others 9
Total 52.136 Total 7.099 Total 1.856
Romania
Green Coffee (Incl Decaf)
Roasted Coffee (Incl Decaf)
Extracts, essences
Vietnam 8.206 Germany 9.087 Brazil 1.230
Brazil 1.806 Bulgaria 3.962 Spain 505
Uganda 1.742 Italy 3.819 Germany 503
Greece 1.695 Poland 2.336 Poland 491
Colombia 1.517 Netherlands 819 Vietnam 394
Others 6.313 Others 2.153 Others 833
Total 21.279 Total 22.175 Total 3.956
Slovakia
Green Coffee (Incl Decaf)
Roasted Coffee (Incl Decaf)
Extracts, essences
Belgium 1.942 Germany 16.658 Czech Republic 1.377
Germany 1.178 Hungary 4.561 Poland 583
Hungary 665 Poland 3.267 Germany 410
Vietnam 565 Czech Republic 2.495 Spain 356
Czech Republic 253 Austria 987 Switzerland 228
Others 906 Others 2.953 Others 104
Total 5.510 Total 30.921 Total 3.058

European Coffee Report 2013/2014 20
Slovenia
Green Coffee (Incl Decaf)
Roasted Coffee (Incl Decaf)
Extracts, essences
Brazil 4.595 Hungary 1.607 Germany 233
India 2.159 Italy 1.240 Austria 63
Vietnam 2.026 Croatia 274 Italy 31
Italy 777 Austria 238 Switzerland 13
Tanzania 445 Bosnia and Herzegovina 212 Poland 12
Others 1.323 Others 340 Others 32
Total 11.324 Total 3.910 Total 384
Spain
Green Coffee (Incl Decaf)
Roasted Coffee (Incl Decaf)
Extracts, essences
Vietnam 128.719 Germany 5.110 France 4.884
Brazil 38.388 Portugal 5.080 Germany 2.225
Germany 29.446 France 1.719 Romania 1.123
Colombia 13.297 Italy 1.673 United Kingdom 755
Uganda 10.586 Netherlands 740 Netherlands 444
Others 45.225 Others 1.133 Others 741
Total 265.661 Total 15.455 Total 10.171
Sweden
Green Coffee (Incl Decaf)
Roasted Coffee (Incl Decaf)
Extracts, essences
Brazil 41.723 Netherlands 6.380 Switzerland 1.191
Peru 11.283 Germany 2.743 Germany 813
Colombia 7.627 Denmark 1.355 Czech Republic 763
Honduras 6.180 Switzerland 997 United Kingdom 302
Kenya 5.623 Italy 951 France 224
Others 31.604 Others 2.238 Others 634
Total 104.040 Total 14.663 Total 3.927
United Kingdom
Green Coffee (Incl Decaf)
Roasted Coffee (Incl Decaf)
Extracts, essences
Vietnam 38.787 Italy 7.019 Germany 9.196
Brazil 30.999 Germany 5.777 Brazil 3.502
Indonesia 22.483 Netherlands 5.399 Netherlands 2.602
Colombia 18.366 Belgium 2.058 Ecuador 2.319
Honduras 6.911 Ireland 1.809 France 1.553
Others 30.090 Others 4.454 Others 7.566
Total 147.637 Total 26.516 Total 26.738
Source: Eurostat Note: data are in tons and refer to imports from all origins

European Coffee Report 2013/2014 21
2. CONSUMPTION
Total coffee consumption - in 1000 bags of 60 kg -
July/June
2010/11 2011/12 2012/13
European Union 40.700 40.575 41.630
Austria 1.035 1.153 1.250
Belgium 933 866 1.436
Bulgaria 369 361 419
Croatia 373 367 361
Cyprus 76 80 88
Czech Republic 528 644 662
Denmark 781 789 812
Estonia 80 91 127
Finland 1.110 1.045 1.082
France 5.704 6.023 5.605
Germany 9.057 9.088 8.777
Greece 1.043 1.009 1.116
Hungary 234 254 239
Ireland 162 205 196
Italy 5.808 5.571 5.695
Latvia 103 97 102
Lithuania 207 182 182
Luxembourg 231 202 211
Malta 14 18 22
Netherlands 1.121 1.185 1.682
Poland 2.151 1.963 1.794
Portugal 824 850 858
Romania 759 808 873
Slovakia 341 317 197
Slovenia 211 193 188
Spain 3.094 3.328 3.624
Sweden 1.196 1.104 1.211
United Kingdom 3.157 2.782 2.822
Source: ICO Note: the ICO calculates consumption as disappearance: imports minus re-exports plus or minus stock changes.
Per capita coffee consumption - in kg -
2010 2011 2012
European Union 4,89 4,82 4,84
Austria 6,45 7,95 9,00
Belgium 4,78 5,09 4,96
Bulgaria 3,21 2,94 3,10
Croatia 5,11 5,10 5,02
Cyprus 4,03 4,33 4,53
Czech Republic 2,67 3,24 3,86
Denmark 8,72 8,20 8,60
Estonia 4,84 3,10 4,84
Finland 12,07 12,17 12,00
France 5,42 5,63 5,43
Germany 6,72 6,85 6,40
Greece 5,37 5,52 5,81

European Coffee Report 2013/2014 22
Hungary 2,25 1,08 1,52
Ireland 2,15 2,37 2,80
Italy 5,73 5,62 5,63
Latvia 2,83 2,93 2,95
Lithuania 4,35 3,55 3,66
Luxembourg 27,33 24,59 24,40
Malta 1,72 2,17 2,93
Netherlands 4,86 3,27 4,96
Poland 3,39 3,20 3,04
Portugal 4,60 4,82 4,73
Romania 2,18 2,21 2,34
Slovakia 3,72 4,28 2,21
Slovenia 6,00 6,05 5,36
Spain 4,20 4,06 4,41
Sweden 7,81 7,14 7,31
United Kingdom 3,03 2,81 2,80 Source: ICO Note: the ICO calculates consumption as disappearance: imports minus re-exports plus or minus stock changes. This may lead to statistical anomalies, as is illustrated by the unrealistically high per capita consumption data of Luxembourg. This is likely caused by important volumes of roasted and instant coffee purchased by tourists and border region inhabitants. Such purchases are not included in the export statistics, thus giving a false impression of the volume consumed locally.

European Coffee Report 2013/2014 23
EU VAT AND EXCISE DUTIES
ROASTED, NON-DECAFFEINATED COFFEE, UNLESS INDICATED OTHERWISE
COUNTRY VAT% EXCISE DUTIES
Austria 10
Belgium 6 Green: EUR 0,1983/kg; roasted 0,2479/kg; soluble 0,6941/kg
Bulgaria 20
Croatia 25
Roasted: HRK 6 /kg net weight; extracts, essences and concentrates: HRK 20/kg net weight (for coffee extracts: HRK 20/kg dry matter); preparations of coffee, coffee contained in the final product: HRK 20/kg net weight
Cyprus 5
Czech Republic 15
Denmark 25 Green: DKK 5,95/kg; roasted: DKK 7,14/kg; soluble DKK 15,47/kg
Estonia 20
Finland 14
France 5,5
Germany 7
Roasted: EUR 2,19/kg; soluble EUR 4,78/kg; products containing roasted or instant: ranging from EUR 0,12 to EUR 3,83 per kg depending on roasted or instant coffee content
Greece 13
Hungary 27
Ireland 0
Italy 10
Latvia 21 EUR 142,29 per 100 kilograms of pure coffee
Lithuania 21
Luxembourg 3
Malta 0
Netherlands 6
Poland 23
Portugal 23
Romania 24 Green: EUR 153/ton; roasted: EUR 225/ton; soluble: EUR 900/ton
Slovakia 20
Slovenia 9,5
Spain 10
Sweden 12
United Kingdom 0 Source: DG External Trade Export Helpdesk website as at 29 July 2014
Up-to-date information on VAT and excise duties can be found on the European Commission Export Helpdesk website http://exporthelp.europa.eu/. Please note that Indirect taxes’ rates and exemptions are established by the Member States’ legislation, therefore full accuracy can only be obtained by consulting official sources. No responsibility can be accepted by the ECF for any inadvertent errors or omissions.