euro area bank lending survey - january 2012
TRANSCRIPT

1 February 2012
THE EURO AREA BANK LENDING SURVEY
- JANUARY 2012 -
1. Overview of the results
The results reported in the January 2012 bank lending survey relate to changes during the last quarter of 2011 and expectations of changes in the first quarter of 2012. The survey was conducted between 19 December 2011 and 9 January 2012 on a sample of 124 euro area banks. The response rate was 100%.
Three ad hoc questions were added to the questionnaire for the January 2012 survey round. The ad hoc question dealing with the impact of the financial turmoil on access to wholesale funding was amended to also include retail funding. In addition, a question on the impact of the sovereign debt crisis and a question on the likely impact of ongoing regulatory changes on credit standards were added.
According to the January 2012 bank lending survey (BLS), the net tightening of credit standards by euro area banks surged in the fourth quarter of 2011 for credit standards on both loans to non-financial corporations (35% in net terms, up from 16% in the preceding quarter) and loans to households for house purchase (29%, up from 18% in the preceding quarter), and to a lesser extent on consumer credit (13%, up from 10% in the preceding quarter). Looking ahead, euro area banks expect a further net tightening of credit standards, albeit at a slower pace than in the fourth quarter of 2011.
Participating banks explained the surge in the net tightening of credit standards by the adverse combination of a weakening economic outlook and the euro area sovereign debt crisis, which continued to undermine the banking sector’s financial position. Increased market scrutiny of bank solvency risks in the fourth quarter of 2011 is likely to have exacerbated banks’ funding difficulties. As a result, euro area banks significantly tightened credit terms and conditions and raised interest rates on loans to non-financial corporations (NFCs) and households.
Turning to indicators of credit demand, euro area banks reported a net decline in the demand for loans to NFCs in the last quarter of 2011, albeit at a slower pace than in the previous quarter (-5% in net terms, compared with -8% in the third quarter of 2011) and above expectations at the time of the previous survey round. In particular, banks indicated a sharp fall in the financing needs of firms for their fixed

2
investment. The net demand for loans to households declined further in the fourth quarter of 2011, broadly in line with previous expectations and with actual figures quoted in the previous survey round (-27% in the last quarter of 2011, compared with -24% in the preceding quarter for loans for house purchase, and -16% in the last quarter of 2011, compared with -15% in the third quarter for consumer credit).
For the first quarter of 2012 banks expect a sizeable drop in the net demand for housing loans, while the decline in net demand for consumer credit is expected to remain in the same range.
The January 2012 BLS round included three additional ad hoc questions. The replies to these are summarised below:
• Regarding bank access to market funding, euro area banks reported a slight easing of access to wholesale funding in the last quarter of 2011, compared with replies from the previous survey, although still a large number of euro area banks (in net terms) continued to report significant difficulties. This relative improvement was more visible for access to debt securities markets and securitisation activity than for access to money markets. Looking ahead, banks across the euro area overall expect some improvement in access to wholesale market funding in the next quarter, potentially reflecting the anticipated effectiveness of non-standard measures taken by the ECB. The access to retail funding was also seen as a challenging issue at the end of 2011, albeit less so, on average, than access to wholesale funding. For the next quarter banks anticipate a mild improvement.
• On the impact of the sovereign debt crisis, banks indicated that sovereign market tensions led to a substantial deterioration of their funding conditions through balance sheet and liquidity management constraints, as well as through other, more indirect, channels. Banks also reported that vulnerabilities to risks stemming from the sovereign crisis have significantly contributed to the tightening of credit standards, although some parts of the banking system were in a position to shield their lending policies from the impact of the crisis.
• Finally, on the impact of new regulatory requirements on banks’ lending policies, banks’ replies point to a further adjustment of risk-weighted assets and capital positions during the second half of 2011, to a larger extent than in the first half of the year and more than envisaged in July 2011. The same applies for the impact of regulation on the net tightening of credit standards. In the coming months banks indicate a further intensification of balance sheet adjustments and related constraints on the bank lending channel.

3
General notes
The bank lending survey is addressed to senior loan officers of a representative sample of euro area banks.1 Its main purpose is to enhance the understanding of bank lending behaviour in the euro area.2
The questions distinguish between three categories of loan: loans or credit lines to enterprises; loans to households for house purchase; and consumer credit and other lending to households. For all three categories, questions are posed on credit standards for approving loans; credit terms and conditions; and credit demand and the factors affecting it.
The responses to questions related to credit standards are analysed in this report by focusing on the difference (“net percentage”) between the share of banks reporting that credit standards have been tightened and the share of banks reporting that they have been eased. A positive net percentage indicates that a larger proportion of banks have tightened credit standards (“net tightening”), whereas a negative net percentage indicates that a larger proportion of banks have eased credit standards (“net easing”). Likewise, the term “net demand” refers to the difference between the share of banks reporting an increase in loan demand and the share of banks reporting a decline. Net demand will therefore be positive if a larger proportion of banks have reported an increase in loan demand, whereas negative net demand indicates that a larger proportion of banks have reported a decline in loan demand.
In addition, an alternative measure of the responses to questions related to changes in credit standards and net demand is included. This measure is the weighted difference (“diffusion index”) between the share of banks reporting that credit standards have been tightened and the share of banks reporting that they have been eased. Likewise, regarding the demand for loans, the diffusion index refers to the weighted difference between the share of banks reporting an increase in loan demand and the share of banks reporting a decline. The diffusion index is constructed in the following way: lenders who have answered “considerably” are given a weight twice as high (score of 1) as lenders having answered “somewhat” (score of 0.5). The interpretation of the diffusion indices follows the same logic as the interpretation of net percentages.
The survey questions are phrased in terms of changes over the past three months (in this case in the last quarter of 2011) or expectations of changes over the next three months (i.e. in the first quarter of 2012).
Detailed tables and charts on the responses are provided in Annex 1 for the individual questions and in Annex 2 for the ad hoc questions.
A copy of the questionnaire can be found at: http://www.ecb.europa.eu/stats/money/surveys/lend/html/index.en.html.
1 The sample group of banks participating in the survey comprises 124 banks, representing all of the euro area countries, and
takes into account the characteristics of their respective national banking structures. Since the banks in the sample group differ considerably in size, the survey results are weighted according to the national shares in total outstanding euro area lending to euro area residents.
2 For more detailed information on the bank lending survey, see the ECB press release of 21 November 2002 entitled “Bank lending survey for the euro area”, the article entitled “A bank lending survey for the euro area” in the April 2003 issue of the ECB’s Monthly Bulletin and J. Berg et al. (2005), “The bank lending survey for the euro area”, ECB Occasional Paper No 23.

4
2. Developments in credit standards and net demand for loans
2.1 Enterprises
Surge in the tightening of credit standards on loans to enterprises
According to the January 2012 BLS, the net tightening of banks’ credit standards on loans to non-financial corporations surged in the last quarter of 2011, to 35% from 16% in the preceding quarter (see Chart 1). This is higher than anticipated by survey participants at the time of the previous survey round (when it stood at 22%). In net terms, the tightening of credit standards appears to have been applied more to large firms than to small and medium-sized enterprises (SMEs). The net tightening of credit standards on loans to SMEs rose from 14% in the third quarter of 2011 to 28% in the last quarter of the year, and that of credit standards on loans to large firms increased from 19% to 44%. Compared with the previous survey round, the net tightening of credit standards increased for both long-term and short-term loans. However, the tightening of credit conditions was still reported to be applied more often on long-term loans (42% in the last quarter of 2011, compared with 20% in the preceding quarter) than on short-term ones (24% in the last quarter of 2011, compared with 11% in the preceding quarter). Chart 1. Changes in credit standards applied to the approval of loans or credit lines to enterprises (net percentages of banks contributing to tightening standards)
-10
0
10
20
30
40
50
10Q
1
10Q
4
11Q
3
10Q
1
10Q
4
11Q
3
10Q
2
11Q
1
11Q
4
10Q
3
11Q
2
10Q
1
10Q
4
11Q
3
-10
0
10
20
30
40
50actual expected
FACTORS CONTRIBUTING TO TIGHTENING CREDIT STANDARDS
Access to market
financing
Costs related to
bank's capital
position
Expectat. general
economic activity
Bank's liquidity position
Notes: “Realised” values refer to changes that have occurred, while “expected” values are changes anticipated by banks. Net percentages are defined as the difference between the sum of the percentages of banks responding “tightened considerably” and “tightened somewhat” and the sum of the percentages of banks responding “eased somewhat” and “eased considerably”. The net percentages for responses to questions related to the factors are defined as the difference between the percentage of banks reporting that the given factor contributed to a tightening and the percentage reporting that it contributed to an easing.
Turning to the factors explaining the developments in credit standards, the net percentage of euro area banks reporting that cost of funds and balance sheet constraints had a bearing on their credit standards

5
policy increased markedly. Specifically, in the last quarter of 2011, 28% of euro area banks reported difficulties in accessing market financing, compared with 20% in the previous survey round (see Chart 1). This situation led to challenging liquidity positions: in net terms, 27% of euro area banks reported their liquidity position to have a role in explaining tightened credit standards in the last quarter of 2011, compared with 14% in the previous quarter. Recapitalisation pressures also increased as 20% of euro area banks in net terms suggested that their capital position required credit standards to be tightened in the last quarter of 2011 (compared with 12% in the previous quarter).
Balance sheet and funding constraints were compounded by a deteriorating economic environment. Weaker expectations concerning the economic outlook contributed to tighter credit standards for 40% of euro area banks in net terms, after 16% in the previous survey round. The contribution of collateral risk to the tightening of credit standards, which had been mildly positive during most of 2011, increased substantially in the last quarter of the year, surging to 19% in net terms, compared with 8% in the previous quarter. Finally, counterbalancing factors, like competitive pressure, which generally works in the direction of an easing of credit standards, were reported to stay broadly neutral in the last quarter of 2011, as in the previous quarter. Chart 2. Changes in terms and conditions for approving loans or credit lines to enterprises (net percentages of banks reporting tightening terms and conditions)
-10
0
10
20
30
40
50
10Q
1
10Q
3
11Q
1
11Q
3
10Q
1
10Q
3
11Q
1
11Q
3
10Q
1
10Q
3
11Q
1
11Q
3
10Q
1
10Q
3
11Q
1
11Q
3
Collateral requirements
Margins on average loans
Non-interest rate charges
Margins on riskier loans
Note: See the notes to Chart 1.
In line with the net percentage change in credit standards, all terms and conditions reported by euro area banks were tightened in the last quarter of 2011, by even more than in the previous quarter. In particular, 44% of euro area banks – in net terms – revised up their margins on average loans (compared with 18% in the preceding quarter) and 49% of the banks did so on riskier loans (compared with 31% in the third quarter of 2011). The increase in the net tightening of other terms and conditions (i.e. non-interest rate charges, collateral requirements, and loan size and maturity) was also significant for the first time in the

6
year, possibly indicating that quantitative credit restrictions may come into play. For example, 18% of euro area banks reported having increased their non-interest rate charges in the last quarter of 2011 (compared with 4% in the third quarter) and 25% of euro area banks reported having reduced the size of their loans (after 8% in the third quarter).
Looking forward, on balance, euro area banks expect a further increase in the tightening of credit standards on loans to NFCs in the first quarter of 2012 (to 25% in net terms). This expected further tightening is seen as affecting more large firms (34%) than SMEs (19%) as well as primarily long-term loans.
Continued decrease in the demand for loans to non-financial corporations
In the last quarter of 2011 net demand for loans to NFCs was reported to have declined further, albeit to a lesser extent than in the previous quarter (-5%, compared with -8% in the third quarter of 2011; see Chart 3).
Chart 3. Changes in demand for loans or credit lines to enterprises (net percentages of banks reporting a positive contribution to demand)
-50
-30
-10
10
30
50
70
10Q
1
10Q
4
11Q
3
10Q
1
10Q
4
11Q
3
10Q
2
11Q
1
11Q
4
10Q
3
11Q
2
10Q
1
10Q
4
11Q
3
-50
-30
-10
10
30
50
70actual expected
FACTORS CONTRIBUTING TO INCREASING DEMAND
Inventories and working
capital
Fixed investm.
Issuance of debt
securities
Internal financing
Notes: “Realised” values refer to changes that have occurred, while “expected” values are changes anticipated by banks. Net percentages for the questions on demand for loans are defined as the difference between the sum of the percentages of banks responding “increased considerably” and “increased somewhat” and the sum of the percentages of banks responding “decreased somewhat” and “decreased considerably”. The net percentages for responses to questions related to the factors are defined as the difference between the percentage of banks reporting that the given factor contributed to increasing demand and the percentage reporting that it contributed to decreasing demand.
This decline was driven by a moderation in the pace of economic activity, as reflected by the slightly negative contribution of financing needs linked to inventories and working capital. More importantly, the need to finance fixed investment fell sharply (-20% in net terms, compared with -6% in the previous quarter). The decline in net demand for loans was more pronounced for SMEs in the last quarter of 2011 (-7% in net terms, compared with -3% in the previous survey round), while net loan demand was broadly

7
unchanged for large firms (at -2% in net terms, compared with -3% in the previous quarter). Euro area banks also reported that NFCs may have turned more towards alternative sources of finance, which could explain the decline in demand for loans. In particular, 9% of euro area banks, in net terms, reported that the use of internal financing dampened demand for loans, compared with 3% in the previous survey round.
2.2 Households
Further net tightening of credit standards on loans to households for house purchase
Euro area banks also reported a significant increase in the net tightening of credit standards on loans to households for house purchase. The net percentage of banks reporting a tightening of credit standards on mortgage loans stood at 29% in the last quarter of 2011, up from 18% in the preceding quarter and higher than expected. Similarly to corporate loans, increased cost of market funding and balance sheet constraints were put forward as key driving factors behind these developments (see Chart 4). Chart 4. Changes in credit standards applied to the approval of loans to households for house purchase (net percentages of banks reporting a contribution to tightening credit standards)
-10
0
10
20
30
40
10Q
1
10Q
4
11Q
3
10Q
1
10Q
4
11Q
3
10Q
2
11Q
1
11Q
4
10Q
3
11Q
2
10Q
1
10Q
4
11Q
3
-10
0
10
20
30
40actual expected
FACTORS CONTRIBUTING TO TIGHTENING CREDIT STANDARDS
Competition from
other banks
Costs of funds and balance
sheet constraints
Housing market
prospects
Expectat. General
economic activity
Note: See the notes to Chart 1.
In addition, the deterioration in economic prospects was reported to contribute significantly to the increase in the net tightening of credit standards on mortgage loans, albeit less so than pure supply-side factors. More importantly, the increase in the perception of risk at the euro area level appears to be driven by the deterioration in the general economic outlook. Competitive pressures, either from banks or alternative sources of finance, were reported to remain broadly neutral.
Unlike in the last survey round, the reported increase in the tightening of overall credit standards on loans to households for house purchase did translate into a substantial further tightening of price terms and conditions. The net percentage of euro area banks reporting an increase in margins on average loans

8
increased from 10% in the third quarter of 2011 to 29% in the fourth quarter of 2011. Similarly, the net percentage of euro area banks reporting having raised their margins on riskier loans in the fourth quarter of 2011 stood at 33%, up from 14% in the third quarter of 2011. In addition, most non-price terms and conditions were generally reported to have been tightened.
Looking ahead, 24% of euro area banks (in net terms) expect a tightening of credit standards on loans to households for house purchase in the first quarter of 2012, somewhat lower than currently reported for the last quarter of the year.
Substantial contraction of housing loan demand
Euro area banks also reported a strong further contraction in the demand for mortgage loans in the last quarter of the year (-27% in net terms, from -24% in the preceding quarter; see Chart 5). This was mainly on account of a clear deterioration of housing market prospects (-27%, compared with -22% in the previous survey round) and weakening consumer confidence (-34%, compared with -24% in the preceding quarter). Financing needs for non-housing consumption, household savings and competitive pressures were also reported to contribute negatively to the demand for mortgage loans, although in proportions similar to in the previous survey round. Looking ahead, 44% of euro area banks (in net terms) expect demand for loans for house purchase to decline further in the first quarter of 2012. Chart 5. Changes in demand for loans to households (net percentages of banks reporting a positive contribution to demand)
-50
-30
-10
10
30
50
10Q
1
10Q
210
Q3
10Q
4
11Q
111
Q2
11Q
3
11Q
4
12Q
110
Q1
10Q
2
10Q
3
10Q
411
Q1
11Q
2
11Q
311
Q4
12Q
1
-50
-30
-10
10
30
50actual expected
Consumer creditHouse purchase
Note: See the notes to Chart 3.
9
Tightening of credit standards also applied to consumer loans
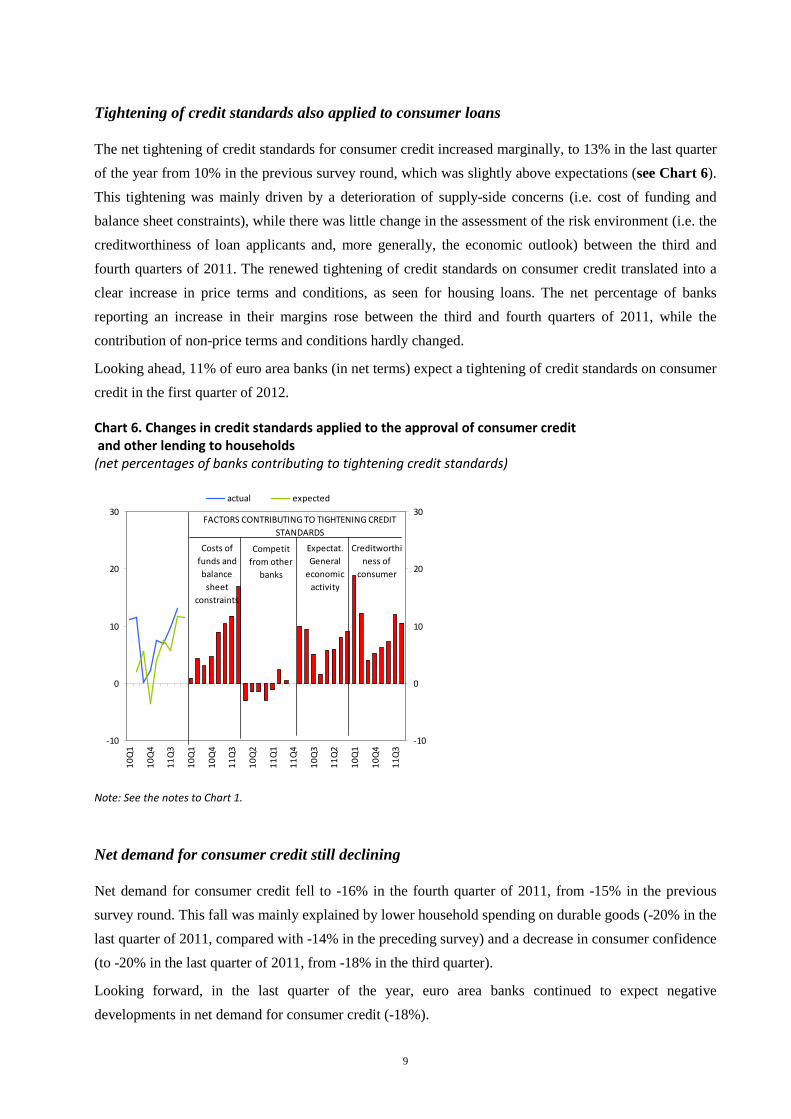
The net tightening of credit standards for consumer credit increased marginally, to 13% in the last quarter of the year from 10% in the previous survey round, which was slightly above expectations (see Chart 6). This tightening was mainly driven by a deterioration of supply-side concerns (i.e. cost of funding and balance sheet constraints), while there was little change in the assessment of the risk environment (i.e. the creditworthiness of loan applicants and, more generally, the economic outlook) between the third and fourth quarters of 2011. The renewed tightening of credit standards on consumer credit translated into a clear increase in price terms and conditions, as seen for housing loans. The net percentage of banks reporting an increase in their margins rose between the third and fourth quarters of 2011, while the contribution of non-price terms and conditions hardly changed.
Looking ahead, 11% of euro area banks (in net terms) expect a tightening of credit standards on consumer credit in the first quarter of 2012. Chart 6. Changes in credit standards applied to the approval of consumer credit and other lending to households (net percentages of banks contributing to tightening credit standards)
-10
0
10
20
30
10Q
1
10Q
4
11Q
3
10Q
1
10Q
4
11Q
3
10Q
2
11Q
1
11Q
4
10Q
3
11Q
2
10Q
1
10Q
4
11Q
3
-10
0
10
20
30actual expected
FACTORS CONTRIBUTING TO TIGHTENING CREDIT STANDARDS
Competit from other
banks
Costs of funds and balance
sheet constraints
Creditworthiness of
consumer
Expectat. General
economic activity
Note: See the notes to Chart 1.
Net demand for consumer credit still declining
Net demand for consumer credit fell to -16% in the fourth quarter of 2011, from -15% in the previous survey round. This fall was mainly explained by lower household spending on durable goods (-20% in the last quarter of 2011, compared with -14% in the preceding survey) and a decrease in consumer confidence (to -20% in the last quarter of 2011, from -18% in the third quarter).
Looking forward, in the last quarter of the year, euro area banks continued to expect negative developments in net demand for consumer credit (-18%).

10
3. Ad hoc questions
Slight easing of access to money and debt securities markets
As in previous surveys, the January 2012 survey questionnaire included a question which aimed at assessing the extent to which financial market tensions affected banks’ credit standards for loans and credit lines to enterprises and households and the extent to which they were expected to affect them in the next three months. For the first time, the question also aimed to assess access to retail funding.3
Chart 7. Banks’ assessment of funding conditions and the ability to transfer risk (net percentages of banks reporting deteriorated market access)
-10
0
10
20
30
40
50
60
70
80
Shor
t-te
rm d
epos
it
Long
-ter
m d
epos
its a
ndot
her r
etai
l fun
ding
inst
rum
ents
Very
shor
t-te
rm m
oney
mar
ket
Shor
t-te
rm m
oney
mar
ket
Shor
t-te
rm d
ebt s
ecur
ities
Med
ium
to lo
ng-t
erm
deb
tse
curit
ies
Secu
ritisa
tion
of c
orpo
rate
loan
s
Secu
ritisa
tion
of lo
ans f
orho
use
purc
hase
Abili
ty to
tran
sfer
cre
dit r
iskof
f bal
ance
shee
t
Q2 2011 Q3 2011 Q4 2011 Q1 2012 expected
Retail funding Wholesale funding
Note: The net percentages are defined as the difference between the sum of the percentages for “deteriorated considerably” and “deteriorated somewhat” and the sum of the percentages for “eased somewhat” and “eased considerably".
Euro area banks reported a slight easing of access to wholesale funding in the fourth quarter of 2011, compared with replies from the previous survey round (see Chart 7). This was particularly true for security issuance conditions, securitisation and banks’ ability to transfer risk off their balance sheets. However, despite the slight easing of access to money markets, between 40% and 50% of euro area banks in net terms continued to report difficulties. With the intensification of the sovereign debt crisis, money market financing has become more difficult in all euro area countries.
3 The results shown are calculated as a percentage of the number of banks which did not reply “not applicable”.

11
Looking ahead, euro area banks expect a stabilisation in the conditions of access to wholesale market funding and less of a deterioration in securitisation conditions in the first quarter of 2012. The exacerbation of bank funding problems against the background of challenging sovereign debt markets led the ECB to take a number of non-standard measures to alleviate funding constraints and ensure an adequate functioning of the bank lending channel. This may partly explain banks’ expectations regarding their access to funding for the first quarter of 2012.
A new feature of this ad hoc question is to also consider access to retail funding, both short and long-term. In this regard, euro area banks also pointed to a challenging environment in the last quarter of 2011, albeit less so, on average, than for access to wholesale funding.
Evidence of sovereign debt crisis spillover to the banking sector
One of the most immediate effects of the euro area sovereign debt crisis has clearly been on the banking sector. In principle, bank funding conditions can be primarily affected through two direct channels:
• First, the lower quality of government debt weakens bank balance sheets, increasing their riskiness as counterparties and, in turn, making funding more costly and more difficult to obtain.
• Second, higher sovereign debt risk reduces the value of collateral that banks can use to raise wholesale funding.
Beyond this, other factors may relate sovereign market tensions to bank funding conditions. Notably, the weaker financial positions of governments have lowered the funding benefits that banks derive from implicit or explicit government guarantees. Financial contagion from sovereign to sovereign or from sovereign to banks may also be at play.
Replies from the January survey show that all channels have operated to a broadly similar extent. About 30% of euro area banks (in net terms) attributed the deterioration of funding conditions to the sovereign debt crisis through one channel or the other, with the effect of reduced collateral value being the reason most often quoted. Interestingly, when asked how the sovereign debt crisis translated into credit standards policy, a smaller number of banks (in net terms) acknowledged an impact on the tightening of their credit standards (about 23% on average for loans to NFCs and about 15% for loans to households; see Chart 8).
This suggests that banks have managed to shield somewhat their lending policy from the liquidity constraints associated with the sovereign debt crisis. However, these constraints have not been the only source of tightening for lending policies.

12
Chart 8. Impact of the sovereign debt crisis on banks’ funding conditions and credit standards (net percentages of banks reporting an impact on funding conditions or on the tightening of credit standards)
0
5
10
15
20
25
30
35
Dire
ctex
posu
re to
sove
reig
n
Valu
e of
sove
reig
nco
llate
ral
Oth
er e
ffect
s
Dire
ctex
posu
re to
sove
reig
n
Valu
e of
sove
reig
nco
llate
ral
Oth
er e
ffect
s
Dire
ctex
posu
re to
sove
reig
n
Valu
e of
sove
reig
nco
llate
ral
Oth
er e
ffect
s
Dire
ctex
posu
re to
sove
reig
n
Valu
e of
sove
reig
nco
llate
ral
Oth
er e
ffect
s
Loans or credit l ines toenterprises
Loans to households forhouse purchase
Loans to households forconsumer credit and other
lending
Impact on your bank'sfunding conditions
Impact on your bank's credit standards
Note: The net percentages are defined as the difference between the sum of the percentages for “contributed to a deterioration of funding conditions/tightening of credit standards considerably” and “somewhat” and the sum of the percentages for “contributed to an easing of funding conditions/easing of credit standards somewhat” and “considerably".
Evidence of gradual adjustment to new regulations and requirements
Finally, the January 2012 survey questionnaire included in addition two ad hoc questions which aimed at assessing the extent to which new regulatory requirements affected banks’ lending policies via the potential impact on their capital position and the credit standards that they apply to loans. These new requirements cover the regulations set out in “Basel III” agreements4, the recent measures of the European Banking Authority5 or any other specific national regulations concerning banks’ capital ratios that have recently been approved or are expected to be approved in the near future.
According to banks’ replies,6 34% of respondents (in net terms) reported a decline in their risk-weighted assets during the past six months and 43% expect a further decline during the next six months in order to comply with new regulatory requirements (see Chart 9). This adjustment process was and is expected to concern more specifically riskier (as opposed to average) loans. As regards the effect of regulation on
4 See Basel III: A global regulatory framework for more resilient banks and banking systems, Basel Committee on Banking
Supervision, Bank for International Settlements, 16 December 2010 (http://www.bis.org/publ/bcbs189.pdf). 5 The EBA set capital targets for 70 European banks, consisting of two parts to be implemented by June 2012. The first part is
a temporary capital buffer against sovereign exposures at market prices as of September 2011. The second part consists in raising core Tier 1 capital ratios to 9%, while avoiding excessive deleveraging.
6 The results shown are calculated as a percentage of the number of banks which did not reply “not applicable”.

13
their capital position, on balance, 42% of the banks noted an increase in their capital position during the past six months and 34% expect some increase in the first half of 2012. In the last six months the rise in banks’ capital positions was achieved more by the issuance of new shares than via retained earnings.
Compared with survey replies to the same question in the July 2011 BLS, it is clear that the process of adjusting to new regulatory requirements via the reduction of risk-weighted assets accelerated somewhat during the second half of 2011 and is expected to accelerate further in the first half of 2012, while the adjustment of capital positions is ongoing. It is interesting to compare what is reported to have been implemented in the second half of 2011 with what was expected in July. Euro area banks actually had to implement more risk-weighted asset shedding and strengthen their capital position more than initially expected.
Chart 9. Impact of Basel III and other regulatory requirements on banks’ risk-weighted assets and capital position (net percentages of banks)
-50-40
-30-20
-100
10
2030
4050
aver
age
loan
sris
kier
loan
s
Reta
ined
earn
ings
Shar
eiss
uanc
e
aver
age
loan
sris
kier
loan
s
Reta
ined
earn
ings
Shar
eiss
uanc
e
aver
age
loan
sris
kier
loan
s
Reta
ined
earn
ings
Shar
eiss
uanc
eRisk-weighted
assets, of whichCapital position,
of whichRisk-weighted
assets, of whichCapital position,
of whichRisk-weighted
assets, of whichCapital position,
of which
2011H1 2011H2 2012H1
July 2011 BLS Jan 2012 BLS
Note: The net percentages are defined as the difference between the sum of the percentages for “increased considerably” and “increased somewhat” and the sum of the percentages for “decreased somewhat” and “decreased considerably". July 2011 BLS replies for the second half of 2011 correspond to expectations.
Looking ahead, a higher net percentage of euro area banks plan on reducing their risk-weighted assets in 2012 than did in 2011. They also expect to continue to reinforce their capital base, although less so (in net terms) than in 2011.
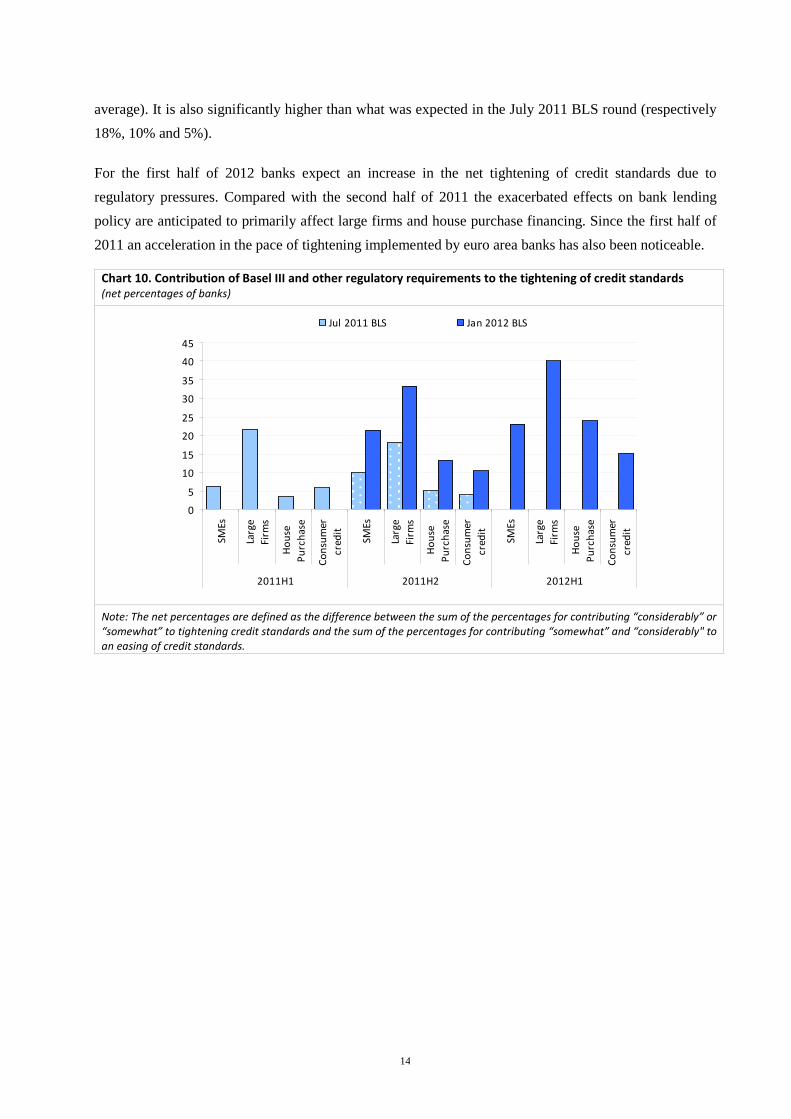
Chart 10 shows euro area banks’ replies regarding the impact of new regulatory requirements on their lending policies and the tightening of their credit standards. In net terms, a third of euro area banks acknowledged that they have tightened their credit standards on loans to large enterprises as a result of adjustments to new regulations and capital requirements. This is more than the net percentage of banks tightening their credit standards on loans to SMEs (21% on average) or on loans to households (11% on
14
average). It is also significantly higher than what was expected in the July 2011 BLS round (respectively 18%, 10% and 5%).
For the first half of 2012 banks expect an increase in the net tightening of credit standards due to regulatory pressures. Compared with the second half of 2011 the exacerbated effects on bank lending policy are anticipated to primarily affect large firms and house purchase financing. Since the first half of 2011 an acceleration in the pace of tightening implemented by euro area banks has also been noticeable.
Chart 10. Contribution of Basel III and other regulatory requirements to the tightening of credit standards (net percentages of banks)
0
5
10
15
20
25
30
35
40
45
SMEs
Larg
eFi
rms
Hous
ePu
rcha
se
Cons
umer
cred
it
SMEs
Larg
eFi
rms
Hous
ePu
rcha
se
Cons
umer
cred
it
SMEs
Larg
eFi
rms
Hous
ePu
rcha
se
Cons
umer
cred
it
2011H1 2011H2 2012H1
Jul 2011 BLS Jan 2012 BLS
Note: The net percentages are defined as the difference between the sum of the percentages for contributing “considerably” or “somewhat” to tightening credit standards and the sum of the percentages for contributing “somewhat” and “considerably" to an easing of credit standards.

15
ANNEX I: RESULTS FOR THE INDIVIDUAL QUESTIONS
I. Loans or credit lines to enterprises
1. Over the past three months, how have your bank’s credit standards as applied to the approval of loans or credit lines to enterprises changed?
Oct Jan Oct Jan Oct Jan Oct Jan Oct JanTightened considerably 5% 6% 4% 4% 6% 8% 4% 5% 5% 10%Tightened somewhat 12% 31% 10% 25% 13% 37% 7% 21% 15% 33%Remained basically unchanged 84% 62% 86% 70% 81% 53% 89% 72% 80% 56%Eased somewhat 0% 2% 0% 1% 0% 2% 0% 2% 0% 1%Eased considerably 0% 0% 0% 0% 0% 0% 0% 0% 0% 0%Total 100% 100% 100% 100% 100% 100% 100% 100% 100% 100%Net percentage 16% 35% 14% 28% 19% 44% 11% 24% 20% 42%Diffusion index 10% 20% 9% 16% 12% 26% 8% 15% 12% 26%Mean 2.79 2.60 2.82 2.68 2.75 2.48 2.85 2.71 2.75 2.47Standard deviation 0.52 0.64 0.50 0.60 0.58 0.69 0.48 0.61 0.56 0.71Number of banks responding 117 118 115 115 112 113 117 118 116 117
Long-term loansOverallLoans to small and medium-
sized enterprises
Loans to large enterprises
Short-term loans
Notes: Net percentage is defined as the difference between the sum of the percentages for “tightened considerably” and “tightened somewhat” and the sum of the percentages for “eased somewhat” and “eased considerably”. The diffusion index is defined as the net percentage weighted according to the intensity of the response, giving lenders who have answered “considerably” a weight twice as high (score of 1) as lenders having answered “somewhat” (score of 0.5). The mean and standard deviation are calculated by attributing the values 1 to 5 starting with the first possible answer and consequently for the other answers. These values are then multiplied with the corresponding (weighted) percentages.
Chart 1. Changes in credit standards applied to the approval of loans or credit lines to enterprises
(net percentages of banks contributing to tightening standards)
-10
0
10
20
30
40
50
09Q
4
10Q
3
11Q
2
12Q
1
10Q
2
11Q
1
11Q
4
10Q
1
10Q
4
11Q
3
09Q
4
10Q
3
11Q
2
12Q
1
10Q
2
11Q
1
11Q
4
-10
0
10
20
30
40
50
actualexpected
Overall Large enterprises
Small and medium-sized
enterprises
Long-term loans
Short-term loans

16
2. Over the past three months, how have the following factors affected your bank’s credit standards as applied to the approval of loans or credit lines to enterprises?
OVERALL SME LARGE
-- - ° + ++ NA -- - ° + ++ NA -- - ° + ++ NAA) Cost of funds and balance sheet constraintsCosts related to your bank's capital position 4% 17% 70% 2% 0% 7% 4% 10% 74% 2% 0% 11% 6% 20% 57% 2% 0% 15%Your bank's ability to access market financing 8% 20% 61% 0% 0% 11% 8% 10% 67% 1% 0% 15% 9% 23% 51% 0% 0% 18%Your bank's liquidity position 8% 20% 65% 0% 0% 8% 8% 14% 67% 0% 0% 12% 8% 22% 55% 0% 0% 16%
B) Pressure from competitionCompetition from other banks 1% 5% 81% 5% 0% 8% 1% 1% 83% 4% 0% 11% 1% 3% 74% 5% 0% 16%Competition from non-banks 1% 0% 84% 2% 0% 13% 1% 0% 79% 2% 0% 18% 1% 0% 79% 2% 0% 18%Competition from market financing 1% 0% 83% 2% 0% 14% 1% 0% 79% 2% 0% 18% 1% 2% 77% 2% 0% 18%C) Perception of riskExpectations regarding general economic activity 3% 39% 51% 2% 0% 6% 3% 34% 54% 1% 0% 8% 4% 36% 44% 2% 0% 14%Industry or firm-specific outook 4% 30% 57% 4% 0% 6% 7% 24% 59% 2% 0% 8% 7% 28% 49% 3% 0% 14%Risk on collateral demanded 1% 19% 72% 2% 0% 6% 1% 19% 71% 1% 0% 8% 2% 18% 65% 2% 0% 14% Summary statistics OVERALL SME LARGE
Oct Jan Oct Jan Oct Jan Oct Jan Oct Jan Oct Jan Oct Jan Oct Jan Oct Jan Oct Jan Oct Jan Oct JanA) Cost of funds and balance sheet constraintsCosts related to your bank's capital position 12% 20% 7% 12% 2.85 2.74 0.42 0.59 5% 12% 3% 8% 2.93 2.82 0.37 0.54 12% 24% 8% 15% 2.83 2.64 0.52 0.67Your bank's ability to access market financing 20% 28% 12% 18% 2.75 2.62 0.52 0.66 9% 16% 6% 12% 2.88 2.74 0.44 0.67 16% 31% 11% 20% 2.77 2.55 0.59 0.69Your bank's liquidity position 14% 27% 8% 17% 2.83 2.62 0.49 0.66 7% 21% 4% 14% 2.92 2.68 0.36 0.65 13% 30% 9% 19% 2.79 2.56 0.62 0.67B) Pressure from competitionCompetition from other banks -3% 1% -2% 1% 3.04 2.97 0.33 0.43 -2% -1% -1% 0% 3.03 2.99 0.26 0.37 -3% -1% -1% 0% 3.03 2.99 0.20 0.44Competition from non-banks 1% -1% 1% 0% 2.99 2.98 0.13 0.33 -1% -1% -1% 0% 3.02 2.97 0.14 0.36 -1% -1% -1% 0% 3.02 2.98 0.14 0.33Competition from market financing 1% -1% 0% 0% 2.99 2.98 0.09 0.33 -1% -1% 0% 0% 3.01 2.98 0.17 0.34 -1% 1% 0% 1% 3.01 2.96 0.16 0.36C) Perception of riskExpectations regarding general economic activity 16% 40% 9% 21% 2.81 2.55 0.50 0.61 12% 36% 7% 19% 2.86 2.59 0.45 0.60 12% 38% 8% 21% 2.83 2.53 0.54 0.64Industry or firm-specific outook 22% 30% 12% 17% 2.74 2.64 0.56 0.66 17% 29% 9% 18% 2.80 2.61 0.49 0.70 21% 32% 12% 19% 2.73 2.56 0.61 0.71Risk on collateral demanded 8% 19% 4% 10% 2.91 2.79 0.33 0.50 6% 19% 3% 10% 2.92 2.78 0.36 0.48 8% 17% 5% 9% 2.89 2.79 0.38 0.52
NetP DI M SD NetP DI M SD NetP DI M SD
NA = Not available; NetP = Net percentage; DI = Diffusion index; M = Mean; SD = Standard deviation Notes: Column “Net percentage” is defined as the difference between the sum of “- -“ (contributed considerably to tightening) and “-“ (contributed somewhat to tightening) and the sum of “+” (contributed somewhat to easing) and “+ +” (contributed considerably to easing).”°” means contributed to basically unchanged. The diffusion index is defined as the net percentage weighted according to the intensity of the response, giving lenders who have answered “considerably” a weight twice as high (score of 1) as lenders having answered “somewhat” (score of 0.5).

17
Chart 2a. Factors affecting credit standards applied to the approval of loans or credit lines to enterprises
(net percentages of banks contributing to tightening standards) OVERALL
-10
0
10
20
30
40
10Q
4
11Q
1
11Q
2
11Q
3
11Q
4
10Q
4
11Q
1
11Q
2
11Q
3
11Q
4
10Q
4
11Q
1
11Q
2
11Q
3
11Q
4
10Q
4
11Q
1
11Q
2
11Q
3
11Q
4
10Q
4
11Q
1
11Q
2
11Q
3
11Q
4
10Q
4
11Q
1
11Q
2
11Q
3
11Q
4
-10
0
10
20
30
40Costs related
to bank's capital
position
Bank's ability to access market
financing
Bank's liquidity position
Expectations regarding general
economic activity
Industry or firm-specific
Risk on collateral demanded
Chart 2b. Factors affecting credit standards applied to the approval of loans or credit lines to enterprises (net percentages of banks contributing to tightening standards)
OVERALL
-10
-5
0
5
10Q
4
11Q
1
11Q
2
11Q
3
11Q
4
10Q
4
11Q
1
11Q
2
11Q
3
11Q
4
10Q
4
11Q
1
11Q
2
11Q
3
11Q
4
-10
-5
0
5Competition from
other banksCompetition
from non-banksCompetition from market financing

18
3. Over the past three months, how have your bank’s conditions and terms for approving loans or credit lines to enterprises changed?
OVERALL SME LARGE-- - ° + ++ NA -- - ° + ++ NA -- - ° + ++ NA
A) PriceYour bank's margin on average loans 13% 34% 45% 3% 0% 6% 13% 30% 44% 5% 0% 8% 15% 34% 36% 3% 0% 13%Your bank's margin on riskier loans 12% 38% 42% 2% 0% 6% 11% 34% 43% 4% 0% 8% 17% 34% 34% 3% 0% 13%B) Other conditions and termsNon-interest rate charges 2% 17% 75% 0% 0% 6% 0% 16% 74% 2% 0% 9% 2% 18% 66% 1% 0% 13%Size of the loan or credit line 5% 21% 67% 1% 0% 6% 3% 14% 72% 3% 0% 8% 8% 22% 56% 1% 0% 13%Collateral requirements 2% 16% 77% 0% 0% 6% 2% 15% 73% 3% 0% 8% 3% 17% 68% 0% 0% 13%
Loan covenants 1% 17% 75% 1% 0% 6% 1% 12% 76% 3% 0% 9% 2% 18% 64% 2% 0% 13%
Maturity 3% 23% 69% 0% 0% 6% 3% 21% 67% 2% 0% 8% 2% 27% 57% 0% 1% 13% Summary statistics OVERALL SME LARGE
Oct Jan Oct Jan Oct Jan Oct Jan Oct Jan Oct Jan Oct Jan Oct Jan Oct Jan Oct Jan Oct Jan Oct JanA) PriceYour bank's margin on average loans 18% 44% 9% 28% 2.81 2.41 0.66 0.78 12% 37% 6% 25% 2.89 2.48 0.61 0.82 20% 45% 12% 30% 2.74 2.33 0.75 0.82Your bank's margin on riskier loans 31% 49% 17% 31% 2.64 2.36 0.70 0.75 23% 41% 12% 26% 2.75 2.45 0.66 0.79 34% 49% 20% 33% 2.55 2.26 0.79 0.83B) Other conditions and termsNon-interest rate charges 5% 18% 2% 10% 2.96 2.79 0.31 0.47 4% 14% 2% 7% 2.96 2.85 0.33 0.43 2% 19% 1% 10% 2.97 2.77 0.39 0.52Size of the loan or credit line 8% 25% 5% 15% 2.90 2.68 0.47 0.61 1% 15% 1% 9% 2.98 2.81 0.37 0.56 9% 29% 6% 19% 2.87 2.60 0.57 0.69Collateral requirements 6% 18% 4% 10% 2.92 2.81 0.41 0.45 2% 14% 2% 8% 2.98 2.85 0.38 0.49 8% 20% 5% 11% 2.90 2.76 0.46 0.51Loans covenants 8% 17% 5% 9% 2.89 2.80 0.43 0.48 3% 9% 2% 5% 2.97 2.89 0.33 0.44 8% 18% 5% 10% 2.89 2.77 0.46 0.56
Maturity 10% 26% 6% 14% 2.88 2.70 0.39 0.54 5% 22% 3% 12% 2.94 2.74 0.36 0.56 14% 28% 8% 14% 2.83 2.69 0.46 0.62
NetP DI M SD NetP DI M SD NetP DI M SD
NA = Not available; NetP = Net percentage; DI = Diffusion index; M = Mean; SD = Standard deviation Notes: Column “Net percentage” is defined as the difference between the sum of “- -“ (tightened considerably) and “-“ (tightened somewhat) and the sum of “+” (eased somewhat) and “+ +” (eased considerably). ”°” means remained basically unchanged. The diffusion index is defined as the net percentage weighted according to the intensity of the response, giving lenders who have answered “considerably” a weight twice as high (score of 1) as lenders having answered “somewhat” (score of 0.5).
Chart 3. Changes in terms and conditions for approving loans or credit lines to enterprises (net percentages of banks reporting tightening terms and conditions)
OVERALL
-5
5
15
25
35
45
55
10Q
4
11Q
2
11Q
4
11Q
1
11Q
3
10Q
4
11Q
2
11Q
4
11Q
1
11Q
3
10Q
4
11Q
2
11Q
4
11Q
1
11Q
3
10Q
4
11Q
2
11Q
4
Size of loan or credit
line
Collateral requirements
Loan covenants
Non-interest rate
charges
MaturityMargins on average loans
Margins on riskier loans

19

20
4. Over the past three months, how has the demand for loans or credit lines to enterprises changed at your bank, apart from normal seasonal fluctuations?
Oct Jan Oct Jan Oct Jan Oct Jan Oct JanDecreased considerably 1% 4% 0% 2% 1% 4% 0% 2% 1% 7%Decreased somewhat 18% 18% 17% 22% 14% 16% 17% 18% 17% 17%Remained basically unchanged 72% 63% 69% 60% 73% 63% 71% 65% 68% 53%Increased somewhat 9% 16% 14% 17% 10% 16% 11% 14% 13% 21%Increased considerably 1% 0% 0% 0% 2% 1% 1% 1% 1% 3%Total 100% 100% 100% 100% 100% 100% 100% 100% 100% 100%Net percentage -8% -5% -3% -7% -3% -2% -4% -4% -4% 0%Diffusion index -4% -4% -2% -5% -1% -3% -2% -3% -2% -2%Mean 2.92 2.92 2.97 2.91 2.99 2.95 2.97 2.95 2.96 2.96Standard deviation 0.59 0.72 0.58 0.71 0.63 0.77 0.60 0.70 0.65 0.92Number of banks responding 117 118 115 115 112 113 117 118 116 117
OverallLoans to small and medium-
sized enterprises
Loans to large enterprises
Short-term loans Long-term loans
Notes: Net percentage is defined as the difference between the sum of the percentages for “increased considerably” and “increased somewhat” and the sum of the percentages for “decreased somewhat” and “decreased considerably”. The diffusion index is defined as the net percentage weighted according to the intensity of the response, giving lenders who have answered “considerably” a weight twice as high (score of 1) as lenders having answered “somewhat” (score of 0.5). The mean and standard deviation are calculated by attributing the values 1 to 5 starting with the first possible answer and consequently for the other answers. These values are then multiplied with the corresponding (weighted) percentages.
Chart 4. Changes in demand for loans or credit lines to enterprises (net percentages of banks reporting a positive contribution to demand)
-40
-20
0
20
40
60
09Q
4
10Q
3
11Q
2
12Q
1
10Q
2
11Q
1
11Q
4
10Q
1
10Q
4
11Q
3
09Q
4
10Q
3
11Q
2
12Q
1
10Q
2
11Q
1
11Q
4
-40
-20
0
20
40
60
actualexpected
Overall Large enterprises
Small and medium-sized
enterprises
Short-term loans
Long-term loans
(a) (e)(d)(c)(b)

21
5. Over the past three months, how have the following factors affected the demand for loans or credit lines to enterprises?
-- - ° + ++ NAA) Financing needsFixed investment 5% 23% 55% 9% 0% 7%Inventories and working capital 1% 14% 62% 14% 0% 10%
Mergers/acquisitions and corporate restructuring 5% 16% 62% 3% 0% 13%Debt restructuring 1% 1% 69% 21% 1% 7%B) Use of alternative financeInternal financing 1% 10% 77% 2% 0% 10%Loans from other banks 1% 5% 72% 10% 3% 9%Loans from non-banks 1% 2% 80% 3% 0% 14%Issuance of debt securities 0% 4% 76% 2% 0% 18%Issuance of equity 0% 4% 77% 0% 0% 19%
Summary statistics
Oct Jan Oct Jan Oct Jan Oct JanA) Financing needsFixed investment -6% -20% -4% -13% 2.90 2.72 0.68 0.74Inventories and working capital 4% -2% 2% -1% 3.04 2.95 0.54 0.64
Mergers/acquisitions and corporate restructuring -4% -18% -3% -11% 2.92 2.74 0.53 0.67Debt restructuring 17% 20% 8% 10% 3.18 3.19 0.48 0.55B) Use of alternative financeInternal financing -3% -9% -2% -5% 2.96 2.89 0.41 0.46Loans from other banks 7% 8% 4% 5% 3.09 3.08 0.49 0.62Loans from non-banks 0% -1% 0% -1% 3.00 2.95 0.20 0.40Issuance of debt securities 2% -2% 1% -1% 3.03 2.97 0.39 0.32Issuance of equity 1% -4% 1% -2% 3.01 2.95 0.21 0.22
NetP DI M SD
NA = Not available; NetP = Net percentage; DI = Diffusion index; M = Mean; SD = Standard deviation Notes: Column “Net percentage” is defined as the difference between the sum of “+ + “ (contributed considerably to higher demand) and “+“ (contributed somewhat to higher demand) and the sum of “-” (contributed somewhat to lower demand) and “- -” (contributed considerably to lower demand). ”°” means contributed to basically unchanged demand. The diffusion index is defined as the net percentage weighted according to the intensity of the response, giving lenders who have answered “considerably” a weight twice as high (score of 1) as lenders having answered “somewhat” (score of 0.5).
Chart 5a. Factors affecting demand for loans and credit lines to enterprises
(net percentages of banks reporting a positive contribution to demand)
-20
0
20
40
10Q
4
11Q
1
11Q
2
11Q
3
11Q
4
10Q
4
11Q
1
11Q
2
11Q
3
11Q
4
10Q
4
11Q
1
11Q
2
11Q
3
11Q
4
10Q
4
11Q
1
11Q
2
11Q
3
11Q
4
-20
0
20
40Fixed investment Inventories and
working capitalM&As and corporate
restructuringDebt restructuring

22
Chart 5b. Factors affecting demand for loans and credit lines to enterprises (net percentages of banks reporting a positive contribution to demand)
-20
-10
0
10
2010
Q4
11Q
1
11Q
2
11Q
3
11Q
4
10Q
4
11Q
1
11Q
2
11Q
3
11Q
4
10Q
4
11Q
1
11Q
2
11Q
3
11Q
4
10Q
4
11Q
1
11Q
2
11Q
3
11Q
4
10Q
4
11Q
1
11Q
2
11Q
3
11Q
4
-20
-10
0
10
20Internal
financingLoans from other banks
Loans from non-banks
Issuance of debt
securities
Issuance of equity

23
6. Please indicate how you expect your bank’s credit standards as applied to the approval of loans or credit lines to enterprises to change over the next three months.
Oct Jan Oct Jan Oct Jan Oct Jan Oct JanTighten considerably 2% 1% 2% 2% 7% 2% 2% 1% 3% 2%Tighten somewhat 21% 27% 15% 22% 16% 33% 11% 20% 24% 29%Remain basically unchanged 76% 69% 80% 72% 76% 64% 86% 76% 73% 66%Ease somewhat 1% 3% 3% 5% 1% 1% 1% 2% 1% 3%Ease considerably 0% 0% 0% 0% 0% 0% 0% 0% 0% 0%Total 100% 100% 100% 100% 100% 100% 100% 100% 100% 100%Net percentage 22% 25% 14% 19% 22% 35% 12% 20% 26% 28%Diffusion index 12% 13% 8% 10% 14% 19% 7% 10% 14% 15%Mean 2.76 2.73 2.84 2.80 2.71 2.63 2.86 2.79 2.71 2.70Standard deviation 0.51 0.56 0.50 0.56 0.64 0.58 0.45 0.51 0.56 0.58Number of banks responding 117 118 115 115 112 112 117 118 116 117
Long-term loansOverallLoans to small and medium-
sized enterprises
Loans to large enterprises
Short-term loans
Notes: Net percentage is defined as the difference between the sum of the percentages for “tighten considerably” and “tighten somewhat” and the sum of the percentages for “ease somewhat” and “ease considerably”. The diffusion index is defined as the net percentage weighted according to the intensity of the response, giving lenders who have answered “considerably” a weight twice as high (score of 1) as lenders having answered “somewhat” (score of 0.5). The mean and standard deviation are calculated by attributing the values 1 to 5 starting with the first possible answer and consequently for the other answers. These values are then multiplied with the corresponding (weighted) percentages.
Chart 6. Expected credit standards for the approval of loans or credit lines to enterprises (net percentages of banks contributing to tightening standards)
-5
0
5
10
15
20
25
30
35
40
11Q
1
11Q
2
11Q
3
11Q
4
12Q
1
11Q
1
11Q
2
11Q
3
11Q
4
12Q
1
11Q
1
11Q
2
11Q
3
11Q
4
12Q
1
11Q
1
11Q
2
11Q
3
11Q
4
12Q
1
11Q
1
11Q
2
11Q
3
11Q
4
12Q
1
-5
0
5
10
15
20
25
30Overall Small and
medium-sized enterprises
Large enterprises
Short-term loans
Long-term loans

24
7. Please indicate how you expect demand for loans or credit lines to enterprises to change at your bank over the next three months (apart from normal seasonal fluctuations)
Oct Jan Oct Jan Oct Jan Oct Jan Oct JanDecrease considerably 2% 1% 2% 1% 2% 0% 2% 1% 2% 3%Decrease somewhat 23% 26% 21% 25% 22% 27% 15% 19% 27% 33%Remain basically unchanged 69% 66% 71% 62% 71% 67% 78% 71% 63% 57%Increase somewhat 5% 6% 6% 12% 5% 6% 6% 10% 7% 8%Increase considerably 1% 0% 1% 0% 0% 0% 0% 0% 1% 0%Total 100% 100% 100% 100% 100% 100% 100% 100% 100% 100%Net percentage -19% -21% -16% -14% -19% -21% -11% -10% -22% -27%Diffusion index -10% -11% -8% -8% -11% -10% -6% -5% -11% -15%Mean 2.79 2.78 2.84 2.85 2.79 2.79 2.87 2.89 2.77 2.70Standard deviation 0.62 0.59 0.61 0.65 0.59 0.56 0.53 0.58 0.66 0.68Number of banks responding 116 118 115 115 112 112 117 118 116 117
OverallLoans to small and medium-
sized enterprises
Loans to large enterprises
Short-term loans Long-term loans
Notes: Net percentage is defined as the difference between the sum of the percentages for “increase considerably” and “increase somewhat” and the sum of the percentages for “decrease somewhat” and “decrease considerably”. The diffusion index is defined as the net percentage weighted according to the intensity of the response, giving lenders who have answered “considerably” a weight twice as high (score of 1) as lenders having answered “somewhat” (score of 0.5). The mean and standard deviation are calculated by attributing the values 1 to 5 starting with the first possible answer and consequently for the other answers. These values are then multiplied with the corresponding (weighted) percentages.
Chart 7. Expected demand for loans and credit lines to enterprises (net percentages of banks reporting a positive contribution to demand)
-40
-30
-20
-10
0
10
20
30
40
50
11Q
1
11Q
2
11Q
3
11Q
4
12Q
1
11Q
1
11Q
2
11Q
3
11Q
4
12Q
1
11Q
1
11Q
2
11Q
3
11Q
4
12Q
1
11Q
1
11Q
2
11Q
3
11Q
4
12Q
1
11Q
1
11Q
2
11Q
3
11Q
4
12Q
1
-40
-30
-20
-10
0
10
20
30
40
50Overall Small and medium-sized
enterprises
Large enterprises
Short-term loans
Long-term loans

25
II. Loans to households
8. Over the past three months, how have your bank’s credit standards as applied to the approval of loans to households changed?
Oct Jan Oct JanTightened considerably 2% 1% 2% 1%Tightened somewhat 16% 30% 9% 13%Remained basically unchanged 82% 69% 89% 85%Eased somewhat 0% 1% 1% 1%Eased considerably 0% 0% 0% 0%Total 100% 100% 100% 100%Net percentage 18% 29% 10% 13%Diffusion index 10% 15% 6% 7%Mean 2.79 2.71 2.89 2.86Standard deviation 0.48 0.51 0.40 0.42Number of banks responding 111 111 113 114
Loans for house purchase
Consumer credit and other lending
Notes: Net percentage is defined as the difference between the sum of the percentages for “tightened considerably” and “tightened somewhat” and the sum of the percentages for “eased somewhat” and “eased considerably”. The diffusion index is defined as the net percentage weighted according to the intensity of the response, giving lenders who have answered “considerably” a weight twice as high (score of 1) as lenders having answered “somewhat” (score of 0.5). The mean and standard deviation are calculated by attributing the values 1 to 5 starting with the first possible answer and consequently for the other answers. These values are then multiplied with the corresponding (weighted) percentages.
Chart 8. Credit standards applied to the approval of loans to households
(net percentages of banks reporting tightening credit standards)
0
5
10
15
20
25
30
35
10Q
4
11Q
1
11Q
2
11Q
3
11Q
4
10Q
4
11Q
1
11Q
2
11Q
3
11Q
4
0
5
10
15
20Loans for house
purchaseConsumer credit and
other lending

26
9. Over the past three months, how have the following factors affected your bank’s credit standards as applied to the approval of loans to households for house purchase?
-- - ° + ++ NAA) Cost of funds and balance sheet constraints 2% 27% 56% 0% 0% 14%B) Pressure from competitionCompetition from other banks 0% 1% 80% 3% 0% 16%Competition from non-banks 0% 0% 82% 1% 0% 17%C) Perception of risk
Expectations regarding general economic activity 1% 16% 68% 1% 0% 13%Housing market prospects 1% 14% 71% 0% 0% 13%
Summary statistics
Oct Jan Oct Jan Oct Jan Oct JanA) Cost of funds and balance sheet constraints 17% 30% 9% 16% 2.80 2.66 0.47 0.54B) Pressure from competitionCompetition from other banks 0% -2% 0% -1% 3.00 3.02 0.16 0.25Competition from non-banks 0% -1% 0% -1% 3.00 3.02 0.00 0.14C) Perception of risk
Expectations regarding general economic activity 10% 16% 6% 9% 2.87 2.83 0.41 0.46Housing market prospects 11% 15% 7% 8% 2.86 2.82 0.47 0.43
NetP DI M SD
NA = Not available; NetP = Net percentage; DI = Diffusion index; M = Mean; SD = Standard deviation Notes: Column “Net percentage” is defined as the difference between the sum of “- -“ (contributed considerably to tightening) and “-“ (contributed somewhat to tightening) and the sum of “+” (contributed somewhat to easing) and “+ +” (contributed considerably to easing). ”°” means contributed to basically unchanged. The diffusion index is defined as the net percentage weighted according to the intensity of the response, giving lenders who have answered “considerably” a weight twice as high (score of 1) as lenders having answered “somewhat” (score of 0.5).
Chart 9. Factors affecting credit standards applied to the approval of loans to households for house purchase (net percentages of banks contributing to tightening standards)
-10
0
10
20
30
10Q
4
11Q
1
11Q
2
11Q
3
11Q
4
10Q
4
11Q
1
11Q
2
11Q
3
11Q
4
10Q
4
11Q
1
11Q
2
11Q
3
11Q
4
10Q
4
11Q
1
11Q
2
11Q
3
11Q
4
10Q
4
11Q
1
11Q
2
11Q
3
11Q
4
-10
0
10
20
30Cost of funds and balance
sheet constraints
Competition from other
banks
Expectations regarding general
economic activity
Competition from non-
banks
Housing market
prospects

27
10. Over the past three months, how have your bank’s conditions and terms for approving loans to households for house purchase changed?
-- - ° + ++ NAA) PriceYour bank's margin on average loans 1% 34% 46% 5% 1% 13%Your bank's margin on riskier loans 3% 33% 47% 3% 0% 14%B) Other conditions and termsCollateral requirements 0% 3% 84% 0% 0% 13%Loan-to-value ratio 0% 13% 74% 0% 0% 13%Maturity 0% 9% 78% 0% 0% 13%Non-interest rate charges 0% 7% 79% 1% 0% 14%
Summary statistics
Oct Jan Oct Jan Oct Jan Oct JanA) PriceYour bank's margin on average loans 10% 29% 6% 15% 2.89 2.70 0.57 0.67Your bank's margin on riskier loans 14% 33% 7% 18% 2.84 2.61 0.46 0.62B) Other conditions and termsCollateral requirements 1% 3% 1% 2% 2.99 2.97 0.12 0.19Loan-to-value ratio 9% 13% 5% 6% 2.89 2.87 0.36 0.36Maturity 7% 9% 4% 5% 2.92 2.91 0.31 0.31Non-interest rate charges 6% 5% 3% 3% 2.94 2.94 0.28 0.31
NetP DI M SD
NA = Not available; NetP = Net percentage; DI = Diffusion index; M = Mean; SD = Standard deviation Notes: Column “Net percentage” is defined as the difference between the sum of “- -“ (tightened considerably) and “-“ (tightened somewhat) and the sum of “+” (eased somewhat) and “+ +” (eased considerably). ”°” means remained basically unchanged. The diffusion index is defined as the net percentage weighted according to the intensity of the response, giving lenders who have answered “considerably” a weight twice as high (score of 1) as lenders having answered “somewhat” (score of 0.5).
Chart 10. Changes in terms and conditions for approving loans to households for house purchase
(net percentages of banks reporting tightening terms and conditions)
-10
0
10
20
30
40
10Q
4
11Q
1
11Q
2
11Q
3
11Q
4
10Q
4
11Q
1
11Q
2
11Q
3
11Q
4
10Q
4
11Q
1
11Q
2
11Q
3
11Q
4
10Q
4
11Q
1
11Q
2
11Q
3
11Q
4
10Q
4
11Q
1
11Q
2
11Q
3
11Q
4
10Q
4
11Q
1
11Q
2
11Q
3
11Q
4
-10
0
10
20
30
40Margins on
average loans
Margins on riskier loans
Collateral requirements
Loan-to-value ratio
Maturity Non-interest rate
charges

28
11. Over the past three months, how have the following factors affected your bank’s credit standards as applied to the approval of consumer credit and other lending to households (as described in question 8)?
-- - ° + ++ NAA) Cost of funds and balance sheet constraints 3% 15% 68% 1% 0% 13%B) Pressure from competitionCompetition from other banks 0% 1% 84% 1% 0% 13%Competition from non-banks 0% 1% 82% 1% 0% 16%C) Perception of risk
Expectations regarding general economic activity 2% 10% 74% 2% 0% 13%Creditworthiness of consumers 2% 11% 73% 2% 0% 13%Risk on collateral demanded 1% 2% 79% 2% 0% 16%
Summary statistics
Oct Jan Oct Jan Oct Jan Oct JanA) Cost of funds and balance sheet constraints 12% 17% 7% 10% 2.86 2.79 0.40 0.53B) Pressure from competitionCompetition from other banks 0% 0% 0% 0% 3.00 3.00 0.09 0.19Competition from non-banks 0% 1% 0% 0% 3.00 2.99 0.00 0.17C) Perception of risk
Expectations regarding general economic activity 8% 9% 5% 5% 2.89 2.90 0.40 0.43Creditworthiness of consumers 12% 11% 7% 6% 2.85 2.88 0.44 0.45Risk on collateral demanded 5% 1% 3% 1% 2.93 2.99 0.30 0.32
NetP DI M SD
NA = Not available; NetP = Net percentage; DI = Diffusion index; M = Mean; SD = Standard deviation Notes: Column “Net percentage” is defined as the difference between the sum of “- -“(contributed considerably to tightening) and “-“(contributed somewhat to tightening) and the sum of “+” (contributed somewhat to easing) and “+ +” (contributed considerably to easing). ”°” means contributed to basically unchanged. The diffusion index is defined as the net percentage weighted according to the intensity of the response, giving lenders who have answered “considerably” a weight twice as high (score of 1) as lenders having answered “somewhat” (score of 0.5).
Chart 11. Factors affecting credit standards applied to the approval of consumer credit and other lending to
households (net percentages of banks contributing to tightening standards)

29
-10
0
10
20
30
10Q
4
11Q
1
11Q
2
11Q
3
11Q
4
10Q
4
11Q
1
11Q
2
11Q
3
11Q
4
10Q
4
11Q
1
11Q
2
11Q
3
11Q
4
10Q
4
11Q
1
11Q
2
11Q
3
11Q
4
10Q
4
11Q
1
11Q
2
11Q
3
11Q
4
10Q
4
11Q
1
11Q
2
11Q
3
11Q
4
-10
0
10
20
30Cost of
funds and balance sheet constraints
Competition from other
banks
Competition from non-
banks
Expectations regarding general
economic activity
Credit-worthiness of
consumers
Risk on collateral demanded

30
12. Over the past three months, how have your bank’s conditions and terms for approving consumer credit and other lending to households changed?
-- - ° + ++ NAA) PriceYour bank's margin on average loans 1% 18% 64% 5% 0% 13%Your bank's margin on riskier loans 5% 16% 62% 5% 0% 13%B) Other conditions and termsCollateral requirements 1% 3% 80% 1% 0% 15%Maturity 0% 3% 81% 3% 0% 13%Non-interest rate charges 0% 3% 83% 1% 0% 14%
Summary statistics
Oct Jan Oct Jan Oct Jan Oct JanA) PriceYour bank's margin on average loans 3% 13% 2% 7% 2.96 2.86 0.47 0.53Your bank's margin on riskier loans 9% 16% 6% 10% 2.88 2.80 0.50 0.65B) Other conditions and termsCollateral requirements 3% 3% 2% 2% 2.96 2.96 0.23 0.29Maturity 3% -1% 2% 0% 2.96 3.01 0.31 0.27Non-interest rate charges 4% 2% 2% 1% 2.96 2.98 0.21 0.20
NetP DI M SD
NA = Not available; NetP = Net percentage; DI = Diffusion index; M = Mean; SD = Standard deviation Notes: Column “Net percentage” is defined as the difference between the sum of “- -“ (tightened considerably) and “-“ (tightened somewhat) and the sum of “+” (eased somewhat) and “+ +” (eased considerably). ”°” means remained basically unchanged. The diffusion index is defined as the net percentage weighted according to the intensity of the response, giving lenders who have answered “considerably” a weight twice as high (score of 1) as lenders having answered “somewhat” (score of 0.5).
Chart 12. Changes in terms and conditions for approving consumer credit and other loans to households (net percentages of banks reporting tightening terms and conditions)
-5
0
5
10
15
20
25
10Q
4
11Q
1
11Q
2
11Q
3
11Q
4
10Q
4
11Q
1
11Q
2
11Q
3
11Q
4
10Q
4
11Q
1
11Q
2
11Q
3
11Q
4
10Q
4
11Q
1
11Q
2
11Q
3
11Q
4
10Q
4
11Q
1
11Q
2
11Q
3
11Q
4
0
5
10
15
20
25Margins on
average loansMargins on riskier loans
Collateral requirements
Maturity Non-interest rate charges

31
13. Over the past three months, how has the demand for loans to households changed at your bank, apart from normal seasonal fluctuations?
Oct Jan Oct JanDecreased considerably 10% 11% 3% 4%Decreased somewhat 24% 32% 20% 21%Remained basically unchanged 55% 42% 68% 67%Increased somewhat 11% 13% 7% 7%Increased considerably 0% 3% 2% 2%Total 100% 100% 100% 100%Net percentage -24% -27% -15% -16%Diffusion index -17% -17% -8% -9%Mean 2.66 2.65 2.84 2.82Standard deviation 0.83 0.97 0.69 0.72Number of banks responding 111 111 113 114
Loans for house purchase
Consumer credit and other lending
Notes: Net percentage is defined as the difference between the sum of the percentages for “increased considerably” and “increased somewhat” and the sum of the percentages for “decreased somewhat” and “decreased considerably”. The diffusion index is defined as the net percentage weighted according to the intensity of the response, giving lenders who have answered “considerably” a weight twice as high (score of 1) as lenders having answered “somewhat” (score of 0.5). The mean and standard deviation are calculated by attributing the values 1 to 5 starting with the first possible answer and consequently for the other answers. These values are then multiplied with the corresponding (weighted) percentages.
Chart 13. Demand for loans to households (net percentages of banks reporting positive loan demand)
-30
-20
-10
0
10
20
30
10Q
4
11Q
1
11Q
2
11Q
3
11Q
4
10Q
4
11Q
1
11Q
2
11Q
3
11Q
4
-30
-20
-10
0
10
20
30Loans for house
purchaseConsumer credit and
other lending
32
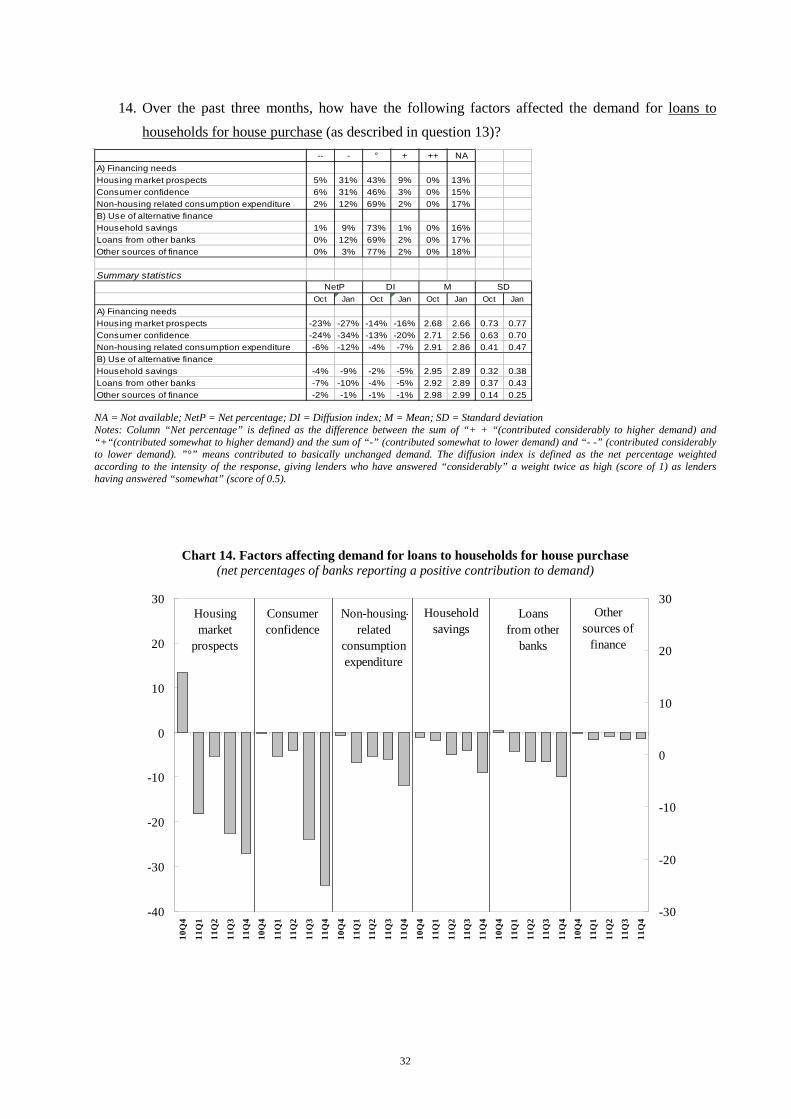
14. Over the past three months, how have the following factors affected the demand for loans to households for house purchase (as described in question 13)?
-- - ° + ++ NAA) Financing needsHousing market prospects 5% 31% 43% 9% 0% 13%Consumer confidence 6% 31% 46% 3% 0% 15%Non-housing related consumption expenditure 2% 12% 69% 2% 0% 17%B) Use of alternative financeHousehold savings 1% 9% 73% 1% 0% 16%Loans from other banks 0% 12% 69% 2% 0% 17%Other sources of finance 0% 3% 77% 2% 0% 18%
Summary statistics
Oct Jan Oct Jan Oct Jan Oct JanA) Financing needsHousing market prospects -23% -27% -14% -16% 2.68 2.66 0.73 0.77Consumer confidence -24% -34% -13% -20% 2.71 2.56 0.63 0.70Non-housing related consumption expenditure -6% -12% -4% -7% 2.91 2.86 0.41 0.47B) Use of alternative financeHousehold savings -4% -9% -2% -5% 2.95 2.89 0.32 0.38Loans from other banks -7% -10% -4% -5% 2.92 2.89 0.37 0.43Other sources of finance -2% -1% -1% -1% 2.98 2.99 0.14 0.25
NetP DI M SD
NA = Not available; NetP = Net percentage; DI = Diffusion index; M = Mean; SD = Standard deviation Notes: Column “Net percentage” is defined as the difference between the sum of “+ + “(contributed considerably to higher demand) and “+“(contributed somewhat to higher demand) and the sum of “-” (contributed somewhat to lower demand) and “- -” (contributed considerably to lower demand). ”°” means contributed to basically unchanged demand. The diffusion index is defined as the net percentage weighted according to the intensity of the response, giving lenders who have answered “considerably” a weight twice as high (score of 1) as lenders having answered “somewhat” (score of 0.5).
Chart 14. Factors affecting demand for loans to households for house purchase (net percentages of banks reporting a positive contribution to demand)
-40
-30
-20
-10
0
10
20
30
10Q
4
11Q
1
11Q
2
11Q
3
11Q
4
10Q
4
11Q
1
11Q
2
11Q
3
11Q
4
10Q
4
11Q
1
11Q
2
11Q
3
11Q
4
10Q
4
11Q
1
11Q
2
11Q
3
11Q
4
10Q
4
11Q
1
11Q
2
11Q
3
11Q
4
10Q
4
11Q
1
11Q
2
11Q
3
11Q
4
-30
-20
-10
0
10
20
30Housing market
prospects
Consumer confidence
Non-housing- related
consumption expenditure
Household savings
Loans from other
banks
Other sources of
finance

33
15. Over the past three months, how have the following factors affected the demand for consumer credit and other lending to households (as described in question 13)?
-- - ° + ++ NAA) Financing needsSpending on durable consumer goods 2% 22% 62% 3% 0% 11%Consumer confidence 2% 22% 64% 3% 0% 10%Securities purchases 2% 6% 73% 1% 0% 20%B) Use of alternative financeHousehold savings 1% 9% 75% 7% 0% 10%Loans from other banks 0% 8% 75% 6% 0% 11%Other sources of finance 0% 4% 80% 3% 0% 13%
Summary statistics
Oct Jan Oct Jan Oct Jan Oct JanA) Financing needsSpending on durable consumer goods -14% -20% -7% -11% 2.84 2.76 0.55 0.58Consumer confidence -18% -20% -11% -11% 2.76 2.76 0.57 0.57Securities purchases -4% -7% -2% -4% 2.95 2.90 0.31 0.41B) Use of alternative financeHousehold savings -3% -3% -1% -2% 2.98 2.96 0.35 0.46Loans from other banks -8% -2% -4% -1% 2.91 2.98 0.38 0.42Other sources of finance -2% -1% -1% 0% 2.97 2.99 0.17 0.31
NetP DI M SD
NA = Not available; NetP = Net percentage; DI = Diffusion index; M = Mean; SD = Standard deviation Notes: Column “Net percentage” is defined as the difference between the sum of “+ +“(responsible for considerable increase) and “+“(responsible for increase) and the sum of “-” (responsible for decrease) and “- -” (responsible for considerable decrease). ”°” means responsible for neither decrease nor increase. The diffusion index is defined as the net percentage weighted according to the intensity of the response, giving lenders who have answered “considerably” a weight twice as high (score of 1) as lenders having answered “somewhat” (score of 0.5).
Chart 15. Factors affecting demand for consumer credit and other lending to households (net percentages of banks reporting a positive contribution to demand)
-25
-20
-15
-10
-5
0
5
10
10Q
4
11Q
1
11Q
2
11Q
3
11Q
4
10Q
4
11Q
1
11Q
2
11Q
3
11Q
4
10Q
4
11Q
1
11Q
2
11Q
3
11Q
4
10Q
4
11Q
1
11Q
2
11Q
3
11Q
4
10Q
4
11Q
1
11Q
2
11Q
3
11Q
4
10Q
4
11Q
1
11Q
2
11Q
3
11Q
4
-25
-20
-15
-10
-5
0
5
10Spending on
durable consumer
goods
Consumer confidence
Securities purchases
Household savings
Loans from other banks
Other sources of
finance

34
16. Please indicate how you expect your bank’s credit standards as applied to the approval of loans to households to change over the next three months.
Oct Jan Oct JanTighten considerably 1% 1% 2% 1%Tighten somewhat 12% 24% 10% 11%Remain basically unchanged 87% 76% 88% 89%Ease somewhat 1% 0% 0% 0%Ease considerably 0% 0% 0% 0%Total 100% 100% 100% 100%Net percentage 11% 24% 12% 11%Diffusion index 6% 12% 7% 6%Mean 2.88 2.75 2.87 2.88Standard deviation 0.39 0.46 0.40 0.36Number of banks responding 111 111 111 112
Loans for house purchase
Consumer credit and other lending
Notes: Net percentage is defined as the difference between the sum of the percentages for “tighten considerably” and “tighten somewhat” and the sum of the percentages for “ease somewhat” and “ease considerably”. The diffusion index is defined as the net percentage weighted according to the intensity of the response, giving lenders who have answered “considerably” a weight twice as high (score of 1) as lenders having answered “somewhat” (score of 0.5). The mean and standard deviation are calculated by attributing the values 1 to 5 starting with the first possible answer and consequently for the other answers. These values are then multiplied with the corresponding (weighted) percentages.
Chart 16. Expected credit standards for loans to households (net percentages of banks expecting tightening standards)
-5
0
5
10
15
20
25
30
11Q
1
11Q
2
11Q
3
11Q
4
12Q
1
11Q
1
11Q
2
11Q
3
11Q
4
12Q
1
-5
0
5
10
15Loans for house
purchaseConsumer credit and
other lending

35
17. Please indicate how you expect demand for loans to households to change over the next three months at your bank (apart from normal seasonal fluctuations).
Oct Jan Oct JanDecrease considerably 4% 4% 2% 0%Decrease somewhat 26% 43% 15% 25%Remain basically unchanged 62% 50% 76% 69%Increase somewhat 8% 3% 5% 5%Increase considerably 0% 0% 2% 2%Total 100% 100% 100% 100%Net percentage -22% -44% -11% -18%Diffusion index -13% -24% -6% -8%Mean 2.74 2.52 2.89 2.83Standard deviation 0.68 0.65 0.61 0.60Number of banks responding 111 111 113 114
Loans for house purchase
Consumer credit and other lending
Notes: Net percentage is defined as the difference between the sum of the percentages for “increase considerably” and “increase somewhat” and the sum of the percentages for “decrease somewhat” and “decrease considerably”. The diffusion index is defined as the net percentage weighted according to the intensity of the response, giving lenders who have answered “considerably” a weight twice as high (score of 1) as lenders having answered “somewhat” (score of 0.5). The mean and standard deviation are calculated by attributing the values 1 to 5 starting with the first possible answer and consequently for the other answers. These values are then multiplied with the corresponding (weighted) percentages.
Chart 17. Expected demand for loans to households (net percentages of banks expecting positive loan demand)
-50
-40
-30
-20
-10
0
10
20
30
11Q
1
11Q
2
11Q
3
11Q
4
12Q
1
11Q
1
11Q
2
11Q
3
11Q
4
12Q
1
-50
-40
-30
-20
-10
0
10
20
30Loans for house purchase Consumer credit and
other lending

36
ANNEX II: RESULTS FOR THE AD HOC QUESTIONS
i. As a result of the situation in financial markets(1), has your market access changed when tapping your usual sources of wholesale funding and/or has your ability to transfer risk changed over the past three months, or are you expecting this access/activity to change over the next three months?¹
-- - o + + + Mean Standard deviation -- - o + + + Mean Standard
deviation
A) Retail funding
Short-term deposits (up to one year) 9% 24% 56% 8% 3% 2.72 0.90 5% 12% 68% 15% 0% 2.93 0.72 13%
Long-term (more than one year) deposits and other retail funding instruments 7% 29% 58% 6% 0% 2.64 0.75 9% 23% 60% 8% 0% 2.66 0.78 17%
B) Inter-bank unsecured money market
Very short-term money market (up to one week) 8% 31% 60% 1% 0% 2.54 0.67 0% 14% 70% 16% 0% 3.02 0.59 13%
Short-term money market (more than one week) 18% 31% 50% 1% 0% 2.34 0.81 4% 12% 73% 12% 0% 2.92 0.66 13%
C) Wholesale debt securities(3)
Short-term debt securities (e.g. certificates of deposit or commercial paper) 13% 22% 58% 8% 0% 2.60 0.85 8% 5% 73% 14% 0% 2.93 0.76 19%
Medium to long-term debt securities (incl. covered bonds) 15% 31% 53% 2% 0% 2.41 0.79 6% 9% 70% 15% 0% 2.94 0.73 14%
D) Securitisation(4)
Securitisation of corporate loans 19% 19% 58% 3% 0% 2.46 0.90 7% 27% 59% 7% 0% 2.66 0.77 54%
Securitisation of loans for house purchase 17% 17% 66% 1% 0% 2.50 0.83 5% 23% 66% 6% 0% 2.74 0.70 50%
E) Ability to transfer credit risk off balance sheet(5) 10% 25% 59% 6% 0% 2.61 0.88 2% 23% 68% 7% 0% 2.80 0.65 58%
N/A(2)Over the past three months Over the next three months
(1) Please also take into account any effect of state guarantees for debt securities and recapitalisation support. (2) Please select “N/A” (not applicable) only if the source of funding is not relevant for your bank. (3) Usually involves on-balance sheet funding. (4) Usually involves the sale of loans from banks’ balance sheets, i.e. off-balance sheet funding. (5) Usually involves the use of credit derivatives, with the loans remaining on banks’ balance sheets.
ii. In order to comply with the new regulatory requirements, has your bank: increased/decreased risk-weighted assets; increased/decreased its capital position over the past six months, and/or does it intend to do so over the next 6 months?
-- - ○ + + + Not applicable Mean SD -- - ○ + + + Not
applicable Mean SD
Risk-weighted assets 7% 30% 50% 3% 0% 9% 2.6 0.74 6% 41% 40% 4% 0% 9% 2.5 0.75 Of which: Average loans 5% 24% 58% 3% 0% 10% 2.7 0.68 6% 25% 55% 3% 0% 10% 2.6 0.72 Riskier loans 9% 28% 49% 1% 0% 13% 2.5 0.76 11% 35% 41% 1% 0% 12% 2.4 0.76
Capital position 1% 4% 35% 35% 13% 11% 3.6 0.91 0% 6% 42% 32% 7% 13% 3.5 0.82Of which: Retained earnings 3% 7% 54% 23% 2% 11% 3.1 0.80 1% 6% 57% 24% 0% 12% 3.2 0.65 Share issuance 0% 0% 46% 15% 14% 25% 3.6 0.84 0% 2% 51% 14% 5% 28% 3.3 0.72
Over the past six months Over the next six months
* See Basel III: A global regulatory framework for more resilient banks and banking systems, Basel Committee on Banking Supervision, Bank for International Settlements, 16 December 2010 (http://www.bis.org/publ/bcbs189.pdf).
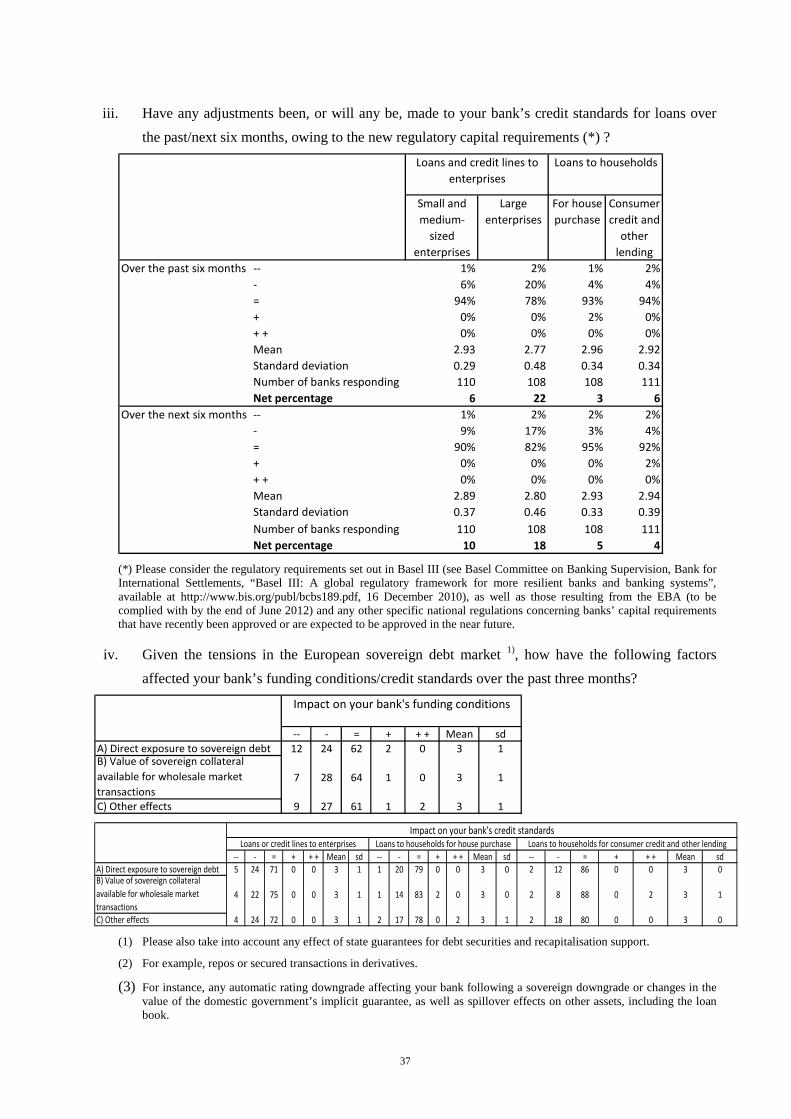
37
iii. Have any adjustments been, or will any be, made to your bank’s credit standards for loans over the past/next six months, owing to the new regulatory capital requirements (*) ?
Small and medium-
sized enterprises
Large enterprises
For house purchase
Consumer credit and
other lending
Over the past six months -- 1% 2% 1% 2%- 6% 20% 4% 4%= 94% 78% 93% 94%+ 0% 0% 2% 0%+ + 0% 0% 0% 0%Mean 2.93 2.77 2.96 2.92Standard deviation 0.29 0.48 0.34 0.34Number of banks responding 110 108 108 111Net percentage 6 22 3 6
Over the next six months -- 1% 2% 2% 2%- 9% 17% 3% 4%= 90% 82% 95% 92%+ 0% 0% 0% 2%+ + 0% 0% 0% 0%Mean 2.89 2.80 2.93 2.94Standard deviation 0.37 0.46 0.33 0.39Number of banks responding 110 108 108 111Net percentage 10 18 5 4
Loans and credit lines to enterprises
Loans to households
(*) Please consider the regulatory requirements set out in Basel III (see Basel Committee on Banking Supervision, Bank for International Settlements, “Basel III: A global regulatory framework for more resilient banks and banking systems”, available at http://www.bis.org/publ/bcbs189.pdf, 16 December 2010), as well as those resulting from the EBA (to be complied with by the end of June 2012) and any other specific national regulations concerning banks’ capital requirements that have recently been approved or are expected to be approved in the near future.
iv. Given the tensions in the European sovereign debt market 1), how have the following factors affected your bank’s funding conditions/credit standards over the past three months?
-- - = + + + Mean sdA) Direct exposure to sovereign debt 12 24 62 2 0 3 1B) Value of sovereign collateral available for wholesale market transactions
7 28 64 1 0 3 1
C) Other effects 9 27 61 1 2 3 1
Impact on your bank's funding conditions
-- - = + + + Mean sd -- - = + + + Mean sd -- - = + + + Mean sdA) Direct exposure to sovereign debt 5 24 71 0 0 3 1 1 20 79 0 0 3 0 2 12 86 0 0 3 0B) Value of sovereign collateral available for wholesale market transactions
4 22 75 0 0 3 1 1 14 83 2 0 3 0 2 8 88 0 2 3 1
C) Other effects 4 24 72 0 0 3 1 2 17 78 0 2 3 1 2 18 80 0 0 3 0
Loans or credit lines to enterprises Loans to households for house purchase Loans to households for consumer credit and other lendingImpact on your bank's credit standards
(1) Please also take into account any effect of state guarantees for debt securities and recapitalisation support.
(2) For example, repos or secured transactions in derivatives.
(3) For instance, any automatic rating downgrade affecting your bank following a sovereign downgrade or changes in the value of the domestic government’s implicit guarantee, as well as spillover effects on other assets, including the loan book.

38
ANNEX III: GLOSSARY
To assist respondent banks in filling out the questionnaire, this glossary defines the most important terminology used in the bank lending survey:
Capital
In accordance with the Basel capital adequacy requirements, the definition of capital includes both tier 1 capital (core capital) and tier 2 capital (supplementary capital). In the context of the EU Capital Requirements Directive, Directive 2006/48/EC of the European Parliament and of the Council of 14 June 2006 relating to the taking up and pursuit of the business of credit institutions defines capital as own funds and makes a distinction between original own funds and additional own funds.
Collateral
The security given by a borrower to a lender as a pledge for the repayment of a loan. This could include certain financial securities, such as equity or debt securities, real estate or compensating balances (a compensating balance is the minimum amount of a loan that the borrower is required to keep in an account at the bank).
Consumer confidence
Consumers’ assessments of economic and financial trends in a particular country and/or in the euro area. They include assessments of the past and current financial situations of households and resulting prospects for the future, assessments of the past and current general economic situation and resulting prospects for the future, as well as assessments of the advisability of making residential investments (question 14), particularly in terms of affordability, and/or major purchases of durable consumer goods (question 15).
Cost of funds and balance sheet constraints
A bank’s capital and the costs related to its capital position can become a balance sheet constraint that may inhibit the expansion of its lending. For a given level of capital, the bank’s loan supply could be affected by its liquidity position and its access to money and debt markets. Similarly, a bank could abstain from granting a loan, or be less willing to lend, if it knows that it will not be able subsequently to transfer the risk (synthetic securitisation) or the entire asset (true-sale securitisation) off its balance sheet.

39
Covenant
An agreement or stipulation laid down in loan contracts, particularly contracts with enterprises, under which the borrower pledges either to take certain action (an affirmative covenant), or to refrain from taking certain action (a negative covenant); this is consequently part of the terms and conditions of the loan.
Credit line
A facility with a stated maximum amount that an enterprise is entitled to borrow from a bank at any given time. For the purposes of the survey, developments regarding credit lines should be interpreted as changes in the net amount that can be drawn down under either an existing or a new credit line.
Credit standards
The internal guidelines or criteria that reflect a bank’s lending policy. They are the written and unwritten criteria, or other practices related to this policy, which define the types of loan a bank considers desirable and undesirable, its designated geographical priorities, collateral deemed acceptable or unacceptable, etc. For the purposes of the survey, changes in written loan policies, together with changes in their application, should be reported.
Credit terms and conditions
These refer to the specific obligations agreed upon by the lender and the borrower. In the context of the bank lending survey, they consist of the direct price or interest rate, the maximum size of the loan and the access conditions, and other terms and conditions in the form of non-interest rate charges (i.e. fees), collateral requirements (including compensating balances), loan covenants and maturities (short-term versus long-term).
Debt restructuring
Debt restructuring is a relevant factor in the context of the bank lending survey only to the extent that it gives rise to an actual increase or decrease in demand for loans following the decision of corporations with outstanding debt obligations to alter the terms and conditions of these loans. Generally, companies use debt restructuring to avoid defaulting on existing debt or to take advantage of lower interest rates or lower interest rate expectations. In the context of this survey, debt restructuring should not be interpreted as the switching between different types of debt (such as MFI loans and debt securities; this is already captured under the item “Issuance of debt securities”), capital restructuring (substitution between debt and equity) or share buy-backs (already captured under the item “Issuance of equity”). Debt restructuring in

40
the form of inter-company loans is already covered by the item “Loans from non-banks”. Moreover, debt restructuring in the form of a substitution between short-term and long-term loans does not give rise to a change in overall loan demand.
Diffusion index
The diffusion index is defined as the difference between the weighted sum of the percentages of banks responding “tightened considerably” and “tightened somewhat”, and the weighted sum of the percentages of banks responding “eased considerably” and “eased somewhat”. Regarding demand for loans, the diffusion index is defined as the difference between the weighted sum of the percentages of banks responding “increased considerably” and “increased somewhat”, and the weighted sum of the percentages of banks responding “decreased considerably” and “decreased somewhat”. The diffusion index is weighted according to the intensity of the response, giving lenders who have answered “considerably” a weight twice as high (score of 1) as lenders having answered “somewhat” (score of 0.5).
Enterprises
The term “enterprises” denotes non-financial corporations, i.e. all private and public institutional units, irrespective of their size and legal form, which are not principally engaged in financial intermediation but rather in the production of goods and non-financial services.
Enterprise size
The distinction between large enterprises and small and medium-sized enterprises is based on annual sales. An enterprise is considered large if its annual net turnover is more than €50 million.
Households
Individuals or groups of individuals acting as consumers or as producers of goods and non-financial services exclusively intended for their own final consumption, as well as small-scale market producers.
Housing market prospects
In question 9, (besides interest rate developments) “housing market prospects” refers to the risk on the collateral demanded; in question 14, it includes households’ expectations regarding changes in house prices.

41
Loans
The loans covered by the bank lending survey are those granted to euro area residents by domestic bank branches, and include loans or credit lines to enterprises, loans to households for house purchase, and consumer credit and other lending to households.
Loan-to-value ratio
The ratio of the amount borrowed to the appraisal or market value of the underlying collateral, usually employed in relation to loans used for real estate financing.
Maturity
Maturity as used in the bank lending survey is original maturity, and only two types are used: short-term and long-term. Short-term loans are loans with an original maturity of one year or less; long-term loans have an original maturity of more than one year.
Net percentage (or balance)
In the context of credit standards, the net percentage is defined as the difference between the sum of the percentages of banks responding “tightened considerably” and “tightened somewhat”, and the sum of the percentages of banks responding “eased considerably” and “eased somewhat”. Regarding demand for loans, the net percentage is defined as the difference between the sum of the percentages of banks responding “increased considerably” and “increased somewhat”, and the sum of the percentages of banks responding “decreased considerably” and “decreased somewhat”.
Non-banks
In general, these consist of non-monetary financial corporations, in particular insurance corporations and pension funds, financial auxiliaries and other financial intermediaries.
Non-interest rate charges
Various kinds of fees that can form part of the pricing of a loan, such as commitment fees on revolving loans, administration fees (e.g. document preparation costs), and charges for enquiries, guarantees and credit insurance.